Article

Baseline Study on Microplastic Distribution in the Open Surface Waters of the Korean Southwest Sea

1
Department of Ocean Integrated Science, College of Fisheries & Ocean Science, Chonnam National University, Yeosu 59626, Republic of Korea
2
Faculty of Environmental & Symbiotic Science, Prefectural University of Kumamoto, Kumamoto 862-8502, Japan
3
Best Environmental Technology Co., Ltd., Yeosu 59661, Republic of Korea
*
Author to whom correspondence should be addressed.
Water 2023, 15(13), 2393; https://doi.org/10.3390/w15132393
Submission received: 31 May 2023 / Revised: 16 June 2023 / Accepted: 20 June 2023 / Published: 28 June 2023

Abstract

:
This study investigated microplastic distribution characteristics by collecting surface seawater from sea areas to the south of Jeju Island in August 2020. The average microplastic abundance was 0.46 ± 0.27 particles/L (n = 23), and PE had a high ratio, averaging 53%. The levels of fragments and fibers were observed to be 69% and 31% on average, respectively. The most common size of the microplastics was on average 0.02–0.30 mm at a level of 69%. We found a higher abundance of microplastics in the study area than in other open waters such as the Arctic Central Basin and the Atlantic Ocean, whereas the abundance was lower than that in previous studies on coastal areas. We studied an area of open sea connecting China, Japan, and the Pacific Ocean, and, in this region, the microplastic distribution varies depending on sea currents in the surrounding areas. In the summer, the western and central regions of the study sea area have low salinity levels due to discharge from China’s Yangtze River. This generally indicates that high-density plastic deposits are found in the Yangtze River estuary, and low-density plastics are found in the study area. Furthermore, this implies that low- and high-density plastics are transported in water for long periods of time due to the Taiwan Warm Current and because the eastern sea area has high salinity.

1. Introduction

Approximately 360 million tons of plastic is produced worldwide [1,2]. The levels of global plastic waste reached between 60 million and 90 million tons in 2015, and these figures are expected to increase to between 155 million and 260 million tons by 2060 [2,3]. Approximately 8 million tons of these plastics flow into the ocean annually due to waste or dumping [4]. The plastics introduced into the ocean are granulated [5], mainly via photochemical processes, and are divided into four categories: megaplastics (over 1 m in size), macroplastics (greater than 2.5 cm and smaller than 1 m in size), mesoplastics (greater than 5 mm and smaller than 2.5 cm in size), and microplastics (smaller than 5 mm in size) [6].
According to their origins, microplastics can be divided into primary and secondary microplastics [7,8]. Primary microplastics, such as microbeads, resin pellets, or microcapsules, are intentionally manufactured from microplastics [9,10]. Secondary microplastics are granulated over time via photolysis, mechanical abrasion, and temperature fluctuations [11,12,13,14].
Microplastics decomposed via these processes are not easily distinguishable from phytoplankton and organic matter. Some are utilized as an attachment base for phytoplankton [15] or accidentally ingested by zooplankton and fishes [16]. Ingested microplastics are not digested and remain in the body, affecting the physiology of zooplankton and potentially their survival [17].
In addition, microplastics may bioaccumulate in upper predators, such as humans, fish, and mammals, affecting human health via the food chain of the marine ecosystem [18,19]. Although ingested microplastics of size less than 130 μm are mainly excreted, some can bind to intestinal cells and cause local immune responses [20]. In addition, there is the possibility that harmful additives, heavy metals, and adsorbed hydrophobic harmful chemicals contained in the microplastics can be eluted into the body [20]. Microplastics that are inhaled into respiratory organs may be removed via the mucociliary clearance mechanism of the lungs, but very adverse effects are expected in the event of long-term exposure in individuals with poor health [21]. Furthermore, Yang et al. (2004) [22] reported that tiny nanoparticles (polystyrene of ≤ 20 nm sizes) of plastic could pass through the blood–brain barrier to cause cerebral ischemia and reperfusion.
Therefore, many global researchers are currently investigating microplastics to determine their distribution on the coastlines of territorial waters and develop valid institutional methods for mitigating microplastic pollution [23,24,25,26,27,28,29,30]. Many studies are being conducted on the coastlines and estuaries of many countries. However, it is crucial that we develop a great understanding of the characteristics of microplastics in open seas, which are greatly influenced by sea currents. The East China Sea, the southern sea of Jeju Island in Republic of Korea, is affected by many sea currents, such as the Yangtze River discharge flow, the Chinese Coastal Current, the southern coastal waters of Republic of Korea, the Tsushima Warm Current, and the Taiwan Warm Current. There is a high possibility that microplastics introduced into the ocean from China, Republic of Korea, Japan, and Southeast Asian countries will flow into the East China Sea via these sea currents. However, studies on the outcome and distribution characteristics of microplastics in this sea area are limited [31]. In addition, research on the distribution of microplastics is necessary because the current flowing into the East China Sea passes through the Korean Strait, affecting the territorial waters of other countries [32].
In August 2020, microplastics were collected from the surface of the East China Sea (specifically in the southern sea area of Jeju Island, Republic of Korea) and analyzed using FT-IR mounted with MCT (Mercury Cadmium Telluride) detectors. This study has the following objectives: (1) to investigate microplastic abundance and the types, sizes, and shapes of microplastics in the surface waters of the East China Sea to determine distribution characteristics; (2) to compare the abundance of microplastics in the present study with previous studies and provide primary data; (3) to understand the fate of microplastics and their characteristics in the research area, which is affected by sea currents. This study is the first to analyze microplastics in the surface waters of the East China Sea, the southern sea area of Jeju Island in Republic of Korea. This baseline study is expected to provide essential data to reveal the characteristics of microplastics in the East Sea of Republic of Korea and the East China Sea.

2. Materials and Methods

2.1. Sampling Method

In August 2020, microplastic samples were collected from 23 locations on the surface waters southwest of Jeju using the training ship, Saedongbaek (2996 tons), from Chonnam National University, Yeosu, Republic of Korea (Figure 1). The water temperature and salinity were measured on-site, 0.5 m below the surface, at individual sampling points using a CTD (SBE 19, Sea-bird Electronic, Bellevue, WA, USA). At a depth of 0–20 cm, 30 L of surface seawater was collected using a stainless-steel bucket and filtered using a 20 μm mesh stainless-steel sieve. Brown hard-glass sample bottles were washed with distilled and pure ionic water and fired for over four hours at approximately 400 °C to remove contamination before sampling. The collected samples were stored at 4 °C until analysis.

2.2. Microplastic Pretreatment Method

The pretreatment method for the collected microplastic samples was digestion of organic matter → density separation → drying, modified from the “Survey guidelines for the qualitative and quantitative analysis of microplastics remaining in seawater and marine creatures” of the National Institute of Fisheries Science [33] and the “Manual for Microplastic Analysis in the Marine Environment” from the National Oceanic and Atmospheric Administration (NOAA) [34]. Notably, all reagents used in the pretreatment were of pesticide residue analytical grade.

2.2.1. Organic Matter Digestion

After sampling, only the filtered samples (20 μm–5 mm) were transferred into a 500 mL beaker using sieves with 20 μm and 5 mm meshes and dried in a natural convection dryer (LDO-080N, Daihan Labtech Co., Namyangju, Republic of Korea) at 90 °C for 24 h. Next, 20 mL of 35% hydrogen peroxide (CAS No.: 7722-84-1, JUNSEI, Tlkyo, Japan), 20 mL of an aqueous iron sulfate solution, and a suitable amount of sulfuric acid (CAS No.: 7664-93-9, JUNSEI, Tlkyo, Japan) were successively added to the beaker. The aqueous iron sulfate solution was prepared using 7.5 g of iron sulfate (CAS No.: 7720-78-7, JUNSEI, Tlkyo, Japan) in 500 mL of distilled water. The beaker was covered using aluminum foil and left in a fume hood at room temperature for 5 min. The solution was stirred at 180 rpm at 75 °C (MSH-20D, Daihan Scientific Co., Ltd., Wonju, Republic of Korea) for 30 min. If organic matter remained after digestion, 20 mL of 35% hydrogen peroxide was poured into the beaker. This process was repeated until the organic matter was completely digested.

2.2.2. Density Separation and Drying

After digesting the organic matter, the sample was filtered through the 20 μm mesh sieve, and the beaker was rinsed with ultrapure water (up to 18.3 MΩ-cm, HIQ1, Human Science Co., Ltd. Hanam, Republic of Korea) to transfer all the particles onto the sieve. All the particles on the sieve were transferred to a 250 mL density separation funnel using 6.7 M of NaI solution (CAS No.: 7681-82-5, JUNSEI): a density of 1.6 g/cm3. Thereafter, 100 mL of NaI was added to a funnel, which was covered with aluminum foil and left for 24 h. The deposited matter in the lower layer was discarded, and the supernatant was filtered on a metal filter (pore size, 20 μm; diameter, 24 mm) and dried in a desiccator for 24 h.

2.3. Identifying the Polymer Types

Using an ATR (attenuated total reflection) method, bench-type FT-IR has previously been employed for quantitative and qualitative microplastic analyses [35,36,37]. In this case, microscopic observation is essential for collecting microplastic samples. However, there are disadvantages in sorting samples with diameters smaller than 1 mm, such as particle loss during transport from the microscope to the FT-IR [33], extended analysis time, and limited qualitative and quantitative results based on partial inspections rather than inspections of the entire particle set.
This study employed a method that used a Nicolet iN10 MX FT-IR (Thermo Fisher, Waltham, MA, USA) equipped with a particle tracking mode (Mercury Cadmium Telluride, MCT). This method uses liquid nitrogen to obtain high-quality IR spectra and facilitates IR mapping analysis of a wide area instead of inspecting a single particle. For this reason, this method is a powerful tool in qualitative and quantitative analyses because all particles can be directly inspected on filter paper without particle transfer, contrary to the ATR method. The instrumental analysis conditions for the particle tracking mode (MCT detectors) were set as follows: collection mode: transmission; aperture: width 60 μm × height 60 μm; line of area: number of points × 30 μm × Y 30 μm. IR spectra were obtained in a wavelength range of 650–4000 cm−1 with a measurement resolution of 4 cm−1. The obtained IR spectra were compared with the reference spectra in the software library database (OMNIC software, Thermo Fisher Madison, WI, USA). Spectra with at least 80% similarity were considered to represent the target polymers. A total of nine target polymers were selected: polyethylene (PE), polystyrene (PS), polypropylene (PP), polyester (PY), acryl, alkyd, polyethylene terephthalate (PET), polyvinyl chloride (PVC), and nylon.

2.4. Microplastic Shape Classification and Size Measurement

The shapes of the microplastics were classified using FT-IR microscopy, and the shapes were divided into five types: fragments, fibers, spheres, sheets, and pellets [33]. Feret’s diameter was employed to measure the major axis of the particle using the ruler tool in OMNIC, the software of Nicolet iN10 MX FT-IR (Thermo Fisher, Waltham, MA, USA) [33].

2.5. Quality Assurance/Quality Control (QA/QC)

One field blank per ten sampling points (i.e., a total of two field blanks) was collected to assess the contamination caused between collecting surface water in situ and the pretreatment process and FT-IR measurement [33]. Filtered distilled water (HPLC-grade or higher-grade distilled water, Burdick & Jackson, Muskeon, MI, USA) was poured into a 1 L glass bottle from the sampling step in the ship. Notably, a new, metal filter paper rinsed using distilled water was inspected to assess atmospheric contamination during the FT-IR measurements before inspecting the samples [38]. Finally, only three microplastics were found in the two field blanks, and no microplastic was found in the metal filter blanks.

3. Results

3.1. Spatial Distribution of Water Temperature and Salinity in the Surface Water

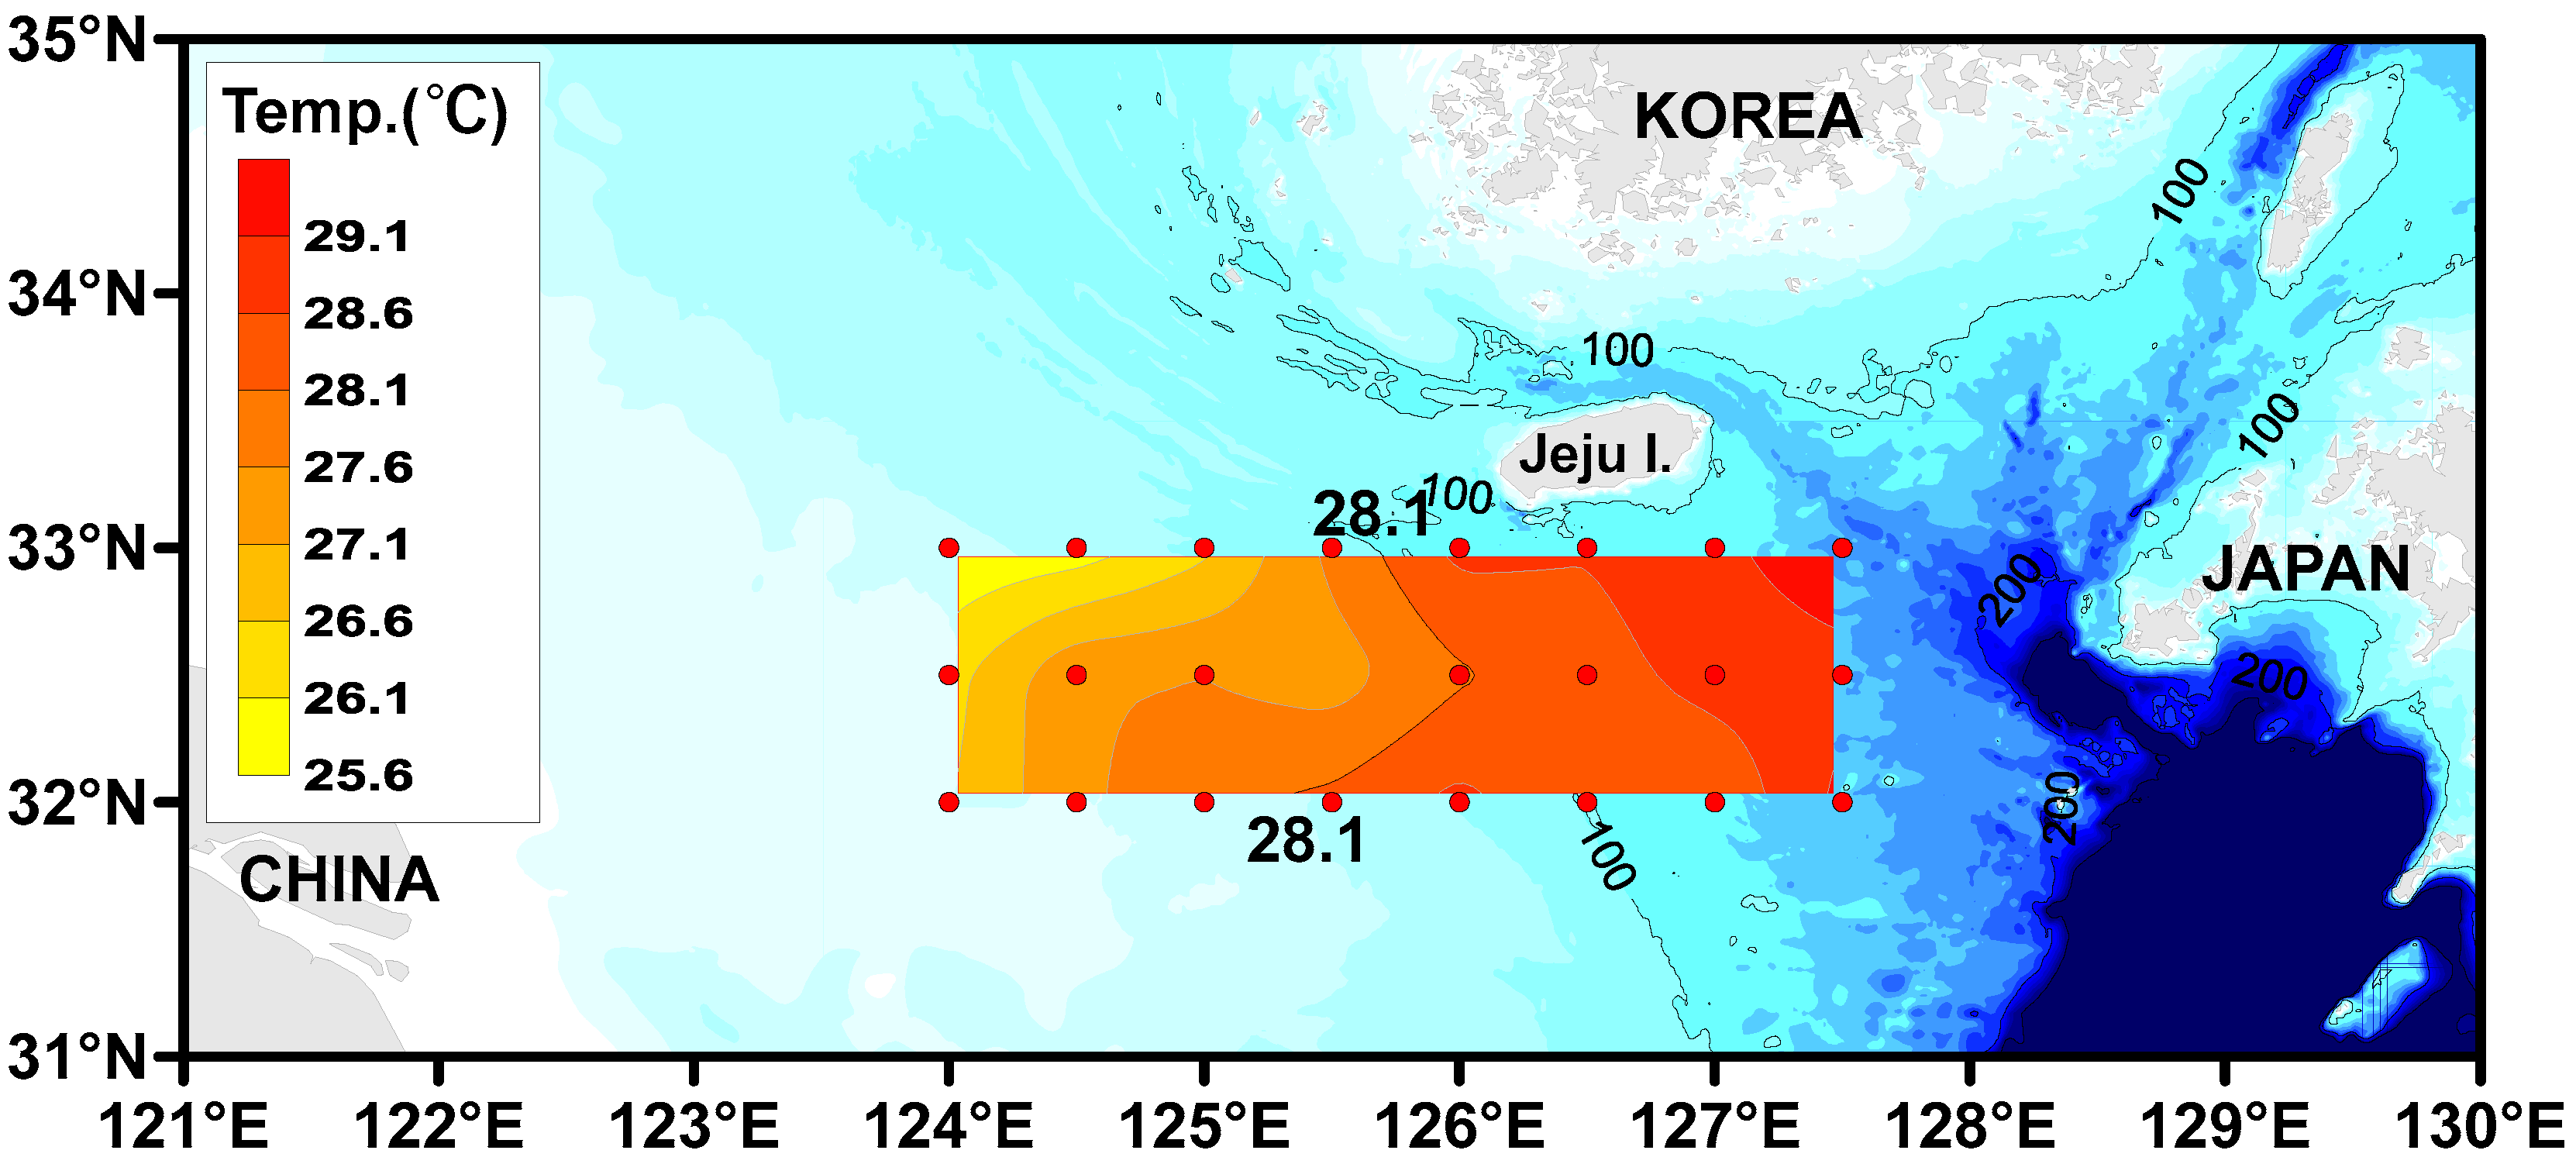
The results for water temperature and salinity in the surface water at 23 locations in the southern sea of Jeju Island are shown in Table 1, and the spatial distributions are shown in Figure 2 and Figure 3. The water temperature ranged from 25.60 to 29.36 °C (average 27.87 ± 1.05 °C). The sampling points northwest of the study area tended to have lower water temperatures than the others, as shown in Figure 2. The salinity ranged from 23.99 to 32.04 psu (average 29.70 ± 2.33 psu). The spatial salinity distribution increased from the southwest toward the northeast of the study area.

3.2. The Numerical Distribution of Microplastic Abundance

Microplastics were detected in the surface seawater at all sampling points (Table 1, Figure 4). The abundance range of the microplastics was 0.17–1.37 particles/L (average 0.46 ± 0.27 particles/L). EC02, in the west of the study area, and EC07, closest to the east of Jeju Island, had high abundance levels of microplastics: 1.37 particles/L and 0.93 particles/L, respectively. Contrary to this, EC20, in the south of the study area, revealed the lowest abundance level: 0.17 particles/L. In terms of spatial distribution, the abundance increased from the south toward the north at the sampling points to the west of the study area (EC01, EC02, EC03, EC14, EC15, EC16, EC17, EC18, EC19).

3.3. The Distribution of Microplastic Polymer Types

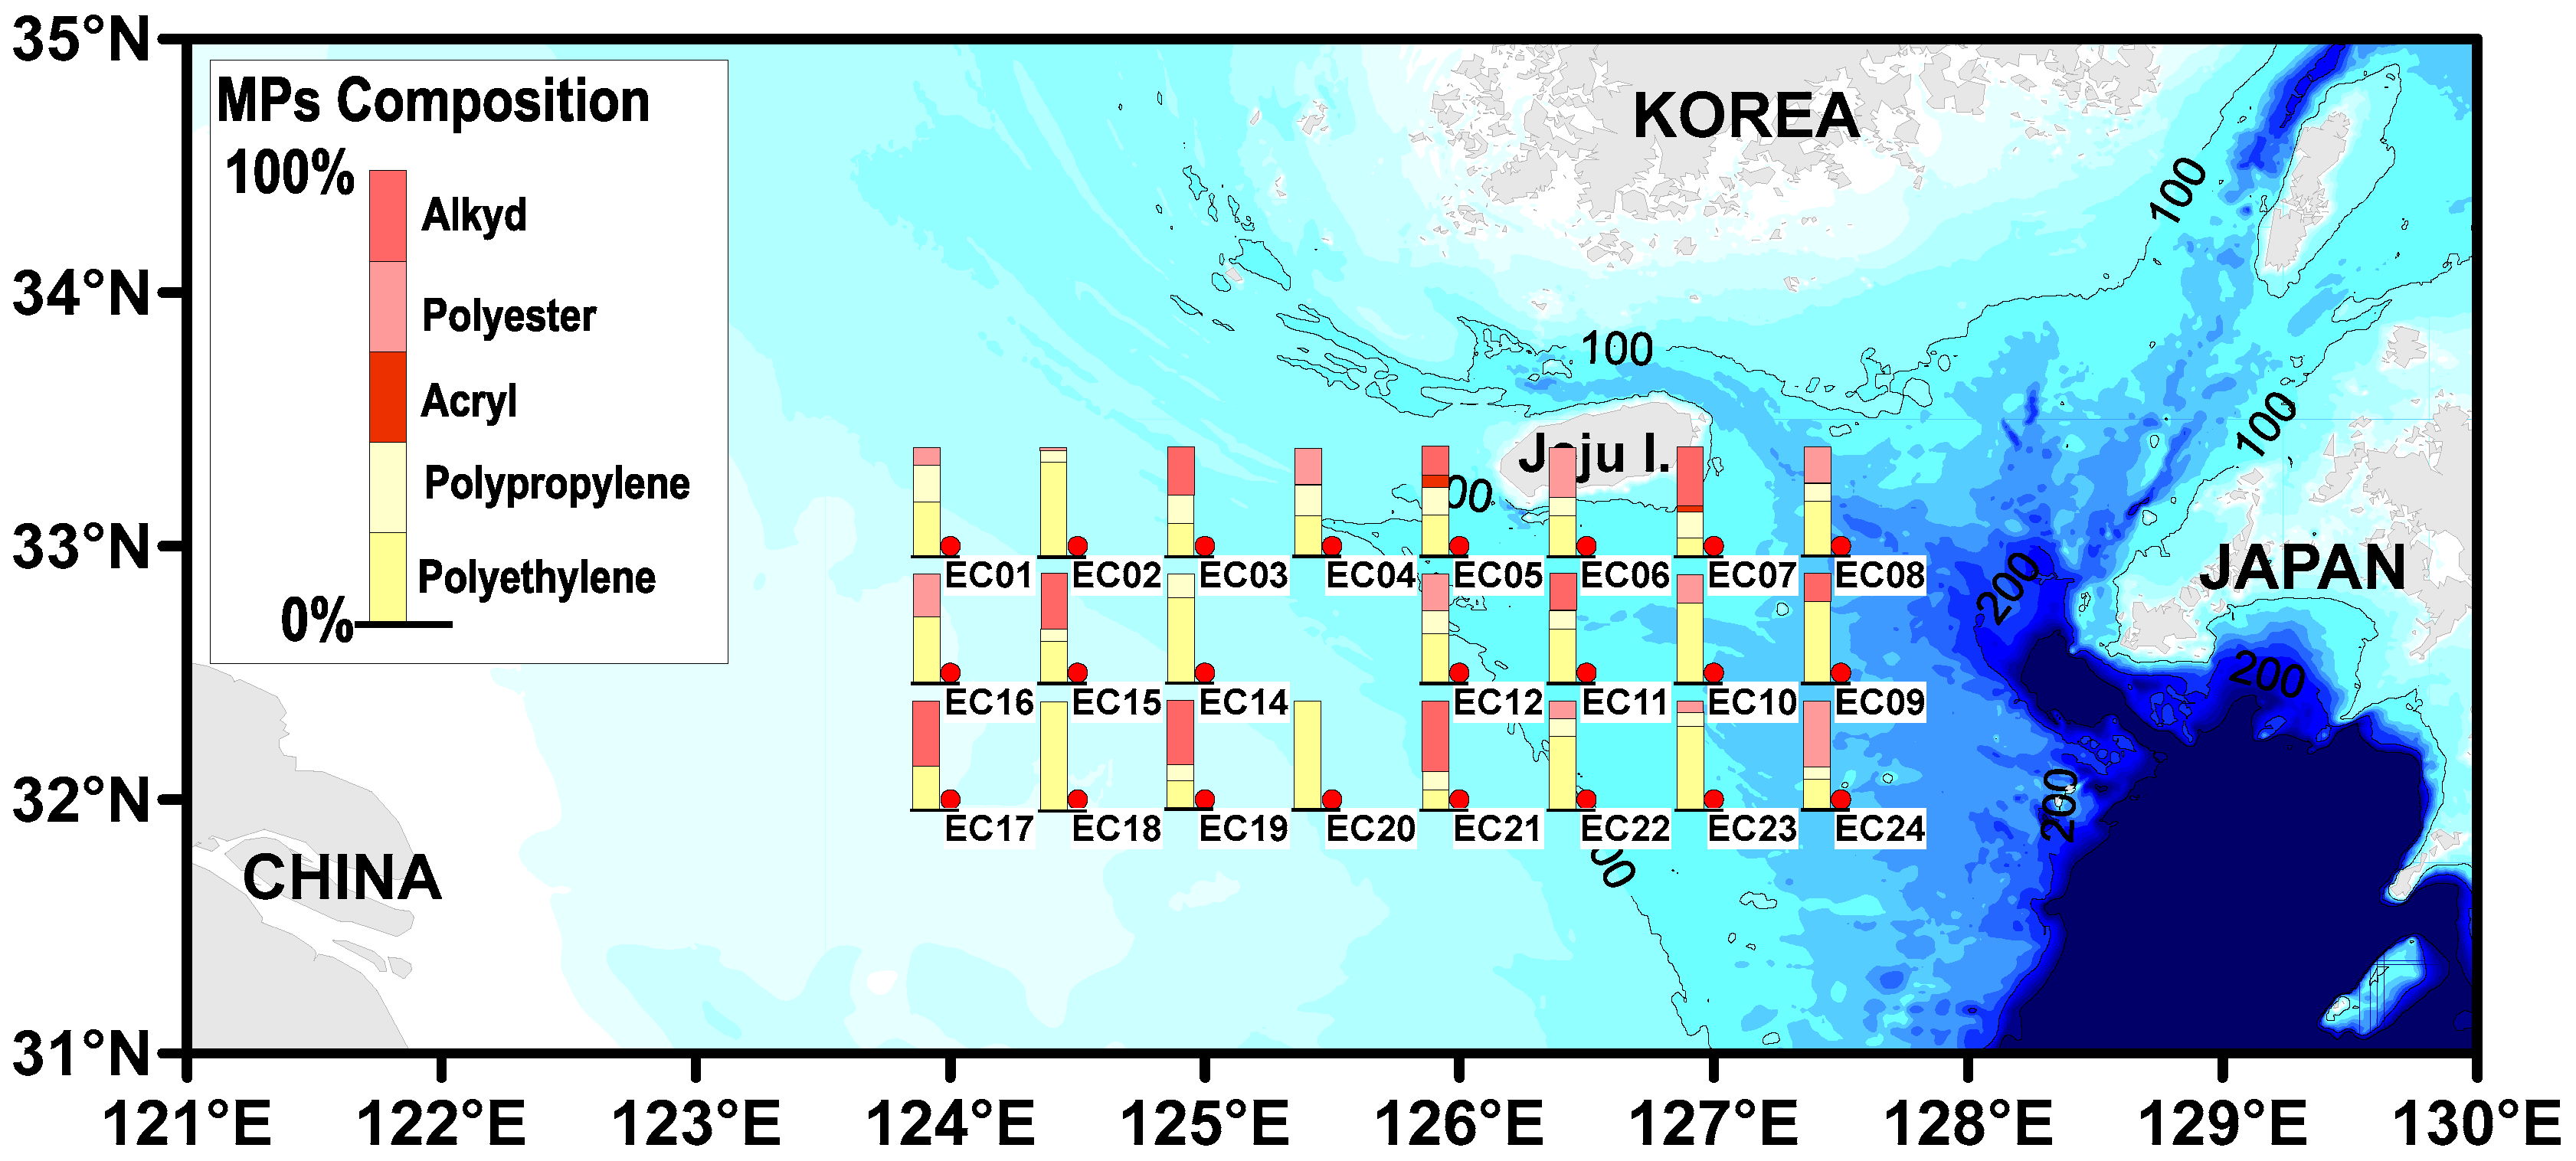
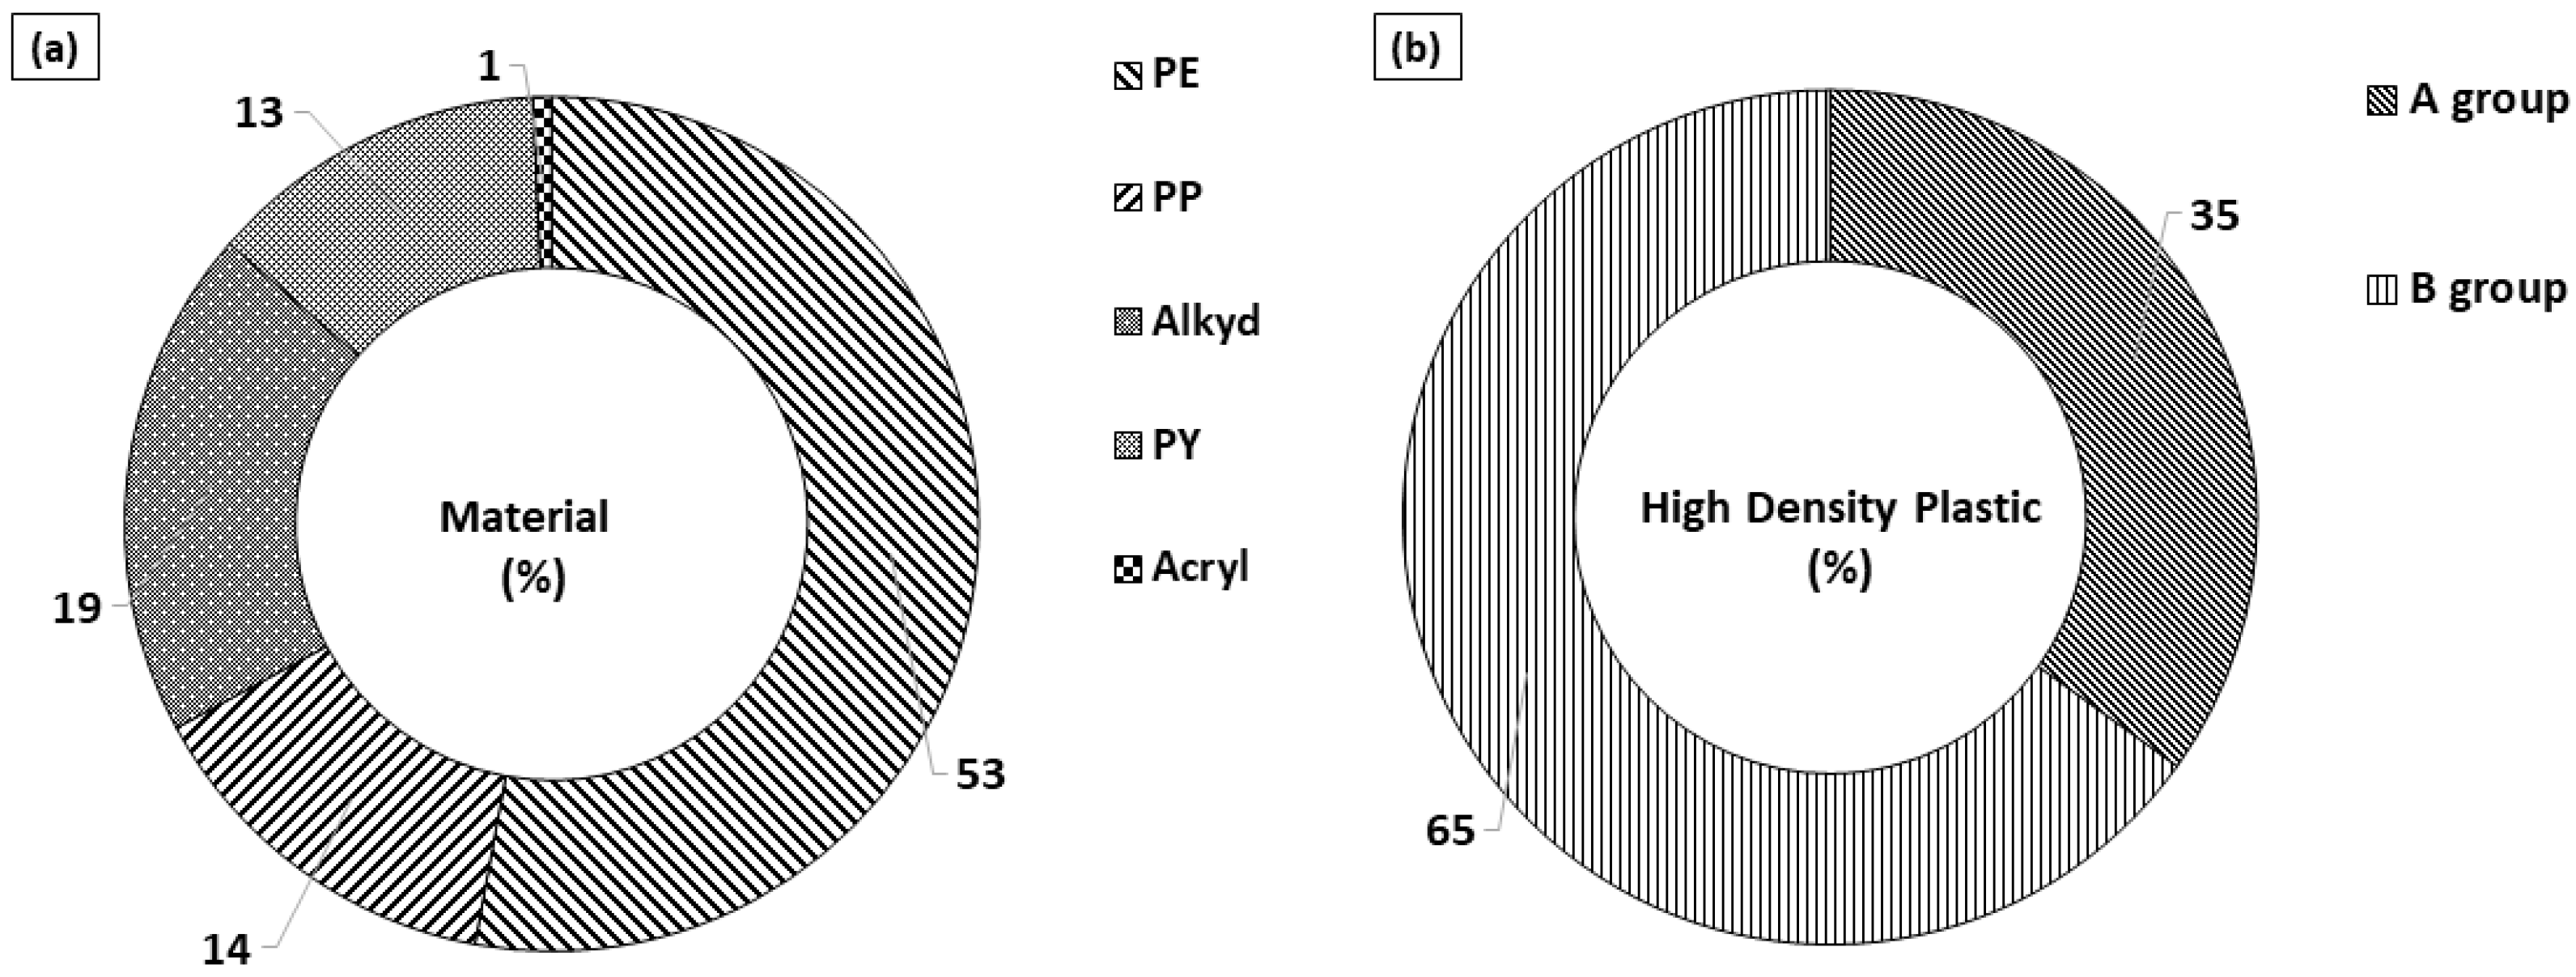
Only five types (PE, PP, alkyd, acryl, and polyester) of the nine studied polymers were detected using the FT-IR analyzer (Table 1, Figure 5). PE was the predominant polymer, accounting for an average of 53% of the total composition, followed by 19% alkyd, 14% PP, 13% polyester, and 1% acryl. Notably, PE was found to have the highest abundance (100%) in EC18 and EC20, alkyd (64%) in EC21, PP (29%) in EC04, polyester (60%) in EC06, and acryl (13%) in EC15.

3.4. The Distribution of the Microplastics Shapes

Only two microplastic shapes (fragments and fibers) were detected; spheres, sheets, and pellets were not found. The latter two shapes are often found in secondary plastics due to the granulation of plastics over time via weathering processes, such as physical and chemical actions, photochemical actions, mechanical abrasion, temperature fluctuations, and effects of the wind and waves [9,10].
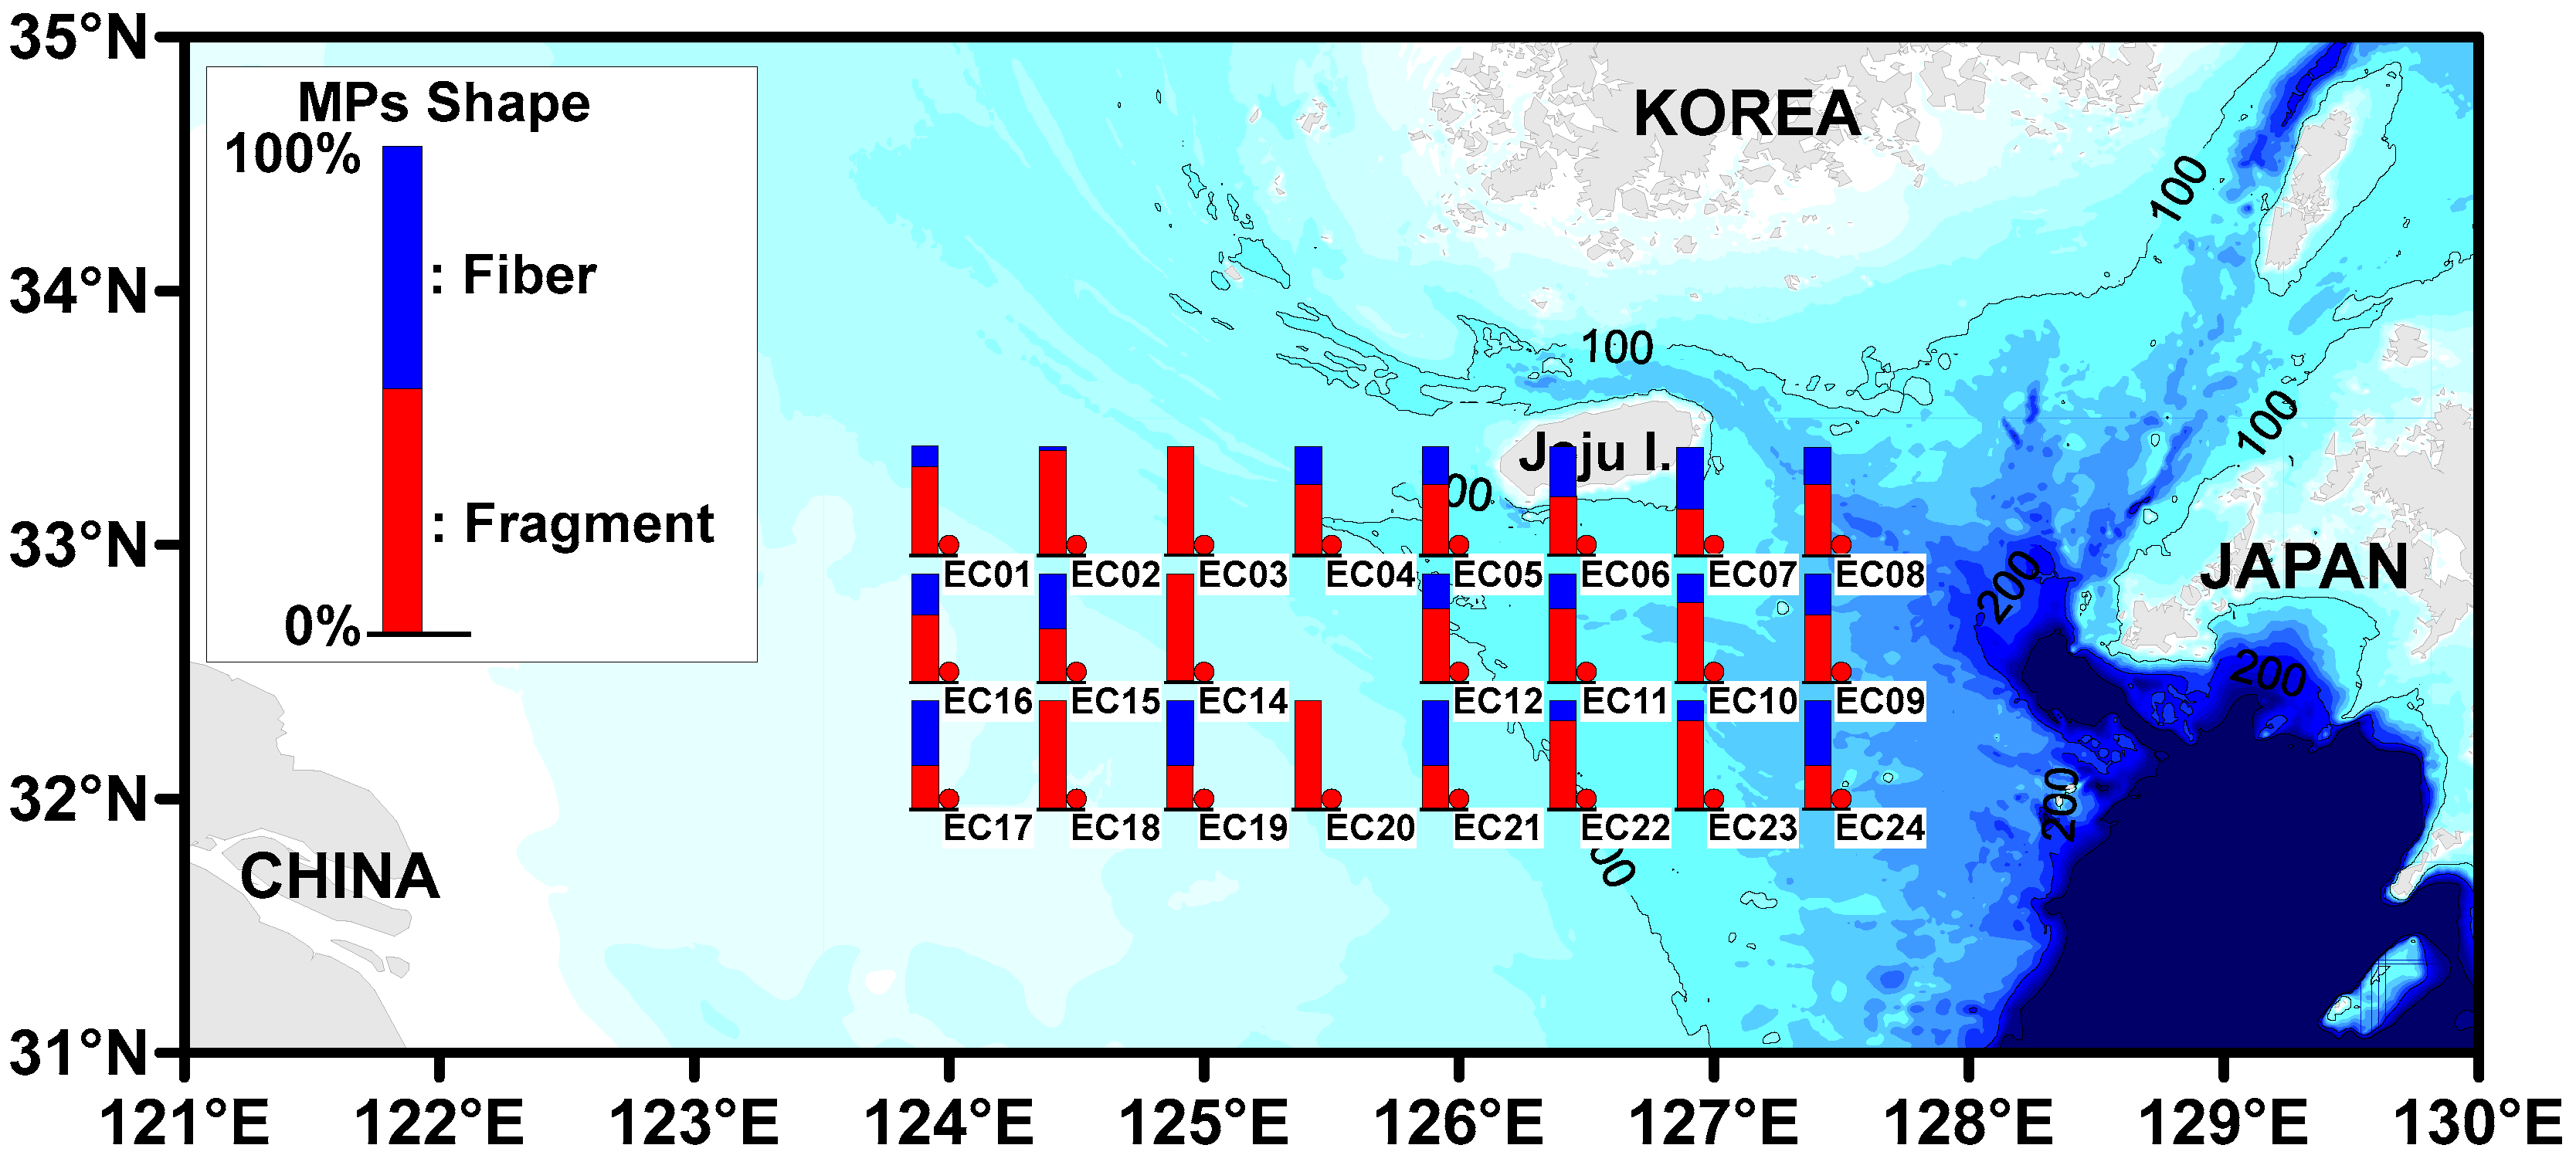
Notably, fragments were found to be the dominant shape, accounting for approximately 69% of all microplastics; the remaining 31% was fibers. The spatial distribution also had this tendency (Figure 6). Although it was not distinct, the surface water in the south of the study area tended to have a higher ratio of fibers than of fragments, particularly in the EC17, EC19, EC21, and EC24 sampling points.

3.5. The Distribution of Microplastics Sizes

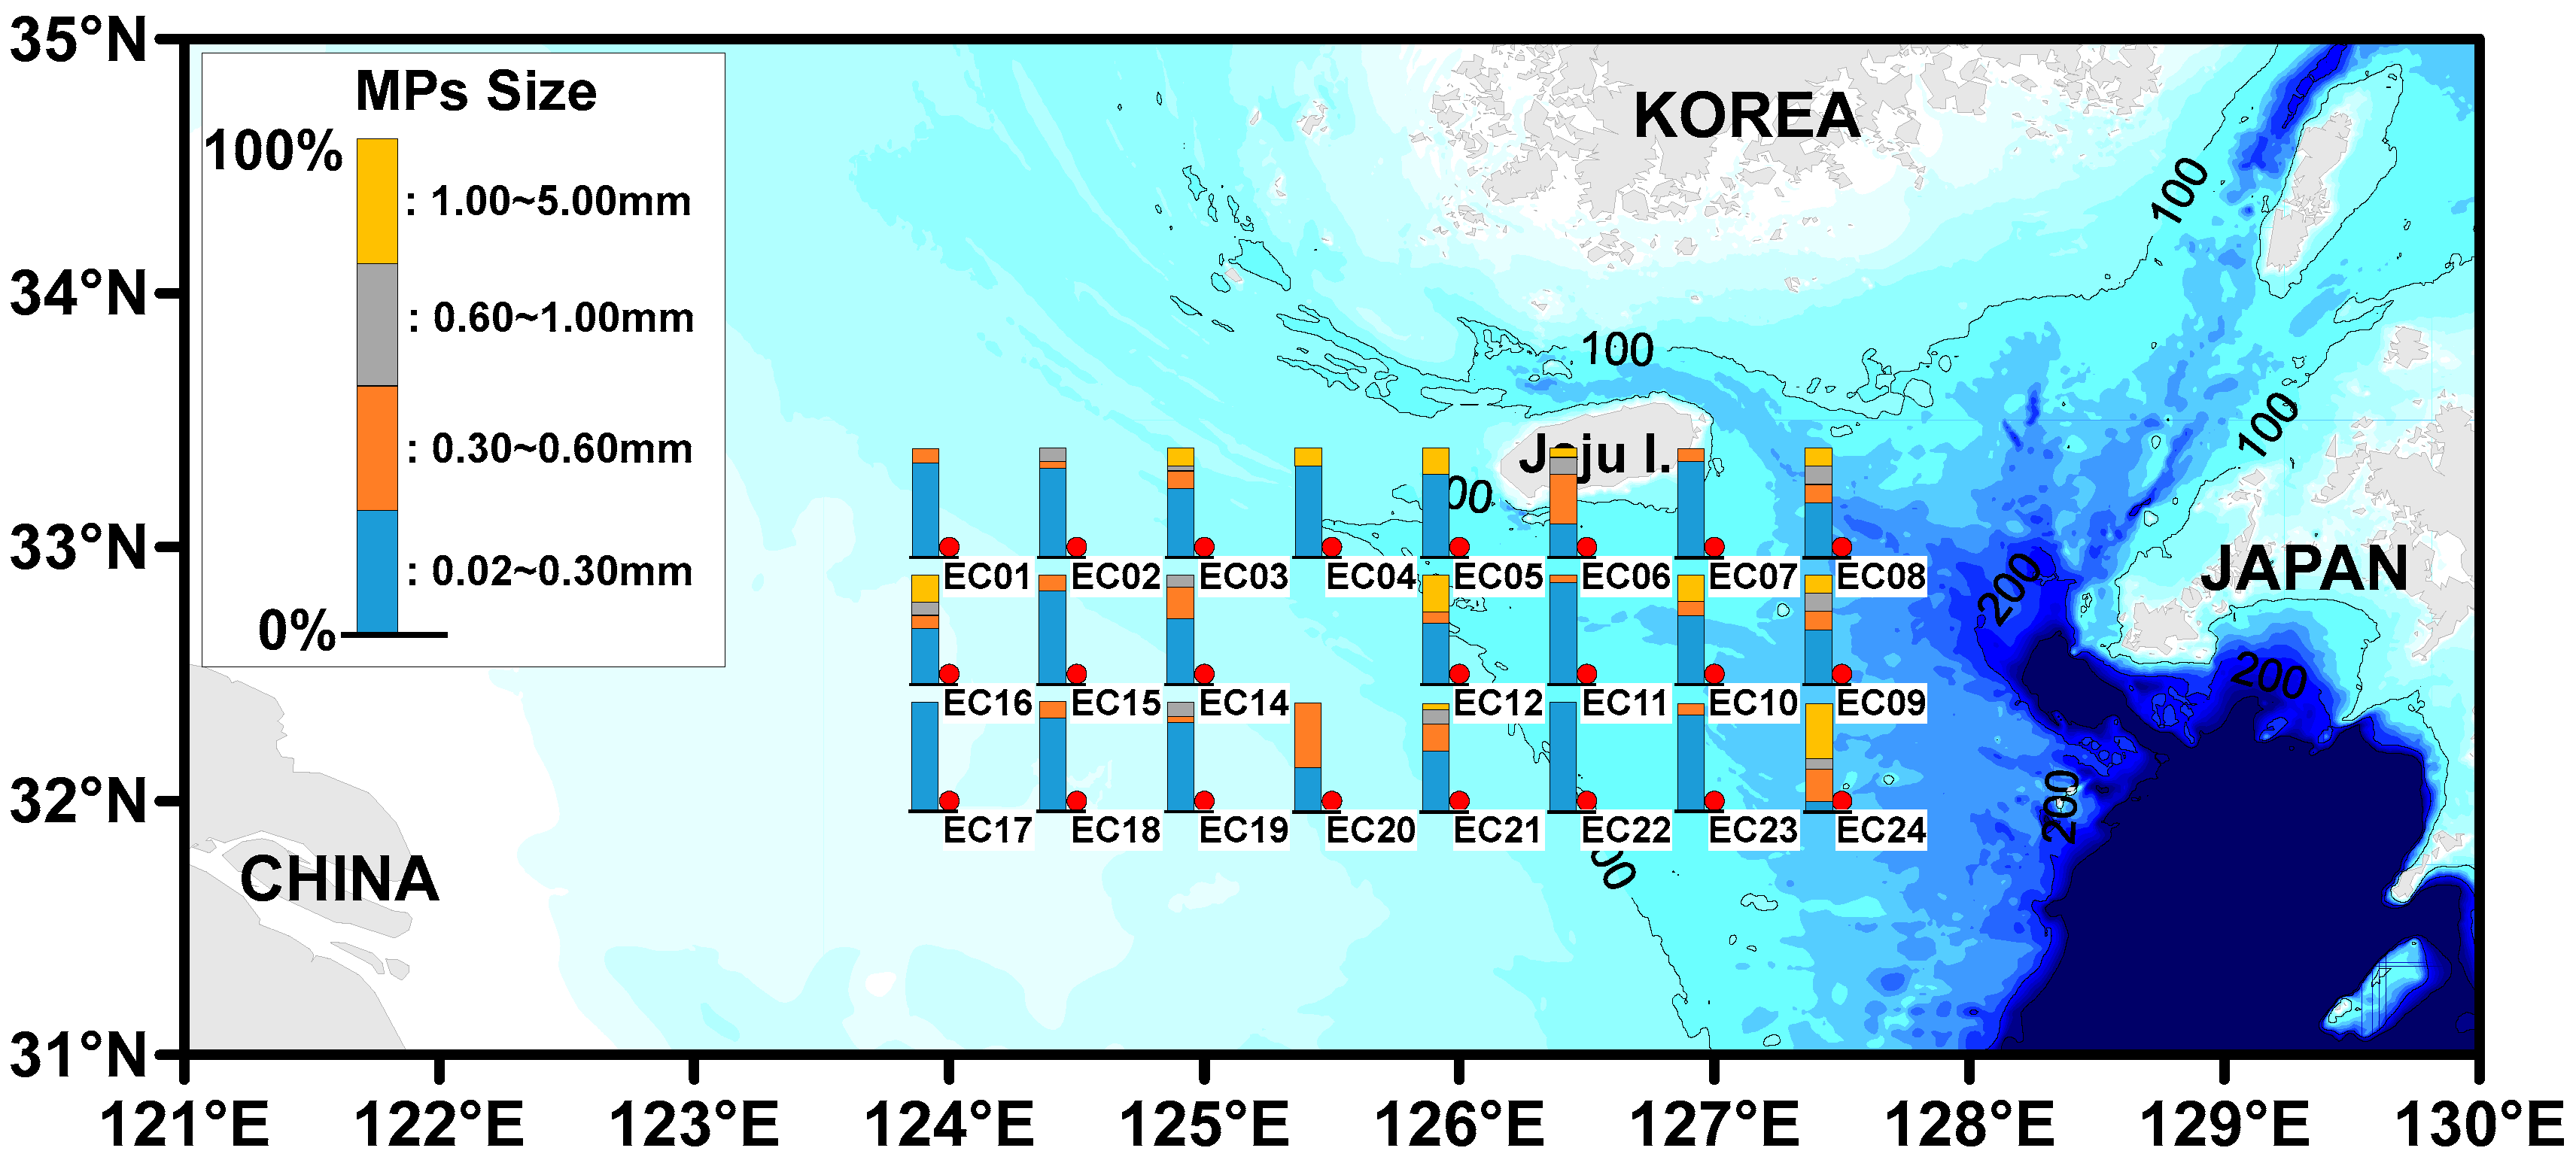
The microplastics were classified into the following size groups: 0.02–0.30 mm, 0.30–0.60 mm, 0.60–1.00 mm, and 1.00–5.0 mm. All these size groups were found in the study area (Table 1, Figure 7). The most frequently detected microplastic group was 0.02–0.30 mm, accounting for 69% of all microplastics, followed by the 0.30–0.60 mm group, which accounted for 16%. The most common microplastic size detected in shellfish was less than 0.2 mm [39]. This implies that the predominant microplastic group in the present study is likely to be bioconcentrated. The 0.02–0.30 mm size group had the highest portion, constituting 100% of the microplastics at the locations EC17 and EC22. The relatively large 1.00–5.0 mm size group accounted for 50% of the microplastics at EC24, a slightly higher percentage than at the other sampling locations. The central part of the study area (EC06, EC12, and EC21) and the southeast region of Jeju (EC08, EC09, and EC24) had relatively less deviation between each size group.

4. Discussion

Previous studies on microplastic distribution primarily employed two methods depending on the microplastic sample collection methods. One was the volume-reduced sampling method, which uses nets such as the manta trawl net and the bongo net [34,40,41,42,43]. Another was the bulk water sampling method, in which a certain amount of seawater is collected using a bucket or an underwater pump [27,39]. The volume-reduced sampling method only targets microplastics that are larger than the mesh size of the net (e.g., 300 μm mesh net, 0–1200 particles/m3 [33,43]), while the bulk water sampling method uses relatively smaller mesh sizes (e.g., 20 μm mesh, 0–152,668 particles/m3 [33,43]). For this reason, there is a remarkable difference in measuring quantity between the two methods [43]. Therefore, only previous results obtained using the bulk water sampling method were compared with those of this study, as shown in Table 2.
The results of this study reveal a higher microplastics abundance than those of previous studies in the Yellow Sea, the southern coastal waters of Republic of Korea [44], and the East Sea of Republic of Korea [44]. Contrary to this, the present study revealed lower levels than the previous results in the coastal waters of Incheon/Gyeonggi, Republic of Korea [26], and in Korean coastal waters, including Cheonsu Bay, Hampyeong Bay, Deukryang Bay, Gwangyang Bay, Ulsan Coast, Yeongil Bay, Incheon Coast, and Busan Coast [27]. Concerning previous results from international studies compared with the present study, lower abundances of microplastics were found in the Arctic Central Basin [45], the Atlantic Ocean [46], and on the coast of Malaysia [47]. However, the northern Yellow Sea [48], South China Sea [49], coast of China, Yellow Sea (including the waters adjacent to Jeju Island) [31], and estuary of the Yangtze River in China [50] demonstrated a higher abundance of microplastics than the results of our study.
The predominant PE and PP polymers, similar to those in this study, had prevalence levels of 84% in Hampyeong Bay, 82% in Deukryang Bay, and 89% in Gwangyang Bay, the southern coast of Republic of Korea, but accounted for a relatively lower portion of microplastics, with 54% in Cheonsu Bay and 30% in Ulsan Coast Bay, Republic of Korea [27]. In Yeongil Bay, the coast of Incheon, and the coast of Busan, EVA (ethylene–vinyl acetate) was found at high percentages (58%, 75%, and 72%, respectively) with a different tendency from that in our study. In previous international studies, PE and PP polymers were at levels of 77.8% and 11.1% on the coast of China, in the Yellow Sea (including the waters near Jeju Island) [31], and the northern Yellow Sea [48], respectively. The compositions were slightly higher than those in the results of this study.
In the Atlantic Ocean [46], two polymers were found to have a prevalence of 48%, and this proportion was lower than that in this study. Interestingly, in a study conducted in August 2016, polyester was found to be the predominant polymer type in the Arctic Central Basin, with at least an 80% prevalence [45]. This is different from the results for other Korean and international seas, as described above. In the previous study [45], these PY fibers were expected to derive from fishing gear or the textile materials in the wastewater of sewage treatment plants that flowed into the ocean and were transported long-distance into the Arctic Ocean. Regarding microplastic shapes, on the coast of Republic of Korea, fragments constituted 81% [27], showing a similar tendency to this study. However, fibers were dominant in the Arctic Central Basin (94%) [45], on the coast of Malaysia (73.8~80.8%) [47], and on the coast of China and the Yellow Sea (89.3%) [31], showing a tendency different from this study. In terms of particle size, non-fiber shapes with an average size of 0.197 ± 0.168 mm and fiber shapes with an average size of 0.752 ± 0.711 mm were found in Cheonsu Bay, Hampyeong Bay, Deukryang Bay, Gwangyang Bay, and Yeongil Bay, as well as on the coasts of Ulsan, Incheon, and Busan [27]. The >0.04 mm size group had a prevalence value of 64% in the Atlantic Ocean. The > 0.50 mm size group had prevalence values of 35.7–83.5% in the North Yellow Sea (October 2016) [48] and 76% in the Yellow Sea (including waters near Jeju Island), a tendency similar to our study’s results, indicating that the numerical microplastic abundance increased toward the smaller size group. Contrary to this, the 1–2 mm size group were the most common group of polymers in the Arctic Central Basin [45], with a prevalence of 62%, a tendency different from other studies, which may be caused by the detection of major microplastics with fibrous polyester types.
Table 2. The comparison of results of other studies on microplastic abundance, polymer type, shape, and size in surface seawater in the southwest of Jeju Island.
Investigated AreanInvestigationCollected Water VolumeMesh Size Numerical Abundance
(Particle/L)
Primary Polymer
(Mean %)
Primary Shape
(Mean %)
Main Size
(Mean %)
Ref.
Republic of KoreaIncheon/
Gyeonggi area
122013100 L20 μm mean 152.69 ± 92.38---[26]
Cheonsu Bay52016/2017100 L20 μm mean 0.784 ± 0.272PP + PE (54%)Fragment (81%)Non-fiber 197 ± 168 μm
Fiber 752 ± 711 μm
[27]
Hampyeong52016/2017100 L20 μm mean 1.548 ± 0.211PP + PE (84%)Fragment (81%)-
Deukryang Bay52016/2017100 L20 μm mean 1.146 ± 0.423PP + PE (82%)Fragment (81%)-
Gwangyang Bay52016/2017100 L20 μm mean 2.362 ± 1.022PP + PE (89%)Fragment (81%)-
Ulsan Coast52016/2017100 L20 μm mean 1.764 ± 1.006PP + PE (30%)Fragment (81%)-
Yeongil Bay52016/2017100 L20 μm mean 1.688 ± 0.496EVA (58%)Fragment (81%)-
Incheon52016/2017100 L20 μm mean 4.064 ± 1.075EVA (75%)Fragment (81%)-
Busan62016/2017100 L20 μm mean 2.362 ± 1.022EVA (72%)Fragment (81%)-
Yellow Sea92018200 L20 μm mean 0.266 ± 0.459---[44]
South Sea52018200 L20 μm ---
East Sea82018200 L20 μm mean 0.289 ± 0.280---
ChinaChinese Coast16-100 L50 μm mean 4.5PP, PE (>75%)Fiber (89.3%)500 μm (76%)[31]
Yangtze Estuary 12–20 L32 μm mean 4.137 ± 2.462-Fiber (79.1%)>500–1000 μm (67%)[50]
North Yellow Sea50201625 L30 μm mean 0.545 ± 0.282PE (77.8%)
PP (11.1%)
Film (58.1%)
Fiber (39.1%)
>500 μm (35.7~83.5%)[48]
South China Sea2220173 m320–300 μm mean 2.569 ± 1.770Alkyd (22.5%)
PCL (20.9%)
PEA (15.5%)
PS (14.7%) PTFE (4.7%)
--[49]
MalaysiaEstuaries4
9
20182.041 L/s (10 min)20 μm mean 0.422 ± 0.110-Fiber (73.8–80.8%)-[47]
Sea areamean 0.211 ± 0.104--
North PoleArctic Central Basin-20162000 L250 μm 0–0.0075
(8.5 m depth)
Polyester (>80%)Fiber (94%)1000–2000 μm (62%)[45]
Atlantic Ocean232014mean 2.6 m310~50 μm 0.013–0.501PE + PP (48%)->40 μm (64%)[46]
Southwest sea of Jeju23202030 L20 μm 0.23 ± 0.22PP + PE (67%)Fragment (69%)20–300 μm (54.4%)This study
It is challenging to predict spatiotemporal microplastic distributions in marine environments because they are affected by many factors, such as marine hydrology, weather conditions, the physical and chemical properties of microplastics, and biological processes [31,51,52]. In particular, our study area, the East China Sea, is affected by various sea currents [53,54], wind [55], and seasonal changes.
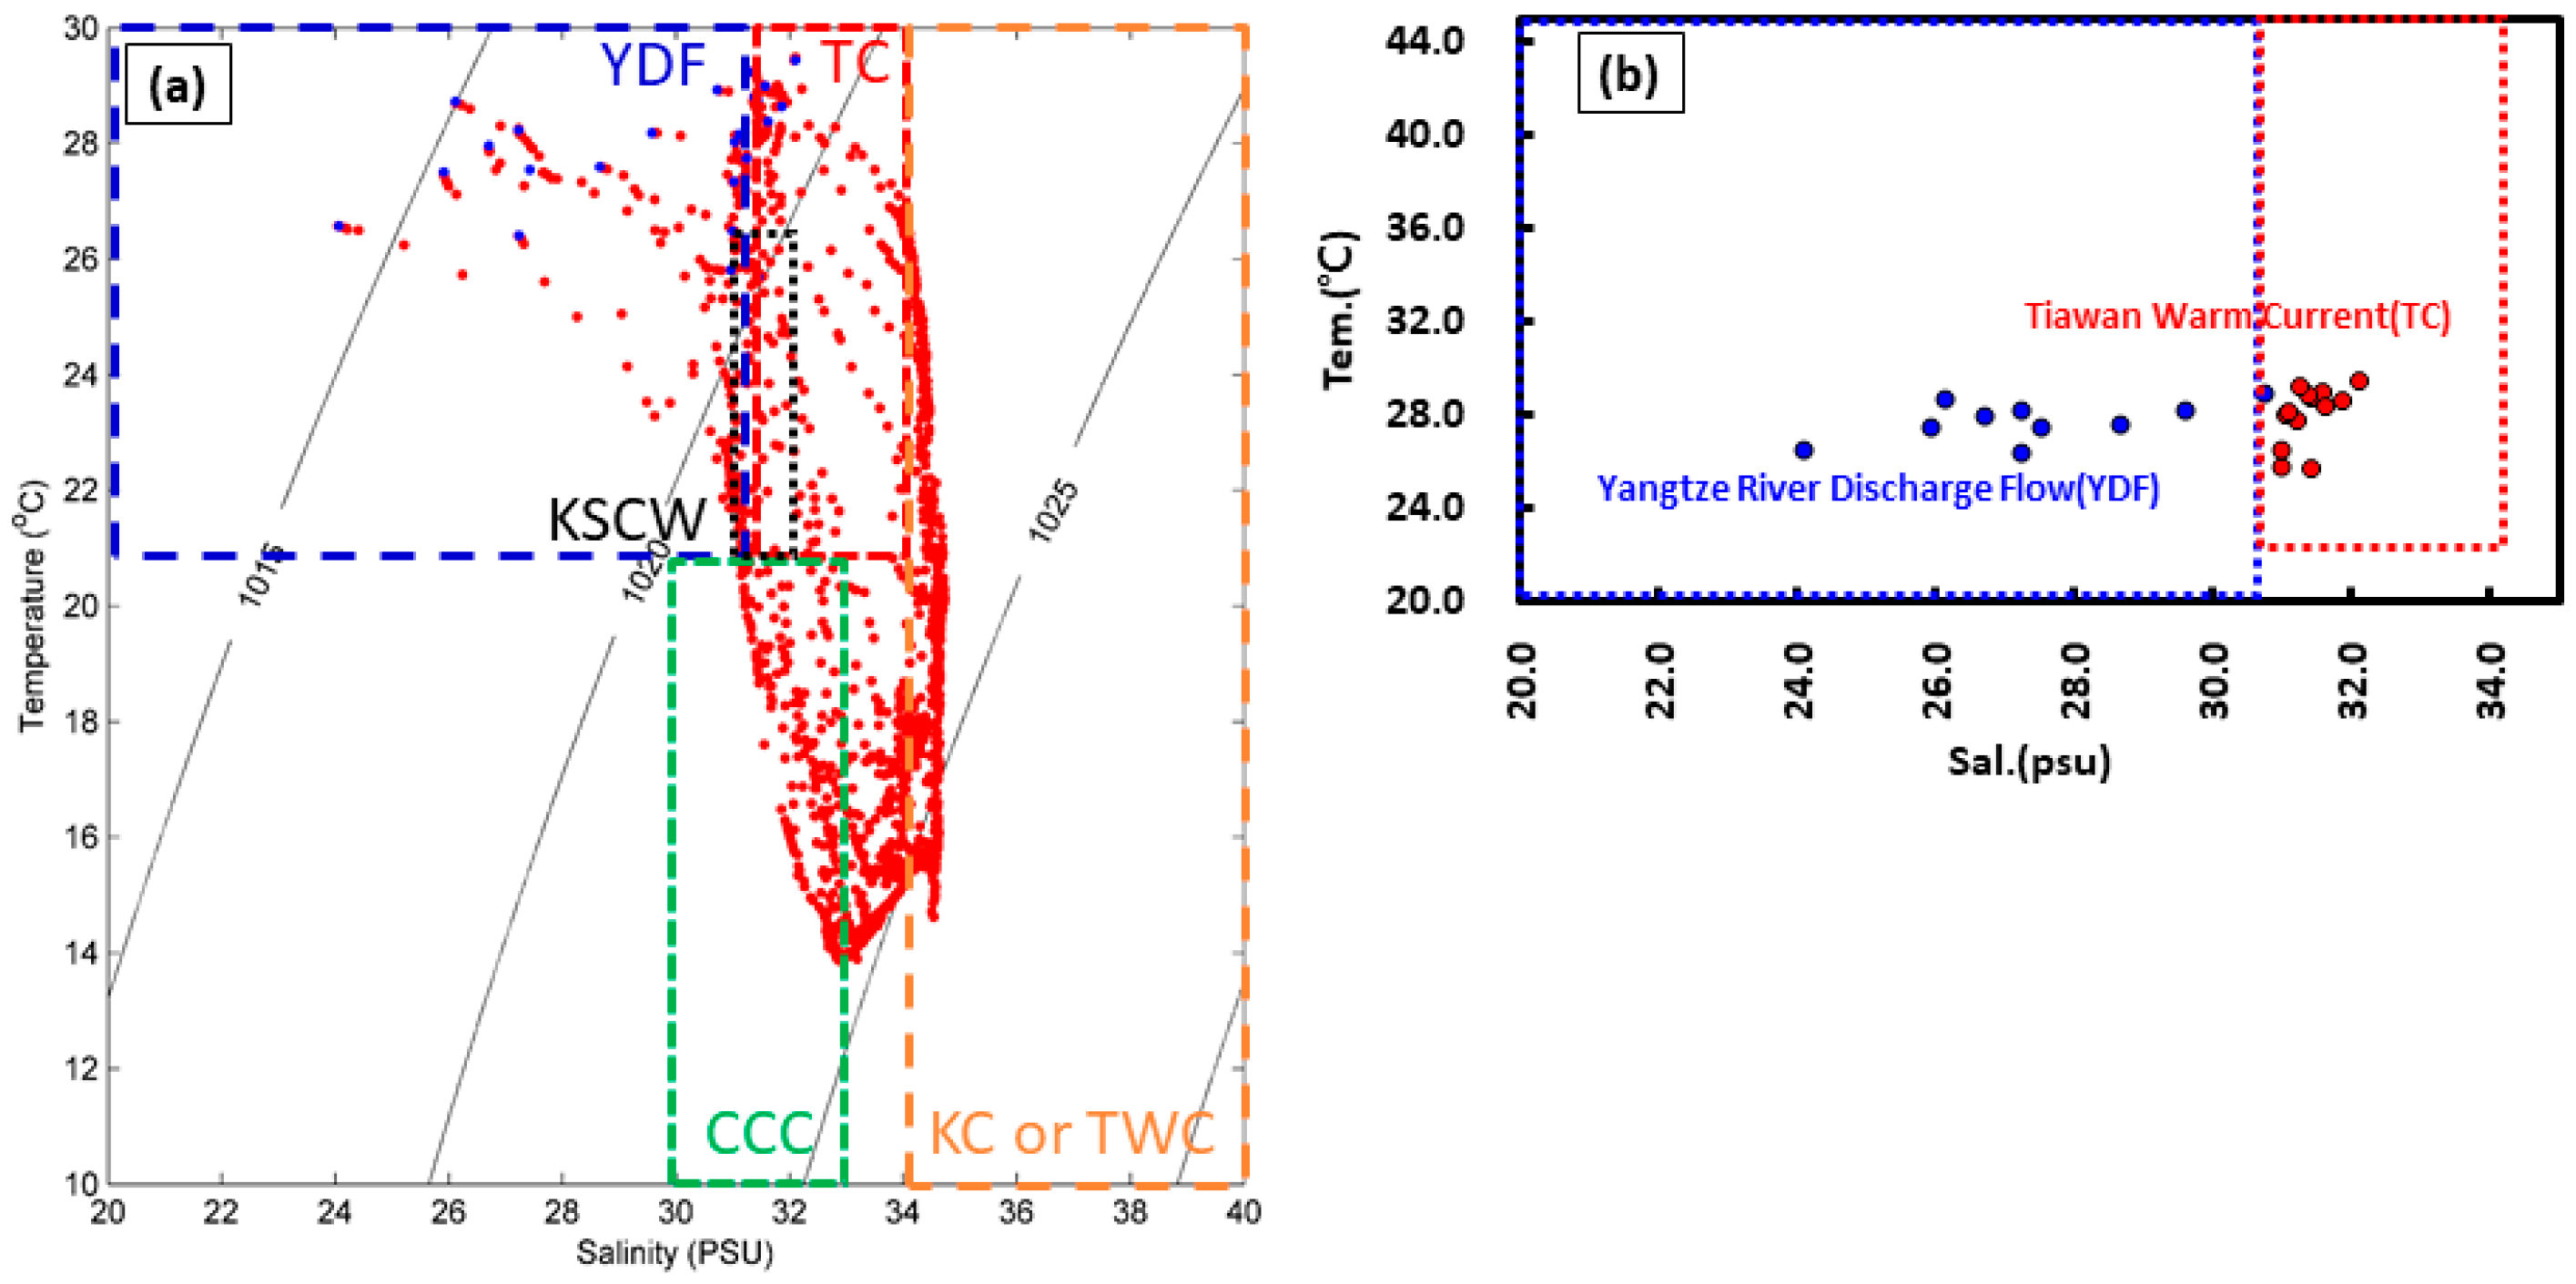
Since it is expected that the fate of microplastics in the study area is significantly affected by sea currents in summer, water mass analysis was carried out using surface water temperature and salinity (T-S diagram) levels based on a previous research survey [56,57,58] (Figure 8). Notably, discharge flow from the Yangtze River (YDF group, water temperature above 23 °C, salinity below 31 psu) and the Taiwan Warm Current (TC group, water temperature above 23 °C, salinity 31 to 34.2 psu) were prominent in the study area [56,57]. The west and central parts of the study area appertained to the YDF group and the southeast part of the study area to the TC group.
The average microplastic abundance levels were 0.36 particles/L in the YDF group and 0.52 particles/L in the TC group, slightly higher in the TC group than in the YDF group. The maximum discharges at the Datong sluice gate, the last floodgate in China’s lower Yangtze River, were 69,744 m3s−1 and 81,807 m3s−1 in 2019 and 2020, respectively [59]. Notably, this more than double the annual average discharge emitted in July [59]. Numerous microplastics, 195,000–900,000 particles/km2 (average 492,000 particles/km2), were found in the surface water in the Yangtze River Basin [60]. Some were deposited into the river sediment, but others were released into the East China Sea via the Yangtze River estuary. The microplastic levels in the surface water in the Yangtze River estuary reported an average of 8.55 ± 1.79 particles/L [50]. This implies that the Yangtze River is one of the most significant microplastic sources in this study area.
However, our study was relatively distant from the Yangtze River estuary area, and the microplastic abundance in the YDF group ranged from 0.2 to 0.6 particles/L [61]. We believe that the microplastics flowing into the Yangtze River estuary are in a low-salinity environment. This is likely because the Yangtze River features a slightly lower buoyancy causing high-density plastic to sink similar to sediment (alkyd density: 1.24–2.10 g/cm3, acryl density: 1.09–1.20 g/cm3, polyester density: 1.24–2.3 g/cm3) [44] and low-density plastic to float on the surface (PP density: 0.85–9.2 g/cm3, PE density: 0.89–0.93 g/cm3) [44]. The composition of high-density plastic in this study was 35% in the YDF group and 65% in the TC group (Figure 9).
On the other hand, stratification and mixing in the water column at the boundary between freshwater and seawater are essential factors that influence plastic transportation [62]. Notably, the difference in density between freshwater (density 1.00 g/cm3) and seawater (density 1.03 g/cm3) may affect buoyancy and deposition. Moreover, there are many suspended and deposited plastics in estuaries due to the poor water circulation and high sedimentation rates. The microplastic abundance in the sediments of the Yangtze River estuary was recorded at the remarkably high level of 2378.80 particles/kg [63]. The microplastic levels in the sediment of rivers had a tendency to decrease from the river mouth toward the open sea due to the increased distance [64].
High-density plastics can sink into the deep sea within a few days [65], and they may not move far from the estuary [44]. This is expected to result in a high number of microplastics being deposited by the Yangtze River. Furthermore, low-density microplastics could flow into the study area and drift into the surface water in low-salinity environments. These characteristics could result in the proportion of heavy polymers in the YDP group being lower than that in the TC group. These results are also reliable in terms of salinity results. The TC group had a higher salinity than the YDF group (the averages were 31.34 psu in the YDF and 27.01 psu in the TC groups). The Taiwan Warm Current occurs strongly in summer and has a higher density of 1.03 g/cm3, reinforcing the buoyancy of particles in the TC group. Additionally, weathered microplastics, over time, change color to black or transparent [66] and white or bright turquoise for smaller particles [67] in remote marine environments. In this study, it was confirmed that more than 90% of the microplastics in the TC group were white or black (Figure 10).
For the reasons mentioned above, it is likely that the high-density polymers, introduced from the Yangtze River Discharge Flow, deposit onto the sea floor around the estuary of the river. Contrarily, the low-density polymers may drift into the study area depending on the seawater density. These fates of the microplastics are expected to depend on the salinity distribution in the surface seawater derived from the Yangtze River in summer. In addition, the high-salinity Taiwan Warm Current might affect microplastic distribution in southeastern sea areas. This is the first study on microplastics to use a micro-FT-IR with an MCT mode in the East China Sea. Our baseline study results will act as the primary data sources to determine microplastic pollution from the East China Sea and the southern waters of the Korean and Japanese coasts into the Pacific Ocean.

5. Conclusions

This study collected surface seawater samples from the southern sea area of Jeju Island; identified the abundance, types, sizes, and shapes of polymers in the study area via microplastic analysis; and compared these with previous research results. In addition, the distribution characteristics of microplastics were considered using the characteristics of ocean currents in the research sea area.
PE, PP, alkyd, acryl, and polyester were detected in microplastics, and PE had a high ratio with an average of 53%. The average abundance of microplastics was determined to be 0.46 ± 0.27 particles/L. As for the microplastic shapes, fragments and fibers were observed, with average abundance levels of 69% and 31%, respectively, confirming that the fragment form was more common. The largest size of the microplastics was 0.02–0.30 m, mainly detected in shellfish, with an overall average abundance of 69%.
The abundance levels, polymer types, sizes, and shapes of the microplastics were compared with a study that used a bulk water sampling method, among other sample collection methods. The microplastic abundance was lower than the results of other coastal studies. On the other hand, it was higher than the results of studies on open waters, such as the Arctic Central Basin and the Atlantic Ocean. In addition, except for the results of studies in areas where aquaculture is highly developed, with regard to microplastic polymer types, sizes, and shapes, the results for the Atlantic Ocean (far from any coastlines) showed the opposite trend. Although this research area is an open sea area, microplastics are believed to be introduced via ocean currents and show different trends.
During summer, the study area is affected by discharge flow from the Yangtze River and the Taiwan Warm Current. The western part of the study area has a low salt content due to discharge flow from the Yangtze River; therefore, high- and low-density plastics settle in the study area. It is believed that low- and high-density plastics are transported and introduced over long periods because the eastern part of the study area is subject to the high salinity of the Taiwan Warm Current.
This study is the first example of monitoring microplastics using FT-IR in the East China Sea. This sea area can be used to achieve basic results because it flows into the East Sea of Republic of Korea via the Tsushima Current, and microplastics in adjacent territorial waters can therefore be studied.

Author Contributions

Conceptualization, B.K.M., C.R.C., Y.I. and H.S.C.; methodology, B.K.M., C.R.C., H.Y.S., Y.I. and H.S.C.; validation, B.K.M. and C.R.C.; formal analysis, B.K.M., M.J.J., U.K., K.H.D. and H.J.K.; investigation, B.K.M., H.H.J., M.J.J., U.K., K.H.D. and H.J.K.; data curation, B.K.M., C.R.C., H.Y.S. and H.S.C.; writing—original draft preparation, B.K.M. and C.R.C.; writing—review and editing, B.K.M., H.H.J., C.R.C., H.Y.S. and H.S.C.; visualization, B.K.M.; supervision, H.S.C.; project administration, H.S.C.; funding acquisition, H.S.C. All authors have read and agreed to the published version of the manuscript.

Funding

This research was supported by Chonnam National University and the Basic Science Research Program through the National Research Foundation of Korea (NRF) funded by the Ministry of Science and ICT (2020R1A2C21024421340982119420103).

Data Availability Statement

Not applicable.

Acknowledgments

This research was supported by the BK21 FOUR (Fostering Outstanding Universities for Research) funded by the Ministry of Education (MOE, Korea) and National Research Foundation of Korea (NRF).

Conflicts of Interest

The authors declare no conflict of interest.

References

  1. Plastics Europe. An Analysis of European Plastics Production, Demand and Waste Data. Plastics Europe. In Plastics–The Facts; Plastics Europe: Brussels, Belgium, 2019. [Google Scholar]
  2. Zainuddin, A.H.; Aris, A.Z.; Zaki, M.R.M.; Yusoff, F.M.; Wee, S.Y. Occurrence, potential sources and ecological risk estimation of microplastic towards coastal and estuarine zones in Malaysia. Mar. Pollut. Bull. 2022, 174, 113282. [Google Scholar] [CrossRef] [PubMed]
  3. Lebreton, L.; Andrady, A. Future scenarios of global plastic waste generation and disposal. Palgrave Commun. 2019, 5, 6. [Google Scholar] [CrossRef] [Green Version]
  4. Jambeck, J.R.; Geyer, R.; Wilcox, C.; Siegler, T.R.; Perryman, M.; Andrady, A.; Narayan, R.; Law, K.L. Plastic waste inputs from land into the ocean. Science 2015, 347, 768–771. [Google Scholar] [CrossRef] [PubMed]
  5. Andrady, A.L. Microplastics in the marine environment. Mar. Pollut. Bull. 2011, 62, 1596–1605. [Google Scholar] [CrossRef] [PubMed]
  6. Kershaw, P.J.; Rochman, C.M. Sources, fate and effects of microplastics in the marine environment: Part 2 of a global assessment. In Reports and Studies—IMO/FAO/Unesco-IOC/WMO/IAEA/UN/UNEP Joint Group of Experts on the Scientific Aspects of Marine Environmental Protection (GESAMP); International Maritime Organization: London, UK, 2015; Eng No. 93. [Google Scholar]
  7. Li, J.; Liu, H.; Chen, J.P. Microplastics in freshwater systems: A review on occurrence, environmental effects, and methods for microplastics detection. Water Res. 2018, 137, 362–374. [Google Scholar] [CrossRef]
  8. De Jesus Piñon-Colin, T.; Rodriguez-Jimenez, R.; Pastrana-Corral, M.A.; Rogel-Hernandez, E.; Wakida, F.T. Microplastics on sandy beaches of the Baja California Peninsula, Mexico. Mar. Pollut. Bull. 2018, 131, 63–71. [Google Scholar] [CrossRef]
  9. Estahbanati, S.; Fahrenfeld, N.L. Influence of wastewater treatment plant discharges on microplastic concentrations in surface water. Chemosphere 2016, 162, 277–284. [Google Scholar] [CrossRef]
  10. Rillig, M.C. Microplastic in terrestrial ecosystems and the soil? Environ. Sci. Technol. 2012, 46, 6453–6454. [Google Scholar] [CrossRef]
  11. Auta, H.S.; Emenike, C.U.; Fauziah, S.H. Distribution and importance of microplastics in the marine environment: A review of the sources, fate, effects, and potential solutions. Environ. Inter. 2017, 102, 165–176. [Google Scholar] [CrossRef]
  12. Barnes, D.K.; Galgani, F.; Thompson, R.C.; Barlaz, M. Accumulation and fragmentation of plastic debris in global environments. Philos. Trans. R. Soc. B Biol. Sci. 2009, 364, 1985–1998. [Google Scholar] [CrossRef] [Green Version]
  13. Bergmann, M.; Wirzberger, V.; Krumpen, T.; Lorenz, C.; Primpke, S.; Tekman, M.B.; Gerdts, G. High quantities of microplastic in Arctic deep-sea sediments from the HAUSGARTEN observatory. Environ. Sci. Technol. 2017, 51, 11000–11010. [Google Scholar] [CrossRef] [PubMed] [Green Version]
  14. Ling, S.D.; Sinclair, M.; Levi, C.J.; Reeves, S.E.; Edgar, G.J. Ubiquity of microplastics in coastal seafloor sediments. Mar. Pollut. Bull. 2017, 121, 104–110. [Google Scholar] [CrossRef]
  15. Boerger, C.M.; Lattin, G.L.; Moore, S.L.; Moore, C.J. Plastic ingestion by planktivorous fishes in the North Pacific Central Gyre. Mar. Pollut. Bull. 2010, 60, 2275–2278. [Google Scholar] [CrossRef] [PubMed]
  16. Cole, M.; Galloway, T.S. Ingestion of nanoplastics and microplastics by Pacific oyster larvae. Environ. Sci. Technol. 2015, 49, 14625–14632. [Google Scholar] [CrossRef] [Green Version]
  17. Cole, M.; Webb, H.; Lindeque, P.K.; Fileman, E.S.; Halsband, C.; Galloway, T.S. Isolation of microplastics in biota-rich seawater samples and marine organisms. Sci. Rep. 2014, 4, 1–8. [Google Scholar] [CrossRef] [Green Version]
  18. Lattin, G.L.; Moore, C.J.; Zellers, A.F.; Moore, S.L.; Weisberg, S.B. A comparison of neustonic plastic and zooplankton at different depths near the southern California shore. Mar. Pollut. Bull. 2004, 49, 291–294. [Google Scholar] [CrossRef]
  19. Farrell, P.; Nelson, K. Trophic level transfer of microplastic: Mytilus edulis (L.) to Carcinus maenas (L.). Envrion. Pollut. 2013, 177, 1–3. [Google Scholar] [CrossRef] [PubMed]
  20. Cox, K.D.; Covernton, G.A.; Davies, H.L.; Dower, J.F.; Juanes, F.; Dudas, S.E. Human consumption of microplastics. Enviro. Sci. Technol. 2019, 53, 7068–7074. [Google Scholar] [CrossRef] [Green Version]
  21. Lehner, R.; Weder, C.; Petri-Fink, A.; Rothen-Rutishauser, B. Emergence of nanoplastic in the environment and possible impact on human health. Environ. Sci. Technol. 2019, 53, 1748–1765. [Google Scholar] [CrossRef]
  22. Yang, C.S.; Chang, C.H.; Tsai, P.J.; Chen, W.Y.; Tseng, F.G.; Lo, L.W. Nanoparticle-based in vivo investigation on blood–brain barrier permeability following ischemia and reperfusion. Anal. Chem. 2004, 76, 4465–4471. [Google Scholar] [CrossRef]
  23. Zheng, Y.; Li, J.; Sun, C.; Cao, W.; Wang, M.; Jiang, F.; Ju, P. Comparative study of three sampling methods for microplastics analysis in seawater. Sci. Total Environ. 2021, 765, 144495. [Google Scholar] [CrossRef]
  24. Amelia, T.S.M.; Khalik, W.M.A.W.M.; Ong, M.C.; Shao, Y.T.; Pan, H.J.; Bhubalan, K. Marine microplastics as vectors of major ocean pollutants and its hazards to the marine ecosystem and humans. Prog. Earth Planet. Sci. 2021, 8, 12. [Google Scholar] [CrossRef]
  25. Lee, J.M. Relationship among Size Groups of Plastic Beach Debris as a Tool to Assess Microplastic Pollution in Korea. Ph.D. Dissertation, Department of Ecological Engineering, Pukyong University, Busan, Republic of Korea, 2013. (In Korean). [Google Scholar]
  26. Chae, D.H.; Kim, I.S.; Kim, S.K.; Song, Y.K.; Shim, W.J. Abundance and distribution characteristics of microplastics in surface seawaters of the Incheon/Kyeonggi coastal region. Arch. Environ. Contam. Toxicol. 2015, 69, 269–278. [Google Scholar] [CrossRef] [PubMed]
  27. Song, Y.K.; Hong, S.H.; Eo, S.; Jang, M.; Han, G.M.; Isobe, A.; Shim, W.J. Horizontal and vertical distribution of microplastics in Korean coastal waters. Environ. Sci. Technol. 2018, 52, 12188–12197. [Google Scholar] [CrossRef] [PubMed]
  28. Kang, H.S.; Seo, M.H.; Yang, Y.S.; Park, E.O.; Yoon, Y.H.; Kim, D.J.; Jeong, H.G.; Soh, H.Y. Zooplankton and Neustonic Microplastics in the Surface Layer of Yeosu Coastal Areas. Kor. J. Environ. Biol. 2018, 36, 11–20. [Google Scholar] [CrossRef]
  29. Kwon, O.Y.; Kang, J.H.; Hong, S.H.; Shim, W.J. Spatial distribution of microplastic in the surface waters along the coast of Korea. Mar. Pollut. Bull. 2020, 155, 110729. [Google Scholar] [CrossRef]
  30. Jung, J.W.; Park, J.W.; Eo, S.; Choi, J.; Song, Y.K.; Cho, Y.; Shim, W.J. Ecological risk assessment of microplastics in coastal, shelf, and deep sea waters with a consideration of environmentally relevant size and shape. Environ. Pollut. 2021, 270, 116217. [Google Scholar] [CrossRef]
  31. Jiang, Y.; Zhao, Y.; Wang, X.; Yang, F.; Chen, M.; Wang, J. Characterization of microplastics in the surface seawater of the South Yellow Sea as affected by season. Sci. Total Environ. 2020, 724, 138375. [Google Scholar] [CrossRef]
  32. Isobe, A.; Uchhda, K.; Tokai, T.; Iwasaki, S. East Asian seas: A hot spot of pelagic microplastics. Mar. Pollut. Bull. 2015, 101, 618–623. [Google Scholar] [CrossRef]
  33. National Institute of Fisheries Science (NFS). Guidelines for Qualitativeness and Quantification of Residual Microplastics in Seawater and Aquatic Life; NIPS: Busan, Republic of Korea, 2021; pp. 1–49. (In Korean) [Google Scholar]
  34. Masura, J.; Baker, J.; Foster, G.; Arthur, C. Laboratory Methods for the Analysis of Microplastics in the Marine Environment: Recommendations for Quantifying Synthetic Particles in Waters and Sediments; NOAA Techical Memorandum; NOAA Marine Debris Division: Silver Spring, MD, USA, 2015; p. 48. [Google Scholar]
  35. Bimali Koongolla, J.; Andrady, A.L.; Terney Pradeep Kumara, P.B.; Gangabadage, C.S. Evidence of microplastics pollution in coastal beaches and waters in southern Sri Lanka. Mar. Pollut. Bull. 2018, 137, 277–284. [Google Scholar] [CrossRef]
  36. Brandon, J.; Goldstein, M.; Ohman, M.D. Long-term aging and degradation of microplastic particles: Comparing in situ oceanic and experimental weathering patterns. Mar. Pollut. Bull. 2016, 110, 299–308. [Google Scholar] [CrossRef] [Green Version]
  37. Castillo, A.B.; Al-Maslamani, I.; Obbard, J.P. Prevalence of microplastics in the marine waters of Qatar. Mar. Pollut. Bull. 2016, 111, 260–267. [Google Scholar] [CrossRef]
  38. Korea Institute of Oceanscience & Technology (KIOST). Guidelines for “Study on Environmental Risk of Marine Microplastics” 01. Guidelines for Collection and Analysis of Floating Microplastics; KIOST: Busan, Republic of Korea, 2017; pp. 1–23. (In Korean) [Google Scholar]
  39. Cho, Y.; Shim, W.J.; Jang, M.; Han, G.M.; Hong, S.H. Abundance and characteristics of microplastics in market bivalves from South Korea. Environ. Pollut. 2019, 245, 1107–1116. [Google Scholar] [CrossRef]
  40. UNEP. Marine Plastic Debris and Microplstics—Global Lessens and Research to Inspire Action and Guide Policy Change; United Nations Environment Programme: Nairobi, Kenya, 2019. [Google Scholar]
  41. Kershaw, P.; Turra, A.; Galgani, F. Guidelines for the Monitoring and Assessment of Plastic Litter in the Ocean-GESAMP Reports and Studies No. 99. GESAMP Reports and Studies; United Nations Office: Nairobi, Kenya, 2019; pp. 1–123. [Google Scholar]
  42. Michida, Y.; Chavanich, S.; Cozar, C.A.; Hagmann, P.; Hinata, H.; Isobe, A.; Kershaw, P.; Kozlovskii, N.; Li, D.; Lusher, A.L.; et al. Guidelines for Harmonizing Ocean Surface Microplastic Monitoring Methods; Ministry of the Environment Japan: Tokyo, Japan, 2019; p. 71. [Google Scholar]
  43. Jeong, H.; Kusano, T.; Addai-Arhin, S.; Nugraha, W.C.; Novirsa, R.; Phan Dinh, Q.; Shirosaki, T.; Fujita, E.; Kameda, Y.; Cho, H.S.; et al. A Study on the Differences of Microplastics Distributions in the Surface Freshwater Collected by 100- and 355-μm Meshes. Environ. Monitor. Con. Res. 2022, 2, 22–34. [Google Scholar]
  44. Eo, S.; Hong, S.H.; Song, Y.K.; Han, G.M.; Seo, S.; Shim, W.J. Prevalence of small high-density microplastics in the continental shelf and deep sea waters of East Asia. Water Res. 2021, 200, 117238. [Google Scholar] [CrossRef] [PubMed]
  45. La Daana, K.K.; Gårdfeldt, K.; Lyashevska, O.; Hassellöv, M.; Thompson, R.C.; O’Connor, I. Microplastics in sub-surface waters of the Arctic Central Basin. Mar. Pollut. Bull. 2018, 130, 8–18. [Google Scholar]
  46. Enders, K.; Lenz, R.; Stedmon, C.A.; Nielsen, T.G. Abundance, size and polymer composition of marine microplastics ≥ 10 μm in the Atlantic Ocean and their modelled vertical distribution. Mar. Pollut. Bull. 2015, 100, 70–81. [Google Scholar] [CrossRef]
  47. Taha, Z.D.; Amin, R.M.; Anuar, S.T.; Nasser, A.A.A.; Sohaimi, E.S. MICROPLASTICS in seawater and zooplankton: A CASE study from Terengganu estuary and offshore waters, Malaysia. Sci. Total Environ. 2021, 786, 147466. [Google Scholar] [CrossRef]
  48. Zhu, L.; Bai, H.; Chen, B.; Sun, X.; Qu, K.; Xia, B. Microplastic pollution in North Yellow Sea, China: Observations on occurrence, distribution and identification. Sci. Total Environ. 2018, 636, 20–29. [Google Scholar] [CrossRef]
  49. Cai, M.; He, H.; Liu, M.; Li, S.; Tang, G.; Wang, W.; Cen, Z. Lost but can’t be neglected: Huge quantities of small microplastics hide in the South China Sea. Sci. Total Environ. 2018, 633, 1206–1216. [Google Scholar] [CrossRef]
  50. Zhao, S.; Zhu, L.; Wang, T.; Li, D. Suspended microplastics in the surface water of the Yangtze Estuary System, China: First observations on occurrence, distribution. Mar. Pollut. Bull. 2014, 86, 562–568. [Google Scholar] [CrossRef] [PubMed]
  51. Fazey, F.M.; Ryan, P.G. Biofouling on buoyant marine plastics: An experimental study into the effect of size on surface longevity. Environ. Pollut. 2016, 210, 354–360. [Google Scholar] [CrossRef] [PubMed]
  52. Khatmullina, L.; Chubarenko, I. Transport of marine microplastic particles: Why is it so difficult to predict? Anthr. Coasts 2019, 2, 293–305. [Google Scholar] [CrossRef] [Green Version]
  53. Chen, C.T.A. Distributions of nutrients in the East China Sea and the South China Sea connection. J. Ocean. 2008, 64, 737–751. [Google Scholar] [CrossRef]
  54. Chen, C.T. Chemical and physical fronts in the Bohai, Yellow and East China Seas. J. Mar. Syst. 2009, 78, 394–410. [Google Scholar] [CrossRef]
  55. Seung, Y.H. Water masses and circulations around Korean Peninsula, J. Oceanolog. Soc. Kor. 1992, 27, 324–331. (In Korean) [Google Scholar]
  56. Gong, G.C.; Chen, Y.L.L.; Liu, K.K. Chemical hydrography and chlorophyll a distribution in the East China Sea in summer: Implications in nutrient dynamics. Cont. Shelf Res. 1996, 16, 1561–1590. [Google Scholar] [CrossRef]
  57. Hur, H.B.; Jacobs, G.A.; Teague, W.J. Monthly variations of water masses in the Yellow and East China Seas, November 6. J. Ocean. 1999, 55, 171–184. [Google Scholar] [CrossRef]
  58. Yoon, S.C.; Youn, S.H.; Whang, J.D.; Suh, Y.S.; Yoon, Y.Y. Long-term Variation in Ocean Environmental Conditions of the Northern East China Sea. J. Kor. Soc. Mar. Environ. Energy 2015, 18, 189–206. (In Korean) [Google Scholar] [CrossRef]
  59. Zhu, Z.N.; Zhu, X.H.; Zhang, C.; Chen, M.; Zheng, H.; Zhang, Z.; Kaneko, A. Monitoring of Yangtze River Discharge at Datong Hydrometric Station Using Acoustic Tomography Technology. Front. Earth Sci. 2021, 9, 723123. [Google Scholar] [CrossRef]
  60. Xiong, X.; Wu, C.; Elser, J.J.; Mei, Z.; Hao, Y. Occurrence and fate of microplastic debris in middle and lower reaches of the Yangtze River–from inland to the sea. Sci. Total Environ. 2019, 659, 66–73. [Google Scholar] [CrossRef] [PubMed]
  61. Zhang, D.; Cui, Y.; Zhou, H.; Jin, C.; Yu, X.; Xu, Y.; Zhang, C. Microplastic pollution in water, sediment, and fish from artificial reefs around the Ma’an Archipelago, Shengsi, China. Sci. Total Environ. 2020, 703, 134768. [Google Scholar] [CrossRef] [PubMed]
  62. Zhang, H. Transport of microplastics in coastal seas. Estuar. Coast. Shelf Sci. 2017, 199, 74–86. [Google Scholar] [CrossRef]
  63. Lin, J.; Xu, X.M.; Yue, B.Y.; Xu, X.P.; Liu, J.Z.; Zhu, Q.; Wang, J.H. Multidecadal records of microplastic accumulation in the coastal sediments of the East China Sea. Chemosphere 2021, 270, 128658. [Google Scholar] [CrossRef]
  64. Zhang, C.; Zhou, H.; Cui, Y.; Wang, C.; Li, Y.; Zhang, D. Microplastics in offshore sediment in the yellow Sea and east China Sea, China. Environ. Pollut. 2019, 244, 827–833. [Google Scholar] [CrossRef]
  65. Kowalski, N.; Reichardt, A.M.; Waniek, J.J. Sinking rates of microplastics and potential implications of their alteration by physical, biological, and chemical factors. Mar. Pollut. Bull. 2016, 109, 310–319. [Google Scholar] [CrossRef] [PubMed]
  66. Abidli, S.; Antunes, J.C.; Ferreira, J.L.; Lahbib, Y.; Sobral, P.; El Menif, N.T. Microplastics in sediments from the littoral zone of the north Tunisian coast (Mediterranean Sea). Estuar. Coast. Shelf Sci. 2018, 205, 1–9. [Google Scholar] [CrossRef]
  67. Martí, E.; Martin, C.; Galli, M.; Echevarría, F.; Duarte, C.M.; Cózar, A. The colors of the ocean plastics. Environ. Sci. Technol. 2020, 54, 6594–6601. [Google Scholar] [CrossRef]
Figure 1. The study areas and sampling stations.
Water 15 02393 g001
Figure 2. Spatial distribution of water temperature in the southwest sea of Jeju Island.
Water 15 02393 g002
Figure 3. Spatial distribution of salinity in the southwest sea of Jeju Island.
Water 15 02393 g003
Figure 4. Spatial distribution of microplastic abundance in the southwest sea area of Jeju Island.
Water 15 02393 g004
Figure 5. Spatial distribution of microplastic composition in the southwest sea area of Jeju Island.
Water 15 02393 g005
Figure 6. Spatial distribution of microplastic shapes in the southwest sea area of Jeju Island.
Water 15 02393 g006
Figure 7. Spatial distribution of microplastic size in the southwest sea area of Jeju Island.
Water 15 02393 g007
Figure 8. T-S diagram of surface seawater in the south of Jeju Island. (a) T-S diagram of water column, (b) T-S diagram of surface seawater. YFD: Yangtze River discharge flow, CCC: Chinese Coastal Current, KC: Kuroshio Current, TWC: Tsushima Warm Current, TC: Taiwan Warm Current, KSCW: Korea southern coastal water.
Water 15 02393 g008
Figure 9. Percentage compositions (%) of microplastic polymer types (a) and high-density microplastic polymers in the A and B groups (b).
Water 15 02393 g009
Figure 10. Surface color classification of microplastics.
Water 15 02393 g010
Table 1. Results for microplastic abundance, size, shape, water temperature, and salinity in the southwest sea of Jeju Island.
SiteMP Abundance (Particles/L) (a)MP Size (%)MP Shape (%) (b)Tem.
(°C)
Sal.
(psu)
PEPPPYAcrylAlkydTotal0.02–0.3 mm0.3–0.6 mm0.6~1.0 mm1.0–5.0 mmFragmentFiber
EC010.330.17N.DN.D0.100.6087.512.5N.DN.D83.316.725.6931.44
EC021.200.130.03N.DN.D1.3782.94.912.2N.D97.62.425.8130.97
EC030.230.20N.DN.D0.330.7763.215.85.315.8100.00.026.4830.98
EC040.200.170.20N.DN.D0.5788.211.8N.DN.D64.735.327.7431.24
EC050.100.07N.D0.030.070.2775.0N.DN.D25.062.537.528.7431.43
EC060.170.070.20N.DN.D0.4330.846.215.47.753.846.228.6331.87
EC070.170.23N.D0.030.500.9388.911.1N.DN.D42.957.128.9931.57
EC080.100.030.07N.DN.D0.2050.016.716.716.766.733.329.4432.10
EC090.200.07N.DN.D0.170.4350.016.716.716.761.538.528.9230.73
EC100.20N.D0.07N.DN.D0.2762.512.5N.D25.075.025.028.8131.38
EC110.270.10N.DN.D0.170.5393.86.3N.DN.D68.831.328.3831.62
EC120.130.070.10N.DN.D0.3055.611.1N.D33.366.733.328.0331.04
EC140.270.07N.DN.DN.D0.3360.030.010.0N.D100.00.027.5928.66
EC150.270.07N.DN.D0.330.6786.413.6N.DN.D50.050.027.5527.50
EC160.17N.D0.10N.DN.D0.2750.012.512.525.062.537.526.4127.24
EC170.13N.DN.DN.D0.200.33100.0N.DN.DN.D40.060.026.5724.06
EC180.23N.DN.DN.DN.D0.2385.714.3N.DN.D100.00.027.4925.92
EC190.130.07N.DN.D0.300.5081.36.312.5N.D40.060.027.9726.71
EC200.17N.DN.DN.DN.D0.1740.060.0N.DN.D100.00.028.2327.23
EC210.070.07N.DN.D0.230.3756.325.012.56.336.463.628.7326.12
EC220.270.07N.DN.DN.D0.33100.0N.DN.DN.D83.316.728.1829.60
EC230.230.03N.DN.DN.D0.2788.911.1N.DN.D88.911.128.1631.11
EC240.100.030.20N.DN.D0.3310.030.010.050.040.060.029.2431.25
Min0.070.030.030.030.070.1710.04.95.36.336.40.025.6924.06
Max1.200.230.200.030.501.37100.060.016.750.0100.063.629.4432.10
Mean0.230.090.120.030.240.4669.016.05.49.668.931.127.9029.64
SD0.220.060.060.000.120.2723.214.06.513.621.421.41.052.33
(a) Only the detected polymer types (PE, PS, PP, PY, acryl, alkyd, PET, PVC, and nylon) are shown. (b) Only the observed shapes (fragment, fiber, sphere, sheet, and pellet) are shown. N.D: not detected.
Disclaimer/Publisher’s Note: The statements, opinions and data contained in all publications are solely those of the individual author(s) and contributor(s) and not of MDPI and/or the editor(s). MDPI and/or the editor(s) disclaim responsibility for any injury to people or property resulting from any ideas, methods, instructions or products referred to in the content.