Article

Numerical Simulation for Optimization of the Water Intake-Outlet Arrangements for Seawater Desalination Plants Based on MIKE21: A Case Study of Laoshan Bay, Qingdao

First Institute of Oceanography, MNR, Qingdao 266061, China
*
Author to whom correspondence should be addressed.
Water 2023, 15(13), 2402; https://doi.org/10.3390/w15132402
Submission received: 10 May 2023 / Revised: 19 June 2023 / Accepted: 21 June 2023 / Published: 29 June 2023
(This article belongs to the Section Oceans and Coastal Zones)

Abstract

:
The field of seawater desalination faces some challenges. For example, at present, site selection and layout of water intakes and outlets are often not carefully considered. This can easily result in the degradation of water quality due to coastal sea pollution and sudden brine discharge, which can be hazardous and can negatively impact marine development and activities such as aquaculture. By using the MIKE21 numerical simulation software, this paper establishes a two-dimensional mathematical tidal current model of the engineered sea area and a mathematical convection diffusion model after brine discharge. The tidal current field of the Laoshan Bay waters and the salinity field distribution after brine discharge in different water intake-outlet arrangement schemes in desalination plants are calculated and analyzed. In view of the various control factors affecting the layout and location selection of water intakes and outlets, combined with the current situation of marine development and utilization, calculation results and layout advantages and disadvantages of the primary schemes are compared and analyzed, the scheme with the best water intake-outlet layout is recommended, and relevant optimization suggestions are presented.

1. Introduction

With rapid economic development in coastal areas and increasing demand for freshwater, a growing number of desalination plants are in the planning and construction phases in coastal areas. Desalination plants mostly use coastal seawater as a water source and receiving water. In the production of high-quality freshwater, seawater desalination technology can also produce brine, which has higher salinity than ordinary seawater. Bay waters usually present an unsteady flow state due to coastal islands, complex terrain, and tidal influence. Therefore, the water intake of a desalination plant is vulnerable to clogging due to sand and dirt [1,2,3], which then reduces the efficiency of water diversion and the water quality. At the same time, discharging brine into the sea may harm and influence marine life growth and reproduction, and may even cause other marine ecological problems [4,5,6]. Therefore, water supply and drainage engineering not only directly affect the operational costs and safety of desalination plants, but also, through different water intake-outlet arrangements and construction forms, have different effects on the surrounding marine environment. Choosing a reasonable water intake-outlet arrangement has important practical significance for the safe and economic operation of desalination plants and for the marine environment.
The process of brine discharge into the sea is a complicated process of convective mass transfer and diffusion [7,8]. In view of the environmental impacts caused by brine discharge, scholars in China and abroad have carried out much investigation and research. Studies show that high-salinity anomalies have an impact on marine biota, including zooplankton and benthic communities [9,10,11,12]. The site selection of water intake is affected by many factors, such as water depth, tidal current velocity, water sediment concentration, and the form of the water intake structure. Therefore, determining the optimum site for water intake and brine outfalls is a key issue at the planning stage for coastal desalination plant projects [13]. In addition, the geometrical characteristics of the diffuser, especially the discharge angle, have been shown to affect the diffusion distance and concentration distribution of brine [14,15]. Some scholars have carried out relevant studies on the location selection and scheme optimization of water intake projects [16,17]. With the wide application of mathematical models in the field of engineering, scholars increasingly use numerical simulation methods to study transport diffusion rules and influence factors of brine discharge [18,19,20,21]. Some scholars also provide measures for decreasing environmental impact and optimizing the water intake-outlet arrangements [16,22].
This article presents a comprehensive analysis and scheme comparison of site suitability for different water intake-outlet arrangements by discussing the distribution of the tidal flow field and salinity field of the desalination plants in Laoshan Bay, Qingdao. Using MIKE 2023 software, this article establishes a two-dimensional numerical model, and performs a numerical simulation of the impact factors (tidal current, sediment, brine diffusion, etc.) considering the current situation of marine development and utilization of coastal aquaculture, structures, etc. The article presents a comprehensive analysis and multifactor scheme optimization, and provides theoretical and data support for the spatial location selection and optimization of water intake-outlet arrangement in the construction of environmentally friendly desalination plants.

2. Study Area and Desalination Engineering

2.1. Study Area

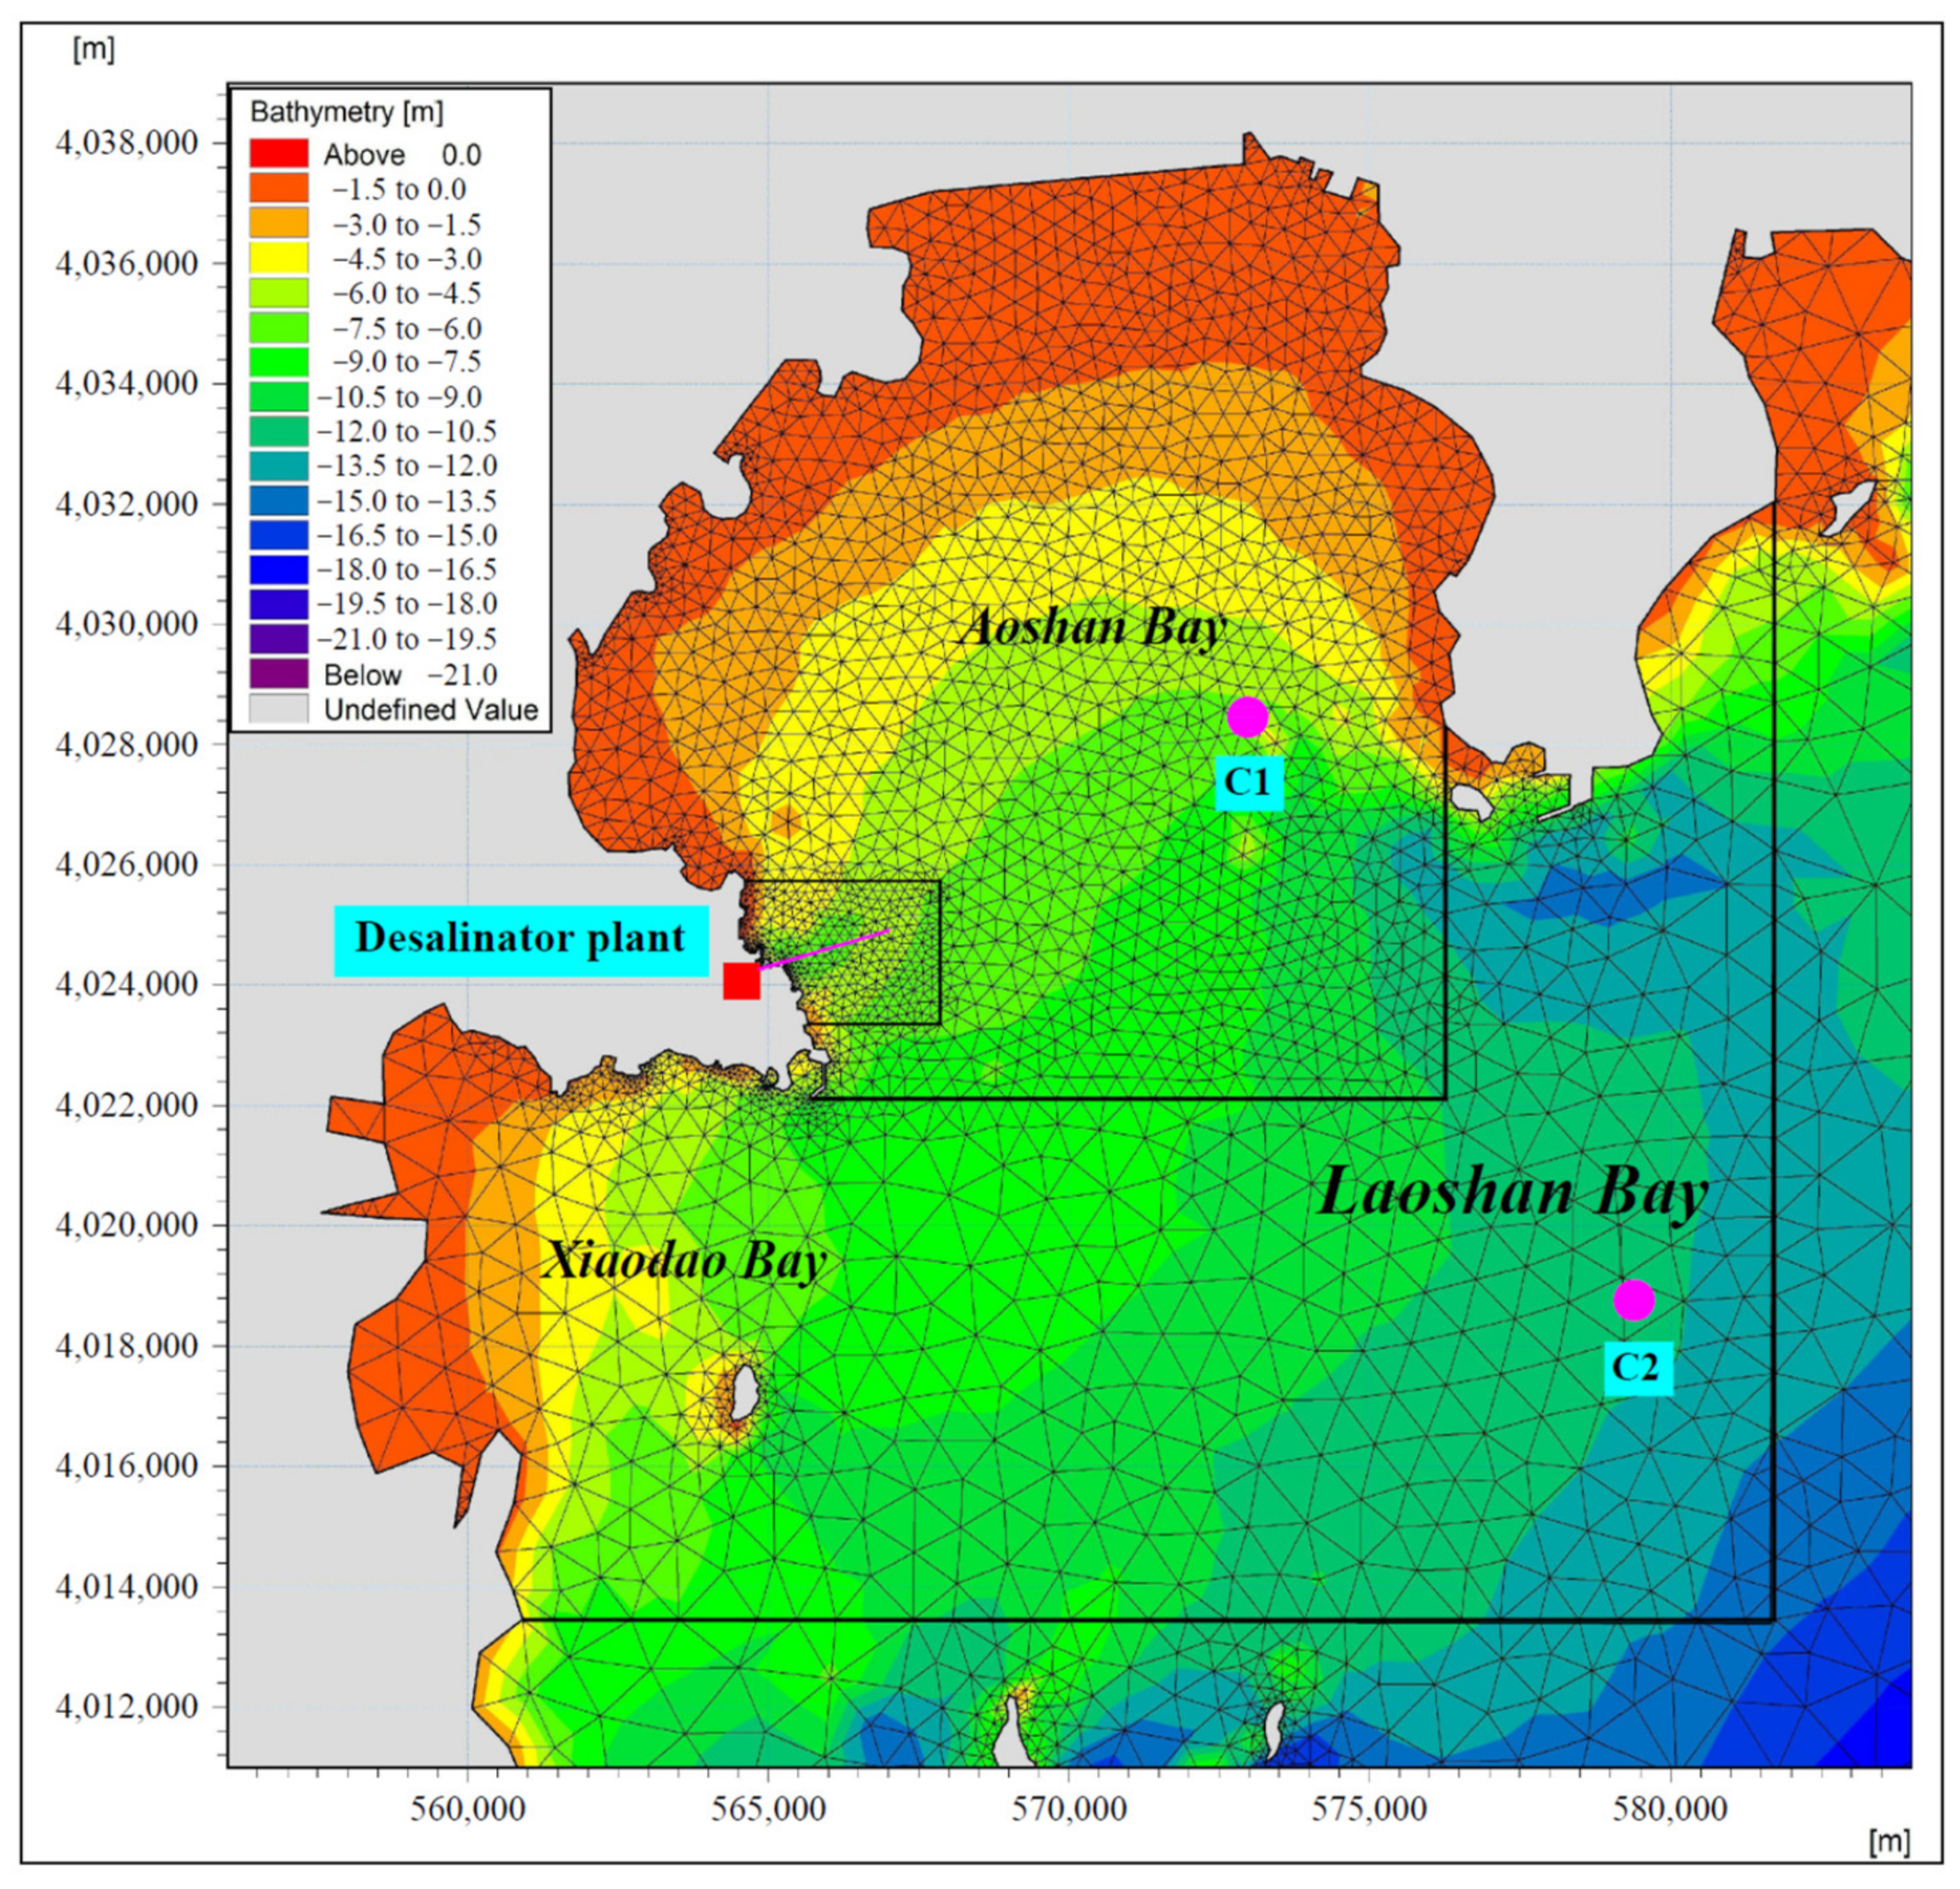
Laoshan Bay is located to the east of Qingdao, Shandong province, facing the South Yellow Sea on the east. It is a semi-closed bay composed of Aoshan Bay and Xiaodao Bay, with an area of about 190 km2. The water depth of the bay increases from 0~5 m near the shore to up to 20 m in the sea (Figure 1). Aoshan Bay is located north of Laoshan Bay, with the mouth facing south. It is about 12 km long and 9 km wide from north to south, covering an area of about 160 km2, with an average water depth of 4 m and a maximum water depth of 13 m. The headland on its east side is Nvdao Island, and on its west side it is separated from Xiaodao Bay by Aoshantou.
The tidal currents in Laoshan Bay are regular and semidiurnal, comprising mostly alternating currents in the inner bay and rotary currents in the outer bay. The flow velocity of the rising tide is greater than that of the ebb tide, and the current velocity gradually increases from shore to sea. The maximum tidal current velocity is 30~50 cm/s in the inner bay and 60~70 cm/s in the outer bay [23]. The annual wave direction of Laoshan Bay mainly concentrates in the S-SE-E direction, and the constant wave direction is SE. The strongest wave direction is in the NNE direction with a frequency of 0.10%, and the maximum significant wave height is 2.5 m. Waves in the offshore areas are mainly wind waves, and strong waves mainly come from swells in the open sea. The significant wave height is mainly concentrated between 0.1 m and 1.0 m with a frequency of 94.32% [23]. The coastal waters of Laoshan Bay are rich in marine biological resources and have good water quality. The development and utilization of the bay head is mostly salt pans and aquaculture ponds. There are some small ports on Nvdao Island and at Aoshantou and other bedrock headland areas [24].

2.2. Desalination Engineering

The planned desalination project is located on the shore of Laoshan Bay, with a desalination capacity of 50,000 m3/d. The project adopts reverse-osmosis seawater desalination technology. By using the selection permeability of the reverse-osmosis membrane, freshwater can be obtained from seawater, and the salt separated by desalination can be discharged in concentrated water. This technology does not require heating. The process is simple, with low energy consumption, and has a wide range of applications. The water intake-outlet of the project is located in the sea area of Aoshan Bay on the east side of the facility. A seabed water intake is used to obtain seawater, using a water intake head with a structure of a pile foundation pipe frame. The designed diameter of the water intake pipe is DN1400, with a water intake capacity of 137,000 tons/day. The brine is discharged via the diffuser, and the designed diameter of the discharge pipe is DN1000, with a drainage capacity of 87,000 tons/day. The water pipelines are all buried below the seabed. The engineering design scheme adopted in this project can effectively avoid the influence of waves.
According to the preliminary engineering design, the water intake-outlet is located offshore. The water intake and outlet pipes are arranged in parallel from shore to sea. The distance between the pipes is 5.0 m, and the water depth near the drainage outlet is about 6–8 m. There are three primary layout schemes (Figure 1). Plan A adopts the scheme of “taking near and draining far”. The offshore distance of the intake is about 1100 m, where the water depth is 7.0 m. The offshore distance of the outlet is 1600 m, at a water depth of 7.8 m. Plan B and plan C adopt a scheme of “taking far and draining near”. For Plan B, the offshore distance of the intake is about 1900 m, at a water depth of 8.0 m. The offshore distance of the outlet is 1500 m, at a water depth of 7.5 m. For Plan C, the offshore distance of the intake is about 1600 m, at a water depth of 7.8 m. The offshore distance of the outlet is 1100 m, at a water depth of 7.0 m. On the basis of the above initial layout schemes of the water intake-outlet arrangement and the numerical simulation results of different schemes combined with other control factors, the recommended scheme is determined and optimized using multi-factor analysis and comprehensive selection. The final optimization scheme can be used as the basis for further design and construction.

3. Numerical Model

3.1. MIKE21 Model

The MIKE21 model contains a number of modules. In this paper, the hydrodynamic module and transport module are selected to establish the hydrodynamic and advection-dispersion model. The equations of the model are based on flow equations governing mass and momentum conservation along the average depth of shallow water in two dimensions, as shown in Equations (1)–(3). The diffusion control equation of salinity is shown in Equation (4).
ξ t + x ( h u ) + y   ( h v ) = 0    
u t + u u x + v u y Ω v + g ξ x + g u u 2 + v 2 C 2 h x ( N x u x ) y ( N y u y ) = 0
v t + u v x + v v y + Ω u + g ξ y + g v u 2 + v 2 C 2 h x ( N x v x ) y ( N y v y ) = 0
where ξ is the water level of the free water surface; h is the water depth; u and v are the x, y vertical mean velocities; g is the acceleration of gravity; Ω = 2ωsinφ is the Coriolis force coefficient; ω is the angular velocity of the earth’s rotation; φ is the latitude of the point; N x   and   N y are turbulence vortex viscosity coefficients in the 𝑥 and 𝑦 directions; and c is the Chezy resistance coefficient.
t ( h s ) + x ( u h s ) + y   ( v h s ) = x ( h D x s x ) + y ( h D y s y ) + h s s S    
where h is the water depth; s is the vertical mean salinity; u and v are the x, y horizontal velocities; D x and D y   are the x, y diffusion coefficients; D = f Δ x Δ t , f is the linear attenuation coefficient; Δ x is the space step; Δ t is the time step; 𝑆 is the source and sink item traffic; and s s is the salinity at source and sink.

3.2. Model Building

3.2.1. Mesh Grid

The computational domain of the model is the coastal area of Qingdao enclosed by the four points A, B, C, and D and the shoreline (Figure 2). An unstructured triangular mesh is adopted for meshwork. The full computational domain consists of 7523 nodes and 12,962 units. In order to ensure calculation accuracy, grid refinement is carried out on the sea area near the engineered area at a grid scale of 20~50 m, and near the outlet at a grid scale of 10~20 m, as seen in Figure 3. The water depth is based on the chart data, while the measured water depth data, converted to the local mean sea level, are used around the project. The shoreline data of the sea-land demarcation line in Shandong Province and the measured shoreline data in the vicinity of the project are adopted.

3.2.2. Conditions and Parameters

At points A and D on the open boundary of the model, the harmonic constants of the four main constituents M2, S2, K1 and O1, obtained from years of tidal level observation data of the Shijiusuo and Dingzi estuaries, were used as input conditions. At points B and C, the harmonic constants of the four main constituents M2, S2, K1 and O1, extracted at the corresponding points by the MIKE21 global model, were used as input conditions. The closed boundary takes the sea area and the shoreline around the project as the boundary. At the same time, the dynamic boundary method was used to perform the dry and wet grid treatment of water levels near the land-water boundary, since some areas along the shores of Laoshan Bay will dry out during the simulation. The water level of the dry grid was set within a range of 0.10~0.15 m and the water level of the wet grid was set within a range of 0.15~0.20 m. In order to ensure the stability of the numerical scheme throughout the simulation, the critical Courant–Friedrichs–Lewy (CFL) number was set to 0.8. The calculation time step of the model was dynamically adjusted according to the calculation conditions, with a minimum time step of 0.4 s. The bed roughness was controlled by the Manning coefficient M, which is 40~94 m1/3/s. The horizontal eddy viscosity coefficient (0.2 in the calculation domain) was given by the Smagorinsky formula.
According to the model, the brine discharged by the desalination plant via the drainage outlet diffuser is discharged into the sea area of Laoshan Bay. The brine discharge is 8.7 m3/d (equivalent to a desalination output of 5 × 10⁴ t/d), and its salinity value is 53.5‰. During the simulation calculation time, the background value of salinity in the sea area of Laoshan Bay was set as 31.8‰ on the basis of historical survey data. Due to the characteristics of waves in Laoshan Bay and the cover of the headland, the salinity diffusion is less affected by wave action. After the brine is discharged into the sea, the waters inside the bay are continuously exchanged with the seawater outside the bay. The salinity of each point in the bay does not increase unrestrictedly, but changes periodically with the tidal current and reaches stability after a given period of time [25,26]. Therefore, the simulation calculation time for the advection-dispersion of the brine was set from 8 to 19 April 2018. The standard eddy viscosity formula was used for the salinity diffusion coefficient, and the constant value of the transverse diffusion coefficient in the model was 0.1. Table 1 shows the values of all the parameters used for the calculations of the hydrodynamic and advection-dispersion models.

3.2.3. Model Verification

The hydrodynamic model is the foundation of the advection-diffusion model, and the accuracy of the advection-diffusion model can be ensured only if the accuracy of the simulation results can be ensured. To verify the accuracy of tidal level simulation, the tidal level observation data of two tidal stations in Qingdao Port and Laoshan Bay in the calculation domain were compared with the tidal level simulation results. The verified location is shown in Figure 2, and the tidal level verification curve is shown in Figure 4.
The tidal flow field simulation results were verified by continuous 25 h measured current data and model calculation results from two stations in Laoshan Bay in April 2018. The positions of the tidal flow verification points are shown in Figure 3, and the tidal flow verification curves of the two stations are shown in Figure 5 and Figure 6, respectively.
The calculated results of the model were found to be in good agreement with the measured tidal level data and ocean current data, properly reflecting the tidal level and ocean current characteristics in Laoshan Bay and its surrounding waters and meeting the simulation accuracy requirements of the hydrodynamic model and advection-diffusion model in this paper.

4. Results and Discussion

4.1. Simulation Results of Tidal Flow Field in Laoshan Bay

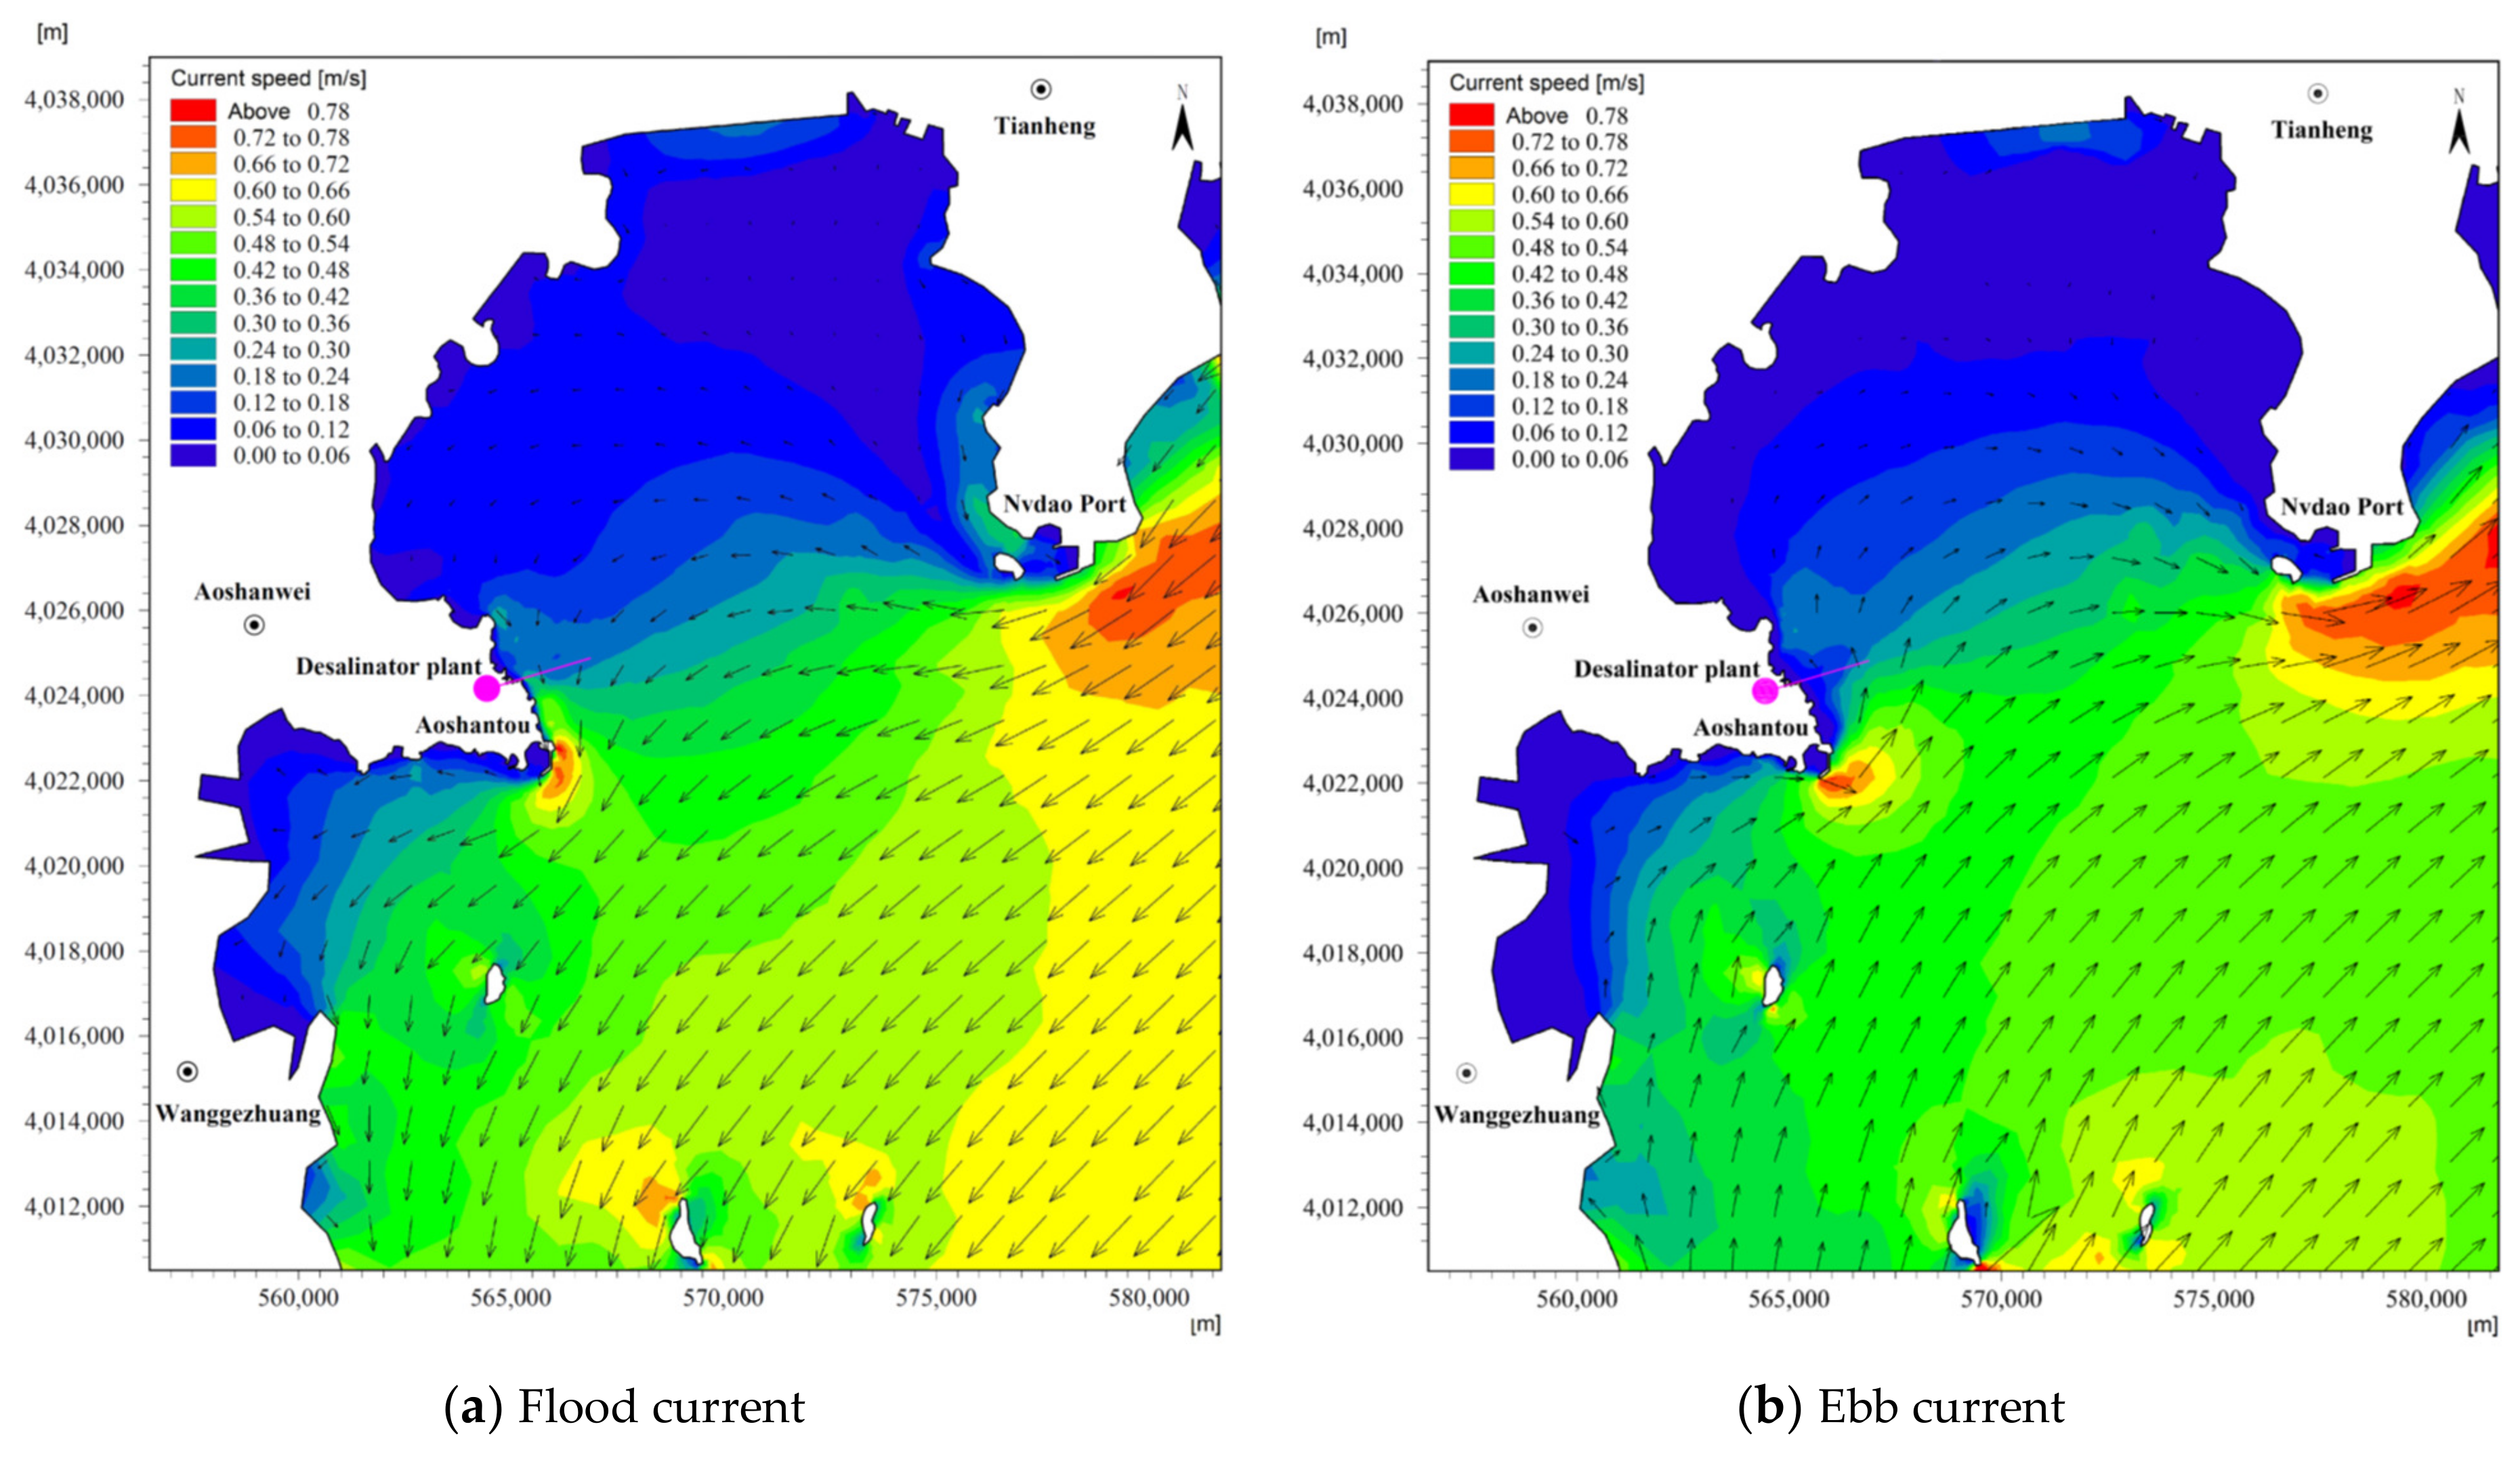
The simulation results of the tidal flow field in Laoshan Bay calculated using the model are shown in Figure 7. During the flood tide, the flow velocity in Laoshan Bay is generally 30~55 cm/s, and outside the bay the flow velocity is 60~70 cm/s. The flood current flows from NE to SW from the eastern sea area of Tianheng Town, then turns to NW after passing the headland and flows into Aoshan Bay on the north side. The flow velocity of the flood current in Aoshan Bay is typically 10~42 cm/s, and the flow velocity on the shore is relatively small, generally less than 10 cm/s. Near Nvdao Island, the flow velocity of the flood current is relatively high, between 54 cm/s and 78 cm/s. The flood current in the area where the project is located flows from NNW to SSE, with a velocity between 10 cm/s and 36 cm/s. After passing the project area, the flood current along the coast passes around the Aoshantou headland and then turns west to Xiaodao Bay. The flow velocity in the Aoshantou sea area is relatively high, with a maximum of 72 cm/s. The flood current in the Xiaodao Bay generally flows from NE to SW at a velocity of 10~42 cm/s, while the velocity near the shore is low, generally less than 10 cm/s. Then the tidal current flows from N to S along the shore to the outside of the bay, and the velocity increases accordingly.
During the ebb tide, the velocity in Laoshan Bay is generally 25~50 cm/s, and the velocity outside the bay is 55~65 cm/s. The northern ebb current flows from NW to SE, bypasses Nvdao Island, then turns to the NE and flows to the sea on the east side of Tianheng Town. The flow velocity in Aoshan Bay is 10~48 cm/s, and the velocity on the shore is low, generally less than 10 cm/s. The ebb tide velocity on the south side of Nvdao Island is relatively high, between 54 cm/s and 72 cm/s. Along the south side of the sea, the ebb tide flows from S to N outside the bay, and then from SW to NE inside Xiaodao Bay, and the flow velocity decreases accordingly. The flow velocity of the ebb tide in Xiaodao Bay is 10~36 cm/s, and the flow velocity on the shore is relatively low, generally less than 10 cm/s. After bypassing Aoshantou Headland, the ebb tidal current passes through the sea area of the project area, flowing from SSE to NNW at a flow velocity of 10~30 cm/s. The sea area south of Aoshantou has a high flow velocity of up to 68 cm/s.
The calculation results of the tidal flow field and the conclusions of historical research results are consistent [22,23], and the numerical simulation results properly reflect the distribution law of the tidal flow field in Laoshan Bay.

4.2. Simulation Results of Salinity Field after Brine Discharge

The diffusion process of brine in Laoshan Bay is mainly affected by tidal currents. The calculated results of salinity field distribution of brine discharged by different water intake-outlet schemes of seawater desalination projects are shown in Figure 8. It can be seen that the impact of the brine discharge under different schemes on the increase of salinity in the nearby sea area is less than 0.6 units in most sea areas, although the impact of the increase of salinity in a small area near the discharge outlet is more than 2.3 units. With the continuous discharge of brine, the salinity of the sea area near the discharge outlet obviously increases. However, due to the water exchange between Aoshan Bay and the outside, the salinity diffusion process tends to stabilize over time, and the salinity within the affected area does not continue to increase significantly. As can be seen from Figure 8a–c, the brine near the discharge outlet of the desalination project on the southwest side of Aoshan Bay diffuses along the main flow direction mainly under the influence of tidal action, with a longer diffusion distance from NNW to SSE along the main flow direction, and a smaller diffusion distance from WSW to ENE, which is perpendicular to the main flow direction. However, due to the difference in hydrodynamic conditions inside and outside the bay, the flow velocity is low and the salinity field is fan-shaped north of the discharge outlet, while the flow velocity is high and the salinity field is banded in the south.
Figure 8d shows the salinity change curve of the profile in the direction of the drainage pipe in the coastal seawater desalination project. Figure 8d reflects the variation of salinity along the profile of different intake-outlet arrangement schemes, as well as the distribution law of salinity near the intakes and outlets of different schemes. It can be seen that along the direction of the intake-outlet pipes, the salinity peaks are all located in the center of the discharge outlet in different schemes, and the peak salinity increment is 1.6~2.3 PSU. The salinity value rapidly decreases from the discharge outlet to both sides of the shore and the sea, and the curve of salinity values from the outlet to the sea is steeper, indicating that the salinity decreases more quickly on the seaside. The salinity value increase near the shore can be reduced to 0.1~0.2 PSU, while that on the seaside can be reduced to below 0.1 PSU, until it reaches the marine background level.

4.3. Comparison and Optimization of Water Intake-Outlet Layout Schemes

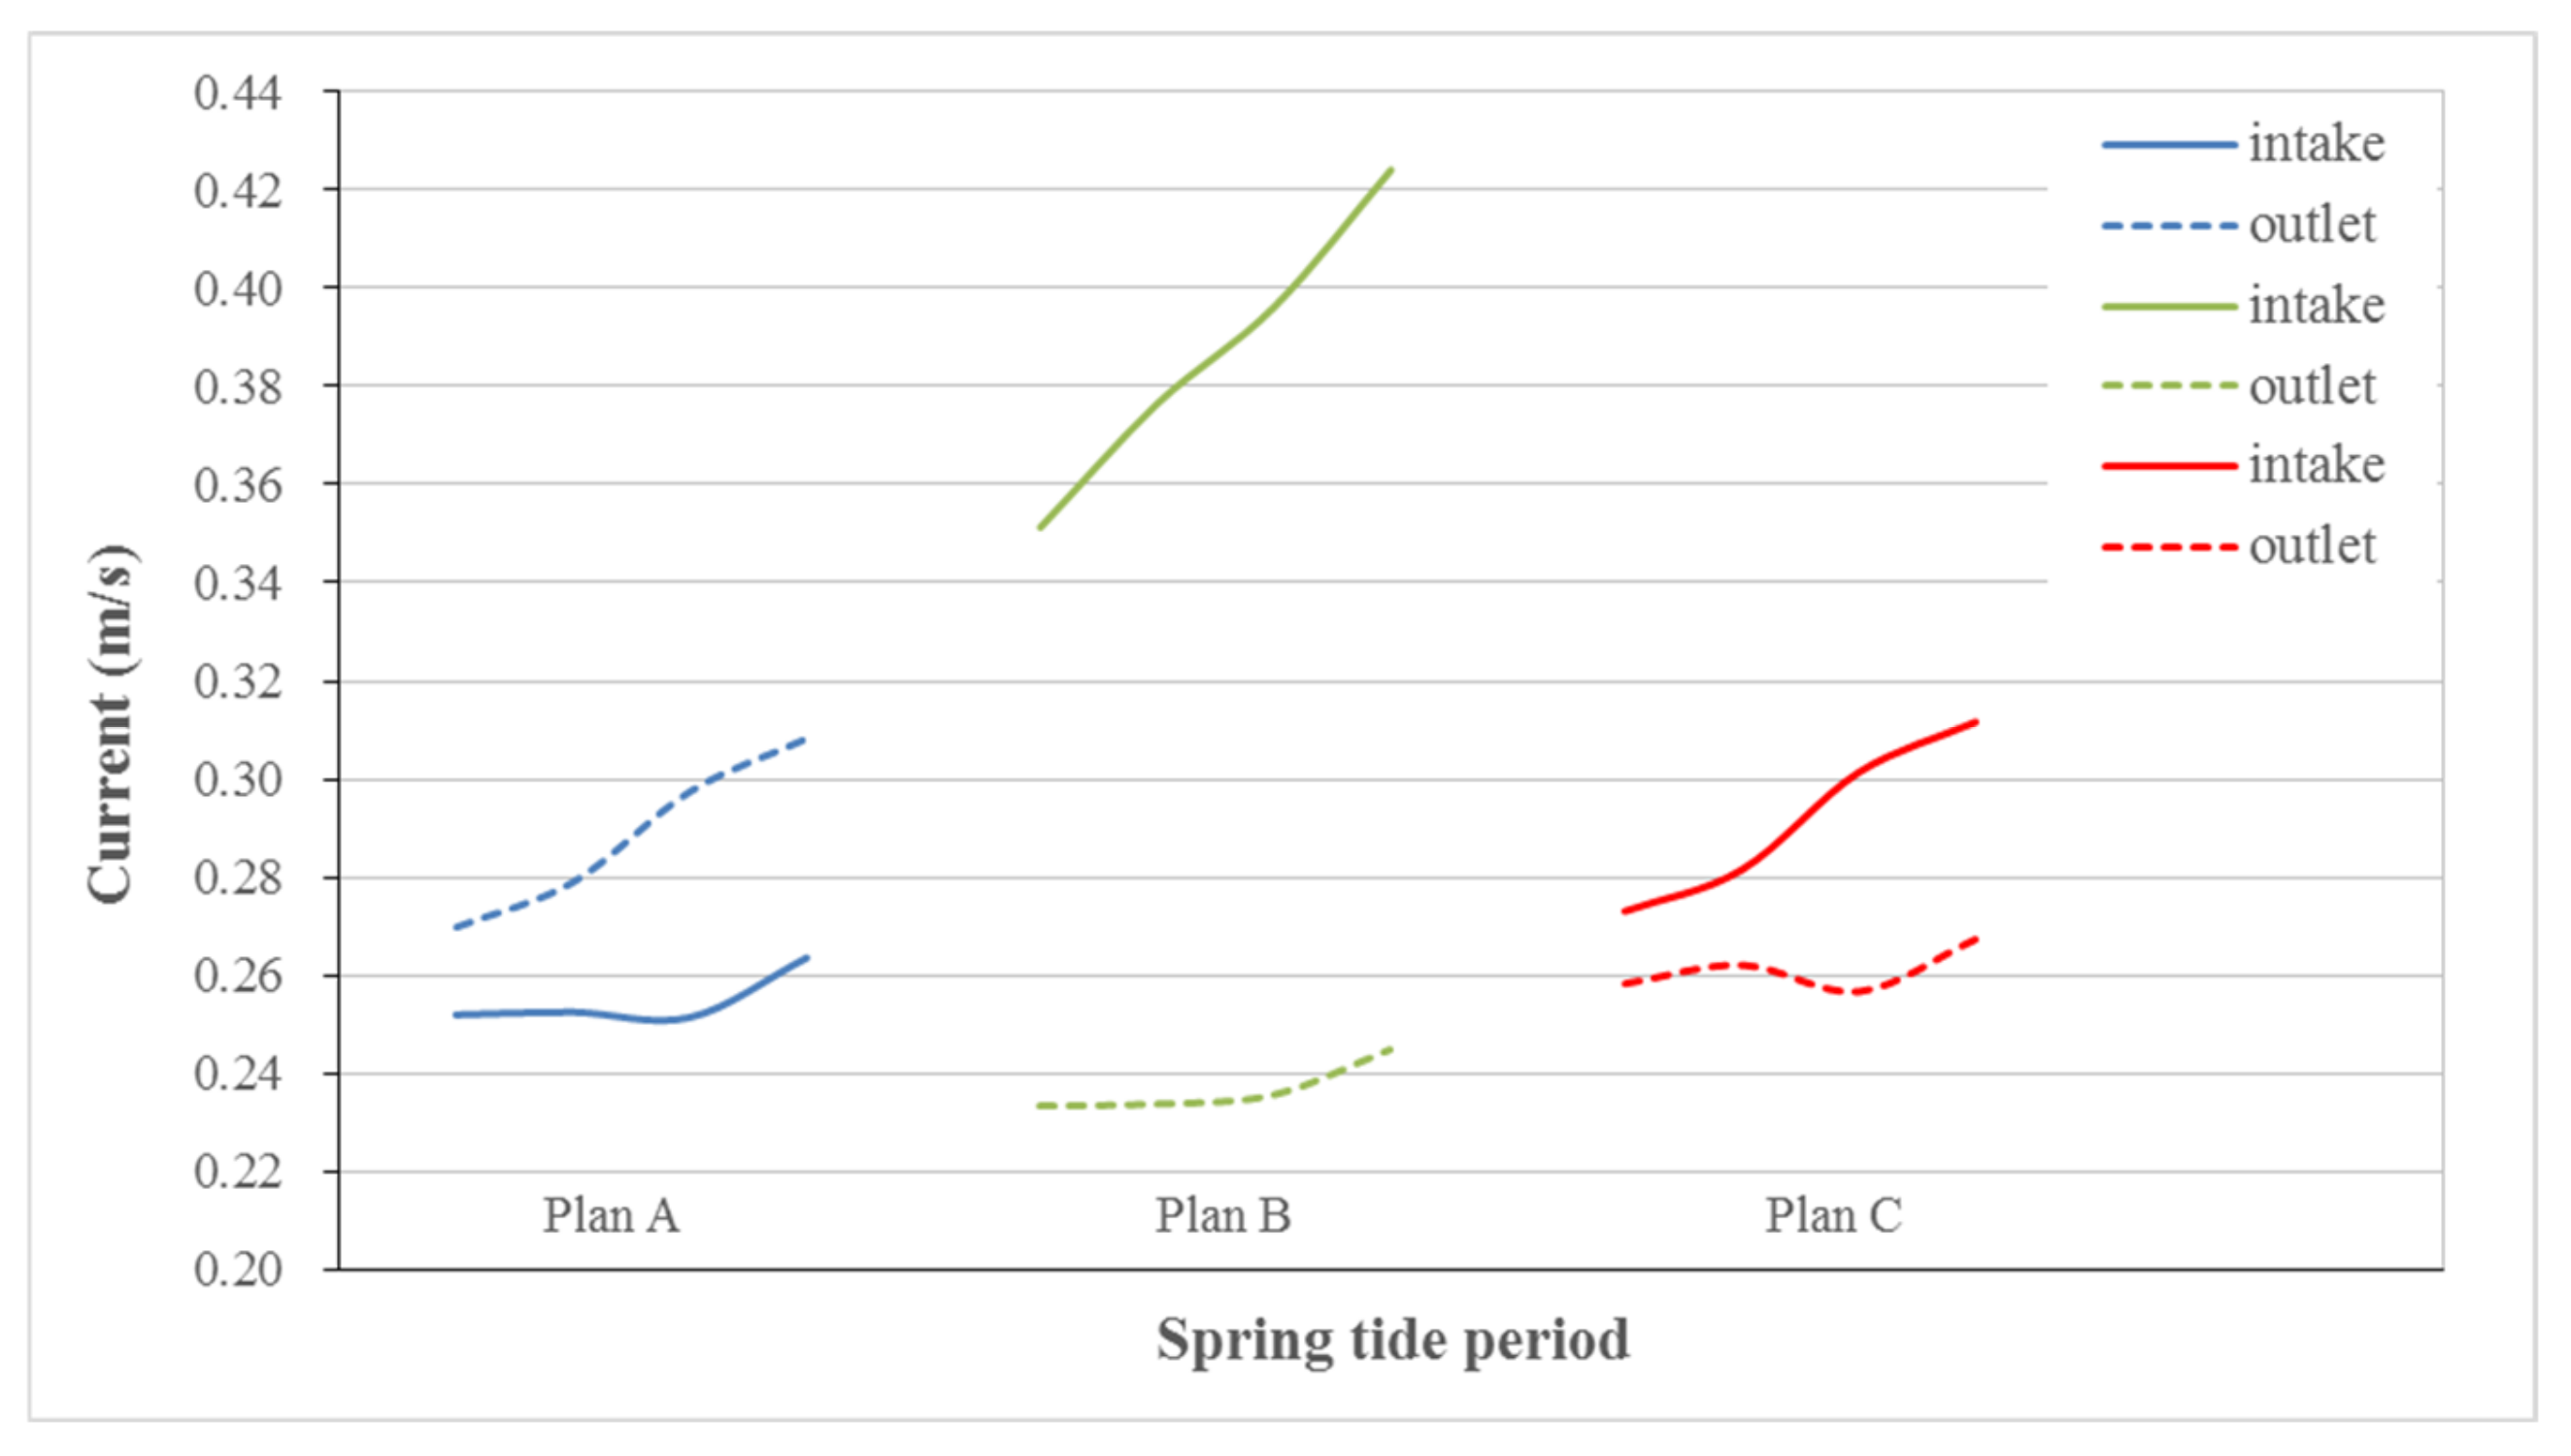
The design unit provides three preliminary selection schemes. For all schemes, the water intake and outlet pipes are arranged side by side, and the longitudinal distance between the water intake and the outlet is small. The intake-outlet arrangements are divided into “taking near and draining far”, “taking far and draining near”, and other forms, with the distance between the water intake and the outlet being 400~500 m. The hydrodynamic condition difference between water intake and outlet in different layout schemes and the salinity field influence after the brine is discharged into the sea are analyzed according to the numerical simulation results for the tidal flow field and brine diffusion in the preliminary selection schemes. In combination with the distribution of marine exploitation activities, the multi-factor comparison of the pros and cons of each layout scheme are discussed, and further layout optimizations are made. Table 2 lists the areas affected by maximum salinity increments of 0.5, 1.0 and 1.5 PSU in a tidal period, the diffusion distances of the 0.5 PSU salinity increment both perpendicular and parallel to the current direction, and the maximum salinity near the water intakes and outlets in different water intake-outlet layout schemes. Figure 9 shows the distribution curves of maximum current speeds near the water intake and outlet during the spring tide period in different layout schemes.
According to the data from the design unit, the planned desalination project adopts the seabed-type water intake method, which is suitable for large quantities of water intake, a relatively flat coast, and a sea area where the deep water area is far away from the coast. In this water intake method, sufficient water depth (greater than 5.0 m) must be ensured at the intake position to bury the main part of the intake in the sea bottom to maintain low-temperature seawater with small water quality variations. However, the gravity flow pipe is prone to accumulating marine organisms or mud and sand, so it has certain requirements for flow speed near the intake. Therefore, the selection of the water intake location should take into account water depth, tidal current velocity, etc., as well as the influence of the salinity increase of seawater near the intake caused by brine discharge from the outlet into the sea. The depth of the water intake in the preliminary layout scheme is between 7.0 m and 7.8 m, which meets the water depth requirements of the seabed water intake method. As can be seen from Figure 9, the maximum current speed at the water intake at different locations with an offshore distance of 1.0~2.0 km is between 0.25 m/s and 0.43 m/s, and the average maximum current speed near the water intake in plan B at an offshore distance of about 1.9 km is about 0.41 m/s. For plans A and C, which have smaller offshore distances (the water intake offshore distances are 1.1 km and 1.6 km, respectively), the average maximum current speeds near the intakes are 0.25 m/s and 0.30 m/s, respectively. Generally, a smaller current speed (<0.30 m/s) can greatly reduce the concentration of marine organisms and mud and sand at the intake, thus avoiding blockage of the intake and effectively ensuring the safety of the intake and the quantity of water intake of the desalination plant [27,28]. Therefore, the layout of the intake in plans A and C is superior to that in plan B. As can be seen from Figure 8 and Table 2, after the discharge of brine, the diffusion distance of the 0.5 PSU salinity increment along the direction of water intake-outlet pipes is 421~522 m in the sea area. A water intake located 260 m away from the center of the outlet can effectively avoid the impact of brine discharge on the seawater quality near the water intake. At the same time, in combination with the distribution characteristics of the flow field in the sea area of Laoshan Bay, due to the difference in velocity between the two sides of the outlet, the seaward side of the outlet is more conducive to brine diffusion than the coastward side. The former has a smaller influence distance of salinity increase. Therefore, plans B and C, with the layout of “taking far and draining near”, are better than plan A with the layout of “taking near and draining far”. In summary, among the three preliminary schemes, the optimal scheme for intake layout is plan C.
On the basis of the strength of convection and diffusion, the location of the brine outlet should also be determined considering the distribution of development and utilization activities such as mariculture in the sea area, as well as economic efficiency [26]. The brine produced by the planned project is discharged into the sea via the diffusers at the drainage outlet. The offshore distance of the three optional plans is between 1.1 km and 1.6 km for plan C, B, and A, in order from near to far. The water depth at the drainage outlet is between 7.0 m and 7.8 m, and the average maximum velocity is between 0.24 m/s and 0.30 m/s. According to the simulation results of the salinity field in Laoshan Bay, the impact of the salinity increase caused by brine is mainly distributed in the discharge outlet and the surrounding sea area. The maximum salinity values at the discharge outlets of plans A to C are 33.6 PSU, 33.8 PSU and 34.1 PSU, respectively. The region with increasing salinity value reaches the maximum distance of diffusion transport in the direction of NNW~SSE. According to Table 2, the maximum diffusion distance of the 0.5 PSU salinity increment region caused by plan A is 1.2 km and the width of the affected region is 421 m. For plan B, with a 0.5 PSU salinity increment, the maximum diffusion distance is 1.5 km and the width of the affected region is 522 m. For plan C, the maximum diffusion distance is 12.1 km and the width of the affected region is 492 m. It can be concluded that the drainage outlet scheme with a larger distance from the shore has greater flow velocity near the outlet and a better convective mixing effect between brine and natural seawater, resulting in a smaller salinity increase area. From the perspective of the size of the salinity increase area, plan B is superior to plan C in the primary schemes in the form of “taking far and draining near.“ However, the greater distance from the shore means that the project is more expensive. In addition, the current distribution of development and utilization in the sea area also needs to be considered when evaluating the impact of brine on the marine environment. Therefore, we superimposed the region of the salinity increment in different schemes on the distribution of mariculture areas, coastal tourism areas and ports in the sea area (Figure 10). It can be seen that the impact ranges of 0.5 PSU salinity increase in all schemes and do not affect the environmentally sensitive areas in the bay. Compared with plan B, the outlet of plan C is closer to the shore, the project investment is less, and the impact range of salinity increase is closer to the shore and further away from the northeast aquaculture area. Therefore, the maximum impact ranges of 0.2 PSU salinity increase only in plan C and do not affect the aquaculture area. After a comprehensive analysis of the comparison results of water intake and outlet schemes, plan C is determined as the recommended scheme among the three primary schemes.
In the selection process of the primary scheme, it can be seen from Figure 8 and Table 2 that, although plan C is closer to the coast than plan B and its maximum salinity diffusion distance is slightly further along the flow direction than that of plan B, plan C’s 0.5 PSU salinity increment zone width is smaller than that of plan B. This is caused by the current-carrying action of the headland on the south side of the project. There is a high-value area about 200 m wide with higher flow speed relative to the sea areas on both sides in the 0.9 km offshore area near the engineered area, where the average maximum velocity can reach 0.3 m/s, which is close to the velocity near the drainage outlet of primary plan A and has a good diffusion effect, further optimizing the recommended scheme. On the basis of the “taking far and draining near” water intake-outlet layout form, the center location of the drainage outlet of plan C is arranged at an offshore location of 0.9 km. The width of the outlet diffuser is suggested to be kept within 200 m, that is, 0.8~1.0 km offshore. The multiple outlet form is used in the maximum average flow velocity to increase the diffusion efficiency, decrease the diffusion distance and the width of the salinity increment area, and further reduce the environmental impact of the brine discharge. According to the corresponding distribution characteristics of the flow field and width of the salinity increment zone, the intake is adjusted 200 m away from the diffuser of the outlet in Plan C, i.e., 1.2 km offshore. After adjustment, the average maximum flow velocity near the intake is 0.20 m/s. In this way, it can be ensured that the water quality of the intake is not affected by the salinity increment zone of the outlet. It can also ensure the suitability of the flow velocity near the water intake. To ensure the water intake efficiency and the diffusion efficiency of the brine, the optimized scheme further reduces the length of the water intake-outlet pipeline, thus further reducing the project investment. The water intake-outlet arrangement of the final scheme and the distribution of the influence of brine diffusion are shown in Figure 11. The optimal scheme adopts the water intake-outlet arrangement of “taking far and draining near”. The water intake and drainage pipes are arranged in parallel, with lengths of 1.2 km and 0.8 km, respectively. The outlet is arranged in the sea area at a water depth of 6.8 m, where the nearby average maximum flow velocity is 0.30 m/s. The diffuser is positioned 0.8 km to 1.0 km offshore. The water intake is located in the sea area, 1.2 km offshore, where the water depth is 7.3 m and the average maximum flow rate is 0.20 m/s.

5. Conclusions

In the present paper, by establishing the two-dimensional tidal current and convection diffusion mathematical models, the hydrodynamic conditions of the water intake-outlet project of desalination in Laoshan Bay and the influence of brine discharge were calculated and preliminary schemes were compared. In combination with the current development and utilization of the engineered area, the rationality of the water intake-outlet layout scheme was demonstrated and a scheme recommendation was presented and optimized. The main conclusions are as follows:
(1) The tidal currents in Laoshan Bay are mainly alternating, and change gradually into rotary currents outside the bay. The flow velocity of the rising tide is greater than that of the ebb tide. The velocity of the tidal current along the shore is generally less than 10 cm/s and increases gradually from the shore to the sea. The flow velocity in the bay is generally between 25 cm/s and 55 cm/s, and outside the bay is between 55 cm/s and 70 cm/s. The main trend of the tidal currents in the engineered area is in the NNW~SSE direction, with a flow velocity of 10~36 cm/s. As a result of the current-carrying effect of Aoshantou Headland on the south side of the seawater desalination plant, there is an area with higher flow velocity relative to the sea areas on both sides in the 0.9 km offshore direction, with a width of about 200 m and an average maximum flow velocity of 0.30 m/s.
(2) Due to the weak wave action and the cover of the headland, the diffusion process of brine in Laoshan Bay is mainly controlled by tidal currents, and the diffusion rules in different water intake-outlet schemes are similar. The brine diffuses along the main flow direction, with a longer diffusion distance from NNW to SSE along the main flow direction and a smaller diffusion distance from WSW to ENE that is perpendicular to the main flow direction. The salinity field in the northern portion of the discharge outlet is fan-shaped, and in the south bay, it is banded. The salinity peaks are all located at the center of the discharge outlet. In the small region near the outlets, the influence of increasing salinity can reach more than 2.3 PSU, while in other areas it is below 0.6 PSU. Salinity rapidly decreases from the discharge outlet to both sides of the shore and the sea until it reaches the marine background level. The salinity value decreases faster on the sea side than on the shore side. The maximum diffusion distance of the 0.5 PSU salinity increment zone caused by the discharge of brine is under 2.0 km, and the width is within 500 m.
(3) Based on the differences in hydrodynamic conditions in different water intake-outlet layout schemes and the influence of the sea salinity field after the discharge of brine, combined with the distribution of sea area development and utilization activities, plan C was selected as the recommended plan among the three primary schemes through a multi-factor comprehensive selection. The recommended plan was further optimized. The water intake-outlet engineering layout of the optimized scheme makes full use of the relatively high-value area of flow velocity caused by the headland current-carrying effect on the south side of the project. Its suitable offshore distance guarantees the efficient diffusion of brine and satisfies the flow velocity requirement near the water intake, which guarantees the safety of the water intake. At the same time, the water intake is on the shore side of the water outlet, which effectively avoids any negative influence of the brine discharge from the water outlet on the water quality. The layout of the final scheme of the water intake-outlet layout adopts the form of “taking far and draining near”, with the intake and discharge pipes arranged in parallel. The brine diffuser of the outlet is located 0.8 km to 1.0 km offshore, where the water depth is about 6.8 m and the flow rate is 0.30 m/s. The intake is positioned in the sea area 1.2 km offshore, where the water depth is 7.3 m and the flow velocity is 0.20 m/s.

Author Contributions

Conceptualization, Y.J. and Y.W.; methodology, Y.J.; software, Y.J.; validation, J.D., D.G. and Y.J.; formal analysis, Y.S.; investigation, W.Y.; resources, D.G.; data curation, J.D.; writing—original draft preparation, Y.J.; writing—review and editing, Y.J.; visualization, Y.W.; supervision, D.G. All authors have read and agreed to the published version of the manuscript.

Funding

This research received no external funding.

Data Availability Statement

Please contact the corresponding author for data.

Conflicts of Interest

The authors declare no conflict of interest.

References

  1. Zhang, F.K.; Zou, C.L.; Li, L.; Liu, S.J. Policies of seawater intaking in USA and their reference for seawater desalination in China. J. Econ. Water Resour. 2016, 34, 53–55. [Google Scholar]
  2. Zhang, D.M.; Shi, X.D.; Wang, D.; Kou, Y.D. Study of seawater intake and drainage methods selection and design features for seawater desalination plant. Mod. Ind. Econ. Inf. 2017, 24, 31–33. [Google Scholar]
  3. Zhu, Q.; Zuo, L.M.; Shan, K.; Ma, W. The suitability of desalinated water intake in coastal areas of Beijing, Tianjin & Hebei. Ocean Dev. Manag. 2017, 2, 80–84. [Google Scholar]
  4. Huang, Y.J.; Chen, Q.Z.; Zeng, J.N.; Jiang, Z.B. Influences of the high salinity wastewater from desalination plants on the marine ecological environment. J. Mar. Sci. 2009, 27, 103–110. [Google Scholar]
  5. Portillo, E.; De La Rosa, M.R.; Louzara, G.; Ruiz, J.M.; Marín-Guirao, L.; Quesada, J.; González, J.C.; Roque, F.; González, N.; Mendoza, H. Assessment of the abiotic and biotic effects of sodium metabisulphite pulses discharged from desalination plant chemical treatments on seagrass (Cymodocea nodosa) habitats in the Canary Islands. Mar. Pollut. Bull. 2014, 80, 222–233. [Google Scholar] [CrossRef]
  6. Panagopoulos, A.; Haralambous, K.-J. Environmental impacts of desalination and brine treatment-Challenges and mitigation measures. Mar. Pollut. Bull. 2020, 161, 111773. [Google Scholar] [CrossRef]
  7. Pérez Talavera, J.; Quesada Ruiz, J. Identification of the mixing processes in brine discharges carried out in Barranco del Toro Beach, south of Gran Canaria (Canary Islands). Desalination 2001, 139, 277–286. [Google Scholar] [CrossRef]
  8. Malfeito, J.J.; Díaz-Caneja, J.; Fariñas, M.; Fernández-Torrequemada, Y.; González-Correa, J.M.; Carratalá-Giménez, A.; Sánchez-Lizaso, J.L. Brine discharge from the Javea desalination plant. Desalination 2005, 185, 87–94. [Google Scholar] [CrossRef]
  9. McAllen, R.; Taylor, A. The effect of salinity change on the oxygen consumption and swimming activity of the high-shore rockpool copepod Tigriopus brevicornis. J. Exp. Mar. Biol. Ecol. 2001, 263, 227–240. [Google Scholar] [CrossRef]
  10. Belkin, N.; Rahav, E.; Elifantz, H.; Kress, N.; Berman-Frank, I. The effect of coagulants and antiscalants discharged with seawater desalination brines on coastal microbial communities: A laboratory and in situ study from the southeastern Mediterranean. Water Res. 2017, 110, 321–331. [Google Scholar] [CrossRef]
  11. Frank, H.; Fussmann, K.-E.; Rahav, E.; Bar-Zeev, E. Chronic effects of brine discharge form large-scale seawater reverse osmosis desalination facilities on benthic bacteria. Water Res. 2019, 151, 478–487. [Google Scholar] [CrossRef]
  12. Bianchelli, S.; Martire, M.L.; Pola, L.; Gambi, C.; Fanelli, E.; Danovaro, R.; Corinaldesi, C. Impact of hypersaline brines on benthic meio- and macrofaunal assemblages: A comparison from two desalination plants of the Mediterranean Sea. Desalination 2022, 532, 115756. [Google Scholar] [CrossRef]
  13. Malcangio, D.; Petrillo, A.F. Modeling of brine outfall at the planning stage of desalination plants. Desalination 2010, 254, 114–125. [Google Scholar] [CrossRef]
  14. Papakonstantis, I.G.; Christodoulou, G.C.; Papanicolaou, P.N. Inclined negatively buoyant jets 1: Geometrical characteristics. J. Hydraul. Res. 2011, 49, 3–12. [Google Scholar] [CrossRef]
  15. Papakonstantis, I.G.; Christodoulou, G.C.; Papanicolaou, P.N. Inclined negatively buoyant jets 2: Concentration measurements. J. Hydraul. Res. 2011, 49, 13–22. [Google Scholar] [CrossRef]
  16. Cui, Z.F.; Hu, D.C. Numerical simulation study of erosion-deposition laws of riverbed around submerged water intake. Yangtze River 2015, 46, 31–45. [Google Scholar]
  17. Abdullaev, K.M.; Agamaliev, M.M.; Akhmedova, D.A. Technology for combined desalination of seawater. J. Water Chem. Technol. 2019, 41, 119–124. [Google Scholar] [CrossRef]
  18. Zhu, C.J.; Liang, Z.Q.; Yan, F.; Hao, W.L. Reduction of waste water in Erhai Lake based on MIKE21 hydrodynamic and water quality model. Sci. World J. 2013, 2013, 958506. [Google Scholar] [CrossRef] [Green Version]
  19. Dubinina, E.O.; Miroshnikov, A.Y.; Kossova, S.A.; Flint, M.V. Numerical estimations of desalinated seawater modification using waters of the Laptev Sea shelf as an example. Dokl. Earth Sci. 2019, 484, 109–113. [Google Scholar] [CrossRef]
  20. Li, X.J.; Huang, M.T.; Wang, R.H. Study of Donghu Lake water eutrophication simulation based on MIKE. IOP Conf. Ser. Earth Environ. Sci. 2019, 435, 012013. [Google Scholar]
  21. Wang, K.; Du, J.; Liu, M.; Wu, J.H.; Jiang, H.Z.; Jin, S.; Song, L. Numerical simulation of Bohai oil Spill in the winter sea ice period. China Ocean Eng. 2019, 33, 185–197. [Google Scholar] [CrossRef]
  22. Li, W.D.; Li, M.G.; Pang, Q.X.; Wang, C.Y. Study on mathematical model for water intake and drainage project of Taishan Nuclear Power Station. J. Waterw. Harb. 2011, 32, 94–100. [Google Scholar]
  23. Zhao, J.; Chen, J.F. Research on hydro-environment of Aoshan Bay. Mar. Fish. Res. 2001, 22, 59–63. [Google Scholar]
  24. Sun, W.; Tang, X.C.; Xu, Y.D.; Liu, Y.J.; Ma, J.X.; Zhang, H.J. Characteristics of nutrients and eutrophication assessment of the Laoshan Bay, Qingdao. Trans. Oceanol. Limnol. 2016, 6, 45–52. [Google Scholar]
  25. Wu, Y.J.; Mei, N.; Liang, B.C. Study on transport and diffusion of concentrated and heated brine under the action of tide in Jiaozhou Bay. Period. Ocean Univ. China 2008, 38, 1029–1034. [Google Scholar]
  26. Wood, J.E.; Silverman, J.; Galanti, B.; Biton, E. Modelling the distributions of desalination brines from multiple sources along the Mediterranean coast of Israel. Water Res. 2020, 173, 115555. [Google Scholar] [CrossRef]
  27. Liu, W.X.; Luan, Z.K.; Tang, H.X. Environmental assessment on heavy metal pollution in the sediments of Le’an river with potential ecological risk index. Acta Ecol. Sin. 1999, 19, 206–211. [Google Scholar]
  28. Pistocchi, A.; Bleninger, T.; Dorati, C. Screening the hurdles to sea disposal of desalination brine around the Mediterranean. Desalination 2020, 491, 114570. [Google Scholar] [CrossRef]
Figure 1. The geographical location of the research area and the water intake-outlet arrangements for seawater desalination. (a) Layout schemes of Plan A. (b) Layout schemes of Plan B. (c) Layout schemes of Plan C.
Water 15 02402 g001
Figure 2. Grid distribution in the computational domain, and color-shaded bathymetry. A, B, C, and D are control points for open water boundaries. T1 is a tidal level monitoring point.
Water 15 02402 g002
Figure 3. Local grid refinement in the engineered area, and locations of verification points. C1 and C2 are current monitoring points.
Water 15 02402 g003
Figure 4. Comparison of the simulated and measured values of the tidal level at the Qingdao Port (a) and Station T1 (b).
Water 15 02402 g004
Figure 5. Comparison between the simulated and measured values of the flow velocity and direction at Station C1.
Water 15 02402 g005
Figure 6. Comparison between the simulated and measured values of the flow velocity and direction at Station C2.
Water 15 02402 g006
Figure 7. Hydrodynamic flow field simulation results.
Water 15 02402 g007
Figure 8. Salinity field simulation results.
Water 15 02402 g008
Figure 9. Maximum current speeds near the water intake and outlet during the spring tide period.
Water 15 02402 g009
Figure 10. Distribution of current development and utilization.
Water 15 02402 g010
Figure 11. Optimization layout plan of intake and drainage arrangements.
Water 15 02402 g011
Table 1. Values of parameters.
ParameterValue
Minimum time step interval0.4 s
CFL number0.8
Flooding depth0.15 m
Horizontal eddy viscosity coefficient0.2
Manning coefficient40~94 m1/3/s
Brine discharge8.7 m3/d
Initial salinity31.8 PSU
Source salinity53.5 PSU
Transverse diffusion coefficient0.1 m2/s
Table 2. Influence area and diffusion distance of the salinity increment.
LayoutsArea of the Salinity
Increment (km2)
Diffusion Distance of
0.5 PSU Salinity Increment (m)
The Maximum
Salinity (PSU)
0.5
PSU
1
PSU
1.5
PSU
Transverse to
Current Direction
Parallel to
Current Direction
IntakeOutlet
Plan A0.3320.0500.012421121232.133.6
Plan B0.5080.0520.016522147232.033.8
Plan C0.7980.0920.026492206631.934.1
Disclaimer/Publisher’s Note: The statements, opinions and data contained in all publications are solely those of the individual author(s) and contributor(s) and not of MDPI and/or the editor(s). MDPI and/or the editor(s) disclaim responsibility for any injury to people or property resulting from any ideas, methods, instructions or products referred to in the content.