Article

Research on the Application of MEMS Gyroscope in Inspecting the Breakage of Urban Sewerage Pipelines

College of Environmental Science and Engineering, Tongji University, Shanghai 200092, China
*
Author to whom correspondence should be addressed.
Water 2023, 15(13), 2426; https://doi.org/10.3390/w15132426
Submission received: 18 May 2023 / Revised: 24 June 2023 / Accepted: 27 June 2023 / Published: 30 June 2023

Abstract

:
Long-term corrosion, construction irregularities, road pressure and other reasons lead to various defects in urban sewer pipelines. Closed-circuit television (CCTV) and quick view (QV) are currently the most commonly used techniques to detect the internal state of the pipeline, but CCTV requires a large amount of capital investment and manpower costs, while QV is faced with the use of limitations and inaccurate positioning. The inspection of urban sewerage networks has long been a challenge for the relevant management authorities to overcome. To this end, in this study, an device was assembled using a six-axis MEMS gyroscope sensor as the core component to inspect and locate the breakage point of the pipe. Specifically, a six-axis MEMS gyroscope sensor is used as the core component along with a small lithium battery and a remote control switch assembled in a highly waterproof round box, and dropped into a laboratory to simulate a sewage pipe that has external water infiltration. Then the device is recovered and the SD card on which the data is stored is removed, the data is loaded to perform the coordinate conversion process and restore the trajectory and attitude of the device along its travel. The three axis axial acceleration of the device before and after passing through the infiltration point is analyzed for anomalies, as well as changes in the roll and pitch angle fluctuations of the device. Multiple experiments demonstrated that the six-axis MEMS gyro sensor response is very sensitive, generating data and storing it through the DATALOG module. With the reading and analysis of the data, when the pipeline is broken by external water intrusion, the axial acceleration value, pitch angle and roll angle of the device will change abruptly after flowing through the infiltration point, based on the analysis of these indicators the preliminary judgment of the extent of external water infiltration and locate the location of the infiltration point, potential applications of MEMS gyroscopic sensors in the field of sewerage are believed to be vast.

1. Introduction

The breakage of sewage pipes and the infiltration of groundwater into sewage pipes will adversely affect sewage treatment plants [1], the infiltration of sewage in sewerage pipes into groundwater causes problems such as soil pollution and black smelly water bodies, which seriously affects the safety of the urban water environment and reduces the quality of life of urban residents [2,3]. Therefore, mapping the current situation of the sewerage network, mastering and assessing the operational status of the sewerage network are the difficulties that need to be overcome by the academic and engineering communities at present.
With the development of technological progress, more and more equipment and technologies are being used in the operation and maintenance of sewerage networks. Commonly used equipment includes Closed-circuit television (CCTV), quick-view (QV), sonar, infrared and ground-penetrating radar [4]. The CCTV method and QV are widely used in Sewerage network inspection [5]. CCTV inspection of pipelines is costly, labor-intensive, time-consuming, and error-prone, e.g., CCTV inspection requires labor-intensive and costly pre-inspection pilot draining and blocking of the inspected pipe section, and the inspected sewer mileage generates hours of video, which needs to be handled by trained and certified inspectors, a great demand for automatic identification technology [6,7]. Furthermore, the range of pipelines that can be inspected at any one time is quite narrow, for a large city, only about ten percent of them can be inspected each year [8,9]. Quick-view (QV) is a technique that uses a periscope to inspect Sewerage pipes inside an inspection shaft [10]. This approach is relatively simple but is not applicable when the pipe is full of water and is only suitable for monitoring the condition of the pipe in the inspection wells and adjacent areas [11]. In general, instrumental inspection techniques have the advantages of clear images, high safety and repeatability of images, but they also suffer from inaccurate positioning, difficulty in adapting to the pipeline anomalies, harsh usage conditions, as well as high costs and low efficiency [3,12]. Urban drainage pipes also have some pressurized flow pipes, and there are many related techniques for detecting leakage in pressurized flow pipes, which identify the location of leakage by transient data such as pressure wave and flow rate, and detect the location of leakage by injecting pressure wave analysis through sensors and constructing system structures [13,14].
Micro Electro Mechanical System (MEMS) is an advanced technology that combines microfabrication techniques used in the semiconductor industry with micromachining techniques used in the machinery industry [15]. MEMS gyroscopes are among the most widely developed and utilized products in this technology, these sensors can accurately and rapidly measure various parameters related to object motion, such as acceleration, velocity, angular velocity, position, mechanics, torque, etc. [16,17], and applying these parameters, the motion state of the target object in space can be measured, such as vibration, inertial navigation, slide detection, motion trajectory, etc. [18,19]. For instance, MEMS gyroscopic sensors have been utilized in a variety of applications such as attitude monitoring, balance control and navigation in the navigation of UAVs, unmanned vehicles and ships [20,21,22]. In contrast to conventional techniques, which measure acceleration, velocity, angular velocity and other parameters that are greatly influenced by the rotation of the object, acceleration and temperature variations, MEMS gyroscopic sensors are a significant improvement in measurement accuracy [23,24,25,26]. Meanwhile, with the advantages of small size, light weight, low power consumption, low cost, high reliability, excellent performance and powerful functions, MEMS gyroscope sensors are widely used in aviation, aerospace, automotive, biomedical, environmental monitoring, military and other fields, and have become a top scientific research hotspot with very promising application prospects [27,28,29,30,31].
In most cases, the urban sewage network has non-pipe flow, open channel and other non-all-pipe flow. Under the influence of external flow confluence, the flow pattern near the confluence point will change, and the flow velocity field and water surface fluctuation will also change [32,33]. In coastal and riverside urban areas, the groundwater levels will rise during rainy seasons or due to high water tables [34]. When groundwater infiltrates from any part of a pipe into a sewage pipeline, there is a sudden change in the water surface or flow pattern in the pipe, and the effect of the pipe water level height increases rapidly with increasing infiltration rates [35]. When floating objects on the water surface, such as ships, are subjected to water surface waves or changes in the velocity field, their motion state also changes accordingly, in particular, the pitch and roll angles of the object’s motion are most sensitive to changes in the flow state [36,37].
In this paper, a new device based on a MEMS gyroscope sensor as the core component is designed, which also includes small lithium batteries, and remote control switches. These components are assembled in a round box of resin material with good water resistance, and the size and mass of the box are controlled so that it can float on the water surface. Then, in the laboratory, a simulated section of sewer pipe is built to simulate the infiltration of external water in the event of non-full pipe flow. Next, the device is then placed in a non-full flow pipe where external water infiltration occurred, and after several experiments the device is recycled and the data collected by the MEMS gyroscope sensor in the device are read out. These data collected by the equipment based on the carrier coordinate system are transformed into the geographic navigation coordinate system by processing this data using the quadratic Eulerian angle-quadratic method. The roll and pitch angles of the device are calculated, and the drift trajectory of the device is calculated by integrating the triaxial axial acceleration. Finally, the axial acceleration values of the device flowing through the external water infiltration point are analyzed by the Z-score method for anomalies, and the roll angle and pitch angle fluctuations before and after the device flowing through the external water infiltration point are compared. These anomalies and change patterns are summarized to investigate the sensitivity of MEMS gyroscopic sensors to changes in equipment motion near penetration points, and to analyze potential applications of the equipment in sewage pipelines.
Related work such as the devices and the laboratory simulation of the sewage pipeline installation is presented in the next section. Section 3 introduces the theory and methodology of MEMS gyroscope attitude restoration calculations. Section 4 provides a detailed analysis and discussion of the changes in device attitude before and after the point of infiltration. The last section includes the conclusions of the paper and plans for future work.

2. Related Works

Figure 1 shows the internal diagram of the device and its components, the device is based on a six-axis MEMS gyroscope sensor, which can monitor the three-dimensional axial acceleration and axial angular velocity of the device during its movement at a set frequency (10~200 Hz). In this paper the frequency is set at 10 Hz, and each set of data is stored in the SD card through the DATALOG module [38]. The six-axis MEMS gyroscope sensor is powered by a 450 mAh lithium-ion battery capable of providing power for more than three hours, and using a remote control switch with a range of 20 m. These three components are then packaged to form a small-cassette testing device (SCTD) with a diameter of 8 cm and a height of 3 cm, with an overall density of 0.5 g/cm3. SCTD is submerged in water with a draft set at half the height of the equipment, allowing it to respond to changes in flow patterns within the pipe and ensuring its stability during movement.
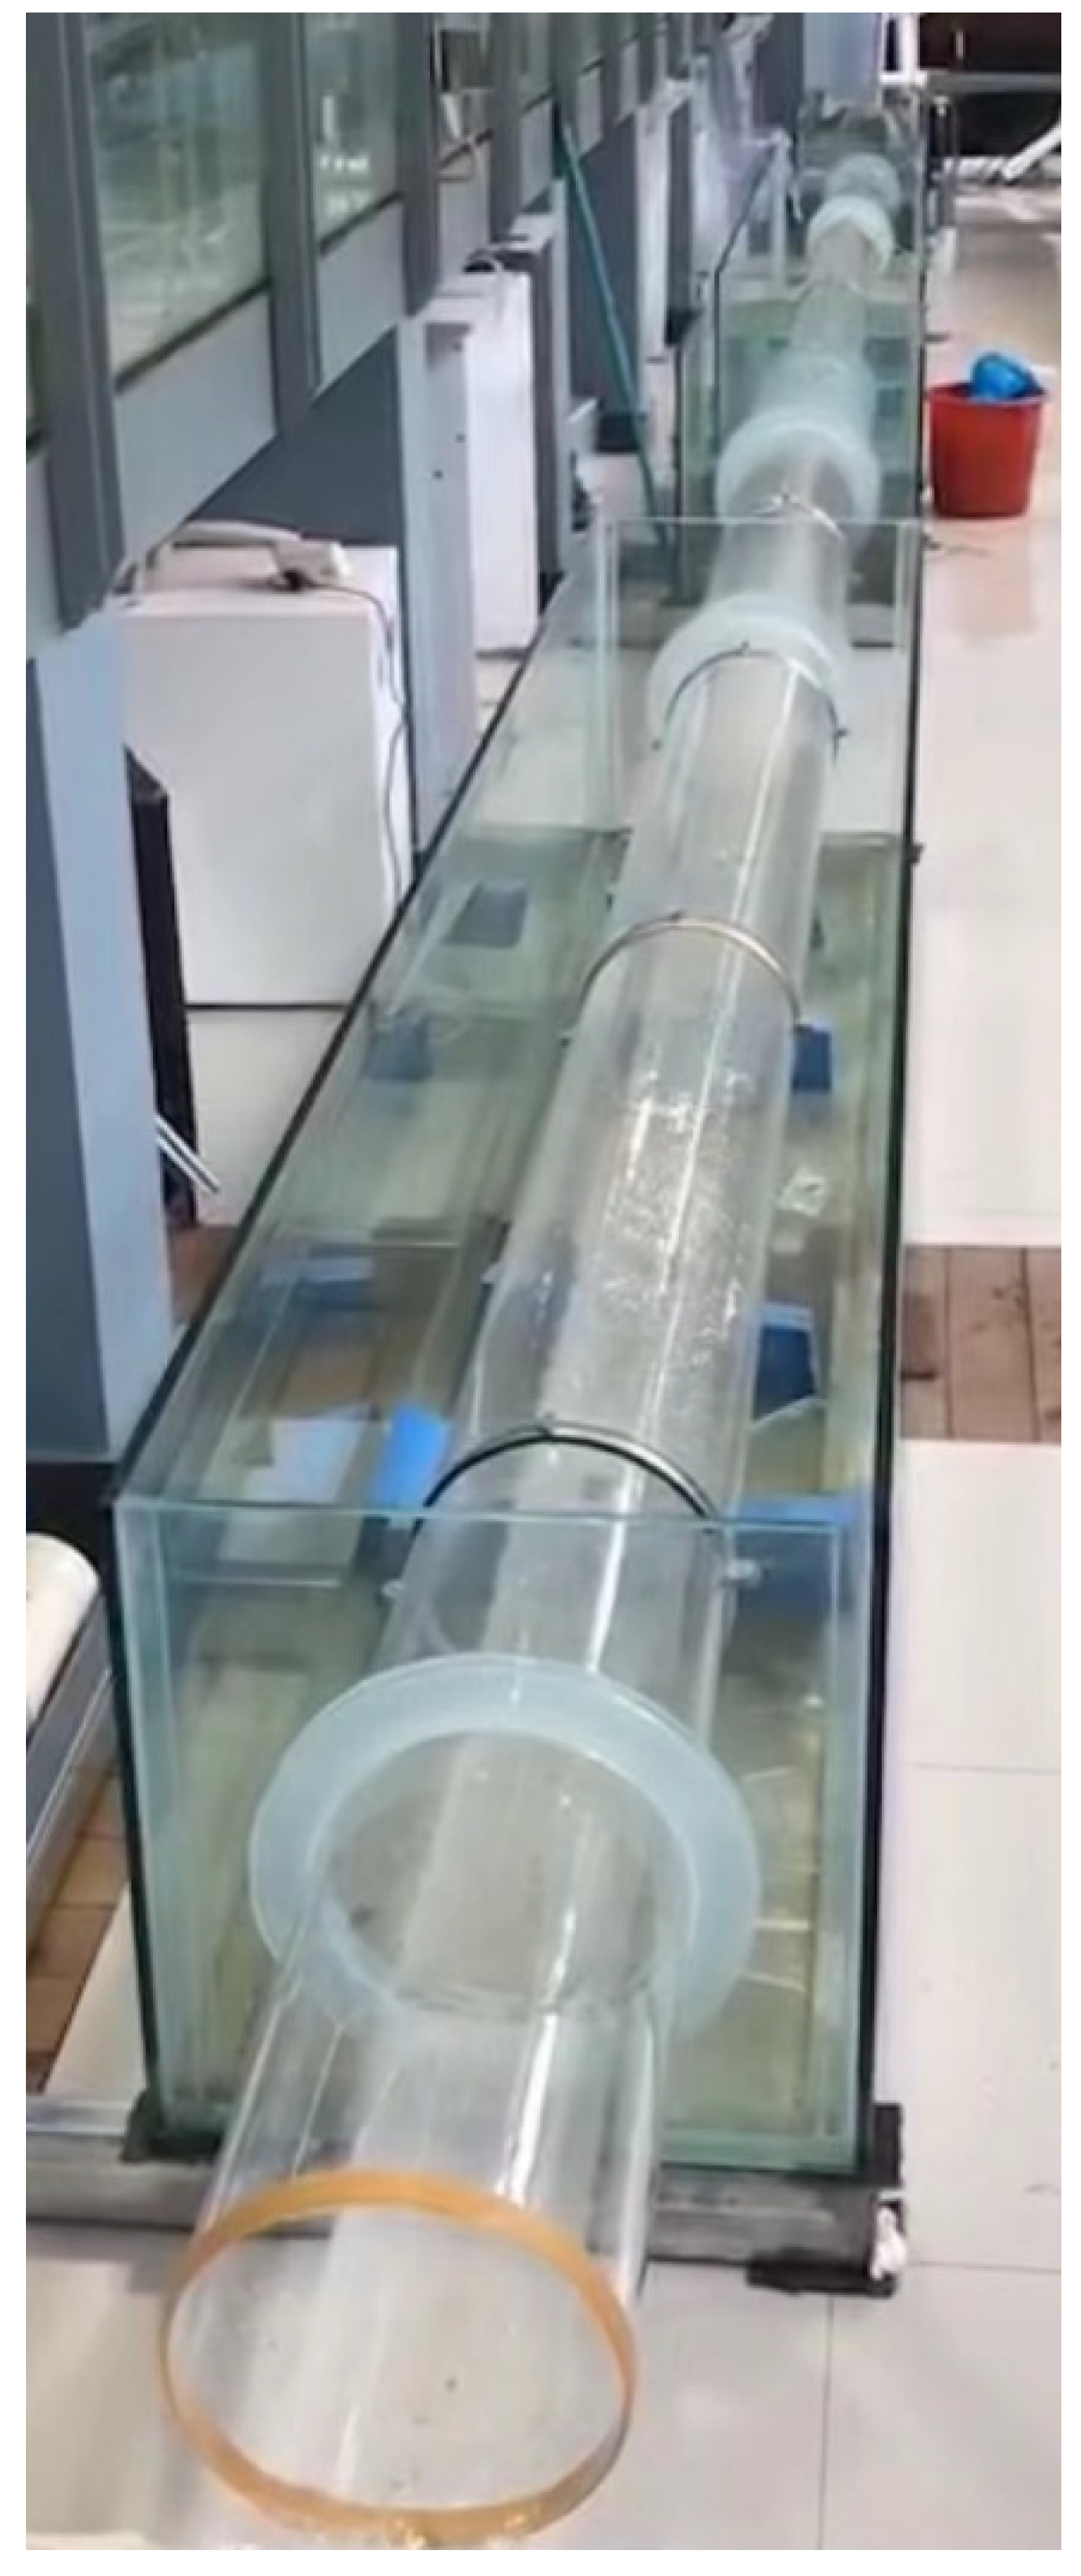
As Figure 2, the laboratory-designed schematic diagram simulates the municipal Sewerage pipelines. The entire device consists of an inlet pipe, an inlet tank, an upstream pipeline, a simulated inspection well, a storage tank, and a downstream pipeline. The slope of the pipeline is set at 3‰. The inflow rate Qw of the inlet pipe can be controlled through a valve (The valves are part of the equipment already in the laboratory and not shown in the design drawings). The inlet tank simulates the starting inspection well, while the upstream pipeline is 6 m in length with a diameter of D1 = 0.2 m, the downstream pipeline is 6.5 m in length with a diameter of D2 = 0.25 m, an inspection well is installed between the upstream with downstream pipelines. A broken hole is sliced at the bottom of the downstream pipe in order to allow water from the storage tank to infiltrate into the pipeline as infiltration point, approximately 11.5 m from the water inlet of the upstream pipeline, the size of the infiltration point is 50 × 15 mm. Figure 3 shows the sewage pipe in the laboratory, the sewage pipeline is made of transparent acrylic tubing to facilitate the observation of the water flow in the pipe and the tank is made of glass reinforced plastic (GRP) to facilitate the control of the water level in the tank.

3. Methodology and Case Design

3.1. Experimentation

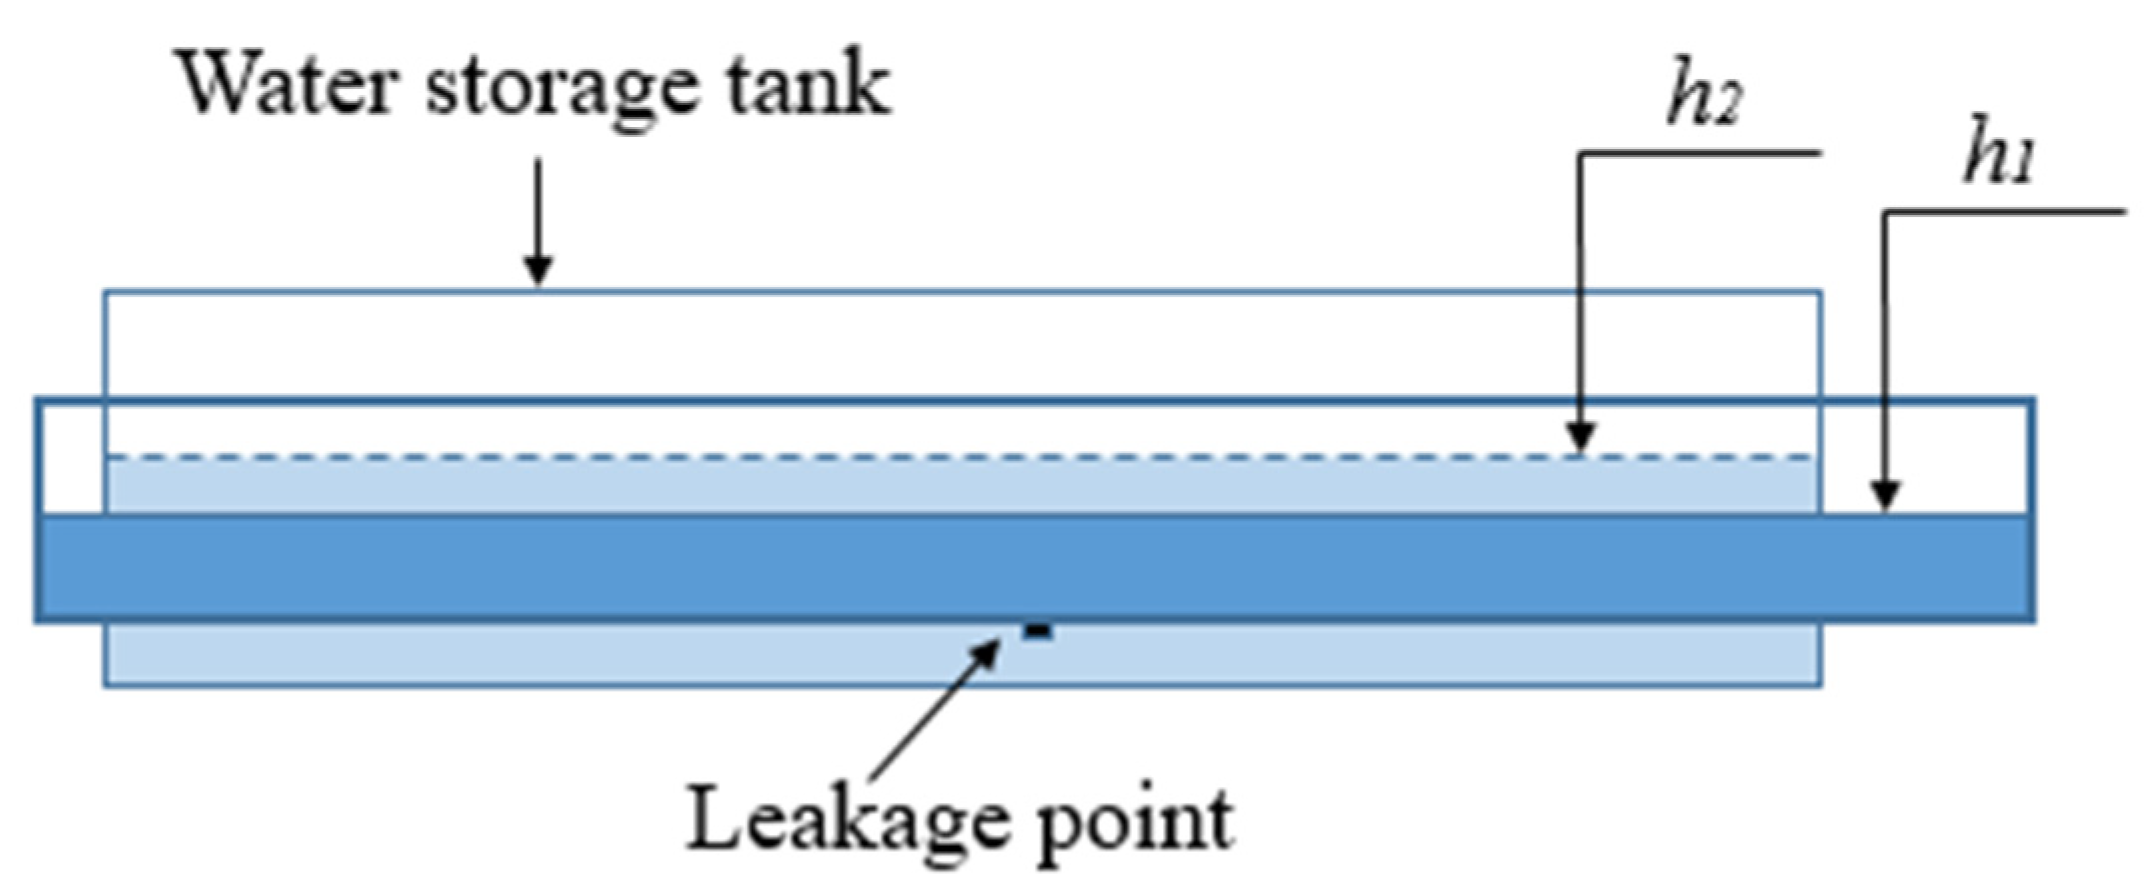
As shown in Figure 4, water is injected into the water storage tank and the liquid level was maintained higher than that of the pipeline to simulate the condition where underground water infiltrates the pipeline due to sewage pipe damage. The external water infiltration rate q 0 through the holes into the pipeline can be calculated using Equation (1):
q 0 = μ A 2 g h 2 h 1
where: μ : orifice submergence discharge coefficient, with a value of 0.62, q 0 : inflow rate through the holes, A : area of the damaged opening, h 1 : liquid level height in the pipeline, h 2 : liquid level height inside the storage tank.

3.2. Data Collection

3.2.1. MEMS Gyroscope Precision

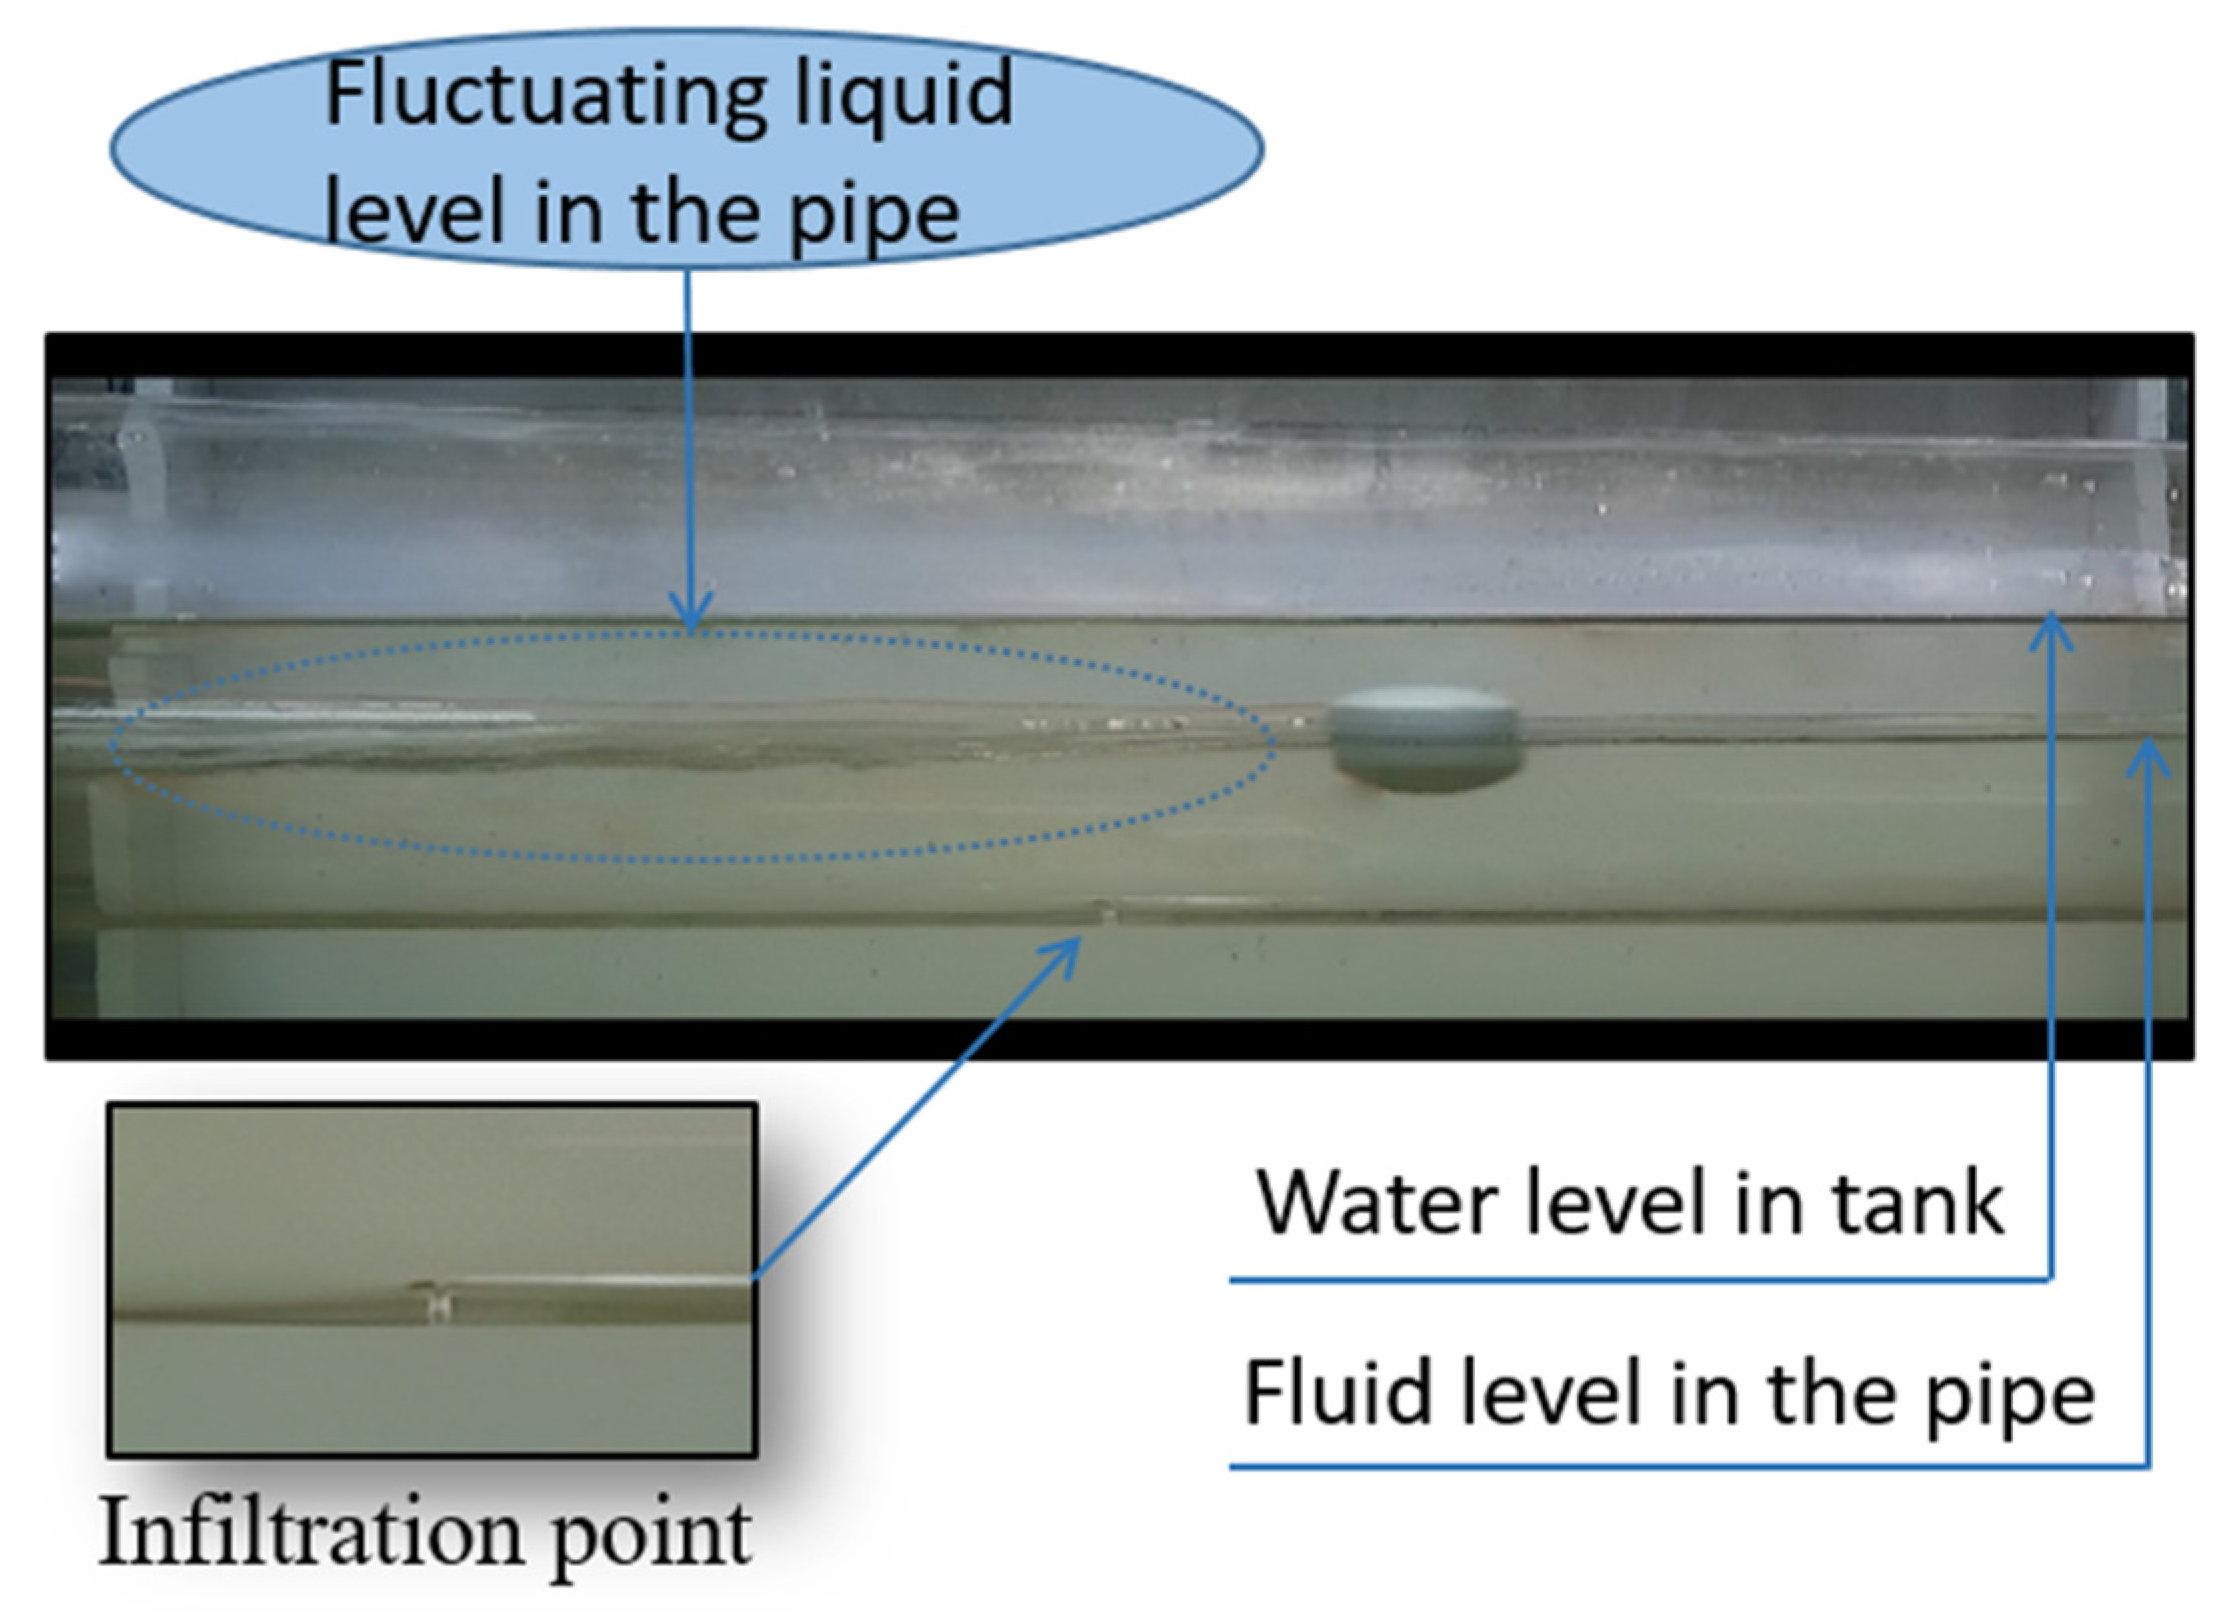
The six-axis MEMS gyroscope sensor utilized in this study demonstrates precise monitoring capabilities for capturing the three-dimensional linear velocity ( a x , a y , a z ) and angular acceleration ( w x , w y , w z ) of an object in motion. During the experimental process, after the water flow in the pipeline reaches a stable state, the SCTD is released into the upstream inlet of the pipeline to move with the flow. Figure 5 shows a photograph taken in the pre-experiment of SCTD flowing through the downstream pipe near the breakage point. It is evident from the pictures that when the tank level is higher than the fluid level in the pipe, the tank water flows into the pipe through the point of infiltration, the flow pattern in the pipe changes significantly, the motion attitude of the SCTD flowing through this section of the pipe changes as well.

3.2.2. Experimental Cases

In Table 1, the parameter settings for the experimental cases involve controlling the flow rate Q inside the pipeline to be 10 L/s by adjusting the inlet flow rate, the infiltration flow rate q 0 at the damaged section of the pipeline is controlled by adjusting the height difference ( h ) between the liquid levels of the pipeline and the water tank, which can be calculated using Equation (1). It was observed during the experiment that reducing h to below 3 cm resulted in difficulties in maintaining measurement accuracy, so the minimum value for ∆h was set at 3 cm. On the other hand, when h was set to 5 cm, visible water surface fluctuations were observed, and the SCTD exhibited oscillations near the damaged section, further increasing h caused deformation at the joint of the pipeline due to buoyancy forces acting on the water, which was a limitation of the experimental setup.

3.3. Data Processing

3.3.1. Euler Transformations and the Quaternion Method

Currently, the six-axis gyroscope sensor can primarily monitor the three-dimensional acceleration ( a x , a y , a z ) and angular velocity ( w x , w y , w z ) along the X, Y, and Z axes of an object in motion. As illustrated in Figure 6, the motion characteristics of an object, including pitch, roll, and yaw angles, are analyzed based on data collected from a MEMS gyroscope sensor. The data set is processed using Euler transformation and quaternion methods to effectively mitigate acceleration errors and calculate the pitch, roll, and yaw angles. By integrating the acceleration data, the trajectory of the object at each time point can be reconstructed, enabling the determination of the corresponding changes in acceleration and attitude angles for each trajectory point. Subsequently, the motion states of the object before and after the SCTD passes through the damaged point in the pipeline are carefully analyzed, yielding valuable insights into its behavior.
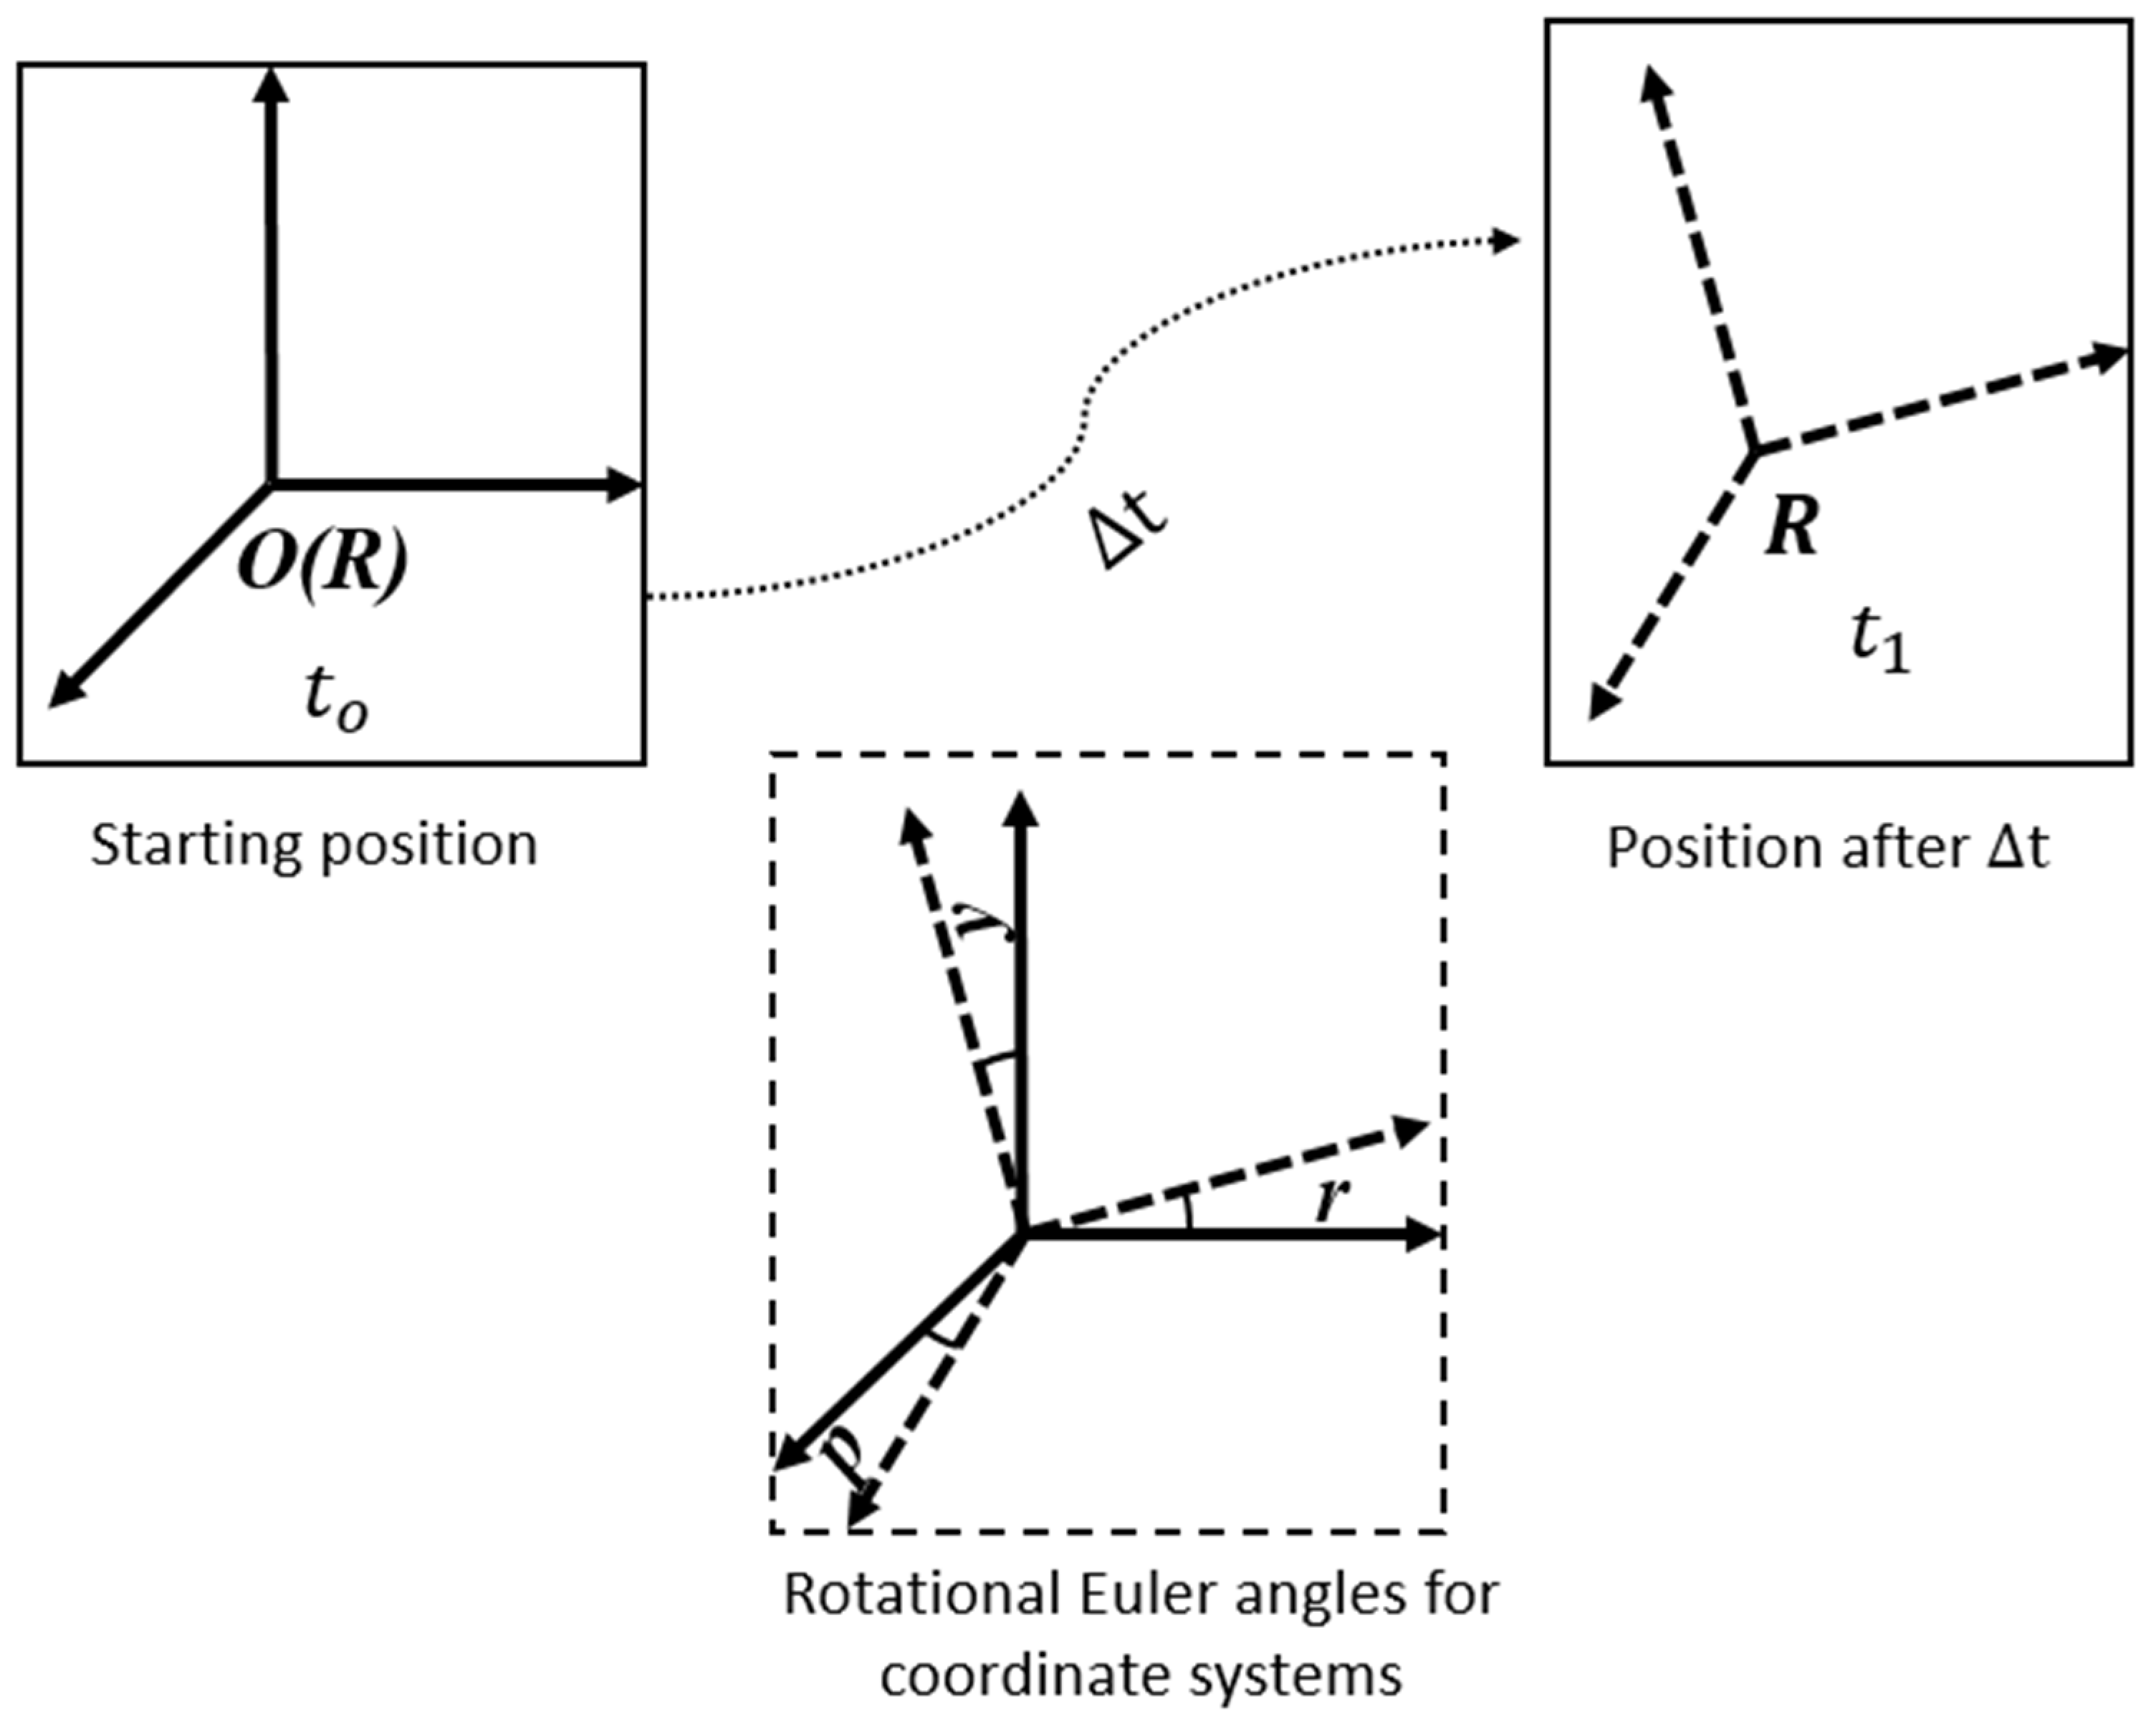
As illustrated in Figure 7, the MEMS gyroscope sensor is initially stationary at time t o , and a zero-point calibration is performed to align the initial carrier coordinates R with the geographic navigation coordinates O. After the carrier moves for a period of time t , the carrier coordinate system R is rotated with the movement of the carrier, resulting in a deflection of the rotated carrier coordinate system R relative to the geographic navigation coordinates O. The three-dimensional axial acceleration and angular acceleration in the raw data are generated and collected based on the carrier coordinates R. In order to realistically and accurately reproduce the motion attitude of the carrier in the geographic coordinate system, it is necessary to convert the 3D axial and angular accelerations from the raw data into a data set relative to the geographic navigation coordinate system O.
Setting the following parameters in order to illustrate the derivation of the Euler-quaternion conversion straightforwardly:
θ represents the rotation angle of the motion;
y denotes the yaw angle, which is the rotation around the y-axis;
p represents the pitch angle, which is the rotation around the x-axis;
r represents the roll angle, which is the rotation around the z-axis;
M x represents the rotation matrix for the carrier around the x-axis;
M y represents the rotation matrix for the carrier around the y-axis;
M y represents the rotation matrix for the carrier around the z-axis;
C θ represents the rotation matrix for the carrier’s overall rotation.
Based on these parameter definitions, the following are available:
M x = 1 0 0 0 cos r sin r 0 sin r cos r ;   M y = cos p 0 sin p 0 1 0 sin p 0 cos p ;   M z = cos y sin y 0 sin y cos y 0 0 0 1
C θ = M x M y M z = cos r cos y + sin r sin y sin p cos r sin y + sin r cos y sin p sin r cos p sin y cos p cos y cos p sin p sin r cos y cos r sin y sin p sin r sin y cos r cos y sin p cos r cos p
Expression: C θ is defined the rotation matrix as Equation (4),
C θ = T 11 T 12 T 13 T 21 T 22 T 23 T 31 T 32 T 33
The calculation of Equations (3) and (4) leads to the derivation of Equation (5).
p = a r c sin T 32         r = a r c t a n T 31 T 33   y = a r c t a n T 12 T 22
Then, according to the quaternion method, the rotation matrix C θ of the carrier can also be expressed as shown in Equation (6), the iterative calculation of quaternions can be accomplished by Equation (7).
C θ = 1 2 q 2 2 + q 3 2 2 q 1 q 2 q 0 q 3 2 q 1 q 3 + q 0 q 2 2 q 1 q 2 + q 0 q 3 1 2 q 1 2 + q 3 2 2 q 2 q 3 q 0 q 1 2 q 1 q 3 1 q 0 q 2 2 q 2 q 3 + q 0 q 1 1 2 q 1 2 + q 2 2
q 0 q 1 q 2 q 3 t + t   = q 0 q 1 q 2 q 3 t + t 2 w x · q 1 w y · q 2 w z · q 3 w x · q 0 w y · q 3 + w z · q 2 w x · q 3 + w y · q 0 w z · q 1 w x · q 2 + w y · q 1 + w z · q 0
According to Equation (7), quaternion update can be achieved by integrating angular acceleration with the initial value at the starting time, then, using Equations (4), (5) and (7), the values of pitch, roll, and yaw angles can be calculated.
However, the components of gravity acceleration in the three directions in the navigation coordinate system can be obtained using the rotation matrix, as given in Equation (8), this is necessary to remove the impact of gravity acceleration when directly integrating acceleration for the motion of the carrier, as it can result in significant errors.
a x g a y g a z g   = C θ 0 0 g
Note: a x g , a y g and a z g are the gravitational acceleration components on the X, Y and Z axe respectively.
The calculation of Equations (3) and (8) leads to the derivation of Equation (9).
a x g = sin p · g a y g = cos p · sin r · g a z g = cos p · cos r · g
The angular velocity values obtained from the inertial measurement unit (IMU) are subject to error compensation, which is mainly determined by comparing the actual values of the three-axis acceleration with the components of gravity acceleration in the three directions, denoted as a x g , a y g and a z g . As Equation (9) shows, there is no direct relationship between a x g   a y g   a z g and the yaw angle, making it impossible to apply this method for compensating yaw angle with error correction. To effectively compensate for the errors in yaw angle, magnetic data needs to be incorporated, as six-axis gyros lack magnetic information, and the compensation of yaw angle cannot be achieved, these factors result in errors accumulating with the recorded data. Therefore, in the subsequent discussion of attitude angles in this article, the focus will mainly be on roll angle and pitch angle.

3.3.2. Trajectory Point Calculation

According to Newton’s second law and for the purpose of detecting the motion trajectory of an object, the acceleration produced by the object is integrated once to obtain the velocity and then integrated twice to obtain the displacement. The motion displacement along the x, y and z axes of the accelerometer after n steps of ∆t can be calculated using Equation (11). Connecting the spatial coordinate points at different time intervals yields the spatial motion trajectory. In this study, due to the experiment being conducted in a single-directional pipeline, the motion trajectory is considered as a one-dimensional trajectory. The three-dimensional axial acceleration, pitch angle, and attitude angle of SCTD during its motion along the pipeline are analyzed.
S x n = S x n 1 + v x n 1 · t + 1 4 a x n 1 + a x n · t 2 S y n = S y n 1 + v y n 1 · t + 1 4 a y n 1 + a y n · t 2 S x n = S z n 1 + v z n 1 · t + 1 4 a z n 1 + a z n · t 2
Note: a n is the instantaneous acceleration at time tn, S n is the displacement from t0 to tn, v n     is the instantaneous velocity at time tn.

3.3.3. Z-Score Method

Z-Score is a parameter-based anomaly detection method used to assess the distance between sample points and the population mean, it is primarily applied to measure how many standard deviations the raw data deviates from the population mean in one-dimensional or low-dimensional feature spaces [39]. In this study, Z-Score was also employed to process and identify when acceleration values underwent abrupt changes in the three-dimensional axial acceleration data collected from MEMS gyroscopes. The data were normalized using Equation (12),
Z i = x i μ σ
where μ and σ are the average and standard deviation of the dataset, respectively.
Then a threshold (Zthr) is set. If |Zi| > Zthr, the data point is considered an abnormal value. Zthr is generally set to 2.5, 3.0, 3.5. Specifically, Zthr = 2.5 was used in this research.

4. Results and Discussion

The changes in the three-dimensional axial acceleration, roll angle, and pitch angle of SCTD are analyzed and discussed within the segment of the pipeline ranging from 10 to 14 m downstream of the water inlet of the upstream pipeline, to simplify and facilitate the analysis and discussion, the position X meters away from the upstream inlet of the pipeline is defined as LX, the segment between L10 and L14 is defined as Pobs.

4.1. Analysis of Acceleration Anomalies

In Figure 8, the data presented pertains to Case 1, showcasing the three-dimensional axial acceleration values ( a x , a y , a z ) of SCTD flow through Pobs. Outliers are denoted as values that deviate significantly under the condition of Zthr set at 2.5, prior to reaching the damage point at L11.5,   a x , a y , a z exhibit minimal fluctuations and no outliers are observed. However, beyond L11.5, a sudden divergence in the values occurs, accompanied by the appearance of outliers. The maximum divergence is observed around the vicinity of L12, followed by a convergence after L13, and a return to stability after L13.5. In Figure 9, the data presented corresponds to Case 2, with Zthr set at 2.5. Similar to Case 1, prior to reaching the damage point at L11.5, no outliers are observed in the acceleration values of a x , a y , a z . However, beyond L11.5, a sudden divergence in the values occurs, accompanied by the appearance of outliers. Notably, the maximum divergence occurs before L11.8, and the values return to stability after L12.5.
In Figure 8 and Figure 9, it is evident that the three-dimensional axial acceleration values of SCTD begin to exhibit divergence in response to the intrusion of external water after passing the damage point at L11.5. This observation substantiates that external water infiltration has a substantial influence on the drift motion and attitude of SCTD within the pipeline, underscoring SCTD’s sensitivity to abnormal operating conditions. In both Case 1 and Case 2, the flow rate inside the pipeline was maintained at 10 L/s, while the infiltration flow rates were 0.46 L/s and 0.29 L/s, respectively. Comparing Figure 6 and Figure 7, it is evident that in Case 1, the three-dimensional axial acceleration values of SCTD exhibit larger magnitude of positive and negative extremes for the outliers. For instance, the extreme positive and negative values for a x outliers in Case 1 are 0.092 g and −0.081 g, respectively, whereas in Case 2, they are 0.021 g and −0.042 g, respectively. Furthermore, in Case 1, the three-dimensional axial acceleration values of SCTD exhibit a sustained divergence after passing the damage point at L11.5 over a range of approximately 2 m, whereas in Case 2, the divergence range is approximately 1 m. These findings demonstrate that SCTD is also sensitive to variations in the magnitude of infiltration flow rates, as reflected by the range of divergence in the three-dimensional axial acceleration values. Therefore, the infiltration velocity in the pipeline damage process can be estimated preliminarily according to the divergence range and extreme value of the three-dimensional axial acceleration value.

4.2. Pitch and Roll Fluctuation Analysis

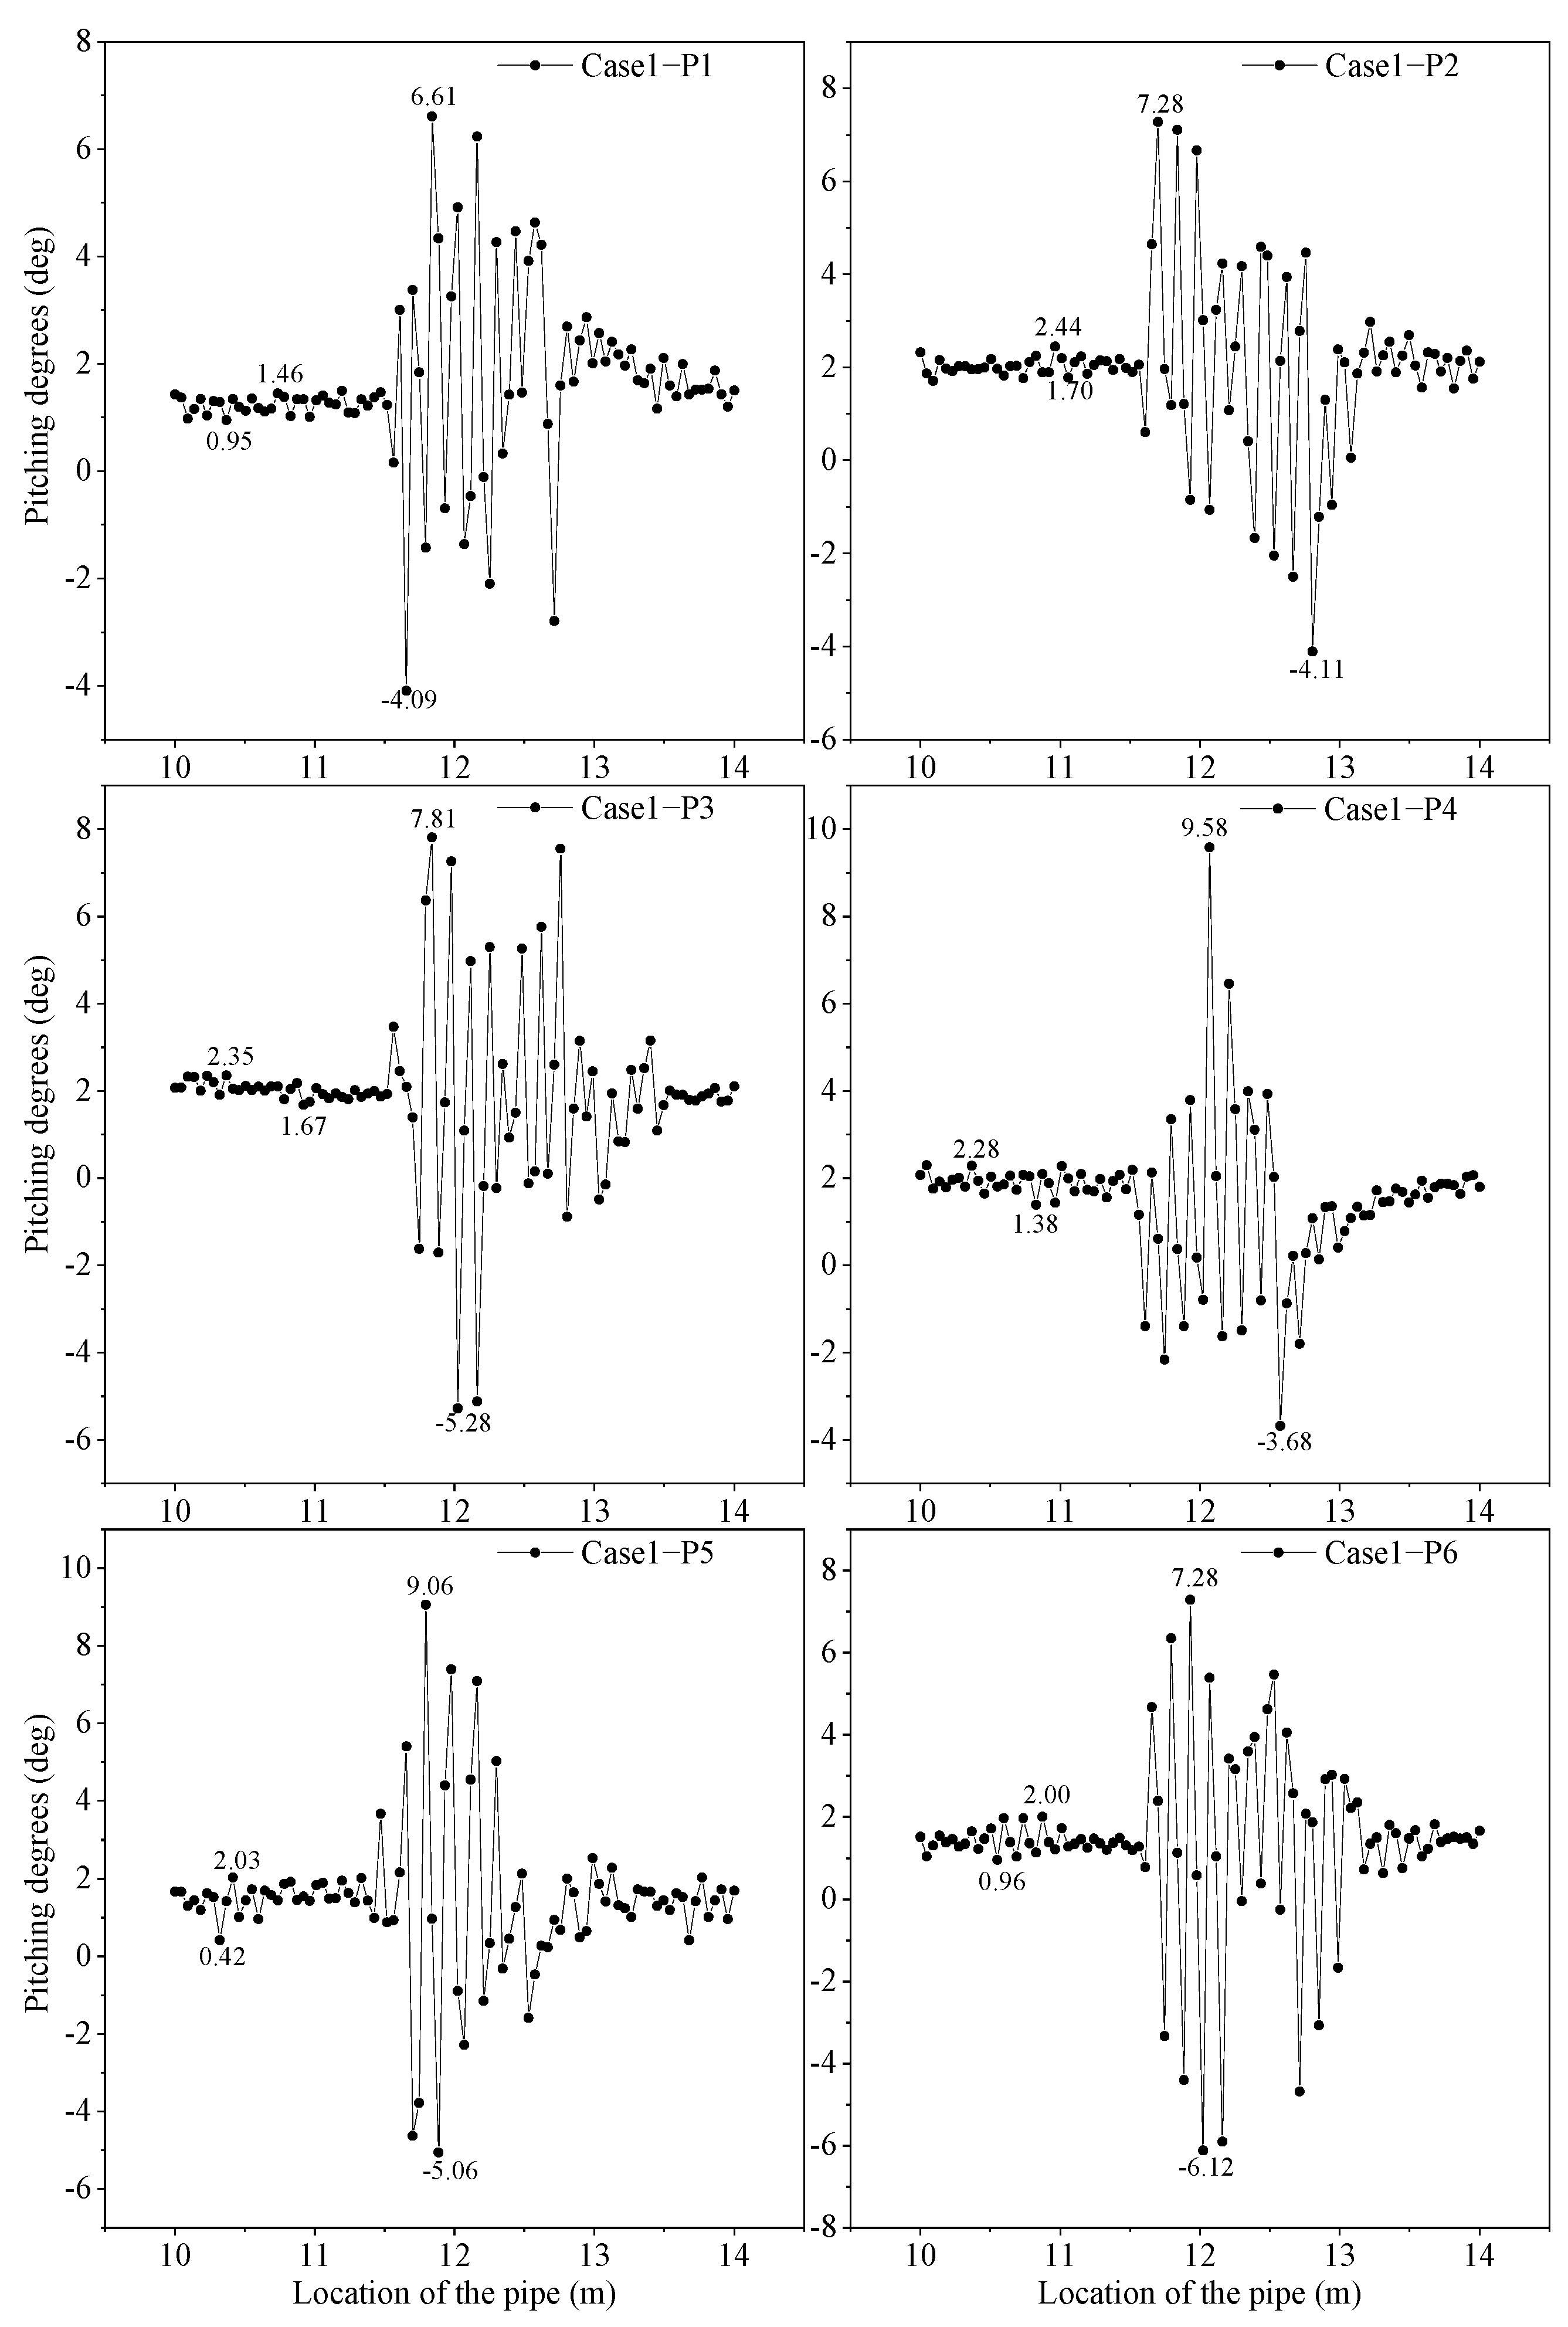
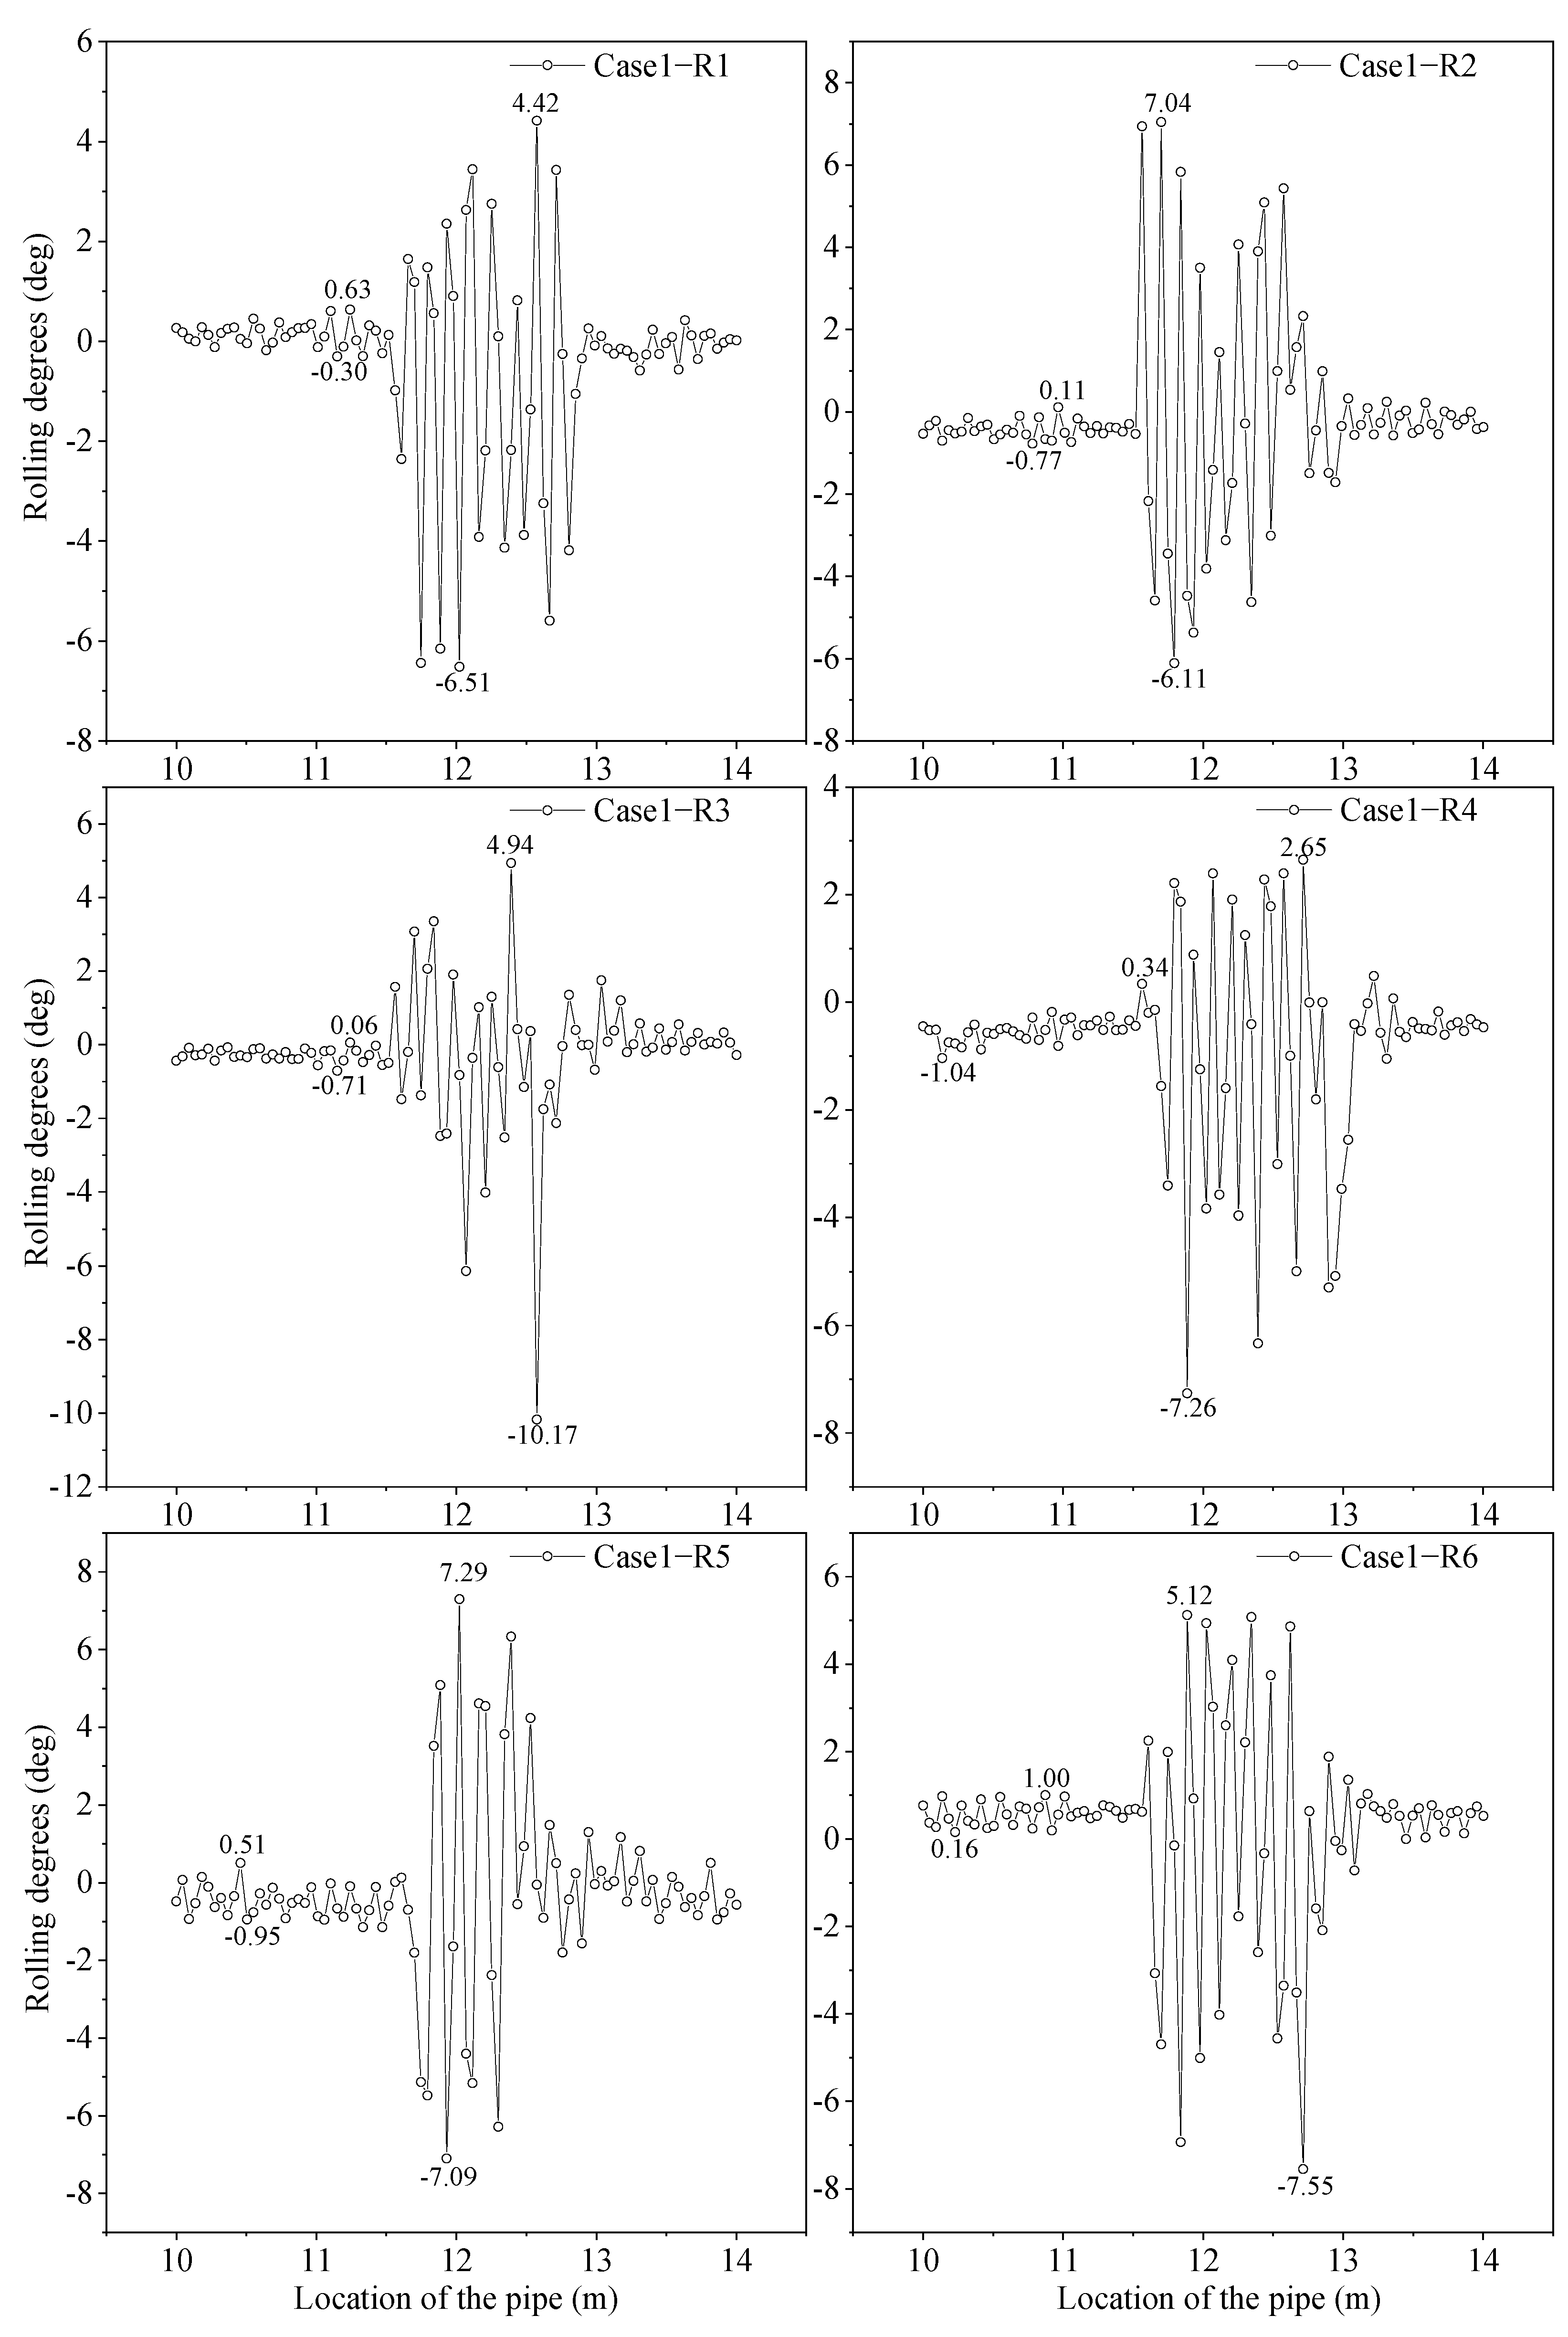
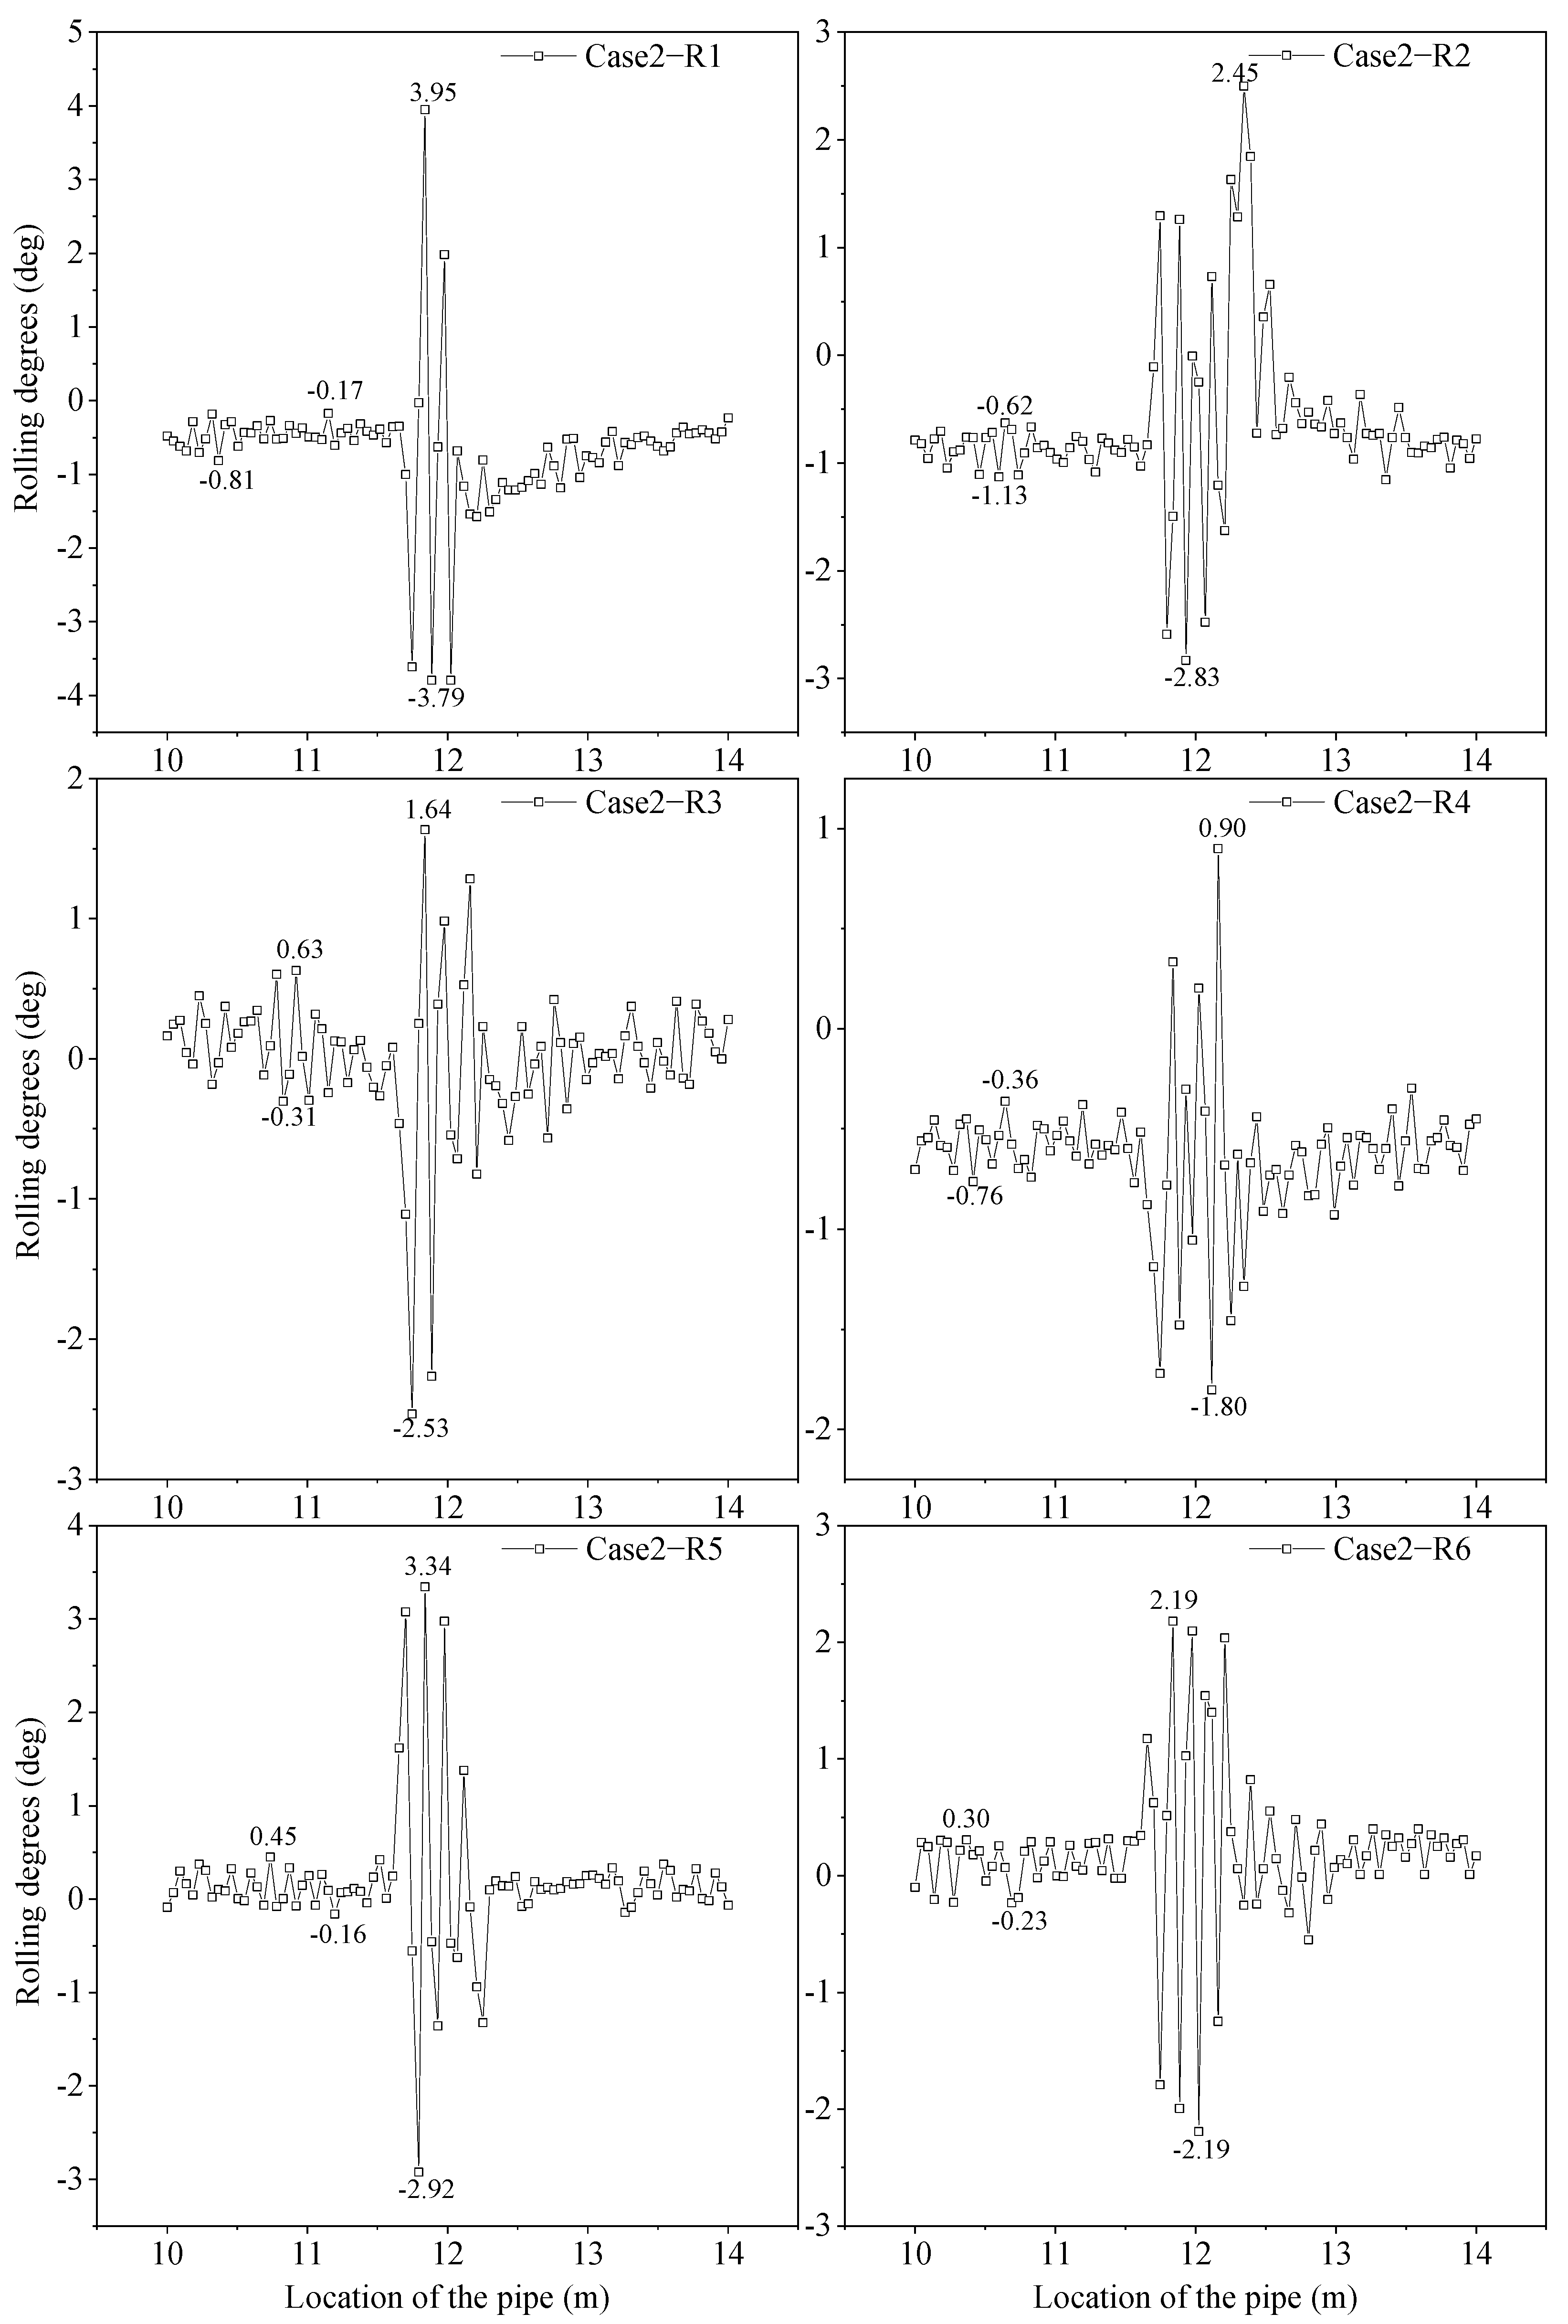
The analysis of SCTD’s pitch and roll angles in Pobs was carried out following the description and analysis of its three-dimensional axial acceleration in Section 4.1, which provided initial evidence for detecting external water infiltration. To enhance the robustness of the experiments, six parallel experiments were conducted for both Case 1 and Case 2, and the data collected from SCTD were used to reconstruct the attitude. Plotting the data separately for the six parallel experiments allowed for a clearer visualization of the results. The pitch and roll angles of SCTD were analyzed by identifying the maximum values (Max1) and minimum values (Min1) before L11.5 in the pipeline, as well as the maximum values (Max2) and minimum values (Min2) after L11.5. The magnitude of the differences between the maximum and minimum values for the two intervals was calculated as the ratio R, using Equation (12). This approach provides a preliminary basis for comparing the magnitude of changes in the pitch and roll angles between the two intervals.
R = M a x 2 M i n 2 M a x 1 M i n 1
Figure 10 illustrates the variation of pitch angle of SCTD in Case 1, across all six experiments, the pitch angle showed relatively smooth variations before reaching L11.5, with the highest vibration amplitude observed in Case 1-P5, reaching a value of 1.61°, however, after passing L11.5, the vibration amplitude of SCTD suddenly increased, with the minimum R value observed in Case 1-P1 reaching 10.7°. Table 2 summarizes the amplitude ratio R of pitch angle variations of SCTD before and after L11.5 in the six parallel experiments. The maximum R value was 20.99, the minimum value was 12.88, and the average value was 17.73. Figure 11 and Table 3 depict the variation of roll angle and amplitude ratio of SCTD in Case 1, the location and trend of vibration were similar to that of pitch angle variations, the maximum R value observed was 19.62, while the minimum value was 9.85, with an average value of 13.41. Figure 12 and Figure 13 illustrate the changes in pitch angle and roll angle of SCTD in Case 2, the pitch angle and roll angle both exhibit abrupt changes after the L11.5, with rapid vibration response. Table 4 presents the R values corresponding to the pitch angle, with a maximum value of 9.67, a minimum value of 6.60, and an average value of 8.51. Table 5 shows the R values corresponding to the roll angle, with a maximum value of 12.09, a minimum value of 4.44, and an average value of 8.69.
The magnitude and duration of pitch angle vibration were greater in Case 1, as evidenced by the data from Figure 10 and Figure 12. A similar trend was observed in the roll angle, as shown in Figure 11 and Figure 13. These findings are consistent with the changes in three-dimensional axial acceleration, indicating that the response of SCTD to external water infiltration is synchronous across multiple indicators. These results are mutually supportive, providing corroborative evidence for each other. The boxplots in Figure 14 shows box plots of the four sets of R values, Case 1 and Case 2 were both subjected to six experiments, Case 1 had a large infiltration volume and the median value of R was greater than 13, which also proves that the greater the infiltration flow, the easier it is for the device to detect and locate the breakage point, but the R value error range is relatively large, which may be related to the shape design of the SCTE as a cylindrical box shape, as the box shape is prone to rotation when drifting in water and the error accumulation is relatively large, indicating that the shape design of the SCTE needs further improvement to enhance the SCTE heading stability. In Case 2, the infiltration flow rate is minor, but the median R values are also all greater than 8 and the error range is relatively narrow. These indicate that the device is also capable of capturing signals at low infiltration flows and is stable, and also indicate that the device can detect and locate breakage points at infiltration flows of no less than 2.9%.
As mentioned above, SCTD demonstrates a timely response to external water infiltration through its three-dimensional axial acceleration, pitch angle, and roll angle measurements by compensating for detected acceleration errors. SCTD’s motion trajectory can be accurately reconstructed, this allows for precise localization of infiltration points, which provides an advantage over CCTV and QV techniques. In the entire experimental process, water flow was continuously present inside the pipeline, in contrast to CCTV, SCTD eliminates the need for inlet and outlet blocking, resulting in substantial cost and labor savings. Moreover, SCTD exhibits a longer endurance time, allowing for monitoring of a larger length of pipeline compared to the limited range of QV. The high sensitivity of MEMS gyroscope sensors employed in SCTD results in precise monitoring data, leading to significantly improved accuracy in detecting abnormalities caused by external water infiltration, and the distinctive signal characteristics provided by SCTD facilitate effective identification and recognition of such abnormalities. Nevertheless, further refinement in the design of SCTD’s physical shape is warranted to mitigate data errors arising from inherent device defects during navigation, additionally, the incorporation of magnetometers has the potential to enable the reconstruction of SCTD’s heading angle, thus enhancing its capabilities.

5. Conclusions

In this paper, the authors have assembled a floating detection device based on a six-axis MEMS gyroscope sensor as the core component, combined with a small lithium battery and a remotely controllable switch. The size of the device is a cylindrical cassette of 8 cm in diameter and 3 cm in height with an overall density of 0.5 g/cm3 and a submersion height of 1.5 cm in water. The data recorded by a six-axis MEMS gyroscope sensor can be reconstructed into the device’s motion trajectory and motion states along the way through Euler-quaternion conversion and acceleration integration calculations. The authors constructed a simulated sewage pipeline in the laboratory, and they created varying infiltration flow rates. The device was deployed in multiple experimental setups, and its motion trajectory was reconstructed, the authors also analyzed the changes in acceleration, pitch, and roll angles before and after the infiltration point. Analysis of the data suggests that the device flows through the infiltration point with a significant pattern of dispersion in its tri-axial acceleration and anomalous values of acceleration, as well as significant fluctuations in roll and pitch angles, and that the magnitude of the infiltration flow rate can be initially determined based on the interval and magnitude of the fluctuations. The results demonstrate that the device can be highly sensitive to changes in flow patterns caused by the abnormal flow pattern of external water infiltration into the sewage pipelines, and can determine the approximate severity of external water infiltration and can be accurately located. It is worth mentioning that the design of the device in this paper is only a preliminary exploration, the shape of the device, the introduction of the magnetometer, the error elimination of the heading angle, etc. are worth further research to form a series of devices that can be put into the monitoring of abnormal working conditions of the sewage network.

Author Contributions

Conceptualization, Y.X.; methodology, Y.X.; software, Y.X.; validation, J.M. and J.W.; formal analysis, Y.X.; investigation, H.Y. and J.M.; resources, T.T. and K.X.; data curation, Y.X. and J.W.; writing-original draft preparation, Y.X.; writing-review and editing, T.T.; visualization, T.T.; supervision, T.T.; project administration, K.X.; funding acquisition, T.T. All authors have read and agreed to the published version of the manuscript.

Funding

This work was financially supported by the National Natural Science Foundation of China under Grant numbers 51978493.

Conflicts of Interest

The authors declare no conflict of interest.

References

  1. Weiß, G.; Brombach, H.; Haller, B. Infiltration and inflow in combined sewer systems: Long-term analysis. Water Sci. Technol. 2002, 45, 11–19. [Google Scholar] [CrossRef] [PubMed]
  2. Grengg, C.; Mittermayr, F.; Ukrainczyk, N.; Koraimann, G.; Kienesberger, S.; Dietzel, M. Advances in concrete materials for sewer systems affected by microbial induced concrete corrosion: A review. Water Res. 2018, 134, 341–352. [Google Scholar] [CrossRef] [PubMed]
  3. Wang, J.; Liu, G.-H.; Wang, J.; Xu, X.; Shao, Y.; Zhang, Q.; Liu, Y.; Qi, L. Current status, existent problems, and coping strategy of urban drainage pipeline network in China. Environ. Sci. Pollut. Res. 2021, 28, 43035–43049. [Google Scholar] [CrossRef] [PubMed]
  4. Fenner, R.A. Approaches to sewer maintenance: A review. Urban Water 2000, 2, 343–356. [Google Scholar] [CrossRef]
  5. Xie, Q.; Li, D.; Xu, J.; Yu, Z.; Wang, J. Automatic Detection and Classification of Sewer Defects via Hierarchical Deep Learning. IEEE Trans. Autom. Sci. Eng. 2019, 16, 1836–1847. [Google Scholar] [CrossRef]
  6. Ji, H.W.; Yoo, S.S.; Koo, D.D.; Kang, J.-H. Determination of Internal Elevation Fluctuation from CCTV Footage of Sanitary Sewers Using Deep Learning. Water 2021, 13, 503. [Google Scholar] [CrossRef]
  7. Laakso, T.; Kokkonen, T.; Mellin, I.; Vahala, R. Sewer Condition Prediction and Analysis of Explanatory Factors. Water 2018, 10, 1239. [Google Scholar] [CrossRef] [Green Version]
  8. Ghavami, S.M.; Borzooei, Z.; Maleki, J. An effective approach for assessing risk of failure in urban sewer pipelines using a combination of GIS and AHP-DEA. Process Saf. Environ. Prot. 2019, 133, 275–285. [Google Scholar] [CrossRef]
  9. Guo, W.; Soibelman, L.; Garrett, J. Automated defect detection for sewer pipeline inspection and condition assessment. Autom. Constr. 2009, 18, 587–596. [Google Scholar] [CrossRef]
  10. Li, D.; Xie, Q.; Yu, Z.; Wu, Q.; Zhou, J.; Wang, J. Sewer pipe defect detection via deep learning with local and global feature fusion. Autom. Constr. 2021, 129, 103823. [Google Scholar] [CrossRef]
  11. Thathagar, M.B.; Beckers, J.; Rothenberg, G. Copper-catalyzed suzuki cross-coupling using mixed nanocluster catalysts. J. Am. Chem. Soc. 2002, 124, 11858–11859. [Google Scholar] [CrossRef]
  12. Chen, W.; Zhou, C.; Tang, Y. Quantitative detection analysis to guide the drainage network maintenance. Water Wastewater Eng. 2014, 40, 101–104. [Google Scholar]
  13. Brunone, B.; Maietta, F.; Capponi, C.; Keramat, A.; Meniconi, S. A review of physical experiments for leak detection in water pipes through transient tests for addressing future research. J. Hydraul. Res. 2022, 60, 894–906. [Google Scholar] [CrossRef]
  14. Meniconi, S.; Brunone, B.; Frisinghelli, M. On the Role of Minor Branches, Energy Dissipation, and Small Defects in the Transient Response of Transmission Mains. Water 2018, 10, 187. [Google Scholar] [CrossRef] [Green Version]
  15. Kazusuke, M. MEMS inertial sensors and their applications. In Proceedings of the 2008 5th International Conference on Networked Sensing Systems, Kanazawa, Japan, 17–19 June 2008. [Google Scholar]
  16. Chen, K.; Fang, L.Q.; Wang, H.K. The Primary Processing of MEMS Devices and Applications Analysis. Adv. Mater. Res. 2012, 418–420, 2134–2138. [Google Scholar] [CrossRef]
  17. Chin-Woo, T.; Sungsu, P. Design of accelerometer-based inertial navigation systems. IEEE Trans. Instrum. Meas. 2005, 54, 2520–2530. [Google Scholar]
  18. Vágner, M.; Beneš, P.; Havránek, Z. Experience with Allan variance method for MEMS gyroscope performance characterization. In Proceedings of the 2012 IEEE International Instrumentation and Measurement Technology Conference Proceedings, Graz, Austria, 13–16 May 2012. [Google Scholar]
  19. Valenti, R.G.; Dryanovski, I.; Xiao, J. Keeping a Good Attitude: A Quaternion-Based Orientation Filter for IMUs and MARGs. Sensors 2015, 15, 19302–19330. [Google Scholar] [CrossRef] [Green Version]
  20. Ko, N.Y.; Lee, S.J.; Jeong, S.; Moon, Y.S. Attitude Estimation of an Unmanned Surface Vehicle Using MEMS-AHRS and GNSS. In Proceedings of the 2017 17th International Conference on Control, Automation and Systems (ICCAS), Jeju, Republic of Korea, 18–21 October 2017. [Google Scholar]
  21. Li, Y.; Yu, Y.; Zhang, C.; Du, Z.; Kang, W.; Tian, Y. Design and Preliminary Test Verification of Heave Motion Monitoring System for Ships. Instrum. Tech. Sens. 2014, 46–48, 59. [Google Scholar]
  22. Shi, X.; Lu, L.; Jin, G.; Tan, L. Research on the attitude of small UAV based on MEMS devices. AIP Conf. Proc. 2017, 1839, 020094. [Google Scholar] [CrossRef] [Green Version]
  23. Lee, H.-J.; Park, D.-J. Analysis of Thermal Characteristics of MEMS Sensors for Measuring the Rolling Period of Maritime Autonomous Surface Ships. J. Mar. Sci. Eng. 2022, 10, 859. [Google Scholar] [CrossRef]
  24. Wang, X.; Zhang, W.; Gao, Q.; Wu, X.; Meng, Z. Attitude Estimation of Multi-axis Steering UGV using MEMS IMU. In Proceedings of the 2019 3rd International Conference on Electronic Information Technology and Computer Engineering (EITCE), Xiamen, China, 18–20 October 2019. [Google Scholar]
  25. Liu, X.; Liu, X.; Zhang, W.; Yang, Y. UAV attitude calculation algorithm based on acceleration correction model. Xibei Gongye Daxue Xuebao/J. Northwestern Polytech. Univ. 2021, 39, 175–181. [Google Scholar] [CrossRef]
  26. Zai, D.; Zhou, G.; Chen, Y.; Li, W. Application of Kalman filtering in MEMS gyroscope measuring turning rate of ship. Transducer Microsyst. Technol. 2021, 40, 157–160. [Google Scholar]
  27. Ko, Y.; Geng, X.; Lai, Y.; Ma, X.; Cui, X.; Shi, G. Moving Vehicle Attitude Tracking Algorithm Based on MEMS Inertial Navigation System. In Proceedings of the 2018 IEEE 1st International Conference on Micro/Nano Sensors for AI, Healthcare, and Robotics (NSENS), Shenzhen, China, 5–7 December 2018. [Google Scholar]
  28. Wang, X.; Xiao, L. Gyroscope-reduced inertial navigation system for flight vehicle motion estimation. Adv. Space Res. 2017, 59, 413–424. [Google Scholar] [CrossRef]
  29. El-Sheimy, N.; Nassar, S.; Noureldin, A. Wavelet de-noising for IMU alignment. IEEE Aerosp. Electron. Syst. Mag. 2004, 19, 32–39. [Google Scholar] [CrossRef]
  30. Fitzgerald, A.M. MEMS Inertial Sensors. In Position, Navigation, and Timing Technologies in the 21st Century; Wiley-IEEE Press: Hoboken, NJ, USA, 2020; pp. 1435–1446. [Google Scholar]
  31. Li, W.; Cai, H.; Zhao, S.; Liu, C. Six-axis IMU Compensated Magnetometer Dynamic Stable Calibration. Intstrum. Tech. Sens. 2021, 14–19. Available online: https://kns.cnki.net/kcms2/article/abstract?v=TC3HGDY_hVau3LqftqfTcaXkXhtXR8MkLseSqYqE1O-R2-BqVap_9_NtLkhObmRQF70QgHEqy1-ux1kX05fC3kcorikrkScb4MRdHmYUJiD54rdVcijeBbJJUo8dLuKaPWdqO0Qqo_w=&uniplatform=NZKPT&language=CHS (accessed on 17 May 2023).
  32. Abu-Zaid, T.S. Three-dimensional numerical study for determining the optimum diversion angle of bifurcating channels. Ain Shams Eng. J. 2023, 14, 101940. [Google Scholar] [CrossRef]
  33. Wu, S.; Cheng, Y.; Hou, B.; Li, H.; Li, J. Influence of Model Parameter Uncertainty on the Evaluation of Function State of Drainage Network. J. Beijing Univ. Technol. 2021, 47, 280–292. [Google Scholar]
  34. Jia, H.; Yao, H.; Yu, S.L. Advances in LID BMPs research and practice for urban runoff control in China. Front. Environ. Sci. Eng. 2013, 7, 709–720. [Google Scholar] [CrossRef]
  35. Karpf, C.; Hoeft, S.; Scheffer, C.; Fuchs, L.; Krebs, P. Groundwater infiltration, surface water inflow and sewerage exfiltration considering hydrodynamic conditions in sewer systems. Water Sci. Technol. 2011, 63, 1841–1848. [Google Scholar] [CrossRef]
  36. Nossen, J.; Grue, J.; Palm, E. Wave forces on three-dimensional floating bodies with small forward speed. J. Fluid Mech. 1991, 227, 135–160. [Google Scholar] [CrossRef] [Green Version]
  37. Rodrigues, J.; Soares, C.G. Froude-Krylov forces from exact pressure integrations on adaptive panel meshes in a time domain partially nonlinear model for ship motions. Ocean Eng. 2017, 139, 169–183. [Google Scholar] [CrossRef]
  38. Yuan, J.; Tao, S. Some Semantic Equivalent Transform Rules from DOOL Program into Datalog. Comput. Eng. Appl. 2005, 41, 176–179. [Google Scholar]
  39. Chen, L.; Yan, H.; Yan, J.; Wang, J.; Tao, T.; Xin, K.; Li, S.; Pu, Z.; Qiu, J. Short-term water demand forecast based on automatic feature extraction by one-dimensional convolution. J. Hydrol. 2022, 606, 127440. [Google Scholar] [CrossRef]
Figure 1. Assembly of the equipment.
Water 15 02426 g001
Figure 2. The design of the experimental installation for sewerage pipes.
Water 15 02426 g002
Figure 3. Laboratory simulation of sewage piping installations.
Water 15 02426 g003
Figure 4. Schematic diagram of the groundwater infiltration into the Sewerage pipe.
Water 15 02426 g004
Figure 5. Physical view of the device flowing.
Water 15 02426 g005
Figure 6. Yaw, Pitch and Roll of an object.
Water 15 02426 g006
Figure 7. Eulerian angle of the pose of the carrier with relation to the geographical coordinate system.
Water 15 02426 g007
Figure 8. Anomalous values for 3D axial acceleration of the equipment in Case 1.
Water 15 02426 g008
Figure 9. Anomalous values for 3D axial acceleration of the equipment in Case 2.
Water 15 02426 g009
Figure 10. Equipment pitching angle change of the Case 1.
Water 15 02426 g010
Figure 11. Equipment rolling angle change of the Case 1.
Water 15 02426 g011
Figure 12. Equipment pitching angle change of the Case 2.
Water 15 02426 g012
Figure 13. Equipment rolling angle change of the Case 2.
Water 15 02426 g013
Figure 14. R-value box diagram.
Water 15 02426 g014
Table 1. Cases parameters setting table.
Q (L/s)h (cm) q 0 (L/s) K (%)
Case 11050.464.6
Case 21030.292.9
Note: Q represents the flow rate of water inside the pipeline, K represents the percentage of infiltration flow rate to the pipeline flow rate ( q 0 / Q ), ∆h represents the difference in liquid levels between the water tank and the pipeline ( h 2 h 1 ).
Table 2. Amplitude ratio of the pitching angle of the equipment of the Case 1.
C1-P1C1-P2C1-P3C1-P4C1-P5C1-P6Average
RC1-P20.9915.4019.2514.7323.1512.8817.73
Table 3. Amplitude ratio of the rolling angle of the equipment of the Case 1.
C1-R1C1-R2C1-R3C1-R4C1-R5C1-R6Average
RC1-R11.7614.9419.627.189.8517.1213.41
Table 4. Amplitude ratio of the pitching angle of the equipment of the Case 2.
C2-P1C2-P2C2-P3C2-P4C2-P5C2-P6Average
RC2-P9.418.198.916.608.279.678.51
Table 5. Amplitude ratio of the rolling angle of the equipment of the Case 2.
C2-R1C2-R2C2-R3C2-R4C2-R5C2-R6Average
RC2-R12.0910.354.446.7510.268.268.69
Disclaimer/Publisher’s Note: The statements, opinions and data contained in all publications are solely those of the individual author(s) and contributor(s) and not of MDPI and/or the editor(s). MDPI and/or the editor(s) disclaim responsibility for any injury to people or property resulting from any ideas, methods, instructions or products referred to in the content.