Article

Evolution Characteristics of Rainfall and Runoff in the Upper Reaches of Zhang River Basin

1
State Key Laboratory of Simulation and Regulation of Water Cycle in River Basin, A-1 Fuxing Road, Haidian District, Beijing 100038, China
2
China Institute of Water Resources and Hydropower Research (IWHR), A-1 Fuxing Road, Haidian District, Beijing 100038, China
3
College of Water Conservancy and Environment, University of Jinan, 336 Nanxinzhuang West Road, Shizhong District, Jinan 250022, China
*
Author to whom correspondence should be addressed.
Water 2023, 15(14), 2521; https://doi.org/10.3390/w15142521
Submission received: 29 May 2023 / Revised: 28 June 2023 / Accepted: 4 July 2023 / Published: 10 July 2023
(This article belongs to the Special Issue Water Resources and Sustainable Development)

Abstract

:
It is of great significance to study and analyze the surface water resources and their change trend in the groundwater overexploitation area of the North China Plain, which is of great significance to solve the shortage of water resources in the groundwater overexploitation area of the North China Plain, promote the exploitation of groundwater, and realize the sustainable development of water resources. This paper takes Minyou Irrigation District of Handan City, a typical overexploitation area in the North China Plain, as an example. Based on the measured rainfall and runoff data from 1957 to 2020, the Mann–Kendall trend test, cumulative anomaly method, double cumulative curve method, and Morlet wavelet transform were used to analyze and predict the trend of water resources in the irrigation area and the individual contribution of climate change and human activities to runoff change. The results show that the annual rainfall and annual runoff in the irrigation area have a significant downward trend and significant cyclical changes throughout the study period. In 1977, the annual runoff showed a sudden change, and the average contribution rates of climate change and human activities to its change were 40.55% and 59.46%, respectively. In the future (2020–2035), runoff will remain stable and rainfall will show an increasing trend. The research results can provide scientific reference for the development, utilization, and rational allocation of surface water resources in the groundwater overexploitation area of the North China Plain.

1. Introduction

The North China Plain is an important wheat and corn production base in China, which plays an important role in ensuring China’s food security. However, due to the insufficient amount of water resources in the region, the unbalance of precipitation and water resource distribution within the region under the influence of climate change and human activities has intensified, resulting in an increasingly serious agricultural drought and water deficiency. The exploitation of groundwater for irrigation for a long time and on a large scale has become one of the important reasons for groundwater overexploitation in the North China Plain. Although, with the promotion of water-saving irrigation technology and the implementation of comprehensive management measures for water-saving compressive exploitation since 2014, agricultural water use and groundwater exploitation in North China have shown a downward trend, the dominant position of groundwater in farmland irrigation has not yet changed. Therefore, further governance actions have been carried out by the State, such as the Ministry of Water Resources, the Ministry of Finance, the National Development and Reform Commission, and the Ministry of Agriculture and Rural Affairs jointly issued the “Action Plan for Comprehensive Management of Groundwater over exploitation in North China” and the government of Hebei Province issued the “Five-year Implementation Plan for Comprehensive Management of Groundwater over exploitation in Hebei Province (2018–2022),” clearly requiring to strictly restrict the groundwater exploitation. In this regard, it is particularly urgent to study the evolution rule of surface water resources in North China and predict the variation trend of surface water resources in the future in a situation where the contradiction between the supply and demand of water resources is intensifying.
As an important constituent part and transformation form of water resources, runoff is not only the key link within the surface water cycle but also the main source of available surface water resources in irrigation districts. Human activities such as building large-scale water conservancy projects to change the regional runoff yield conditions have an impact on the regional hydrological process, and the combined effects of different climate change scenarios and various human activities make the runoff yield mechanism of the basin more complicated [1]. Under the current situation of increasing shortages of water resources caused by global climate change and human activities, runoff variation and attribution prediction have become one of the hot issues in the field of modern water science [2] and also an important basic work for the comprehensive management of surface water resources in irrigation districts [3]. In recent years, scholars have continued to explore the new methods from multiple perspectives, including the tendency [4,5,6], mutability [7,8,9], wet and dry abundance [10,11,12], periodicity [13,14,15], and attribution analysis [16,17,18,19,20] for rainfall-runoff evolution. For example, Panditharathne et al. [21] used the Mann–Kendall test to study the relationship among the variation trend of rainfall-runoff, the change points and runoff variation, and the rainfall-runoff in the Nirvara River Basin in southern Sri Lanka. Li et al. [22] used multiple hydrological statistical methods such as the Mann–Kendall test, cumulative departure, and rainfall-runoff double mass curve to study the evolution characteristics of hydrological elements in the Dawen River Basin. Ji et al. [23] used the cumulative departure method to identify the years of runoff mutation and the multiple linear regression method to evaluate the contribution rate of climate change and human activities to vegetation change in the upper reaches of the Yellow River. Banda et al. [24] used the Mann–Kendall test and double mass curve technology to explore the impact of human activities and climate variability on runoff variations in Rietspruit sub-basin of South Africa. Based on the double mass curve method, Wang et al. [25] performed attribution analysis on the runoff variation in Nanxiaohegou watershed, and quantitatively revealed the contribution rate of climate change and human activities to runoff variation. Zhang et al. [26] used Mann–Kendall method and the Morlet wavelet analysis method to study the annual variation characteristics of precipitation in Zhengzhou, and the results showed that the mutation and periodicity of precipitation series in Zhengzhou were significant. The Mann–Kendall trend test method can test the variation trend and mutation points of the sequence without being disturbed by a few outliers and has wide applicability, but it can only make qualitative judgments on the sequence. The cumulative departure method can quantitatively count and analyze the trend of the sequence and visually present the mutations. The double mass curve method can analyze the correlation of rainfall-runoff and distinguish the influence of climate and human activities on natural runoff throughout the observation period. Morlet wavelet analysis can show the variation of the wet and dry cycles of the sequence on multiple time scales, and on this basis, it can predict the trend variations in the future.
Based on the above research methods, this paper intends to study the variation trend characteristics and driving factors of rainfall runoff in the surface water source of Handan public irrigation area (Zhanghe River Basin above Yuecheng Reservoir), a typical groundwater overexploitation area in the North China Plain, to explore the main driving factors causing runoff changes, and on this basis, to analyze and predict the periodic changes of rainfall runoff. The research results can provide scientific reference for the development and utilization of surface water resources and rational allocation in North China.

2. Overview of the Research Area

As the main tributary of the South Canal water system in the Hai River Basin, the Zhang River has many branches in a fan-shaped distribution along its upper reaches, including the Qingzhang River and the Zhuozhang River. Flowing through the Yuecheng Reservoir built at its outlet, the Zhang River leaves the mountain and enters the plain eastward. The section of the Zhang River down Yuecheng Reservoir flows eastward through the irrigation district of Handan City, Hebei Province, with a length of 117.4 km. The total basin area of the Zhang River is 19,220 km2, of which the catchment area of the Yuecheng Reservoir is 18,100 km2, accounting for 94.2% of the total basin area and being the main water source of the Minyou irrigation district downstream. Located in Handan City, Hebei Province, and in the middle of the North China Plain, the total control area of Minyou irrigation district is 3480.6 km2, and the effective irrigation area is 1340 km2, with an average annual rainfall of 580 mm and an average annual evaporation of 1120 mm. With the topography being higher in the southwest and lower in the northeast, the main surface water source of the irrigation district comes from the Yuecheng Reservoir in the upper reaches of the Zhang River. However, since the surface water resources cannot meet the irrigation needs of the irrigation district, the groundwater is exploited for irrigation all year round in the middle and lower reaches of the irrigation district, which leads to the continuous decline of groundwater level and even the formation of groundwater funnel areas in some areas. The location of the irrigation district and its upstream meteorological and hydrological stations are shown in Figure 1.

3. Research Methods and Data Sources

3.1. Research Methods

In this paper, the Mann–Kendall (MK) trend test method [27,28,29], cumulative departure method [30,31,32], double mass curve method [33,34], and Morlet wavelet transform method [35,36] are used to perform the trend mutation analysis, attribution analysis, and periodic analysis prediction of runoff data and rainfall of meteorological stations in the research area. The details of each research topic are as follows:
(1)
MK Trend Test
The MK trend test is a nonparametric test method recommended by the World Meteorological Organization. Under the precondition that the sequences are independent of each other with the same continuous distribution, the calculation formula is as follows:
For hydrological sequence x, an order sequence is constructed:
S k = i = 1 k r i k = 2,3 , 4 , · · · , n
r i = + 1             x i > x j + 0             x i < x j j = 1,2 , · · · , n
where the order column S k is the cumulative count of the number of values when the i t h greater time value is greater than that at time j . Under the assumption of random independence of time series, the statistical magnitude is constructed:
U F k = S k E S k v a r S k ( k = 1,2 , · · · , n )
where U F 1 = 0 ;   E S k ,   v a r S k is the mean and variance of the cumulative count S k . When x 1 , x 2 , · · · , x n are independent of each other and have the same distribution, it can be calculated by the following formula:
E S k = k k + 1 4
v a r S k = k k 1 2 k + 5 72
S = i = 2 n j = 1 i 1 s i g n X i X j
Z = S 1 n n 1 2 n + 5 / 18     S > 0 Z = 0                                                       S = 0 Z = S 1 n n 1 2 n + 5 / 18     S < 0
where sign ( ) is a sign function, S is a normal distribution, UF is a standard normal distribution, and UB = −UF. Given the significance level α = 0.05, if |UF| or |UB| is greater than the critical value of the test statistic 1.96, it indicates that there is a significant trend change in the sequence; given the significance level α = 0.01, if |UF| or |UB| is greater than the critical value of the test statistic 2.38, it indicates that the trend change of the sequence is extremely significant, and the part exceeding the critical line is the time of mutation [37]. Z is a positive value indicating an increasing trend and a negative value indicating a decreasing trend. For a given significance level α, if |Z| is greater than or equal to 1.96 and 2.38, it indicates that it has passed the significance test with confidence levels of 95% and 99%, respectively.
(2)
Cumulative departure method
As a commonly used method to intuitively judge the variation trend by the curve, the cumulative departure method can reflect the evolution trend of the elements [38,39]. When the cumulative departure curve shows an upward trend, it indicates that the departure value increases, and vice versa [40]. This index can be used to judge the variation trend of long-term rainfall and runoff in the Zhang River Basin, and the approximate time of runoff mutation can also be judged from the Figure. For sequence x , the cumulative departure of time t can be calculated by the following formula:
X = i = 1 t x i = 1 t x i t = 1,2 , · · · , n
where X is the cumulative departure value from year 1 to year t   ( t is the time series, t n ).
(3)
Double mass curve
The double mass curve method is the simplest, most intuitive, and most widely used method for analyzing the consistency or long-term evolution trend of hydrometeorological elements. In the double mass curve of rainfall and runoff, the change in cumulative rainfall in a limited period of time is a natural change, and the influence of human activities is relatively small. Cumulative runoff is affected by both human activities and rainfall. Therefore, using cumulative rainfall as a reference variable, the influence of human activities on natural runoff can be distinguished by the double mass curve. The formula is as follows:
S r i = i = 1 n r i
S p i = i = 1 n p i
where S r i is the cumulative runoff depth of the first i years during n years in the basin (mm), S p i is the cumulative rainfall of the first i year during n years in the basin (mm), r i is the runoff depth of the i th year (mm), p i is the rainfall of the i th year (mm).
(4)
Morlet wavelet transform
Wavelet transform analysis is a multi-resolution analysis method that can perform the analysis of the time domain and frequency domain simultaneously and enables the hydrological time series being studied to reveal the law of system variation at different levels [41]. The calculation formula is:
+ ψ t d t = 0
ψ a , b t = | a | 1 / 2 ψ t b a       b R , a R , a 0
ω f a , b = | a | 1 / 2 + f t ψ t b a d t
V a r a = + | ω f a , b | 2 d b
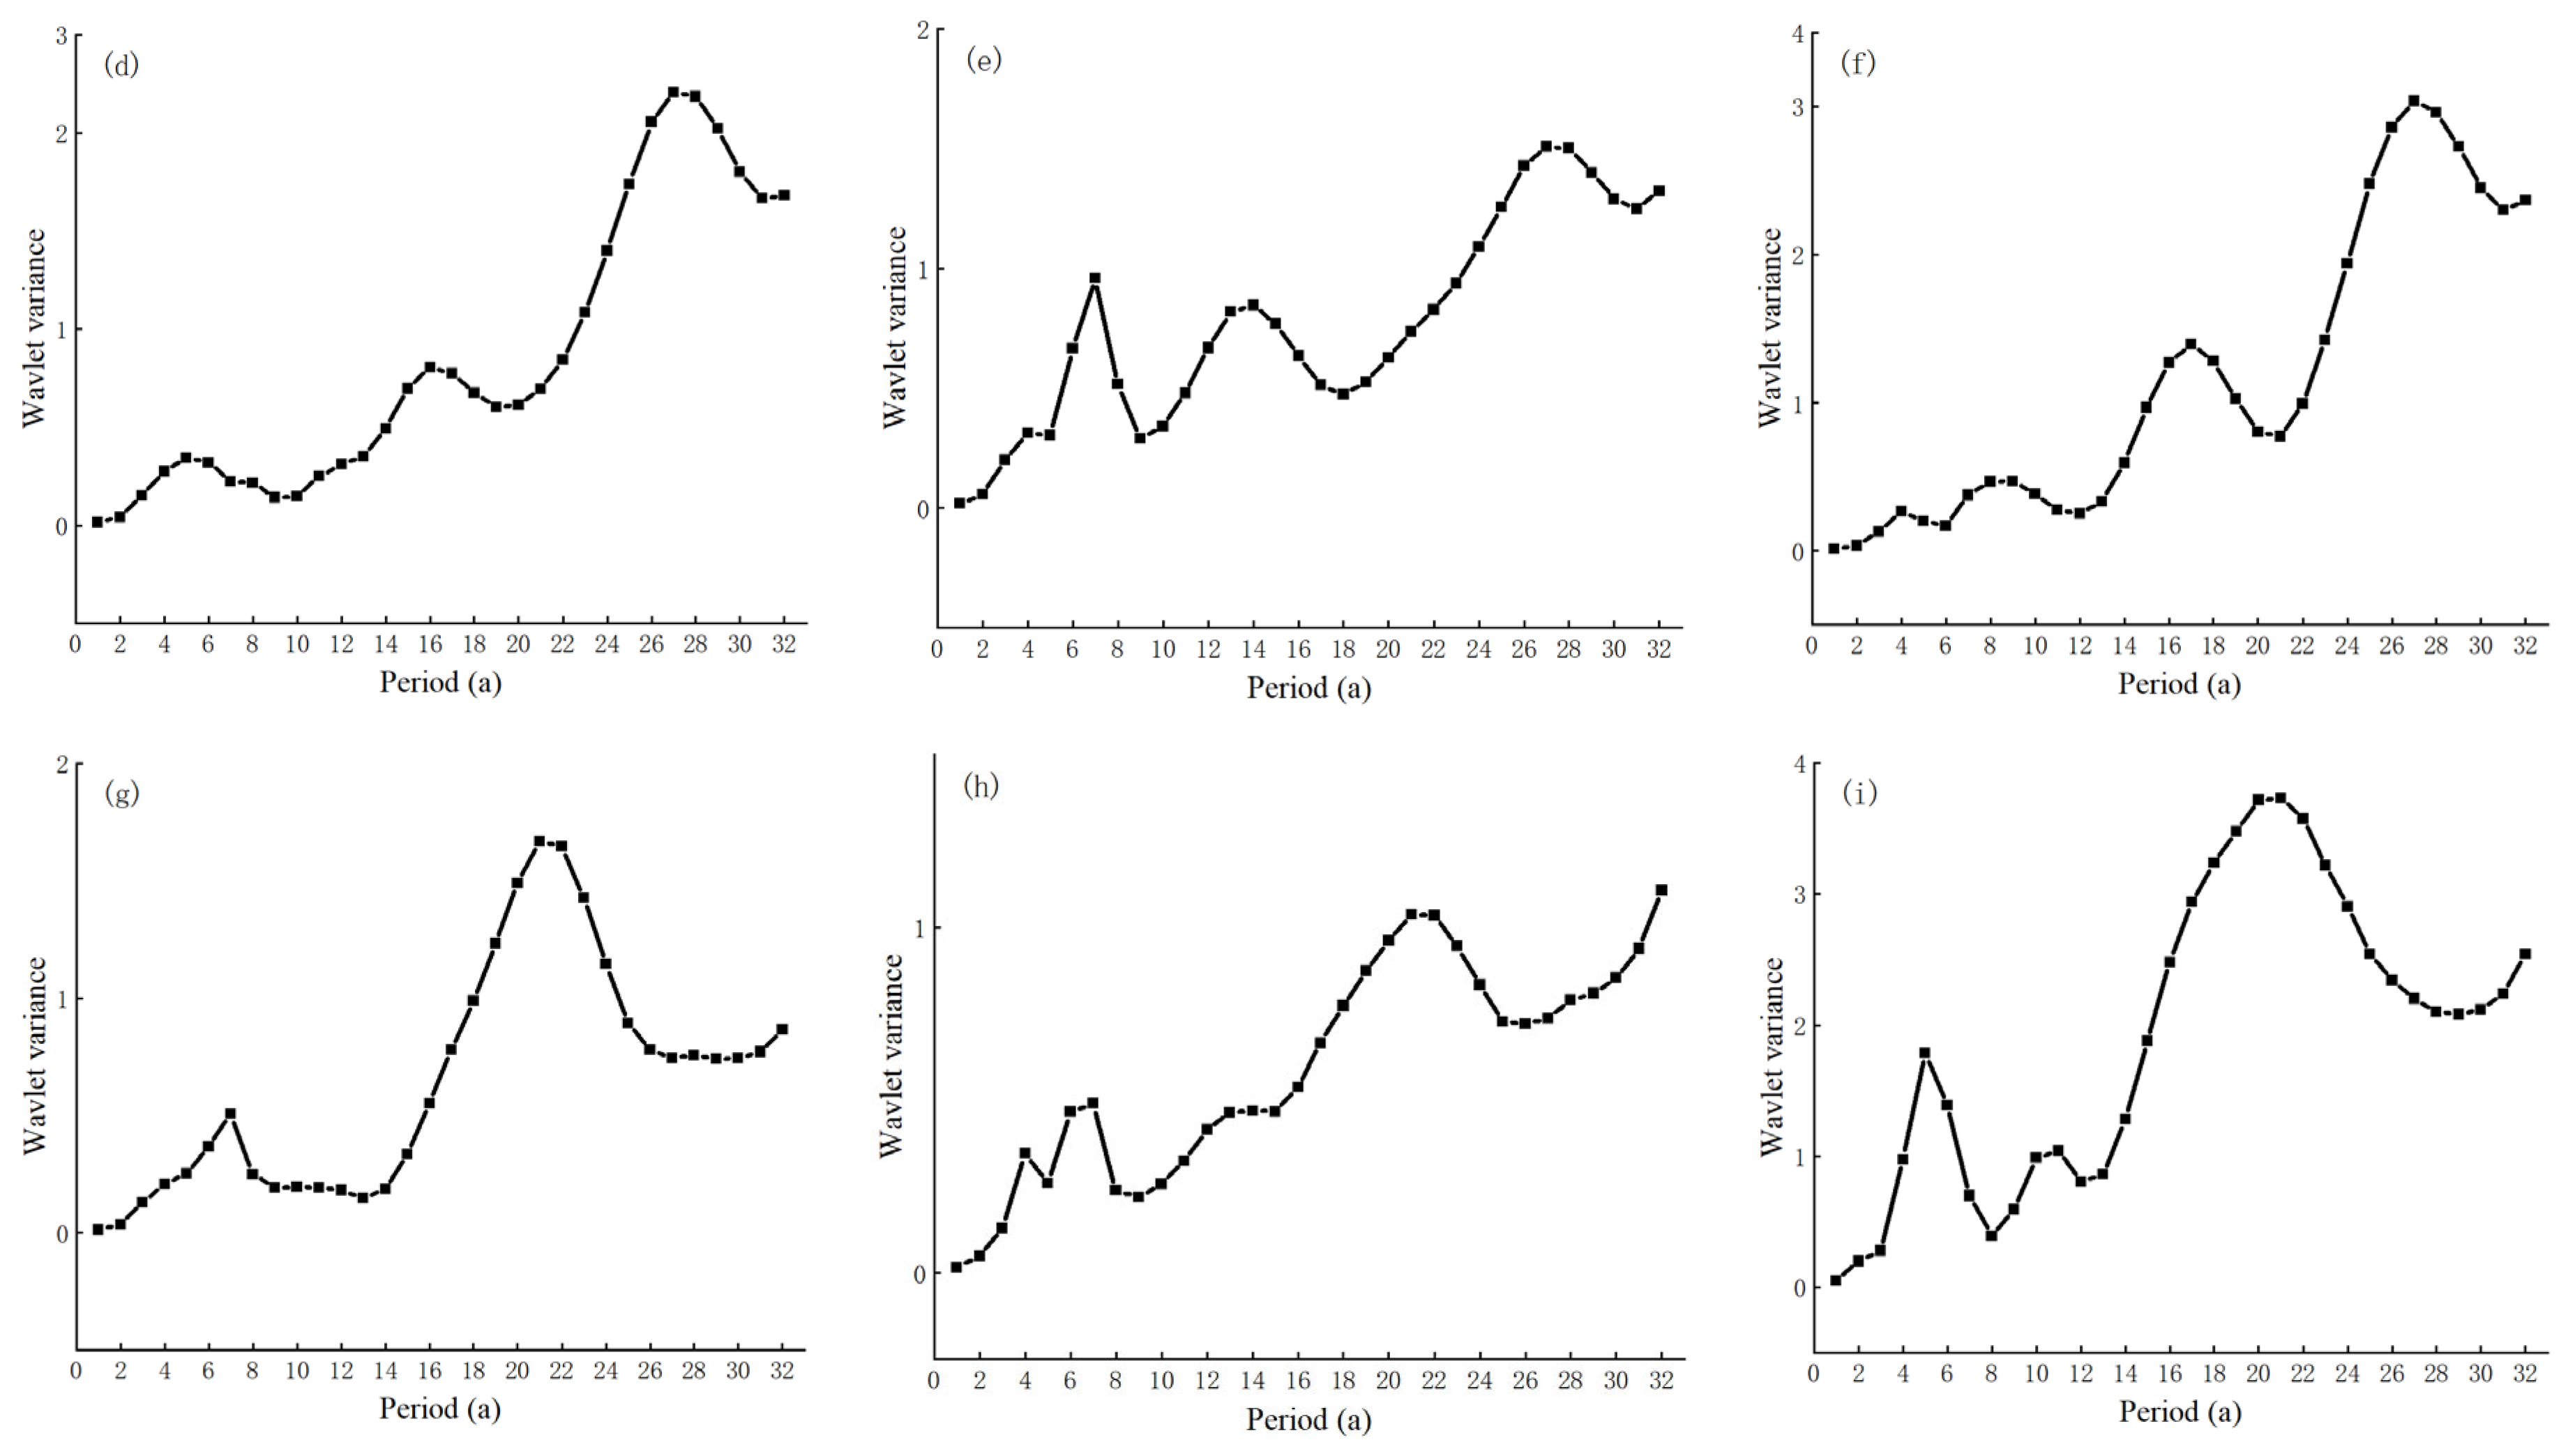
where ψ t is the basis wavelet function, ψ a , b t is a sub-wavelet, a is the scale factor, b is the time factor, f t is the given original signal, ω f a , b is the wavelet transform coefficient, V a r a is the wavelet variance, reflecting that the energy of the signal fluctuation is changing with the scale, based on which the periodic variation of the time series at different scales can be determined [42], and then the runoff variation of the basin in the next stage can be predicted as per the current period.

3.2. Data Sources

In this paper, the rainfall sequence data from 1957 to 2020 are selected from 8 meteorological stations (Pingshun station, Lucheng station, Huguan station, Changzhi station, Changzi station, Tunliu station, Xiangyuan station, and Licheng station) in the upper reaches of the Zhang River, together with the runoff data from 1962 to 2020 of Yuecheng Reservoir from the hydrologic station for inflow monitoring (Guantai Station). The site information is shown in Table 1. The rainfall data are derived from the China Meteorological Science Data Sharing Service Network (http://data.cma.cn, accessed on 13 April 2023), and the runoff data are from the Deliverables of Hydrological Data Compiled by Handan Zhangfu River Irrigation District.

4. Results and Discussion

4.1. Analysis of Trend Mutability

4.1.1. MK Trend Test

(1)
Rainfall trend analysis
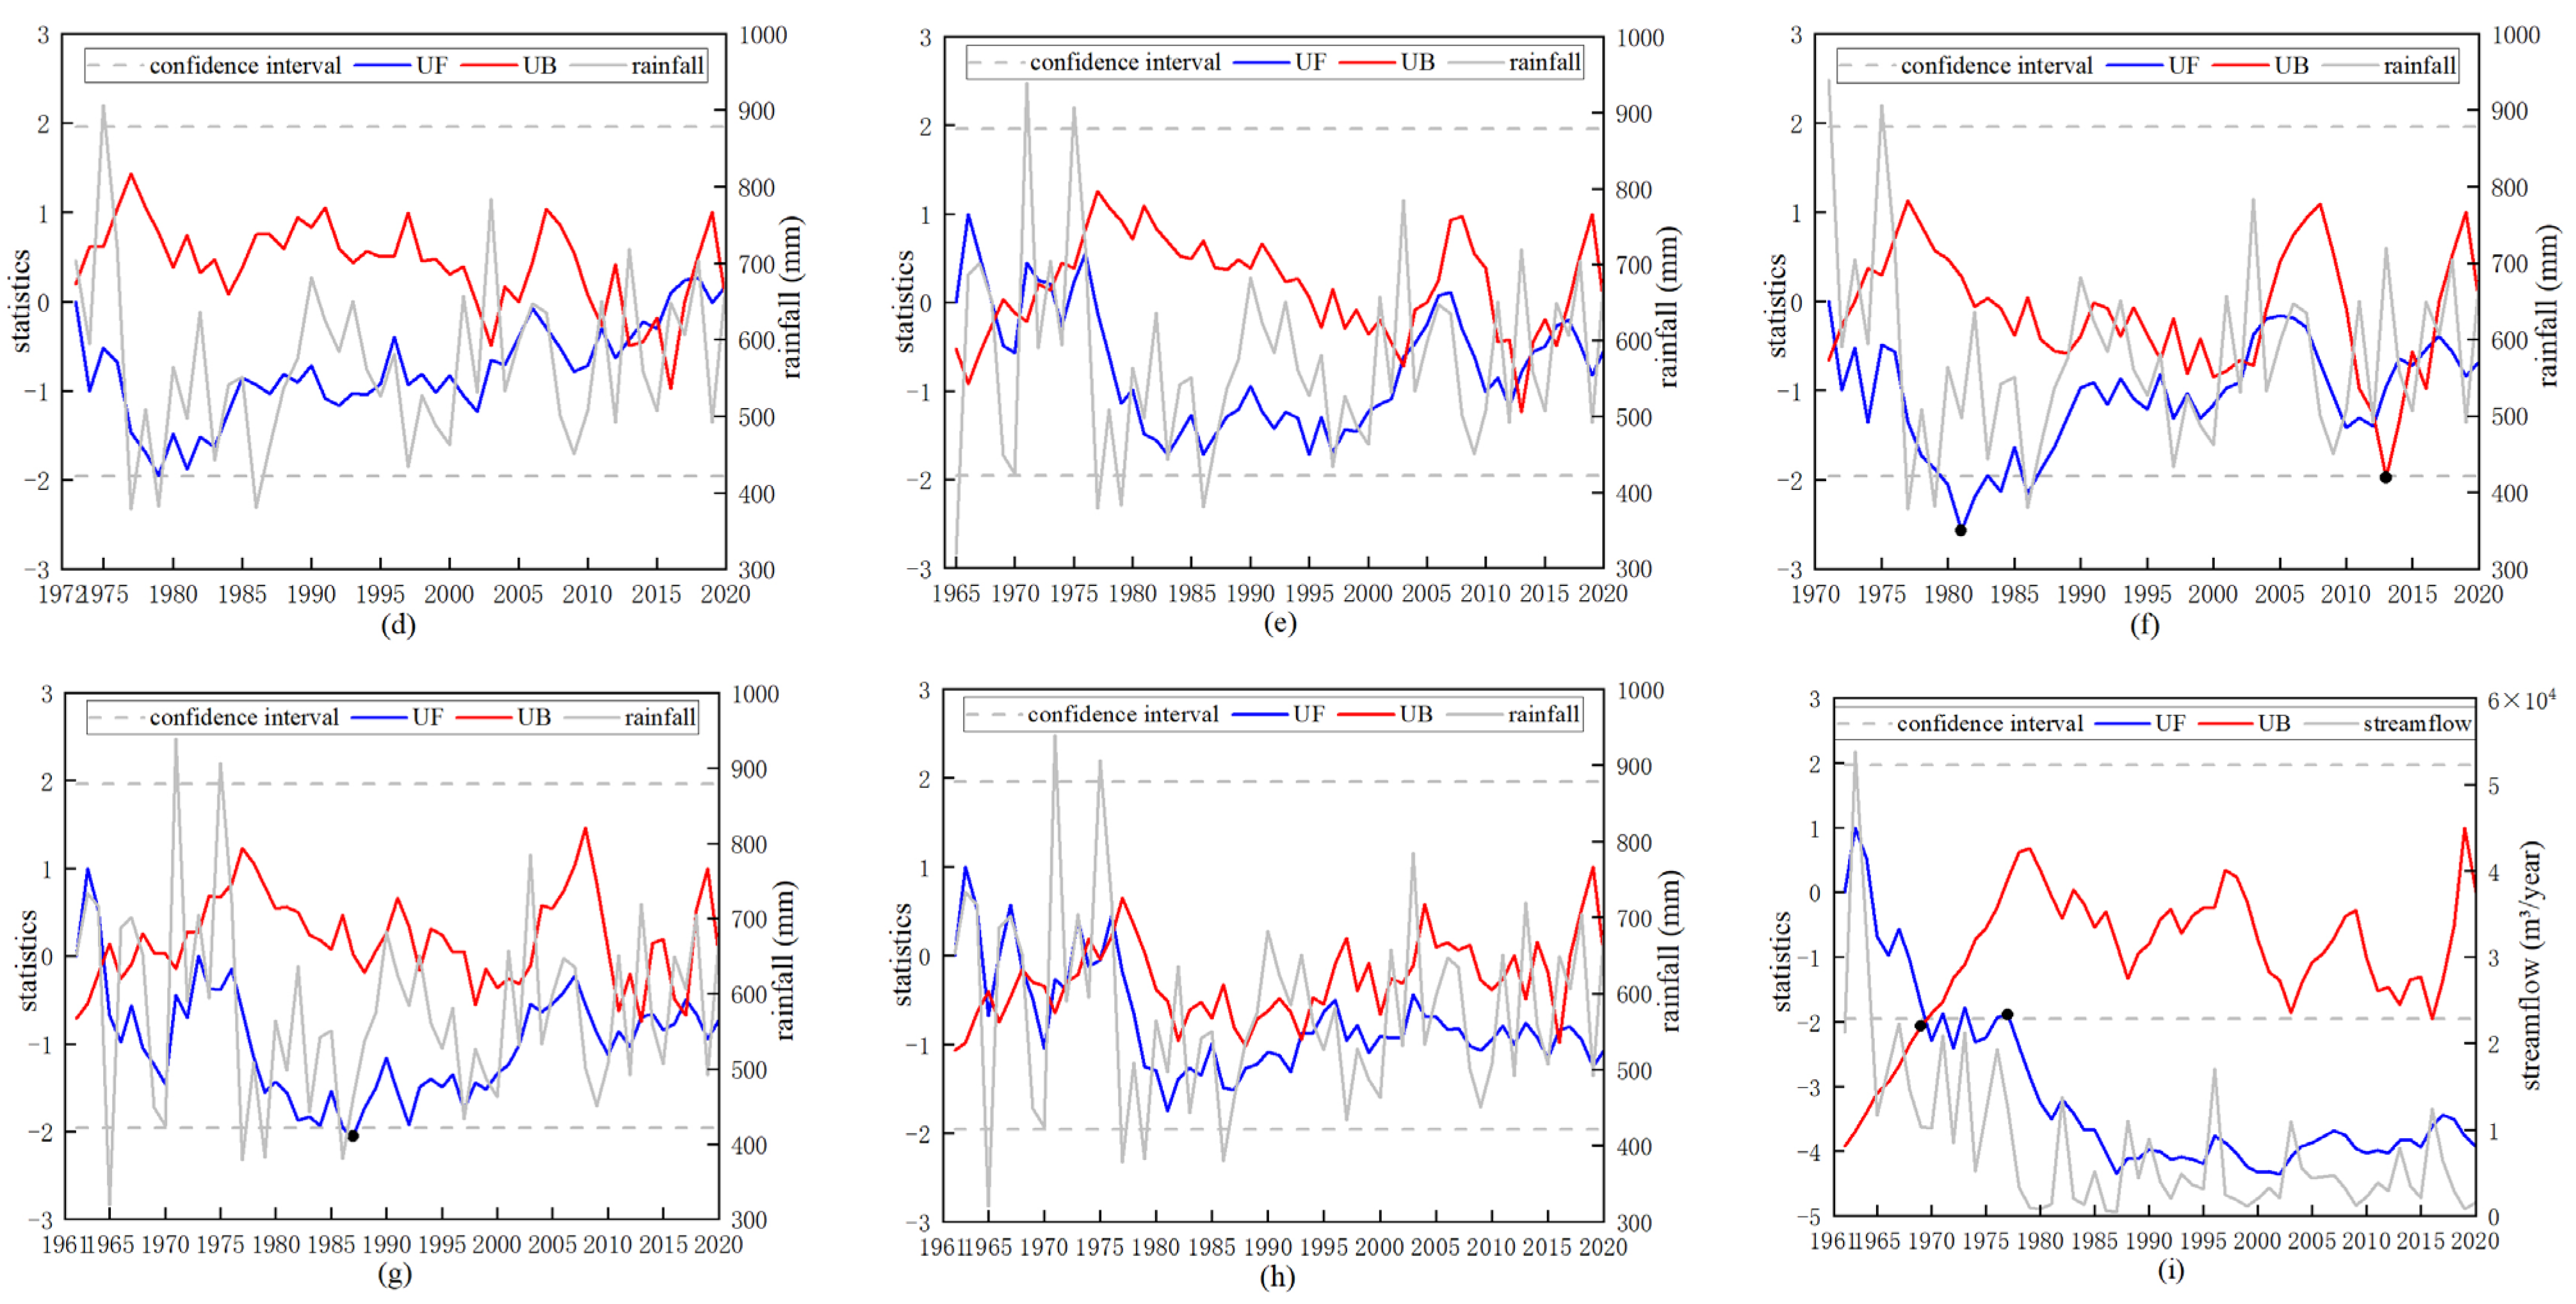
The rainfall series from 1962 to 2020 were selected for Mann-Kendall trend testing and analysis from 8 meteorological stations (Pingshun station, Lucheng station, Huguan station, Changzhi station, Zhangzi station, Tunliu station, Xiangyuan station, and Licheng station) in the upper reaches of the Zhang River. The results are shown in Figure 2a–h. On the whole, the rainfall at meteorological stations in the past 60 years has had a significant decreasing trend. The summary results are shown in Table 2, and the analysis of each station is as follows:
The rainfall of 7 stations at Pingshun, Huguan, Tunliu, Xiangyuan, Changzhi, Changzi, and Licheng showed a decreasing trend (UF < 0). All the rainfall exceeded the critical line at the significance level of 0.05, respectively, at Pingshun station in 1977, 1988, and 2000, at Huguan station in 1977, at Tunliu station in 1981 and 2013, and at Xiangyuan station in 1987, indicating that the decreasing trend of rainfall was very significant, of which the statistical value of rainfall at Tunliu station in 1981 even exceeded the significant level of 0.01, showing the extremely significant decreasing trend of rainfall. It can be seen from the UF curve and UB curve that the mutation points occurred at the four stations of Pingshun, Huguan, Tunliu, and Xiangyuan, respectively, in 1977, 1988, 2000, 1977, 1981, 2013, and 1987, while no mutation point occurred at Changzhi, Zhangzi, and Licheng.
The rainfall at Lucheng Station showed a decreasing trend (UF < 0) from 1976 to 1985 and an increasing trend after 1985 (UF > 0). According to the UF curve and UB curve, the mutation points of the rainfall sequence at Lucheng station were in 1977 and 1979.
(2)
Runoff trend analysis
The Mann–Kendall (MK) trend test was used to perform the trend analysis of the runoff series from 1962 to 2020 at Guantai hydrological station. As shown in Figure 2i, the runoff at Guantai hydrological station generally showed a decreasing trend (UF < 0) with an obvious decreasing trend from 1969 to 1977, which exceeded the critical line at the significance level of 0.01 after 1977, indicating an extremely significant decreasing trend of runoff. According to the UF curve and UB curve, the mutation points of the runoff sequence at Guantai station were in 1969 and 1977. Overall, from 1962 to 1964, the runoff was increasing (UF > 0), while since 1964, it has maintained a decreasing trend (UF < 0). The variation trend of runoff at Guantai hydrological station and the variation trend of rainfall in the upper reaches of the Zhang River showed a downward trend. Compared with the variation of rainfall, the variation of runoff’s decreasing trend was more intense.

4.1.2. Cumulative Departure Method

(1)
Analysis of rainfall
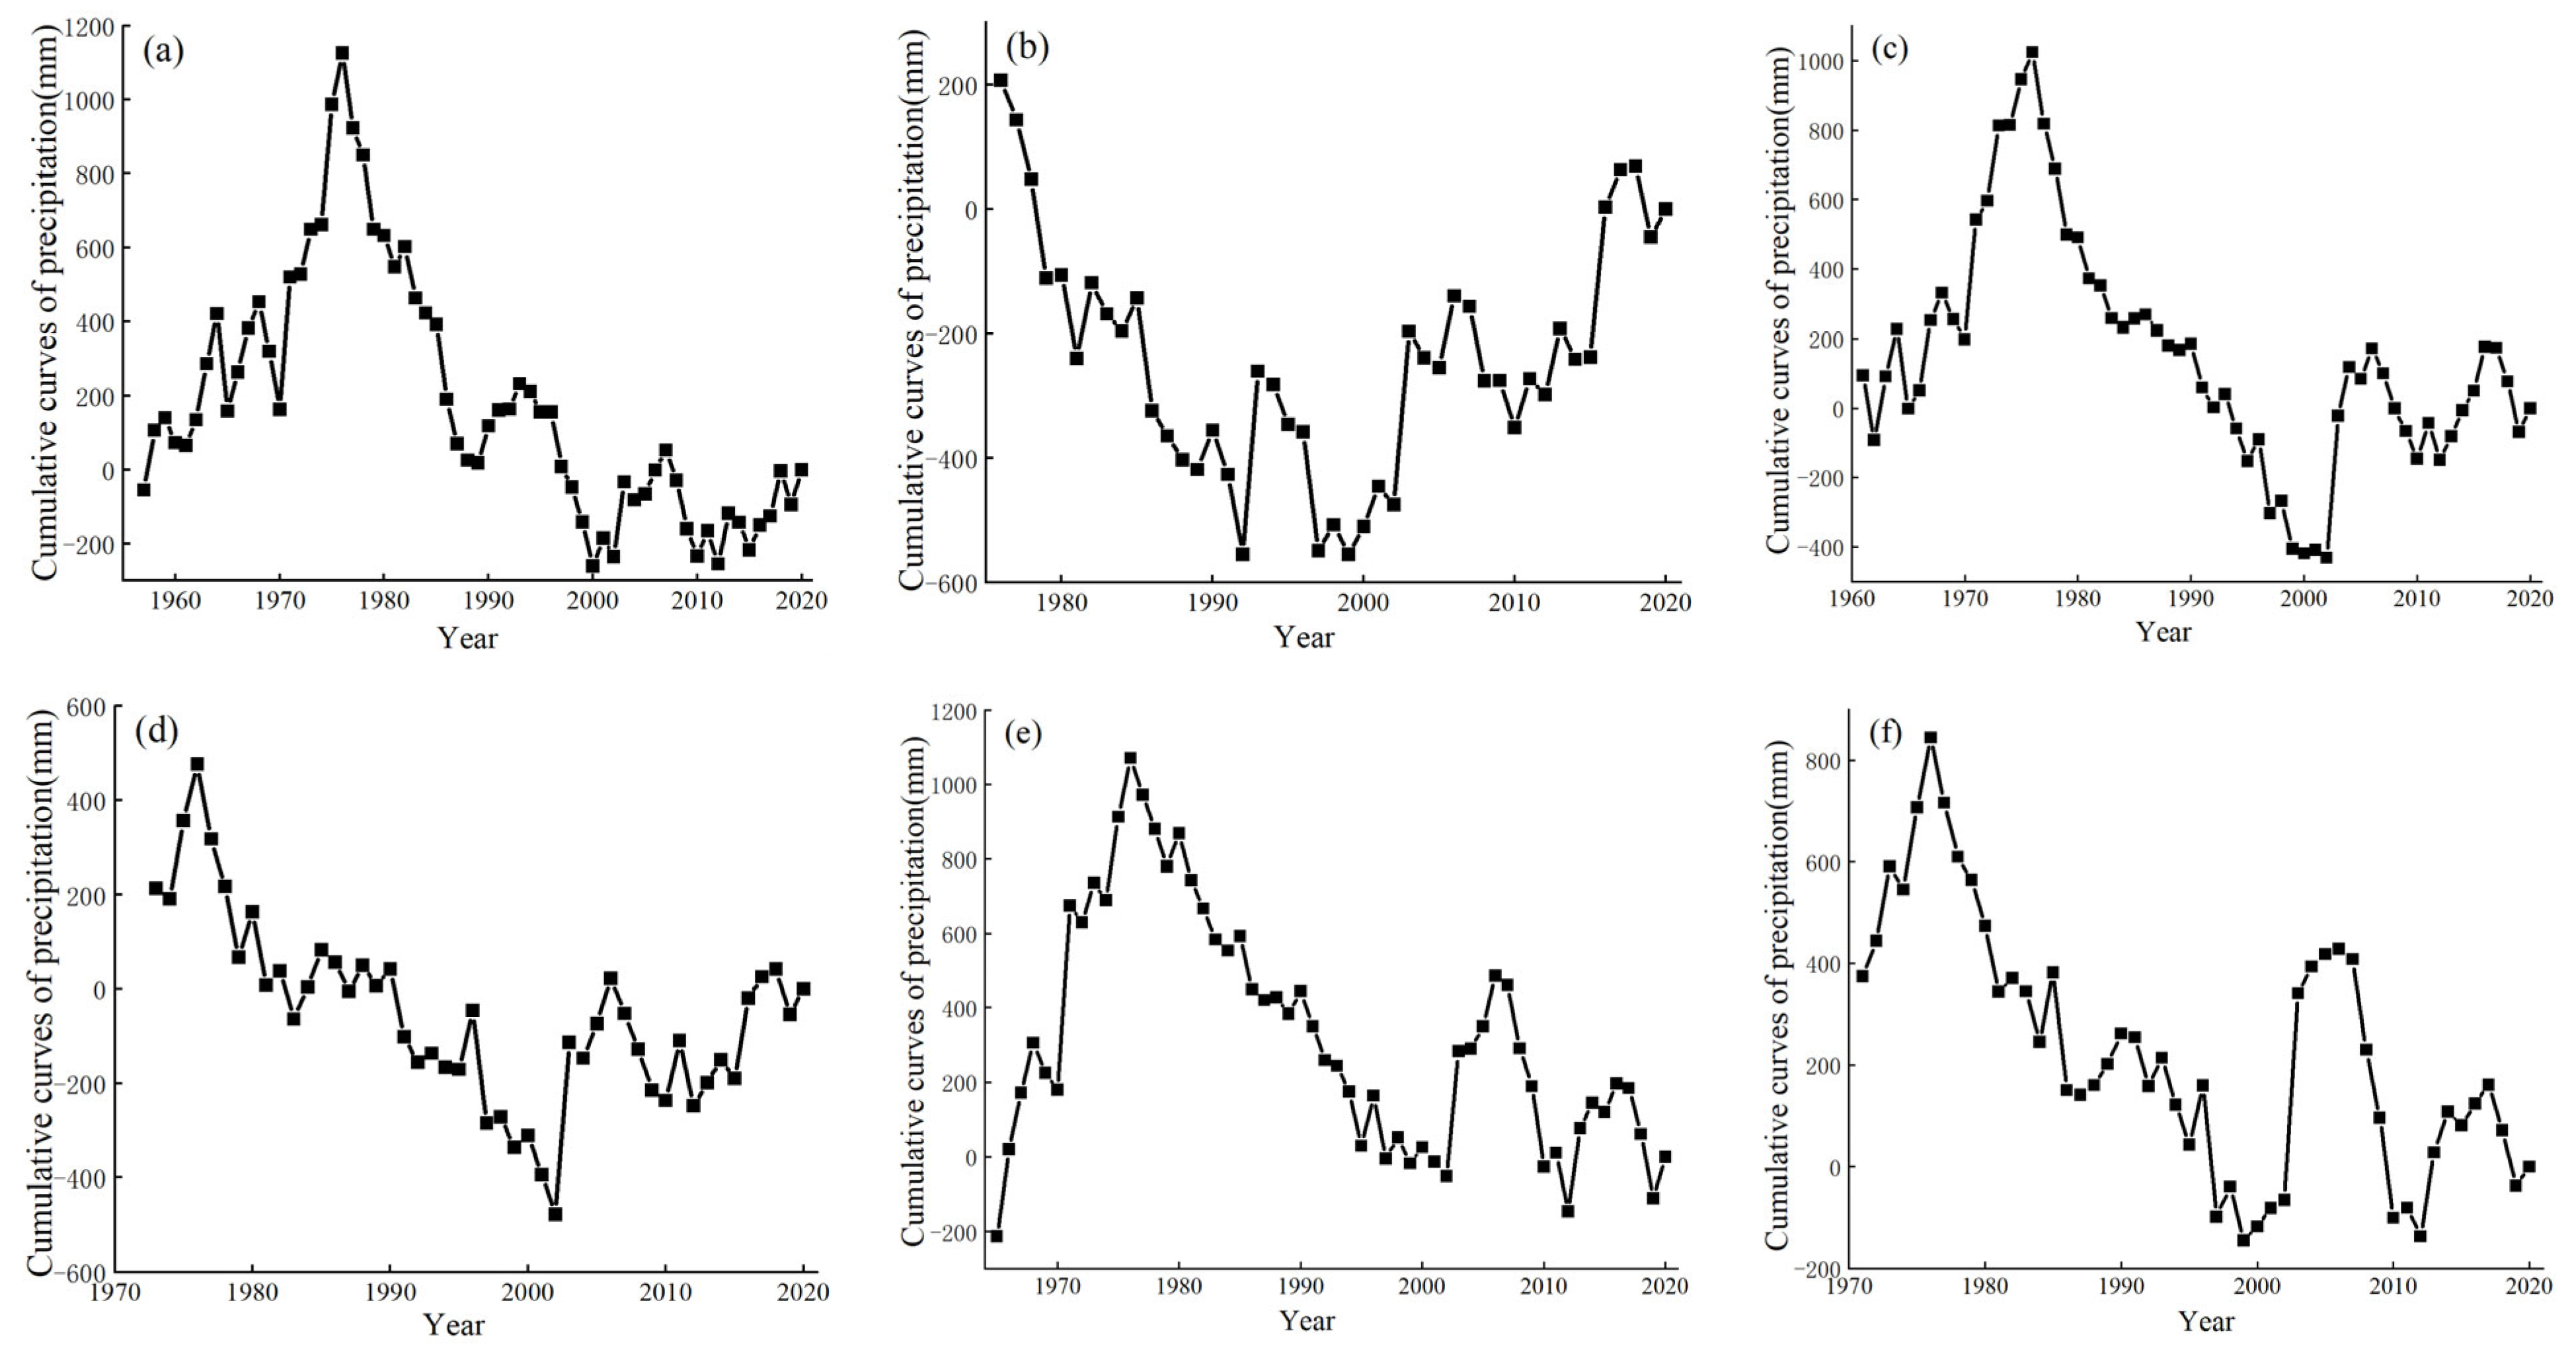
The Mann–Kendall trend test only made a qualitative judgment on the variation trend of rainfall-runoff in the Zhang River Basin. In order to further reveal the mutation characteristics of rainfall-runoff in the basin, the cumulative departure method was used to further analyze the relationship between the amount of water resources in the irrigation district and the rainfall in the upper reaches of the Zhang River. Figure 3 shows the cumulative departure variation process of rainfall at 8 stations in the upper reaches of the Zhang River. In general, it is divided into two stages in the late 1970s: the period of increasing rainfall before the 1970s and that of decreasing rainfall after the 1970s.
(2)
Analysis of runoff
The cumulative anomaly change process of runoff at the observation station is shown in Figure 3i. The changes in runoff and rainfall are similar. Taking the middle and late 1970s as the boundary, there are obvious increasing and decreasing periods of runoff. In summary, since 1957, the runoff variation process at Guantai station has been closely related to the rainfall in the upper reaches of the Zhang River. Their overall pattern is basically the same, and the amount of water resources increases first and then decreases during the research period.

4.1.3. Results of Trend Mutation

The analysis results of the MK trend test method and the cumulative departure method are shown in Table 2. A comprehensive analysis of the mutation points can determine the mutation years. The results show that there are some differences in the mutation points obtained by the two methods. It is determined through comprehensive analysis that there was one runoff mutation point in the Zhang River Basin from 1962 to 2020, and it was in 1977. Finally, it is determined that the years from 1962 to 1977 were the runoff base period of the Zhang River Basin, and those from 1977 to 2020 were the runoff variation period of the Zhang River Basin.

4.2. Results of Attribution Analysis

The variation in runoff series is the result of the combined effect of climate change and human activities, of which climate change will cause the variations in “natural runoff”, while the difference between “measured runoff” and “natural runoff” is dominated by human activities. The two key steps of the runoff variation attribution method are the diagnosis of the runoff mutation point and the reduction of natural runoff, for which improving the accuracy of natural runoff simulation has been an important direction of hydrological research in recent years. According to the principle of attribution analysis, human activities will change the rainfall-runoff relationship in the region, showing the slope variation on the rainfall-runoff double accumulation curve. The rainfall-runoff regression analysis conducted before and after the mutation can quickly achieve quantitative attribution.
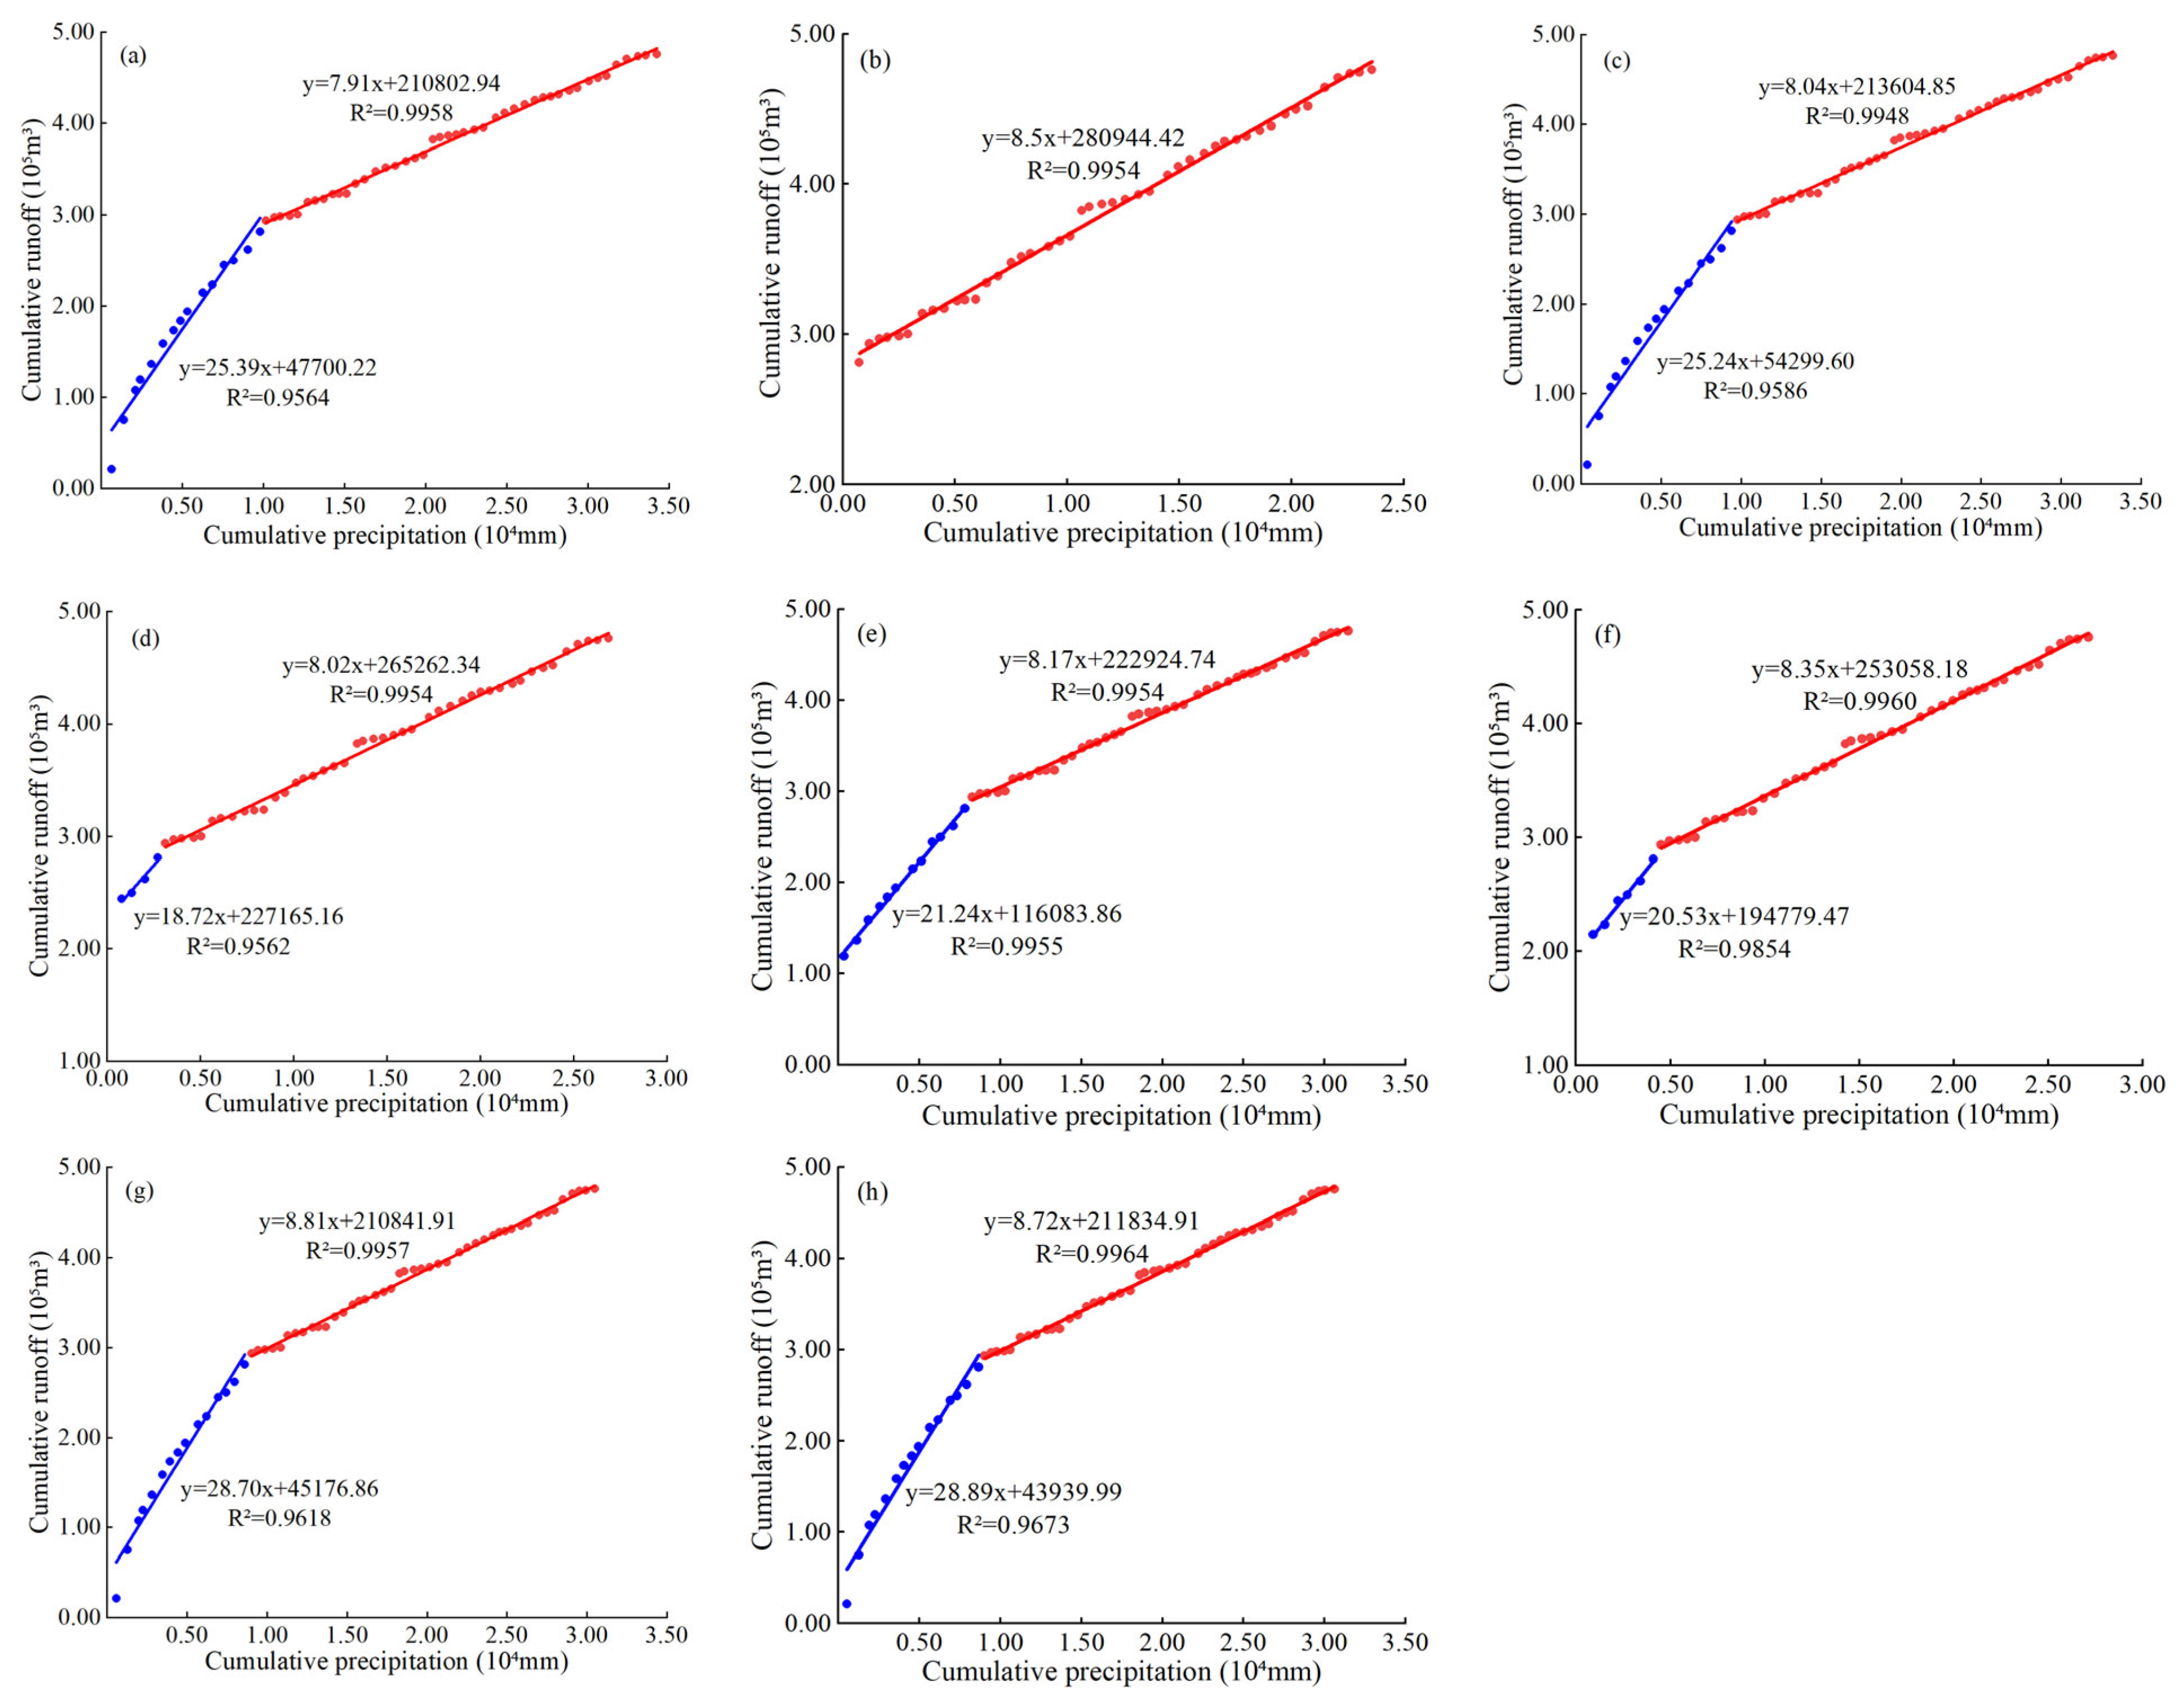
According to the results from the previous trend analysis, the regression analysis was performed for the base period (1962–1977) and the variation period (1977–2020), and according to Formula (2), the double mass curve of runoff at Guantai station from 1962 to 2020 and the annual rainfall at Pingshun station in the upper reaches of the Zhang River were plotted (Figure 4).
Because Lucheng station was built in 1976, compared with other stations, the data time series are quite different and not representative. Therefore, this paper only makes attribution analysis at the remaining 7 stations. From the blue and red in Figure 4, which represent the changes of the base period and the change period respectively, it can be seen that the slope of the curve is obviously inconsistent, and there is an inflection point around 1977. The slope of the curve in the base period is steeper, and the slope of the curve in the change period is obviously alleviated. It shows that under the same rainfall condition, the runoff in the base period is greater than that in the change period; that is, the underlying surface conditions of the basin before and after the inflection point are quite different, and human activities are more obvious. The contribution rate of rainfall change and human activities to the runoff change in the study area is shown in Table 3. Combined with Table 3, the attribution analysis of the runoff change at hydrological stations in the study area is as follows: The factors contributing to the annual runoff reduction in the Zhang River Basin during the change period are mainly human activities, accounting for more than 50%. Pingshun station, Tunliu station, and Xiangyuan station accounted for more than 60%, and Licheng station accounted for more than 70%.
Human activities have played a role in reducing the runoff from the Zhang River Basin. The change in rainfall runoff in the study area coincides with the three-year “Great Leap Forward” from 1957 to 1960. A large number of large and medium-sized reservoirs and irrigation areas have been built. Small-scale farmland water conservancy projects are blooming everywhere, and the time series of meteorological stations began in the whole period. Due to the impact of the “Cultural Revolution” in China from 1966 to 1979, the construction of farmland water conservancy was once stalled, coupled with climate change, rainfall and runoff increased year by year. Until the end of the “Cultural Revolution” in 1976, the existing engineering facilities and farmland water conservancy projects were restored. By the end of 1979, a large number of small and medium-sized farmland water conservancy projects had been renovated, and the runoff had been reduced year by year. It is necessary to study the variation law of rainfall runoff in the Zhang River Basin, give full play to the regulating effect of water conservancy projects on runoff, and improve the water resources management system so as to rationally allocate water resources in time and space.

4.3. Results of Periodicity

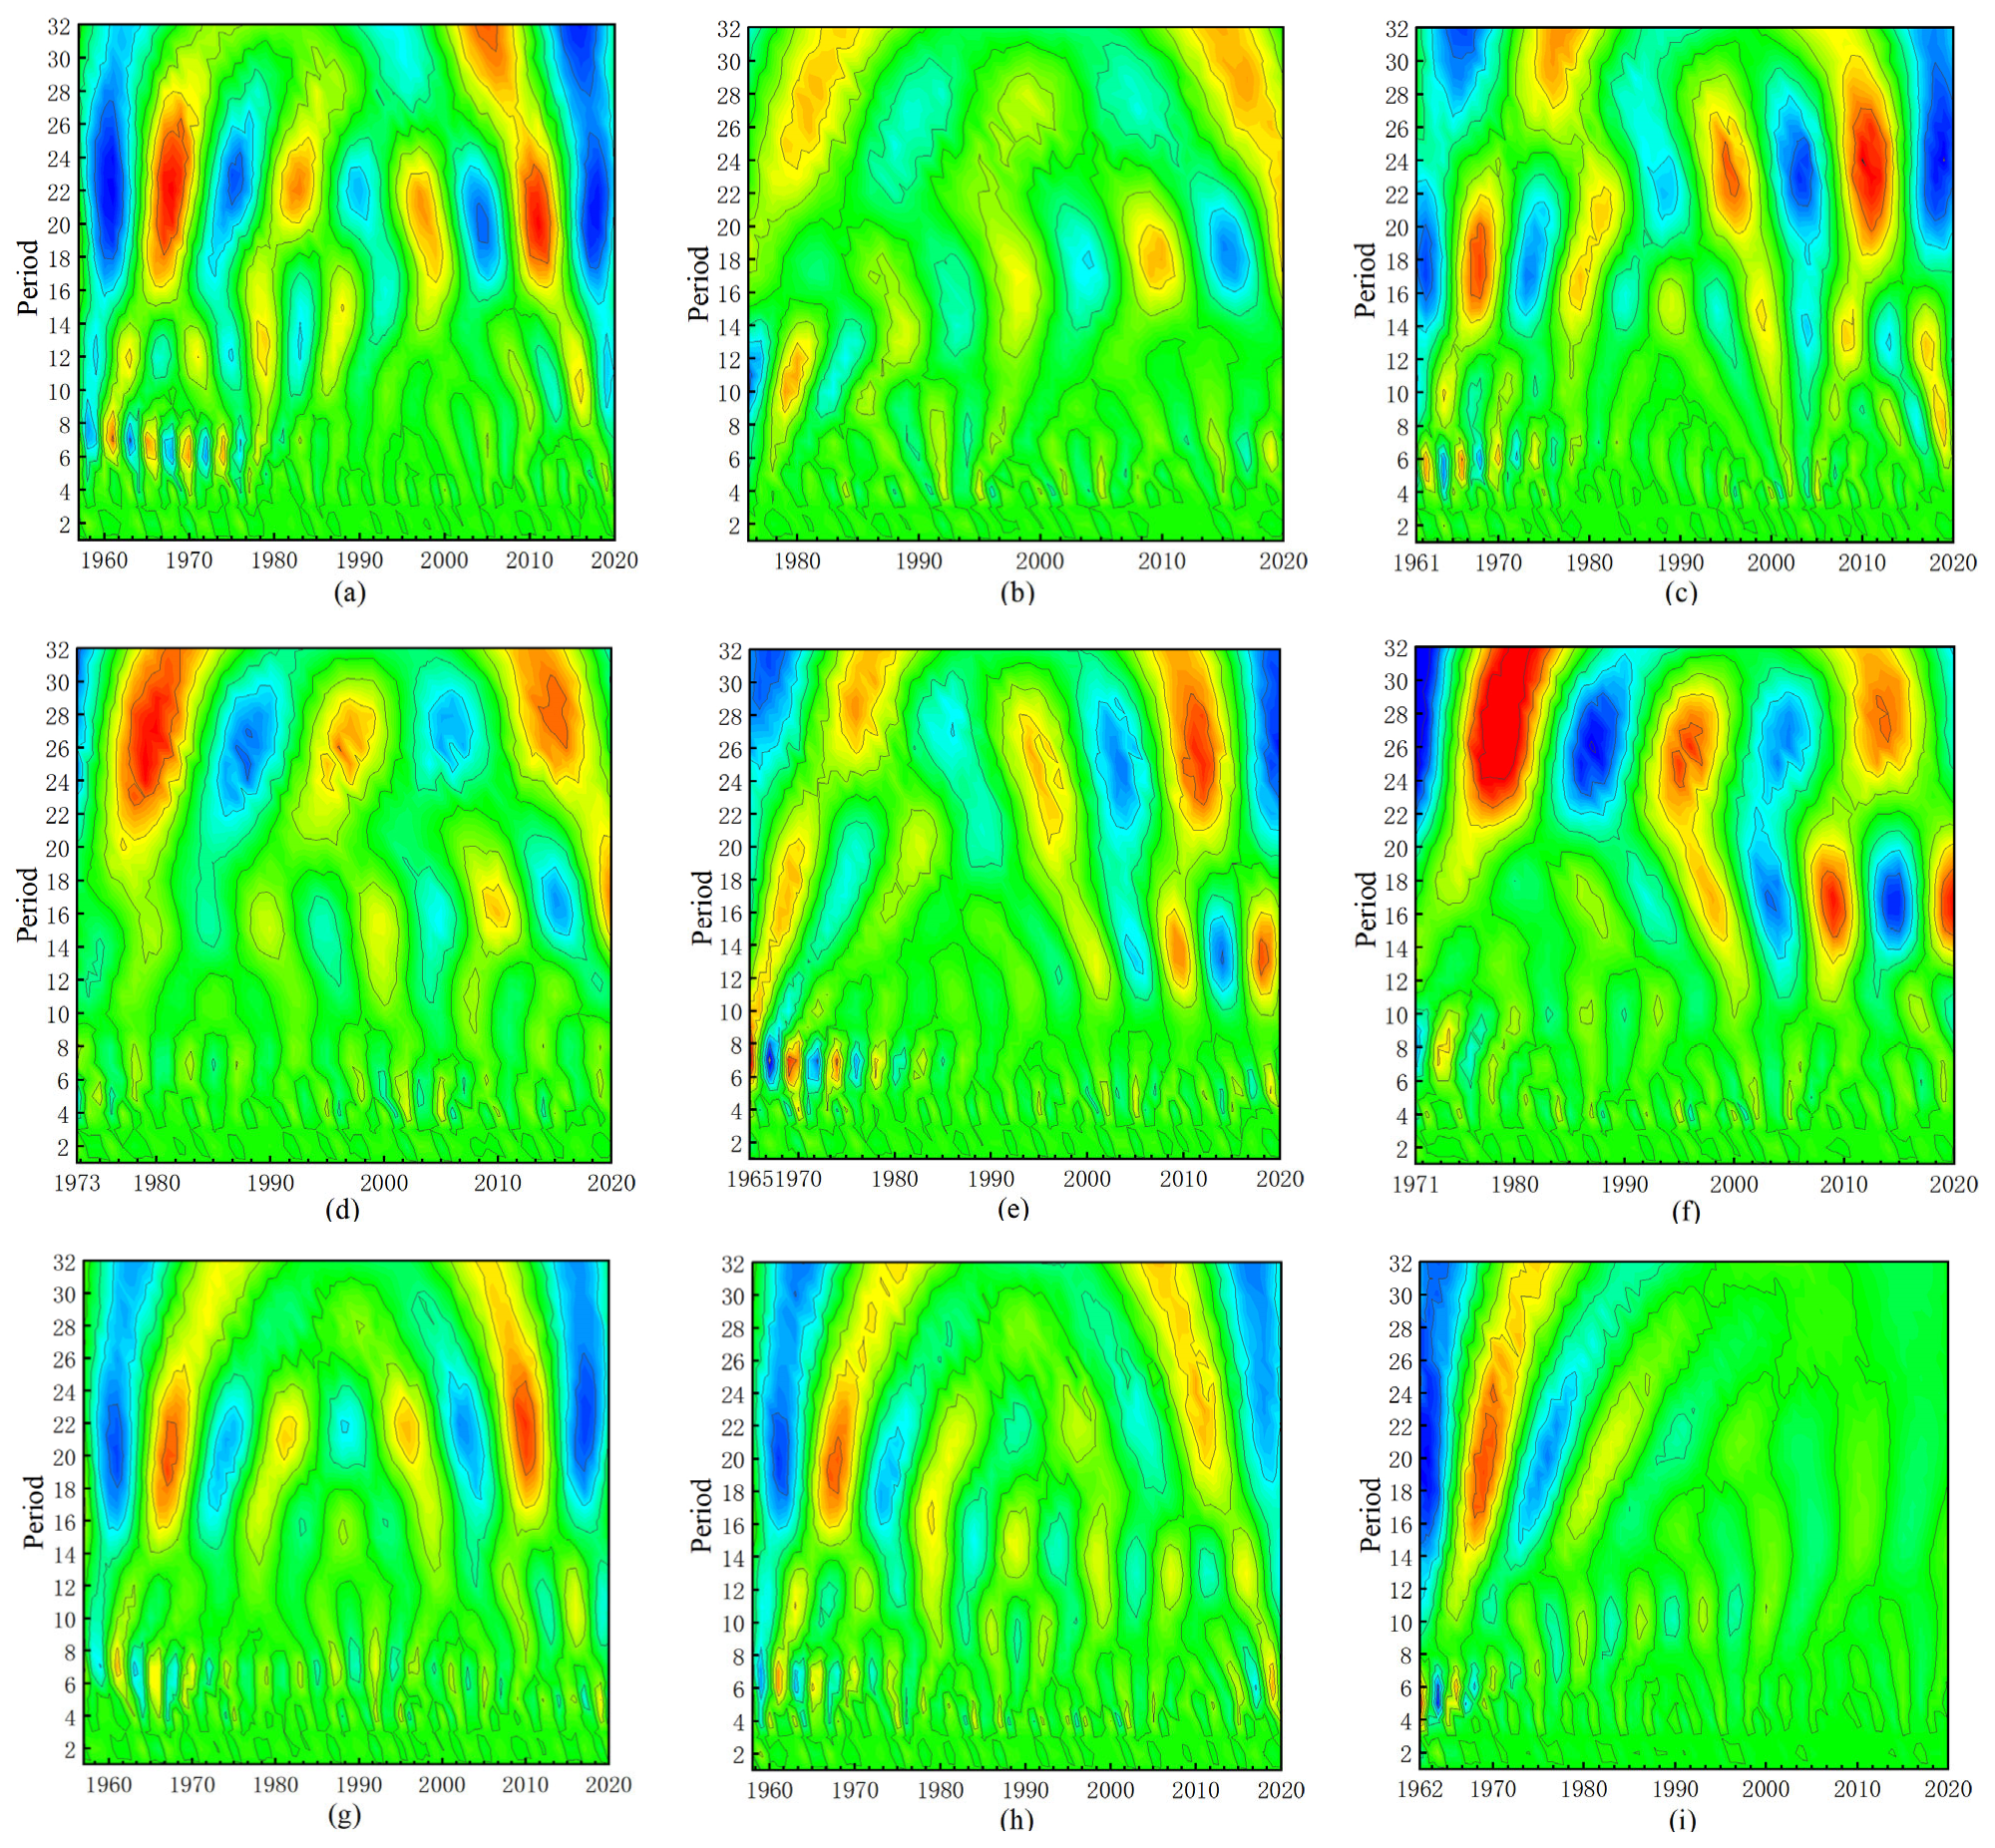
In order to understand the overall changing rule of a hydrological sequence, in addition to trend analysis, periodicity is also one of the important analysis contents. Because water resources and rainfall are not only affected by atmospheric circulation and temperature variations but also by human activities in the evolution process, there should be certain rules or changes in periodicity among these influencing factors, so it is necessary to study the periodicity of rainfall and total water resources. In order to predict the periodic variation of rainfall-runoff in the Zhang River Basin in the future, the Morlet wavelet transform is performed on the runoff data of the irrigation district and the rainfall data of the upper reaches of the Zhang River in Matlab to obtain the wavelet coefficient real part contour map (Figure 5, Table S1) and the Morlet wavelet coefficient variance diagram (Figure 6, Table S2).
Figure 5 is the wavelet coefficient real-part contour map. The abscissa is the year, the ordinate is the time scale, and the equivalent curve in the figure is the real part value of the wavelet coefficient. When the real part value of the wavelet coefficient is positive, it represents the wet period of runoff, plotted in blue in the figure when it is negative, it indicates the dry period of runoff, plotted in red in the figure.
There are significant periodic changes in the interannual scale of rainfall changes in the upper reaches of the river. As shown in Figure 5a–h, there are three types of periodic changes of 16~30 years, 10~16 years, and 6~9 years in the evolution of rainfall in the basin. On the three types of scales, there are multiple oscillations of dry-wet alternation, and the oscillation period is about 5 years. At the same time, the periodic changes of the above three scales are very stable and global throughout the whole analysis period. The periodic change of 16~30 years is relatively stable. The negative phase of the 16–30-year scale has approached closure by 2020, and the new oscillation period begins, indicating that the annual rainfall will show a fluctuating upward trend from 2020 to 2035.
The change in runoff in the irrigation area also has significant periodic changes on an interannual scale. As shown in Figure 5i, there are two types of periodic changes of 9~32 years and 4~10 years in the evolution of runoff in the basin. There are multiple oscillations of dry-wet alternation on both scales, and the oscillation period is about 2–5 years. However, since 2000, due to the influence of coal mining, the periodic variation trend of runoff has been weakening. The runoff from the observation station tends to be stable, and the dry-wet change is not obvious. Especially after 2020, the short fluctuation period has disappeared, indicating that the runoff remains stable from 2020 to 2035.
Figure 6 is the wavelet coefficient variance diagram; the abscissa is the number of years of the cycle, and the ordinate is the relative size of the wavelet variance. From the diagram, the main cycle of water resource change in the irrigation area can be seen. Figure 6 shows that there are three peaks in the wavelet variance of annual runoff. The first peak corresponds to a time scale of 20 years, which is the first main cycle of annual runoff change in the basin, indicating that the annual runoff in this area has the strongest periodic oscillation of about 20 years. The second peak is 11 years, which is the second main cycle of annual runoff change. The third peak is 5 years, which is the third main cycle of annual runoff change. This indicates that the fluctuation of the above three cycles controls the variation characteristics of runoff in the whole time series.

5. Conclusions

In this paper, trend mutation analysis, attribution analysis, periodic analysis, and prediction of rainfall and runoff in the research area are carried out based on the runoff data from 1962 to 2020 at Guantai hydrological station in Zhang River Basin and the rainfall data from 1957 to 2020 of its upstream meteorological stations, combined with the methods of Mann–Kendall trend test, cumulative departure method, double mass curve method, and Morlet wavelet transform, to obtain more scientific and reasonable conclusions with the main contents as follows:
In the past 60 years, the variation process of water resources in the irrigation district has been closely related to the rainfall in the upper reaches of the Zhang River, with the overall pattern being basically the same, that is, a decreasing trend as a whole in terms of rainfall and runoff in the irrigation district. Except for the late-built Lucheng station, the measured rainfall-runoff from the other seven stations has changed significantly, and the mutation year of rainfall-runoff was around 1977. The runoff variation can be divided into two stages: the basis period (1962~1977) and the variation period (1977~2020).
The results from an attribution analysis of runoff variation in the research area show that the factors contributing to annual runoff reduction in the Zhang River Basin are mainly due to human activities, with the contribution rate accounting for more than 50%. The rainfall-runoff data was collected during the “Great Leap Forward” period in the late 1950s. The rainfall runoff increased year by year during the “Cultural Revolution” period from the 1960s to the 1970s and decreased year by year until the end of the “Cultural Revolution” in the late 1970s. The hydrological effects caused by human activities such as a large number of farmland water conservancy projects, groundwater exploitation, and various water storage projects built in the late 1970s are the main reasons for the decrease in runoff.
There is a long fluctuation period of about 20 or 15 years and a short fluctuation period of 5 years on the interannual scale of rainfall and runoff variation in the upper reaches of the Zhang River. During the research period, there are many oscillations of dry-wet alternation, with the oscillation period being about 5 years. The long fluctuation period of rainfall was approaching closure by 2020, while the new oscillation period initiated, indicating that the annual rainfall may represent a fluctuating upward trend from 2020 to 2035. Since 2000, due to the influence of coal mining, the periodic variation trend of runoff in the irrigation district has been weakening. The runoff at Guantai station tends to be stable, and the dry-wet variation is not obvious, especially since the short fluctuation period almost disappears, indicating that the runoff has remained stable since 2000.

Supplementary Materials

The following supporting information can be downloaded at: https://www.mdpi.com/article/10.3390/w15142521/s1, Table S1: Figure 5 Pingshun station. Table S2: Figure 6’s wavelet variance.

Author Contributions

Conceptualization, L.D. and G.W.; methodology, L.D.; software, G.W.; validation, L.D., G.W. and B.L.; formal analysis, G.W.; investigation, B.L.; resources, G.W.; data curation, G.W.; writing—original draft preparation, G.W.; writing—review and editing, L.D.; visualization, G.W.; supervision, B.L.; project administration, B.L.; funding acquisition, L.D. All authors have read and agreed to the published version of the manuscript.

Funding

This research was funded by the Water Resources Demonstration Project of Zhangfu River Irrigation District in Handan City, Hebei Province, funder: Lijuan Du, funding number ID120202A0022022, and The APC was funded by Lijuan Du.

Data Availability Statement

The rainfall data are derived from the China Meteorological Science Data Sharing Service Network (http://data.cma.cn), and the runoff data are from the Deliverables of Hydrological Data Compiled by Handan Zhangfu River Irrigation District.

Acknowledgments

This research has been supported by funds from the Water Resources Demonstration Project of Zhangfu River Irrigation District in Handan City, Hebei Province (ID120202A0022022).

Conflicts of Interest

The authors declare no conflict of interest.

References

  1. Wang, G.Q.; Zhang, J.Y.; Guan, X.X.; Bao, Z.X.; Liu, Y.L.; He, R.M.; Jin, J.L.; Liu, C.S.; Chen, X. Quantifying attribution of runoff change for major rivers in China. Adv. Water Sci. 2020, 31, 313–323. [Google Scholar]
  2. Liu, N.; Harper, R.J.; Smettem, K.R.J.; Dell, B.; Liu, S. Responses of streamflow to vegetation and climate change in southwestern Australia. J. Hydrol. 2019, 572, 761–770. [Google Scholar] [CrossRef]
  3. Liu, Y.; Han, X.X.; Li, L.J. Characteristics and attribution analysis of runoff changes in the middle and upper reaches of Cao’e River from 1980 to 2018. J. Water Resour. Water Eng. 2022, 33, 53–61. [Google Scholar]
  4. Nyikadzino, B.; Chitakira, M.; Muchuru, S. Rainfall and runoff trend analysis in the Limpopo river basin using the Mann Kendall statistic. Phys. Chem. Earth 2020, 117, 102870. [Google Scholar] [CrossRef]
  5. Dan’azumi, S.; Ibrahim, U.A. Trend analysis of observed precipitation, temperature, and streamflow for Hadejia-Nguru wetlands catchment, Nigeria. Theor. Appl. Climatol. 2023, 151, 195–207. [Google Scholar] [CrossRef]
  6. Clavera, G.R.; Quintana, S.P.; Palazón, L.; Zabaleta, A.; Cenobio, O.; Barella, O.A.; Beguería, S. Streamflow trends of the Pyrenees using observations and multi-model approach (1980–2013). J. Hydrol. Reg. Stud. 2023, 46, 101322. [Google Scholar]
  7. Liu, J.P.; Wang, W.; Zhou, J.J.; Zou, X.B. The Research of Runoff Variation Characteristics of Wei River Basin. In Proceedings of the 3rd International Conference on Advances in Energy and Environmental Science, Zhuhai, China, 25–26 July 2015. [Google Scholar]
  8. Shen, Z.T.; Zhao, Q.; Li, X.F. Analysis of Rainfall-Runoff Variation Characteristics and Influencing Factors in the Dawen River Basin in the Past 50 Years. IOP Conf. Ser. Earth Environ. Sci. 2020, 619, 012091. [Google Scholar] [CrossRef]
  9. Huang, Z.Q.; Shen, K.Q.; Zhao, C.; Shan, M. Trend Analysis of Annual Runoff in Yong’an Creek Basin of Zhejiang. IOP Conf. Ser. Earth Environ. Sci. 2021, 811, 012003. [Google Scholar]
  10. Lu, H.X.; Ma, G.W.; Wang, X.D.; Ping, F.; Li, F.W. Effects of Abundant-and-Low-Flow Property of Annual Rainfall on Multi-Source Water Intake System Allocation. Appl. Mech. Mater. 2013, 2545, 353–356. [Google Scholar] [CrossRef]
  11. Li, Z.Y.; Sun, Z.L.; Sun, L.X.; Liu, J.; Xiong, W.H.; Dong, H.Y.; Zheng, H.L. Hydrological variation and hydro-sediment interrelation of the Luozha River in the Lancang River Basin. Water Supply 2022, 22, 4839–4851. [Google Scholar] [CrossRef]
  12. Lyu, J.Q.; Yin, S.S.; Sun, Y.T.; Wang, K.X.; Luo, P.P.; Meng, X.L. Flood Runoff Simulation under Changing Environment, Based on Multiple Satellite Data in the Jinghe River Basin of the Loess Plateau, China. Remote Sens. 2023, 15, 550. [Google Scholar] [CrossRef]
  13. He, B.; Miao, C.Y.; Shi, W. Trend, abrupt change, and periodicity of streamflow in the mainstream of Yellow River. Environ. Monit. Assess. 2013, 185, 6187–6199. [Google Scholar] [CrossRef] [PubMed]
  14. Wu, L.L.; Zhang, W.; Wu, T. Analysis of the Periodicity of Annual Extreme Runoff at Datong Station, Yangtze River, China. Appl. Mech. Mater. 2012, 256–259, 2606–2610. [Google Scholar] [CrossRef]
  15. Lamborn, C.C.; Smith, W.J. Human perceptions of, and adaptations to, shifting runoff cycles: A case-study of the Yellowstone River (Montana, USA). Fisheries Research 2019, 216, 96–108. [Google Scholar] [CrossRef]
  16. Ji, G.X.; Wu, L.Y.; Wang, L.D.; Yan, D.; Lai, Z.Z. Attribution Analysis of Seasonal Runoff in the Source Region of the Yellow River Using Seasonal Budyko Hypothesis. Land 2021, 10, 542. [Google Scholar] [CrossRef]
  17. Wang, L.; Cao, H.; Li, Y.R.; Feng, B.F.; Qiu, H.; Zhang, H.R. Attribution Analysis of Runoff in the Upper Reaches of Jinsha River, China. Water 2022, 14, 2768. [Google Scholar] [CrossRef]
  18. Zhang, C.; Wu, C.S.; Peng, Z.D.; Kuai, S.Y.; Zhang, S.H. Synergistic Effects of Changes in Climate and Vegetation on Basin Runoff. Water Resour. Manag. 2022, 36, 3265–3281. [Google Scholar] [CrossRef]
  19. Mo, C.X.; Lai, S.F.; Yang, Q.; Huang, K.K.; Lei, X.B.; Yang, L.F.; Yan, Z.W.; Jiang, C.H. A comprehensive assessment of runoff dynamics in response to climate change and human activities in a typical karst watershed, southwest China. J. Environ. Manag. 2023, 332, 117380. [Google Scholar] [CrossRef]
  20. Wang, H.X.; Ma, Y.C.; Yang, H.; Hong, F.T.; Guo, W.X. Quantitative evaluation of the impact of climate change and human activities on Jialing river runoff changes in the past 60 years, China. J. Water Clim. Change 2023, 14, 590–609. [Google Scholar] [CrossRef]
  21. Panditharathne, R.; Gunathilake, M.B.; Chathuranika, I.M.; Rathnayake, U.; Babel, M.S.; Jha, M.K. Trends and Variabilities in Rainfall and Streamflow: A Case Study of the Nilwala River Basin in Sri Lanka. Hydrology 2022, 10, 8. [Google Scholar] [CrossRef]
  22. Li, Y.; Zhao, L.; Zhang, Z.; Li, J.X.; Hou, L.; Liu, J.Q.; Wang, Y.B. Research on the Hydrological Variation Law of the Dawen River, a Tributary of the Lower Yellow River. Agronomy 2022, 12, 1719. [Google Scholar] [CrossRef]
  23. Ji, G.X.; Gao, H.S.; Huang, J.C.; Yang, X.; Zhang, Y.L. Research on Runoff Variation Characteristics and Attribution Analysis in the Upper Yellow River Basin. J. Henan Norm. Univ. (Nat. Sci. Ed.) 2023, 01, 12–19. [Google Scholar]
  24. Banda, V.D.; Dzwairo, R.B.; Singh, S.K.; Kanyerere, T. Separating anthropogenic and climate contributions to streamflow variations in Rietspruit sub-basin, South Africa. Phys. Chem. Earth 2022, 127, 103200. [Google Scholar] [CrossRef]
  25. Wang, L.; Song, X.Y.; Li, L.J.; Zhang, L.; Liu, Y.; Li, H.Y.; Li, Y.L. Variation trend and attribution analysis of runoff in typical small watershed in gully region of the loess. Res. Soil Water Conserv. 2021, 28, 48–53+69. [Google Scholar]
  26. Zhang, H.Z.; Zhao, W.J. Quantitative Analysis of Annual Precipitation in Extreme Precipitation Areas. Environ. Resour. Ecol. J. 2022, 6, 90–94. [Google Scholar]
  27. Das, S.; Scaringi, G. River flooding in a changing climate: Rainfall-discharge trends, controlling factors, and susceptibility mapping for the Mahi catchment, Western India. Nat. Hazards 2021, 109, 2439–2459. [Google Scholar] [CrossRef]
  28. Talukdar, S.; Pal, S.; Shahfahad; Naikoo, M.W.; Parvez, A.; Rahman, A. Trend analysis and forecasting of streamflow using random forest in the Punarbhaba River basin. Environ. Monit. Assess. 2022, 195, 153. [Google Scholar] [CrossRef] [PubMed]
  29. Zhang, L.R.; He, Y.H.; Tang, Y.P.; Wang, G.Q. Research on key technologies of Haihe River Basin runoff change trend and change attribution. In Proceedings of the Future-Oriented Water Security and Sustainable Development—Proceedings of the 14th China Water Forum, Changchun, China, 25 August 2016; pp. 117–125. [Google Scholar]
  30. Liu, W.L.; Liu, L.N.; Wu, B. Analysis of dry runoff change characteristics and influencing factors in the lower reaches of the main stream of the Ganjiang River. Hydrology 2022, 42, 89–96. [Google Scholar]
  31. Pan, B.; Han, M.; Wei, F.; Tian, L.X.; Liu, Y.T.; Li, Y.L.; Wang, M. Analysis of the Variation Characteristics of Runoff and Sediment in the Yellow River within 70 Years. Water Resour. 2021, 48, 676–689. [Google Scholar] [CrossRef]
  32. Zhang, G.H.; Ding, W.F.; Liu, H.Y.; Liang, Y.; Xu, L.; Zhang, O.Y. Quantifying Climatic and Anthropogenic Influences on Water Discharge and Sediment Load in Xiangxi River Basin of the Three Gorges Reservoir Area. Water Resour. 2021, 48, 204–218. [Google Scholar] [CrossRef]
  33. Jin, S.F.; Zheng, Z.Y.; Ning, L.K. Separating variance in the runoff in Beijing’s river system under climate change and human activities. Phys. Chem. Earth 2021, 123, 103044. [Google Scholar] [CrossRef]
  34. Shao, Y.T.; He, Y.; Mu, X.M.; Zhao, G.J.; Gao, P.; Sun, W.Y. Contributions of climate change and human activities to runoff and sediment discharge reductions in the Jialing River, a main tributary of the upper Yangtze River, China. Theor. Appl. Climatol. 2021, 145, 1437–1450. [Google Scholar] [CrossRef]
  35. Qi, L.L.; Guo, Z.L.; Qi, Z.X.; Guo, J.J. Prospects of Precipitation Based on Reconstruction over the Last 2000 Years in the Qilian Mountains. Sustainability 2022, 14, 10615. [Google Scholar] [CrossRef]
  36. Guo, W.X.; He, N.; Ban, X.; Wang, H.X. Multi-scale variability of hydrothermal regime based on wavelet analysis—The middle reaches of the Yangtze River, China. Sci. Total Environ. 2022, 841, 156598. [Google Scholar] [CrossRef]
  37. Sun, N. Consistency Test of Natural Runoff Series. Shanxi Water Conserv. Sci. Technol. 2015, 04, 68–70. [Google Scholar]
  38. Yang, D.; Liu, H.M.; Guo, P.P.; Zheng, F.J.; Liu, Q. The change of rainfall in Liaoning Province in recent 53 years from 1956 to 2008. Resour. Environ. Arid. Reg. 2011, 25, 002. [Google Scholar]
  39. Lozowski, E.P.; Charlton, R.B.; Nguyen, C.D.; Wilson, J.D. The Use of Cumulative Monthly Mean Temperature Anomalies in the Analysis of Local Interannual Climate Variability. J. Clim. 1989, 2, 1059–1068. [Google Scholar] [CrossRef]
  40. Shu, M.Z.; Liu, L.H. Temporal and spatial variation characteristics of rainfall in the Haihe River Basin in recent 51 years. South–North Water Divers. Water Conserv. Sci. Technol. 2015, 13, 009. [Google Scholar]
  41. Hu, D.L.; Yan, D.H.; Song, X.S.; Zhang, M.Z.; Yu, X.; Yang, S.Y. Analysis on the changing trend of water resources in the Yangtze River Basin above Yibin. South–North Water Divers. Water Conserv. Sci. Technol. 2008, 02, 21. [Google Scholar]
  42. Li, L.; Wu, X.J.; Zhou, X.D.; Dong, Y.; Zhang, F.P.; Zhang, Y.N.; Liu, J. Analysis of river runoff evolution characteristics in coal mining area based on Morlet wavelet theory. Hydropower Energy Sci. 2022, 40, 37–40. [Google Scholar]
Figure 1. Locations of meteorological stations in the Zhang River Basin and its upstream.
Water 15 02521 g001
Figure 2. The results of the MK trend analysis of rainfall-runoff in the Zhang River Basin. (a) Pingshun station; (b) Lucheng station; (c) Huguan station; (d) Changzhi station; (e) Zhangzi station; (f) Tunliu station; (g) Xiangyuan station; (h) Licheng station; (i) Guantai station.
Water 15 02521 g002aWater 15 02521 g002b
Figure 3. The results of MK trend analysis of rainfall-runoff in the Zhang River Basin. (a) Pingshun station; (b) Lucheng station; (c) Huguan station; (d) Changzhi station; (e) Zhangzi station; (f) Tunliu station; (g) Xiangyuan station; (h) Licheng station; (i) Guantai station.
Water 15 02521 g003aWater 15 02521 g003b
Figure 4. The double mass curve of annual runoff at Guantai station and annual rainfall in the upper reaches of the Zhang River. (a) Pingshun station; (b) Lucheng station; (c) Huguan station; (d) Changzhi station; (e) Zhangzi station; (f) Tunliu station; (g) Xiangyuan station; (h) Licheng station.
Water 15 02521 g004
Figure 5. The contour map of wavelet coefficients of the rainfall stations and hydrological stations in the upper reaches of the Zhang River. (a) Pingshun station; (b) Lucheng station; (c) Huguan station; (d) Changzhi station; (e) Zhangzi station; (f) Tunliu station; (g) Xiangyuan station; (h) Licheng station; (i) Guantai station.
Water 15 02521 g005
Figure 6. The map of wavelet variance of the rainfall stations and hydrological stations in the upper reaches of the Zhang River. (a) Pingshun station; (b) Lucheng station; (c) Huguan station; (d) Changzhi station; (e) Zhangzi station; (f) Tunliu station; (g) Xiangyuan station; (h) Licheng station; (i) Guantai station.
Water 15 02521 g006aWater 15 02521 g006b
Table 1. Overview of meteorological and hydrological stations in the irrigation district.
TypeStation NameStation NumberLongitude (E)Latitude (N)Time Period of Measured Data
rainfall stationPingshun station53,888113.2636.121957–2020
Lucheng station53,880113.1436.21976–2020
Huguan station53,885113.1236.071961–2020
Changzhi station53,882113.0236.041973–2020
Changzi station53,873112.5236.061965–2020
Tunliu station53,879112.5336.191971–2020
Xiangyuan station53,884113.0236.311957–2020
Licheng station53,878113.2336.311958–2020
hydrologic stationGuantai station36,255114.0836.321962–2020
Table 2. The mutation test results of the rainfall-runoff trend in the irrigation district.
TypeStation NameMann−Kendall Trend TestAccumulated
Variance
Trend Test
Statistic
Year of Mutation PointMutation Point
Statistic
TrendsYear of Mutation Point
rainfall stationPingshun station−0.491977 *, 1988 *, 2000 *+2.18, −2.06, −2.02decreased1976
Lucheng station1.631977 *, 1979 *+2.08, −2.04raised1992
Huguan station−0.391977 *+1.98decreased1976
Changzhi station0.18\\raised1976
Changzi station−0.53\\decreased1976
Tunliu station−0.661981 **, 2013 *−2.57, −1.98decreased1976
Xiangyuan station−0.711987 *−2.05decreased1976
Licheng station−1.06\\decreased1976
hydrologic stationGuantai station−3.92 **1969 *, 1977 **−2.29, −2.39decreased1977
Notes: * Statistically significant trends at the 5% significance level. ** Statistically significant trends at the 1% significance level. The statistical value is positive, indicating an increasing trend, and vice versa.
Table 3. The contribution rate of rainfall variation and human activities to runoff variation in the research area.
Rainfall Station-Hydrological
Station
PeriodObserved Value
(m3/s)
Simulated Value
(m3/s)
Runoff Variation Value
(m3/s)
RainfallHuman Activities
Variation (m3/s)Contribution Rate (%)Variation (m3/s)Contribution Rate (%)
Pingshun Station-Guantai Station1962–197711,034.6012,049.70215.8583.7338.79132.1261.21
1977–202010,818.7510,950.87
Huguan Station-Guantai Station1962–197711,034.6011,748.48215.85105.1248.70110.7351.30
1977–202010,818.7510,929.48
Changzhi Station-Guantai Station1973–197711,034.6010,835.78215.85103.6948.04112.1651.96
1977–202010,818.7510,930.91
Zhangzi Station-Guantai Station1965–197711,034.6011,105.96215.8591.9442.60123.9157.40
1977–202010,818.7510,910.70
Tunliu Station-Guantai Station1971–197711,034.6010,899.02215.8582.3738.16133.4861.84
1977–202010,818.7510,901.13
Xiangyuan Station-
Guantai Station
1962–197711,034.6011,770.28215.8582.8038.36133.0561.64
1977–202010,818.7510,901.56
Licheng Station-Guantai Station1962–197711,034.6011,905.22215.8563.1329.25152.7270.75
1977–202010,818.7510,881.89
Average 215.8587.5440.55128.3159.46
Disclaimer/Publisher’s Note: The statements, opinions and data contained in all publications are solely those of the individual author(s) and contributor(s) and not of MDPI and/or the editor(s). MDPI and/or the editor(s) disclaim responsibility for any injury to people or property resulting from any ideas, methods, instructions or products referred to in the content.