Article

Real-Time Control Operation Method of Water Diversion Project Based on River Diversion Disturbance

1
College of Hydrology and Water Resources, Hohai University, Nanjing 210098, China
2
State Key Laboratory of Simulation and Regulation of Water Cycle in River Basin, China Institute of Water Resources and Hydropower Research, Beijing 100038, China
3
School of Civil Engineering, Shandong University, Jinan 250061, China
*
Author to whom correspondence should be addressed.
Water 2023, 15(15), 2793; https://doi.org/10.3390/w15152793
Submission received: 12 June 2023 / Revised: 26 July 2023 / Accepted: 28 July 2023 / Published: 2 August 2023
(This article belongs to the Special Issue Advances in Hydrology: Flow and Velocity Analysis in Rivers)

Abstract

:
Changes in water diversion flow are the major disturbance sources in the daily operation of water diversion projects. Ensuring efficient and safe project operation while dealing with different degrees of water diversion disturbance is crucial for real-time control operation. Based on the historical water diversion projects in China and abroad, this study constructs the water diversion disturbance conditions, selects the typical disturbance lines, and constructs the control objectives for different water diversion disturbance lines. The discrete state space equation of the multi-channel pool integral time-delay model is introduced and used as the system prediction model. Concurrently, the simulation results of the river channel hydrodynamic model are used to correct the system state. The model predictive control algorithm is established according to the objective functions of different typical water distribution disturbance lines, and the control strategy of the control gate and pump station along the water diversion project is formulated to assist in the decision making of the project scheduling operation scheme. The proposed method can better cope with different degrees of river diversion disturbance, compensate for the loss of control performance caused by the low accuracy of the generalized model simulation, and improve water level control and sluice regulation.

1. Introduction

In recent years, increases in the scale of water diversion projects [1] and the complexity of water diversion lines [2] have gradually increased the difficulty of dispatching operations. Traditional scheduling operation modes depend to a large extent on manual operation; the accuracy of the control process is low [3] and the operation and management cost is high. As the main source of disturbance in the daily operation of water diversion projects, changes in water intake flow at the diversion outlet may lead to problems such as regulation failure, inefficient operation of cascade pumping stations, and instability of project operations. Therefore, it is crucial to improve the anti-water disturbance ability and control efficiency of engineering control operations [4].
The early canal automatic control algorithm uses an inverse solution based on the Saint-Venant equation [5] to calculate the strategy of the control building, including the gate-stroking algorithm [6]. The constant water level control method (CLIS) [7] is based on the inverse solution. However, this algorithm is limited by engineering constraints and sometimes produces unstable or infeasible solutions [8]. To ensure the stability of the solution results of the regulation process of a canal water conveyance system, Bautista et al. [9] proposed a volume compensation algorithm to solve the flow compensation process. This approach was based on the volume difference between two stable states. The actual operation of a canal water conveyance system is often subject to complex disturbances [10] and the model parameters change with time [11]. Therefore, feedforward control is limited by the degree [12] of reflection of the model on the system characteristics and physical laws, proving that the resolved control operation scheme has limitations.
Considering the above problems, feedback control provides an effective response method. Using the proportional-integral-derivative (PID) [13] automatic control algorithm, the control variables can be adjusted for the control error of the system output, and the system control strategy can be generated in real time. The PID control has been successfully applied to the Dez irrigation canal in Iran [14] and the New South Wales irrigation canals in Australia [15]. Additionally, the PID control algorithm has a positive effect [16] on a single canal pool or control building. The actual canal water conveyance system engineering structure is complex, with multilevel channel series and parallel structures [17]. In view of the problems, model predictive control considers the simulation error of the prediction model and the complex disturbance in the actual scheduling operation process [18]. According to the complex engineering topology, the system prediction model [19] is customized to eliminate unnecessary intermediate calculation steps. The rolling optimization strategy [20] is used to correct the system state regularly, and the system control action [21] is generated online to minimize the simulation error. Consequently, the adjustment effect is significantly improved. In response to the disturbance of water diversion, Hashemy et al. [14] proposed a model predictive control algorithm using the storage strategy of a water transmission line. The excess water is stored through the channel to compensate for the water demand of the water diversion outlet and the downstream flow demand during the flow delay time after the disturbance of water diversion. Zheng et al. [22] constructed a large-scale system decomposition and coordination model based on the principle of time-of-use electricity prices and achieved the global economic operation of cascade pumping stations in water diversion projects according to the flow optimization distribution results of single-stage pumping station subsystems.
However, the above control algorithms are mostly applied in irrigation canal systems controlled by control gates or a series of open channels controlled by cascade pumping stations. The model predictive control design of the internal control gate and pumping station mixed water conveyance system of the inter-basin water transfer project [23] and the strategy of water distribution disturbance are poorly studied. In this study, based on the existing engineering topology, a discrete state space equation of the multi-channel pool integral time-delay model was constructed, and a model predictive control algorithm was designed according to the objective function under different typical water diversion disturbance lines. A numerical simulation was performed using historical dispatching operation data from the Yangtze River to the Huai River project to verify the effectiveness of the model and algorithm and to assist in the decision making of the project scheduling operation plan.

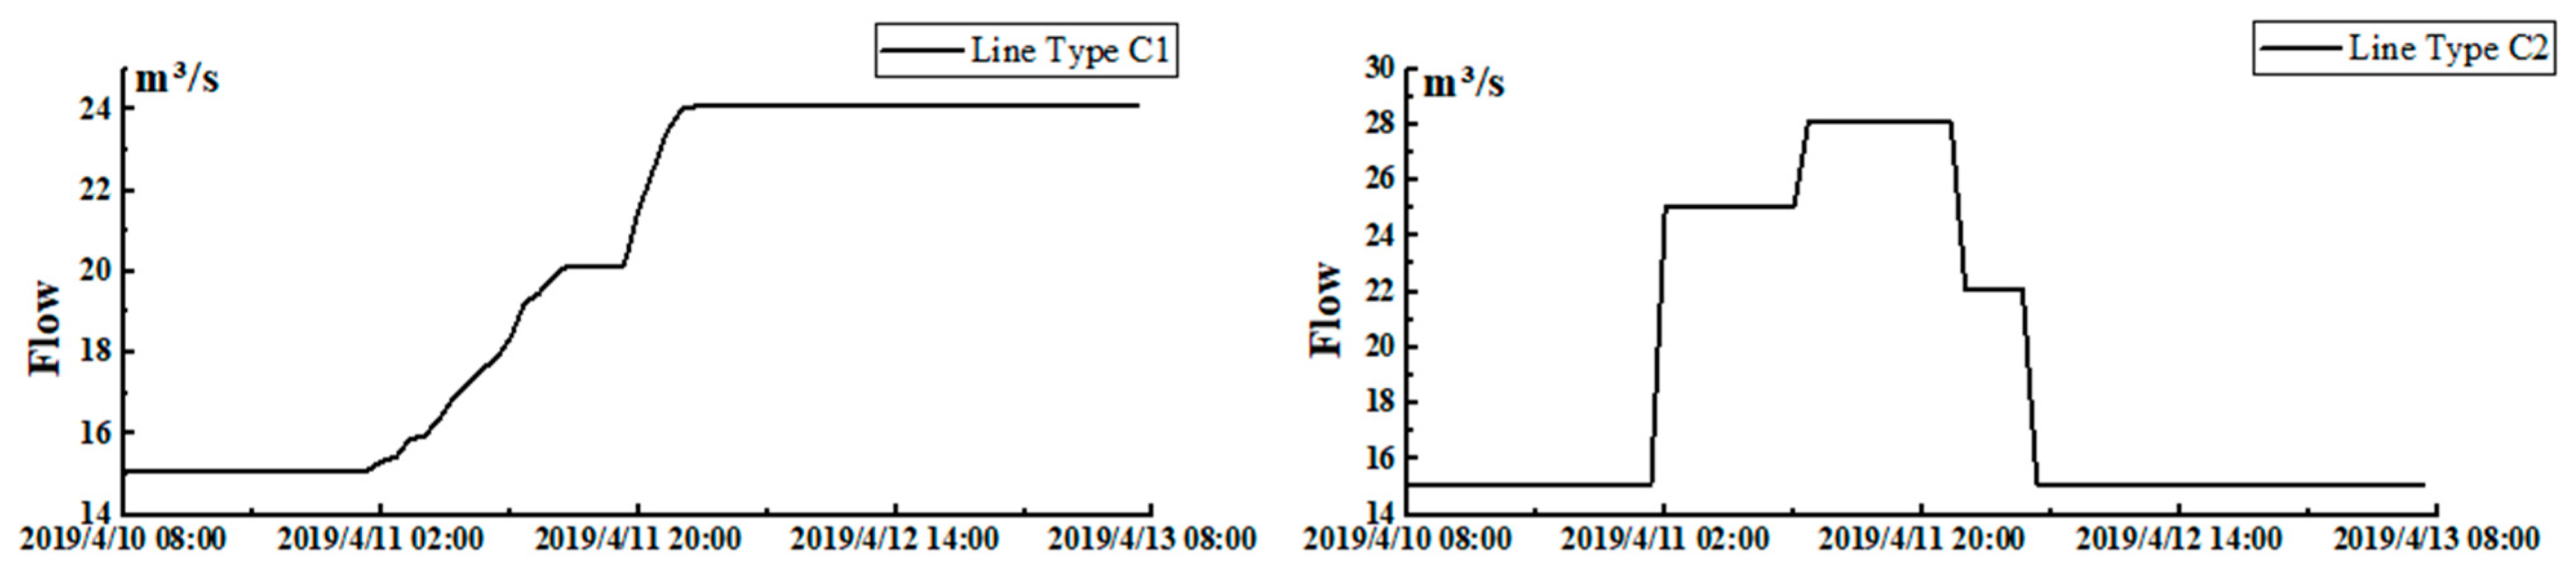
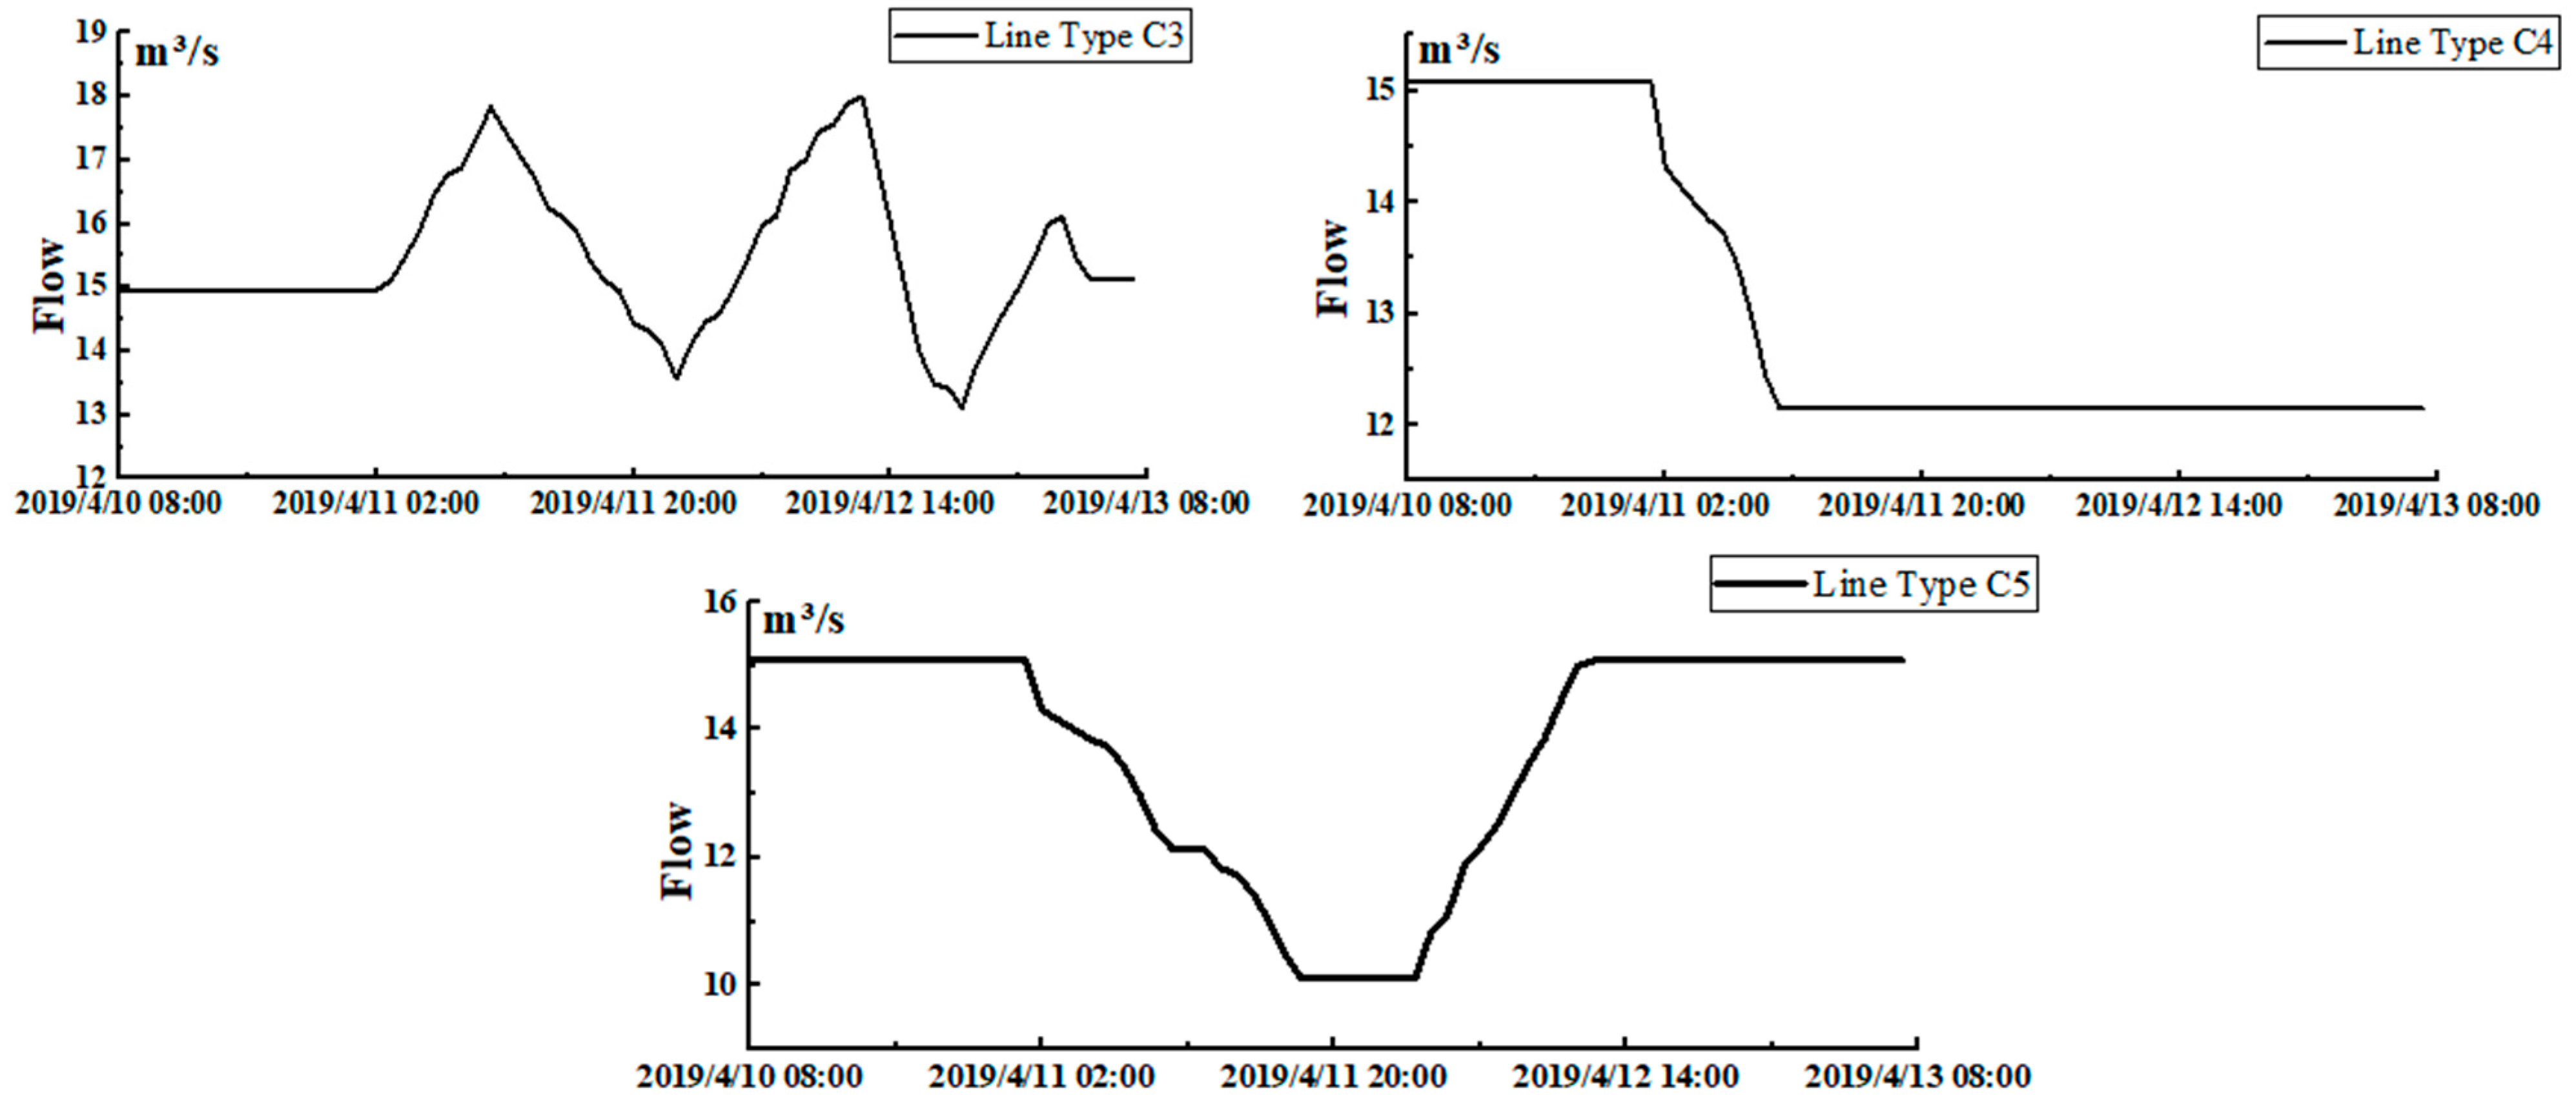
2. Analysis of Typical Water Diversion Disturbance Conditions

Based on the water use plan and actual water supply process [14,24,25] of water diversion projects and large-scale irrigation canal systems in China and abroad, the linear difference and disturbance characteristics of the intake process of diversion outlets are analyzed in terms of diversion flow change rate, change duration, channel flow, and the proportion of water diversion change relative to channel flow [10]. According to the variation amplitude and trend of the diversion disturbance and the linear characteristics of the water intake process, the diversion disturbance of the river channel is divided into the following five categories: (C1) According to the water use plan of the diversion and the optimal allocation of water resources in the receiving area, the intake flow of the diversion is increased by combining the engineering control threshold and the flow adjustable interval under current conditions and restored to stable levels after meeting the water demand of the diversion. (C2) During the peak period of urban water use, the intake flow of the inlet is increased to accommodate the sudden and temporarily increased demand of the inlet. After meeting the temporary water demand, the diversion process is restored to the original stable state by reducing the intake flow. (C3) Due to changes in channel water levels and the frequent regulation of the diversion sluice, the intake flow of the diversion gate fluctuates. The accuracy of the control action is improved by reducing the regulation frequency of the diversion sluice to restore the diversion process to the original stable state. (C4) The water demand of the inlet is reduced, as is the intake flow of the inlet. After reaching its planned water demand flow, the intake process returns to a stable state. (C5) The downstream diversion outlet of the canal pool is affected by the peak period of urban water use, which increases demand. To balance the supply and distribution volume of the diversion outlet along the project without destroying the original steady state of the project, the diversion flow in the canal pool is reduced. After the downstream demand has stabilized, the diversion process is adjusted to return to the original steady state. The specific disturbance characteristics are shown in Table 1.
According to the above water diversion disturbance conditions, typical disturbance lines were selected (Figure 1). Among them, the line type C2 has a few changes but with sudden major fluctuations in the water flow rate, so its disturbance intensity is large and its disturbance frequency is low. The disturbance intensity of the line type C3 is low but the disturbance frequency is high, with gradual fluctuations. Compared with other disturbance line types, the above two line types are representative in terms of disturbance duration, intensity, and frequency. Based on this, the corresponding objective function and constraint conditions were set up for different disturbance line types to eliminate the influence of typical water diversion disturbance on the levels of the canal pool, ensuring the economic and efficient operation of the cascade pumping station and improving the water level control and pumping station and gate control effect of the water diversion project.

3. Materials and Methods

The real-time control operation method of a water transfer project based on river diversion disturbance takes the water level prediction results upstream and downstream of the project line, the engineering design parameters of the control buildings and channel sections as the input, and the discrete state space equation of the integrated time-delay model of the multi-channel pool as the prediction model. According to the control objectives under different typical diversion disturbance lines, the model predictive control algorithm is constructed to optimize the control strategy of pump stations and the control gate and the process of changes in upstream and downstream water levels and flow rates, thereby assisting dispatchers in making decisions on engineering scheduling and operation plans [26]. The specific calculation process is shown in Figure 2.

3.1. Integrator-Delay Model

The Integrator-Delay Model is a simulation model that describes the change in system structure and function with time. The accuracy of the simulation model is important to optimize the calculated results. The flow and water level status in the open channel can be described by the Saint-Venant (SV) equation [27]. However, the SV equation—as a simulation model inside the model predictive control mode (MPC)—has a long calculation time and slow speed, which cannot meet the rapid simulation requirements of automatic control algorithms. Therefore, this study used the integral delay (ID) model instead of the river hydrodynamic model to quickly simulate the river channel water conveyance process and provide the basis for the design of the MPC. The integral time-delay model [28] generalizes the channel into a uniform flow area and a backwater area and assumes that they are time-delay and integral processes, respectively. The specific structure is shown in Figure 3, and the integral delay equation of the channel is as follows:
q fa ( t ) = q in ( t τ ) dy ( t ) d t = 1 A s q fa ( t ) q out ( t ) q d ( t )
In the formula, y is the water level of the downstream control point, m; t is time in s; A S is the water surface area of the backwater area in m 2 ; q i n , q o u t , q f a , and q d are the inflow and outflow of the canal pool, backwater area inflow, and the variation in water flow relative to the initial stable state in m3/s, respectively. Finally, τ is the time delay in the uniform flow region in s. The integral time-delay model includes two parameters: backwater area and time delay. In this study, the characteristic parameters were identified using a parameter identification method [29] via unsteady flow simulation.
For a multilevel series channel, it is necessary to describe the physical relationship between the series channel pools and establish the state-space equation of the multi-channel pool integral time-delay model. The discrete form of the state-space equation is:
x ( k + 1 ) = A x ( k ) + B u u ( k ) + B d d ( k )
where k is the time step; x ( k ) is the state variable; u ( k ) and d ( k ) are the control variables; A is the system matrix; and B is the control matrix. The water level y ( k ) at time k, water level amplitude y k = y k y k 1 , and pre-controlled inflow amplitude q i n k i = q i n k i q i n k i 1 were selected as the state variables. The current-controlled inflow amplitude q i n k , current-controlled outflow amplitude q o u t k , and current-controlled flow amplitude q d k were selected as the control variables. The state-space equation for a single-channel pool is as follows:
y ( k + 1 ) Δ y ( k + 1 ) Δ q i n ( k ) Δ q i n ( k 1 ) Δ q i n ( k k τ + 1 ) = 1 1 0 Δ t A s 0 1 0 Δ t A s 0 0 0 0 0 0 1 0 . . . . . . . . . . 0 0 1 0 y ( k ) Δ y ( k ) Δ q i n ( k 1 ) Δ q i n ( k 2 ) Δ q i n ( k k τ ) 0 1 1 0 1 1 1 0 0 . . . . . . . . . 0 0 0 Δ q i n ( k ) Δ q o u t ( k ) Δ q d ( k )
Assuming that the multilevel series canal is composed of m canal basins, the discrete state-space equation of the multistage series canal basin can be obtained:
x 1 ( k + 1 ) x 2 ( k + 1 ) x m ( k + 1 ) = x 1 ( k ) x 2 ( k ) x m ( k ) A 1 A 2 A m T + u 1 ( k ) u 2 ( k ) u m ( k ) B u 1 B u 2 B u 3 T + d 1 ( k ) d 2 ( k ) d m ( k ) B d 1 B d 2 B d m T

3.2. Objective Function and Constraint

The goal of real-time control operations of water diversion projects is to consider the upstream and downstream water level constraints of the project hub under the premise of ensuring water demand along the line and to make rational use of the regulation and control capabilities of the project hubs at all levels along the line, and in doing so, realizing the steady state of river channel water delivery and the rapid transition of the high-efficiency area of pumping station operation under the premise of maintaining stable changes in water levels. In this study, control objectives were constructed for different typical water diversion disturbance lines. The objective function adopts a hierarchical structure, and the order optimization calculation is conducted according to the target priority and guarantee degree. The specific forms are as follows:

3.2.1. Disturbance Line Type (C2)

Level 1: constraint guarantee objectives
min ( ω i = 1 N t = 1 T | L i , t d e v | + t = 1 T | Q t tar Q t | )
In the formula, L i , t d e v is the water level constraint violation (WLCV) value at the time t of the control section; Q t t a r is the water flow required at the target end section in m3/s; Q t is the flow rate of the target end section in m3/s; and ω is the weight coefficient, which is a maximum value. The purpose is to maximize the WLCV value of the canal pool.
Level 2: water level control target
min ( t = 1 , T i = 1 N L i , t sec L i , t 1 sec )
In the formula, L i , t s e c and L i , t 1 s e c are the water level at time t and time t − 1 of the internal control section of the ith canal pool, respectively, m; t s t and t e d are the start and end time of water disturbance, respectively.
Level 3: economic operation target of cascade pumping stations
max ( ω i N η p , i av N + η p min + μ η p s a v )
In the formula, N is the number of pumping stations; η p , i a v is the average efficiency of the ith pumping station, expressed as %; η p m i n is the minimum operating efficiency of all pumping stations during the scheduling period (%); η p s a v is the average operating efficiency of cascade pumping stations during the scheduling period (%); and ω and μ are weight coefficients, where ω is 0.6 and μ is 0.4.
Among them, Level 1 enables the water diversion project to meet the water demand of the end surface and the water level constraints. Level 2 minimizes the hourly water level variation in the canal pool under the premise of meeting the water flow and level constraints of the end surface. By reducing the amplitude of water level fluctuations, the level of the channel pool is quickly restored to stability after the diversion disturbance. Level 3 guides the cascade pumping station to transition from the original to the new high-efficiency area during the transition to the steady state of water conveyance following diversion disturbance.

3.2.2. Disturbance Line Type (C3)

Level 1: water level stability duration control target
max ( μ ( T i n i min + i = 1 N T i i n i / N ) + ω ( T e n d min + i = 1 N T i e n d / N ) )
In the formula, T i n i m i n is the shortest stable time in all canal pools at the beginning of the forecast period, in hours (h); T i i n i is the stable time of the water level of the first canal pool in the initial stage of the forecast period (h); T e n d m i n is the shortest stable time in all canal pools at the end of the forecast period (h);   T i e n d is the stable time of the water level of the first canal pool at the end of the forecast period (h); and ω and μ are weight coefficients, where ω is 0.99 and μ is 0.01.
Level 2: stable operation efficiency control target
max ( i N η p , i s t N + η s t min + T s t min )
The operating efficiency difference between adjacent moments is less than 0.3%, and the operating efficiency of the pumping station is considered stable. N is the number of pumping stations; η p , i s t is the stable operation efficiency of the ith pumping station at the end of the forecast period (%); η s t m i n is the minimum stable operating efficiency of all pumping stations at the end of the foreseeable period (%); T s t m i n is the shortest stable time for the stable operation efficiency of all pumping stations (%).
Constraint 1: control section water level constraint
L i ( t ) L i , max v a ( t ) ( i = 1 ~ N , t = 1 ~ T )
In the formula, L i , m a x v a ( t ) is the maximum water level amplitude at time t of the ith control section, in meters (m); L i ( t ) is the water level variation at time t of the ith control section.
Among them, Level 1 is to increase the stability time of the initial stage of the forecast period under the premise of meeting the water level constraints of the control section. With the forecast period of the model predictive control, under the long-term and low-frequency water diversion disturbance, the control gate and pumping station are guided to continuously take control actions to stabilize the water level of the canal pool during the dispatching period. This is to improve the optimization effect of the algorithm to achieve water level stability during the entire dispatching period. Level 2 increases the stable operation efficiency and the stable duration by increasing the stable operation efficiency at the end of the forecast period. While transitioning to a steady state of water transfer after the water diversion disturbance, it guides the single-stage pumping station inside different canal pools to quickly transition from the original to the new stable operation efficient area.

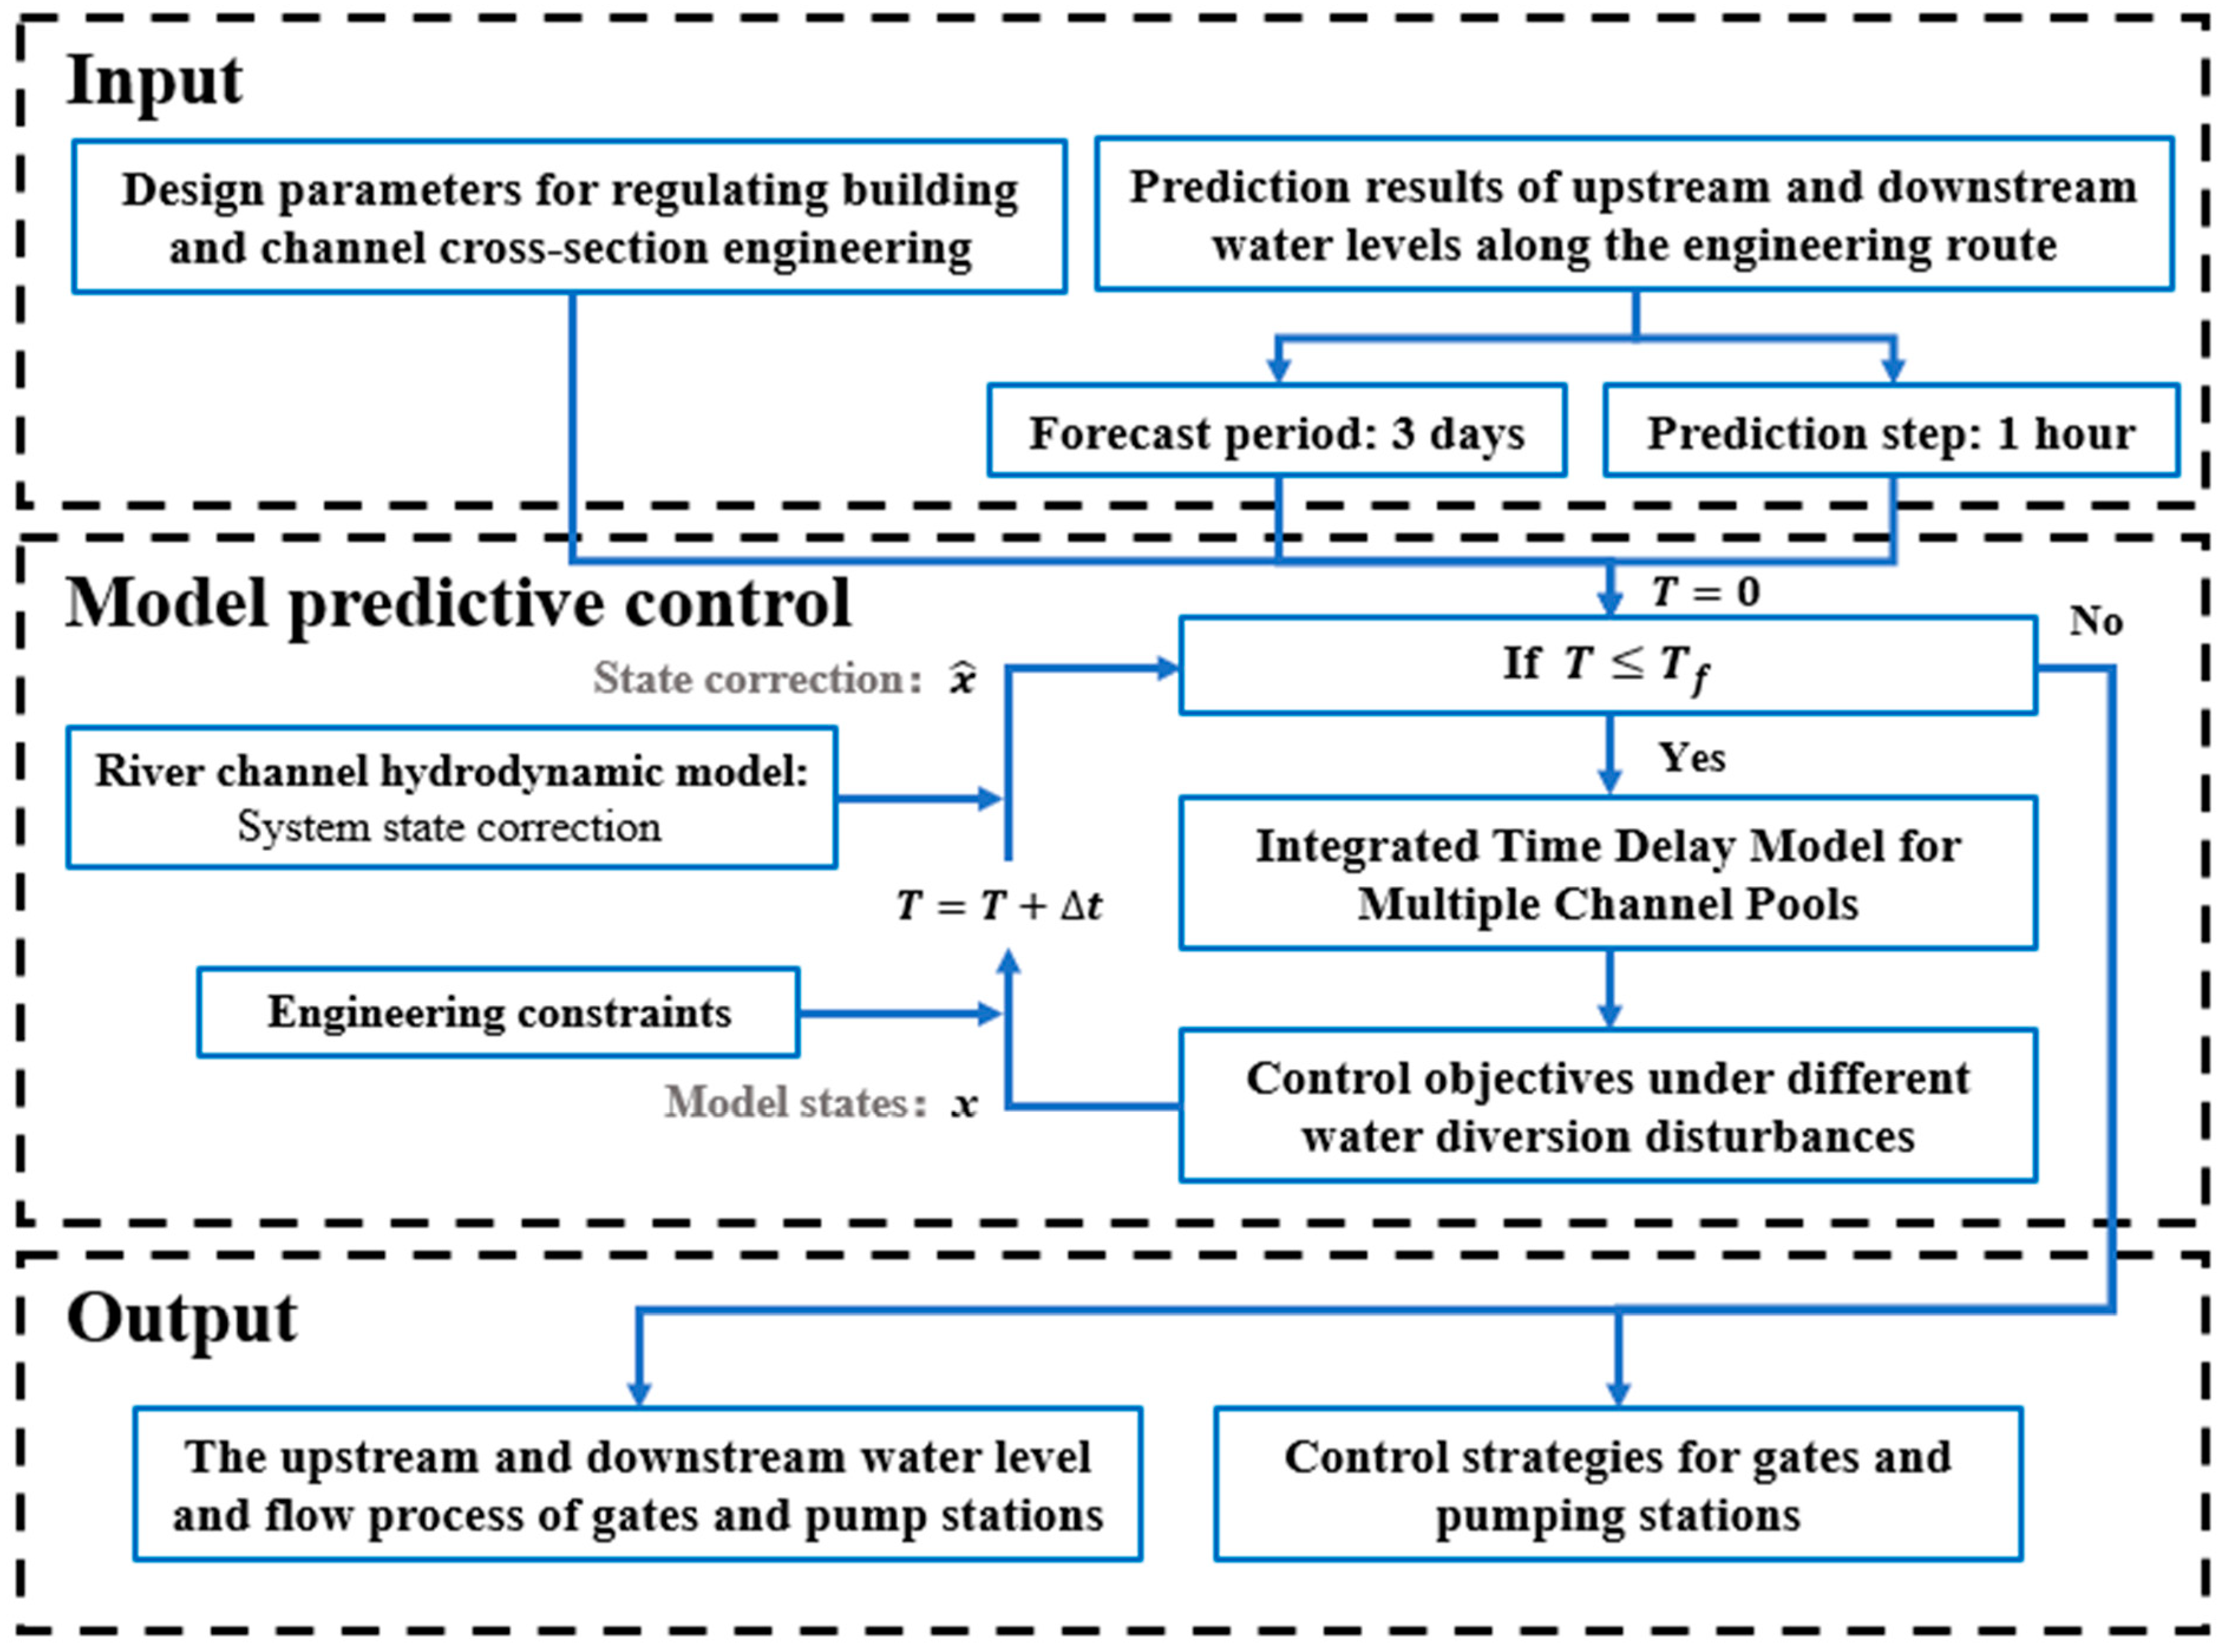
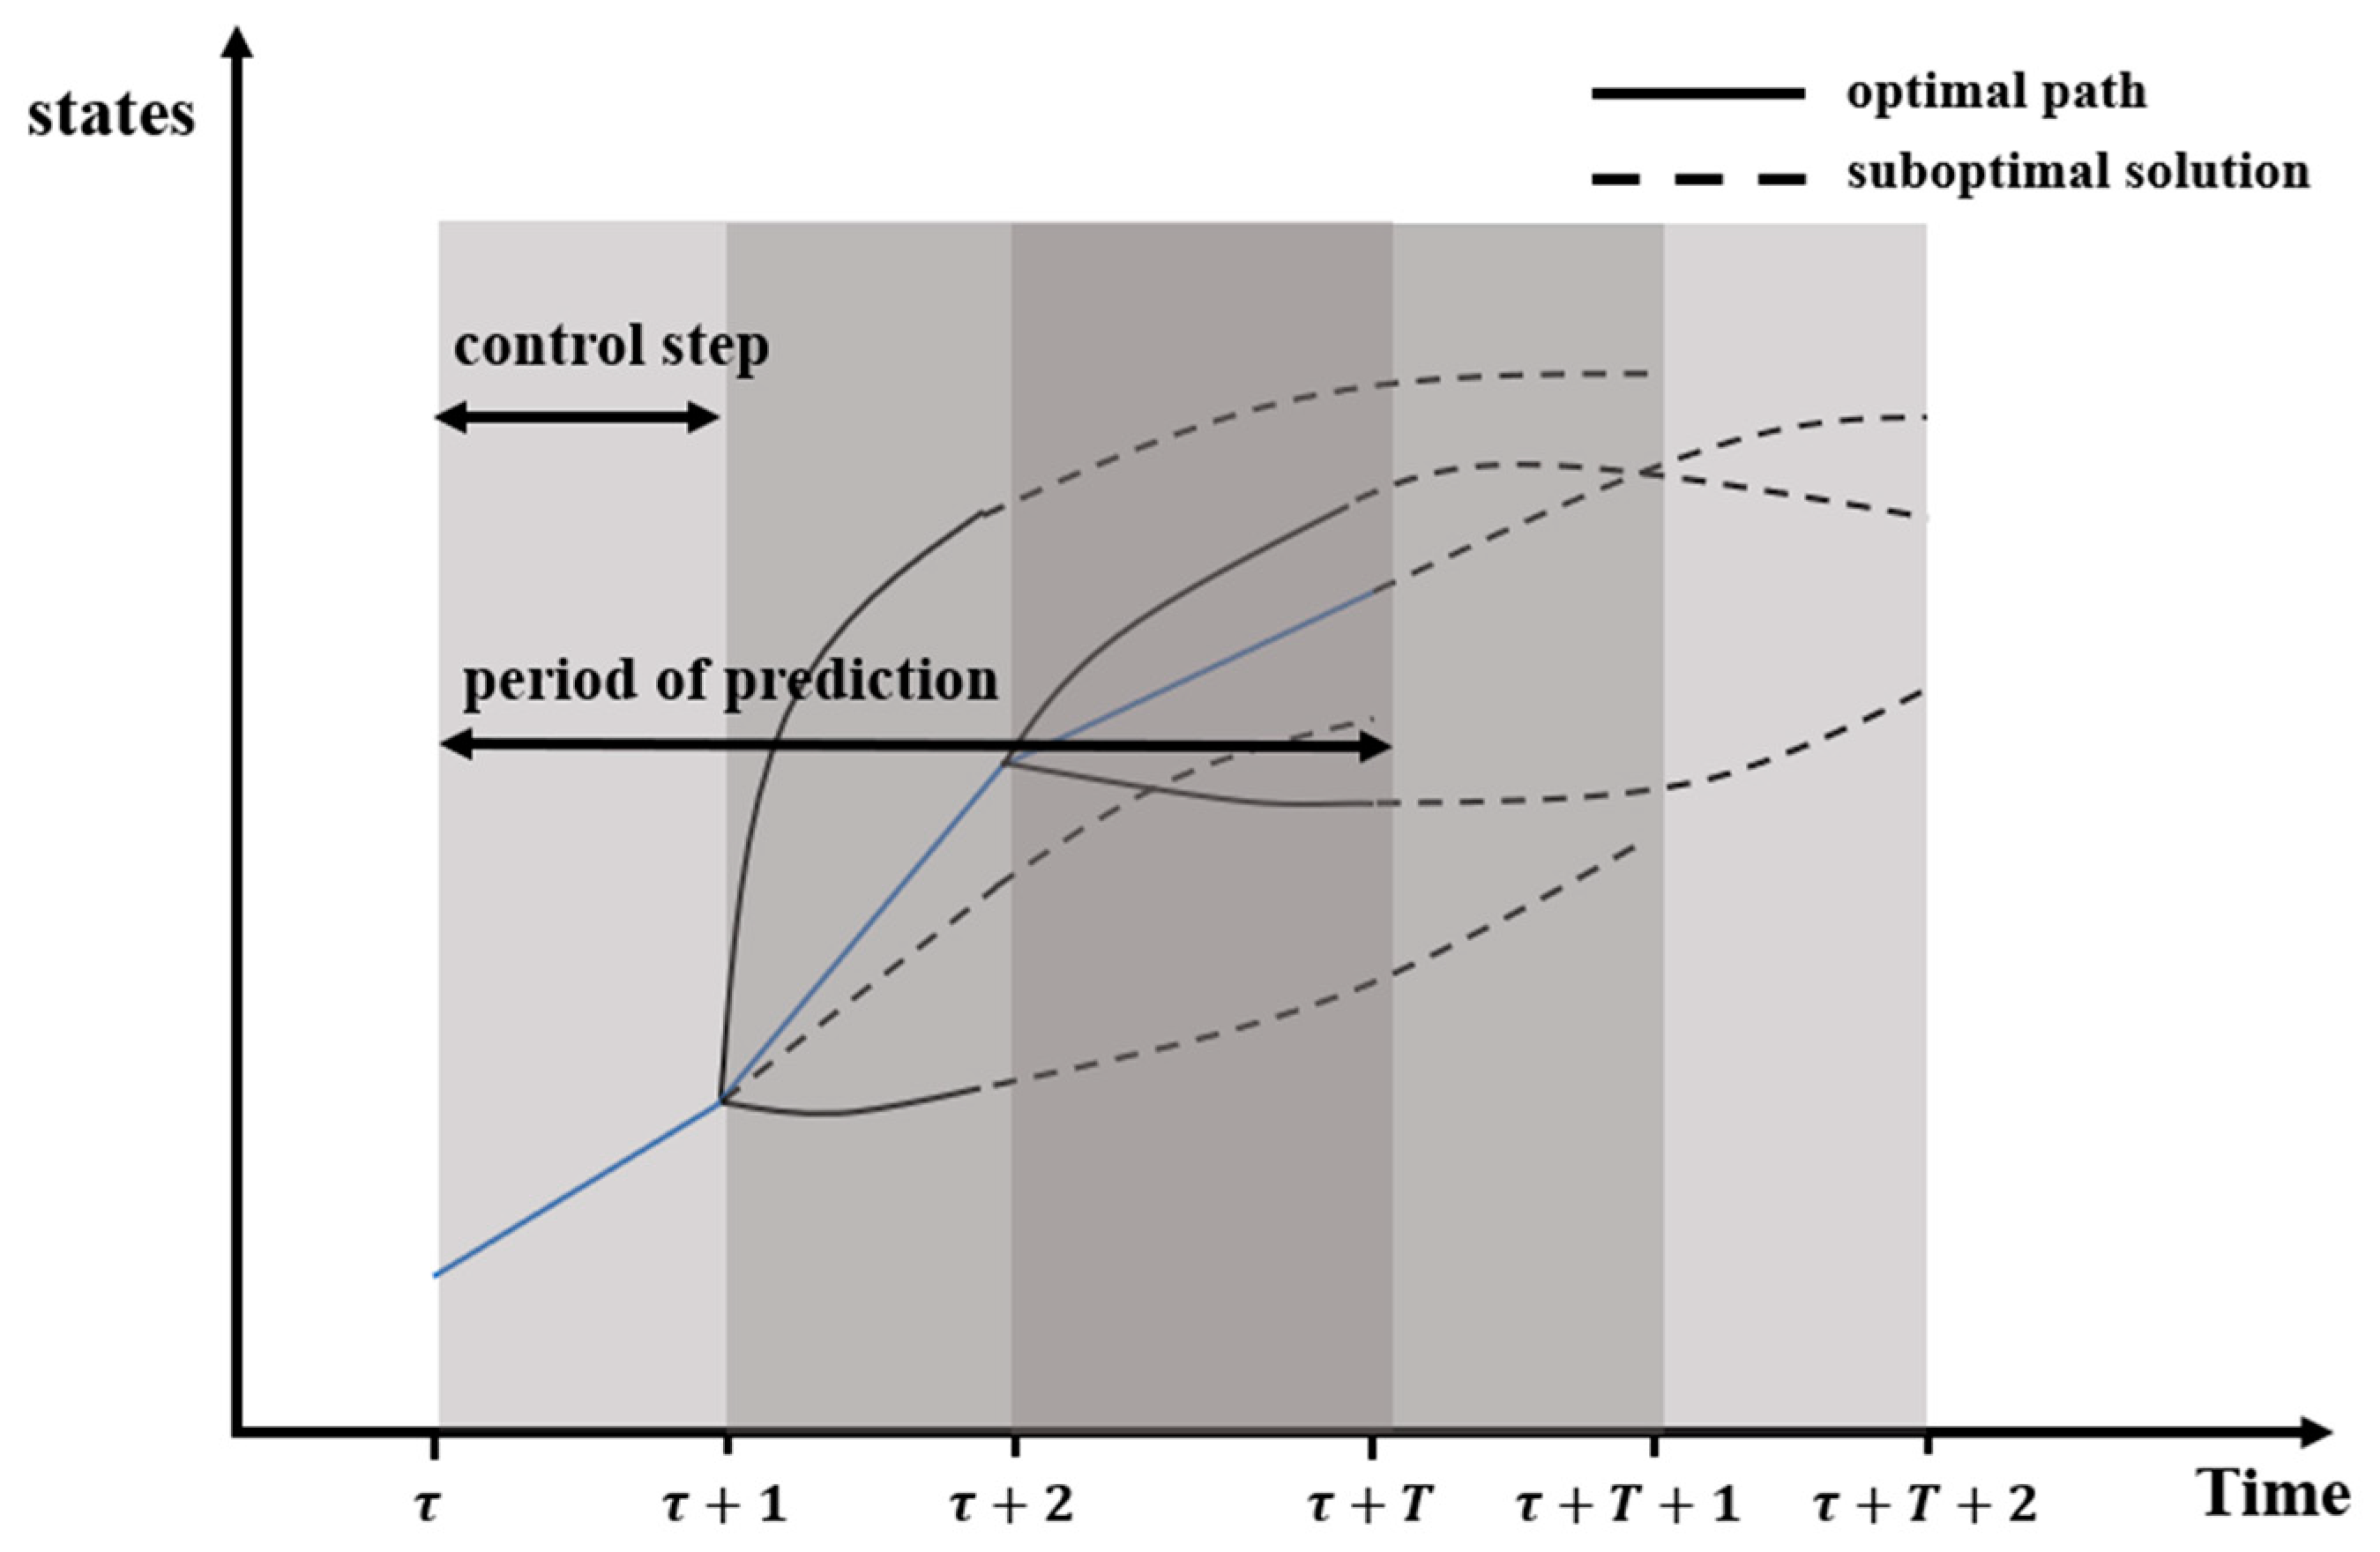
3.3. Model Predictive Control Algorithm

The discrete state space equation of the multi-channel pool integral time-delay model was used as the system prediction model. Taking two adjacent pumping stations and two adjacent gate stations, or adjacent pumping stations and gate stations along the water transfer project, and the channels between them as a canal pool, the generalized inverted siphon, gradient section, diversion, and other internal buildings were coupled with SV equations to construct a one-dimensional hydrodynamic model, and the model simulation results were used for system state correction. According to the objective function and constraint conditions under different typical water distribution disturbance lines, the model predictive control algorithm [30] was constructed to solve the optimal control strategy of control gate and pump station. This was carried out to reduce the amplitude of water level fluctuations in the canal pool during the regulation and control of the gate and the pumping station after the sudden water diversion disturbance. In so doing, the stability time of the water level in the canal pool was shortened, so that the river canal water conveyance system could achieve transition of the steady state of the water conveyance and the high-efficiency area of the pumping station. In this study, the simulation time step was set to 1 h, the control time step to 2 h, and the preview period to 72 h. Based on the optimal control strategy applied to the current time step, the prediction and control calculations were recursively performed backward over time. The specific form is shown in Figure 4. The specific construction form of the model predictive control problem [31] is as follows:
min   J ( x , u , d ) s . t . x ( τ + 1 ) = f ( x ( t ) , u ( t ) , d ( t ) ) x ( τ ) χ ,   τ = t , , t + T u ( τ ) υ ,   τ = t , , t + T x ( 0 ) = x 0
Among them, J is the objective function, including the Formulas (5)~(10),   x R n x is the state of the system at the time step t, and u R n u is the control variable, including the gate opening and the number and angle of the pumping station. d R n d is a sequence of disturbances, including a diversion disturbance. The function f is the system dynamics equation, which contains the Formulas (5)~(7), (8)~(10), and is a nonlinear constraint condition of the system state.

4. Case Study

4.1. Project Profile

The Caizi Lake–Wabu Lake section of the Yangtze River–Huai River Water Diversion Project can be divided into five sections [25] of canals according to the geographical location of the control buildings, including two control gates, two pumping stations, and nine diversion gates. Figure 5 shows the longitudinal profile of the test case. The engineering parameters and channel characteristics of each project hub and channel along the line are shown in Table 2. Considering that the water level prior to Control Gate 1 is mainly affected by the upstream lake, and the influence of the gate regulation process on the water level is not obvious, Control Gate 2 was used as the canal head control gate, and the upstream section was used as the control section to analyze the control effect of the control gate.

4.2. Control Strategy
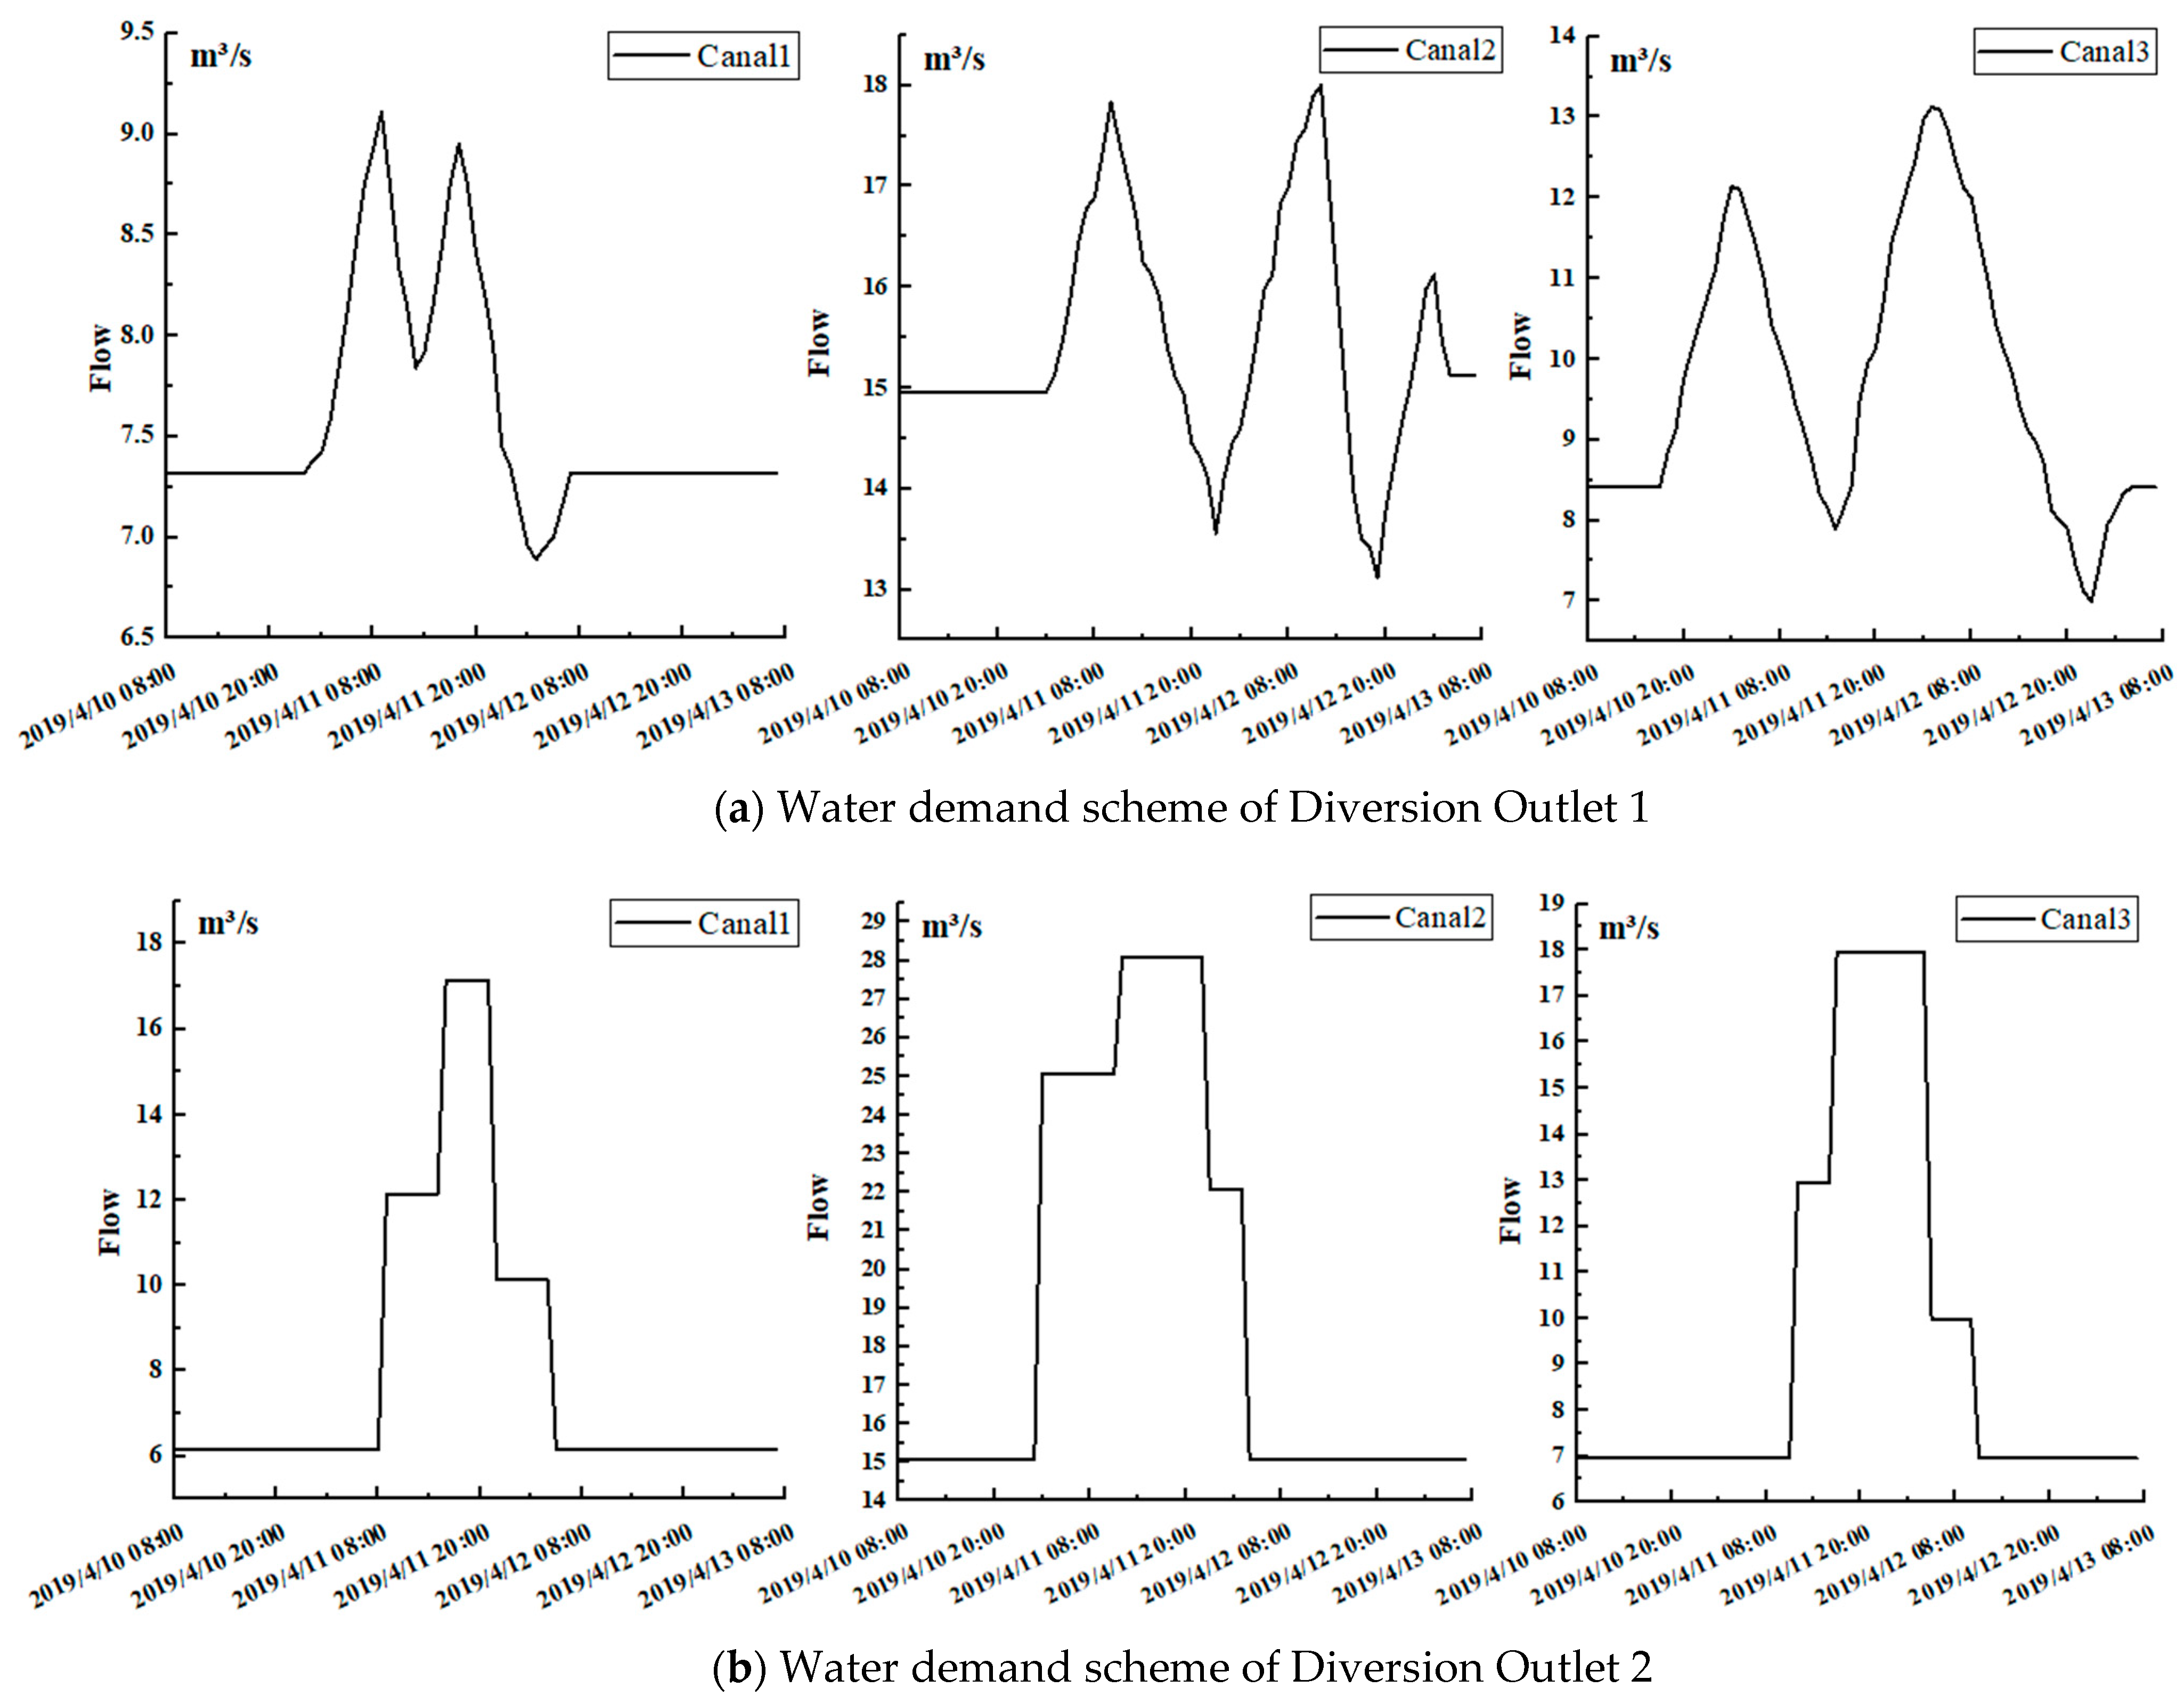
This study compared three control strategies, including local feedback control, conventional optimal scheduling, and model predictive control. The local feedback control mode refers to the actual control process of the local control gate and pump station using the PID control method, and the actual scheduling process is concentrated to 72 h to provide data support for subsequent test cases. The conventional optimal scheduling mode adopts the genetic algorithm, and the daily control process of the control gate and the pumping station is set as the decision variable. The scheduling goal is to maintain the stability of the water level in front of the gate and upstream and downstream of the pumping station, improve the operation efficiency of the cascade pumping station, and ensure the water demand along the project and the end section. The control process of the control gate and pump station along the line is optimized when the engineering constraints along the line are considered. The model’s predictive control mode uses the state space equation of the multi-channel integrated delay model as the forecasting model and explores the genetic algorithm to optimize the control process of the control gate and pump station along the line. Taking the hydrodynamic simulation results of the river channel as the current state of the system, the boundary conditions of the model project are corrected regularly. At the same time, the water demand scheme of the water inlet and the water level prediction results of the upstream and downstream lakes in the foreseeable period are updated, and the control operation scheme of the river channel water conveyance system is generated by rolling optimization.

4.3. Test Scenario

The key point of the real-time control operation of water diversion projects is to generate the best control operation strategy [32] for the control gate and pump station along the main river channel when a sudden water diversion disturbance occurs on the water demand side. In this study, using the historical dispatching operation case set of the Yangtze–Huai River Diversion Project, two water demand schemes for the water diversion gate were constructed based on the characteristics of typical water diversion disturbance lines. To reduce the calculation time of model optimization, the actual scenario of 10 and 15 days was shortened to 72 h. Water Demand Scheme 1 as shown in Figure 6a was used to test the control effect of the control gate and the water level control effect of the canal pool under the long-term low-intensity high-frequency water diversion disturbance by constructing the water diversion flow fluctuation scene in different periods along the canal pool. Water Demand Scheme 2 as shown in Figure 6b was used to test the control effect of the water level of the canal pool under the short-term high-intensity low-frequency water diversion disturbance by constructing a scene where the water diversion flow increases rapidly in different periods of time and recovers stably after a period. The process of water diversion disturbance in each canal pool in Schemes 1 and 2 is shown in Figure 6.
Based on different water demand schemes of the water diversion gates, this study constructed two test scenarios, detailed as follows:
Test Scenario A: This scenario took Water Demand Scheme 1 of the water diversion gate as the boundary condition, and the constant water level control mode in front of the gate was adopted in the canal head control gate. The maximum allowable water level deviation from the target water level was set to 10 cm. The cascade pumping station adopted the control operating water level interval constraint, and the upper and lower thresholds of the interval were set to the design maximum and minimum operating water levels, respectively. The control effect of the model predictive control on the control gate, pump station, and the water level control of the canal pool under long-term, low-intensity, and high-frequency water diversion disturbances was tested.
Test Scenario B: In this scenario, Water Demand Scheme 2 of the water diversion gate was used as the boundary condition, and the control mode of the head control gate and the cascade pumping station was identical to Scenario A. The control effect of the model predictive control on the control gate, pump station, and the water level control of the canal pool under short-term, high-intensity, and low-frequency water diversion disturbance was tested.
On the basis of the above two test scenarios, this study used the conventional optimal scheduling mode (OPT) and the MPC to generate the control operation scheme (72 h) of the water diversion project and compared it with the actual control operation process (ACP) based on local feedback control mode in the process of water level change in the upstream and downstream sections of the project, the process of pump station operation efficiency change, and the operation evaluation index.

4.4. Operational Evaluation Indicators

In this study, the maximum absolute error (MAE) and integral absolute error (IAE) [4] were used to evaluate the regulation effect of the control gate under different control modes. The operation efficiency of the cascade pumping station subsystem ( η p s ) [33] and the operation efficiency of the pumping station ( η p ) [22] were used to evaluate the regulation effect of the pumping station under different control modes. In the process of the dispatching operation, when the water level amplitude of the single time step of the canal pool was less than 0.1 cm, the water level of the canal pool returned to a steady state, and the regulation effect was acceptable. Therefore, the stability time t s [19], from the beginning of the water diversion disturbance to the current moment, was used to evaluate the water level control effect of the transition of the steady state of the river channel.
MAE = max | y t y t a r | y t a r
IAE = Δ t T t = 0 T | y t y tar | y tar
In the formula, y t is the water level of each simulation step; y tar is the target water level in front of the downstream gate of the canal pool; t is the simulation time step; and T is the simulation time (72 h in this study).
η ps = k = 1 n T P k k = 1 n T P k τ = k = 1 n H k k = 1 n H k / η p ( q v , H k ) = k = 1 n ( h k h k τ ) k = 1 n ( h k h k τ ) / η p ( q v , H k )
In the formula, η p s is the efficiency of the pumping station subsystem; T P K is the energy required for the flow to pass through the k-stage pumping station, in Joules (J); T P K τ is the energy consumption of the k-stage pumping station (J); H k is the head of the k-stage pumping station: H k = h k h k τ , in meters (m); h k is the water level of the outlet pool of the k-stage pumping station (m); h k τ is the water level of the intake sump of the k-stage pumping station; and η p ( q v , H k ) is the efficiency value of the combined operation of each unit in the k-stage pumping station under the condition of q v and H k .

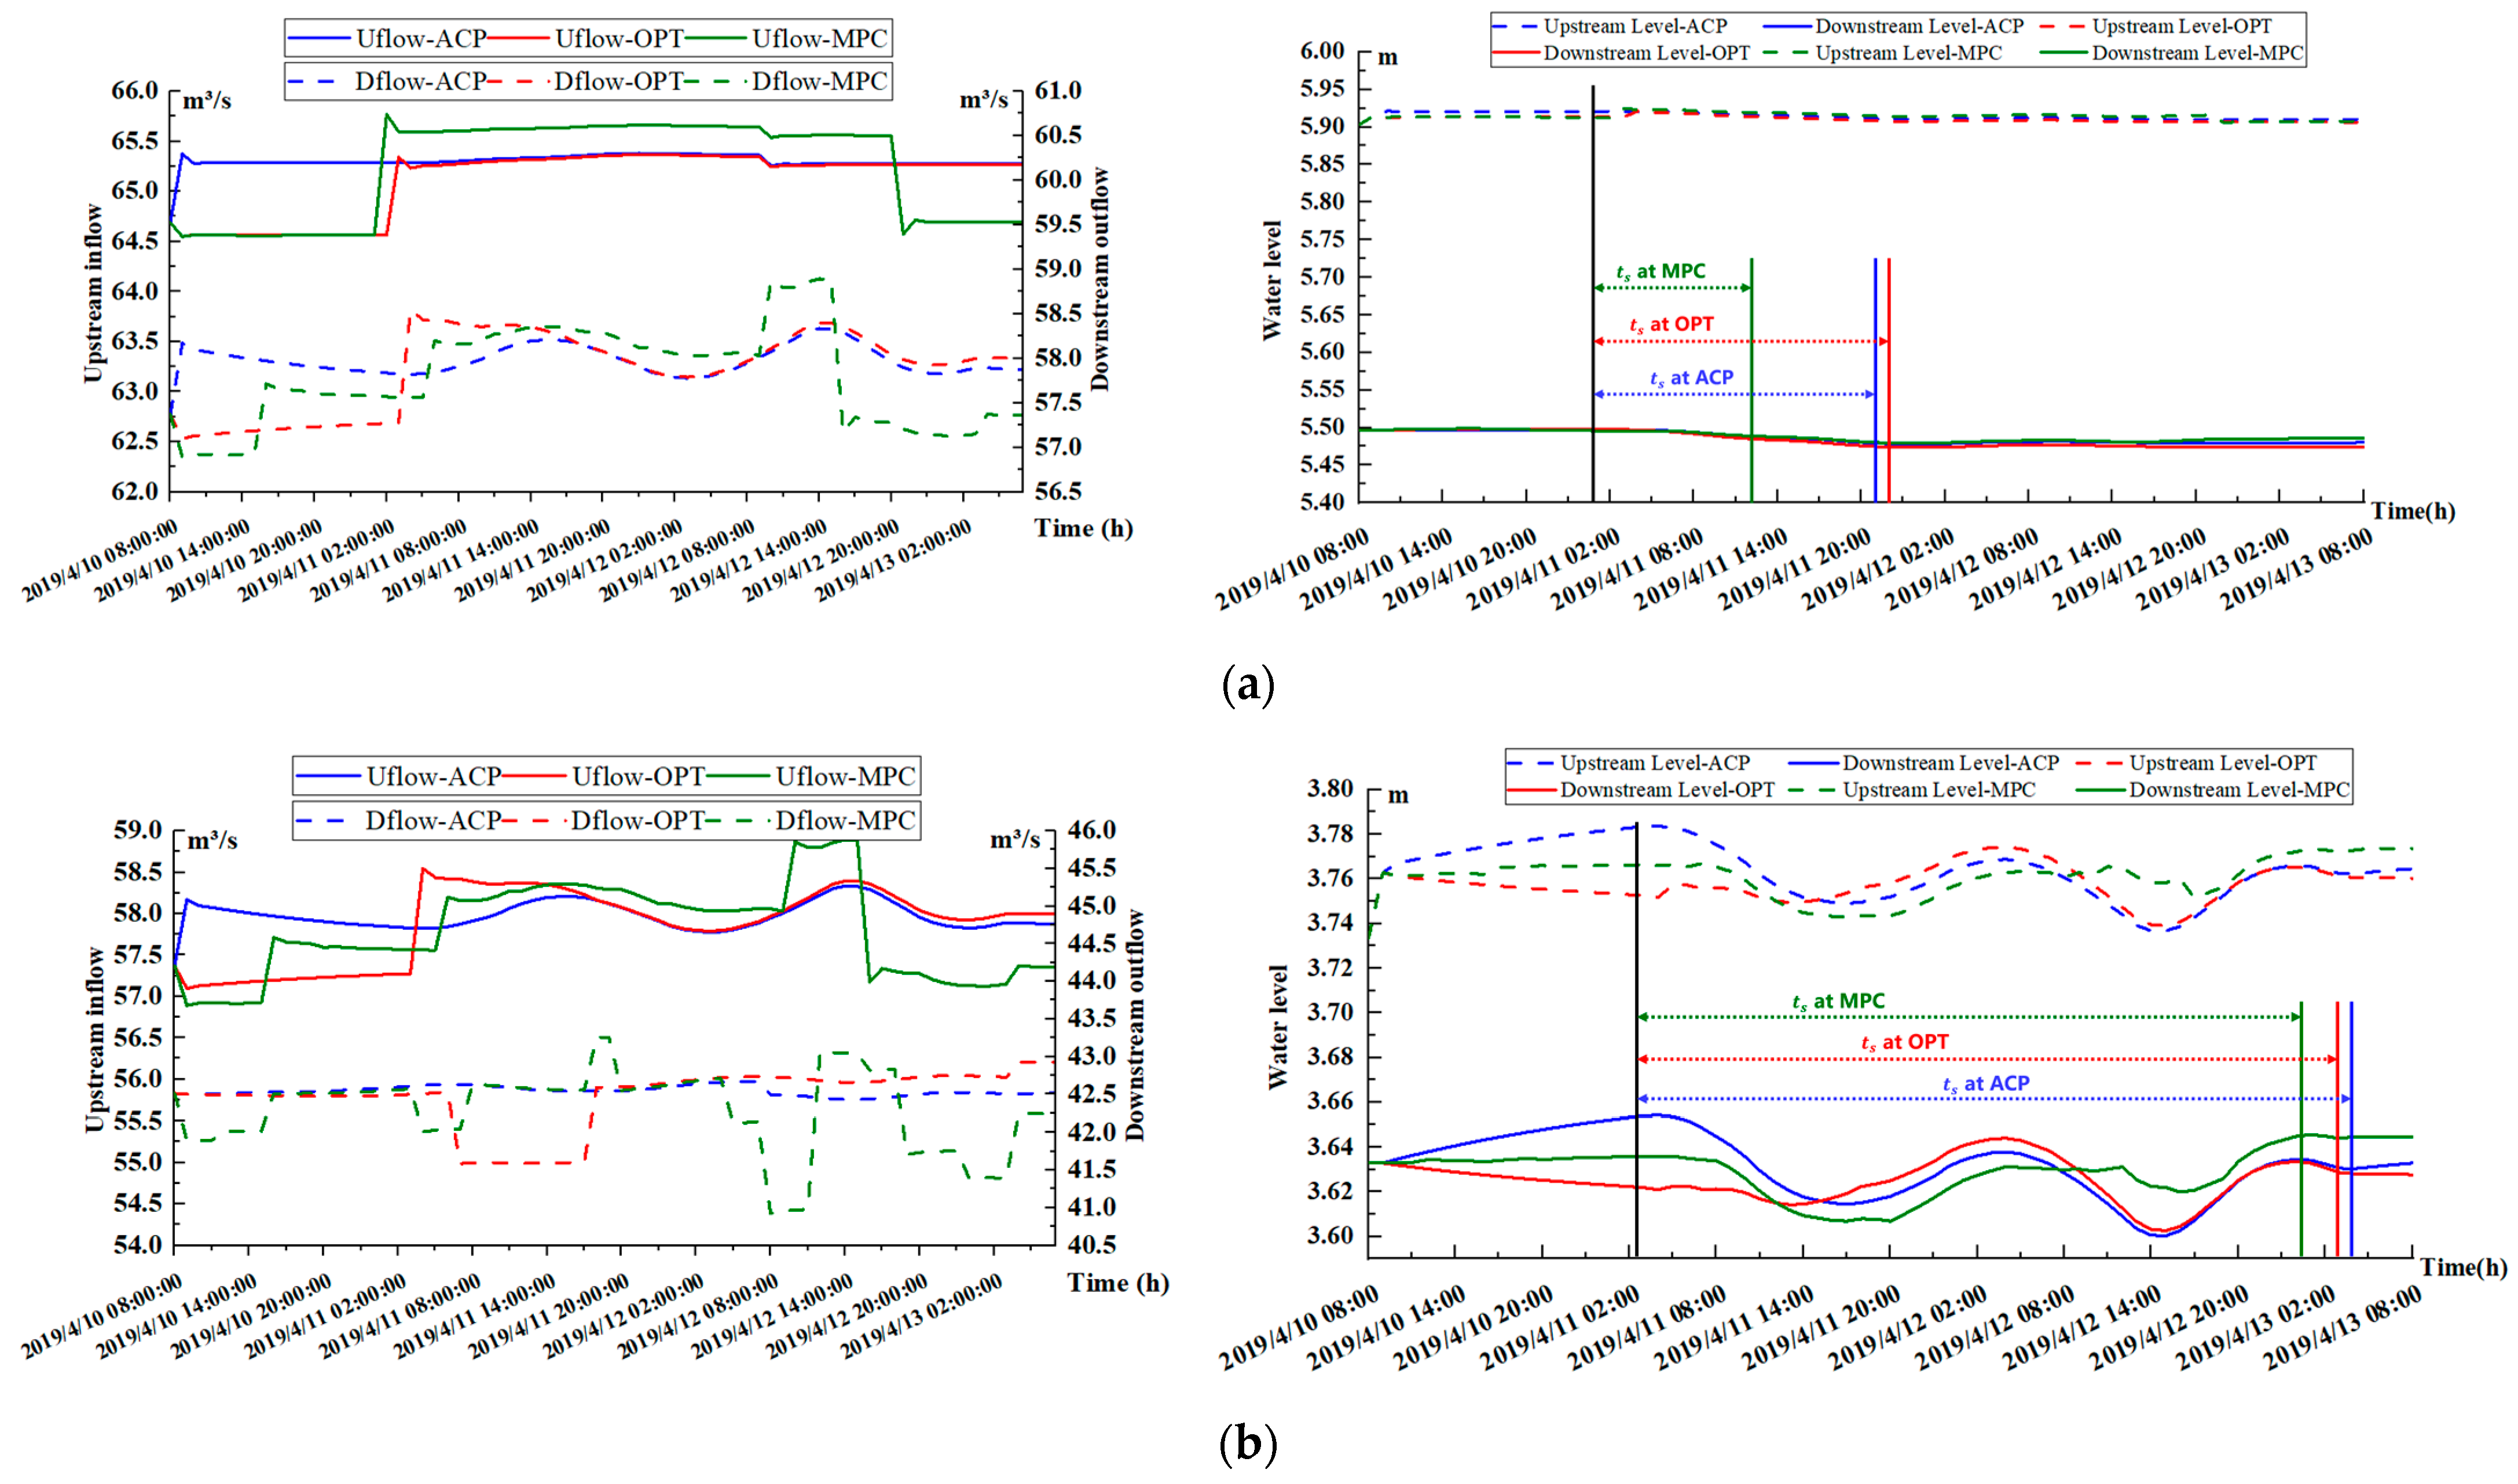
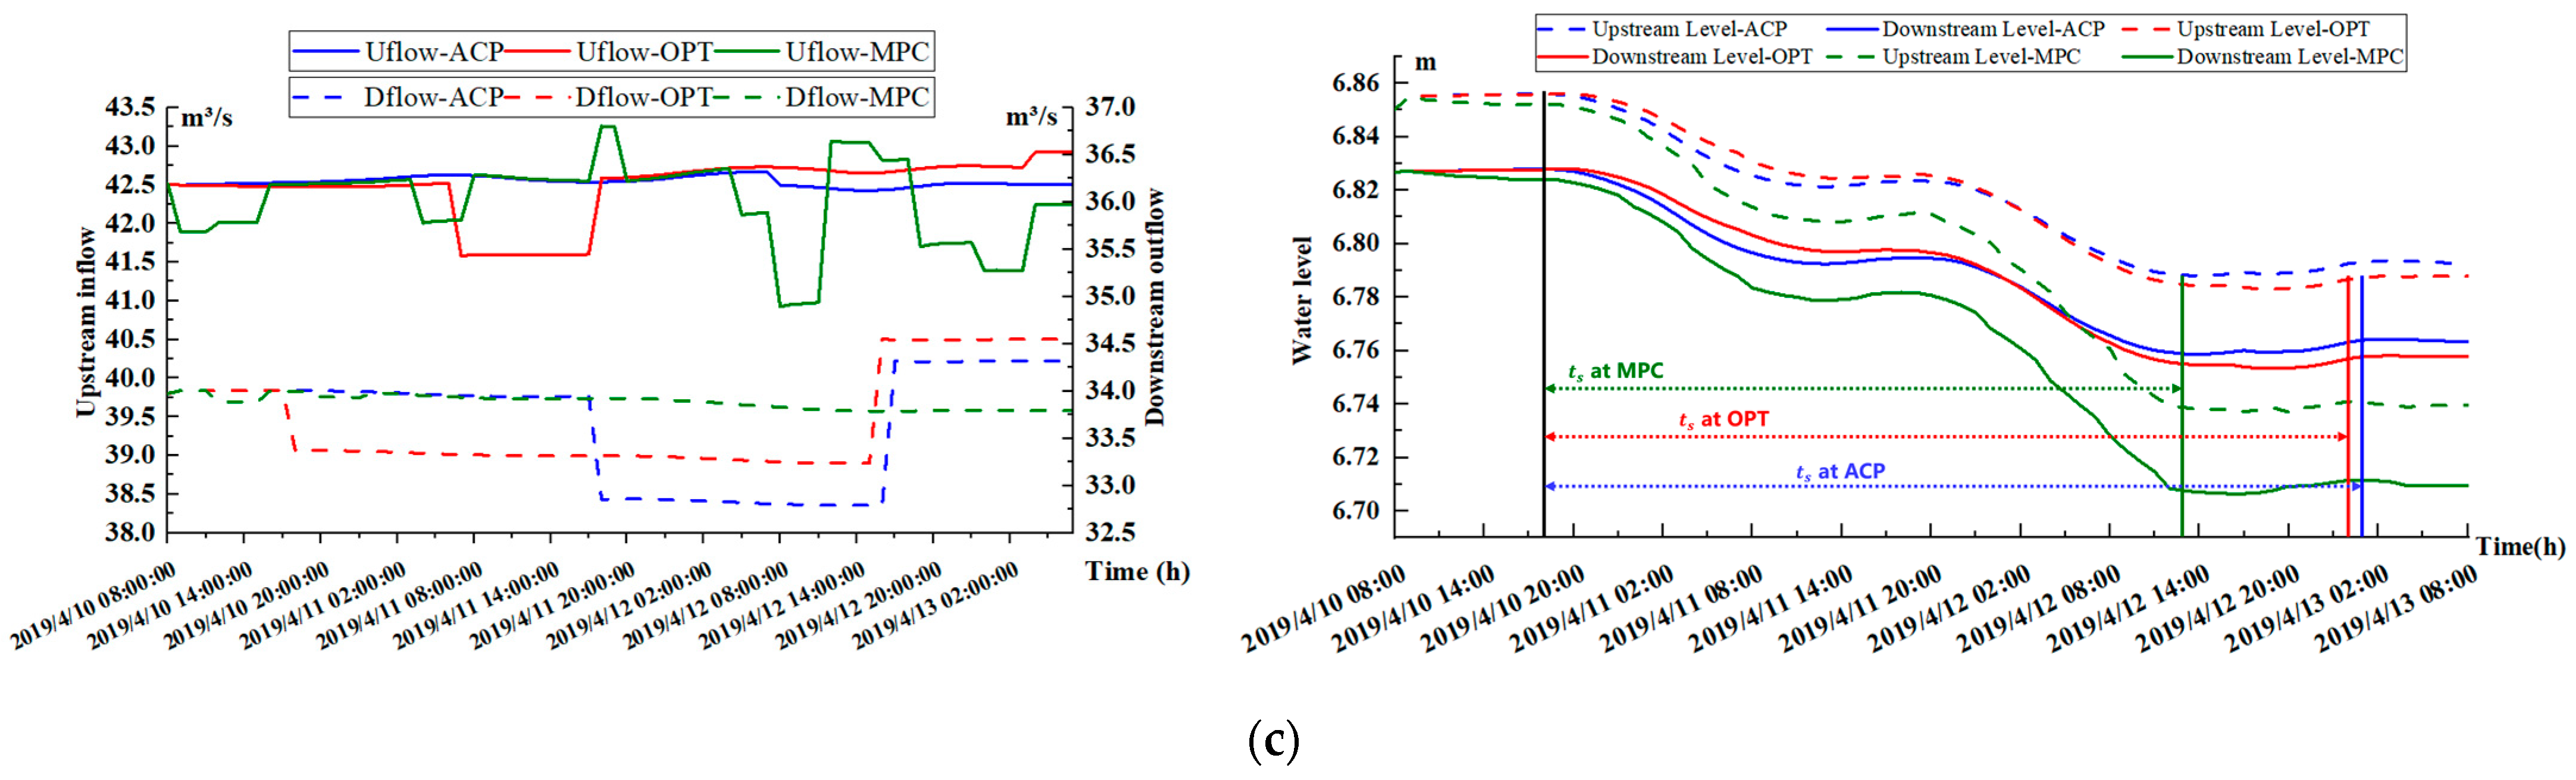
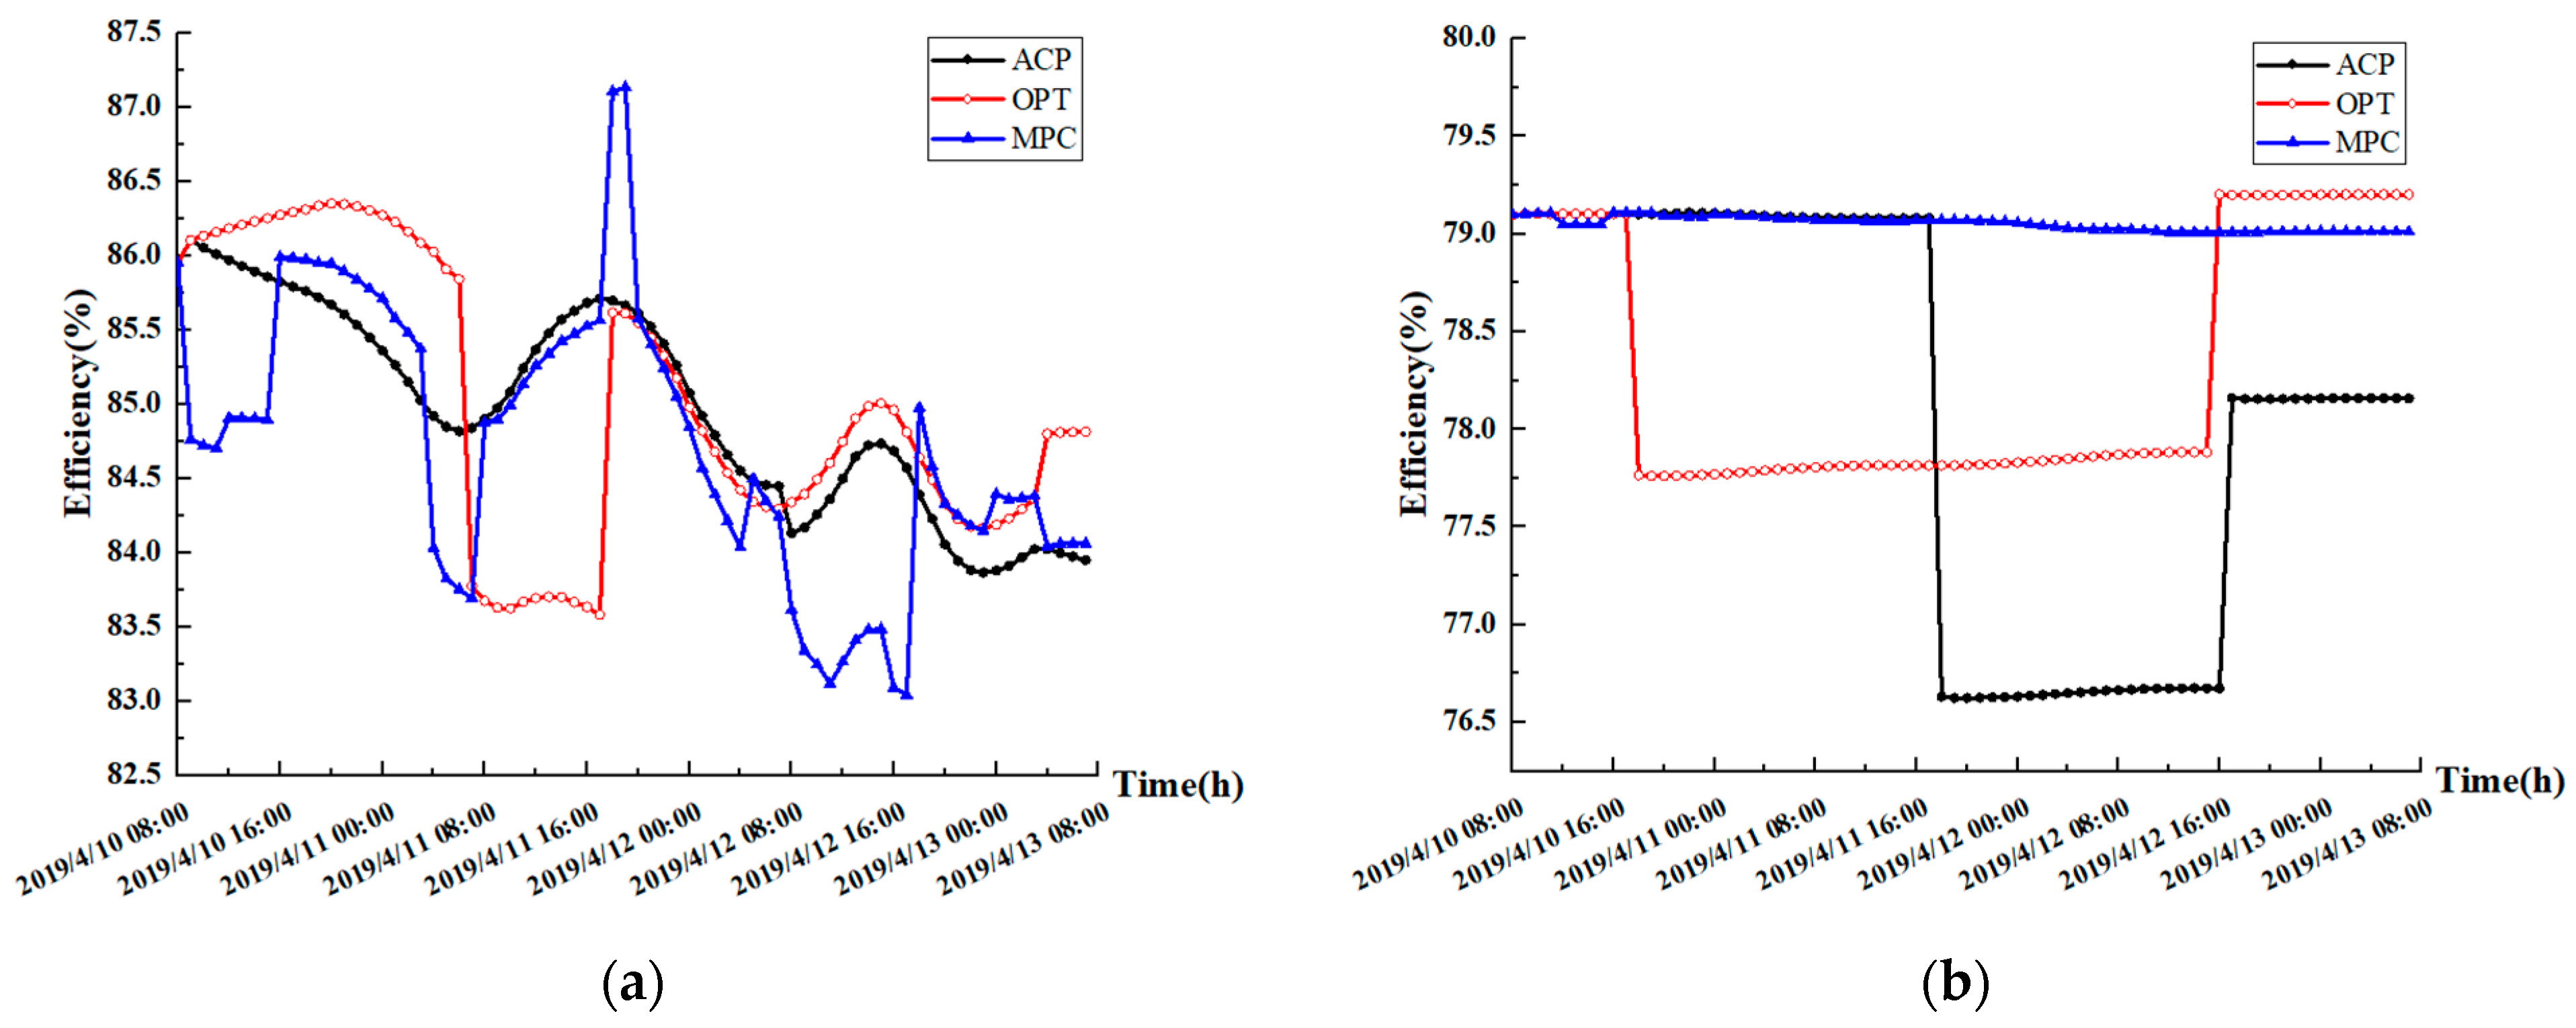
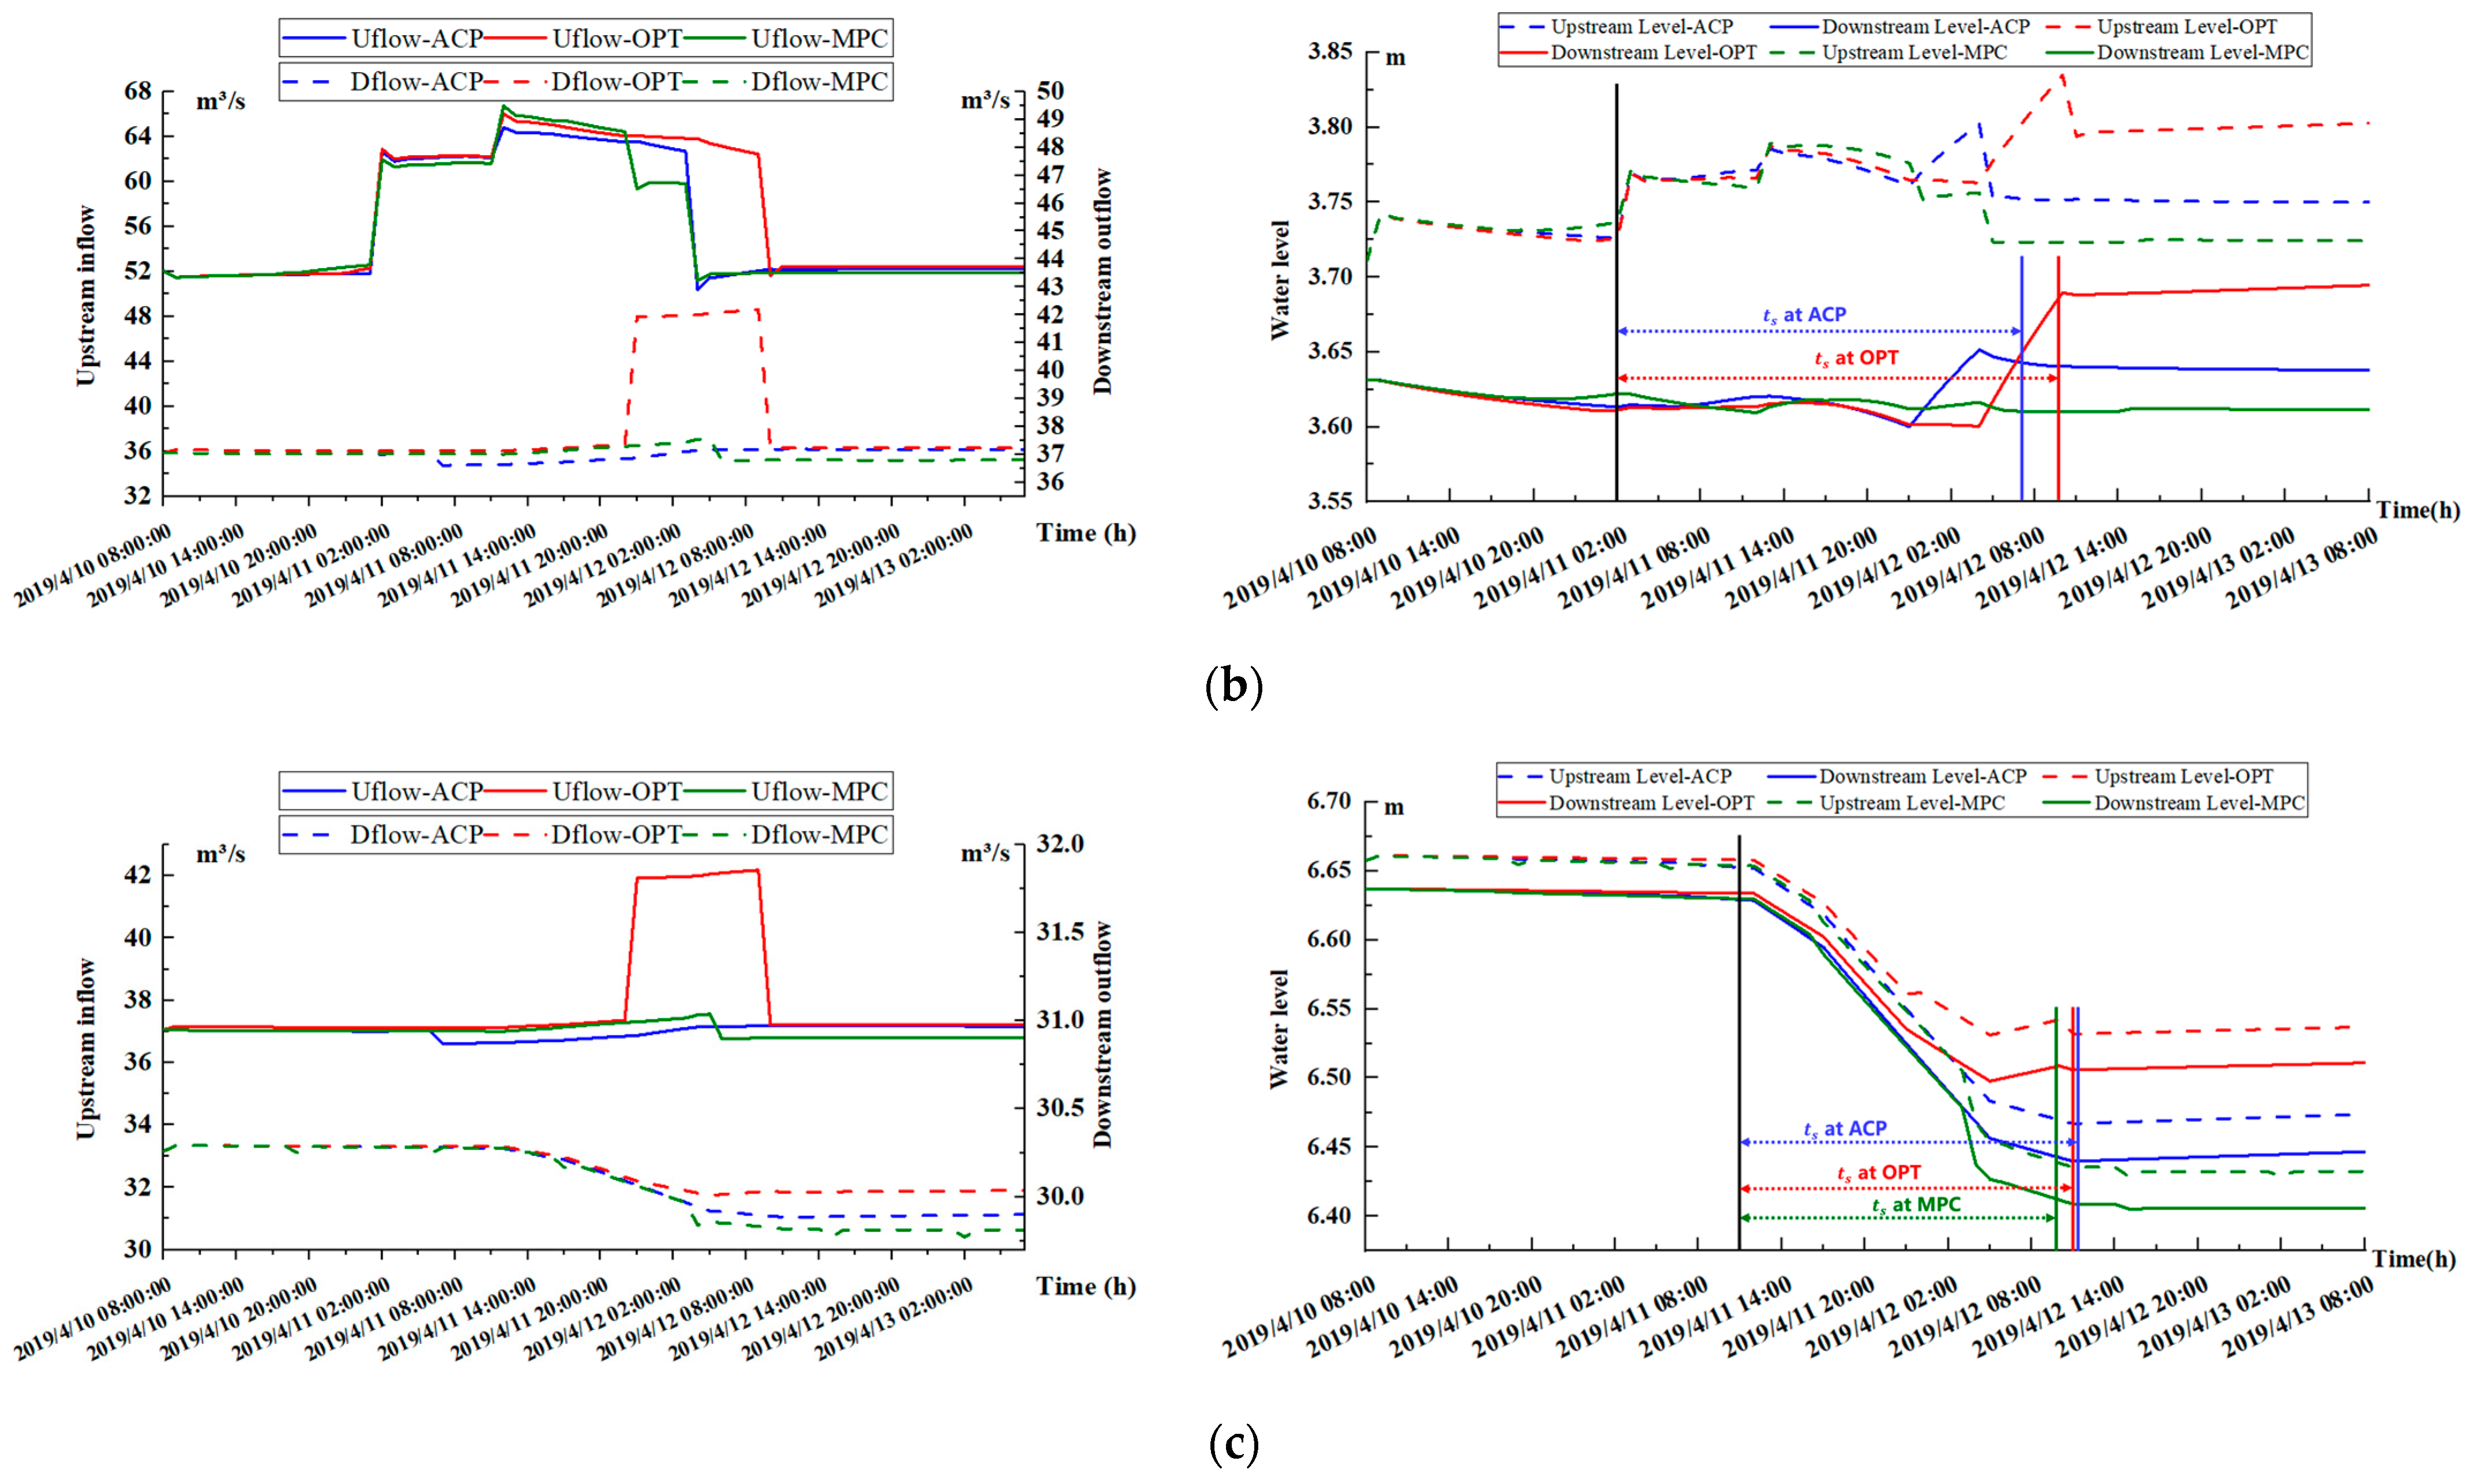
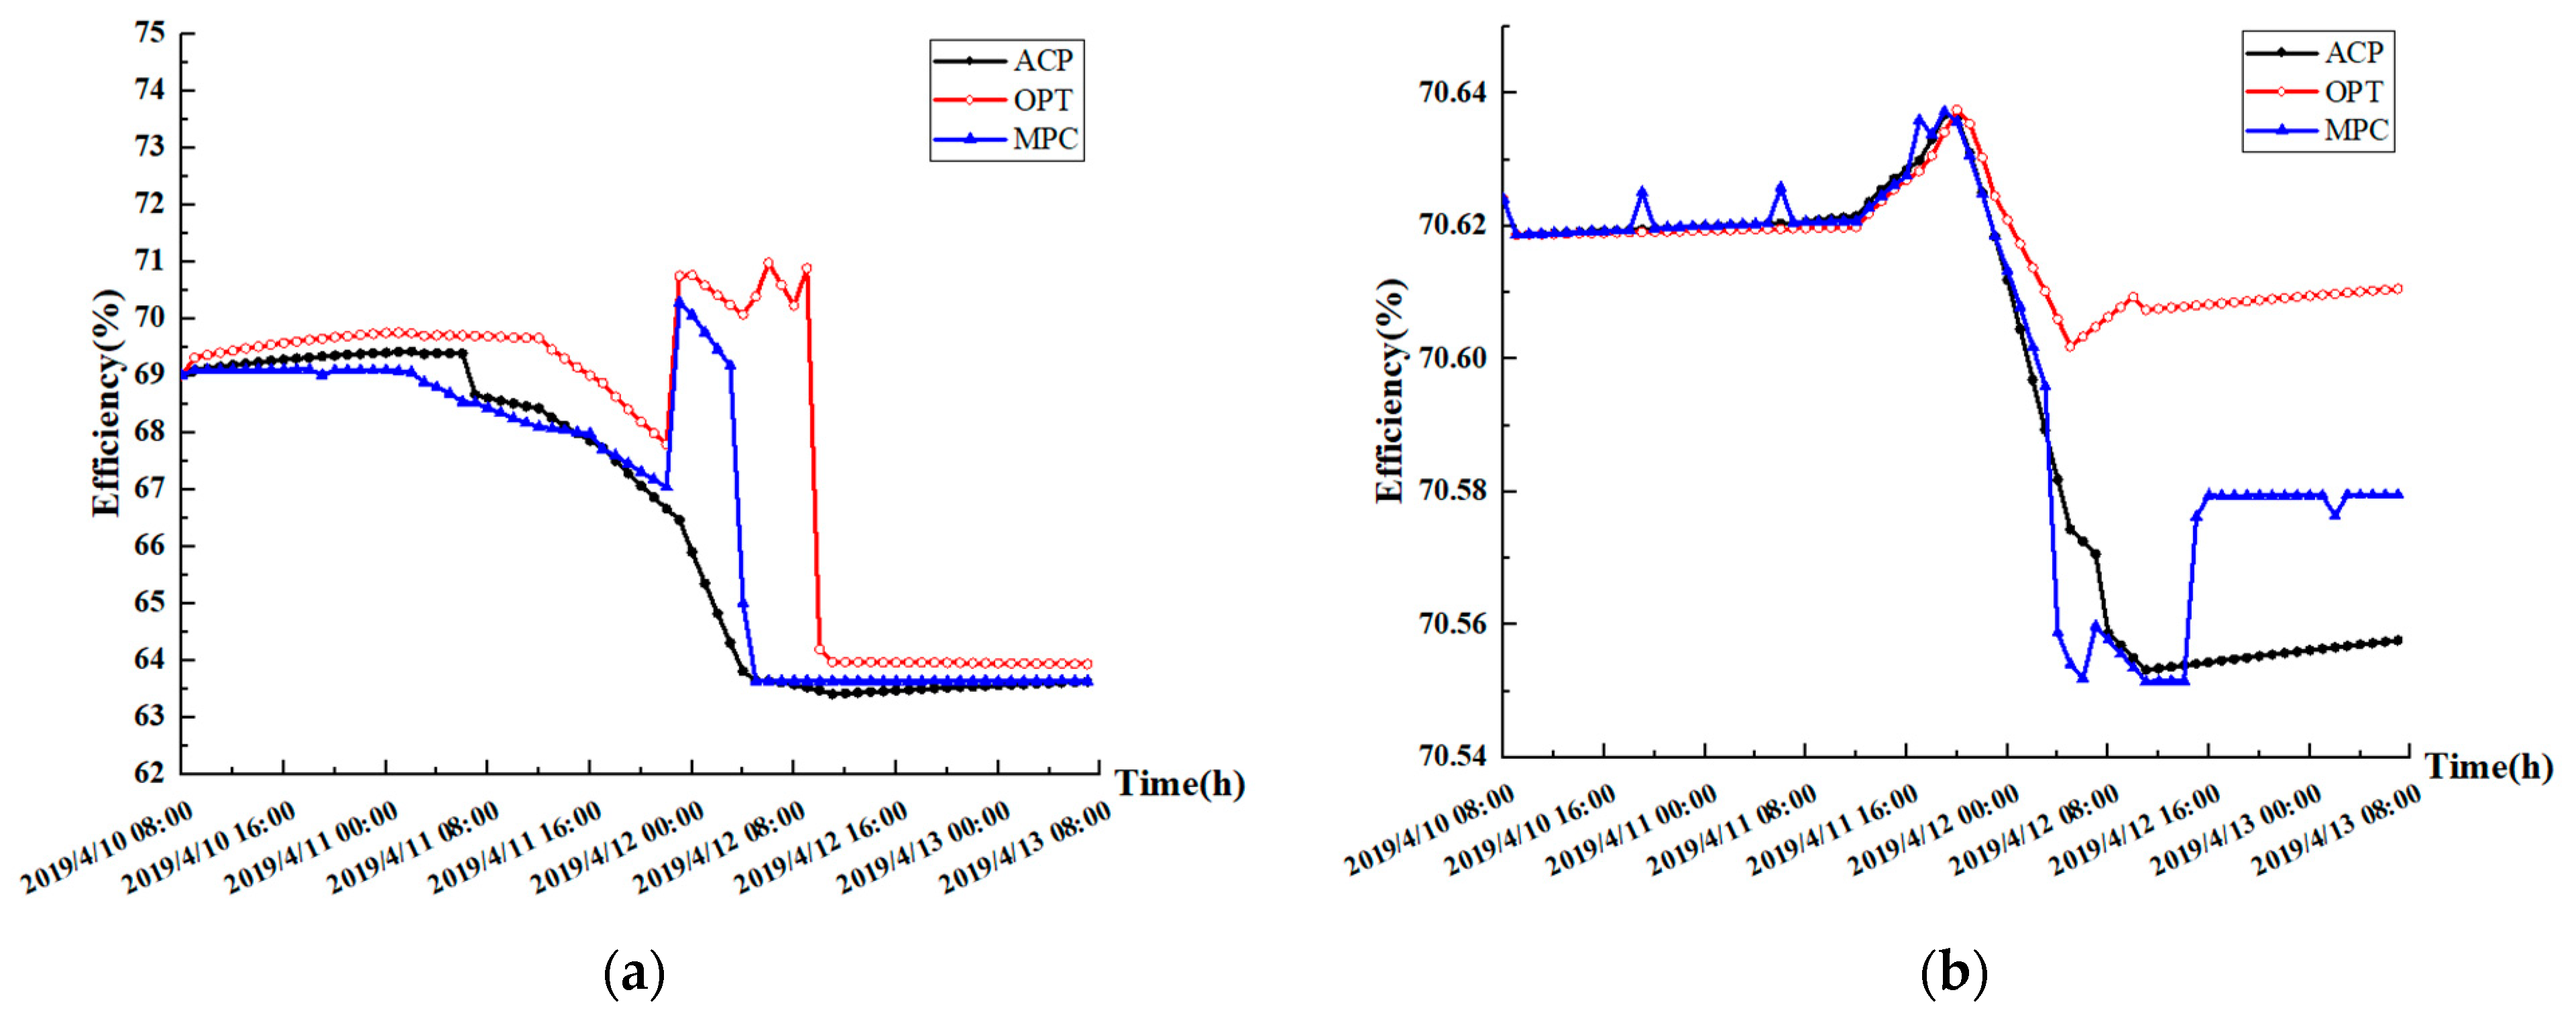
4.5. Results and Discussion

The model optimization results of the test scenario are shown in Figure 7, Figure 8, Figure 9 and Figure 10, and the performance index values are shown in Table 3. Among them, Figure 7a–c and Figure 9a–c show the upstream and downstream flow and water level change process of each canal pool along the project under Test Scenarios A and B, respectively. Figure 8a,b and Figure 10a,b show the efficiency change process of the first and second-stage pumping stations in the cascade pumping station, respectively.
In Test Scenario A, the control effect of the water level of the canal pool is shown in Figure 7a–c. All three modes could restore the water level to a stable state, and the water level prior to Control Gate 1 could be strictly controlled within the target water level, “±10 cm”, but the control performance was different. The water level change of Canal 1 was smooth and stable after a brief period of disturbance. Compared with the water level change process of the other two modes, the water level change of MPC was smaller. For the low-frequency, small-amplitude, short-term water diversion disturbance process, the inflow of the canal pool increased slightly before the disturbance occurred to cope with the water demand within the time lag. After the disturbance, the stability of the flow state of the canal pool was restored, and the water level of the canal tended to be stable. In the overall regulation process, MAE and IAE were relatively small, and the control effect of the control gate was better. Compared with Canal 1, the water flow in Canal 2 changed more frequently, the change range was larger, the disturbance time was longer, and restoring the stability of the water level of the canal pool was difficult. The MPC adopts a rolling optimization strategy and corrects the system state step-by-step, accurately predicts the water level change trend caused by the fluctuation of water diversion flow, and takes corresponding control actions to reduce the water level amplitude. At the beginning of the water diversion disturbance, some small fluctuations in water level could be observed, after which the water level changes gradually stabilized. Compared with ACP and OPT, t s was shortened by three hours and two hours, respectively, and the water level control effect of the canal pools had a relative advantage.
The regulation effect of the pump station is shown in Figure 8a,b. In ACP, the stable operating efficiency of pump station 1 transitions from 85.95% to 83.95%, and the stable operating efficiency of pump station 2 transitions from 79.10% to 78.15%. Due to the single goal of PID control to maintain a stable water level, the water level in the canal pool no longer transitions to a new operating efficiency zone after reaching stability. At the same time, due to the limitations of the algorithm control range, it is not possible to conduct a cascade pump station joint control to improve pump station operating efficiency. Therefore, after the disappearance of the water diversion disturbance, the stable operating efficiency of the pump station and the operating efficiency of cascade pump stations are relatively low compared to MPC. During the steady-state transition process of water transfer engineering after water diversion disturbance, the OPT is affected by the stable operation efficiency control goal, which stabilizes the operation efficiency of Pump Station 1 to 84.81%. The control effect is relatively superior to ACP and MPC. However, as the uncertainty of model prediction results caused by water diversion disturbance was ignored, the accuracy of the regulation strategy could be low, which may cause the actual diversion process of the pump station to deviate from the scheduling plan. In MPC, the stable operation efficiency of Pump Station 1 transited from 85.95% to 84.06%. The main reason is that the model predictive control improves the regulation accuracy of the control gate and the pump station by continuously correcting the system state and updating the control action during the transition of the forecast period so that the water level of the canal pool can quickly recover and stabilize, and at the same time guide the upstream and downstream water levels and flow of the pump station to transition to the new high-efficiency zone of pump station operation. The regulation effect of the pump station is better.
Compared with Test Scenario A, Test Scenario B tested the control performance of a model predictive control algorithm in extreme scenarios by increasing the intensity of water diversion disturbance. The water level changes were relatively smooth (Figure 9a). Canal 1 could increase the inflow of Control Gate 1 in advance and keep the outflow of Control Gate 2 unchanged 10 h before the water diversion disturbance. Before the disturbance, the variation in the water demand of the water diversion port in the time lag was compensated by increasing the storage capacity of the channel tank, and the regulation pressure caused by the disturbance of the severe water diversion disturbance to the control action of the control gate was alleviated. In the early stage of the water diversion disturbance, a small water level variation could be observed. The rolling update control action increased the regulation accuracy so that the water level of the channel pool could be quickly restored and stabilized. At the same time, the stable water level reduced the prediction difficulty of the prediction model. Compared with ACP and OPT, the stability time t s of the canal pool water level was shortened by 13 h and 9 h, respectively, and the control effect of sluice regulation and canal pool water level improved.
The change process of the water level of Canal 2 is shown in Figure 9b. After the water diversion disturbance occurred, the water level fluctuated slightly, its change was stable, and the amplitude was less than 0.1 cm. The stable operation efficiency of Pump Station 1 transited from 69% to 63%. The precise control process of Control Gate 1 and Pump Station 1 enabled the water level of the canal pool to remain stable following severe water diversion disturbance. The stable water level promotes the control action and prediction result to form a cyclic feedback of the control effect. While achieving a rapid transition in the efficient operation area of pumping stations, the economic operation goals of cascade pumping stations guide the overall upward trend of operational efficiency changes, and the regulation effect of pumping stations has a relative advantage compared to ACP.
In the face of high-intensity, low-frequency, short-term water diversion disturbances, MPC replenishes water to the target river channel in advance to cope with the loss of control performance of the control gate caused by severe water diversion disturbances. Through rolling update control actions, it improves the control accuracy and efficiency of the control gate and pump station, reduces the loss of control performance of the pump station caused by the uncertainty of model prediction results, and quickly restores the stability of the water level in the channel pool. The control effect on the control gate and pump station and the water level control of the canal pool have considerable advantages over ACP.

5. Conclusions

In this study, water diversion disturbance conditions were constructed according to the collection of historical dispatching cases of water diversion projects in China and elsewhere. Based on the above conditions, the typical water diversion disturbance lines were selected and the control targets were constructed, respectively. The multi-channel pool integral time-delay model was introduced to construct a discrete state space equation and use it as a prediction model to eliminate redundant steps in the model calculation process, further improving the accuracy of the prediction model. The system state was corrected by the simulation results of the canal hydrodynamic model. The model predictive control algorithm was constructed according to the objective function under different typical water diversion disturbance lines, and the optimal control strategy of the water diversion project was generated by rolling optimization. Compared with the conventional optimal scheduling mode and feedback control mode, the model predictive control can strictly control the water level in front of the gate in the target water level zone, and the flow and water level of the canal pool can be restored to stability under different degrees of water diversion disturbance. In the face of high-frequency, low-intensity, and long-term water diversion disturbances, it can quickly respond to them with the average stable time of water level ( t s ) shortened by 7.67 h. The fluctuation in water level during the regulation process and the errors with the target water level are small, and the stable operation of the pump station and the efficiency of the cascade pump station operation are high. The water level control and the regulation effect of the pump station and control gate have relative advantages. In the face of low-frequency, high-intensity, and short-term water diversion disturbances, it is possible to increase the storage capacity of the canal pool in advance to cope with potential scheduling operational risks and reduce the pressure and regulatory performance losses caused by frequent adjustment of upstream and downstream control gates after disturbances occur, with the average stable water level duration ( t s ) shortened by 13.6 h. Subsequently, by regularly correcting the system state, the loss of pump station control performance caused by the uncertainty of model prediction results is reduced, and the water level control and pump station regulation effects are improved.

Author Contributions

Conceptualization, P.J. and J.S.; methodology, P.J.; software, C.W.; investigation, P.J.; resources, P.J.; data curation, X.L.; writing—original draft preparation, P.J.; writing—review and editing, P.J. and J.S.; visualization, P.J.; supervision, P.J.; project administration, P.J. and H.W.; funding acquisition, C.W. All authors have read and agreed to the published version of the manuscript.

Funding

This research received no external funding.

Data Availability Statement

Not applicable.

Conflicts of Interest

The authors declare no conflict of interest.

References

  1. Wang, Y.G.; Zhang, W.S. Modelling water quality and quantity with the influence of inter-basin water diversion projects and cascade reservoirs in the Middle-lower Hanjiang River. J. Hydrol. 2016, 541, 1348–1362. [Google Scholar] [CrossRef]
  2. Zhou, Y.L.; Guo, S.L. Systematic impact assessment on inter-basin water transfer projects of the Hanjiang River Basin in China. J. Hydrol. 2017, 553, 584–595. [Google Scholar] [CrossRef]
  3. Park, S.; Jahns, T.M. Flexible dv/dt and di/dt control method for insulated gate power switches. J. IEEE Trans. Ind. Appl. 2003, 39, 657–664. [Google Scholar] [CrossRef] [Green Version]
  4. Hashemy Shahdany, S.M.; Adib Majd, E.; Firoozfar, A.; Maestre, J.M. Improving operation of a main irrigation canal suffering from inflow fluctuation within a centralized model predictive control system: Case study of Roodasht Canal, Iran. J. Irrig. Drain. Eng. 2016, 142, 06016007. [Google Scholar] [CrossRef]
  5. Kurganov, A.; Qu, Z.; Wu, T. Well-balanced positivity preserving adaptive moving mesh central-upwind schemes for the Saint-Venant system. ESAIM Math. Model. Numer. Anal. 2022, 56, 1327–1360. [Google Scholar] [CrossRef]
  6. Wylie, E.B. Control of transient free-surface flow. J. Hydraul. Div. 1969, 95, 347–362. [Google Scholar] [CrossRef]
  7. Liu, F.; Feyen, J.; Malaterre, P.-O.; Baume, J.-P.; Kosuth, P. Development and evaluation of canal automation algorithm CLIS. J. Irrig. Drain. Eng. 1998, 124, 40–46. [Google Scholar] [CrossRef]
  8. Bautista, E.; Clemmens, A.J.; Strelkoff, T. Comparison of numerical procedures for gate stroking. J. Irrig. Drain. Eng. 1997, 123, 129–136. [Google Scholar] [CrossRef]
  9. Bautista, E.; Clemmens, A.J.; Strand, R.J. Salt River Project canal automation pilot project: Simulation tests. J. Irrig. Drain. Eng. 2006, 132, 143–152. [Google Scholar] [CrossRef] [Green Version]
  10. Mu, X.P.; Guo, X.C.; Li, W.X. Study on the hydraulic response sensitivity of unsteady flow in a conveyance channel to flow diversion. Hydropower J. 2010, 29, 96–101+112. (In Chinese) [Google Scholar]
  11. Shen, J.; Liu, Y.J. Genetic algorithm for parameter identification of water resources optimal allocation model. J. Wuhan Univ. 2002, 3, 13–16. (In Chinese) [Google Scholar]
  12. Li, K.B.; Shen, B.; Song, X.Y.; Hao, G.R. The application and improvement of TOPMODEL model in runoff simulation analysis in semi-humid areas. Hydraul. J. 2015, 46, 1453–1459. (In Chinese) [Google Scholar]
  13. Sablina, G.V.; Markova, V.A. Tuning a PID controller in a system with a delayed second-order object. Optoelectron. Instrum. Data Process. 2023, 58, 410–417. [Google Scholar] [CrossRef]
  14. Hashemy, S.M.; Monem, M.J.; Maestre, J.M.; Van Overloop, P.J. Application of an in-line storage strategy to improve the operational performance of main irrigation canals using model predictive control. J. Irrig. Drain. Eng. 2013, 139, 635–644. [Google Scholar] [CrossRef]
  15. Ooi, S.K.; Weyer, E. Control design for an irrigation channel from physical data. Control Eng. Pract. 2008, 16, 1132–1150. [Google Scholar] [CrossRef]
  16. Schuurmans, J. Open-channel flow model approximation for controller design. Appl. Math. Model. 1995, 19, 525–530. [Google Scholar] [CrossRef]
  17. Gupta, J.; van der Zaag, P. Interbasin water transfers and integrated water resources management: Where engineering, science and politics interlock. J. Phys. Chem. Earth Parts A/B/C 2008, 33, 28–40. [Google Scholar] [CrossRef]
  18. Vermuyten, E.; Meert, P.; Wolfs, V.; Willems, P. Model uncertainty reduction for real-time flood control by means of a flexible data assimilation approach and reduced conceptual models. J. Hydrol. 2018, 564, 490–500. [Google Scholar] [CrossRef]
  19. Liu, J.L.; Wang, Z.J.; Yang, Z.G.; Zhang, T. An adaptive predictive control algorithm for comprehensive dendritic canal systems. J. Irrig. Drain. Eng. 2023, 149, 04022046. [Google Scholar] [CrossRef]
  20. Nguyen, M.C.; Nguyen, N.T.; Bui, D.N.; Nguyen, T.L. Adaptive fuzzy Lyapunov-based model predictive control for parallel platform driving simulators. Trans. Inst. Meas. Control 2023, 45, 838–852. [Google Scholar] [CrossRef]
  21. Li, Z.Y.; Zhu, X.B.; Ye, Q.; Tian, S.T.; Xian, H.L. Single loop voltage control strategy based on model predictive control for NPC-UPS. J. Phys. Conf. Ser. 2023, 2418, 012045. [Google Scholar] [CrossRef]
  22. Zheng, H.Z.; Zhang, Z.; Wu, H.; Lei, X.H. Study on the daily optimal dispatching and economic operation of cascade pumping stations in water conveyance system. J. Hydraul. Eng. 2016, 47, 1558–1565. (In Chinese) [Google Scholar]
  23. Wen, X.; Li, J.Y.; Tan, Q.F.; Mao, Y.Z.; Ding, Z.Y.; Wang, H. Study on medium and long-term optimal scheduling of Jiangsu section of South-to-North Water Diversion Project. Hydropower J. 2022, 41, 65–77. (In Chinese) [Google Scholar]
  24. Anhui Water Conservancy and Hydropower Survey and Design Institute. Preliminary Design Report of the River Transfer Project from the Huai River; Anhui Water Conservancy and Hydropower Survey and Design Institute: Hefei, China, 2017. (In Chinese) [Google Scholar]
  25. Anhui Water Conservancy and Hydropower Survey and Design Institute. Feasibility Study Report of Water Transfer Project from the Yangtze River to Huai River; Anhui Water Conservancy and Hydropower Survey and Design Institute: Hefei, China, 2015. (In Chinese) [Google Scholar]
  26. Chen, Z.; Wang, H.; Qi, X. Pricing and Water Resource Allocation Scheme for the South-to-North Water Diversion Project in China. Water Resour Manag. 2013, 27, 1457–1472. [Google Scholar] [CrossRef]
  27. Liu, H.; Wang, H.; Liu, S.; Hu, C.; Ding, Y.; Zhang, J. Lattice Boltzmann method for the Saint–Venant equations. J. Hydrol. 2015, 524, 411–416. [Google Scholar] [CrossRef]
  28. Wang, Z.J.; Zheng, Z.L.; Xu, G.Y.; Jiang, G.Y. Optimal control of multi-cascade water conveyance channels based on linear quadratic form. Adv. Water Sci. 2018, 29, 383–389. (In Chinese) [Google Scholar]
  29. Kong, L.Z. Research on Normal Control and Emergency Regulation Algorithms for Large Open Channel Water Transmission Projects, D. Ph.D. Thesis, Zhejiang University, Hangzhou, China, 2019. (In Chinese). [Google Scholar]
  30. Kong, L.Z.; Wang, H.; Lei, X.H. Research on real-time control of open canal based on linear predictive control method. J. Hydraul. Eng. 2020, 51, 326–334. (In Chinese) [Google Scholar]
  31. Oh, J.; Bartos, M. Model predictive control of stormwater basins coupled with real-time data assimilation enhances flood and pollution control under uncertainty. Water Res. 2023, 235, 119825. [Google Scholar] [CrossRef]
  32. Tang, Y.; Zheng, G.; Zhang, S. Optimal control approaches of pumping stations to achieve energy efficiency and load shifting. Int. J. Electr. Power Energy Syst. 2014, 55, 572–580. [Google Scholar] [CrossRef]
  33. Sang, G.Q.; Zhang, S.H.; Zhang, L. Calculation method and application on operation efficiency of water transfer system with cascade pumping station based on time and space scale. J. Agric. Eng. 2017, 33, 67–75. [Google Scholar]
Figure 1. Graphical representation of the five disturbance lines (C1–C5) of water diversion schemes, indicating temporal fluctuations in flow rates.
Water 15 02793 g001aWater 15 02793 g001b
Figure 2. Calculation flowchart.
Water 15 02793 g002
Figure 3. Channel integral delay model diagram.
Water 15 02793 g003
Figure 4. Principle of model foresight period passage. (The blue line represents the optimal path adopted for the current step size).
Water 15 02793 g004
Figure 5. Schematic of the sequential components of the water diversion project.
Water 15 02793 g005
Figure 6. Graphical representation of water requirement schemes (a,b) indicating temporal fluctuations in flow rates in three canal systems.
Water 15 02793 g006
Figure 7. Flow and water level states of the three canal pools under Test Scenario A. (a) Canal 1, (b) Canal 2, and (c) Canal 3.
Water 15 02793 g007aWater 15 02793 g007b
Figure 8. Change process of the operation efficiency of Pump Stations 1 and 2 under Test Scenario A. (a) Pump Station 1, (b) Pump Station 2.
Water 15 02793 g008
Figure 9. The flow and water level state of the three canal pools under Test Scenario B. (a) Canal 1, (b) Canal 2, and (c) Canal 3.
Water 15 02793 g009aWater 15 02793 g009b
Figure 10. Change process of the operation efficiency of Pump Stations 1 and 2 under Test Scenario B. (a) Pump Station 1, (b) Pump Station 2.
Water 15 02793 g010
Table 1. Characteristics of the water diversion disturbance conditions.
Working ConditionChange Duration/hVariation in Water Diversion Flow/  ( m 3 · s 1 ) Variation Rate of Water Diversion Flow/  ( m 3 · s 1 ) Channel Flow/  ( m 3 · s 1 ) The Variation in Water Diversion Accounting for the Canal Section
C117, 223, 90.0029, 0.006855, 99.55.17, 15.52
C21, 1.5/
1, 1.5
3, 5/6, 100.067, 0.11/0.026, 0.04355, 99.510.34, 17.24/5.17, 8.62
C38, 13/
8, 21
1.79, 4.95/
1.95, 6.12
0.0037, 0.0074/
0.0027, 0.01
55, 99.53, 8.53/3.4, 10.6
C46, 81.65, 2.930.0046, 0.006155, 99.52.84, 5.1
C56, 11/
4, 10
1.54, 4.98/
1.54, 4.98
0.0043, 0.01/
0.0054, 0.0064
55, 99.52.66, 8.59/2.66, 8.59
Table 2. Engineering parameters of the canal and control buildings.
NameTarget Water Level (m)Minimum Upstream Water Level (m)Maximum Upstream Water Level (m)Minimum Downstream Water Level (m)Maximum Downstream Water Level (m)Canal Length (km)Backwater Area  ( km 2 ) Duration of Delay (min)
Gate 15.175.165.18
Pump 1 3.605.806.009.40
Pump 2 5.8010.717.4020.80
Canal 1 20.594.06168
Canal 2 18.271.42429
Canal 3 27.833.48450
Table 3. Evaluation of the dispatching operation state of the canal water conveyance system in two test scenarios.
Test ScenarioEvaluating Indicator η p  (%) t s  (h) η ps  (%) MAE (%)IAE (%)
AACPMaximum86.105480.550.0042379250.002495729
Average81.674079.69
OPTMaximum86.355380.590.0034293640.001884958
Average81.674079.69
MPCMaximum87.144580.720.0032037410.00165318
Average81.3732.380.01
BACPMaximum70.602970.400.003150.008163
Average68.5025.769.70
OPTMaximum75.703271.600.0114940.006578
Average69.602670.10
MPCMaximum70.602370.600.0164410.005329
Average68.6011.769.70
Disclaimer/Publisher’s Note: The statements, opinions and data contained in all publications are solely those of the individual author(s) and contributor(s) and not of MDPI and/or the editor(s). MDPI and/or the editor(s) disclaim responsibility for any injury to people or property resulting from any ideas, methods, instructions or products referred to in the content.

