Article

Application of a Linked Hydrodynamic–Groundwater Model for Accurate Groundwater Simulation in Floodplain Areas: A Case Study of Irtysh River, China

1
College of Environmental Ecology, Jiangsu Open University, Nanjing 210036, China
2
State Key Laboratory of Simulations and Regulations of Water Cycles in River Basins (SKL-WAC), China Institute of Water Resources and Hydropower Research (IWHR), Beijing 100038, China
3
Hydrographic Bureau of Haihe River Water Conservancy Commission, Tianjin 300170, China
4
Key Laboratory of Jiangsu Province for Chemical Pollution Control and Resources Reuse, School of Environmental and Biological Engineering, University of Science and Technology, Nanjing 210094, China
*
Author to whom correspondence should be addressed.
Water 2023, 15(17), 3059; https://doi.org/10.3390/w15173059
Submission received: 4 July 2023 / Revised: 19 August 2023 / Accepted: 22 August 2023 / Published: 27 August 2023

Abstract

:
The rich biodiversity in the floodplain area is influenced by both floodplain floods and groundwater (GW). To protect the ecological environment in the floodplain area, it is essential to study the interaction between floodplain floods and GW. The objective of this paper is to propose a coupling strategy between a hydrodynamic model and a GW model to provide an accurate simulation tool for quantifying the interaction between floodplain floods and GW. The case study is conducted in the floodplain area of the middle reaches of the Irtysh River in northwest China. Firstly, a two-dimensional hydrodynamic model based on TELEMAC-2D is constructed to accurately simulate floodplain floods under wetting and drying conditions. Secondly, a GW model based on MODFLOW is developed. Finally, a coupling strategy is proposed to achieve accurate and efficient integration between the hydrodynamic model and the GW model. The calibration and verification results of the model demonstrate high accuracy, with root mean squared error (RMSE) values of 0.51 m and 0.77 m between observed and calculated GW levels for the hydrodynamic–GW coupled model. The water balance results indicate that floodplain floods serve as the largest GW recharge source in the study area, while phreatic evaporation is the primary GW discharge item. This paper represents a novel attempt to couple a two-dimensional hydrodynamic model with a GW model. The research results provide a scientific tool for the ecological restoration of floodplain areas considering both surface water and GW, as well as the comprehensive management and regulation of wetland water resources and the water environment.

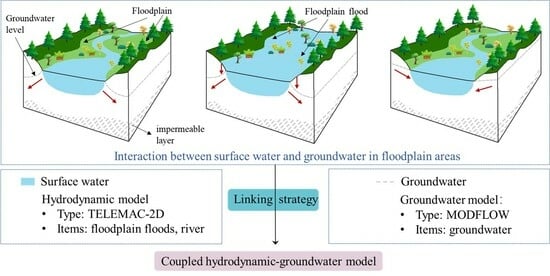
Graphical Abstract

1. Introduction

The floodplain is a low-lying area susceptible to inundation from lateral river overflow [1,2,3]. Floodplain floods, which occur regularly in these areas, play a vital role in replenishing groundwater (GW) through infiltration and maintaining it at an optimal level to facilitate vegetation growth. The interplay between vegetation and floodplain floods collectively shapes the floodplain habitat, thereby driving the formation and evolution of the ecosystem [4,5,6,7,8]. Consequently, maintaining the stability of the floodplain ecosystem hinges on understanding the interaction between floodplain floods and GW.
In recent years, climate change and human activities (such as dam construction) have significantly altered the natural characteristics of floodplain floods, leading to the degradation of floodplain ecosystems in irreversible ways [9,10,11,12]. Current research on ecological restoration in floodplain areas primarily focuses on enhancing the hydraulic connectivity of surface water (SW) through floodplain floods [13,14,15,16,17,18,19]. However, it is imperative to adopt a comprehensive water resource management perspective and prioritize an in-depth exploration of the transformation relationship between floodplain floods and GW. Developing an effective methodology for quantifying this relationship is thus a pressing need.
Currently, the primary approaches for investigating the interplay between SW and GW in wetlands involve direct measurements [20,21,22] and indirect methods [23,24,25]. However, these methods often require specific site-based studies, making it challenging to capture the high spatiotemporal variability inherent in floodplain floods and provide a detailed understanding of the interaction between floodplain floods and GW. Numerical simulation methods offer a quantitative means to calculate the exchange between SW and GW. The simplest approach involves using separate numerical models for GW [26,27,28]; however, this method often oversimplifies SW dynamics by treating it as a discrete node or employing fixed river boundaries, thereby neglecting the significant influence of key SW processes (such as floodplain flooding) on GW. In contrast, coupling models that integrate SW and GW offer enhanced flexibility and serve as an effective solution to address these limitations.
Various types of coupling models exist for integrating SW and GW. Based on the coupling method, they can be classified into completely coupled and loosely coupled approaches. Completely coupled approaches involve solving SW and GW equations simultaneously, while loosely coupled approaches exchange model results [29]. Completely coupled approaches are computationally demanding and are not advantageous for regional-scale applications due to limited input data [30,31,32]. On the other hand, loosely coupled approaches offer greater flexibility [33] and are applicable over a wider range. Another classification method is based on model selection, which can be broadly categorized as GW models coupled to SW hydrology models (such as SWAT-MODFLOW [33,34,35,36,37], MODFLOW-OWHM [38], GSFLOW [39,40,41], MIKESHE [42,43], HydroGeoSphere [44], WetSpass-M-MODFLOW [45]), and GW models coupled to SW hydrodynamic models (such as FEFLOW-MIKE11 [46], MODHMS [47]). Currently, GW-SW hydrology models, particularly the SWAT-MODFLOW coupled model, are the most commonly employed tools for studying the relationship between SW and GW [48]. However, GW-SW hydrology models primarily focus on describing the impact of rainfall-runoff processes on GW and do not simulate the detailed movement of SW flow. While existing GW-SW hydrodynamic models can simulate SW flow, most of the hydrodynamic models used for model coupling are one-dimensional and only capture linear water flow movement. Consequently, existing GW-SW hydrodynamic models face challenges in quantifying the interaction between floodplain floods and GW.
Coupling a 2D hydrodynamic model with a GW model represents the most promising approach to achieve the desired outcome. However, building such a coupled model faces two primary challenges. The first challenge lies in selecting an appropriate 2D hydrodynamic model capable of accurately capturing the periodic or seasonal wetting and drying characteristic of floodplain floods. However, this hydrological process is essential but challenging for most hydrodynamic models to capture [49]. The second challenge pertains to the coupling process between the hydrodynamic model and the GW model. The discrepancy in simulation efficiency between the two models presents a hindrance to model coupling. Hydrodynamic models typically require several days or even longer to complete the simulation, whereas GW models usually only require a few minutes. This disparity further complicates the implementation of model coupling. Additionally, the fine time step required for the hydrodynamic model, often in seconds, poses challenges for real-time coupling with the GW flow model, which typically have much larger time step durations.
The objective of this study was to propose a coupling method between a hydrodynamic model and a GW model to quantitatively assess the interaction between floodplain floods and GW in floodplain areas. In this study, a two-dimensional hydrodynamic model based on TELEMAC-2D was constructed to simulate floodplain floods. Subsequently, a GW model using MODFLOW was developed. The two models were coupled using a loosely coupled approach, and the accuracy of the coupled model was verified. The findings of this research provide an effective tool for understanding the response mechanism of GW to changes in floodplain floods in floodplain areas. In addition, the outcomes of this research will offer a scientific foundation for the comprehensive management and regulation of water resources and the water environment in wetlands.

2. Site Description

The Irtysh River basin is situated in northwest China and spans an area of approximately 52,500 km2. The Piedmont plain in this basin is characterized by low precipitation levels, averaging less than 200 mm/year, and high evaporation rates, exceeding 1200 mm/year, making it a typical arid region. The focus of this paper is the floodplain area located in the middle reaches of the Irtysh River within the piedmont plain. The floodplain area has a width ranging from 10 to 12 km. The elevation of the floodplain area gradually decreases from east to west along the river, while it remains relatively constant along the perpendicular direction to the river. The elevation is approximately 600 m in the east and around 460 m in the west. Based on the temperature data obtained from the Burqin and Aletai hydrometric station, the study area exhibits a yearly average temperature of 4.7 °C, with a mean July temperature of 22.6 °C. The location of the Irtysh River basin is depicted in Figure 1.
The study area is characterized by meandering rivers with slow water flow. During the months of May to June, the river runoff increases due to high mountain snowmelt in the source area, leading to over bankfull discharge and subsequent floodplain floods. These floods can cause large-scale inundation that can persist for a month or even longer. This unique hydrological phenomenon sets the study area apart from the adjacent desert plain, creating a distinct ecosystem. The study area exhibits a rich variety of vegetation types, including dominant tree species such as Populus Euphratica, as well as shrub species dominated by Tamarix chinensis and Salix alba. Together, they form the riparian forests primarily reliant on GW as their hydrological source, playing a crucial role in maintaining the ecological stability of the study area. However, due to the implementation of various water management projects driven by economic and social development, the natural hydrology of the river has been significantly altered, resulting in changes to the characteristics of floodplain floods. The GW depth in the study area is relatively shallow, with most areas being around 2 m and some local areas reaching nearly 4 m. Since floodplain floods serve as a significant recharge source for GW, any changes in it could potentially have a considerable impact on GW levels. Hence, there is an urgent need to establish a reliable approach for assessing the relationship between SW and GW to quantify the impact of altered SW on GW that sustains the riparian forests.

3. Method

3.1. Hydrodynamic Model

3.1.1. Description of TELEMAC-2D Model

The TELEMAC-MASCARET model has been developed by the French National Hydraulics and Environment Laboratory, and it can offer one-dimensional, two-dimensional, and three-dimensional hydraulic modeling for rivers, estuaries, and coasts. TELEMAC-2D, a component of the TELEMAC-MASCARET model, specifically focuses on two-dimensional hydrodynamics. It is designed to simulate water flow with a free water surface, where the width of the water surface is significantly larger than the water depth. The model employs the finite element method to solve the non-conservative form of the shallow water equation (Equations (1)–(3)) [50].
h t + h u x + h v y = 0
u t + u u x + v u y = g Z x + F x + 1 h d i v h v e u
v t + u v x + v v y = g Z y + F y + 1 h d i v h v e v
where h is the water depth; u , v are the flow velocities in x, y directions, respectively; g is the acceleration of gravity; Z is the water level; d i v is the divergence operator; v e is the effective viscosity coefficient; is the gradient operator; F x , F y are the source terms of the equation. The specific solution method of the model can be found in the reference [51]. In this paper, the V7P2 version of TELEMACE-2D is used for simulation, and unstructured grid cell is used to subdivide the domain.

3.1.2. The Establishment of Hydrodynamic Model

To construct the 2D hydrodynamic model, several steps are needed, including determining the simulation scope, dividing the grid cell, preparing the terrain file, and setting boundary conditions. This preparation requires sufficient data, such as geological data, hydrological, meteorological data, and remote sensing image data; data used for this model are listed in Table 1. The simulation area of the model is determined using geological and remote sensing data, and it is divided into unstructured triangular grid cells, with higher grid cell density in the river channel. The model covers an area of approximately 1039 km2, consisting of 580,000 triangular grid cells and over 290,000 nodes. The terrain file is generated by assigning measured elevation point data, DEM data, measured elevation data of channel sections, and remote sensing data to each grid cell. The model includes four boundary conditions, including two inflow boundaries and two outflow boundaries. Figure 2 illustrates the simulation area, grid cell division, and boundary conditions of 2D hydrodynamic model.
The model input comprises terrain conditions, boundary conditions, and the number of parallel processes, which are specified using keywords and written into the model control file (“.cas” file). The time step and Manning’s roughness coefficient of the hydrodynamic model plays a crucial role in determining the simulation accuracy, and their values can be determined during the model calibration phase by trial and error. A comprehensive description of the model establishment, calibration, validation, and application of TELEMAC-2D in the study area can be found in reference [52].

3.2. GW Model

3.2.1. Description of MODFLOW Model

MODFLOW is a software developed by the United States Geological Survey (USGS). The version used in this paper is MODFLOW-2005, which has the ability of simulating three-dimensional GW flow and solute transport. The software operates based on the fundamental principle of using integrated finite differences to calculate the hydraulic head within the central grid (Equation (4)).
x K x x h x + y K y y h y + z K z z h z + W = S h t
where x, y, z are the coordinate axes; K is the hydraulic conductivity along the axis; h is the hydraulic head; W is the unit volume flow; S is the storage capacity or specific yield of the aquifer; t is time.
MODFLOW adopts a modular structure consisting of various main programs and subroutines. The subroutines utilized include RCH for defining areal recharge, which encompasses factors such as rainfall, irrigation, and floodplain floods. The RIV subroutine is used for defining river boundaries and simulating the interaction between rivers and GW in terms of recharge and discharge. The WELL subroutine is employed for simulating lateral recharge and facilitating model calibration. Additionally, the EVT subroutine is utilized for simulating evaporation processes.
Users have the flexibility to define the research area based on their specific needs within MODFLOW. They can select the desired mesh size and perform local refinement to enhance simulation accuracy. The software allows for the specification of boundary types at the model boundaries and assigning corresponding values. Time discretization in MODFLOW is achieved by setting stress periods, which can be flexibly defined to include different time intervals. These features and advantages make MODFLOW a widely utilized tool for the numerical simulation of GW.

3.2.2. The Establishment of GW Model

In order to construct a GW model, it is necessary to gather topographic hydrogeological data, GW level observation data, and irrigation data; data used for the GW model are listed in Table 2. These data play a crucial role in the establishment of the GW model. The process of model construction involves several key steps.
(1)
The simulation range and model boundary conditions should be determined. In this study, the focus is on the floodplain area in the middle reaches of the Irtysh River, covering approximately 1104 km2. The lateral boundary conditions, which consider terrain, geology, and flow field data, encompass inflow boundaries, outflow boundaries, and zero flow (or water separation) boundaries, as shown in Figure 3a. Reasons for this determination are as follows: The BC section and the EF section are considered as lateral inflow sections of GW, and thus generalized as inflow boundaries. The ED section, perpendicular to the GW contour, is treated as an impermeable boundary due to the absence of water exchange. The CD section, with the presence of a mountain named the Small Bashaan Mountain on the eastern side, creating a distinct flow field, is treated as an impermeable boundary. The FG section is influenced by topography and the southern irrigation area, making it a lateral inflow boundary. The south of the HG section is a desert area, and the terrain is relatively flat, resulting in minimal water exchange, and therefore HG is generalized as a zero-flow boundary. The AH section is where GW exits, and is hence generalized as an outflow boundary. Finally, the AB section, influenced by the northern irrigation area, is treated as a lateral inflow boundary. The vertical boundary conditions consist of ground at the top and an impervious layer at the bottom.
(2)
The GW aquifer and source and sink terms should be correctly generalized. Based on the available hydrogeological data, the study area’s aquifers are characterized as homogeneous, isotropic single-layer unconfined aquifer. Considering the specific conditions, the GW model incorporates various recharge components, including floodplain flood GW recharge (FFGR), river channel seepage, canal system seepage, field irrigation infiltration, and lateral recharge. The method of obtaining FFGR will be discussed in the next section. River channel seepage is automatically calculated using the RIV package. Canal system seepage and field irrigation infiltration are calculated based on irrigation and canal data. Lateral recharge is computed using Darcy’s law formula, where hydraulic gradients are derived from GW contours. The main discharge components are represented by evapotranspiration, river channel discharge, and lateral GW discharge. Evaporation data are calculated by multiplying the evaporation coefficient (it has a value of 0.85 in this study) with the large water surface evaporation data from the meteorological station, and river channel discharge and lateral GW discharge are obtained using the same methods described above.
(3)
The model should be discretized in time and space.
The top elevation of the grid is determined by interpolating the measured elevation points, while the bottom elevation is obtained through interpolation of the aquifer bottom elevation from the hydrogeological profiles. The model is designed with a single layer. On the horizontal plane, a regular grid is created with 100 rows and 100 columns. The grid dimensions are 1125 m in length and 491 m in width, resulting in a total of 2012 effective grids.
In the study area, the annual floodplain floods predominantly occur in June, leading to significant changes in GW levels. To capture these dynamics accurately, June is divided into three stress periods, each consisting of 10 days. The remaining 11 months are divided into 11 stress periods, resulting in a total of 14 stress periods.
(4)
The parameters should be determined.
We collected detailed geological survey reports for the study area, which provide comprehensive information about soil properties, hydraulic conductivity, and storage capacity. The topsoil in the study area typically covers a depth of 1 to 2 m and consists of silty clay, fine sand, organic soil, and clayey sand. The underlying layers usually consist of medium sand, medium-fine sand, and clayey sand. The lowest layer is an impermeable bedrock. Based on the actual conditions and parameter values, we divided the model’s parameters into four regions. The hydraulic conductivity and storage capacity values of each region can be established during the model calibration stage. The parameter partition results are illustrated in Figure 3b.

3.3. Hydrodynamic–GW Model Coupling Strategy

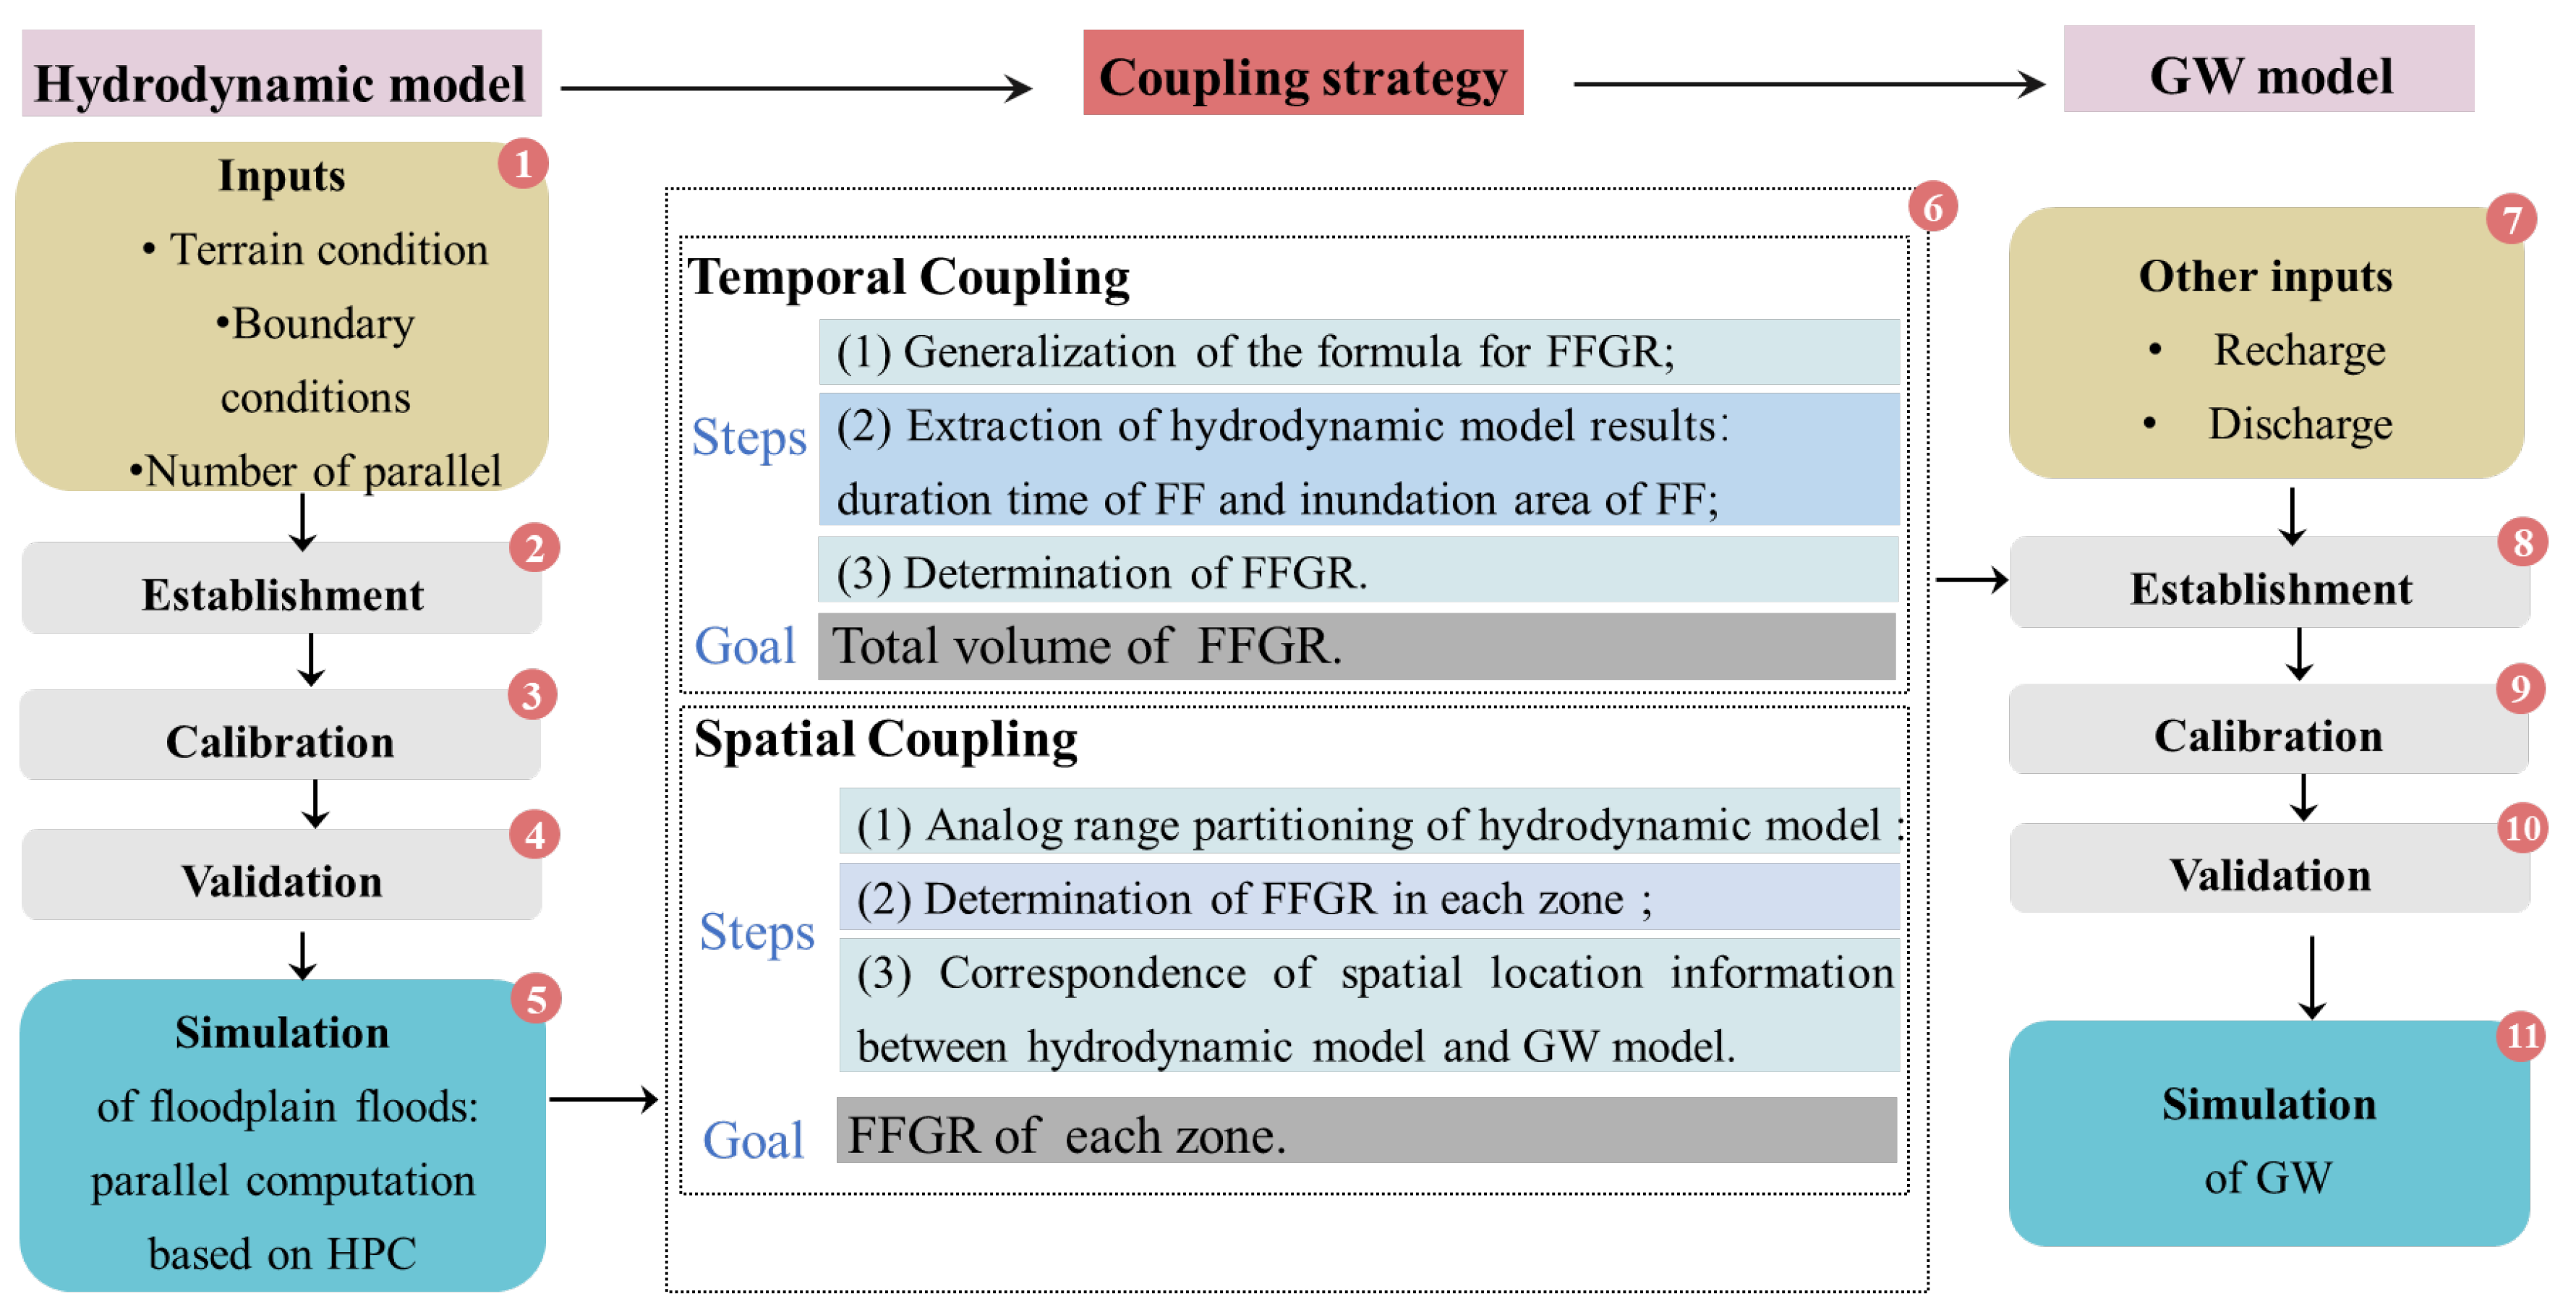
The primary objective of the coupling strategy is to enhance the accuracy of the GW model by incorporating the spatiotemporal variations of floodplain floods and their impacts on GW. To achieve this objective, this study adopts FFGR as the connecting factor between the hydrodynamic model and the GW model. Specifically, the simulation results from the TELEMAC-2D SW model are used to determine the FFGR, which is then integrated into the corresponding boundary conditions of the GW model as input. The coupling principle of the model is illustrated in Figure 4.
The determination of FFGR and its integration into the GW model are critical for achieving the coupling strategy. This study employs both temporal and spatial coupling methods to address these challenges.

3.3.1. Temporal Coupling

Time coupling involves obtaining the inundation duration and area from the hydrodynamic model simulation, determining the FFGR, converting it to daily data, and finally realizing the time step unification between the hydrodynamic and GW models. The specific steps of time coupling are as follows:
(1)
Generalization of the formula for FFGR:
Through the analysis and simplification of the infiltration process, the calculation formula for calculating FFGW based on the flood inundation duration, inundation area, and infiltration rate is constructed:
W R e c h a r g e G = f ( t , f c ( t ) , S t )
where W R e c h a r g e G is the FFGR during the entire flood process; t is time; f c ( t ) is the time-varying infiltration rate; S t is the time-varying floodplain flood inundation area.
For this study area, due to the insufficient data from field infiltration experiments, the FFGR during the entire flood process can be simplified by considering a stable infiltration rate, which means that as long as there is floodwater on the ground, the SW will recharge the GW at a constant infiltration rate until the floodwater dissipates. The premise of this simplification is based on the research area being an arid region with an excess of seepage runoff, and that floods have a prolonged infiltration duration, usually lasting more than 7 days. In this condition, the flood duration is considered to be five times the time required for the infiltration rate to stabilize (which is usually less than 36 h for medium or fine sand [53]). Thus, the error caused by substituting a stable infiltration rate for a changing infiltration rate (of short duration) can be neglected compared to the total FFGR. The calculation for FFGR is given by
W R e c h a r g e G = f c t 0 t 1 S t d t
where f c is the stable infiltration rate; t0, t1 are the start time and end time of flood infiltration respectively. All the values of the above variables are greater than 0.
(2)
Extraction of hydrodynamic model results:
Equation (2) highlights that the determination of FFGR relies on the flood duration and the inundation area. These values are obtained from the simulation results of TELEMAC-2D. The total number of flood days ( K m a x ) can be directly extracted from the simulation output.
In accordance with the information provided in Section 3.1.2, the hydrodynamic model utilized in this study consists of a substantial number of triangular grid cells, with each grid cell composed of three nodes. The simulation result file of the hydrodynamic model contains crucial details including node coordinates, the topological relationship between nodes and grid cells, as well as information pertaining to water depth, flow velocity, and water surface elevation for each node. To determine the inundation state of a triangular grid cell, it is considered to be inundated if the water depth at any of its vertex coordinates is greater than zero. Heron’s formulas are employed for calculating the area of a particular triangular grid cell in an inundated state as follows:
s i ( t ) = p i ( t ) ( p i a i ( t ) ) ( p i ( t ) b i ( t ) ) ( p i c i ( t ) ) p i ( t ) = ( a i ( t ) + b i ( t ) + c i ( t ) ) / 2 a i ( t ) = ( x i 1 ( t ) x i 2 ( t ) ) 2 + ( y i 1 ( t ) y i 2 ( t ) ) 2 b i ( t ) = ( x i 3 ( t ) x i 1 ( t ) ) 2 + ( y i 3 ( t ) y i 1 ( t ) ) 2 c i ( t ) = ( x i 2 ( t ) x i 3 ( t ) ) 2 + ( y i 2 ( t ) y i 3 ( t ) ) 2
where i represents a inundated grid cell; s i ( t ) is the area of the i-th grid cell at time t; p i t ,   a i t ,   b i t ,   c i t are the intermediate variables at time t of the i-th grid cell; ( x i 1 ( t ) , y i 1 ( t ) ) ,   ( x i 2 ( t ) , y i 2 ( t ) ) ,   ( x i 3 ( t ) , y i 3 ( t ) ) are the coordinates of the three nodes that make up the i-th grid cell.
The total inundated area at time t is calculated by the following formula:
S ( t ) = i = 0 i = N S i ( t )
where N is the total number of grid cells in inundated state at time t.
(3)
Determination of FFGR:
The inundation status at a specific time T represents the flooding condition for that day. By combining the above two steps, Equation (9) can be obtained, from which the daily FFGR throughout the simulation period can be calculated. This establishes a time coupling relationship between the GW model and the two-dimensional hydrodynamic model:
W R e c h a r g e G K = f c K ( T ) S K ( T )
where K represents the sequential order of the flood days; W R e c h a r g e G K is FFGR on day K; f c K ( T ) is the infiltration rate at time T on day K (mm/d); S K ( T ) is the floodplain flood inundation area at time T on day K.
For a specific simulation area, f c ( T ) can be determined through infiltration tests. In this study, we adopt the value of f c ( T ) to be 0.5 mm/min through reports collected from the geological bureau. The equation for calculating the FFGR over the entire flood duration is as follows:
W R e c h a r g e G = K = 1 K m a x W R e c h a r g e G K = K = 1 K m a x f c K T · S K T              
where W R e c h a r g e G is the FFGR over the entire flood duration, 0 W R e c h a r g e G W R e c h a r g e G m a x ; K m a x is the total number of flood days; W R e c h a r g e G m a x is the maximum value of FFGR, which is equal to the volume of the vadose zone multiplied by the storage capacity.
In this study, the flood situation at 0 o’clock is considered representative of the entire day. Therefore, Equation (10) can be simplified to
W R e c h a r g e G = K = 1 K m a x W R e c h a r g e G K = f c K = 1 K m a x S K ( 0 )
where S K ( 0 ) is the floodplain flood inundation area at day K. Based on the hydrogeological profile data, the unsaturated zone depth in the study area was determined, and the storage capacity was obtained from the geological data. Consequently, W R e c h a r g e G m a x was calculated to be 291 million m3.

3.3.2. Spatial Coupling

The spatial coupling involves inputting the FFGR into the GW model based on the spatial correspondence between the hydrodynamic model and the GW model, ensuring accurate GW simulation. The specific steps are as follows:
(1)
Analog range partitioning of hydrodynamic model:
The floodplain flood area undergoes dynamic changes, with varying water inflows each year, resulting in different inundation patterns. However, due to topographical variations, certain areas experience longer periods of submergence compared to others. In the absence of considering infiltration rates, areas with longer inundation durations receive higher FFGR, while areas with shorter inundation durations receive lower infiltration recharge. Therefore, the initial step in spatial coupling is to partition the simulation range of the hydrodynamic model based on the duration of inundation.
Flood simulations are conducted based on the hydrodynamic model, using the data of years with the highest water volume. From the simulation results, the year with the widest inundation area is identified and analysis is performed, and processing of its result files is carried out using ArcGIS. The process involves a. Extracting water depth data at time T every day for all nodes in the result file and assigning inundation attributes of 1 and 0 to nodes with a water depth greater than zero and less than zero, respectively; b. Performing interpolation using spatial interpolation tools based on the inundation attributes of the nodes to obtain K m a x individual daily inundation range raster files; c. Using the Raster Calculator tool in the spatial analysis tools to sum up the K m a x individual inundation range raster files, resulting in one raster file representing the number of days of inundation. From this file, we can determine the duration of inundation at each location.
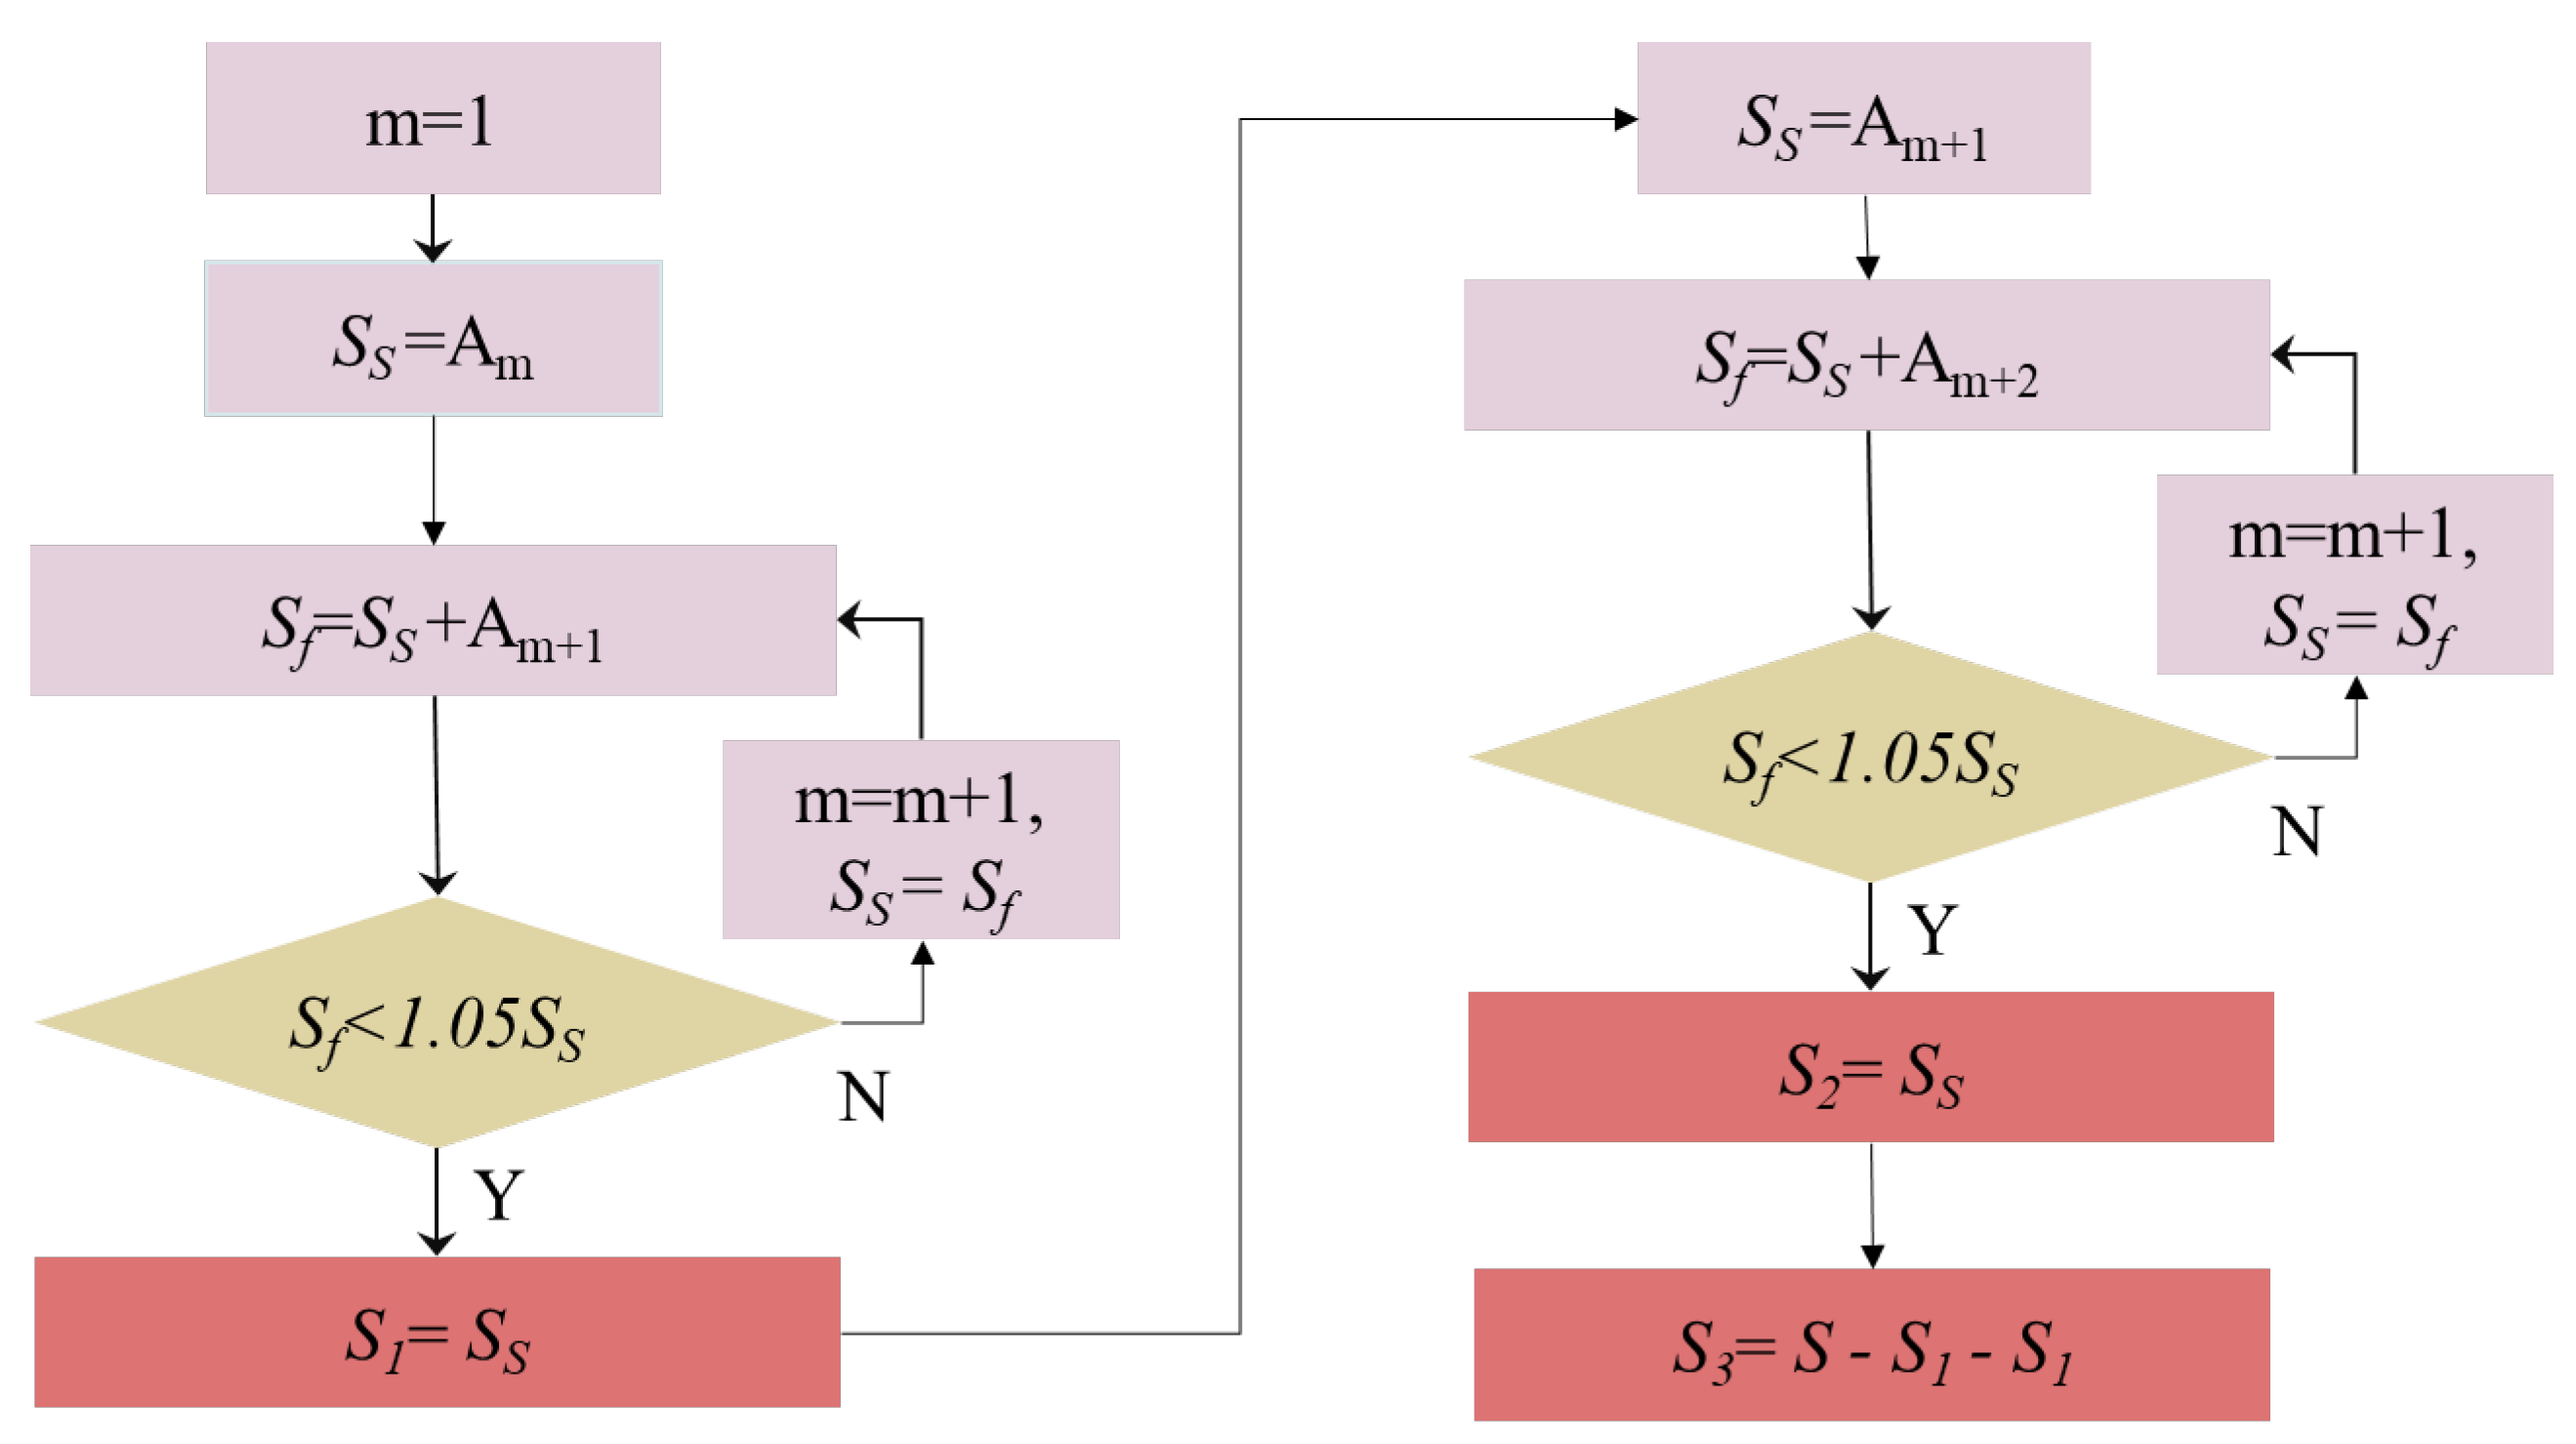
Subsequently, the raster file is reclassified using the Reclassify tool in Spatial Analyst Tools, considering the “ratio” of submerged time at each site to the total duration of submersion. This reclassification facilitates the division of the 2D hydrodynamic model into several zones. By utilizing ArcGIS, the area of each region can be quantified. Steps for the division of the simulation area are as follows: Firstly, based on the mentioned “ratio”, the simulation area is divided into 20 subzones at 5% intervals, with area of each subzone denoted as A1, …, A20. Next, the number of zones for model partitioning is determined, along with the respective area of each zone. In this study, based on the hydrodynamic model simulation results in 2016, the simulation area of the hydrodynamic model is divided into three zones, and the area of the corresponding zones are S1, S2, S3. The division process is elaborated using Figure 5, where m, Ss, Sf are intermediate variables.
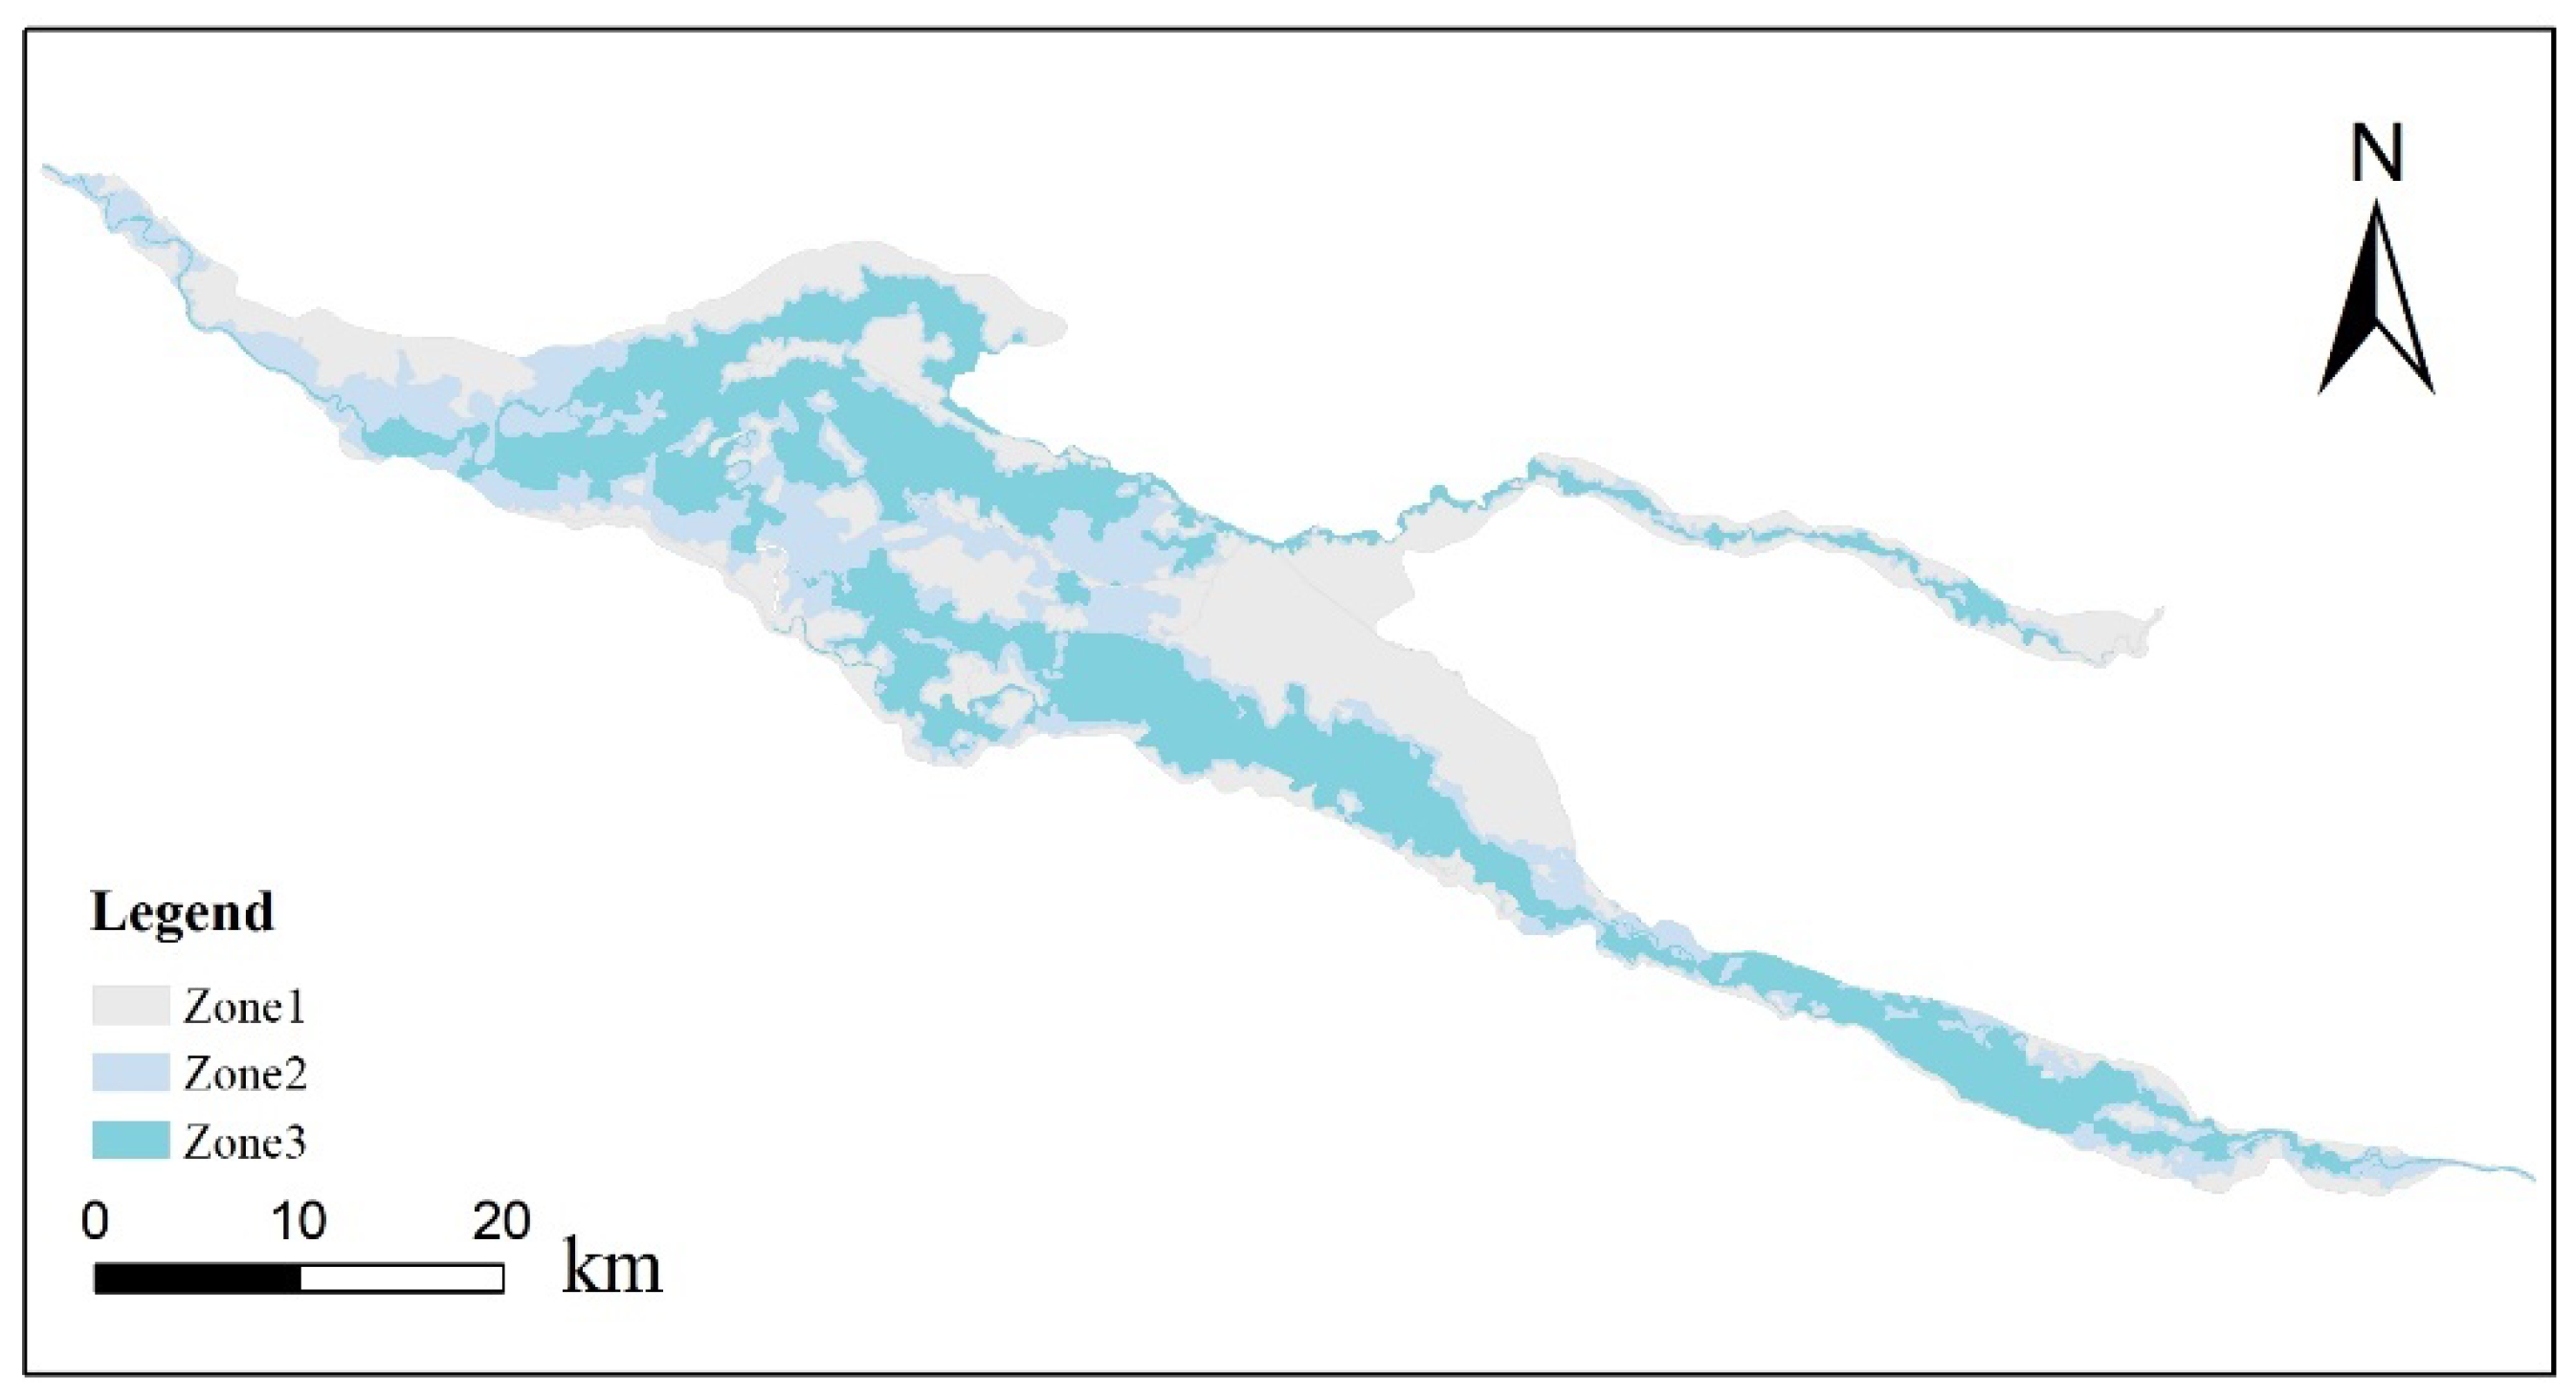
Using the determination of S1 as an example, a brief explanation of Figure 5 is provided. Assuming that there are two potential values for S1, A1 and A1 + A2, if A1 + A2 is only up to 5% larger than A1, which can be expressed as A1 + A2 < 1.05 A1, then S1 equals A1. Conversely, if the increase exceeds 5%, then S1 = A1 + A2. By employing the aforementioned approach, the two-dimensional hydrodynamic model area is partitioned into three zones based on the proportion of inundation duration within the intervals of 0% to 5%, 5% to 80%, and 80% to 100% of the total duration. These three delineated regions have respective areas of 385 km2, 266 km2, and 388 km2, as illustrated in Figure 6.
(2)
Determination of FFGR in each zone:
According to the areas of each zone and the proportion of submerged days obtained in step (1), the average submerged days for each zone can be calculated using the following equation:
K n = p = L p = H S n ( p ) ( p K m a x ) S n = q n · K m a x
where Kn is the average number of days submerged in the n-th zone; p represents the proportion of submerged days in the n-th zone to the total number of days; H, L are the lower limit and upper limit of p in the n-th zone, respectively; S n ( p ) is the area where the proportion of submerged days to the total number of days in the n-th zone is p; qn is the ratio of the average submerged days of the n-th zone to the total submerged days of the entire region, q n = p = L p = H S n ( p ) p / S n . In this study, the values of q1, q2, q3 are 2%, 50%, and 95%, respectively.
Based on the whole FFGR obtained in Section 3.3.1, the area of each zone and the average submerged days of each zone obtained in step (1), the FFGR in each zone can be obtained using the following equation:
W n = q n S n q 1 S 1 + + q n S n W R e c h a r g e G
where W n is the FFGR in the n-th zone.
In the study area, the FFGR in each zone is as follows:
W 1 = 0.015 W R e c h a r g e G
W 2 = 0.261 W R e c h a r g e G
W 3 = 0.724 W R e c h a r g e G
where W1, W2, W3 are the FFGR in zone1, zone2, and zone 3, respectively.
(3)
Correspondence of spatial location information:
First, establish the spatial correspondence between the GW model and the hydrodynamic model based on their coordinate information, as illustrated in Figure 7. Next, transform the results from step (2) into an FFGR intensity that aligns with the time step of the GW model. Then, input this recharge intensity into the GW model based on the established spatial correspondence, thereby achieving model coupling.
Finally, incorporate other recharge and discharge components into the GW model to complete the accurate simulation of the GW level.

4. Results

4.1. Calibration and Validation of the Models

4.1.1. The 2D Hydrodynamic Model

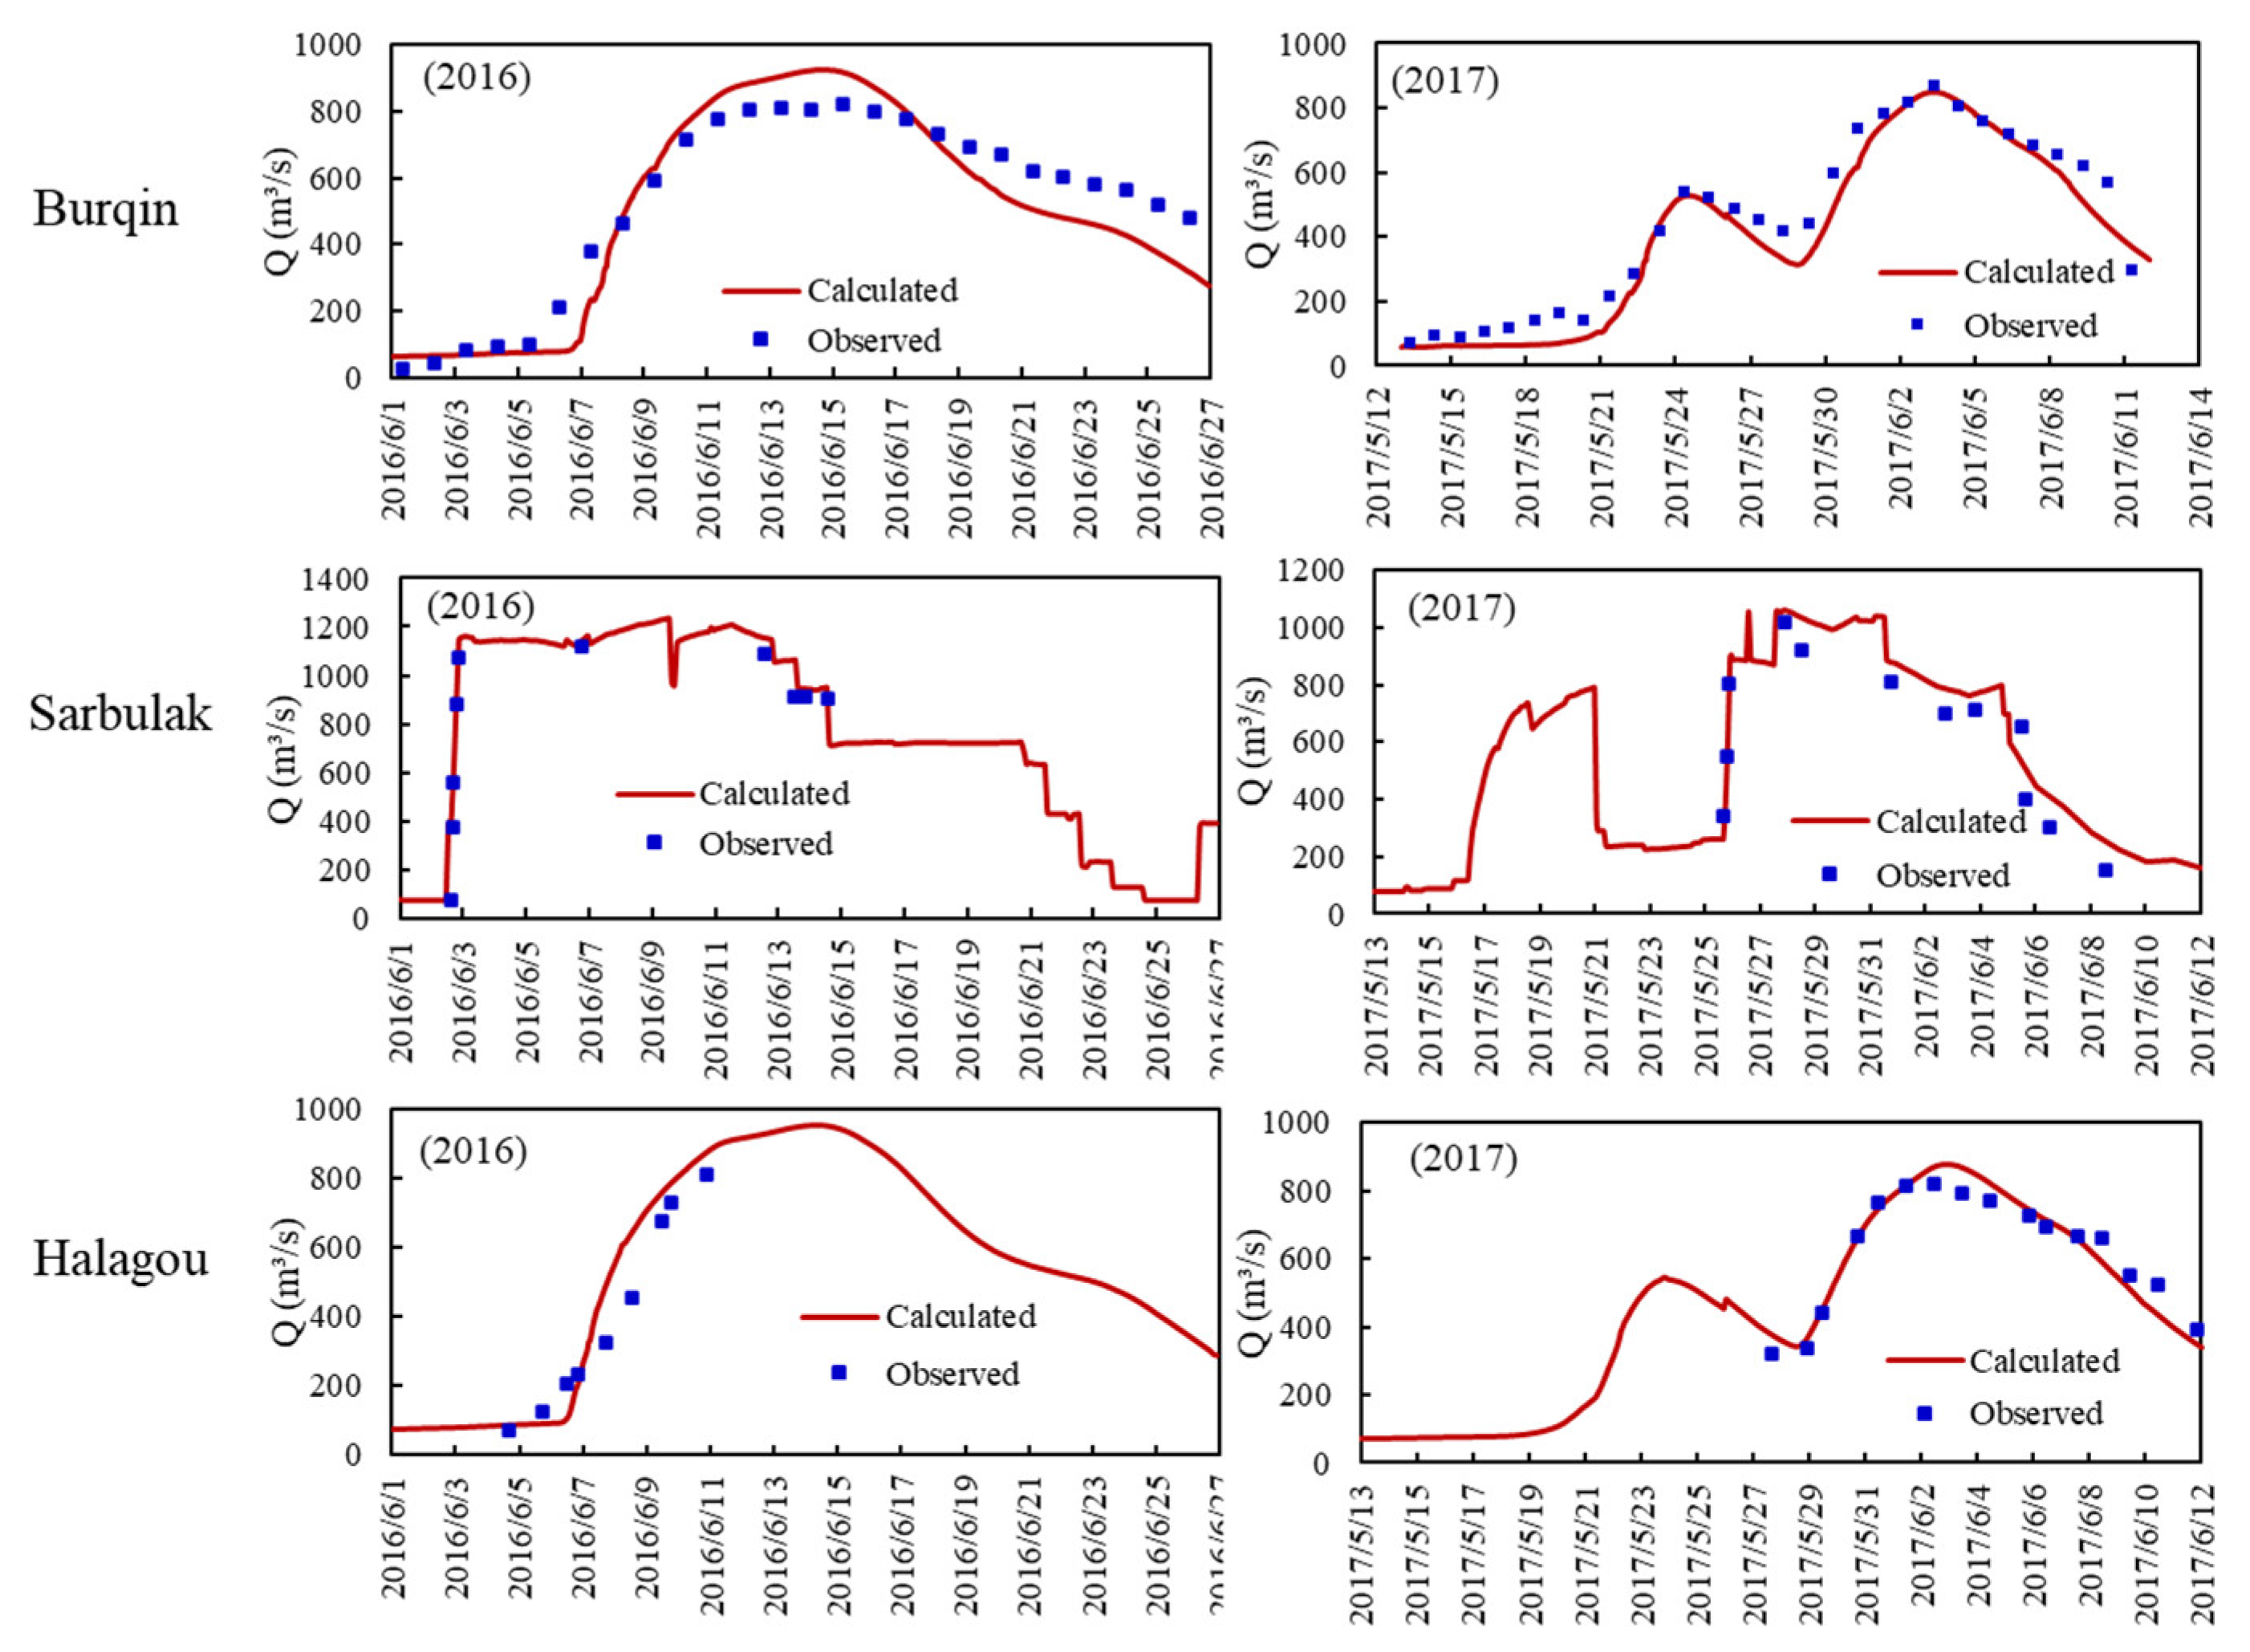
Considering the occurrence of two major floods in 2017, a higher level of model accuracy is required. Therefore, the flood events in 2017 are chosen for the parameter calibration, while the flood events in 2016 serve for the model validation. The measured flow data from three monitoring sites, namely Burqin hydrometric station, Sarbulak, and Halagou Mudao Bridge, are utilized for the calibration and validation process of the model. The Nash efficiency (NSE) values, calculated based on the observed and simulated peak flows, are used to assess the model performance.
During the calibration process of the model, we found that the model exhibits stability when using a time step of 5 s, and a Manning’s roughness coefficient of 0.045 for the river reach and 0.059 for other areas results in a notably accurate fit. At this stage, the NSE values for Burqin, Sarbulak, and Halagou Mudao Bridge are 0.88, 0.85, and 0.85, respectively. During the model validation stage, the NSE values are 0.93, 0.85, and 0.94 for the respective sites, which further confirmed the rationality of the parameter values. Additionally, the accuracy of the model is further confirmed by comparing the inundation area derived from the model simulation results with remote sensing images, showing an error of less than 15% [52]. Moreover, the comparison between the calculated and observed hydrographs for the wet periods in 2016 and 2017 at the three sites (Burqin, Sarbulak, Halagou Mudao Bridge) is depicted in Figure 8, demonstrating a strong agreement. These results collectively demonstrate the high precision of the 2D hydrodynamic model in simulating flood dynamics. For a more comprehensive understanding of the calibration and validation process of the 2D hydrodynamic model in the study area, please refer to [52].

4.1.2. The Coupled Hydrodynamic–GW Model

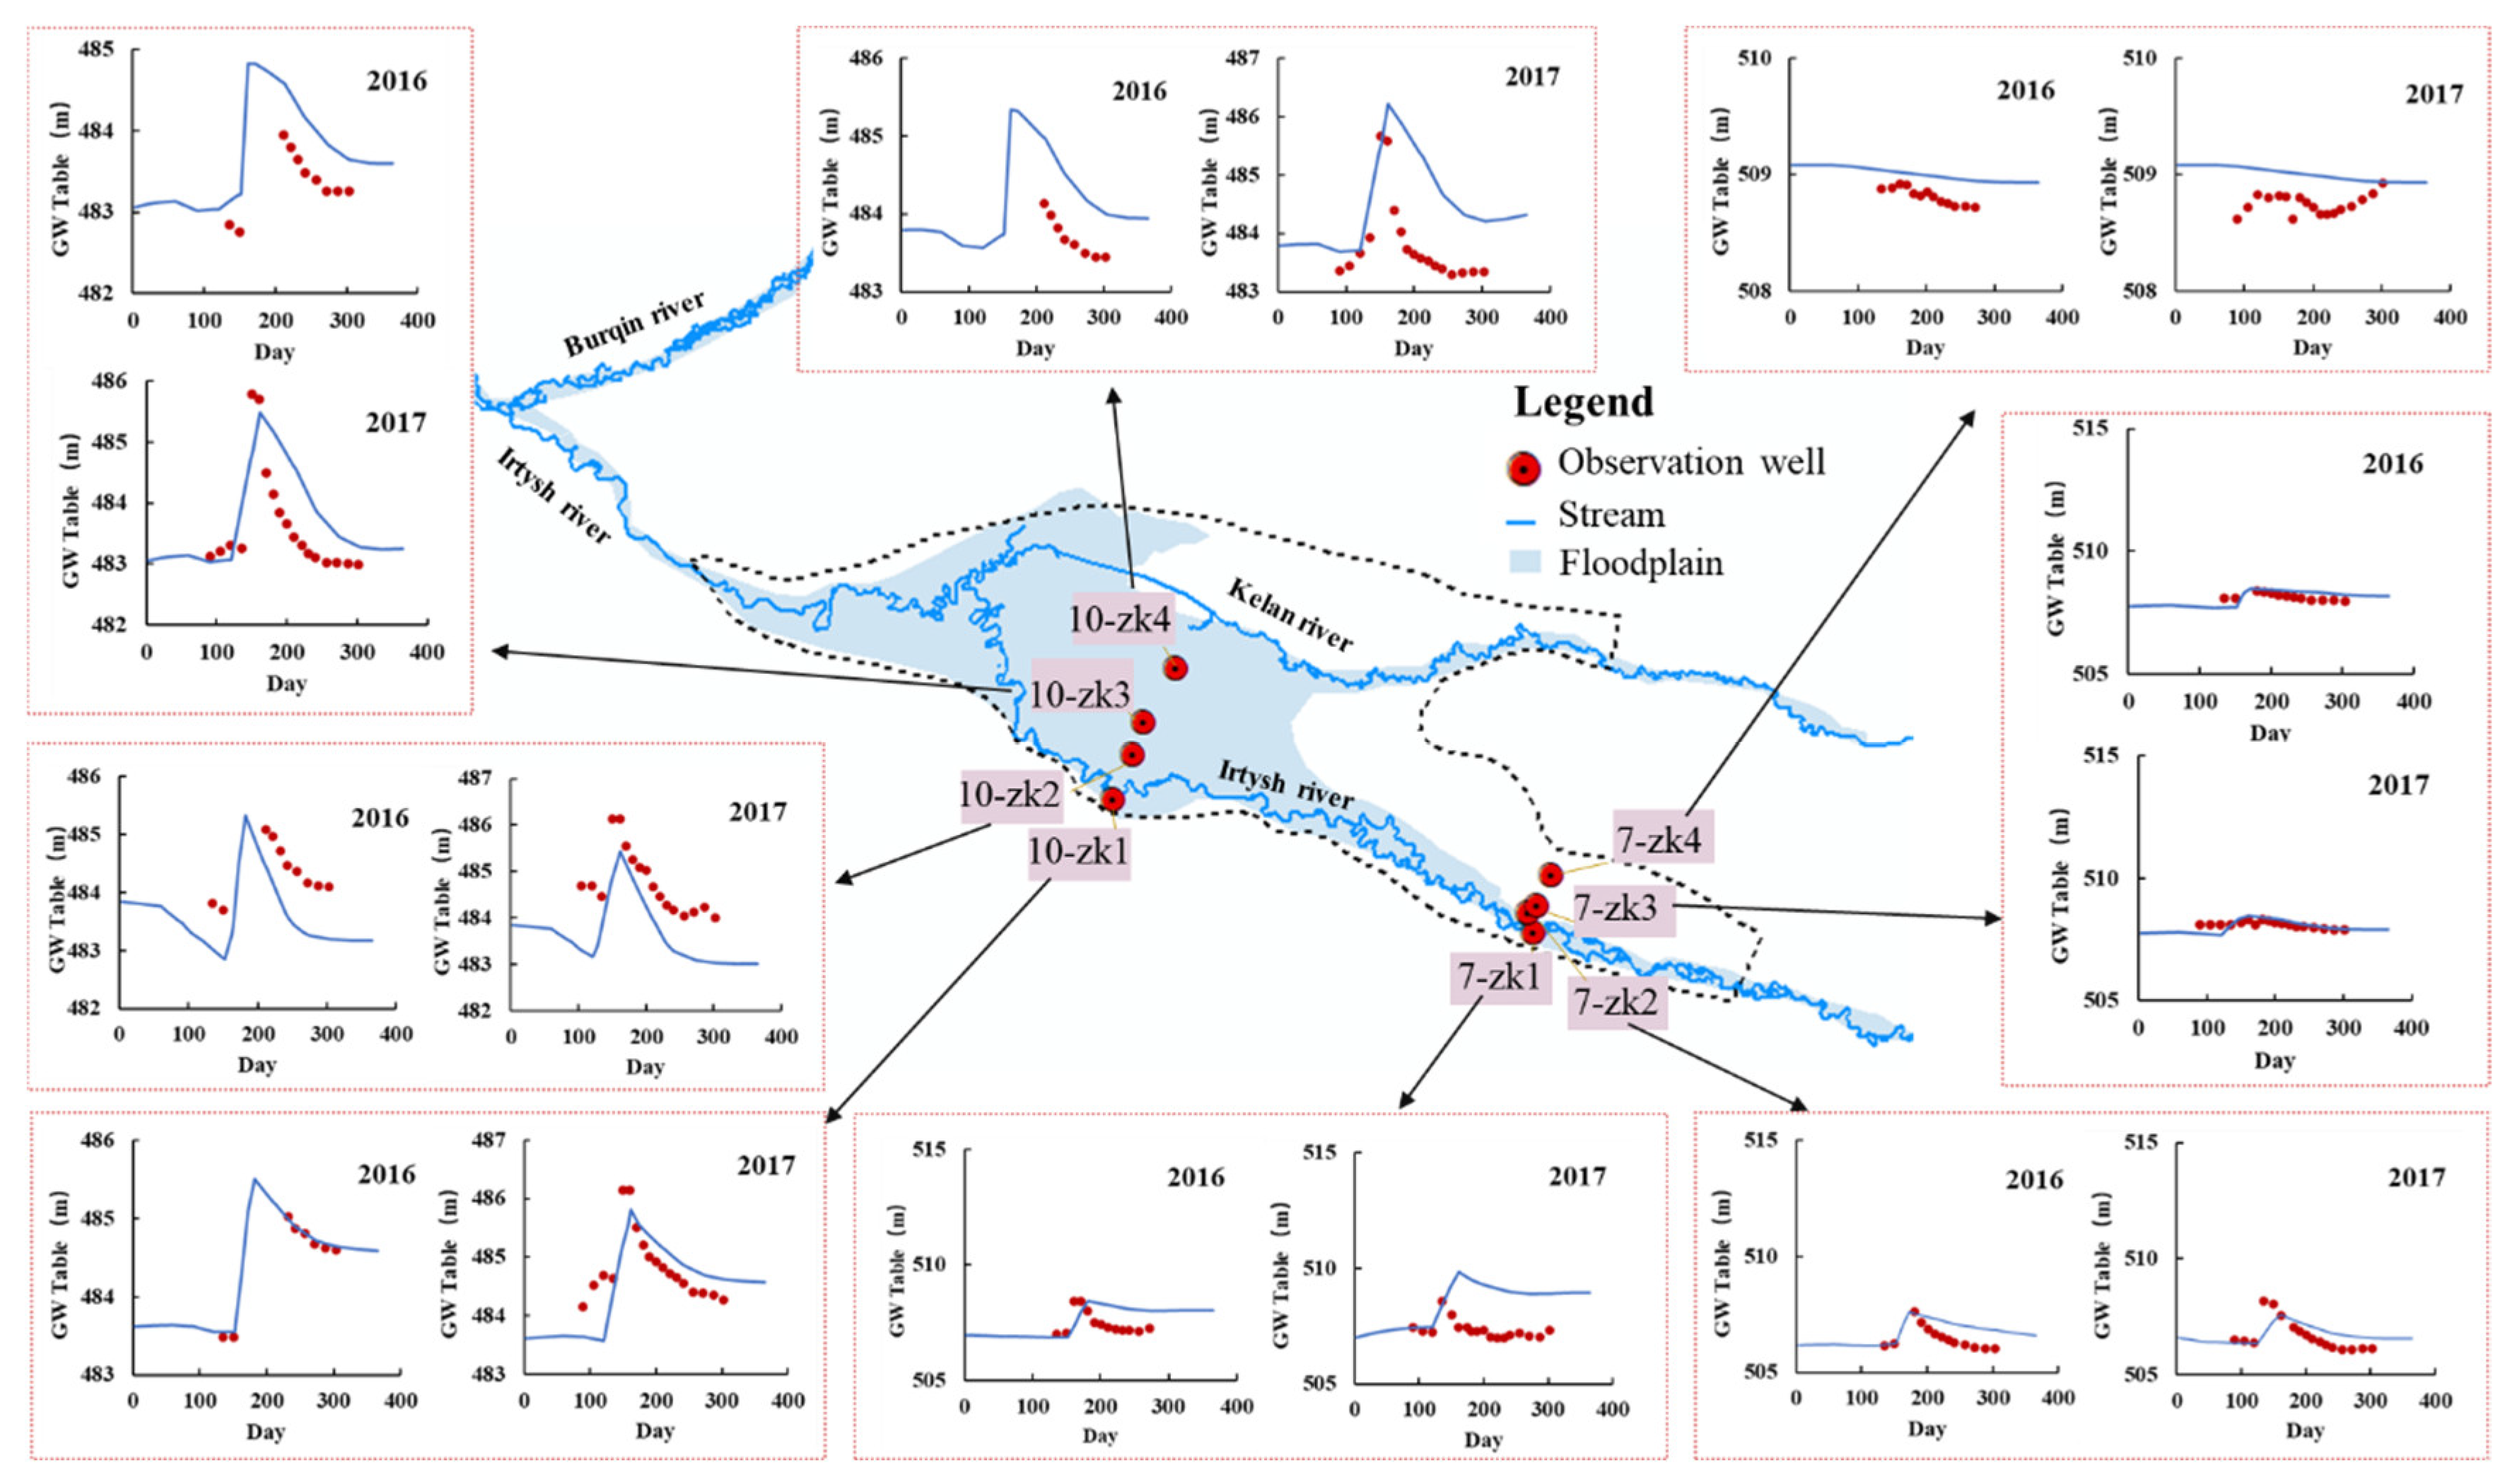
The GW model uses the 2016 dataset for calibration and the 2017 dataset for validation. As described in Section 3.1.1, the FFGR in the GW model relies on the results from the hydrodynamic model. Therefore, the first step is to employ the hydrodynamic model to simulate the extent of floodplain flooding in 2016 and 2017. The simulation results can be observed in Figure 9. Once all source and sink items of the GW model are determined, we can proceed to simulate the GW in the study area and calibrate as well as validate the coupled hydrodynamic–GW model. The root mean squared error (RMSE) values for GW levels, obtained from the comparison between observations and calculations, are used to assess the model performance. There are eight observation wells located within the simulation area, and GW levels are manually measured on the 10th, 20th, and 30th of each month. It should be noted that there are instances of some missing data due to flood inundation, which prevents access to the observation wells.
Similar to the hydrodynamic model, in the calibration phase, we determined parameter values through trial and error and assessed their validity through model validation. In this study, the hydraulic conductivity and storage capacities for regions 1, 2, 3, and 4 (Figure 3b) are 3 m/d and 0.24, 5 m/d and 0.18, 2.1 m/d and 0.22, and 2.6 m/d and 0.24, respectively. RMSE values in calibration and validation stage are presented in Table 3. The average RMSE values for 2016 and 2017 are 0.51 and 0.77, respectively. In 2016, the errors range from 0.05 to 0.88, while in 2017, the errors range from 0.2 to 1.74. It is worth noting that only Wells 7-zk1 and 10-zk2 show RMSE values higher than 1 in 2017, which may be attributed to their specific locations or parameter settings. Compared to other studies using coupled GW (GW) models [54], the RMSE in this study is within a reasonable range.
To further demonstrate the effectiveness of the coupled model, we compared the simulation results of GW levels with measurements from eight observation wells, as shown in Figure 10. The results demonstrate that the model effectively captures the trend of GW level changes. In areas susceptible to floodplain flood inundation, the model accurately simulates the rapid rise and fall of GW levels during flood events, such as at locations 7-zk2, 10-zk1, and 10-zk3. In areas unaffected by floodplain floods, the model simulates a gradual change in GW levels, consistent with the actual conditions observed, as seen at location 7-zk4.

4.2. Water Balance of the Coupled SW–GW Model

Figure 11 displays the water balance results obtained from the GW models for the years 2016 and 2017. The term “storage” refers to the amount of water controlled by the aquifer, while “lateral boundary” and “river” represent the quantities of water exchanged between the simulated area and the adjacent aquifer, as well as between GW and the river, respectively. “RCH” encompasses the GW recharge from irrigation, canals, and floodplain floods, while “evaporation” denotes the amount of water lost through evaporation.
From Figure 11, it is evident that “RCH” contributes the largest proportion to the GW recharge. In the study area, the recharge from irrigation and canals depends on the irrigated area and canal length, amounting to approximately 102 billion m3. Notably, the recharge from floodplain floods surpasses 300 billion m3 in both 2016 and 2017. This substantial volume of water cannot be overlooked in GW numerical simulations. Additionally, “evaporation” constitutes the predominant portion of GW discharge. This can be attributed to the study area’s location in an arid inland region with high evaporation rates. Moreover, the discharge exceeds the recharge in both 2016 and 2017, indicating a rise in GW levels towards the end of the year. However, it is important to note that this discrepancy may be attributed to the accuracy of the GW model. In reality, the GW level should remain relatively stable throughout the year. Furthermore, the contribution of GW recharge from rivers and lateral boundaries is limited in the study area.

5. Discussion

5.1. Accurate Spatiotemporal Simulation of GW Table

Numerical simulation studies have made significant strides in capturing the SW and GW interaction and enhancing the accuracy of GW simulation results. However, most of these studies have primarily focused on the impact of rivers on GW dynamics [29,33,55], while investigations quantifying the influence of floodplain flood inundation on GW are scarce. This disparity can be attributed to the challenges associated with coupling the 2D hydrodynamic model with the GW model, as mentioned in the introduction. Building upon the water balance results in Section 4.2, it becomes evident that floodplain floods represent a substantial source of GW recharge, underscoring the need to address these challenges proactively.
To tackle the first challenge, this study draws inspiration from TELEMAC-2D’s ability to simulate the alternation of wetting and drying in tidal zones [56,57,58], employing TELEMAC-2D for simulating flooding in areas with alternating wet and dry conditions. Regarding the second challenge, this study enhances the simulation efficiency of the hydrodynamic model by leveraging parallel computing capabilities of TELEMAC-2D on a high-performance computer (the feasibility and stability of this approach have been validated in prior research [59]). Additionally, through the coupling strategy proposed in this paper, the issue of disparate time steps between the hydrodynamic model and GW model has been resolved. Fu [60] employed the MIKE11 software to construct a one-dimensional hydrodynamic model for simulating river flow, while the MIKESHE model was utilized for GW simulation. The coupling of SW and GW models was achieved through the internal coupling module of MIKESHE. Additionally, remote sensing data were utilized for acquiring floodplain wetland area information. However, in this study, it was solely utilized for supplementary validation of the SW model. Applying the proposed coupled model in this region can offer comprehensive flooding simulations and encompass the mutual interactions between SW and GW. Hester [61] conducted flood inundation experiments in the floodplain section of Stroubles Creek in the United States to investigate the vertical exchange mechanism between floodplain floods and GW. The GW level monitoring results revealed a noticeable rise in GW levels at shallow monitoring points during flood events, aligning with changes of GW in this study. Utilizing the proposed coupled model allows for simulating the impact of large-scale floodplain floods on GW levels, offering a more efficient and cost-effective approach compared to on-site flood experiments. Above all, the integrated model presented in this study demonstrates a high level of accuracy in capturing the spatiotemporal variations of GW under the influence of floodplain floods (Figure 10), and it offers a novel approach for quantifying GW levels in regions strongly influenced by flood inundation.

5.2. Recommendations during Coupled Model Modeling

To effectively utilize the proposed linking method for accurate GW simulation, the following considerations are necessary when constructing the coupled hydrodynamic–GW model:
  • Digital Elevation Models (DEMs) are vital for both hydrodynamic and GW modeling, and it is crucial to carefully check and correct them to ensure accurate simulation results. The hydrodynamic model’s accuracy is directly influenced by precise elevation data, as it determines flow rates and directions. Similarly, the GW model relies on accurate elevation information to assess the deviation between the model’s top elevation and the phreatic level, known as the phreatic depth. To enhance simulation accuracy, it is recommended to utilize measured elevation data for both hydrodynamic and GW models.
  • Accurate zoning of the hydrodynamic model is crucial for the successful coupling strategy. In this study, the simulation range of the hydrodynamic model is divided into three zones based on the proportion of inundation time. The rationale behind this choice stems from the observation that finer partitioning based on the proportion of inundation time does not yield substantial differences in the resulting zone areas. However, pursuing a more refined partitioning approach would entail a significant increase in workload without commensurate benefits, rendering it cost ineffective. Therefore, it is recommended to determine the SW zoning based on the specific characteristics of the model.

5.3. Model Limitations

The coupled model proposed in this study demonstrates the ability to accurately capture changes in the GW table under changing floodplain flood conditions. However, there are certain limitations that can be addressed in future studies to further enhance its effectiveness.
The coupling method employed in this study is a one-way coupling method, focusing on describing the changes in GW resulting from SW recharge and discharge. However, it does not account for the reciprocal influence of GW on SW dynamics. Addressing this limitation could involve incorporating the GW supply from floodplain floods as a water loss component in the hydrodynamic model during the model establishment period. This approach would enable a more comprehensive representation of the interactions between GW and floodplain floods.
An additional improvement to the coupled model involves enhancing the efficiency of flood inundation simulation. Considering the lengthy timescale of GW evolution, GW prediction periods typically span several decades [26,62,63,64,65]. In capturing the influence of long-term changes in flood inundation characteristics on GW, the coupling model developed in this study proves to be effective. While parallel simulation significantly enhances efficiency, hydrodynamic simulation for extended forecast periods remains time consuming. A promising approach to simulate and predict the spatial and temporal distribution of flood inundation is by leveraging machine learning techniques. Machine learning can provide a valuable tool for accurately modeling and forecasting flood inundation, thereby improving the overall performance and efficiency of the coupled model.
Furthermore, it is important to note that the infiltration process is significantly simplified when calculating FFGR. In reality, the infiltration process of SW is complex and varies across different regions. Therefore, in future studies, it is necessary to address the simplification of the infiltration process in a more nuanced manner, taking into account the specific characteristics of the study area. By improving the treatment of the infiltration process, the accuracy of the coupling model can be enhanced, leading to more reliable GW recharge estimations.

6. Conclusions

In the floodplain areas, floodplain floods play a significant role in GW recharge. To accurately quantify the impact of flood evolution on GW and enhance the simulation accuracy of GW, this study proposes a coupling strategy to establish a loose coupling between the hydrodynamic model TELEMAC-2D and the GW model MODFLOW. The calibration and validation results of the coupled model exhibit RMSE values of 0.51 m and 0.77 m, respectively, which indicate the coupling strategy is rational. Furthermore, the water balance analysis highlights FFGR is the primary source of GW recharge in the study area.
The results demonstrate that the coupled model effectively captures the impact of floodplain floods on GW dynamics. This includes capturing the temporal fluctuations of GW levels and the spatial variations across the study area. In arid plain regions, floodplain floods contribute significantly to GW recharge, highlighting the importance of considering its influence in GW modeling. Previous approaches often represented the influence of SW on GW using simplified nodes or linear river representations. However, the complex nature of floods necessitates a more comprehensive consideration of the spatial and temporal variability of SW in GW simulations, departing from the conventional approaches.
The developed coupling model in this study represents a novel step in integrating the hydrodynamic model with the GW model, offering valuable guidance for investigating the interplay between SW and GW, studying wetland ecosystem dynamics, and formulating optimized reservoir operation strategies. Furthermore, this coupling strategy is not limited to the Irtysh River basin but can be applied to other floodplain regions worldwide. For instance, it holds potential for studying areas such as the Tarim River Basin in China, the Colorado River Delta in Mexico, and the Murray–Darling River basin in Australia.

Author Contributions

Conceptualization, Y.L., Y.J. and S.Z.; Methodology, Y.L.; Software, Y.L. and D.W.; Validation, Y.L. and D.W.; Formal analysis, Y.L. and D.W.; Resources, D.W.; Writing—original draft, Y.L.; Writing—review & editing, Y.L.; Visualization, Y.L.; Supervision, Y.J., S.Z. and H.C.; Project administration, S.Z. All authors have read and agreed to the published version of the manuscript.

Funding

This research was funded by Regional Rural Environmental Pollution Research Center of Jiangsu Open University, grant number 22-KYPT-Z04.

Data Availability Statement

The initial data for the study and the main results are available from the corresponding author upon request, however, approval will be required from the funding agency.

Acknowledgments

The authors would like to thank all the reviewers who participated in the review.

Conflicts of Interest

The authors declare no conflict of interest. The funders had no role in the design of the study, in the collection, analyses, or interpretation of the data, in the writing of the manuscript, or in the decision to publish the results.

References

  1. Tockner, K.; Stanford, J.A. Riverine flood plains: Present state and future trends. Environ. Conserv. 2002, 29, 308–330. [Google Scholar] [CrossRef]
  2. Grizzetti, B.; Liquete, C.; Pistocchi, A.; Vigiak, O.; Zulian, G.; Bouraoui, F.; De Roo, A.; Cardoso, A.C. Relationship between Ecological Condition and Ecosystem Services in European Rivers, Lakes and Coastal Waters. Sci. Total Environ. 2019, 671, 452–465. [Google Scholar] [CrossRef]
  3. Gómez-Baggethun, E.; Tudor, M.; Doroftei, M.; Covaliov, S.; Năstase, A.; Onără, D.F.; Mierlă, M.; Marinov, M.; Doroșencu, A.C.; Lupu, G.; et al. Changes in Ecosystem Services from Wetland Loss and Restoration: An Ecosystem Assessment of the Danube Delta (1960–2010). Ecosyst. Serv. 2019, 39, 100965. [Google Scholar] [CrossRef]
  4. Karimi, S.S.; Saintilan, N.; Wen, L.; Valavi, R.; Cox, J. The ecohydrological impact of water resource developments through inundation regime analysis of a large semi-arid floodplain. J. Hydrol. 2021, 596, 126127. [Google Scholar] [CrossRef]
  5. Selwood, K.E.; Clarke, R.H.; McGeoch, M.A.; Mac Nally, R. Green Tongues into the Arid Zone: River Floodplains Extend the Distribution of Terrestrial Bird Species. Ecosystems 2016, 20, 745–756. [Google Scholar] [CrossRef]
  6. Ramberg, L.; Wolski, P.; Krah, M. Water balance and infiltration in a seasonal floodplain in the Okavango Delta, Botswana. Wetlands 2006, 26, 677–690. [Google Scholar] [CrossRef]
  7. Wu, C.; Webb, J.A.; Stewardson, M.J. Modelling Impacts of Environmental Water on Vegetation of a Semi-Arid Floodplain–Lakes System Using 30-Year Landsat Data. Remote Sens. 2022, 14, 708. [Google Scholar] [CrossRef]
  8. Sims, N.C.; Colloff, M.J. Remote sensing of vegetation responses to flooding of a semi-arid floodplain: Implications for monitoring ecological effects of environmental flows. Ecol. Indic. 2012, 18, 387–391. [Google Scholar] [CrossRef]
  9. Hayes, D.S.; Brändle, J.M.; Seliger, C.; Zeiringer, B.; Ferreira, T.; Schmutz, S. Advancing towards functional environmental flows for temperate floodplain rivers. Sci. Total Environ. 2018, 633, 1089–1104. [Google Scholar] [CrossRef]
  10. Best, J. Anthropogenic Stresses on the World’s Big Rivers. Nat. Geosci. 2018, 12, 7–21. [Google Scholar] [CrossRef]
  11. Chaparro, G.; O’Farrell, I.; Hein, T. Multi-scale analysis of functional plankton diversity in floodplain wetlands: Effects of river regulation. Sci. Total Environ. 2019, 667, 338–347. [Google Scholar] [CrossRef] [PubMed]
  12. Almeida, R.M.; Hamilton, S.K.; Rosi, E.J.; Barros, N.; Doria, C.R.C.; Flecker, A.S.; Fleischmann, A.S.; Reisinger, A.J.; Roland, F. Hydropeaking Operations of Two Run-of-River Mega-Dams Alter Downstream Hydrology of the Largest Amazon Tributary. Front. Environ. Sci. 2020, 8, 120. [Google Scholar] [CrossRef]
  13. Glenn, E.P.; Nagler, P.L.; Shafroth, P.B.; Jarchow, C.J. Effectiveness of environmental flows for riparian restoration in arid regions: A tale of four rivers. Ecol. Eng. 2017, 106, 695–703. [Google Scholar] [CrossRef]
  14. Hairan, M.H.; Jamil, N.R.; Looi, L.J.; Azmai, M.N.A. The assessment of environmental flow status in Southeast Asian Rivers: A review. J. Clean. Prod. 2021, 295, 126411. [Google Scholar] [CrossRef]
  15. Campbell, C.J.; Freestone, F.L.; Duncan, R.P.; Higgisson, W.; Healy, S.J. The more the merrier: Using environmental flows to improve floodplain vegetation condition. Mar. Freshw. Res. 2021, 72, 1185. [Google Scholar] [CrossRef]
  16. Nagler, P.L.; Barreto-Muñoz, A.; Borujeni, S.C.; Jarchow, C.J.; Gómez-Sapiens, M.M.; Nouri, H.; Herrmann, S.M.; Didan, K. Ecohydrological responses to surface flow across borders: Two decades of changes in vegetation greenness and water use in the riparian corridor of the Colorado River delta. Hydrol. Process. 2020, 34, 4851–4883. [Google Scholar] [CrossRef]
  17. Kendy, E.; Flessa, K.W.; Schlatter, K.J.; de la Parra, C.A.; Huerta, O.M.H.; Carrillo-Guerrero, Y.K.; Guillen, E. Leveraging environmental flows to reform water management policy: Lessons learned from the 2014 Colorado River Delta pulse flow. Ecol. Eng. 2017, 106, 683–694. [Google Scholar] [CrossRef]
  18. De Resende, A.F.; Schöngart, J.; Streher, A.S.; Ferreira-Ferreira, J.; Piedade, M.T.F.; Silva, T.S.F. Massive tree mortality from flood pulse disturbances in Amazonian floodplain forests: The collateral effects of hydropower production. Sci. Total Environ. 2019, 659, 587–598. [Google Scholar] [CrossRef]
  19. Larsen, S.; Karaus, U.; Claret, C.; Sporka, F.; Hamerlík, L.; Tockner, K. Flooding and hydrologic connectivity modulate community assembly in a dynamic river-floodplain ecosystem. PLoS ONE 2019, 14, e0213227. [Google Scholar] [CrossRef]
  20. Wise, W.R.; Annable, M.D.; Walser, J.A.E.; Switt, R.S.; Shaw, D.T. A Wetland- Aquifer Interaction Test. J. Hydrol. 1999, 227, 257–272. [Google Scholar] [CrossRef]
  21. Hunt, R.J.; Strand, M.; Walker, J.F. Measuring Groundwater-Surface Water Interaction and Its Effect on Wetland Stream Benthic Productivity, Trout Lake Watershed, Northern Wisconsin, USA. J. Hydrol. 2006, 320, 370–384. [Google Scholar] [CrossRef]
  22. Bye, J.A.; Narayan, K.A. Groundwater response to the tide in wetlands: Observations from the Gillman Marshes, South Australia. Estuar. Coast. Shelf Sci. 2009, 84, 219–226. [Google Scholar] [CrossRef]
  23. Parsons, D.F.; Hayashi, M.; van der Kamp, G. Infiltration and solute transport under a seasonal wetland: Bromide tracer experiments in Saskatoon, Canada. Hydrol. Process. 2004, 18, 2011–2027. [Google Scholar] [CrossRef]
  24. Bravo, H.R.; Jiang, F.; Hunt, R.J. Using groundwater temperature data to constrain parameter estimation in a groundwater flow model of a wetland system. Water Resour. Res. 2002, 38, 28-1–28-14. [Google Scholar] [CrossRef]
  25. Ladouche, B.; Weng, P. Hydrochemical assessment of the Rochefort marsh: Role of surface and groundwater in the hydrological functioning of the wetland. J. Hydrol. 2005, 314, 22–42. [Google Scholar] [CrossRef]
  26. Li, F.; Liu, Y.; Zhao, Y.; Deng, X.; Jiang, R. Regulation of shallow groundwater based on MODFLOW. Appl. Geogr. 2019, 110, 102049. [Google Scholar] [CrossRef]
  27. Ostad-Ali-Askari, K.; Kharazi, H.G.; Shayannejad, M.; Zareian, M.J. Effect of management strategies on reducing negative impacts of climate change on water resources of the Isfahan-Borkhar aquifer using MODFLOW. River Res. Appl. 2019, 35, 611–631. [Google Scholar] [CrossRef]
  28. Woldeamlak, S.T.; Batelaan, O.; De Smedt, F. Effects of climate change on the groundwater system in the Grote-Nete catchment, Belgium. Hydrogeol. J. 2007, 15, 891–901. [Google Scholar] [CrossRef]
  29. Guevara-Ochoa, C.; Medina-Sierra, A.; Vives, L. Spatio-temporal effect of climate change on water balance and interactions between groundwater and surface water in plains. Sci. Total Environ. 2020, 722, 137886. [Google Scholar] [CrossRef]
  30. Pryet, A.; Labarthe, B.; Saleh, F.; Akopian, M.; Flipo, N. Reporting of Stream-Aquifer Flow Distribution at the Regional Scale with a Distributed Process-Based Model. Water Resour. Manag. 2015, 29, 139–159. [Google Scholar] [CrossRef]
  31. Flipo, N.; Mouhri, A.; Labarthe, B.; Biancamaria, S.; Rivière, A.; Weill, P. Continental Hydrosystem Modelling: The Concept of Nested Stream–Aquifer Interfaces. Hydrol. Earth Syst. Sci. 2014, 18, 3121–3149. [Google Scholar] [CrossRef]
  32. Barthel, R.; Banzhaf, S. Groundwater and Surface Water Interaction at the Regional-scale—A Review with Focus on Regional Integrated Models. Water Resour. Manag. 2015, 30, 1–32. [Google Scholar] [CrossRef]
  33. Deb, P.; Kiem, A.S.; Willgoose, G. A linked surface water-groundwater modelling approach to more realistically simulate rainfall-runoff non-stationarity in semi-arid regions. J. Hydrol. 2019, 575, 273–291. [Google Scholar] [CrossRef]
  34. Akbari, F.; Shourian, M.; Moridi, A. Assessment of the climate change impacts on the watershed-scale optimal crop pattern using a surface-groundwater interaction hydro-agronomic model. Agric. Water Manag. 2022, 265, 107508. [Google Scholar] [CrossRef]
  35. Wei, X.; Bailey, R.T.; Records, R.M.; Wible, T.C.; Arabi, M. Comprehensive simulation of nitrate transport in coupled surface-subsurface hydrologic systems using the linked SWAT-MODFLOW-RT3D model. Environ. Model. Softw. 2019, 122, 104242. [Google Scholar] [CrossRef]
  36. Ehtiat, M.; Mousavi, S.J.; Srinivasan, R. Groundwater Modeling Under Variable Operating Conditions Using SWAT, MODFLOW and MT3DMS: A Catchment Scale Approach to Water Resources Management. Water Resour. Manag. 2018, 32, 1631–1649. [Google Scholar] [CrossRef]
  37. Aliyari, F.; Bailey, R.T.; Tasdighi, A.; Dozier, A.; Arabi, M.; Zeiler, K. Coupled SWAT-MODFLOW model for large-scale mixed agro-urban river basins. Environ. Model. Softw. 2019, 115, 200–210. [Google Scholar] [CrossRef]
  38. Alattar, M.H.; Troy, T.J.; Russo, T.A.; Boyce, S.E. Modeling the surface water and groundwater budgets of the US using MODFLOW-OWHM. Adv. Water Resour. 2020, 143, 103682. [Google Scholar] [CrossRef]
  39. Tian, Y.; Xiong, J.; He, X.; Pi, X.; Jiang, S.; Han, F.; Zheng, Y. Joint Operation of Surface Water and Groundwater Reservoirs to Address Water Conflicts in Arid Regions: An Integrated Modeling Study. Water 2018, 10, 1105. [Google Scholar] [CrossRef]
  40. Zhou, S.; Yuan, X.; Peng, S.; Yue, J.; Wang, X.; Liu, H.; Williams, D.D. Groundwater-surface water interactions in the hyporheic zone under climate change scenarios. Environ. Sci. Pollut. Res. 2014, 21, 13943–13955. [Google Scholar] [CrossRef]
  41. Joo, J.; Tian, Y.; Zheng, C.; Zheng, Y.; Sun, Z.; Zhang, A.; Chang, H. An Integrated Modeling Approach to Study the Surface Water-Groundwater Interactions and Influence of Temporal Damping Effects on the Hydrological Cycle in the Miho Catchment in South Korea. Water 2018, 10, 1529. [Google Scholar] [CrossRef]
  42. Sandu, M.-A.; Virsta, A. Applicability of MIKE SHE to Simulate Hydrology in Argesel River Catchment. Agric. Agric. Sci. Procedia 2015, 6, 517–524. [Google Scholar] [CrossRef]
  43. Sterte, E.J.; Johansson, E.; Sjöberg, Y.; Karlsen, R.H.; Laudon, H. Groundwater-Surface Water Interactions across Scales in a Boreal Landscape Investigated Using a Numerical Modelling Approach. J. Hydrol. 2018, 560, 184–201. [Google Scholar] [CrossRef]
  44. Boubacar, A.B.; Moussa, K.; Yalo, N.; Berg, S.J.; Erler, A.R.; Hwang, H.-T.; Khader, O.; Sudicky, E.A. Characterization of groundwater –surface water interactions using high resolution integrated 3D hydrological model in semiarid urban watershed of Niamey, Niger. J. Afr. Earth Sci. 2020, 162, 1. [Google Scholar] [CrossRef]
  45. Salem, A.; Dezső, J.; El-Rawy, M.; Lóczy, D. Hydrological Modeling to Assess the Efficiency of Groundwater Replenishment through Natural Reservoirs in the Hungarian Drava River Floodplain. Water 2020, 12, 250. [Google Scholar] [CrossRef]
  46. Vrzel, J.; Ludwig, R.; Gampe, D.; Ogrinc, N. Hydrological system behaviour of an alluvial aquifer under climate change. Sci. Total Environ. 2019, 649, 1179–1188. [Google Scholar] [CrossRef]
  47. Werner, A.D.; Gallagher, M.R.; Weeks, S.W. Regional-Scale, Fully Coupled Modelling of Stream–Aquifer Interaction in a Tropical Catchment. J. Hydrol. 2006, 328, 497–510. [Google Scholar] [CrossRef]
  48. Ntona, M.M.; Busico, G.; Mastrocicco, M.; Kazakis, N. Modeling groundwater and surface water interaction: An overview of current status and future challenges. Sci. Total Environ. 2022, 846, 157355. [Google Scholar] [CrossRef]
  49. Li, Y.; Yao, J.; Tan, Z.; Zhang, Q. Advances in Surface Water-Groundwater Interactions in Floodplain Wetlands. J. China Hydrol. 2019, 39, 14–21. [Google Scholar]
  50. Reisenbüchler, M.; Bui, M.D.; Skublics, D.; Rutschmann, P. An integrated approach for investigating the correlation between floods and river morphology: A case study of the Saalach River, Germany. Sci. Total Environ. 2019, 647, 814–826. [Google Scholar] [CrossRef]
  51. Hervouet, J. Hydrodynamics of Free Surface Flows: Modelling with the Finite Element Method; John Wiley & Sons: Chichester, UK, 2007; pp. 83–133. [Google Scholar]
  52. Wang, D.; Zhang, S.; Wang, G.; Liu, Y.; Wang, H.; Gu, J. Reservoir Regulation for Ecological Protection and Remediation: A Case Study of the Irtysh River Basin, China. Int. J. Environ. Res. Public Health 2022, 19, 11582. [Google Scholar] [CrossRef] [PubMed]
  53. Yang, H.; Rahardjo, H.; Leong, E.-C. Behavior of Unsaturated Layered Soil Columns during Infiltration. J. Hydrol. Eng. 2006, 11, 329–337. [Google Scholar] [CrossRef]
  54. Ochoa, C.G.; Sierra, A.M.; Vives, L.; Zimmermann, E.; Bailey, R. Spatio-temporal patterns of the interaction between groundwater and surface water in plains. Hydrol. Process. 2020, 34, 1371–1392. [Google Scholar] [CrossRef]
  55. Hu, L.; Xu, Z.; Huang, W. Development of a river-groundwater interaction model and its application to a catchment in Northwestern China. J. Hydrol. 2016, 543, 483–500. [Google Scholar] [CrossRef]
  56. Kumbier, K.; Rogers, K.; Hughes, M.G.; Lal, K.K.; Mogensen, L.A.; Woodroffe, C.D. An Eco-Morphodynamic Modelling Approach to Estuarine Hydrodynamics & Wetlands in Response to Sea-Level Rise. Front. Mar. Sci. 2022, 9, 613. [Google Scholar] [CrossRef]
  57. Haverson, D.; Bacon, J.; Smith, H.C.; Venugopal, V.; Xiao, Q. Modelling the hydrodynamic and morphological impacts of a tidal stream development in Ramsey Sound. Renew. Energy 2018, 126, 876–887. [Google Scholar] [CrossRef]
  58. Stark, J.; Plancke, Y.; Ides, S.; Meire, P.; Temmerman, S. Coastal flood protection by a combined nature-based and engineering approach: Modeling the effects of marsh geometry and surrounding dikes. Estuar. Coast. Shelf Sci. 2016, 175, 34–45. [Google Scholar] [CrossRef]
  59. Moulinec, C.; Denis, C.; Pham, C.T.; Rougé, D.; Hervouet, J.M.; Razafindrakoto, E.; Barber, R.W.; Emerson, D.R.; Gu, X.J. Telemac: An Efficient Hydrodynamics Suite for Massively Parallel Architectures. Comput. Fluids 2011, 51, 30–34. [Google Scholar] [CrossRef]
  60. Fu, Y.; Dong, Y.; Xie, Y.; Xu, Z.; Wang, L. Impacts of Regional Groundwater Flow and River Fluctuation on Floodplain Wetlands in the Middle Reach of the Yellow River. Water 2020, 12, 1922. [Google Scholar] [CrossRef]
  61. Hester, E.T.; Guth, C.R.; Scott, D.T.; Jones, C.N. Vertical surface water–groundwater exchange processes within a headwater floodplain induced by experimental floods. Hydrol. Process. 2016, 30, 3770–3787. [Google Scholar] [CrossRef]
  62. Zhu, X.; Wu, J.; Nie, H.; Guo, F.; Wu, J.; Chen, K.; Liao, P.; Xu, H.; Zeng, X. Quantitative assessment of the impact of an inter-basin surface-water transfer project on the groundwater flow and groundwater-dependent eco-environment in an oasis in arid northwestern China. Hydrogeol. J. 2018, 26, 1475–1485. [Google Scholar] [CrossRef]
  63. Qi, Q.Q.; Xu, Y.X.; Song, S.H.; Zhang, Z.Z. Application of a Groundwater Modelling System in Groundwater Environmental Impact Assessment of River and Lake Connection in Western Jilin Region. Appl. Ecol. Environ. Res. 2019, 17, 5059–5066. [Google Scholar] [CrossRef]
  64. Vernoux, J.F.; Horriche, F.J.; Ghoudi, R. Numerical groundwater flow modeling for managing the Gabes Jeffara aquifer system (Tunisia) in relation with oasis ecosystems. Hydrogeol. J. 2020, 28, 1077–1090. [Google Scholar] [CrossRef]
  65. Khan, H.F.; Yang, Y.C.E.; Ringler, C.; Wi, S.; Cheema, M.J.M.; Basharat, M. Guiding Groundwater Policy in the Indus Basin of Pakistan Using a Physically Based Groundwater Model. J. Water Resour. Plan. Manag. 2017, 143, 05016014. [Google Scholar] [CrossRef]
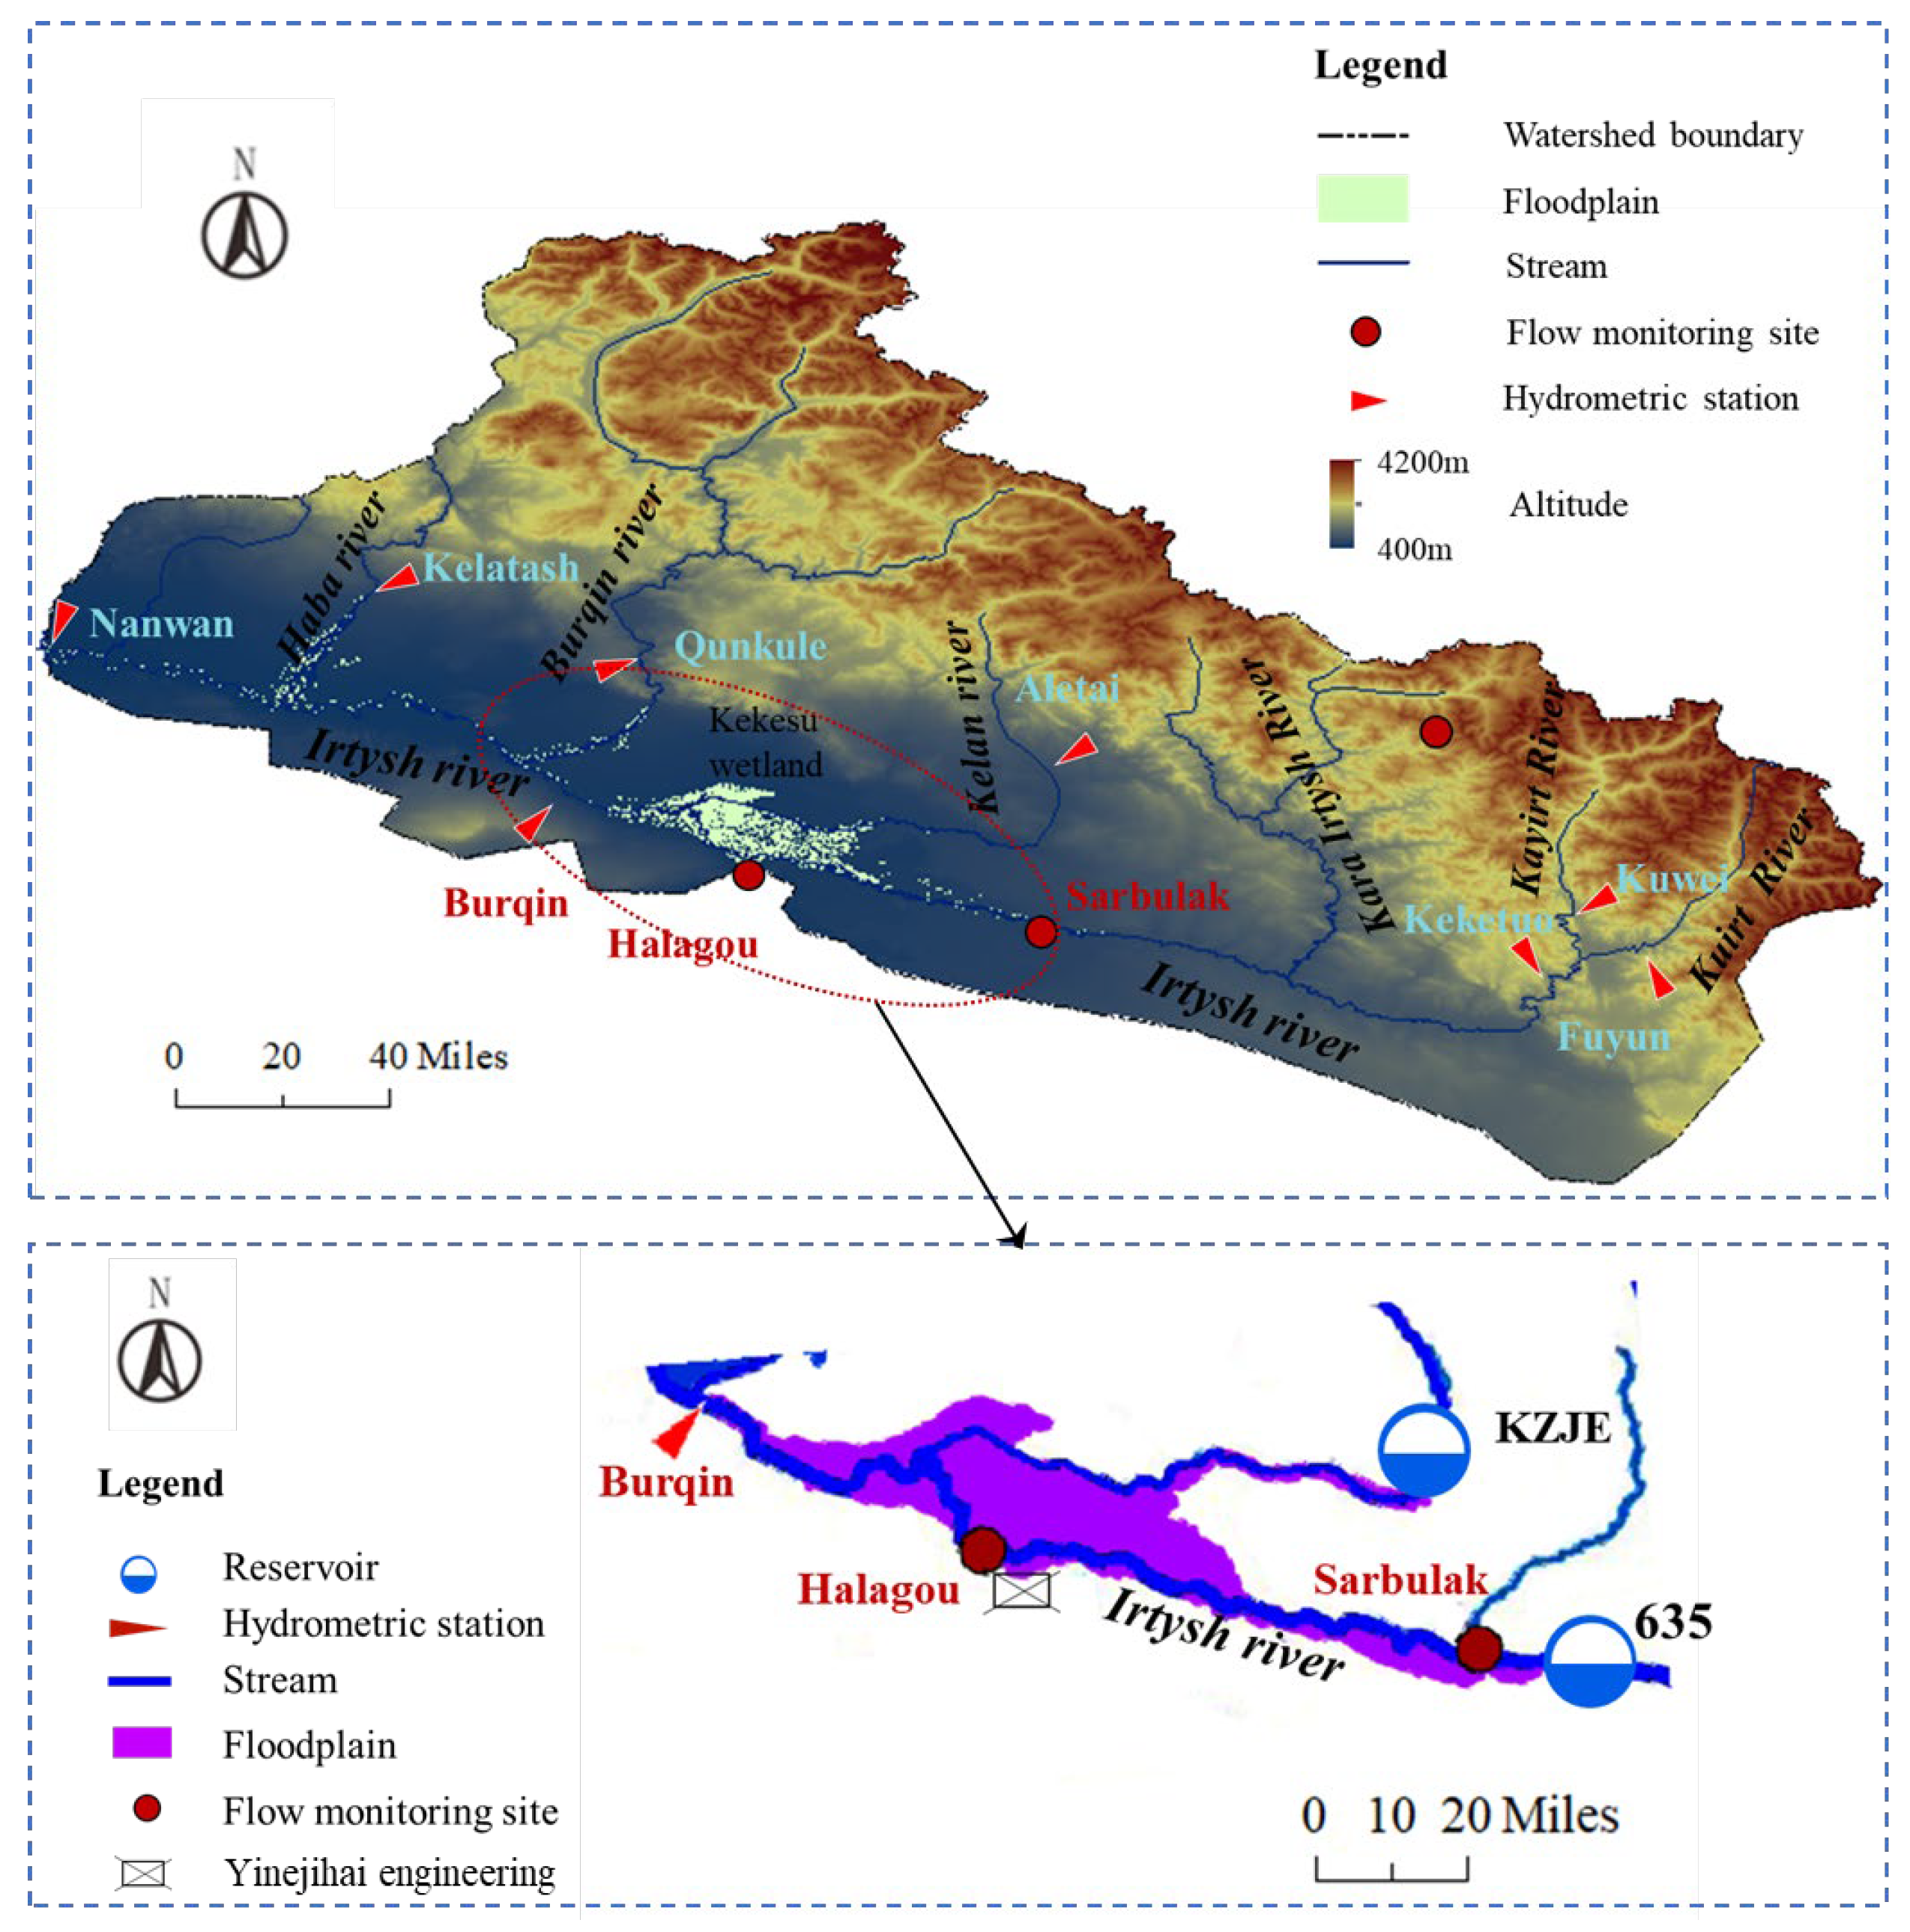
Figure 1. Location of the study area, including hydrometric stations, reservoirs, water management projects, and flow monitoring sites.
Water 15 03059 g001
Figure 2. Simulation area, grid cell division, and boundary conditions of the hydrodynamic model.
Water 15 03059 g002
Figure 3. (a) Lateral boundary conditions of GW model (A–H are the start and end points of each boundary); (b) simulation area, parameter partition of GW model.
Water 15 03059 g003
Figure 4. The coupling strategy of hydrodynamic model and GW model (1–11 are the order of each step of the coupling strategy).
Water 15 03059 g004
Figure 5. An example of the method to partition the simulation range of SW model.
Water 15 03059 g005
Figure 6. Location and area of each zone of the hydrodynamic model.
Water 15 03059 g006
Figure 7. Spatial correspondence diagram between hydrodynamic model and GW model.
Water 15 03059 g007
Figure 8. Calculated (red) and observed (blue) hydrographs at Burqin, Sarbulak, and Halagou Mudao Bridge in 2016, 2017.
Water 15 03059 g008
Figure 9. Calculated floodplain flood inundation area of the study area in (a) 2016 and (b) 2017.
Water 15 03059 g009
Figure 10. Observed (red) and calculated (blue) GW level for 8 observation boreholes in 2016, 2017.
Water 15 03059 g010
Figure 11. Water balance of the study area in (a) 2016 and (b) 2017 (billion m3).
Water 15 03059 g011
Table 1. Data used for hydrodynamic model.
Data TypeData ContentEffectSource
Geological dataChannel section, 2.5 m contour line, measured elevation points with a precision of 1 kmGenerating the simulation area and terrain fileGeological survey results of the study area
DEM data with a resolution of 15 mGenerating the simulation area and terrain fileBigemap
Hydrological data2 h outflow processes of the 635 and KZJE reservoirsInflow boundaryReservoir operation and scheduling data
Daily flows of Yinejihai engineeringOutflow boundaryOperation and scheduling data of Yinejihai engineering
Daily water flows of the Burqin Hydrological StationCalibration and validationBurqin hydrometric station
Daily water levels of the Burqin Hydrological StationOutflow boundaryBurqin hydrometric station
Daily water flows of Sarbulak, and Halagou Mudao BridgeCalibration and validationOn-site monitoring data
Meteorological dataDaily evaporationWater loss calculationAletai hydrometric station
Infiltration observation dataWater loss calculationField data
Remote sensing image dataRemote sensing imaging from the SPOT-6 satellite and Environment-1 satellite Generating the simulation area and terrain fileBigemap
Table 2. Data used for GW model.
Data TypeData ContentEffectSource
Topographic geological data Elevation data obtained from surveyed points with an accuracy of 1 km, Hydrogeological cross-section, soil properties, contour map of GW levelModel establishmentGeological survey results of the study area
The DEM data with a resolution of 15 mModel establishmentBigemap
Recharge and discharge itemsDaily evaporationModel establishmentBurqin and Aletai hydrometric station
Irrigation area and monthly amount of irrigationModel establishmentRegional agricultural statistics annual report
OtherMeasured data of GW level on the 10th, 20th, and 30th day of each monthModel calibration and validationField measurement data
Table 3. RMSE of GW level between observation and calculation (m).
Observation Well7-zk17-zk27-zk37-zk410-zk110-zk210-zk310-zk4Mean Value
20160.790.630.250.180.050.880.550.740.51
20171.740.560.20.270.490.940.751.240.77
Disclaimer/Publisher’s Note: The statements, opinions and data contained in all publications are solely those of the individual author(s) and contributor(s) and not of MDPI and/or the editor(s). MDPI and/or the editor(s) disclaim responsibility for any injury to people or property resulting from any ideas, methods, instructions or products referred to in the content.