Article

Hydrogeochemical Characteristics and Groundwater Quality in Phreatic and Confined Aquifers of the Hebei Plain, China

1
Institute of Hydrogeology and Environmental Geology, Chinese Academy of Geological Sciences, Shijiazhuang 050061, China
2
Hebei Key Laboratory of Groundwater Remediation, Shijiazhuang 050061, China
*
Author to whom correspondence should be addressed.
Water 2023, 15(17), 3071; https://doi.org/10.3390/w15173071
Submission received: 8 July 2023 / Revised: 15 August 2023 / Accepted: 25 August 2023 / Published: 28 August 2023
(This article belongs to the Special Issue Groundwater Chemistry and Quality in Coastal Aquifers)

Abstract

:
This study aims to investigate hydrogeochemical characteristics and groundwater quality in the Hebei Plain and to discuss factors controlling the groundwater quality. A total of 54 groundwater samples were collected and analyzed for 31 hydrogeochemical parameters, and a fuzzy synthetic evaluation (FSE) method was used for assessing groundwater quality. Results show groundwater total hardness, total dissolved solids (TDS), and major ions excluding K+ in phreatic aquifers higher than that in confined aquifers. From the Piedmont plain to the littoral plain, phreatic aquifers towards the reducing environment, and the enhancement of water–rock interaction, ion exchange process, and evaporation probably resulted in the increase in groundwater TDS, major ions (excluding HCO3 and SO42−), B, and Mn concentrations. Moreover, phreatic groundwater chemistry was mainly controlled by rock weathering changing into evaporite dissolution and seawater intrusion from the Piedmont plain to the littoral plain, according to the Gibbs diagram. The proportion of drinkable groundwater in confined aquifers was 1.6 times that in phreatic aquifers. In phreatic aquifers, the proportion of drinkable groundwater in the Piedmont plain was as high as 68%, but none of the drinkable groundwater occurred in the central and littoral plains. Groundwater quality in phreatic aquifers was mainly controlled by five factors, including the water–rock interaction, the marine geogenic sources, the agricultural pollution, the acidification, and the reductive environment. By contrast, groundwater quality in confined aquifers was mainly controlled by three factors, including the water–rock interaction and redox processes, agricultural pollution, and the input of external water. Therefore, in the Hebei Plain, groundwater in confined aquifers is more suitable for drinking purposes than in phreatic aquifers. Additionally, phreatic groundwater in the Piedmont plain should be protected.

1. Introduction

Groundwater is one of the major freshwater resources for human beings in coastal plains. It plays an important role in drinking, industrial, and domestic purposes in urbanizing areas, as well as irrigation purposes in agricultural areas, especially in plains (e.g., Hebei Plain) where surface water is short [1]. For instance, Huan et al. reported that groundwater supplied more than 70% of drinking water in the Hebei Plain [2]. However, many intense human activities such as urbanization, industrialization, mining activities, and agricultural intensification have impacted regional groundwater quality in recent decades on a global scale [3,4,5,6,7]. For example, Gan et al. reported that domestic sewage and animal waste were major sources of groundwater nitrate pollution in several alluvial-pluvial fans in the Hebei Plain due to urbanization and agricultural activities [8]. Therefore, it is necessary to understand the current status of hydrogeochemical characteristics and groundwater quality for groundwater management in the Hebei Plain because various human activities likely have already changed hydrogeochemical conditions and water quality in the groundwater of this area [9].
To date, many studies have already investigated hydrogeochemical characteristics and groundwater quality in part areas within the Hebei Plain. For instance, Xing et al. investigated hydrogeochemical characteristics in the Hebei Plain by using two groundwater flow paths [10]. Zhang et al. assessed the natural background levels of chemical components in the groundwater of the Hutuo River catchment area within the Hebei Plain [11]. Zhang et al. revealed the spatial distribution of iodine in groundwater in the Hebei Plain via a groundwater section [12]. Zhang et al. reported the spatial distribution of groundwater chemistry and quality in the southern Hebei Plain [13]. Liu et al. revealed factors controlling groundwater chemical evolution under reduced exploitation in the Heilongjiang region within the Hebei Plain [14]. Hao et al. recently reported the annual variability of fluoride concentrations in deep groundwater of a land subsidence plain in Cangzhou within the Hebei Plain [15]. By contrast, the Hebei Plain is a large-scale geological unit, and few studies focused on the spatial distribution of hydrogeochemical characteristics and groundwater quality in this entire area [16]. Especially in recent decades, the intensity of human activities in the groundwater of this area has increased [9].
Therefore, the present study aims to investigate the current status of hydrogeochemical characteristics and groundwater quality in the whole Hebei Plain, where human activities strengthen and discuss factors controlling groundwater quality in this entire area. In this study, 54 groundwater samples were collected from both phreatic and confined aquifers. The Piper and Gibbs diagrams were used for analyzing hydrogeochemical characteristics in various aquifers and land use types and a fuzzy synthetic evaluation (FSE) method was used for assessing groundwater quality in different aquifers and land use types [17,18,19]. In addition, a principal components analysis (PCA) was used to extract major factors that control groundwater chemistry and quality in the study area [20]. The conclusions will enhance the groundwater management level for sustainable development in the Hebei Plain.

2. Study Area

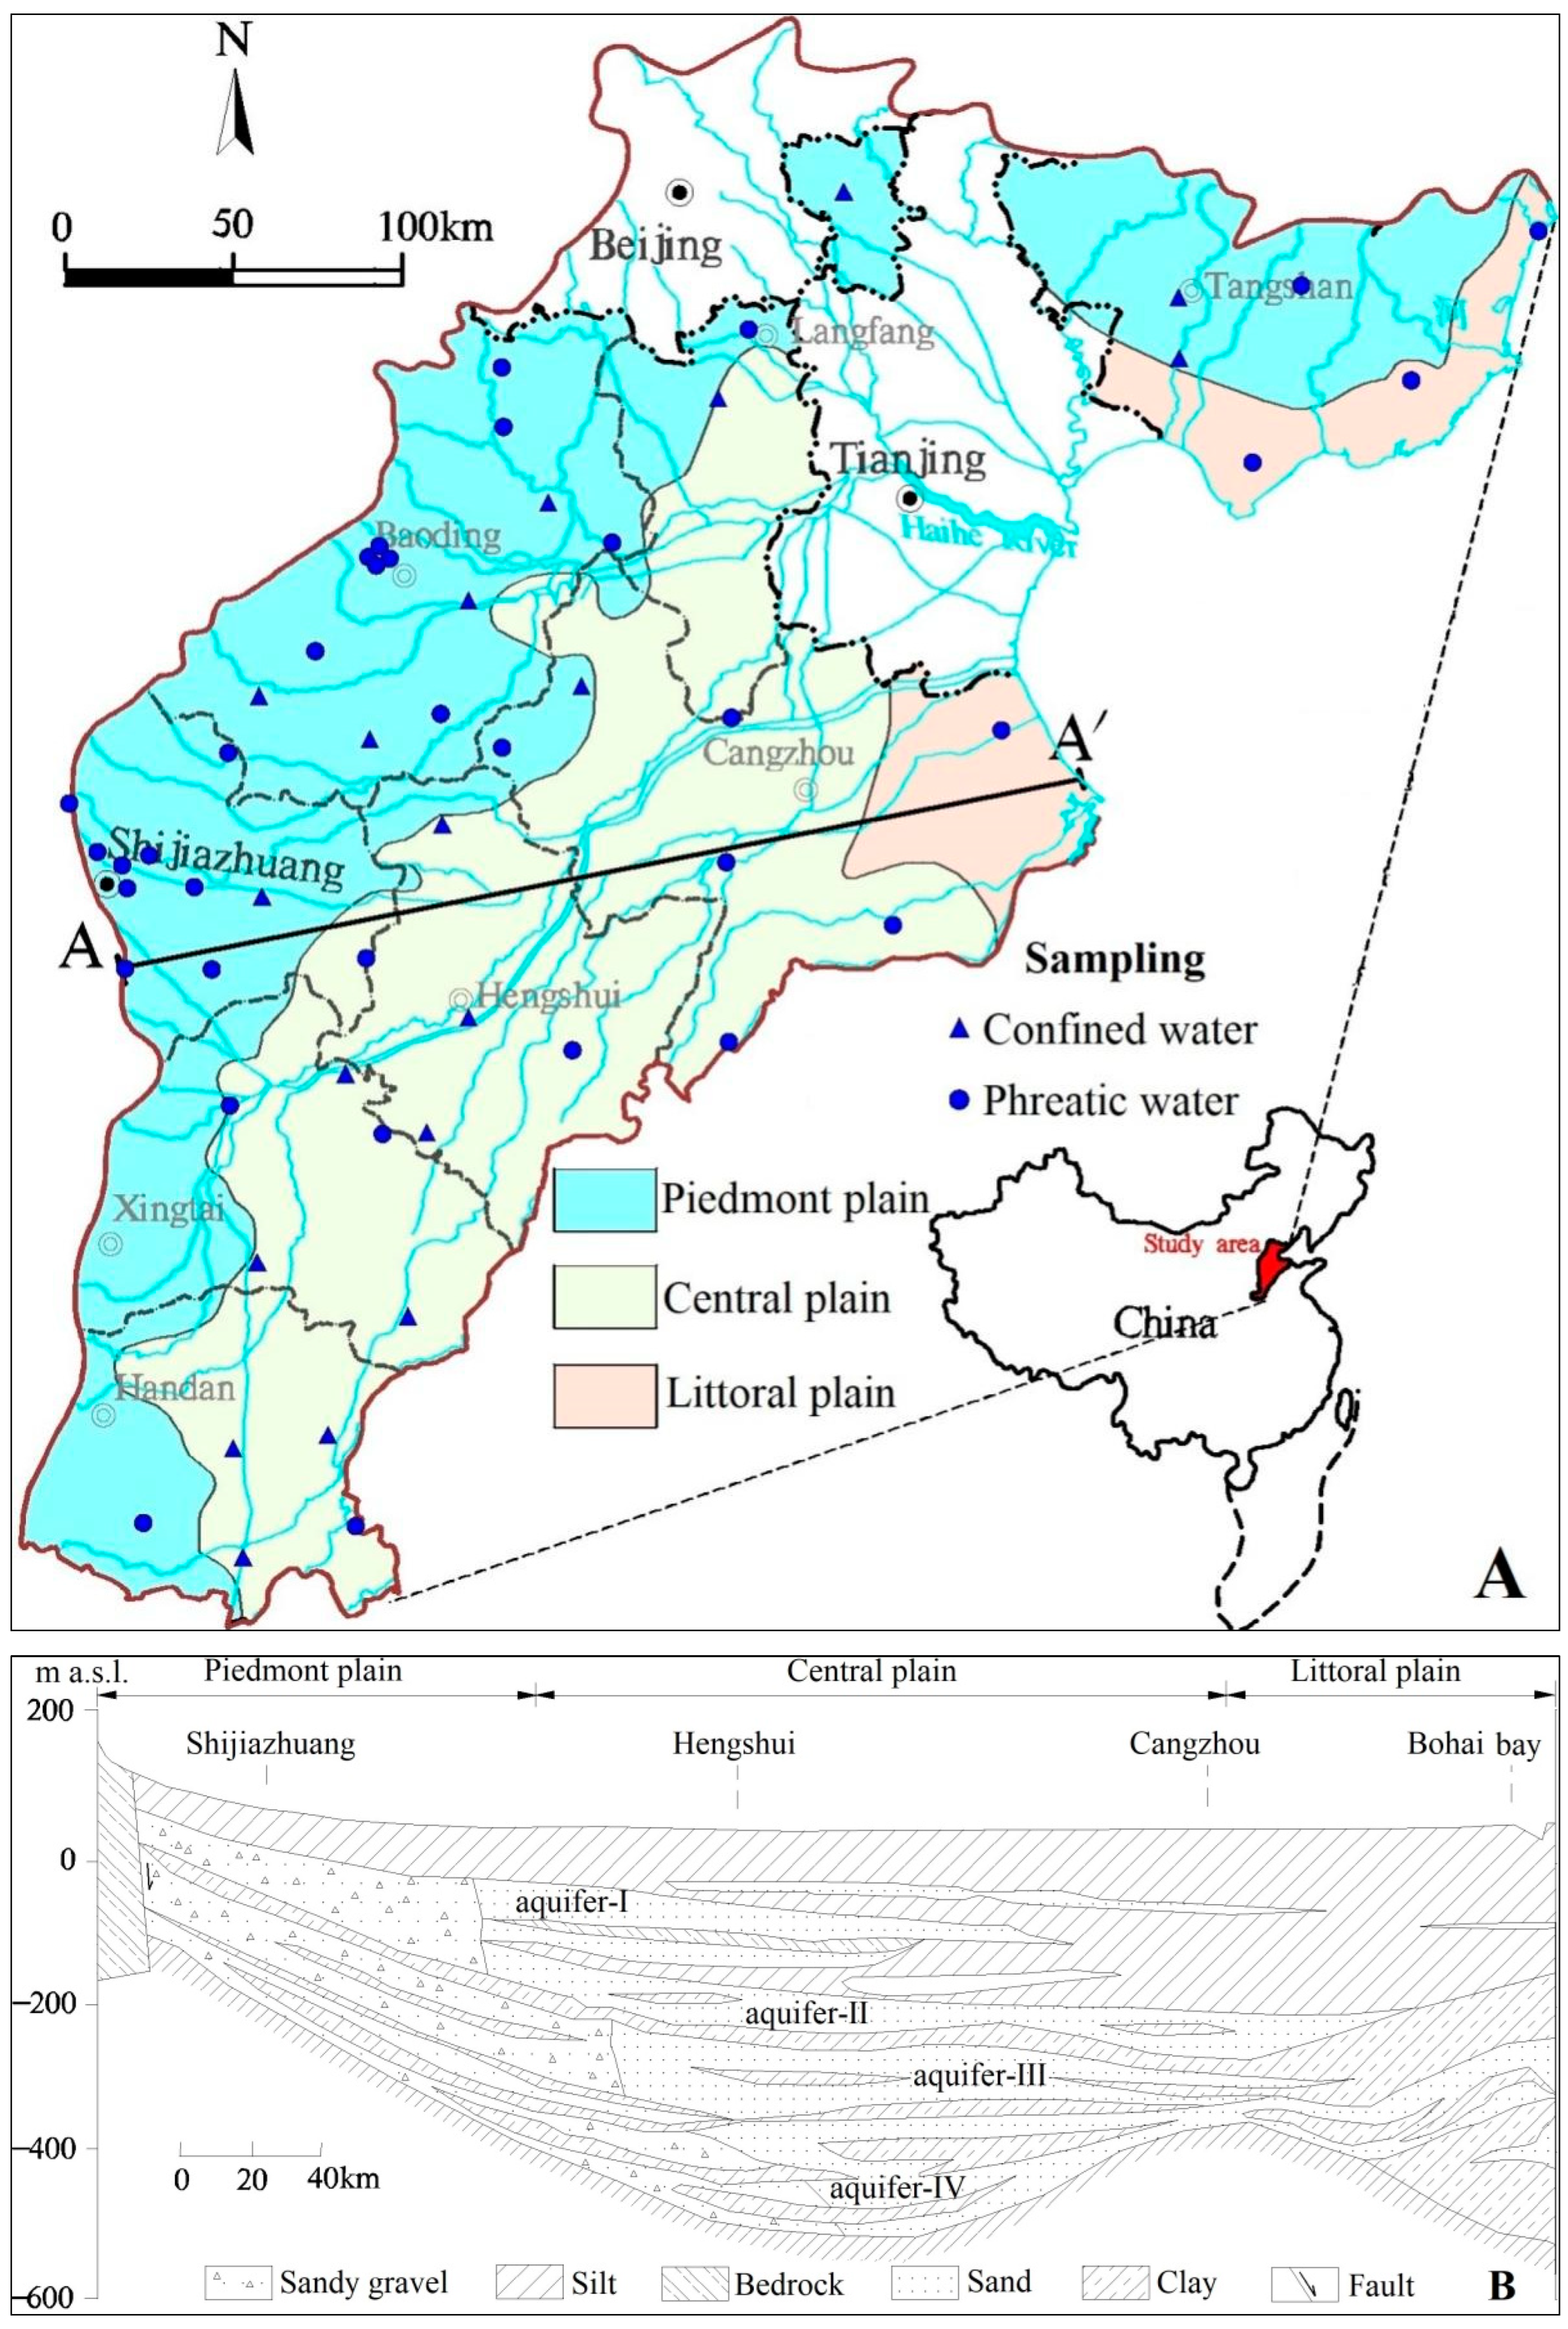
2.1. Geographical Conditions

The Hebei Plain includes the entire plains of Beijing, Tianjin, and Hebei Province, with a total area of approximately 9.25 × 10⁴ km2 (Figure 1A). It is bounded by mountains in the West and North and adjacent to Bohai Bay in the east. The topography generally inclines eastward from an altitude of about 100 m above sea level (ASL) in the west to about 2 m ASL in the east [16]. The climate is typically continental semiarid with a mean annual temperature of 11.3 °C and a mean annual precipitation of approximately 500 mm/year, and the summer monsoon generally contributes more than 70% of the annual precipitation from June to September [21]. It is one of the major granaries of China. Croplands in the Hebei Plain, including 17 large irrigation districts and many small-scale irrigated farms, account for 72% of the total area, and approximately 70% of the total water supply for grain production is supported by groundwater [22].

2.2. Geological and Hydrogeological Conditions

The Hebei Plain is a large Mesozoic and Cenozoic sedimentary basin with a basement of the Sinian bedrock. Alluvial and fluvial sediments originated from the middle and lower reaches of the Yellow River, the Haihe River, the Luanhe River, and their tributaries and formed sedimentary aquifers in this basin. The sediment thickness of Quaternary deposits is about 150–500 m. The Quaternary sediments consist of fluvial deposits in the Piedmont plain, alluvial and lacustrine deposits in the central plain, and alluvial deposits with interbedded marine deposits in the littoral plain [23]. The Piedmont plain has more plentiful groundwater resources than the central and littoral plains due to the mountain-front recharge, waterbody leakage from reservoirs, and groundwater lateral flow [24]. Aquifers in the Hebei Plain can be divided into four groups according to hydrodynamic conditions and the distribution of aquifers and aquitards (Figure 1B). From the top to the bottom, the first aquifer group (aquifer-I) consists of phreatic aquifers in a range of 10–50 m below land surface (BLS) with coarse-grained sand in the Piedmont plain to fine-grained sand in the littoral plain. The second aquifer group (aquifer-II) is composed of multiple semi-confined aquifers with buried depths of 120–210 m BLS, while the third aquifer group (aquifer-III) consists of confined aquifers and has the lower boundary between 170 and 350 m BLS, both of them are dominated by sandy gravel in the Piedmont plain and by medium to fine sand in the central and littoral plains. The fourth aquifer group (aquifer-IV) also consists of confined aquifers with cemented sandy gravel and weathered sand in the Piedmont plain, medium to fine sand in the central plain, and fine sand in the littoral plain, lies below 350 m BLS with a thickness of 50–60 m [25,26]. In recent decades, groundwater recharge from rivers, lakes, and wetlands has reduced significantly because surface water flow to the Hebei Plain is often cut off by reservoirs built upstream, especially during the dry seasons [24]. Groundwater flow velocity ranged from 0.013 to 0.26 m/d in the Piedmont plain and from 0.002 to 0.10 m/d in the central plain [27]. Groundwater flows regionally from the west to the east or the northeast; in other words, it flows from the Piedmont plain via the central plain to the littoral plain [10].

3. Materials and Methods

3.1. Groundwater Sampling

A total of 54 groundwater samples in the Hebei Plain were collected once in August 2021. Among them, 31 samples, 19 samples, and 4 samples were collected from the Piedmont plain, the central plain, and the littoral plain, respectively. In the Piedmont plain, 22 and 9 samples were collected from phreatic and confined aquifers, respectively. In the central plain, 9 and 10 samples were collected from phreatic and confined aquifers, respectively. In the littoral plain, all samples were collected from phreatic aquifers. In order to ensure samples representing the in-situ conditions were collected after pumping at least 3 well volumes or 30 min. Samples were filtered through 0.45 μm membrane filters to remove suspended solids in the field. Three bottles were used to store groundwater for the analysis of chemical components. Groundwater in a 200-mL brown glass bottle was used to analyze sulfide (S2−), while two 500-mL polyethylene bottles were used to store groundwater for the analysis of trace elements and other inorganic chemicals. One bottle used for trace elements analysis was acidified with nitric acid to a pH of less than 2. All samples were stored at 4 °C until laboratory procedures could be performed.

3.2. Analytical Techniques

All analyses were carried out at the Groundwater Mineral Water and Environmental Monitoring Center of the Institute of Hydrogeology and Environmental Geology, Chinese Academy of Geological Sciences. A multi-parameter portable meter (HANNA, HI 98121, Shanghai, SH, China) was used to measure pH in the field. HCO3, CO32−, and the total dissolved solids (TDS) were measured using volumetric and gravimetric methods, respectively. Total hardness (TH) and chemical oxygen demand (COD) were measured by EDTA and potassium dichromate titration methods, respectively. Major cations, Fe, Al, and Mn, were determined by ICP-AES (ICAP6300, Thermo, New York, NY, USA). As, Pb, Hg, Cd, Cr(VI), Se, Ni, Ba, Zn, and B were measured by ICP-MS (Agilent 7500ce ICP-MS, Tokyo, Japan). S2− was measured by the iodometric method. NH4+ and other anions (NO3, SO42−, Cl, NO2, F, I) were carried out on IC (Shimadzu LC-10ADvp, Kyoto, Japan). To assure data quality for indicators, each groundwater sample was analyzed in triplicate, sample batches were regularly interspersed with standards and blanks, and all data were corrected for instrument drift. The relative errors were less than ±5% for all analyzed indicators.

3.3. Fuzzy Synthetic Evaluation (FSE) Method

In this study, we used a fuzzy membership function with the groundwater quality standards of China (Table 1) to evaluate groundwater quality [28]. Linear membership functions are in the Equation (1).
r i j = 0 ,   ( C i S i j 1   or   C i S i j 1 ) C i S i j 1 S i j S i j 1 ,   ( S i j 1 < C i < S i j ) S i j + 1 C i S i j + 1 S i j ,   S i j < C i < S i j + 1 1 ,   ( C i = S i )
where rij indicates the fuzzy membership of indicator i to class j; every indicator is characterized by five classes (I, II, III, IV, V) according to the groundwater quality standards of China [28]. Ci stands for the analytical value of groundwater quality indicator i, and Sij stands for the allowable value of groundwater quality indicator. The fuzzy membership matrix R consists of groundwater quality indicators and classes.
The weight of groundwater quality indicator is expressed as
W i = C i S i
where Wi is the weight of groundwater quality indicator i, Ci is the analytical value of groundwater quality indicator i, and Si is the arithmetic mean of allowable values of each class.
The normalized weight of each indicator is calculated by the formula:
a i = C i S i / i = 1 m C i S i = W i / i = 1 n W i
where ai is the normalized weight of indicator i and Wi is the sum of the weight of all groundwater quality indicators. The fuzzy A consists of the weight of each groundwater quality indicator.
The water quality assessment by fuzzy membership is based on the matrix B,
B = A × R
The fuzzy B is the matrix of membership to each groundwater quality class. Groundwater sample is classified into the class with the maximum membership [29].

3.4. Principal Components Analysis (PCA)

The PCA is a useful tool for reducing a large number of variables to a small number of principal components (PCs) by linearly combining measurements [30,31]. In this study, the PCA was used to reduce variables and extract the main impact indicators that are responsible for the poor-quality groundwater. In addition, it was also used to extract related variables and infer the underlying natural and/or anthropogenic processes that control the groundwater quality [32]. Rotation of the PCs was conducted using the Varimax method. PCs with eigenvalues > 1 were retained for analyses. The PCA was operated by the SPSS® release 23.0 version.

4. Results and Discussion

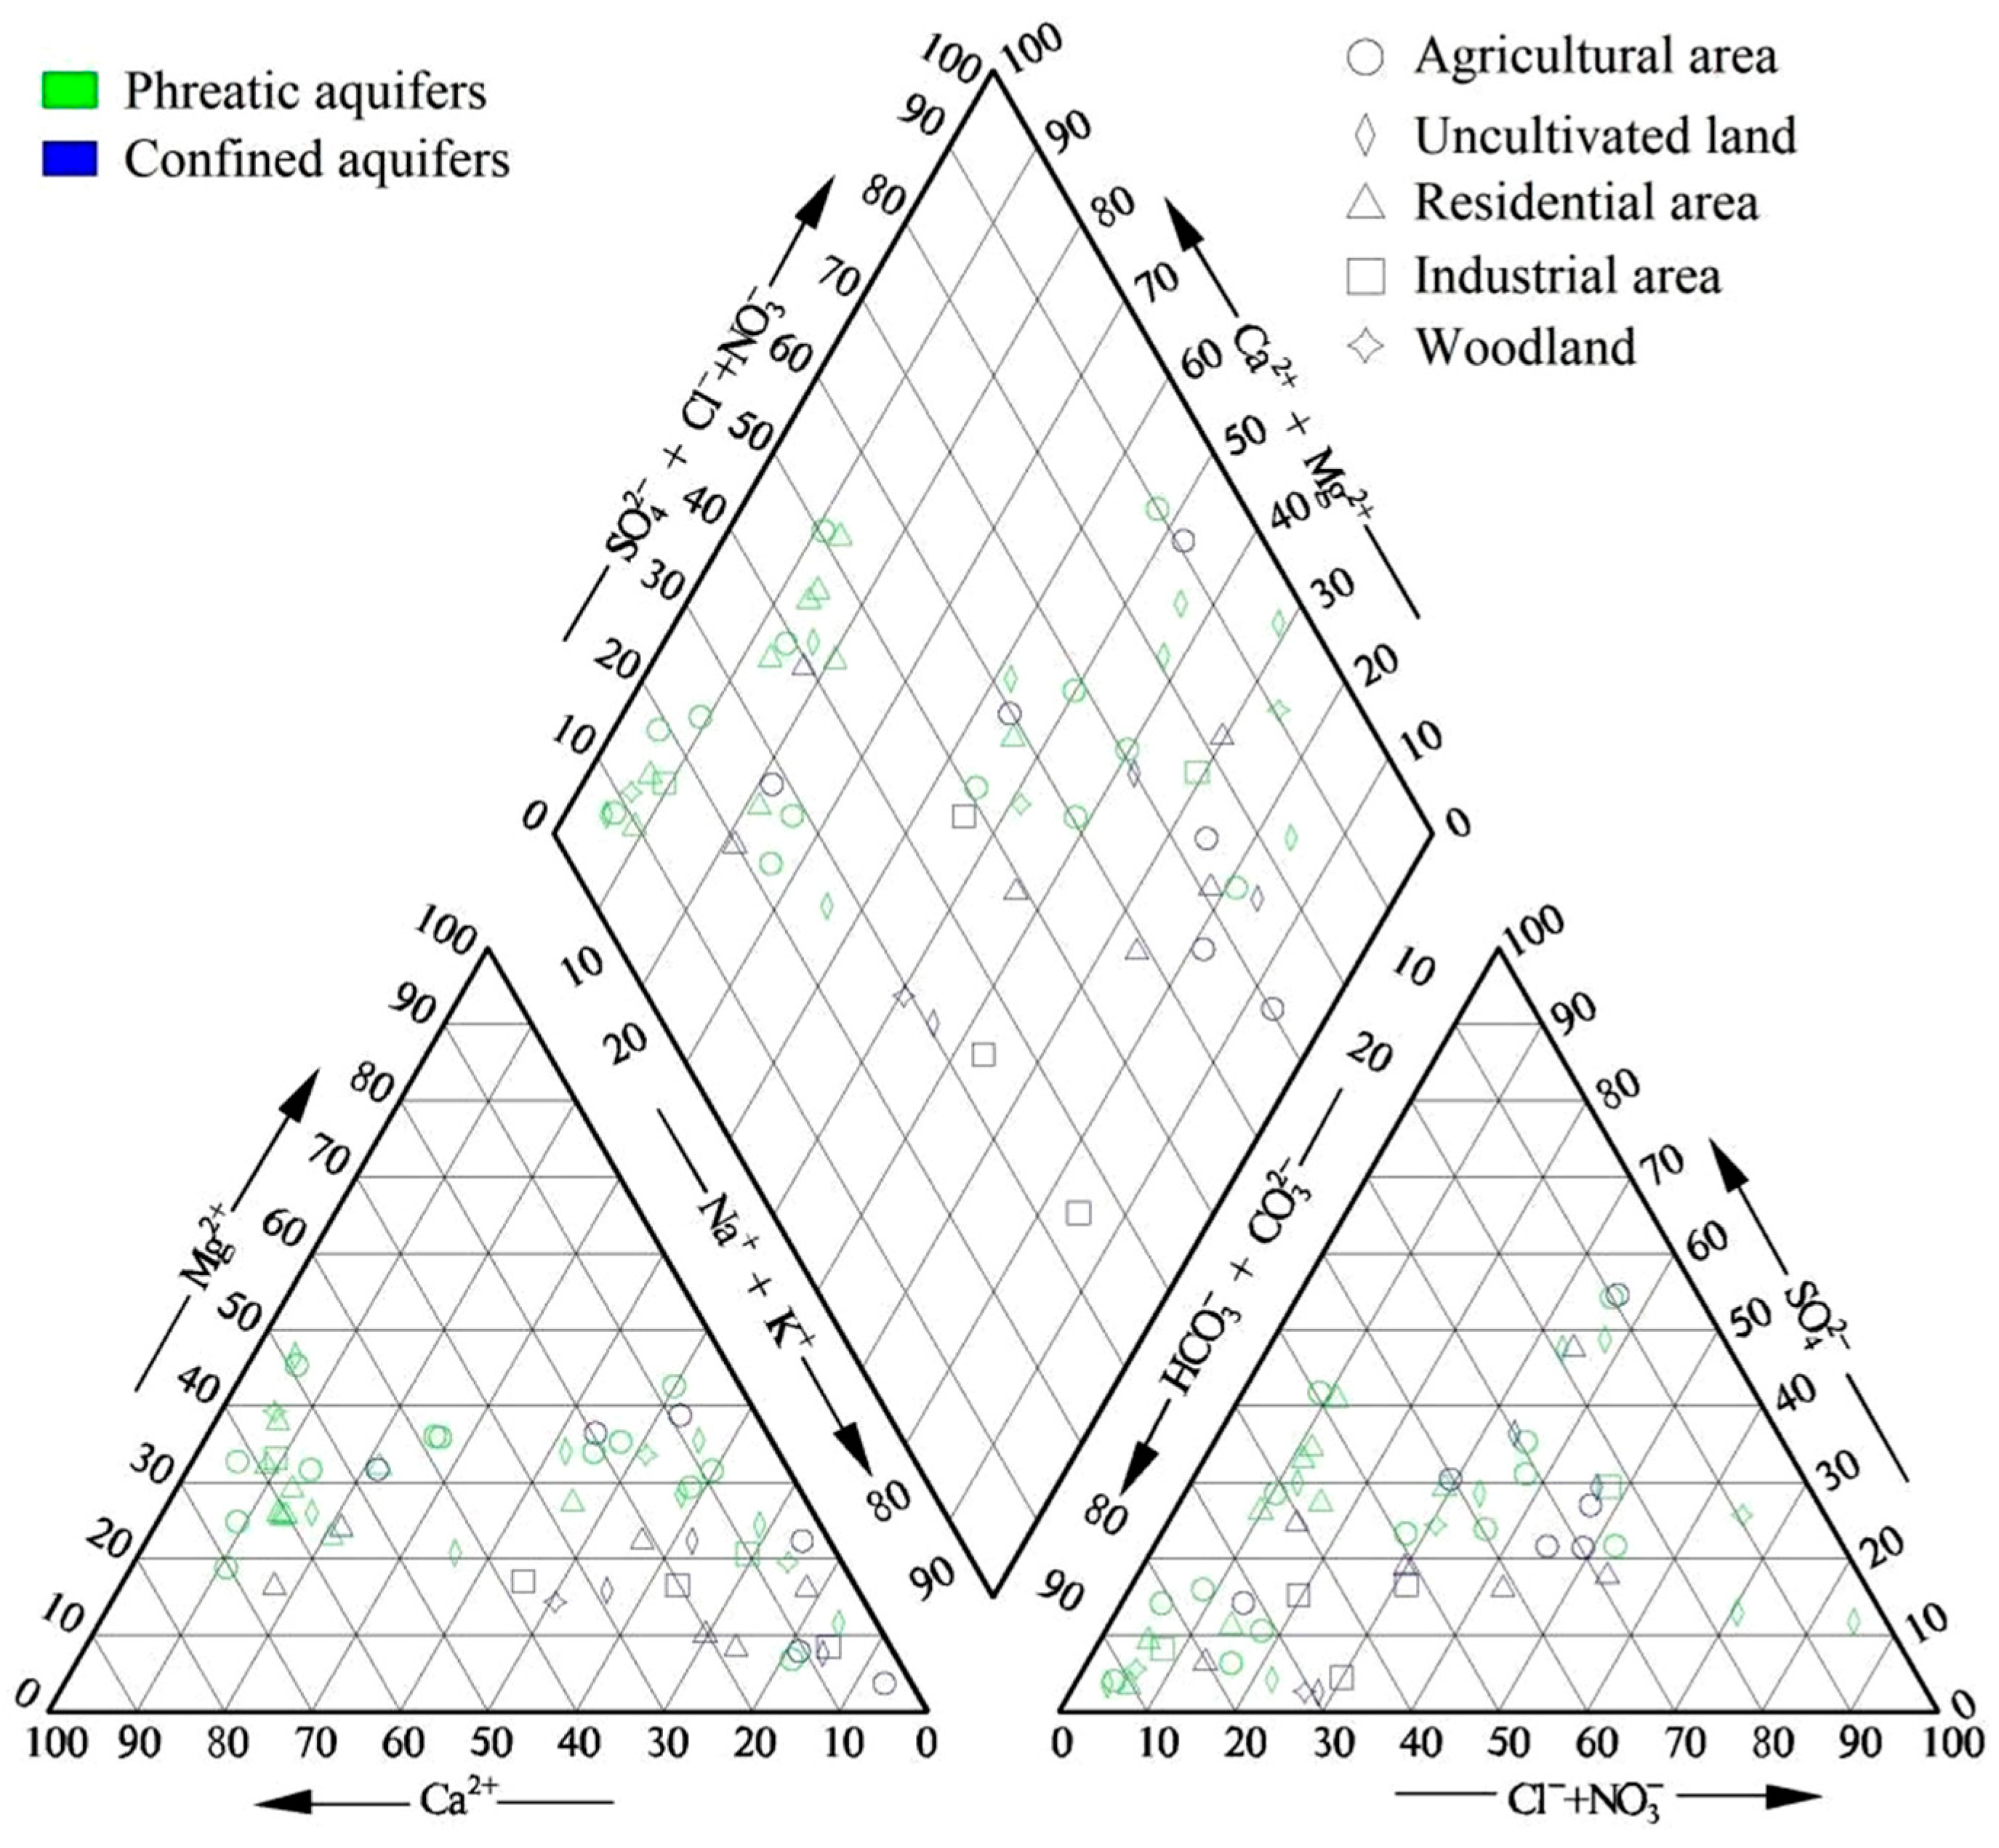
4.1. Characteristics of Groundwater Chemistry

As shown in Table 2, groundwater pH in both phreatic and confined aquifers was predominantly near neutral to weak alkaline in the Hebei Plain. Similarly, the median values of groundwater pH in southern Hebei Plain from 2018 to 2020 were 7.6–7.8 [13]. This indicates that groundwater pH in the Hebei Plain in recent years was shown to be stable. Groundwater COD concentrations were a wide range of 0.31–14.11 mg/L in phreatic aquifers but a narrow range of 0.3–1.39 mg/L in confined aquifers. Both groundwater TH and TDS concentrations in phreatic and confined aquifers were shown wide ranges, and their median values in phreatic aquifers were 3.4 times and 1.5 times those in confined aquifers, respectively. Similarly, in the North China Plain containing the Hebei Plain, the median TDS value in shallow groundwater was also approximately 1.5 times that in deep groundwater from 2006 to 2008 [33]. This is probably attributed to anthropogenic inputs and/or the infiltration of minerals dissolution in the vadose zone via the water flow because wastewater with high concentrations of TDS often infiltrates into phreatic aquifers rather than confined aquifers [16,17]. Major ions except NO3 and K+ in phreatic and confined aquifers were shown wide range concentrations. Generally, groundwater major anions concentrations in both phreatic and confined aquifers were orders of HCO3 > SO42− > Cl > NO3, and median concentrations of groundwater HCO3, SO42−, Cl, and NO3 in phreatic aquifers were 1.7 times, 2.1 times, 1.3 times, and 8 times of those in confined aquifers, respectively. This is probably due to the anthropogenic inputs of these anions and the infiltration of dissolution of related minerals (e.g., calcite, dolomite, gypsum, and halite) in the vadose zone for phreatic aquifers rather than for confined aquifers [8,16]. Unlike major anions, median values of groundwater major cations in phreatic aquifers were shown in an order of Ca2+ > Na+ > Mg2+ > K+, but those in confined aquifers presented an order of Na+ > Ca2+ > Mg2+ > K+. Median concentrations of groundwater Ca2+, Mg2+, and K+ in phreatic aquifers were 4.0 times, 3.1 times, and 1.4 times those in confined aquifers, respectively. By contrast, the median value of groundwater Na+ in phreatic aquifers was approximately half of that in confined aquifers. These are likely not only due to the anthropogenic input of K+ and the infiltration of dissolutions of Ca and Mg-containing minerals (e.g., calcite, dolomite) in the vadose zone for phreatic aquifers but also because of the stronger ion exchange process of “Na in sediments replaced by Ca and Mg” in confined aquifers than in phreatic aquifers [9,10]. Median concentrations of trace metal(lion)s including B, Mn, Al, Fe, and Ba in groundwater in both phreatic and confined aquifers were higher than detection limits, while that of others including Zn, Ni, Cd, Pb, As, Se, Hg, and Cr(VI) in groundwater of phreatic and/or confined aquifers were lower than detection limits. Median values of groundwater Al and Ba in phreatic aquifers were approximately double those in confined aquifers. This indicates that groundwater Al and Ba in the Hebei Plain mainly originated from the anthropogenic inputs and/or the infiltration of dissolution of Al- and Ba-containing minerals in the vadose zone [32,34]. By contrast, the median concentration of groundwater F in phreatic aquifers was 0.8 times that in confined aquifers. This is consistent with the distribution of groundwater pH in the study area; the median pH value in phreatic aquifers was 0.9 times that in confined aquifers (Table 2). These indicate that geogenic factors such as alkaline conditions likely control the distribution of groundwater F in the Hebei Plain because alkalization is in favor of the desorption and dissolution of fluorinated minerals [13,35]. In addition, other chemical components, including I, NO2, NH4+, and S2− in groundwater of phreatic and/or confined aquifers, were also shown to have median values lower than detection limits.
Statistics for concentrations of groundwater chemical parameters in phreatic aquifers in Piedmont, central, and littoral plains are present in Table 3. Groundwater pH in phreatic aquifers in all three plains was near neutral to weak alkaline. The median concentration of groundwater COD in phreatic aquifers increased gradually from the Piedmont plain to the littoral plain. This indicates that the groundwater environment from the Piedmont plain to the littoral plain is reducing environment because of the decrease in groundwater flow velocity from the Piedmont plain to the littoral plain [27]. As median and mean concentrations are concerned, TDS and most major ions, including Cl, K+, Na+, Ca2+, and Mg2+ in groundwater in phreatic aquifers, increased gradually from the Piedmont plain to the littoral plain. This is probably attributed to the change in water–rock interaction and evaporation from the Piedmont plain to the littoral plain and the frequent occurrence of seawater intrusion in the littoral plain because ion exchange and evaporation processes for groundwater chemistry from the Piedmont plain to the littoral plain in the Hebei Plain become stronger [10,16,17,36]. For example, Zhan et al. have already pointed out that Ca- and Mg-containing minerals (e.g., calcite, dolomite, and gypsum) in groundwater in the Piedmont plain were shown less negative saturation indices than those in central and littoral plains, and resulting in concentrations of groundwater TDS accompanied by Ca and Mg from the Piedmont plain to the littoral plain increased [16]. In addition, median and mean concentrations of B and Mn in groundwater in phreatic aquifers also increased gradually from the Piedmont plain to the littoral plain. This likely ascribes to the enhancement of the ion exchange process and reductive dissolution from the Piedmont plain to the littoral plain in the Hebei Plain because the enrichment of B in groundwater is commonly accompanied by ion exchange that depletes Ca and enriches Na in groundwater [37], and the reductive dissolution of Mn containing minerals is in favor of the enrichment of Mn in groundwater [38]. By contrast, median and mean concentrations of groundwater HCO3, F, Fe, and Zn in phreatic aquifers in the central plain were higher than those in the other two plains. In addition, median and mean concentrations of groundwater NO3 in phreatic aquifers in the Piedmont plain were higher than those in other two plains. This indicates that groundwater NO3 contamination was more often in the Piedmont plain than in the other two plains because the groundwater environment in the Piedmont plain was more oxidizing than that in the other two plains [9].
As seen in Figure 2, groundwater anions were generally dominated by HCO3 in both phreatic and confined aquifers in the Hebei Plain. By contrast, groundwater cations in phreatic aquifers were dominated by Ca2+ and Na+, but confined aquifers, they were almost dominated by Na+. The numbers of hydrogeochemical facies for groundwater in phreatic and confined aquifers were 18 and 13, respectively. Hydrogeochemical facies of groundwater in phreatic and confined aquifers were dominated by Ca·Mg-HCO3 facies (25.7%) and Na-HCO3 facies (15.8%), respectively. In phreatic aquifers, groundwater cations in residential areas were dominated by Ca·Mg facies, which in uncultivated lands were dominated by Na·Mg facies and Na facies, but in agricultural areas were dominated by Ca·Mg facies and Na·Mg facies. On the other hand, groundwater anions in both residential and agricultural areas were dominated by HCO3 facies and HCO3·SO4 facies, while in uncultivated lands they were dominated by Cl facies and HCO3 facies. These likely hint that hydrogeochemical facies in residential areas were mainly controlled by geogenic factors, while in uncultivated and agricultural lands they were controlled by both geogenic and anthropogenic factors. Because shallow groundwater in the study area is dominated by Na facies and Cl facies, often ascribed to anthropogenic inputs, while that dominated by Ca facies, Ca·Mg facies, HCO3 facies, and HCO3·SO4 facies is generally attributed to geogenic sources [11,16]. Unlike in other coastal areas, such as the Pearl River Delta [39], no NO3 facies groundwater occurred in the Hebei Plain. It is worth mentioning that all groundwater samples with the concentration of NO3 accounted for >10% of total major anions concentration (meq) were located in agricultural and residential areas. This indicates that groundwater NO3 contamination in the Hebei Plain likely originated from agricultural activities and human wastes [8].
In this study, the Gibbs Diagram was applied to analyze groundwater chemistry in the Hebei Plain. As shown in Figure 3, Na/(Na + Ca) ratios in 86.4% of phreatic groundwaters in the Piedmont plain were less than 0.5 and accompanied by low levels of TDS (<1000 mg/L). This indicates that rock weathering was the dominant mechanism for phreatic groundwater chemistry in the Piedmont plain [18]. By contrast, the confined groundwater in the Piedmont plain was also accompanied by low levels of TDS (<1000 mg/L) but commonly showed higher Na/(Na + Ca) ratios than that in phreatic groundwaters, approximately 67% of confined groundwaters in the Piedmont plain were characterized by Na/(Na + Ca) ratios > 0.5. This infers both rock weathering and ion exchange processes controlling groundwater chemistry in confined aquifers in the Piedmont plain because longer residence times for groundwater in confined aquifers than in phreatic aquifers is in favor of the ion exchange process of sediments adsorbed Na replaced by groundwater Ca [23,26,40]. Compared to the Piedmont plain, Na/(Na + Ca) ratios and TDS concentrations in both phreatic and confined groundwaters in the central plain were higher. This implies that the evaporation process and/or the dissolution of evaporites with cation exchange for groundwater chemistry in the central plain were likely more important than that in the Piedmont plain because the depth of groundwater level in the central plain was shallower than that in the Piedmont plain and the residence time for groundwater in the central plain was longer than that in the Piedmont plain [26,41]. On the other hand, the depth of groundwater level in the central plain in both phreatic and confined aquifers was generally deeper than 3 m [9,21], indicating that the impact of the evaporation process on groundwater chemistry in the central plain was negligible because evaporation from groundwater is often little when the groundwater level deeper than a few meters [42]. Therefore, evaporite dissolution with cation exchange mainly controlled groundwater chemistry in the central plain. Additionally, in the central plain, the median concentration of TDS in phreatic groundwater was more than three times that in confined groundwater. This indicates that evaporite dissolution for groundwater chemistry in phreatic aquifers in the central plain was more important than confined aquifers [18]. In phreatic aquifers, groundwater Na/(Na + Ca) ratios and TDS concentrations in the littoral plain were commonly higher than in Piedmont and central plains. This is likely attributed to strong evaporite dissolution and the occurrence of seawater intrusion in the littoral plain [9,43].

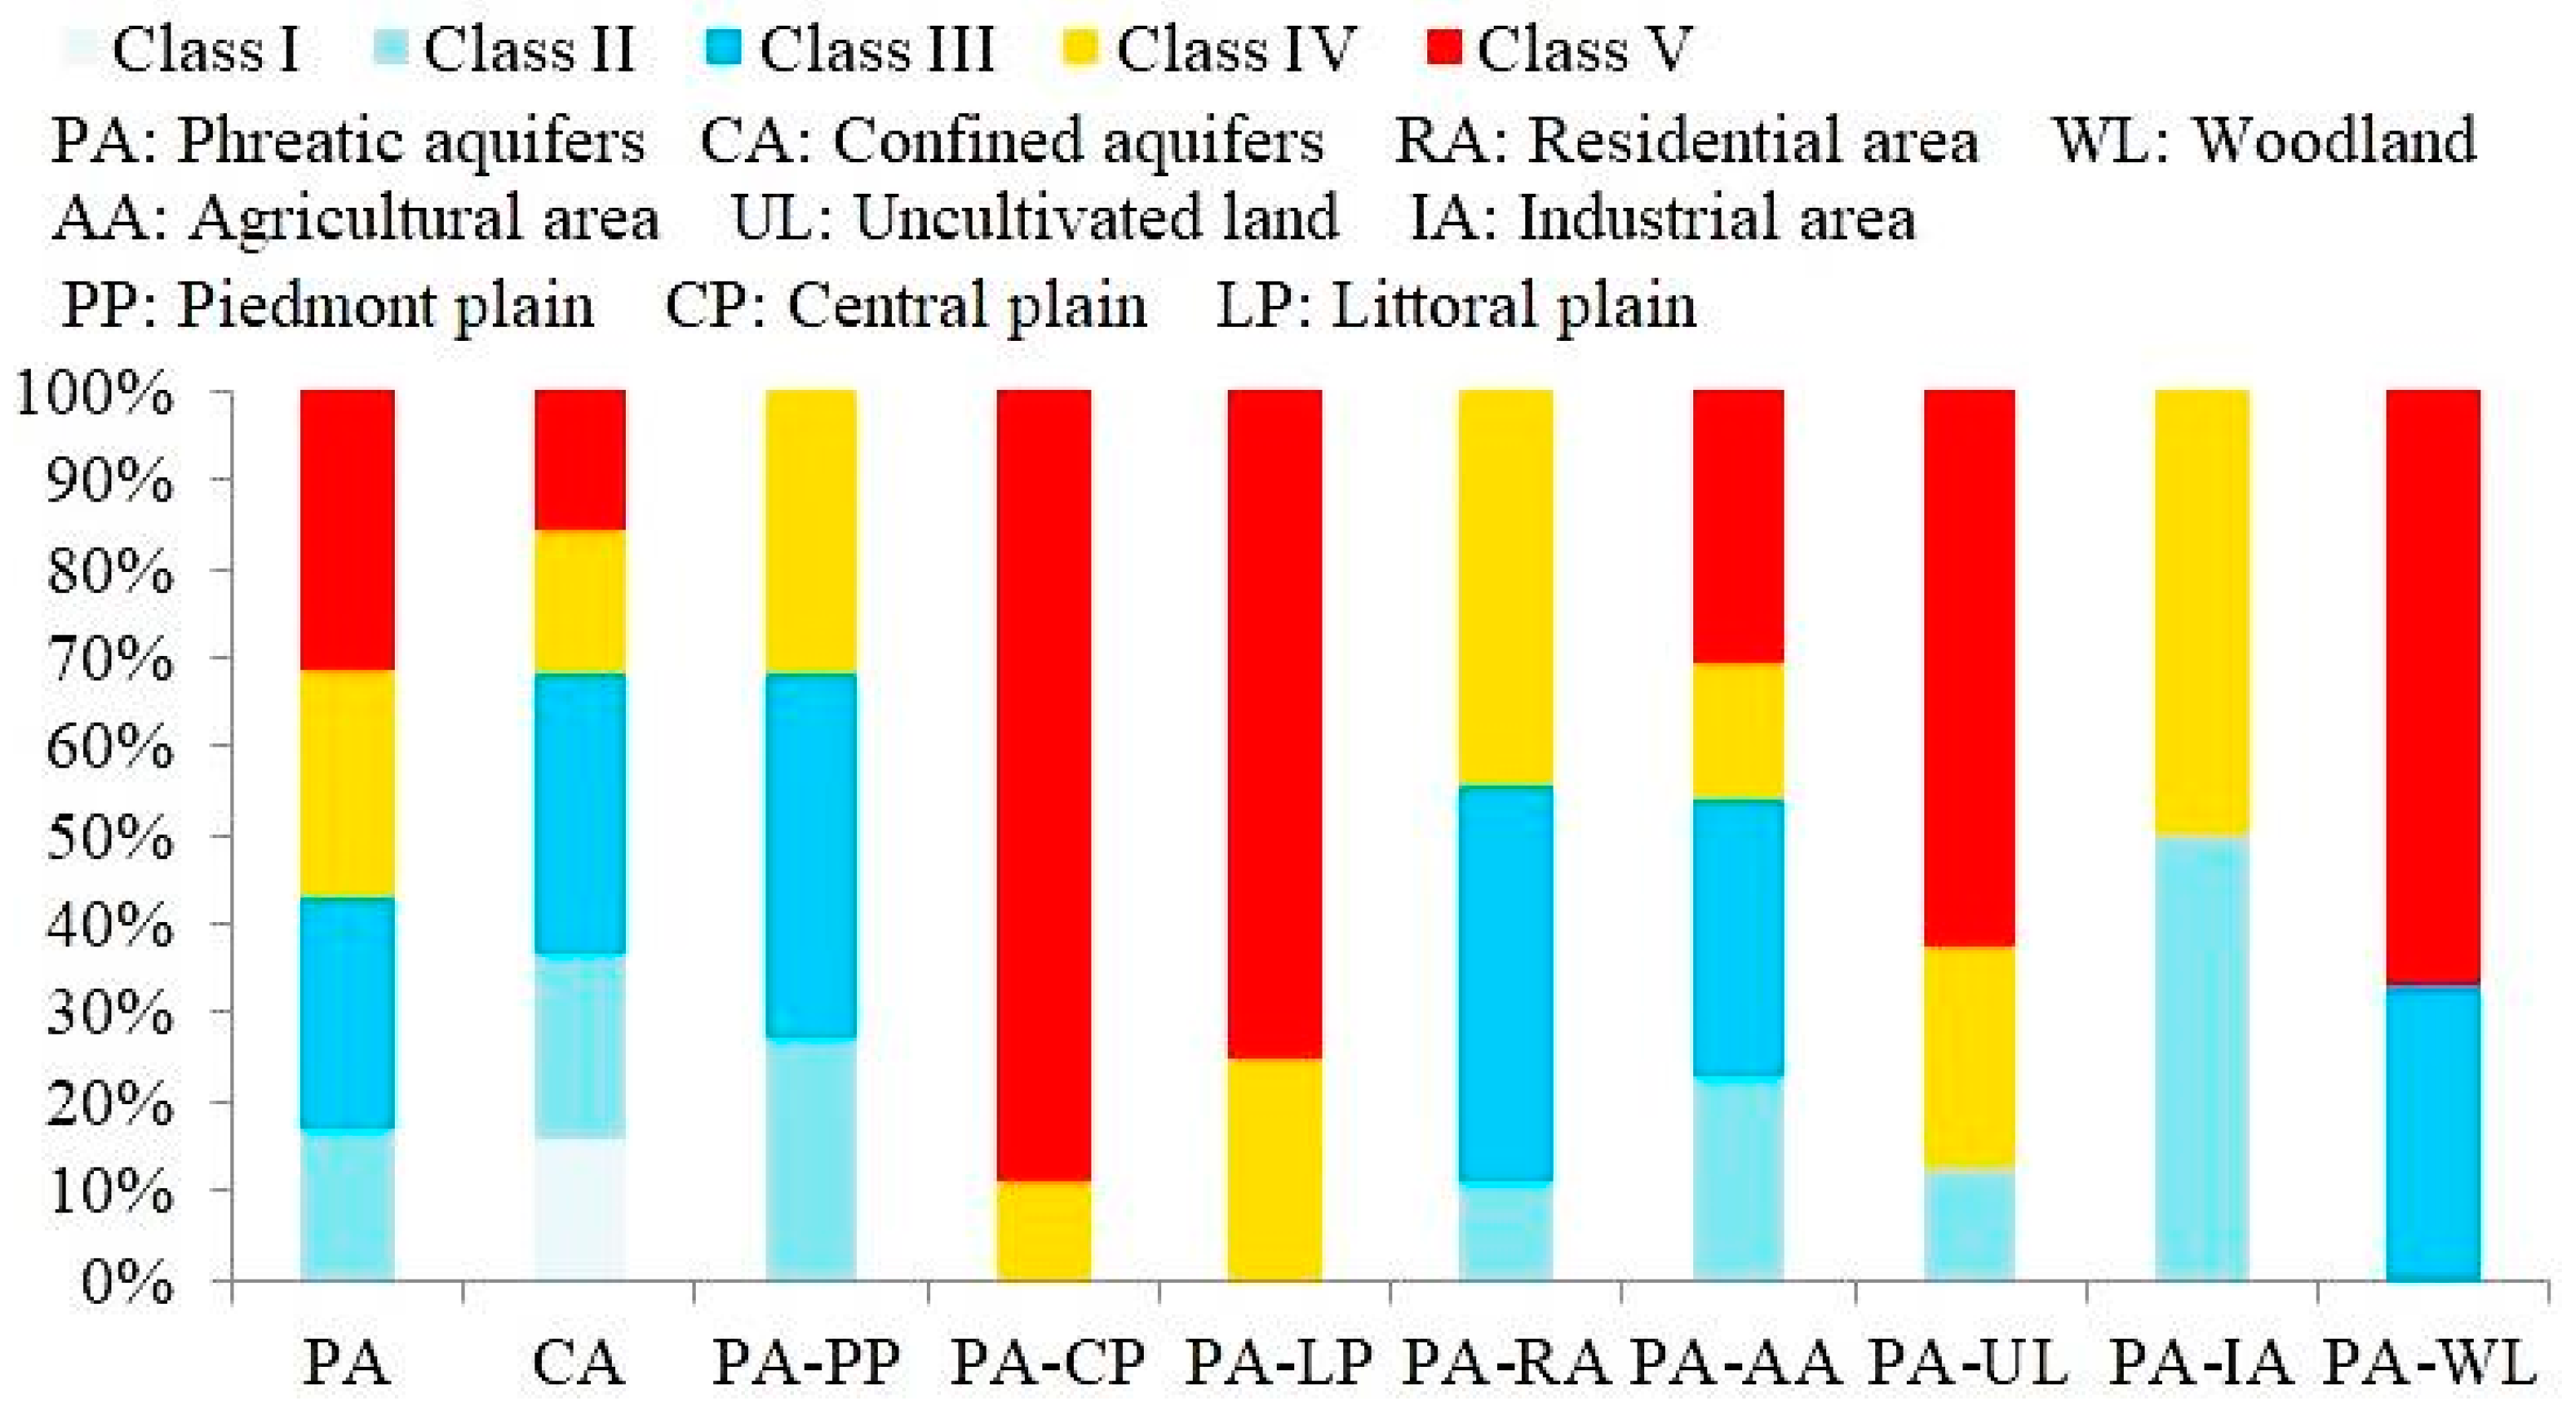
4.2. Distribution of Groundwater Quality

Compared to standards for groundwater quality in China [28], proportions of groundwater samples with concentrations of chemical components exceeded allowable limits (PEAL) for drinking purposes are shown in Table 4. In the Hebei Plain, TH was shown the highest PEAL of 54.3% in phreatic aquifers, followed by ten components (Mn, TDS, Na+, Fe, Cl, SO42−, I, B, F, and S2−) with their PEALs > 10% and six components (Al, COD, NO3, NH4+, Zn, and Se) with their PEALs of 2–10%, while the PEALs of other nine components in phreatic aquifers were zero. By contrast, in confined aquifers, S2− was shown the highest PEAL of 31.6%, followed by seven components (F, Na+, Mn, TDS, Fe, Cl, and I) with their PEALs > 10% and five components (TH, SO42−, B, Zn, and pH) with their PEALs of 5.3%, while other 13 components with their PEALs of zero. Among them, the PEALs of TH, SO42 −, and B in phreatic aquifers were more than 10 times, 5 times, and 3 times those in confined aquifers. The PEALs of Mn, TDS, Na+, Fe, Cl, and I in phreatic aquifers were 2–3 times those in confined aquifers. In addition, the PEALs of Al, COD, NO3, NH4+, and Se in phreatic aquifers were also higher than those in confined aquifers. In contrast, the PEALs of S2−, F, pH, and Zn in phreatic aquifers were lower than those in confined aquifers. Within phreatic aquifers, seven components including TH, Mn, Fe, TDS, Na+, F, and I in the Piedmont plain showed their PEALs > 0; by contrast, 17 components including Mn, TDS, Na+, Cl, SO42−, TH, I, Fe, B, F, S2−, Al, Zn, COD, Se, NO3, and NH4+ in central and littoral plains showed their PEALs > 0. Moreover, PEALs of all these 17 components in central and littoral plains in phreatic aquifers were much higher than those in the Piedmont plain. For example, PEALs of Mn, TDS, Na+, Fe, I, and F in central and littoral plains in phreatic aquifers were much more than 7 times, 10 times, 20 times, 5 times, 17 times, and 8 times those in the Piedmont plain, respectively. These indicate that groundwater quality in the Piedmont plain within phreatic aquifers was better than in central and littoral plains.
The groundwater quality (5 classes) of the Hebei Plain was assessed by the FSE method and shown in Figure 4. In phreatic aquifers, the percentages of classes II, III, IV, and V of groundwater samples were 17.2%, 25.7%, 25.7%, and 31.4%, respectively. In other words, 43% and 57% of groundwater samples in phreatic aquifers were good-quality (drinkable, classes I to III) and poor-quality (undrinkable, classes IV and V), respectively. By contrast, the percentages of classes I, II, III, IV, and V groundwater samples in confined aquifers were 15.8%, 21.0%, 31.6%, 15.8%, and 15.8%, respectively. The proportion of drinkable groundwater in confined aquifers was 1.6 times that in phreatic aquifers. In phreatic aquifers, the proportion of drinkable groundwater in the Piedmont plain was as high as 68%, but none of drinkable groundwater occurred in the central and littoral plains. In addition, the proportions of drinkable groundwater in phreatic aquifers in different land use types were in the order of residential area (55.5%) > agricultural area (53.9%) > industrial area (50%) > woodland (33.3%) > uncultivated land (12.5%). This indicates that groundwater quality in phreatic aquifers in the Hebei Plain was probably controlled by natural factors rather than anthropogenic factors because groundwater pollution was generally more frequent in three former land use types than in two latter ones [44].

4.3. Factors Controlling Groundwater Quality

In this study, the PCA was used to analyze the factors controlling groundwater quality in phreatic and confined aquifers in the Hebei Plain. Here, parameters in the PCA include pH, major ions, and exceeding indicators that concentrations in one or more groundwater samples are higher than their allowable limits. As shown in Table 5, groundwater quality in phreatic aquifers was mainly controlled by five factors. PC1 (factor 1) had strong positive loadings with Cl, COD, Na+, TDS, Mn, TH, Mg2+, K+, and Ca2+, indicating that the PC1 was indicative of the water–rock interaction (e.g., minerals dissolution, ion exchange) because the dissolution of (evaporate) minerals and the ion exchange process were mainly responsible for enrichments of Cl, Na+, TDS, Mn, TH, Mg2+, K+, and Ca2+ in phreatic groundwater (Figure 3) [16]. PC2 (factor 2) showed high positive loadings of I, HCO3, and B and moderate positive loadings of SO42− and F. This was likely representative of the marine geogenic sources because groundwater SO42− and B often originated from the oxidation of pyrite and the dissolution of glauconite in carbonate rocks in marine sediments [45], and the enrichment of groundwater I and HCO3 accompanied with alkalization (in favor of groundwater F enrichment) is often resulted from the mineralization of organic iodine in marine sediments in coastal areas [33,46,47,48]. PC3 (factor 3) explained 11.6% of the total variance with strong to moderate positive loadings of Se, Zn, and NO3. This probably represented the agricultural pollution because groundwater with high levels of NO3 and Zn in phreatic aquifers in the Hebei Plain was generally distributed in agricultural areas (Figure 2) [8], and NO3 inputs were in favor of groundwater Se enrichment via the oxidation of reduced Se in sediments [34]. PC4 (factor 4) had a strong negative loading with pH and a moderate positive loading with Fe, indicating that the PC4 likely represented the acidification because the acidification elevates the mobilization of Fe in sediments [49]. PC5 (factor 5) showed a high positive loading of NH4+ and weak positive loadings of S2− and Al. This was likely indicative of the reductive environment because the reductive environment is in favor of the enrichment of NH4+ and S2− in groundwater [3,50].
By contrast, groundwater quality in confined aquifers was mainly controlled by three factors. PC1 (factor 1) had strong positive loadings with TDS, Cl, Na+, Mg2+, TH, SO42−, Mn, B, HCO3, Fe, I, and Ca2+, and a moderate positive loading with COD. As mentioned previously, the water–rock interaction, such as minerals dissolution and ion exchange, was mainly responsible for the enrichment of TDS, Cl, Na+, Mg2+, TH, SO42−, HCO3, and Ca2+ in confined groundwater (Figure 3). Additionally, the reductive dissolution of Fe/Mn (hydroxy)oxides loaded with I in the reductive environment was mainly responsible for the enrichment of groundwater Mn, Fe, and I in the Hebei Plain [46]. Therefore, the PC1 was assumed to be representative of the water–rock interaction and redox processes. PC2 (factor 2) showed strong positive loadings with Zn and S2− and a moderate positive loading with pH, indicating that the PC2 was not a natural factor because groundwater zinc generally presents in low concentrations in the presence of sulfide [51]. On the other hand, groundwater with high values of Zn, S2−, and pH in confined aquifers was distributed in the agricultural area. Therefore, it can be concluded that the PC2 was likely indicative of agricultural pollution. PC3 (factor 3) had strong positive and negative loadings with K+ and F, respectively. This likely represented the input of external water because the input of external water, such as the ecological water with low levels of F occurred in the Hebei Plain in recent years [15].

5. Conclusions

Hydrogeochemical characteristics and groundwater quality in phreatic and confined aquifers of the Hebei Plain were investigated. Anthropogenic inputs and/or the infiltration of minerals dissolution in the vadose zone resulted in groundwater TH, TDS, Al, Ba, and major ions excluding K+ in phreatic aquifers higher than in confined aquifers. By contrast, more alkaline conditions were likely responsible for higher concentrations of groundwater F in confined aquifers than in phreatic aquifers. From the Piedmont plain to the littoral plain, phreatic aquifers towards the reducing environment, and the enhancement of water–rock interaction, ion exchange process, and evaporation probably resulted in the increase of groundwater TDS, major ions (excluding HCO3 and SO42−), B, and Mn concentrations. Moreover, the phreatic groundwater chemistry was mainly controlled by rock weathering changing into evaporite dissolution and seawater intrusion from the Piedmont plain to the littoral plain, according to the Gibbs diagram.
In the Hebei Plain, groundwater in confined aquifers is more suitable to be developed for drinking purposes than in phreatic aquifers because the proportion of drinkable groundwater in confined aquifers was 1.6 times that in phreatic aquifers according to this investigation. For phreatic aquifers, groundwater in the Piedmont plain should be protected because of the much higher proportion of drinkable groundwater in the Piedmont plain than in the other two plains. Groundwater quality in phreatic aquifers was mainly controlled by five factors, including the water–rock interaction, the marine geogenic sources, the agricultural pollution, the acidification, and the reductive environment. By contrast, groundwater quality in confined aquifers was mainly controlled by three factors, including the water–rock interaction and redox processes, agricultural pollution, and the input of external water.
This is the first time to depict the distribution of groundwater chemistry and quality in the whole Hebei Plain in recent years. However, knowledge of the origins of various poor-quality groundwaters in this area is still limited. Thus, in the future, we will focus on sources, driving forces, and treatment of poor-quality groundwater in this area.

Author Contributions

Conceptualization, Y.Q. and Q.H.; methodology, C.W.; software, C.G.; validation, Y.Q., C.W. and S.Z.; formal analysis, C.Y.; investigation, Q.H., S.Z. and X.C.; resources, Y.Q.; data curation, Q.H.; writing—original draft preparation, Y.Q.; writing—review and editing, Q.H. and C.W.; visualization, C.G.; supervision, X.C.; project administration, C.Y.; funding acquisition, Y.Q. All authors have read and agreed to the published version of the manuscript.

Funding

This research was supported by the Investigation and Evaluation of the Groundwater Basic Environment around National Control Assessment Points in Hebei Province in China (IHEGJS2021083) and the S&T Program of Hebei in China (21567632H).

Data Availability Statement

The datasets generated and/or analyzed during the current study are not publicly available.

Conflicts of Interest

The authors declare no conflict of interest.

References

  1. Lu, X.; Jin, M.; van Genuchten, M.T.; Wang, B. Groundwater Recharge at Five Representative Sites in the Hebei Plain, China. Groundwater 2011, 49, 286–294. [Google Scholar] [CrossRef]
  2. Huan, H.; Hu, L.; Yang, Y.; Jia, Y.; Lian, X.; Ma, X.; Jiang, Y.; Xi, B. Groundwater nitrate pollution risk assessment of the groundwater source field based on the integrated numerical simulations in the unsaturated zone and saturated aquifer. Environ. Int. 2020, 137, 105532. [Google Scholar] [CrossRef]
  3. Zhang, M.; Huang, G.; Liu, C.; Zhang, Y.; Chen, Z.; Wang, J. Distributions and origins of nitrate, nitrite, and ammonium in various aquifers in an urbanized coastal area, south China. J. Hydrol. 2020, 582, 124528. [Google Scholar] [CrossRef]
  4. Ayari, J.; Barbieri, M.; Agnan, Y.; Sellami, A.; Braham, A.; Dhaha, F.; Charef, A. Trace element contamination in the mine-affected stream sediments of Oued Rarai in north-western Tunisia: A river basin scale assessment. Environ. Geochem. Health 2021, 43, 4027–4042. [Google Scholar] [CrossRef]
  5. Huang, G.; Pei, L.; Li, L.; Liu, C. Natural background levels in groundwater in the Pearl River Delta after the rapid expansion of urbanization: A new pre-selection method. Sci. Total Environ. 2022, 813, 151890. [Google Scholar] [CrossRef]
  6. Ayari, J.; Barbieri, M.; Barhoumi, A.; Boschetti, T.; Braham, A.; Dhaha, F.; Charef, A. Trace metal element pollution in media from the abandoned Pb and Zn mine of Lakhouat, Northern Tunisia. J. Geochem. Explor. 2023, 247, 107180. [Google Scholar] [CrossRef]
  7. Bi, P.; Liu, R.; Huang, G.; Li, D. Evaluating natural background levels of heavy metals in shallow groundwater of the Pearl River Delta via removal of contaminated groundwaters: Comparison of three preselection related methods. Environ. Pollut. 2023, 335, 122382. [Google Scholar] [CrossRef]
  8. Gan, L.; Huang, G.; Pei, L.; Gan, Y.; Liu, C.; Yang, M.; Han, D.; Song, J. Distributions, origins, and health-risk assessment of nitrate in groundwater in typical alluvial-pluvial fans, North China Plain. Environ. Sci. Pollut. Res. 2022, 29, 17031–17048. [Google Scholar] [CrossRef]
  9. Qian, Y.; Cui, X.; Yue, C.; Guo, C.; Zhen, S.; Wang, W.; Huang, G.; Li, H.; Wang, Y.; Su, C.; et al. Report on the Investigation and Evaluation of the Basic Environmental Conditions of Groundwater Around the State Control Assessment Points in Hebei Province; The Institute of Hydrogeology and Environmental Geology, Chinese Academy of Geological Sciences: Shijiazhuang, China, 2022. (In Chinese) [Google Scholar]
  10. Xing, L.; Guo, H.; Zhan, Y. Groundwater hydrochemical characteristics and processes along flow paths in the North China Plain. J. Asian Earth Sci. 2013, 70–71, 250–264. [Google Scholar] [CrossRef]
  11. Zhang, Y.; Chen, Z.; Sun, J.; Wang, J. Natural background levels of chemical components in groundwater of Hutuo River catchment area, North China Plain. Environ. Forensics 2017, 18, 62–73. [Google Scholar] [CrossRef]
  12. Zhang, Y.; Wu, Y.; Sun, J.; Hu, S.; Zhang, Y.; Xiang, X. Controls on the spatial distribution of iodine in groundwater in the Hebei Plain, China. Environ. Sci. Pollut. Res. 2018, 25, 16702–16709. [Google Scholar] [CrossRef]
  13. Zhang, L.; Dong, D.; Lv, S.; Ding, J.; Yan, M.; Han, G. Spatial evolution analysis of groundwater chemistry, quality, and fuoride health risk in southern Hebei Plain, China. Environ. Sci. Pollut. Res. 2023, 30, 61032–61051. [Google Scholar] [CrossRef]
  14. Liu, F.; Zou, J.; Liu, J.; Zhang, J.; Zhen, P. Factors controlling groundwater chemical evolution with the impact of reduced exploitation. Catena 2022, 214, 106261. [Google Scholar] [CrossRef]
  15. Hao, C.; Wei, Q.; Dong, H.; Ma, T.; Liu, X.; Li, D.; Dong, J. Geochemical evidence for annual variability of fluoride levels in deep groundwater on land subsidence plain in Cangzhou, Hebei Province, China. Geochemistry 2023, 125985. [Google Scholar] [CrossRef]
  16. Zhan, Y.; Guo, H.; Wang, Y.; Li, R.; Hou, C.; Shao, J.; Cui, Y. Evolution of groundwater major components in the Hebei Plain: Evidences from 30-year monitoring data. J. Earth Sci. 2014, 25, 563–574. [Google Scholar] [CrossRef]
  17. Huang, G.; Sun, J.; Zhang, Y.; Chen, Z.; Liu, F. Impact of anthropogenic and natural processes on the evolution of groundwater chemistry in a rapidly urbanized coastal area, South China. Sci. Total Environ. 2013, 463–464, 209–221. [Google Scholar] [CrossRef]
  18. Marandi, A.; Shand, P. Groundwater chemistry and the Gibbs Diagram. Appl. Geochem. 2018, 97, 209–212. [Google Scholar] [CrossRef]
  19. Liu, F.; Huang, G.; Sun, J.; Jing, J.; Zhang, Y. A new evaluation method for groundwater quality applied in Guangzhou region, China: Using fuzzy method combining toxicity index. Water Environ. Res. 2016, 88, 99–106. [Google Scholar] [CrossRef]
  20. Güler, C.; Kurt, M.A.; Alpaslan, M.; Akbulut, C. Assessment of the impact of anthropogenic activities on the groundwater hydrology and chemistry in Tarsus coastal plain (Mersin, SE Turkey) using fuzzy clustering, multivariate statistics and GIS techniques. J. Hydrol. 2012, 414–415, 435–451. [Google Scholar] [CrossRef]
  21. Hu, X.; Shi, L.; Zeng, J.; Yang, J.; Zha, Y.; Yao, Y.; Cao, G. Estimation of actual irrigation amount and its impact on groundwater depletion: A case study in the Hebei Plain, China. J. Hydrol. 2016, 543, 433–449. [Google Scholar] [CrossRef]
  22. Cao, G.; Zheng, C.; Scanlon, B.R.; Liu, J.; Li, W. Use of flow modeling to assess sustainability of groundwater resources in the North China Plain. Water Resour. Res. 2013, 49, 159–175. [Google Scholar] [CrossRef]
  23. Chen, Z.; Qi, J.; Xu, J.; Xu, J.; Ye, H.; Nan, Y. Paleoclimatic interpretation of the past 30 ka from isotopic studies of the deep confined aquifer of the North China Plain. Appl. Geochem. 2003, 18, 997–1009. [Google Scholar]
  24. Zhong, H.; Sun, L.; Fischer, G.; Tian, Z.; Liang, Z. Optimizing regional cropping systems with a dynamic adaptation strategy for water sustainable agriculture in the Hebei Plain. Agric. Syst. 2019, 173, 94–106. [Google Scholar] [CrossRef]
  25. Zhang, Z.; Shi, D.; Shen, Z.; Zhong, Z.; Xue, Y. Evolution and development of groundwater environment in North China Plain under human activities. Acta Geosci. Sin. 1997, 18, 337–344. [Google Scholar]
  26. Chen, Z.; Nie, Z.; Zhang, Z.; Qi, J.; Nan, Y. Isotopes and sustainability of ground water resources, North China Plain. Ground Water 2005, 43, 485–493. [Google Scholar]
  27. Zhang, Z.; Fei, Y.; Chen, Z.; Zhao, Z.; Xie, Z.; Wang, Y. Investigation and Assessment of Sustainable Utilization of Groundwater Resources in the North China Plain; Geology Press: Beijing, China, 2009; pp. 28–42. (In Chinese) [Google Scholar]
  28. General administration of quality supervision inspection and quarantine of the people’s republic of China (GAQSIQPRC). In Standard for Groundwater Quality; Standards Press of China: Beijing, China, 2017.
  29. Zhang, F.; Huang, G.; Hou, Q.; Liu, C.; Zhang, Y.; Zhang, Q. Groundwater quality in the Pearl River Delta after the rapid expansion of industrialization and urbanization: Distributions, main impact indicators, and driving forces. J. Hydrol. 2019, 577, 124004. [Google Scholar] [CrossRef]
  30. Huang, G.; Chen, Z.; Liu, F.; Sun, J.; Wang, J. Impact of human activity and natural processes on groundwater arsenic in an urbanized area (South China) using multivariate statistical techniques. Environ. Sci. Pollut. Res. 2014, 21, 13043–13054. [Google Scholar] [CrossRef]
  31. Huang, G.; Liu, C.; Zhang, Y.; Chen, Z. Groundwater is important for the geochemical cycling of phosphorus in rapidly urbanized areas: A case study in the Pearl River Delta. Environ. Pollut. 2020, 260, 114079. [Google Scholar] [CrossRef]
  32. Huang, G.; Hou, Q.; Han, D.; Liu, R.; Song, J. Large scale occurrence of aluminium-rich shallow groundwater in the Pearl River Delta after the rapid urbanization: Co-effects of anthropogenic and geogenic factors. J. Contam. Hydrol. 2023, 254, 104130. [Google Scholar] [CrossRef] [PubMed]
  33. Zhang, E.; Wang, Y.; Qian, Y.; Ma, T.; Zhang, D.; Zhan, H.; Zhang, Z.; Fei, Y.; Wang, S. Iodine in groundwater of the North China Plain: Spatial patterns and hydrogeochemical processes of enrichment. J. Geochem. Explor. 2013, 135, 40–53. [Google Scholar] [CrossRef]
  34. Huang, G.; Zhang, M.; Liu, C.; Li, L.; Chen, Z. Heavy metal(loid)s and organic contaminants in groundwater in the Pearl River Delta that has undergone three decades of urbanization and industrialization: Distributions, sources, and driving forces. Sci. Total Environ. 2018, 635, 913–925. [Google Scholar] [CrossRef] [PubMed]
  35. Xiao, Y.; Hao, Q.; Zhang, Y.; Zhu, Y.; Yin, S.; Qin, L.; Li, X. Investigating sources, driving forces and potential health risks of nitrate and fluoride in groundwater of a typical alluvial fan plain. Sci. Total Environ. 2022, 802, 149909. [Google Scholar] [CrossRef] [PubMed]
  36. Guo, Y.; Shen, Z.; Zhong, Z. Hydrogeochemical modeling of groundwater chemical environmental evolution in Hebei Plain. Sci. China Ser. D Earth Sci. 1997, 40, 502–508. [Google Scholar] [CrossRef]
  37. Ravenscroft, P.; McArthur, J.M. Mechanism of regional enrichment of groundwater by boron: The examples of Bangladesh and Michigan, USA. Appl. Geochem. 2004, 19, 1413–1430. [Google Scholar] [CrossRef]
  38. Hou, Q.; Zhang, Q.; Huang, G.; Liu, C.; Zhang, Y. Elevated manganese concentrations in shallow groundwater of various aquifers in a rapidly urbanized delta, south China. Sci. Total Environ. 2020, 701, 134777. [Google Scholar] [CrossRef] [PubMed]
  39. Huang, G.; Liu, C.; Sun, J.; Zhang, M.; Jing, J.; Li, L. A regional scale investigation on factors controlling the groundwater chemistry of various aquifers in a rapidly urbanized area: A case study of the Pearl River Delta. Sci. Total Environ. 2018, 625, 510–518. [Google Scholar] [CrossRef]
  40. Edmunds, W.M.; Cook, J.M.; Darling, W.G.; Kinniburgh, D.G.; Miles, D.L.; Bath, A.H.; Morgan-Jones, M.; Andrews, J.N. Baseline geochemical conditions in the Chalk aquifer, Berkshire, U.K.: A basis for groundwater quality management. Appl. Geochem. 1987, 2, 251–274. [Google Scholar] [CrossRef]
  41. Sahib, L.Y.; Marandi, A.; Schüth, C. Strontium isotopes as an indicator for groundwater salinity sources in the Kirkuk region, Iraq. Sci. Total Environ. 2016, 562, 935–945. [Google Scholar] [CrossRef]
  42. Barica, J. Salinization of groundwater in arid zones. Water Res. 1972, 6, 925–933. [Google Scholar] [CrossRef]
  43. Sarwade, D.V.; Nandakumar, M.V.; Kesari, M.P.; Mondal, N.C.; Singh, V.S.; Singh, B. Evaluation of sea water ingress into an Indian atoll. Environ. Geol. 2007, 52, 1475–1483. [Google Scholar] [CrossRef]
  44. Huang, G.; Song, J.; Han, D.; Liu, R.; Liu, C.; Hou, Q. Assessing natural background levels of geogenic contaminants in groundwater of an urbanized delta through removal of groundwaters impacted by anthropogenic inputs: New insights into driving factors. Sci. Total Environ. 2023, 857, 159527. [Google Scholar] [CrossRef] [PubMed]
  45. Mather, J.D.; Porteous, N.C. The geochemistry of boron and its isotopes in groundwaters from marine and non-marine sandstone aquifers. Appl. Geochem. 2001, 16, 821–834. [Google Scholar] [CrossRef]
  46. Li, J.; Zhou, H.; Qian, K.; Xie, X.; Xue, X.; Yang, Y.; Wang, Y. Fluoride and iodine enrichment in groundwater of North China Plain: Evidences from speciation analysis and geochemical modeling. Sci. Total Environ. 2017, 598, 239–248. [Google Scholar] [CrossRef]
  47. Huang, G.; Liu, C.; Li, L.; Zhang, F.; Chen, Z. Spatial distribution and origin of shallow groundwater iodide in a rapidly urbanized delta: A case study of the Pearl River Delta. J. Hydrol. 2020, 585, 124860. [Google Scholar] [CrossRef]
  48. Bi, P.; Huang, G.; Liu, C.; Li, L. Geochemical factors controlling natural background levels of phosphate in various groundwater units in a large-scale urbanized area. J. Hydrol. 2022, 608, 127594. [Google Scholar] [CrossRef]
  49. Huang, G.; Han, D.; Song, J.; Li, L.; Pei, L. A sharp contrasting occurrence of iron-rich groundwater in the Pearl River Delta during the past dozen years (2006-2018): The genesis and mitigation effect. Sci. Total Environ. 2022, 829, 154676. [Google Scholar] [CrossRef]
  50. Rye, R.O.; Back, W.; Hanshaw, B.B.; Rightmire, C.T.; Pearson, F.J., Jr. The origin and isotopic composition of dissolved sulfide in groundwater from carbonate aquifers in Florida and Texas. Geochim. Cosmochim. Acta 1981, 45, 1941–1950. [Google Scholar] [CrossRef]
  51. Hem, J.D. Chemistry and occurrence of cadmium and zinc in surface water and groundwater. Water Resour. Res. 1972, 8, 661–679. [Google Scholar] [CrossRef]
Figure 1. Hydrogeological setting and sampling sites in the Hebei Plain. (A) sampling sites, (B) cross section.
Water 15 03071 g001
Figure 2. Hydrogeochemical facies of groundwater in phreatic and confined aquifers in the Hebei Plain.
Water 15 03071 g002
Figure 3. Gibbs diagram of groundwater samples in the Hebei Plain.
Water 15 03071 g003
Figure 4. Groundwater quality in various aquifers and different land use types in the Hebei Plain.
Water 15 03071 g004
Table 1. Groundwater quality standards of China for drinking and irrigation.
ItemsClass IClass IIClass IIIClass IVClass V
pH6.5–8.56.5–8.56.5–8.55.5–6.5 and 8.5–9.0<5.5 and >9.0
TH (mg/L)≤150≤300≤450≤650>650
TDS (mg/L)≤300≤500≤1000≤2000>2000
COD (mg/L)≤1≤2≤3≤10>10
Cl (mg/L)≤50≤150≤250≤350>350
NO3 (as N, mg/L)≤2≤5≤20≤30>30
SO42− (mg/L)≤50≤150≤250≤350>350
F (mg/L)≤1≤1≤1≤2>2
NO2 (as N, mg/L)≤0.01≤0.1≤1≤4.8>4.8
I (µg/L)≤40≤40≤80≤500>500
S2− (mg/L)≤0.005≤0.01≤0.02≤0.1>0.1
NH4+ (as N, mg/L)≤0.02≤0.1≤0.5≤1.5>1.5
Na+ (mg/L)≤100≤150≤200≤400>400
B (mg/L)≤0.02≤0.1≤0.5≤2>2
Al (mg/L)≤0.01≤0.05≤0.2≤0.5>0.5
Fe (mg/L)≤0.1≤0.2≤0.3≤2>2
Mn (mg/L)≤0.05≤0.05≤0.1≤1.5>1.5
Ba (mg/L)≤0.01≤0.1≤0.7≤4>4
Zn (mg/L)≤0.05≤0.5≤1≤5>5
Pb (µg/L)≤5≤5≤10≤100>100
As (µg/L)≤1≤1≤10≤50>50
Se (µg/L)≤10≤10≤10≤100>100
Ni (µg/L)≤2≤2≤20≤100>100
Cd (µg/L)≤0.1≤1≤5≤10>10
Cr(VI) (µg/L)≤5≤10≤50≤100>100
Hg (µg/L)≤0.1≤0.1≤1≤2>2
SuitabilityDrinking, IrrigationDrinking, IrrigationDrinking, IrrigationIrrigationNot suitable
Note: data from reference [28].
Table 2. Descriptive statistics of groundwater chemical parameters in phreatic and confined aquifers.
ItemsPhreatic AquifersConfined Aquifers
Min.Med.Max.Min.Med.Max.
pH6.757.498.227.178.218.82
COD0.310.8114.110.30.631.39
TH69.2469.5641541.5136.93808
TDS25668623,5501854639570
CO32−<DL<DL5.9<DL5.929.7
HCO3108.7388.8100973.1228.9845.7
Cl982.313,8302.561.62066
NO3-N<DL3.223.9<DL0.416.9
SO42−7147.127366.170.33964
K+0.41.9510.41.43.2
Na+5.962.5646524111.41940
Ca2+18.398.3570.87.524.4281.8
Mg2+6.341.712195.413.6759
I<DL<DL0.906<DL<DL0.665
NO2-N<DL<DL0.223<DL<DL0.081
NH4+-N<DL<DL1.02<DL<DL0.37
S2−<DL<DL0.19<DL0.0050.217
F0.160.472.570.150.62.11
B<DL0.061.310.020.060.95
Mn<DL0.033.89<DL0.020.77
Al<DL0.070.540.010.030.15
Fe<DL0.0678.31<DL0.072.94
Ba0.010.070.410.010.040.19
Zn<DL<DL36.11<DL0.012.26
Ni<DL0.0010.007<DL<DL0.006
Cd<DL<DL<DL<DL<DL<DL
Pb<DL<DL0.001<DL<DL0.003
Se<DL<DL0.016<DL<DL0.002
Hg<DL<DL<DL<DL<DL<DL
As<DL<DL0.009<DL<DL0.008
Cr(VI)<DL<DL0.006<DL<DL0.008
Notes: pH without the unit while other parameters with the unit of mg/L; <DL—below detection limits.
Table 3. Descriptive statistics of groundwater chemical parameters in phreatic aquifers in Piedmont, central, and littoral plains.
ItemsPiedmont PlainCentral PlainLittoral Plain
Min.Med.MeanMax.Min.Med.MeanMax.Min.Med.MeanMax.
pH7.037.537.528.226.757.347.387.887.227.457.537.99
COD0.310.580.701.520.691.481.612.821.572.205.0214.11
TH693913866623569801211261929792021386415
TDS256555575111813942356310971105114646833823,550
HCO31093113396102967547101009293485442507
Cl958611601354645451551512143454213,830
NO3-N<DL7.18.019.7<DL0.42.923.9<DL0.81.23.2
SO42−766942493024779952736216346291229
K+0.41.61.73.00.71.81.83.16.219.524.151.0
Na+63248200323530648156576135823146465
Ca2+1891982074110313532632114208571
Mg2+634368057143215523251663941219
I<DL<DL0.020.340.040.190.230.45<DL0.110.280.91
NO2-N<DL<DL0.010.22<DL<DL0.020.11<DL0.010.040.15
NH4+-N<DL<DL0.010.14<DL0.060.191.02<DL0.170.180.37
S2−<DL<DL<DL0.010<DL<DL0.0420.190<DL0.0080.0140.040
F0.160.350.451.920.390.871.132.570.470.830.861.30
B<DL0.040.050.250.160.480.591.310.060.760.600.82
Mn<DL<DL0.071.110.120.270.491.430.340.421.273.89
Al<DL0.070.070.160.030.090.150.540.030.090.090.15
Fe<DL0.030.100.610.040.7610.1178.31<DL0.640.651.33
Ba0.010.090.120.410.010.020.030.070.020.080.110.25
Zn<DL<DL0.010.09<DL0.014.0236.11<DL<DL0.010.03
Ni<DL<DL0.0010.004<DL0.0030.0030.004<DL0.0020.0030.007
Cd<DL<DL<DL<DL<DL<DL<DL<DL<DL<DL<DL<DL
Pb<DL<DL<DL<DL<DL<DL<DL0.001<DL<DL<DL<DL
Se<DL<DL0.0010.005<DL<DL0.0020.016<DL<DL<DL<DL
Hg<DL<DL<DL<DL<DL<DL<DL<DL<DL<DL<DL<DL
As<DL<DL<DL0.005<DL<DL0.0020.0090.0020.0030.0030.004
Cr(VI)<DL<DL0.0010.006<DL<DL<DL<DL<DL<DL<DL<DL
Notes: pH without the unit while other parameters with the unit of mg/L; <DL—below detection limits.
Table 4. Statistics for proportions of groundwaters with chemical concentrations exceeded allowable limits.
ItemsAllowable LimitsPhreatic AquifersConfined AquifersPiedmont PlainCentral and Littoral Plains
TH<450 mg/L54.3%5.3%40.9%76.9%
Mn<0.1 mg/L45.7%15.8%13.6%100%
TDS<1000 mg/L40.0%15.8%9.1%92.3%
Na+<200 mg/L37.1%21.1%4.5%92.3%
Fe<0.3 mg/L34.3%15.8%13.6%69.2%
Cl<250 mg/L31.4%15.8%084.6%
I<0.08 mg/L31.4%15.8%4.5%76.9%
SO42−<250 mg/L31.4%5.3%084.6%
B<0.5 mg/L20.0%5.3%053.8%
F<1 mg/L17.1%26.3%4.5%38.5%
S2−<0.02 mg/L14.3%31.6%038.5%
Al<0.2 mg/L5.7%0015.4%
Zn<1 mg/L2.9%5.3%07.7%
COD<3 mg/L2.9%007.7%
NO3-N<20 mg/L2.9%007.7%
NH4+-N<0.5 mg/L2.9%007.7%
Se<0.01 mg/L2.9%007.7%
pH6.5–8.505.3%00
NO2-N<1 mg/L0000
Ba<0.7 mg/L0000
Ni<0.02 mg/L0000
Cd<0.005 mg/L0000
Pb<0.01 mg/L0000
Hg<0.001 mg/L0000
As<0.01 mg/L0000
Cr(VI)<0.05 mg/L0000
Notes: PEAL = proportion of groundwater samples with the concentration of one component exceeded the allowable limit; data of allowable limits are from reference [28].
Table 5. Principal component (PC) loadings for groundwater chemical parameters in phreatic and confined aquifers in the Hebei Plain.
ItemsPhreatic AquifersItemsConfined Aquifers
PC1PC2PC3PC4PC5PC1PC2PC3
Cl0.9760.063−0.045−0.064−0.079TDS0.9910.0150.083
COD0.9760.0650.0000.0250.024Cl0.9910.0580.033
Na+0.9690.215−0.018−0.004−0.016Na+0.9860.0720.008
TDS0.9640.2420.0010.0650.009Mg2+0.985−0.0180.139
Mn0.9320.183−0.1110.0890.069TH0.982−0.0540.158
TH0.9310.2620.0120.2170.053SO42−0.981−0.0100.131
Mg2+0.9240.312−0.0060.1610.047Mn0.969−0.0560.100
K+0.889−0.124−0.058−0.1980.052B0.9500.223−0.131
Ca2+0.8570.0480.0900.4160.071HCO30.945−0.105−0.055
I0.1610.826−0.221−0.0200.029Fe0.9430.2250.142
HCO30.1000.8060.1230.2240.073I0.9150.249−0.086
B0.4790.7590.184−0.0630.215Ca2+0.914−0.2100.239
SO42−0.4240.6800.1800.2970.199COD0.6860.298−0.328
F0.0410.574−0.082−0.5570.144Zn0.0240.925−0.033
Se−0.0340.0660.9550.031−0.008S2−0.6110.771−0.091
Zn0.0220.1840.935−0.0750.109pH−0.5010.648−0.253
NO3−0.098−0.3230.7060.173−0.276K+0.2200.0740.832
pH−0.191−0.281−0.052−0.800−0.066F0.0890.289−0.805
Fe0.0780.106−0.1010.6170.499Eigenvalue12.32.31.7
NH4+0.0320.025−0.0560.0720.853Explained variance (%)68.212.79.5
S2−−0.0090.3490.2560.2210.487Cumulative % of variance68.280.990.4
Al0.0000.260−0.155−0.3540.435
Eigenvalue8.43.52.62.01.6
Explained variance (%)38.115.711.69.17.4
Cumulative % of variance38.153.865.474.581.9
Note: Bold numbers = maximum absolute PC loading of one parameter.
Disclaimer/Publisher’s Note: The statements, opinions and data contained in all publications are solely those of the individual author(s) and contributor(s) and not of MDPI and/or the editor(s). MDPI and/or the editor(s) disclaim responsibility for any injury to people or property resulting from any ideas, methods, instructions or products referred to in the content.

