Article

Experimental and DEM-CFD Coupling Investigations on the Characteristics and Mechanism of Seepage Erosion for Cohesionless Soil

1
School of Water Conservancy and Hydroelectric Power, Hebei University of Engineering, Handan 056038, China
2
Hebei Key Laboratory of Intelligent Water Conservancy, Handan 056038, China
3
China Institute of Water Resources and Hydropower Research, Beijing 100038, China
4
State Key Laboratory of Hydroscience and Engineering, Tsinghua University, Beijing 100084, China
*
Author to whom correspondence should be addressed.
Water 2023, 15(17), 3085; https://doi.org/10.3390/w15173085
Submission received: 1 August 2023 / Revised: 19 August 2023 / Accepted: 24 August 2023 / Published: 28 August 2023

Abstract

:
Seepage erosion is one of the main reasons for the local collapse or instability of embankments. To investigate the characteristics and mechanism of seepage erosion for cohesionless soils, model tests using an independently developed seepage erosion device and numerical simulations based on a discrete element method-computational fluid dynamics (DEM-CFD) coupling model were carried out. The results show that the seepage erosion process of cohesionless soil could be characterized by four stages: stable seepage, upward migration of fine particles, boiling of sand samples, and erosion damage. The skeleton structure of a soil sample under seepage flow was continually changed due to the loss of fine soil particles, which resulted in a significant decrease in the sample strength and could, ultimately, lead to the failure of the sample. The results of this study can provide references and bases for the design, construction, and long-term service of embankments or earth dams under complex seepage conditions, reducing the risk of seepage erosion.

1. Introduction

The internal erosion of soil under seepage flow causes the transport and loss of fine particles, which can result in significant changes in the soil structure and its mechanical properties [1,2,3]. It is often categorized into four types in engineering: concentrated leak erosion, backward erosion, contact erosion, and suffusion [4,5,6,7]. Internal erosion is one of the most common reasons for the instability or failure of water-retaining structures, i.e., earth dams and embankments [8]. Therefore, it is of great practical significance to investigate the characteristics and mechanism of seepage erosion for cohesionless soil, which can provide references and bases for the design, construction, and long-term service of embankments or earth dams under complex seepage conditions, reducing the risk of seepage erosion.
The occurrence and development of seepage erosion is a complex, dynamic process between water and soil mixtures. Its occurrence is closely related to particle gradation, particle shape, fine content, mechanical conditions, and hydraulic conditions [9,10,11,12]. To study the law of seepage erosion, many scholars have carried out research and have achieved many profitable results. These studies can be mainly divided into two categories: experimental tests and numerical simulations. Guidoux et al. [13] studied the contact erosion between coarse soil and base soil, especially cohesive base soil. They proposed an empirical expression for the critical velocity of silt/clay (or sand/clay) mixtures and sand using the effective particle diameter of base soil to calculate the critical velocity. According to laboratory tests, Liang et al. [14] evaluated the effects of different particle size distributions (PSDs) and dry densities of soils on the critical hydraulic gradient of seepage erosion and pointed out that the PSD had a significant effect on the internal erosion behavior of soils. Pan et al. [15] investigated the effect of head rise rates on erosion using an indoor device and found that different head rise rates led to different internal erosion damage patterns. Wen et al. [16] used a self-developed large loess-scouring instrument to analyze and summarize the erosion process and stage characteristics of subsurface erosion under different conditions and revealed the intrinsic mechanisms of the plane erosion process of loess in the stages of different erosion characteristics. The behaviors of soils are highly stochastic under seepage. Limited by experimental methods, it is difficult to capture the process of erosion development and the change in internal contacts between particles when erosion occurs. Therefore, other methods are needed to further explore the internal erosion law of soil.
In recent decades with the rapid development of computer technology, fluid simulation technology based on the DEM has become an important method for many researchers to study seepage or multiphase flow problems [17,18,19], which provides a powerful reference for the study of the microscopic mechanisms of fluid flow and other coupling problems [20,21,22]. At present, the fluid–structure coupling methods based on discrete element theory are mainly divided into the traditional computational fluid dynamics (CFD) method based on the Euler grid [23], the smooth particle fluid dynamics (SPH) method based on Lagrange particles [24], and the mesoscopic lattice Boltzmann method (LBM) [25]. The seepage problem in this study belongs to low-speed flow and laminar flow and does not need to consider turbulent flow. In this study, CFD is used as a fluid solver for numerical simulations. Hu et al. [26] used a coupled discrete element method and computational fluid dynamics (DEM-CFD) to simulate the seepage of intermittently graded and well-graded soils. They found that the fine particle content and hydraulic gradient had significant effects on the seepage dynamics, and the reduction in fine particles was accompanied by a reduction in contact with weaker force and particles with lower contact numbers. Wang et al. [27] used a coupled DEM-CFD method to simulate the seepage of multilayered soils with different fine particle contents. They observed that the quality of eroded soil was mainly determined by the fine particle content of underlayer soil. The higher the fine particle content of the underlayer soil, the higher the cumulative quality of eroded soil. Zhang et al. [28] studied the internal erosion of gap-graded soil under a cyclic hydraulic gradient in microscopic view based on a DEM-CFD method. Their study found that the erosion mass increased significantly under cyclic hydraulic loading, and the erosion ratio gradually increased with the amplitude of the cyclic hydraulic gradient. The mechanism of the cyclic hydraulic gradient on seepage erosion was revealed from a microperspective. It showed that the cyclic hydraulic gradient mainly interfered with the erosion process or caused local clogging. Wang et al. [21] accurately tracked particle migration trace based on numerical simulations and visualized the pore structure and force chain evolution from a microscopic perspective. Compared with laboratory tests, numerical simulation is more convenient and can better reveal the evolution of the seepage erosion process of soil at the mesoscale. However, most previous studies have not considered the complex boundary conditions and the change in contact forces inside the soil during the seepage process. In actual engineering, minor changes in the underlying soil below the embankment may result in significant changes in the mechanical properties of the soil during the development of erosion occurrence [5], such as higher flow velocities in localized areas, greater extent of erosion, and deeper depth of damage. Scholtes et al. [29] pointed out that, under constant confining pressure, the dilatancy and peak stress of soil decrease after seepage failure. Zhou et al. [30] also pointed out that the initial stress anisotropy of the soil inevitably affects the erosion evolution process, and further research on internal erosion under complex stress states is needed. Hu et al. [31], in their study of fine particle loss from soils, showed a reduced peak stress ratio in eroded specimens compared to uneroded specimens, but the critical state values remained almost unchanged. In summary, it is necessary to combine experimental methods and numerical simulations to further study the characteristics and mechanism of seepage erosion for cohesionless soil, which can provide a theoretical foundation and basis for the prevention and control of seepage erosion of embankments or earth dams.
Accordingly, this study first developed a self-made seepage erosion device. Based on this device, the seepage erosion process and critical hydraulic gradient of two graded soils were investigated by applying water head on samples, step by step. Meanwhile, the PSD and mechanical properties of soil samples before and after the test were measured. Furthermore, a seepage erosion model for cohesionless soil was established using a DEM-CFD coupling method. Based on this model, the migration law of fine-grain particles of soil during the seepage erosion process and the contact force chain of particle assembly were further analyzed from macroscopic and mesoscopic views.

2. Model Test on Seepage Erosion of Cohesionless Soils
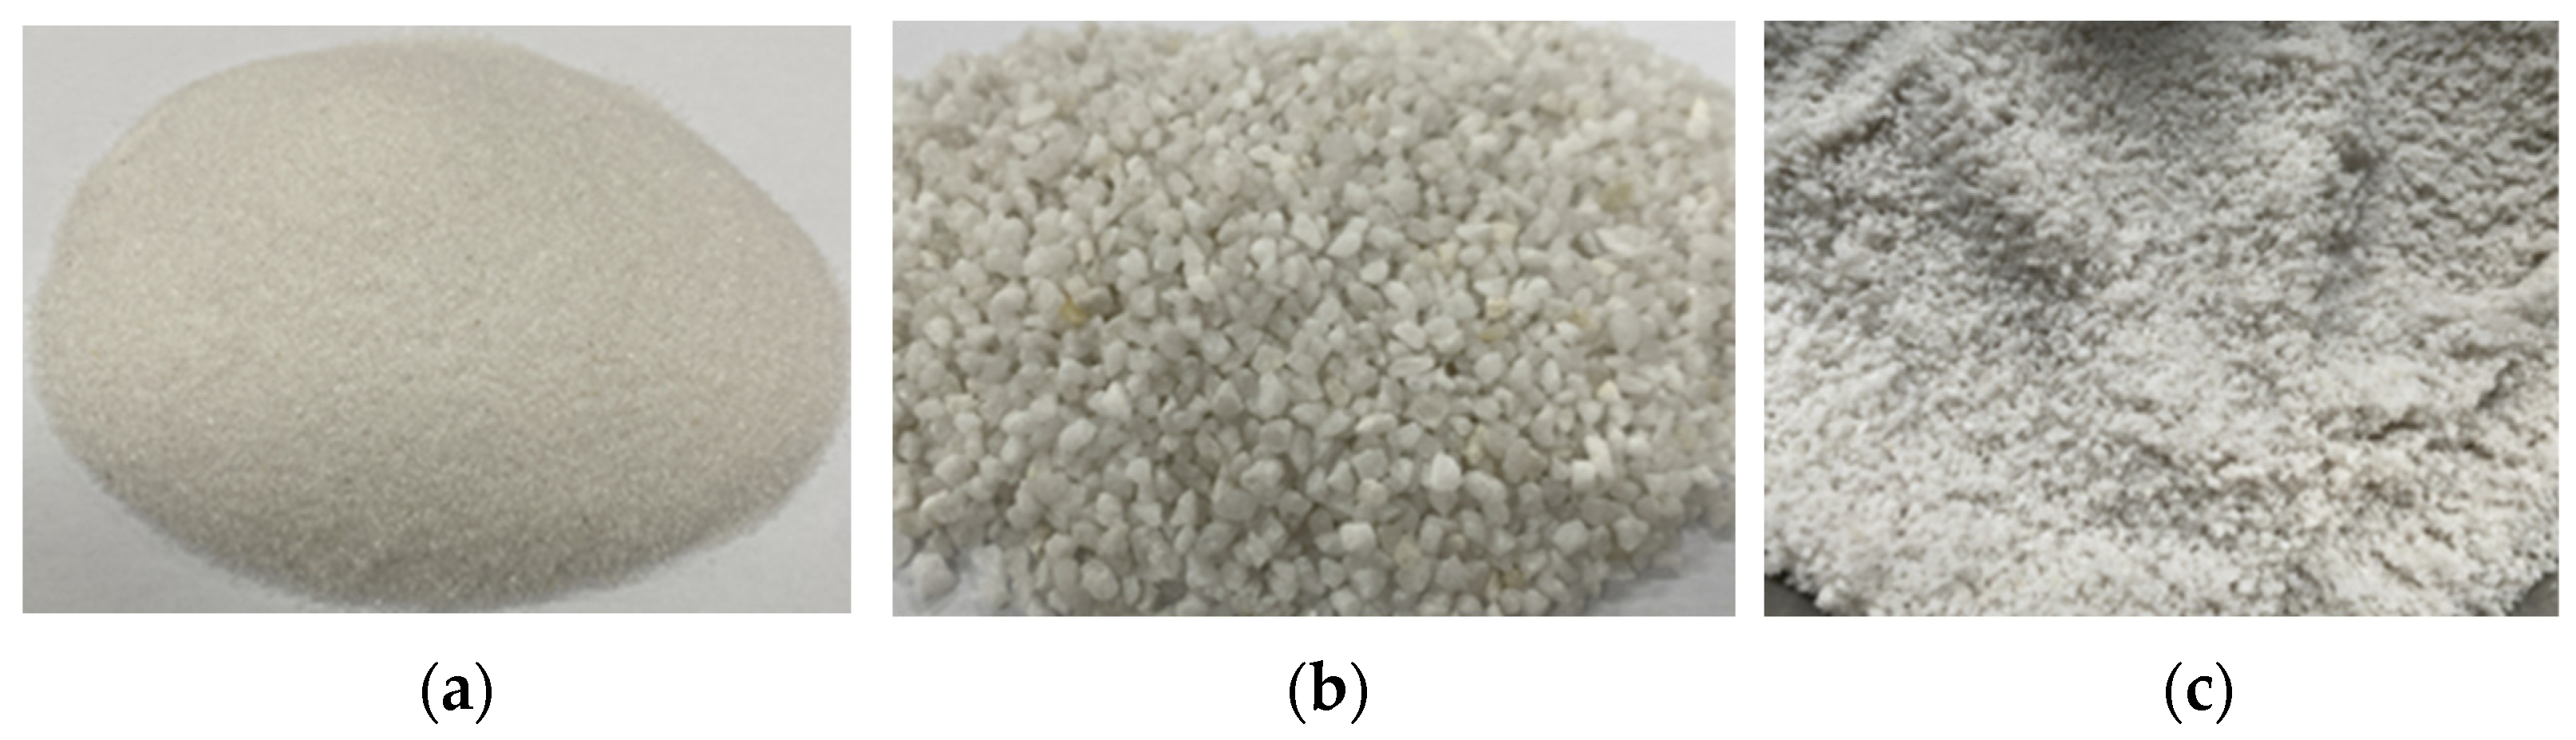
2.1. Material

The material used in the test was quartz sand, which was rinsed, dried, and prepared for use. The sand with particle sizes between 0.075 and 0.5 mm was named particle group C1. Particle group C2 was obtained by mixing the coarse sand (particle sizes between 2 and 4 mm) with C1 at a ratio of 6:4. C1 was continuous-graded soil, and C2 was gap-graded soil, as shown in Figure 1. The gradation curves of C1 and C2 are shown in Figure 2. The grain composition ratios and particle size parameters of C1 and C2 are shown in Table 1 ( d x represents the particle size corresponding to the particle size distribution curve when the particle content of the particle size is less than x%; for example, d 10 represents the particle size of the sample content less than the particle size on the distribution curve accounting for 10% of the total mass).

2.2. The Seepage Erosion Device

The self-made seepage erosion device and the experimental scheme are described in this section. Figure 3 is a schematic diagram of the self-made seepage device. The whole device was mainly composed of 4 parts: a rigid-wall pressure chamber, an adjustable head water pressure supply box, a pressure-measuring tube, and a sand collection box. The rigid-wall pressure chamber (Φ20 cm × 60 cm) was made of transparent Plexiglas and consisted of 3 parts: a steady flow chamber, a sample chamber, and an inverted siphon overflow outlet (as shown in Figure 4). The steady flow chamber was used to smooth the water flow and avoid water impact and was composed of an inlet, a 5 cm high suction pipe layer, and a 5 cm high pebble layer. The sample chamber was 20 cm in diameter and 20 cm in height. Three pressure-measuring heads were installed at 5 cm intervals on the side of the cylinder to measure the head, and a geotextile was laid between it and the steady flow chamber as a filter layer to prevent soil loss. The inverted siphon overflow outlet was made of two cones connected with a thin tube to prevent the precipitated particles from falling back into the sample chamber. This device could be used to study the seepage erosion process of cohesionless soil under increasing water head and to monitor the water head change, escaping particles, water flow rate, etc.
In order to improve the experimental accuracy, three separate seepage erosion tests were conducted for each sample. The water head was applied step-by step, with each step increasing by 5 cm in height and maintaining for 20 min. After each step, the water head of the pressure tube was recorded every 5 min. When the difference in the water head approached equality, the next level of water head was applied. The seepage erosion process of the sample was observed and recorded by capturing photos at each step during the test. When the sand overflowed into the inverted cone in a large amount, the test ended. Both C1 and C2 samples, which represented the continuous-graded soil and gap-graded soil, respectively, were applied to water pressure in the bottom, step by step, to find the critical hydraulic gradient corresponding to the occurrence of seepage erosion.

3. DEM-CFD Coupling Analysis of Seepage Erosion of Cohesionless Soils

Due to the limitations of the experimental device, it was difficult to capture the migration of soil particles and the evolution of soil structure during the seepage erosion process. DEM-CFD coupling simulations can be a powerful supplement to experimental tests to further explore the mesoscopic process of cohesionless soil under seepage erosion.

3.1. DEM-CFD Coupling Method

The DEM-CFD coupling method is based on the Euler–Lagrange model [32]. In this study, the coarse grid method proposed by Tsuji et al. [33,34] was used to solve the fluid phase. We assumed that the pore fluid was continuous and the flow field was a constant laminar flow. The fluid field was divided into a coarse grid first, and then the fluid phase was solved according to the continuity equation and the Navier–Stokes equation (N-S equation) of the local average theory proposed by Anderson et al. [35]. The DEM was used to solve the solid particle system, and the drag force model was used to solve the interaction force between particles and fluid [36]. At present, the solution of particle–fluid interaction mainly includes particle–particle interaction, fluid interaction, and particle–fluid interaction.
The particle motion in the DEM calculation was controlled by Newton’s second law, and the moving process mainly included translation and rotation. Its control equation was as follows:
m i d U i p d t = j = 1 n i c F i j c + F i f , p + F i g
I i d ω i d t = j = 1 n i c M i j
where U i p is the translational linear velocity of the particle i ; F i j c is the contact force acting on the particle i ; F i f , p is the fluid–particle interaction force acting on the particle i ; F i g is the gravitational force on the particle i ; I i is the rotational inertia of the particle; ω i is the rotational angular velocity of the particle i ; and M i j is the rotational moment of particle i by particle j .
For fluid motion, it was derived by local averaging of the incompressible Navier–Stokes (N-S) equation, which in turn led to the following:
ε ρ f v t + ε ρ f v v = p + ε μ v + ε ρ f g + f p
where is the divergence operator; ε is the fluid unit porosity; ρ f is the fluid density; t is the numerical calculation of time; v is the velocity vector of fluid motion; p represents the fluid pressure in the fluid unit; μ represents the fluid dynamic viscosity; f p is the total volume force per unit volume applied to the fluid unit by the particles in the fluid unit; and g represents the gravitational acceleration.
In this study, the effects of drag force F d and buoyancy F b were considered. Drag force is the main force affecting the interaction between particles and fluids. At present, many researchers [37,38,39] have studied and given expressions for fitting the drag force model of porous media. In this paper, we used the research of Di Felice [37] obtained from the drag force f d 0 on a single particle during smooth settling within a fluid multiplied by a function related to the porosity ε of the stacked body, which can be expressed in the following form:
F d = f d 0 ε χ
where ε χ denotes the empirical correction term considering local porosity, which makes the force applicable to both high-porosity and low-porosity systems and applies to a large Reynolds number range [40]; χ is the empirical coefficient related to local porosity (see Equation (5)); and f d 0 denotes the fluid drag force applied to a single particle. The fluid drag force on a single particle can be calculated using Equation (6):
χ = 3.7 0.65 exp 1.5 lg R e p 2 2
f d 0 = 1 8 C d ρ f π d i 2 v u v u
where R e p is the Reynolds number; C d denotes the drag coefficient (formula reference); d i represents the particle diameter; and u is the particle velocity vector.
The second part of the force was the buoyancy force caused by the fluid pressure, which was calculated with the following formula:
F b = V i ρ f g
where V i represents the particle volume.
In summary, the fluid–particle interaction force could be expressed with the following equation:
F f , p = F d + F b = F d V i ρ f g

3.2. DEM-CFD Model of Seepage Erosion for Cohesionless Soils

Based on the laboratory test, a numerical model was established, as shown in Figure 5. To improve the computational efficiency of the model, a scaling model was established, i.e., the sizes of numerical samples were reduced by 10 times compared to the real samples. The numerical model was a cylinder with a diameter of 1.8 cm and a height of 2.0 cm. First, we built an impermeable cylinder as a sample container and generated two square walls at the top and bottom. The cohesionless soil particles were represented by spheres of different sizes. A linear contact model was used to describe the behaviors between particles and particles, as well as between particles and walls. The influence of sand particle shape was reflected by the higher friction coefficient. The soil particles were generated in the cylinder with specified initial porosity and PSD. The soil particle size in the model was scaled up to three times compared with the actual soil to further reduce the computational load. Since the particles of the initial model had a large amount of overlap, through the control function, the particles were given gravity. The model was balanced by the operation of gravity, and the calculated imbalance force was less than 1 × 10⁻⁵, as a criterion for balance to ensure that the soil layer reached a stable state. Finally, the model was determined to have a total of 17,134 particles.
To monitor the state change and structure evolution of the particle assembly during the seepage process, two measuring balls with a 5 mm radius were created in the middle of the sample. The positions of the measuring balls were on the central axis of the cylindrical model. As shown in Figure 6, the red ball was the No. 1 measuring ball, and the green was the No. 2 measuring ball.
Finally, the fluid field was meshed, and the fluid boundaries were determined. The fluid domain included the whole DEM model. According to the laboratory tests, the seepage direction was upward, and the gravity direction was downward. The lower boundary of the fluid mesh was set as the inlet with a specific pressure, and the upper boundary was set as the outlet with zero pressure. The surrounding boundary conditions were set to impervious wall boundary, as shown in Figure 7. The model parameters are shown in Table 2.

4. Results and Discussion

4.1. Experimental Phenomenon and Critical Hydraulic Gradient Analysis

Figure 8 shows the development of seepage occurring in sample C1. At the beginning of the experiment, the sample was stable and no significant movement of sand was observed, as shown in Figure 8a. As the water head increased, the sand sample gradually became fluffy, accompanied by tiny bubbles emerging. The water head continued to increase, some small bulges appeared at the top of the sample, and increasing fine particles began to jump, as shown in Figure 8b. Continuing to increase the water pressure, the sand particles at the bulge continued to gush out, forming circles on the sample surface and expanding. The sand expanded and accumulated on the surface, and the water flow became turbid, as shown in Figure 8c. Further increasing the water pressure, the sand sample was pulled apart between the horizontal cracks (Figure 8e). The water flowed along the side walls in a circular expansion and rose, and the sample was destroyed. The top sand sample overturned obviously, and a large amount of sand gushed into the cone (Figure 8d). Due to the continuous seepage, the finer particles were brought to the upper cone sand-flushing port. Then, the finer particles flowed into the sand collection box with the water flow (Figure 8f). When the sample was eroded by seepage, the whole sand sample expanded, and many pores appeared on the surface of the sand sample after erosion (Figure 8g). It can be observed that a small number of fine particles remained on the surface of the cone. This indicates that the actual mass of eroded fine particles of the sample under the action of seepage was larger than the collected mass.
The C2 sample experimental phenomenon was consistent with the C1 sample process. However, the water head required for the sand gushing of the C2 sample was higher. Under the action of seepage flow, the C2 sample produced tiny bubbles and gradually formed seepage channels in the early stage. Subsequently, the phenomenon of gravel boiling appeared at the top surface. With the water head increasing, sand boiling intensified and occurred in multiple areas, causing many bulges on the surface of the sample, as shown in Figure 9b–d. As the water head continued to increase, the entire sample underwent expansion. Many sand particles at the top of the sample gushed out along the cone, and the water flow became turbid, as shown in Figure 9e. Further increasing the water head, the fine sand at the side wall of the sample was brought out in large quantities under the seepage flow, and the pores between the coarse particles increased to form an obvious depression, as shown in Figure 9f. Under the continuous action of the water head, a clear seepage channel appeared in the middle of the sample, and the fine particles began to scour along the sidewall, as shown in Figure 9g.
The development processes of seepage erosion of the C1 and C2 graded samples are approximately the same, which is consistent with the study of Fleshman and Rice [41]. The seepage erosion of the sandy soil could be divided into four stages: stable seepage, upward migration of fine particles, boiling of sand samples, and erosion damage.
Figure 10 shows the change in the water head hydraulic gradient of the C1 and C2 samples. The first test sand of the C1 sample started to bulge when the water head was 80 cm. After the fine particles moved upward, the water head was gradually increased with a head difference of 2 cm at a time. In both the second and the third experiments, the water head was 82 cm when the fine particles began to move upward. The critical hydraulic gradient could be calculated using the pressure tube data. The critical hydraulic gradients for the three experiments were 0.91, 0.98, and 0.99. By averaging the three experiments, the critical hydraulic gradient for seepage erosion of the C1 sample was 0.96. As the water head rose, the sand was violently overturned and, finally, destroyed.
The critical water heads of the C2 sample for the three tests were 110 cm, 105 cm, and 105 cm. According to the pressure tube data, the critical hydraulic gradients could be calculated as 2.36, 2.11, and 2.09, respectively. The first test results may be large due to an operation problem during the test, so we averaged the data of the remaining two sets of tests and obtain the critical hydraulic gradient of the C2 test soil as 2.1. It can be seen that the required hydraulic gradient was elevated by using a mixture of coarse-grained quartz sand and fine-grained quartz sand. This is because the fine sand was better bonded to the coarse sand, and the soil became more capable of withstanding seepage.

4.2. Mesoscopic Analysis of Seepage Erosion Process and Particle Migration Law

Figure 11 and Figure 12 respectively show a model particle displacement scalar diagram and a model particle displacement section diagram in different periods. When the model ran for 100,000 steps, as shown in Figure 11, the particles in the surface layer under the action of the water flow first initiated a large displacement and, mainly, fine particles were washed out. According to Figure 12, it can be seen that the central particles were denser, and the migration distance that occurred was not long. Due to the small friction coefficient between the rigid wall and the particles, the particles in contact with the wall surface also occurred in different degrees of displacement. The loss of fine particles showed the overall instability failure. Due to the loss of fine particles, the gap in the middle of the soil became larger. Finally, whole soil particles appeared to move upward.
According to the numerical results, the seepage erosion of cohesionless soil was divided into four stages in this study:
(1)
Stable seepage stage
In the initial stage of seepage, gravity and fluid force were applied to the particles. The particles were subjected to upward water pressure and buoyancy and downward gravity and drag force. From Figure 13, it can be seen that the overall velocity of the particles in the initial situation was downward, and the velocity of a small number of particles on the surface was upward. This is because the water pressure was low, and the particles settled downward under gravity. This process lasted a short time. Due to the increased water pressure, the force on the particles was in balance with the seepage force, and the particles were stable under the action of water pressure.
(2)
Fine particle upward migration stage
As the water pressure continued to increase and reached a certain critical value, the fine particles inside the sample were clearly displaced. It can be seen from Figure 11 that the fine particles on the surface of the sample first generated displacement at 100,000 steps. The upper particles of the sample flowed upward under the action of seepage, and the sample began to become fluffy. As can be seen from Figure 12, the displacement of particles in the bottom area of the sample was less. As the water pressure increased, the particles began to show varying degrees of displacement, and some loss of fine particles occurred. The loss of fine particles at this stage can be taken as an important sign that seepage damage began to occur in the sample. The seepage channel began to form inside the sample, with a hydraulic gradient of about 2.0 at this stage.
(3)
Skeleton particle-loosening stage
Increasing the water pressure, the fine particles inside the sample were taken out in large quantities. The porosity inside the soil increased, and the permeability coefficient of the upper part of the sample increased accordingly. Therefore, the ability of the upper unit to bear the water head also decreased, and the particle velocity increased sharply, as shown in the 300 thousand-step diagram in Figure 13. With the loss of fine particles, some weak areas and voids appeared in the upper region of the sample, and the skeleton particles inside the soil moved upward; this stage occurred at a hydraulic gradient of about 6.0.
(4)
Complete failure stage
With the initiation of the skeleton particles, the overall stability of the soil decreased, and the internal erosion became severe. Continuing to increase the water pressure, the soil inside the sample began to destabilize, resulting in infiltration erosion damage. A large number of particles moved toward the outlet, as shown in Figure 11 in the 400 thousand-step and 500 thousand-step diagrams. At this time, the overall porosity of the model also increased, the model volume expanded, and the interparticle contact numbers continued to decrease. With the massive loss of particles in the upper region, the pressure on the particles in the lower area decreased, and the lower area began to move upward. The contact inside the model became sparse, and at this point, the model was destroyed. This was consistent with the laboratory experiment results where, when the water head rose to a certain extent, the sample was destroyed. This stage occurred at a hydraulic gradient of about 9.0.

4.3. Microstructural Characteristics of Soil Particles during the Seepage Erosion Process

In order to quantitatively describe the damage degree of seepage erosion, the erosion rate parameter was introduced to represent the amount of particle loss inside the soil. According to the model of this paper, the erosion rate was defined as the ratio of the mass of sand particles washed out of the model device (i.e., the mass of eroded particles) to the mass of all the sand particles in the barrel before the start of seepage, which was calculated as follows.
C s w = m w m 0
where m w is the mass of eroded particles, and m 0 is the mass of all sand particles.
After the laboratory test, the residual samples in the container and the precipitated sand particles in the sand collection box were recovered, dried, sieved, and weighed. Then, we compared it with the PSD before the test to analyze the change in particle gradation under different erosion rates. According to the change in distribution, the sieve analysis was carried out on the dried soil material after erosion, and the gradation curve was drawn. This section mainly analyzes the gradation before and after the erosion of the C1 sample, as shown in Figure 14.
According to the gradation curves of the samples before and after erosion at the three erosion rates shown in Figure 14, it can be seen that, after the seepage test, the particle gradation curve shifted downward compared with the initial particle gradation curve. The degree of deviation in the gradation curve after erosion was proportional to the amount of particle loss. The greater the erosion rate, the greater the deviation in the gradation curve, which indicates that more particles precipitated out, leading to a change in the internal particle composition structure of the soil. The internal structure of the soil was rearranged during the seepage process. The parameters characterizing the soil gradation at different erosion rates could be obtained by calculation, as shown in Table 3.
As shown in Table 3, the average particle size of the eroded particles tended to increase with the erosion rate, and the fineness modulus also tended to increase. For the same graded fine aggregate, the smaller the fineness modulus of the sand, the finer the particles. With the increase in the erosion rate, more fine particles were lost inside the sample. The fineness modulus of the precipitated particles also increased with increasing erosion rate, which indicates that the loss of coarse particles increased with seepage development. Initially, fine particles on the surface were lost first under upward percolation conditions, and fine particles inside the sample were transported and lost through the gaps in the coarse particles. When the hydraulic gradient reached the start-up hydraulic gradient, the fine particles began to transport and continuously fill the formed voids, thereby forming a blockage or channel between the skeleton particles. When the hydraulic gradient increased, the soil was insufficient to resist the seepage force, and the soil skeleton started to deform and rearrange. Soil deformed through the formation of strong chains between coarse particles, and fine particles provided lateral support for these force chains. When the fine particles continued to lose, water flow continuously weakened the lateral support forces, resulting in changes in the soil’s internal structure and, thus, causing overall instability and deformation.

4.4. Influence and Mechanism Analysis of Seepage Erosion on the Mechanical Properties of Soil

In order to explore the difference in mechanical properties before and after seepage, the C1 sample was mainly analyzed. Triaxial drainage tests were carried out on sand samples with an erosion rate of C s w = 0.014 before and after erosion. The deviatoric stress–strain curves before and after erosion are shown in Figure 15. Filled patterns indicate pre-erosion curves and hollow patterns indicate post-erosion curves. According to the diagram, with the increase in confining pressure, the deviatoric stress of soil increased, and the shear strength increased. Under different confining pressures, the deviatoric stress of the sample reached a peak when it was close to 5% and then decreased slowly. When the strain was 16%, it had not yet reached a stable critical state, showing a certain strain-softening behavior. The strength of soil after seepage erosion was lower than that before erosion, which was due to the loss of internal fine particles caused by seepage erosion, and the soil showed lower mechanical strength.
Figure 16 shows the changes in contact force and contact number between particles during numerical simulation. In Figure 16, the thin cylinder represents the weak contact force between fine particles, and the thicker cylinder represents the contact between skeleton particles, as well as between skeleton particles and the wall. As can be seen from Figure 16, the overall number of model contacts decreased with increasing time steps. In Figure 16, due to the large loss of fine particles in the upper area, the contact between particles was seriously reduced, which had an impact on the model structure. The contact reduction in the lower area was relatively small due to the upper pressure. The strength of the contact force of the sample showed different strengths in different periods. It can be seen from the contact bond color change that the upper part showed a weak force chain, and the lower region showed a certain strong force chain due to the filling and squeezing between the particles, which increased the pressure on the skeleton particles and the transfer of stress between the skeleton particles. With the fine particles decreasing, the strong force chain gradually decreased, and the weak force chain gradually increased. This was consistent with the above physical experimental results. As the pressure gradient increased, the particle spacing increased, the number of contacts decreased, the contact force decreased, and the mechanical properties of the soil decreased, resulting in the instability of the skeleton stress transfer structure. In general, under the action of seepage, the decrease in contact between particles caused by the loss of fine particles led to changes in soil mechanics and structure, which eventually led to the instability and failure of the whole sample [42].

5. Conclusions

In this study, we studied the characteristics and mechanism of seepage erosion for cohesionless soils through model tests and DEM-CFD coupling simulations. According to the experimental and numerical results, the migration law of fine particles and the critical hydraulic gradient of seepage erosion for cohesionless soils were analyzed. Moreover, the changes in framework structure and mechanical properties of cohesionless soils before and after erosion were discussed. Specifically, the following conclusions were drawn:
(1)
A self-made seepage erosion device for cohesionless soil was developed, which could be used to observe the seepage erosion process, measure the critical hydraulic gradient of seepage erosion, and investigate the escaping particles during the seepage erosion process.
(2)
The seepage erosion process of cohesionless soil could be divided into four stages: stable seepage, fine particle upward migration, sand sample boiling, and erosion damage.
(3)
Mixing with coarse-grain sand could increase the critical hydraulic gradient of the fine-grain quartz sand sample because the coarse-grain sand could improve the soil structure and force chain of the fine-grain sand sample.
(4)
Increasing erosion ratio meant more loss of fine sand particles and an increase in pore structure between soil skeleton particles. These changes could result in the rearrangement of soil particles, i.e., a decrease in contact number and the weakening of contact force, which led to strength decrease.

Author Contributions

Methodology, H.S.; Software, H.S. and D.D.; Validation, Z.M.; Formal analysis, T.Z.; Writing—original draft, D.D.; Writing—review and editing, H.S., D.D., J.Y. and Z.M.; Supervision, H.S. and Z.M. All authors have read and agreed to the published version of the manuscript.

Funding

This research was funded by [The Hebei Provincial Natural Science Foundation of China] grant number [E2020402087].

Data Availability Statement

The data is unavailable due to privacy or ethical restrictions.

Conflicts of Interest

The authors declare no conflict of interest.

References

  1. Xiao, Q.; Wang, J.-P. CFD–DEM Simulations of Seepage-Induced Erosion. Water 2020, 12, 678. [Google Scholar] [CrossRef]
  2. Li, W.; Qian, J.; Yin, Z. Simulation of seepage erosion in gap graded sand soil using CFD-DEM. Chin. Rock Soil Mech. 2021, 42, 1–11. [Google Scholar]
  3. Chen, C.; Zhang, L. Hydro-mechanical behaviour of soil experiencing seepage erosion under cyclic hydraulic gradient. Géotechnique 2021, 73, 115–127. [Google Scholar] [CrossRef]
  4. Richards, K.S.; Reddy, K.R. Critical appraisal of piping phenomena in earth dams. Bull. Eng. Geol. Environ. 2007, 66, 381–402. [Google Scholar] [CrossRef]
  5. Yang, J.; Yin, Z.-Y.; Laouafa, F.; Hicher, P.-Y. Analysis of suffusion in cohesionless soils with randomly distributed porosity and fines content. Comput. Geotech. 2019, 111, 157–171. [Google Scholar] [CrossRef]
  6. Wang, X.; Tang, Y.; Huang, B.; Hu, T.; Ling, D. Review on Numerical Simulation of the Internal Soil Erosion Mechanisms Using the Discrete Element Method. Water 2021, 13, 169. [Google Scholar] [CrossRef]
  7. Dassanayake, S.M.; Mousa, A.A.; Ilankoon, S.; Fowmes, G.J. Internal Instability in Soils: A Critical Review of the Fundamentals and Ramifications. Transp. Res. Rec. 2022, 2676, 1–26. [Google Scholar] [CrossRef]
  8. Fell, R.; Wan, C.F.; Cyganiewicz, J.; Foster, M. Time for Development of Internal Erosion and Piping in Embankment Dams. J. Geotech. Geoenviron. Eng. 2003, 129, 307–341. [Google Scholar] [CrossRef]
  9. Chen, F.; Xiong, H.; Wang, X.; Yin, Z.Y. Transmission effect of eroded particles in suffusion using the CFD-DEM coupling method. Acta Geotech. 2022, 18, 335–354. [Google Scholar] [CrossRef]
  10. Gong, J.; Liu, J. Mechanical transitional behavior of binary mixtures via DEM: Effect of differences in contact-type friction coefficients. Comput. Geotech. 2017, 85, 1–14. [Google Scholar] [CrossRef]
  11. Li, W.C.; Deng, G.; Liang, X.Q.; Sun, X.X.; Wang, S.W.; Lee, M.L. Effects of stress state and fine fraction on stress transmission in internally unstable granular mixtures investigated via discrete element method. Powder Technol. 2020, 367, 659–670. [Google Scholar] [CrossRef]
  12. Wang, Y.; Chai, J.; Xu, Z.; Qin, Y.; Wang, X. Numerical Simulation of the Fluid–Solid Coupling Mechanism of Internal Erosion in Granular Soil. Water 2020, 12, 137. [Google Scholar] [CrossRef]
  13. Guidoux, C.; Faure, Y.H.; Beguin, R.; Ho, C.C. Contact Erosion at the Interface between Granular Coarse Soil and Various Base Soils under Tangential Flow Condition. J. Geotech. Geoenviron. Eng. 2010, 136, 741–750. [Google Scholar]
  14. Liang, Y.; Yeh TC, J.; Zha, Y.; Wang, J.; Liu, M.; Hao, Y. Onset of suffusion in gap-graded soils under upward seepage. Soils Found. 2017, 57, 849–860. [Google Scholar] [CrossRef]
  15. Ming, P.; Lu, J.; Cai, X.; Liu, M.; Hu, S. Experimental study on internal erosion and seepage in the foundation of a dike under variable water head. Eur. J. Environ. Civ. Eng. 2021, 26, 5073–5087. [Google Scholar] [CrossRef]
  16. Wen, F.; Li, X.A.; Yang, W.; Li, J.; Zhou, B.; Gao, R.; Lei, J. Mechanism of loess planar erosion and numerical simulation based on CFD–DEM coupling model. Environ. Earth Sci. 2023, 82, 197. [Google Scholar] [CrossRef]
  17. Li, L.; Gu, Z.; Xu, W.; Tan, Y.; Fan, X.; Tan, D. Mixing mass transfer mechanism and dynamic control of gas-liquid-solid multiphase flow based on VOF-DEM coupling. Energy 2023, 272, 127015. [Google Scholar] [CrossRef]
  18. Zhang, F.; Wang, T.; Liu, F.; Peng, M.; Furtney, J.; Zhang, L. Modeling of fluid-particle interaction by coupling the discrete element method with a dynamic fluid mesh: Implications to suffusion in gap-graded soils. Comput. Geotech. 2020, 124, 103617. [Google Scholar] [CrossRef]
  19. Wang, T.; Zhang, F.; Furtney, J.; Damjanac, B. A review of methods, applications and limitations for incorporating fluid flow in the discrete element method. J. Rock Mech. Geotech. Eng. 2022, 14, 1005–1024. [Google Scholar] [CrossRef]
  20. Mu, L.; Zhang, P.; Shi, Z.; Huang, M. Coupled CFD–DEM Investigation of Erosion Accompanied by Clogging Mechanism under Different Hydraulic Gradients. Comput. Geotech. 2023, 153, 105058. [Google Scholar] [CrossRef]
  21. Wang, X.; Huang, B.; Tang, Y.; Hu, T.; Ling, D. Microscopic mechanism and analytical modeling of seepage-induced erosion in bimodal soils. Comput. Geotech. 2022, 141, 104527. [Google Scholar] [CrossRef]
  22. Li, L.; Lu, B.; Xu, W.X.; Gu, Z.H.; Yang, Y.S.; Tan, D.P. Mechanism of multiphase coupling transport evolution of free sink vortex. Acta Phys. Sin. 2023, 72, 182–195. [Google Scholar] [CrossRef]
  23. Wang, F.; Wang, F.; Gong, X.; Zhang, Y.; Li, G. Water Erosion and Extension of Ground Fissures in Weihe Basin Based on DEM-CFD Coupled Modeling. Water 2023, 15, 2321. [Google Scholar] [CrossRef]
  24. Li, B.-L.; Wang, C.-M.; Li, Y.-Y. Study on Dynamic Response of Blocking Structure and Debris Flow Impulsive Force considering Material Source Erosion. Lithosphere 2022, 2022, 1252637. [Google Scholar] [CrossRef]
  25. Zhou, W.; Ma, Q.; Ma, G.; Cao, X.; Cheng, Y. Microscopic investigation of internal erosion in binary mixtures via the coupled LBM-DEM method. Powder Technol. 2020, 376, 31–41. [Google Scholar] [CrossRef]
  26. Hu, Z.; Zhang, Y.; Yang, Z. Suffusion-induced deformation and microstructural change of granular soils: A coupled CFD–DEM study. Acta Geotech. 2019, 14, 795–814. [Google Scholar] [CrossRef]
  27. Wang, P.; Ge, Y.; Wang, T.; Liu, Q.W.; Song, S.X. CFD-DEM modelling of suffusion in multi-layer soils with different fines contents and impermeable zones. J. Zhejiang Univ.-Sci. A 2022, 24, 6–19. [Google Scholar] [CrossRef]
  28. Zhang, P.; Mu, L.; Huang, M. A coupled CFD-DEM investigation into hydro-mechanical behaviour of gap-graded soil experiencing seepage erosion considering cyclic hydraulic loading. J. Hydrol. 2023, 624, 129908. [Google Scholar] [CrossRef]
  29. Scholtès, L.; Hicher, P.Y.; Sibille, L. A Micromechanical Approach to Describe Internal Erosion Effects in Soils. In Geomechanics and Geotechnics: From Micro to Macro; IS-Shanghai: Shanghai, China, 2011; Available online: https://hal.science/hal-01007757 (accessed on 18 August 2023).
  30. Zhou, C.; Qian, J.G.; Yin, Z.Y. Microscopic investigation of the influence of complex stress states on internal erosion and its impacts on critical hydraulic gradients. Int. J. Numer. Anal. Methods Geomech. 2022, 46, 3377–3401. [Google Scholar] [CrossRef]
  31. Hu, Z.; Guo, N.; Yang, Z.X. Effect of fines loss on the microstructure and shear behaviors of gap-graded soils: A multiscale perspective. Comput. Geotech. 2023, 162, 105711. [Google Scholar] [CrossRef]
  32. Zhou, H.; Wang, G.; Jia, C.; Li, C. A Novel, Coupled CFD-DEM Model for the Flow Characteristics of Particles Inside a Pipe. Water 2019, 11, 2381. [Google Scholar] [CrossRef]
  33. Tsuji, Y.; Tanaka, T.; Ishida, T. Lagrangian numerical simulation of plug flow of cohesionless particles in a horizontal pipe-ScienceDirect. Powder Technol. 1992, 71, 239–250. [Google Scholar] [CrossRef]
  34. Tsuji, Y.; Kawaguchi, T.; Tanaka, T. Discrete particle simulation of two-dimensional fluidized bed. Powder Technol. 1993, 77, 79–87. [Google Scholar] [CrossRef]
  35. Anderson, T.B.; Jackson, R. Fluid Mechanical Description of Fluidized Beds. Stability of State of Uniform Fluidization. Ind. Eng. Chem. Fundam. 1968, 7, 12–21. [Google Scholar] [CrossRef]
  36. Zhao, J.; Shan, T. Coupled CFD–DEM simulation of fluid–particle interaction in geomechanics. Powder Technol. 2013, 239, 248–258. [Google Scholar] [CrossRef]
  37. Di Felice, R. The voidage function for fluid-particle interaction systems. Int. J. Multiph. Flow 1994, 20, 153–159. [Google Scholar] [CrossRef]
  38. Ergun, S. Fluid Flow through Packed Columns. Engineering 1952, 48, 89–94. [Google Scholar]
  39. Hill, R.J.; Koch, D.L.; Ladd, A.J. Moderate-Reynolds-number flows in ordered and random arrays of spheres. J. Fluid Mech. 2001, 448, 243–278. [Google Scholar] [CrossRef]
  40. Xu, B.; Yu, A. Numerical simulation of the gas-solid flow in a fluidized bed by combining discrete particle method with computational fluid dynamics. Chem. Eng. Sci. 1997, 52, 2785–2809. [Google Scholar] [CrossRef]
  41. Fleshman, M.S.; Rice, J.D. Laboratory Modeling of the Mechanisms of Piping Erosion Initiation. J. Geotech. Geoenviron. Eng. 2014, 140, 04014017. [Google Scholar] [CrossRef]
  42. Cai, G.D.; Chen, L.; Teng, Y.Z.; Yin, Z.X.; Zhang, Z. Investigation on Drained Mechanical Properties of Sandy Soil after Internal Erosion with an Erosion-Stress Coupling Apparatus. KSCE J. Civ. Eng. 2022, 27, 480–494. [Google Scholar] [CrossRef]
Figure 1. Quartz sand for the experiment: (a) 0.075–0.5 mm; (b) 2–4 mm; (c) mixed quartz sand.
Water 15 03085 g001
Figure 2. The sand sample grading curve.
Water 15 03085 g002
Figure 3. System layout diagram of seepage erosion device.
Water 15 03085 g003
Figure 4. Rigid-wall pressure chamber and flow mechanism.
Water 15 03085 g004
Figure 5. DEM numerical model.
Water 15 03085 g005
Figure 6. Positions of the measuring balls. (Red ball is the No. 1 measuring ball, green ball is the No. 2 measuring ball).
Water 15 03085 g006
Figure 7. Fluid mesh model diagram.
Water 15 03085 g007
Figure 8. C1 sample experimental phenomenon. (The red circle means: (b) small bulges appeared and sand boiling; (e) seepage channels and cracks).
Water 15 03085 g008
Figure 9. C2 sample experimental phenomenon. (a) Soil sample surface before seepage; (b) small bulges appeared and sand boiling; (c,d) sand boiling intensifies jumps and spreads; (e) sand sample gushed out along the cone; (f,g) seepage channels and cracks.
Water 15 03085 g009
Figure 10. Water head hydraulic gradient variation law: (a) C1 sample; (b) C2 sample.
Water 15 03085 g010
Figure 11. Model particle displacement scalar diagram.
Water 15 03085 g011
Figure 12. Model particle displacement section diagram.
Water 15 03085 g012
Figure 13. Model particle velocity vector diagram.
Water 15 03085 g013
Figure 14. Gradation curves of particle size before and after erosion of C1 sample. (a) C s w = 0.014. (b) C s w = 0.020. (c) C s w = 0.043.
Water 15 03085 g014aWater 15 03085 g014b
Figure 15. The deviatoric stress–strain curves before and after seepage erosion.
Water 15 03085 g015
Figure 16. Contact force and number variation between particles.
Water 15 03085 g016
Table 1. Experimental sand compositions and particle size parameters.
Sand SampleParticle CompositionCharacteristic Particle Size (mm)Grading Curve Coefficient
0.075–0.5 mm2–4 mm d 10 d 30 d 50 d 60 C u C c
C11000.130.210.300.362.730.89
C2460.180.442.082.6714.570.39
Table 2. Numerical model parameters.
Computation ModulesParameter Types (Units)Values
Particle modelParticle density, ρ /(kg·m−3)2650
Normal stiffness, k n /(N·m−1)3.0 × 106
Shear stiffness, k s /(N·m−1)2.0 × 106
Bond stiffness ratio, k11.5
Friction coefficient, μ 1 0.5
Initial porosity0.48
Wall modelBond stiffness ratio, k21.5
Friction coefficient, μ 2 0.3
Fluid modelFluid density, ρ f /(kg·m−3)1000
Fluid viscosity, μ f /(Pa·s)0.001
Grid size, (m)0.03 × 0.03 × 0.04
Fluid grid cells, (m)0.005 × 0.005 × 0.005
Number of grid cells288
Table 3. Characteristic parameters of gradation before and after erosion.
Erosion RateStateAverage
Particle Size d 50 /mm
Fineness Modulus M x Inhomogeneity Coefficient C u Curvature Coefficient C c
C1 sampleBefore erosion0.3022.742.7290.888
C s w = 0.014After erosion0.3152.782.7150.915
Exudate particles0.1751.992.1780.988
C s w = 0.020After erosion0.3202.782.7370.934
Exudate particles0.1782.041.8490.971
C s w = 0.043After erosion0.3322.822.7570.979
Exudate particles0.2022.262.0930.984
Disclaimer/Publisher’s Note: The statements, opinions and data contained in all publications are solely those of the individual author(s) and contributor(s) and not of MDPI and/or the editor(s). MDPI and/or the editor(s) disclaim responsibility for any injury to people or property resulting from any ideas, methods, instructions or products referred to in the content.

