Abstract
The object of the present study was to analyse water consumption in a four-person household (park employee housing) located in the village of Kulczyn in Polesie National Park (PNP) in Poland. The wastewater from the buildings was discharged to a hybrid constructed wetland integrated into a closed-loop water system. As part of the study, seasonal, weekly, and daily changes in water consumption and the amount of water used to flush the toilets were determined over a period of one year. It was shown that the average daily water consumption in the entire house was 437 L/d, or 109 L/p/d (litres/person/day). The average daily water consumption per capita was, therefore, similar to that reported for Poland by the European Commission and much lower than that reported for Western European countries (150–250 L/p/d). The highest water withdrawals were recorded in the spring season (March–May) at 117–122 L/p/d, and the lowest in the holiday month of July—88 L/p/d. The highest water consumption levels during the week were recorded on Saturdays—an average of 136 L/p/d, and the lowest on Wednesdays—an average of 92 L/p/d. During the 24 h of a day, the highest water withdrawals were observed late in the evening (10–11 pm) and periodically in the morning (around 10 am), on weekends, and during the holiday period (July and August). It was shown that the amount of water used to flush toilets represented on average about 20% of the total amount of water consumed. This indicates that approximately 88 L/d of water was used to flush the toilets in the homestead under study.
1. Introduction
Management of environmental resources, especially water, is a key challenge for sustainable urban and rural development [1]. It is essential to provide the population with sufficient amounts of water to ensure a healthy lifestyle. However, access to clean water is still limited for millions of people around the world [2], especially in the context of ongoing climate change [3]. For this reason, research and implementation projects in this area should be treated as a priority.
Proper operation of a treatment plant hinges upon the amount of influent wastewater and how steady the inflow is [4]. In other words, it directly depends on water consumption levels in households and public utility facilities. In large, collective wastewater treatment plants, wastewater inflow is steadier and more uniform than in domestic facilities [5]. The uneven inflow of wastewater to treatment plants has a considerable impact on their technological efficiency [6].
It has been found that water consumption levels (and, thus, also wastewater discharge levels) in individual households vary across seasons, but are also different on particular days, weeks, and hours of the day [7]. To date, variations in water consumption levels in households and public utility facilities have been analysed by Pawełek et al. [8], Bergel et al. [7,9], Bugajski et al. [5], and Myka-Raduj et al. [10]. Studies in this subject area have also been conducted in, among others, countries such as RSA [1], Iran [11], China [12], India [13], Kazakhstan [14], and Senegal [15]. A comparison of different European countries has shown that water consumption strongly depends on economic inequalities, the population of cities and villages, or whether a country’s economy is based on services [16].
In Poland, wastewater treatment plants are designed assuming that the average per capita water consumption level, pursuant to the Regulation of the Minister of Infrastructure [17], is 150 L/p/d (L/person/day). In actuality, however, the amount of wastewater generated in households is much smaller. A study by Bergel et al. [9] indicates that water consumption per capita is 86 L/p/d, which is 57% of the value recommended for the design of wastewater treatment plants. A similar water consumption level of 92 L/p/d was reported for urban areas in the Republic of South Africa [1]. In Senegal, users of private collective water supply networks consumed 55 L/p/d of water, while individual consumers used 25 L/p/d of (hydrant) water [15]. Bergel et al. [9] point out that the design guidelines for water consumption standards in Poland are overstated and, therefore, require updating. Moreover, those authors propose that the amount of wastewater discharged should be determined on the basis of the amount of water consumed for domestic purposes only. This means that the amount of water used for household needs and the amount of water used for additional purposes should be measured separately, especially at farms in rural areas.
Households use water for various purposes. Rofiat et al. [18] reported that Nigerian households used 33% of water for bathing, 14% for washing clothes, 13% for cooking, 12% for flushing the toilet, 10.48% for washing a car, 9.08% for washing dishes, and 7.99% for drinking. A study by Narmilan and colleagues [19] showed that households in Sri Lanka used 45% of water for bathing, 15% for washing, 11.7% for flushing the toilet, 11.4% for watering plants, 6.3% for washing dishes, 4.1% for drinking, 3% for house cleaning, 2.8% for cooking, and 0.53% for other purposes. To compare, Ludwińska and Paduchowska [20] reported that in Polish households, the largest amount of water was used for washing and bathing—36%, followed by flushing the toilet—30%, washing clothes—15%, washing dishes—10%, cooking—3%, and cleaning and other purposes—6%.
In recent years, the urgent need to protect water resources around the world has given rise to more and more talk of utilising rainwater [3,21,22,23,24], reusing wastewater, and using closed-water-circuit systems [25,26,27,28,29,30]. Therefore, the determination of water consumption levels and the structure of water use for various purposes in households is a very important issue, as it provides information about the possibility of reuse of appropriately treated wastewater for flushing toilets or watering the garden.
The aim of the present study was to analyse water consumption in a four-person household (employee housing) located in Polesie National Park (PNP), from which wastewater was discharged to a hybrid constructed wetland system. As part of the research, seasonal, weekly, and daily fluctuations in water consumption levels and the ratio of flushing water to total water used were determined over the course of one year. The analysis of water consumption in this particular facility is very important due to further innovative research enabling the reuse of treated wastewater in a single-family household. The obtained research results made it possible to indicate what part of the wastewater treated from the hybrid, constructed, wetland wastewater treatment plant with a closed water circuit operating at the household can be reused for flushing toilets, watering plants, or washing the car.
2. Materials and Methods
2.1. Characteristics of the Facility
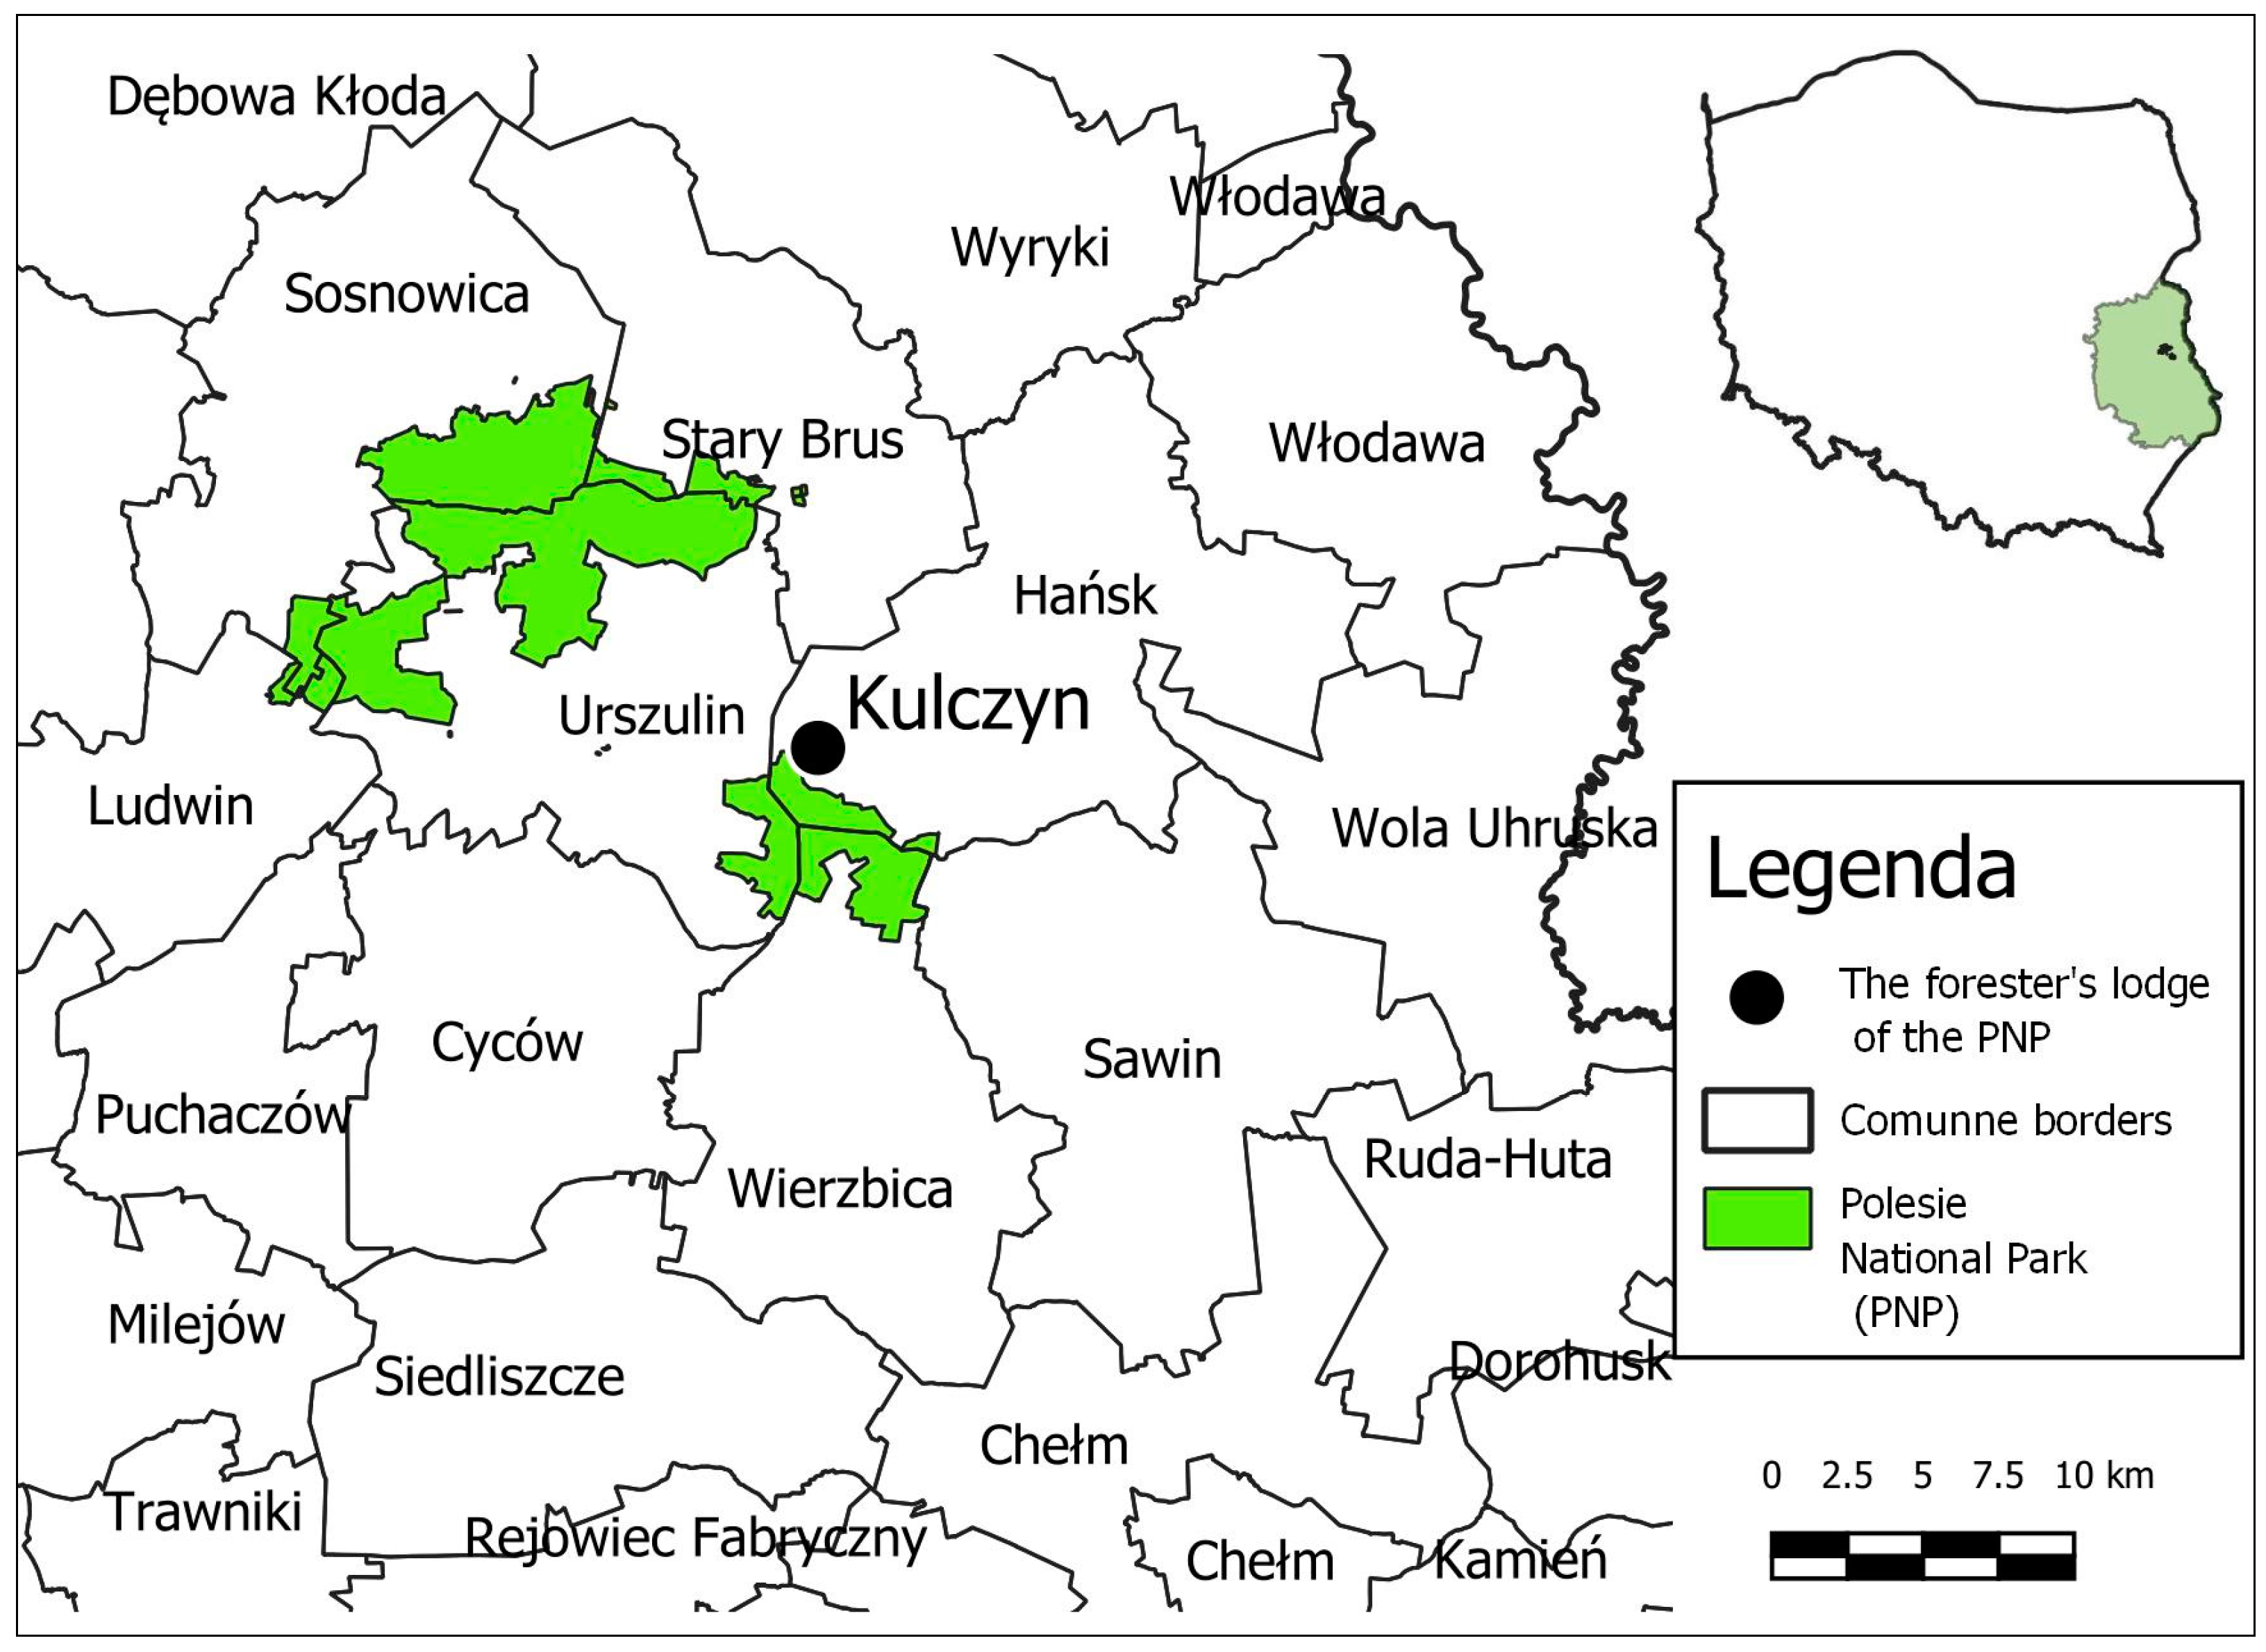
The employee housing (a forester’s lodge) in which the study was conducted is located in a rural area in the village of Kulczyn (51°23′7.01″ N, 23°17′48.42″ E), Hańsk commune, Włodawa district, Lublin Province. The site is situated near the Bagno Bubnów fen in the southeast part of PNP, which (the park) was established on 1 May 1990 to protect water-and-peat-bog ecosystems. The park covers an area of almost 10,000 sq. hectares and encompasses the most valuable natural habitats and landscapes of Western Polesie in southeastern Poland (Figure 1).
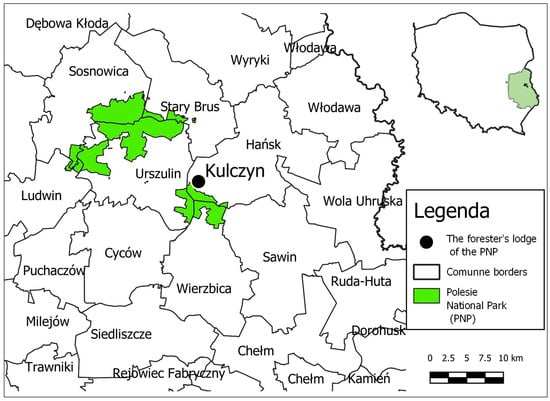
Figure 1.
Geographical location of the employee housing unit in Kulczyn, in Polesie National Park, and in Poland (compiled by Waldemar Raduj, PNP).
On the plot where the employee housing unit is located, there is a residential building and an outbuilding (Figure 2).
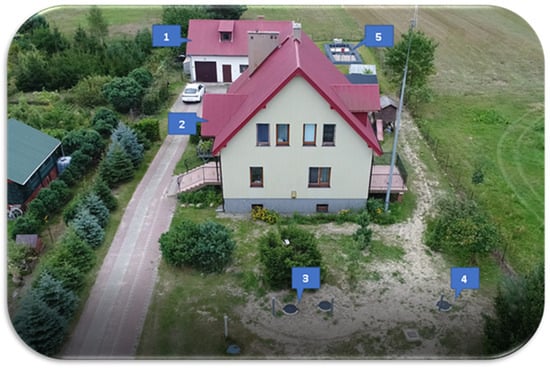
Figure 2.
Employee housing unit in Kulczyn, Polesie National Park—location of facilities on the plot: 1—outbuilding; 2—residential building; 3—primary settling tank; 4—pumping station; 5—hybrid constructed wetland integrated into a closed water circuit (photo by Radomir Obroślak).
The two-storey 160 m2 residential building is permanently inhabited by a family of four (two adults and two teenagers). The employee housing unit is supplied with mains water from the local communal water supply system. The residential building has never been connected to a sewage network. In the years 2004–2022, wastewater discharged from the residential building had been treated in a domestic wastewater treatment plant with a soakaway drainfield. At the end of September 2022, a hybrid constructed wetland system with a closed water circuit was connected to the residential building (Figure 2). The residential building to which tap water is supplied is equipped with a kitchen sink, a dishwasher, two flush toilets, a bathroom with bathing facilities (shower, bathtub) and two washbasins, a washing machine, and one outdoor tap. The family also uses water for drinking and food preparation. There are no other sources of water, so water is sometimes used for watering plants and washing the car.
2.2. Scope, Methods, and Statistical Analysis
Water consumption data collected in the PNP employee housing unit in Kulczyn over a period of 12 months in the year 2022 were analysed. Water was used primarily for domestic purposes and for watering plants. In the study, we determined changes in the amount of water consumed in the housing unit across the seasons and months of the year, as well as on individual days of the week and hours of the day. Special attention was paid to the amount of water used for flushing toilets relative to the total amount of water consumed in the tested facility. The data we obtained made it possible to determine the indices of hourly and daily fluctuations in water consumption levels in the examined household.
To register the amount of water used in the employee housing unit, three BMETERS GSD8 vane-wheel water meters Q3 = 1.6 m3/h T50 (B Meters srl, Via Friuli 3, Gonars 33050, Italy) and one METRON JS 1.0 17 (METRON Integrated Systems Factory Sp. z o. o., Torun, Poland) vane-wheel water meter Qn = 1.0 m3/h with pulse generators (1 dm3/pulse) were installed. Pulses were registered with a Supla Zamel Wi-Fi LIW-01 (Zamel Sp. z o.o. Pszczyna, Poland) pulse counter using SUPLA software version 23.08 [www.supla.org.pl, accessed on 4 January 2023.]. Data were saved automatically every 10 min in SUPLA CLOUD. Then, it was downloaded to a hard drive, stored in Microsoft Excel 2010, and monitored online on mobile devices using the SUPLA app for Android. The water meters with pulse emitters were installed 1—at the main water valve and 2, 3—in the house’s two toilets to record the amount of water supplied from the network. The measuring equipment we used allowed us to precisely analyse the changes in water consumption levels in the PNP employment housing unit during the period under study.
To properly present the results, selected statistical measures were calculated: mean, median, and maximum values. Graphs show results as obtained directly from the measurement readings for specific dates and hours of the day and as series sorted from smallest to largest value.
3. Results and Discussion
In designing water supply systems, water consumption is calculated using various indicator methods by assigning categories of water consumption to consumers [31] or using economic indicators [32] or estimating the probability of fixture use and using fixture unit flow rates determined from the discharge flow rate [33]. In the present case, actual flows were analysed, i.e., specific values of water discharge flows at particular hours of the day and on particular days of 2022. Water consumption was measured using a water meter with a signal transmitter, which allowed us to take readings at any time step. The time step is sometimes set every 15 min or less [34], but the final results are usually reported for one-hour (hours) [35] and 24 h periods (days).
3.1. Annual Water Consumption
To obtain reliable results for the full annual cycle of 2022, water consumption readings were taken across the period from 1 January 2022 to 31 December 2022. Since the house was inhabited by four people (two adults and two children), the water meter readings were divided by four to determine water consumption per inhabitant. When the water consumption values were summed up, it turned out that in 2022, the household used 159.353 m3 of water. A total of 40.429 m3 of water was used in the first calendar quarter (1 January 2022 to 31 March 2022—90 days), 42.052 m3 in the second quarter (1 April 2022 to 30 June 2022—91 days), 36.567 m3 in the third quarter (1 July 2022 to 30 September 2022—92 days), and 40.305 m3 in the fourth quarter (1 October 2022 to 31 December 2022—92 days). The clearly lower water consumption in the third calendar quarter was associated with a two-week vacation trip the family inhabiting the house took in August that year. When these figures were divided by four people, it was found that the mean water consumption per person per calendar quarter was about 10 m3.
3.2. Mean Daily Water Consumption and Consumption Non-Uniformity Indices
Mean daily water consumption Qmd in the investigated household was calculated by dividing the total annual water consumption [159.353 m3/year] by 365 days (Formula (1)), which yielded Qmd = 0.437 m3/d.
By analysing the yearly set of daily water consumption readings, we determined the maximum value denoted as Qmaxd, which was 1.352 m3/d and was recorded on Saturday, 26 November 2022. According to the methodology used in this study, the relationship between Qmaxd and Qmd is produced by Formula (2), where Nd is the daily non-uniformity index.
Nd was calculated by transforming Formula (2):
Nd = Qmaxd/Qmd = 1.352/0.437 = 3.09
Another design value is Qmaxh, which denotes the maximum hourly water consumption on the day of maximum demand and is calculated from Formula (3).
In accordance with the present methodology, Nh in this formula stands for the hourly non-uniformity index. In this case, Qmaxh = 0.256 m3/h was registered on 26 November 2022 between 8 pm and 9 pm. Using Formula (3), we calculated the hourly non-uniformity index:
Nh = (Qmaxh·24)/Qmaxd = (0.256·24)/1.352 = 4.54.
The calculations were performed using water meter readings for the entire household, but since normally this method is used to calculate values per inhabitant [36], we divided the measurement results by four persons:
Qannual = 159.353 m3/year: 4 = 39.838 m3/(P·year)
The daily water consumption per person was q = 0.437 m3/d/4 persons = 0.109 m3/P/d.
A comparison of the characteristic values calculated for the investigated household with the values adopted in the design of water supply and sewage systems in Poland [17] is presented in Table 1.

Table 1.
Comparison of measurement results from Kulczyn with normative data in Poland.
As one can see, the mean daily amount of water per one inhabitant is within the range adopted in designing water supply systems and wastewater treatment plants in Poland. Of course, the ranges adopted by designers are values averaged over multiple households (entire towns or villages), and values for individual households may deviate from the average value both upwards and downwards [5]. The literature shows that water withdrawals in households vary greatly, depending on the country [35] and the type of facility/building [34]. According to [37] data, per capita water consumption in Europe ranges from 50 to over 250 L/d. Data in [37] indicate that in Poland, people consume 100–125 L/d of water per capita, while Western Europeans consume over 150 L/d. The highest per capita water consumption is reported for Italy at 225–250 L/d. In this light, the 109 L/d of water consumed per capita in the household under study is within the range reported by [37] for Poland.
Since averaged values do not provide a full picture of water consumption, maximum daily and hourly consumption values are additionally provided, as they significantly affect the procedure of designing water supply and sewerage networks and wastewater treatment plants. The Qmaxd value is used to design water draw-off points, water treatment plants, and retention reservoirs, whereas Qmaxh is used in designing water supply networks and network pumping stations. Sewerage systems are designed on the basis of Qmaxh, while wastewater treatment plants are designed based on Qmaxd. In the case of privately owned buildings, water draw-offs with a time step shorter than 1 h are taken into account since a single person can draw water at several points over a short time, e.g., bathtub, washing machine, dishwasher, sink, and toilet. In such situations, measurements with a shorter time step are used, which allows one to track consumption in real time using advanced electronic technologies [38]. In cases like this, high water consumption peaks and long periods of zero water consumption can be registered, such as the ones observed in Kulczyn at night and during workdays (the inhabitants did not consume any water from late morning until late afternoon, as they spent that time at work or at school). It should be added that non-uniform water consumption is often due to leaks from the water supply network, which, in larger towns, represent several percent of total water consumption [39]. In large networks, over 10% of the total water production by waterworks can be lost to system leaks, caused mainly by overly high water pressure and poor water distribution management [40]. Since the water plumbing system in the analysed building was completely watertight, water consumption readings reflected solely the amount of water the inhabitants used to meet their natural needs.
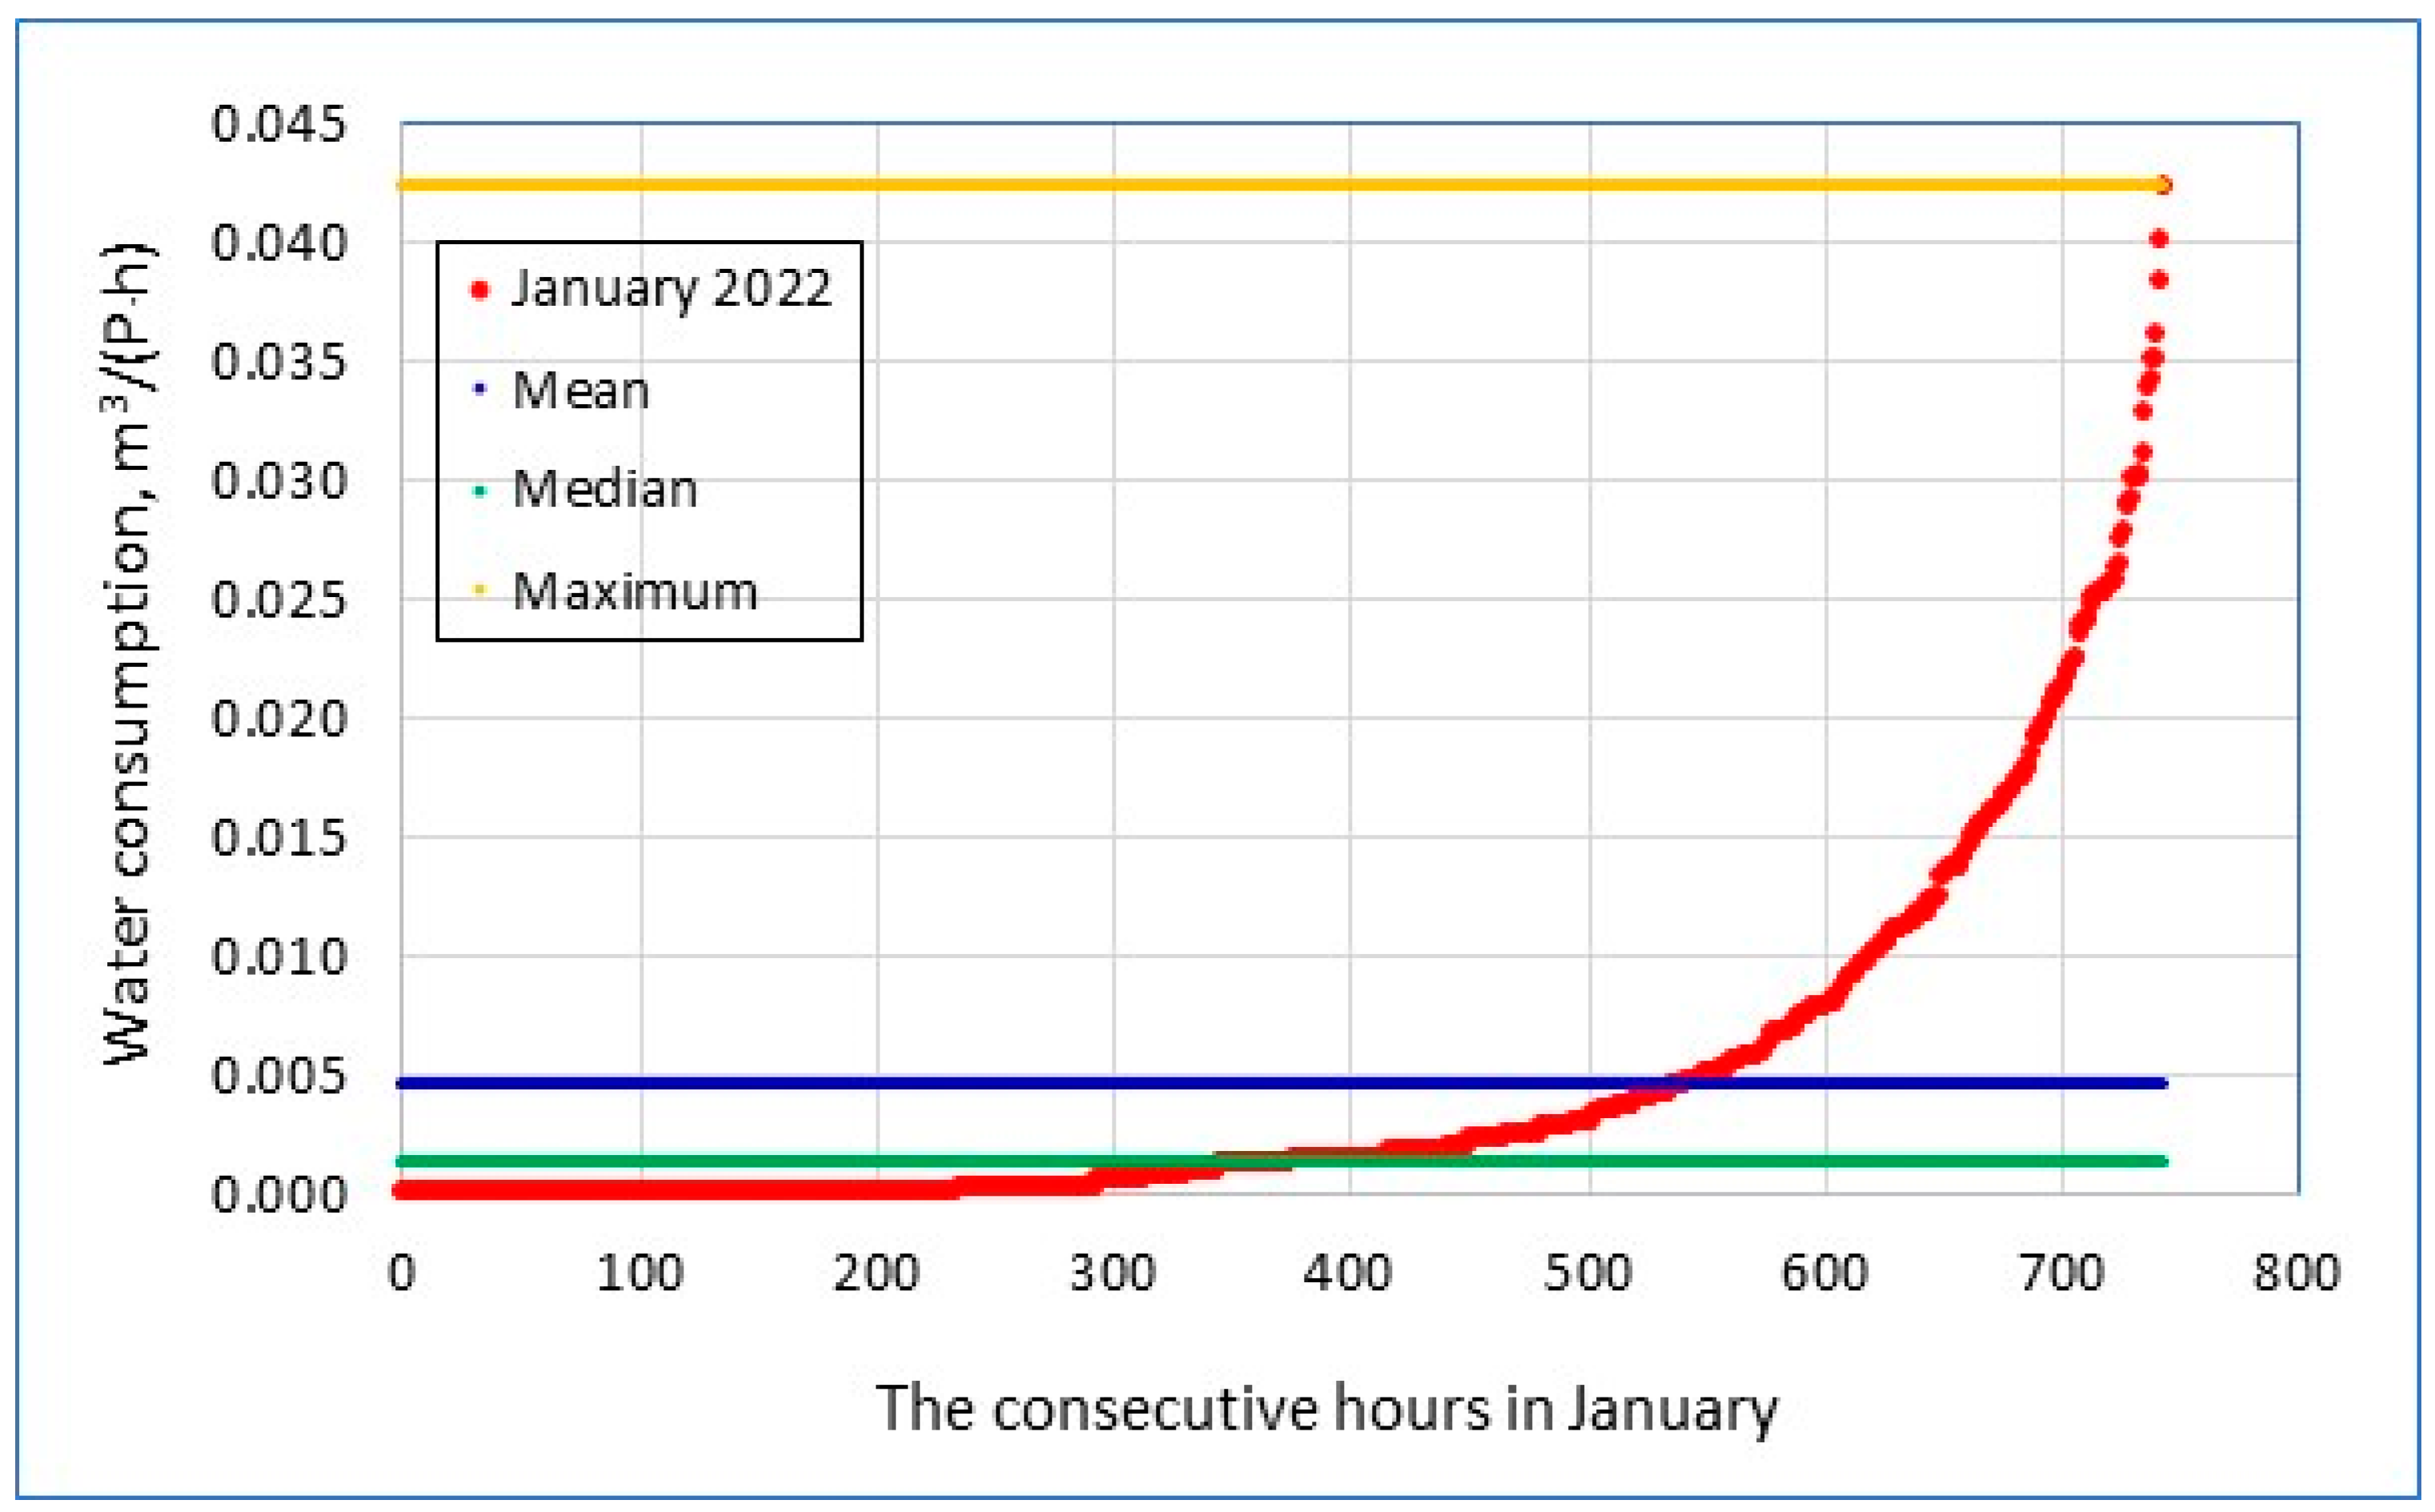
In the analysed facility, it was also found that the non-uniformity indices Nd and Nh were 3.1 and 4.5, respectively, and so they were substantially higher than the typical normative values adopted in the design of water supply systems, as shown in Table 1. These large differences were the consequence of a right (positively)-skewed statistical distribution of water draw-off, as shown in Figure 3.
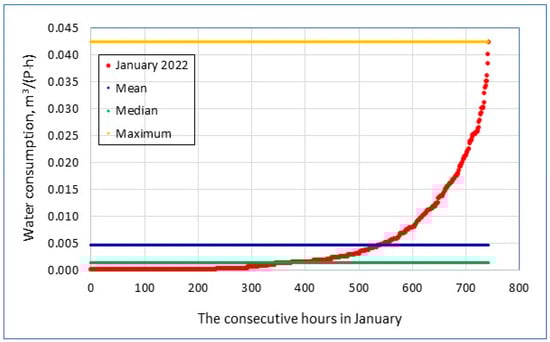
Figure 3.
An example of hourly distribution of per capita water consumption in January 2022, sorted from the lowest to the highest value.
Such large differences between the mean and the median were the consequence of long periods of zero water consumption, which represented 35.2% of the time, yearly. The largest number of hours with zero water consumption were registered in November (42.2%), and the smallest in February (24.7%). August was a unique month, because the water supply system was unused 47.6% of the time, as the family was away on holiday. The yellow line marks maximum water withdrawal values; the minimum value of zero is not shown, as it would overlap with the horizontal axis. The distribution of sorted daily water consumption values is diametrically different, as shown in Figure 4.
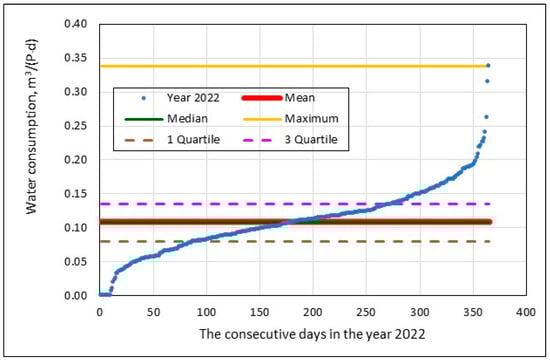
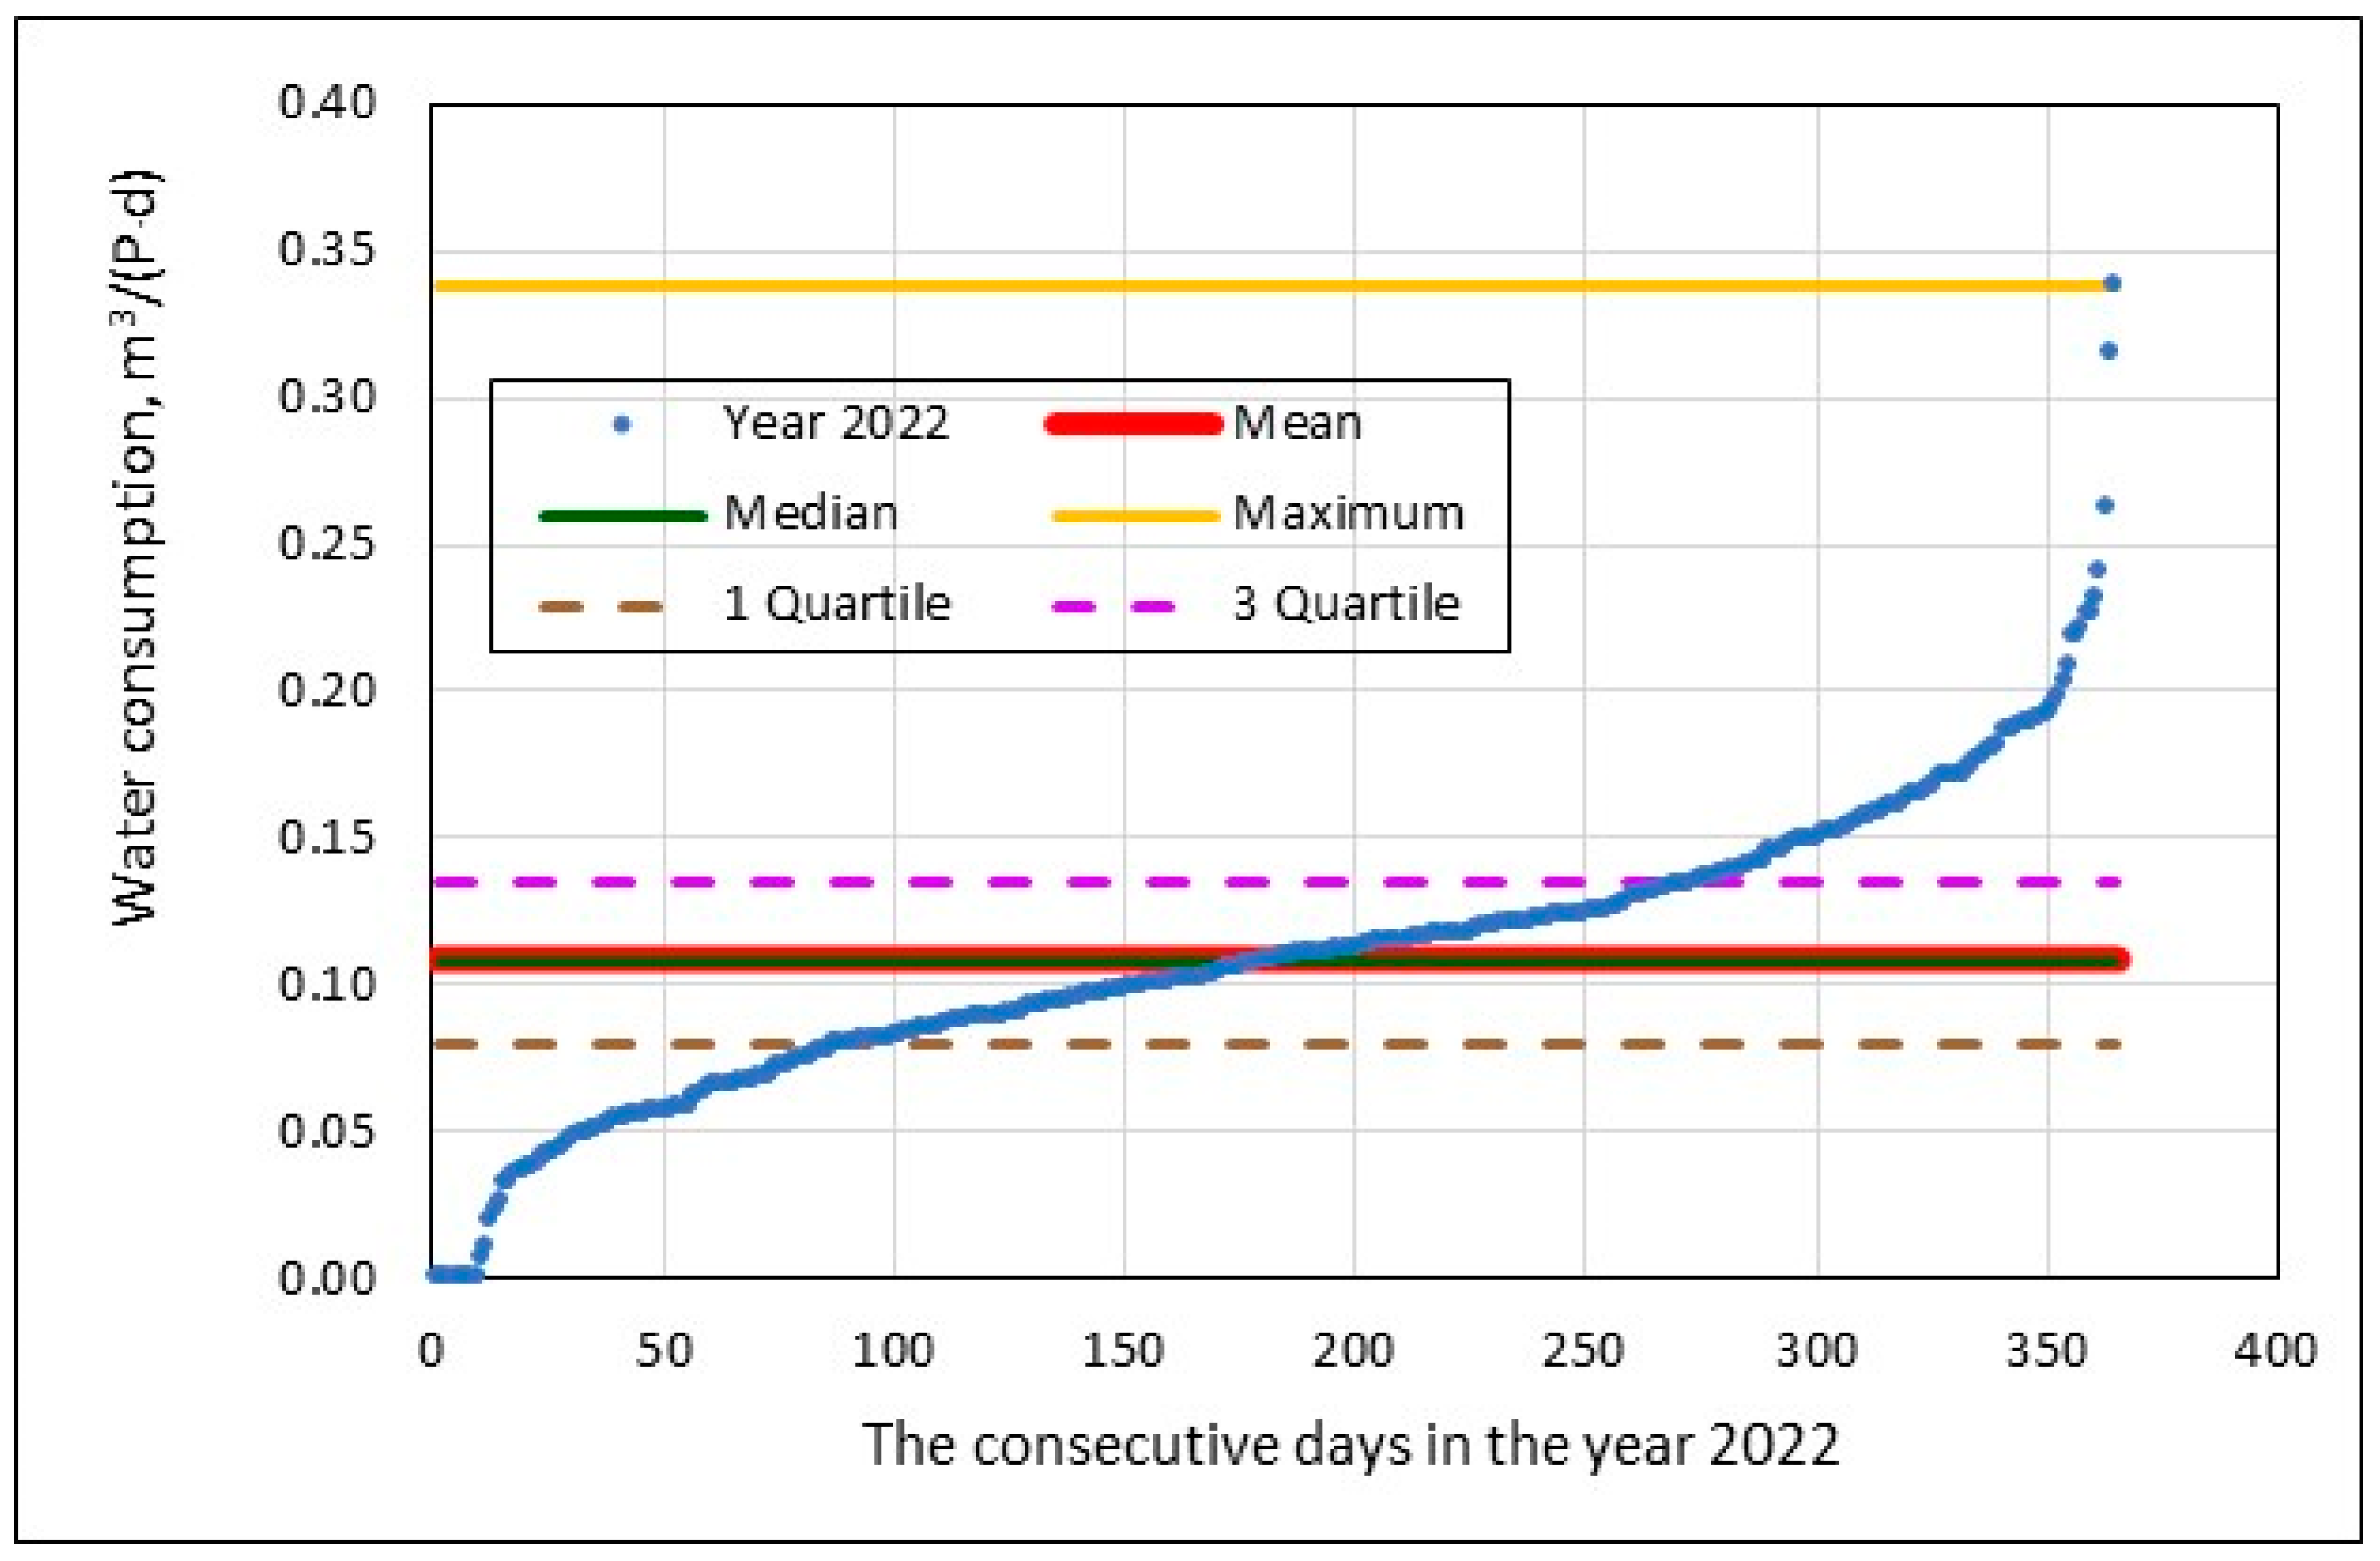
Figure 4.
An example of daily distribution of per capita water consumption in 2022, sorted from the lowest to the highest value.
The distribution shown in Figure 4 is clearly symmetrical, as the mean and the median almost coincide. This is due to the fact that during the year, zero consumption values were registered only on a few vacation days and during a few occasional one-day trips (several days in a year). The quartile distribution shows that 75% of the results are between 0.08 m3/(P·d) (1st quartile) and 0.135 m3/(P·d) (3rd quartile).
3.3. Water Consumption by Season, Day of the Week, and Hour of the Day
In the analyses of water consumption presented in the previous section, hours, days, etc. were viewed as being uniform throughout the year. However, it is known that water consumption in households varies, depending on the season, day of the week, and hour of the day. Figure 5 shows the mean water consumption values observed during the consecutive hours of the day in the different seasons of the year. To create the graphs shown in Figure 5, water consumption readings taken at the consecutive hours of the day (0–1, 1–2, 2–3, etc. until 23–24) across all days of each calendar quarter (winter—January, February, and March; spring—April, May, and June; summer—July, August, and September; and autumn—October, November, and December) were summed up. Each sum was divided by the number of days in the calendar quarter and by the number of household inhabitants. In this way, mean water consumption values for each hour of the day in each quarter of the year were determined. To obtain a more precise distribution, analogous distributions for each month of 2022 were plotted as shown in Figure 6.
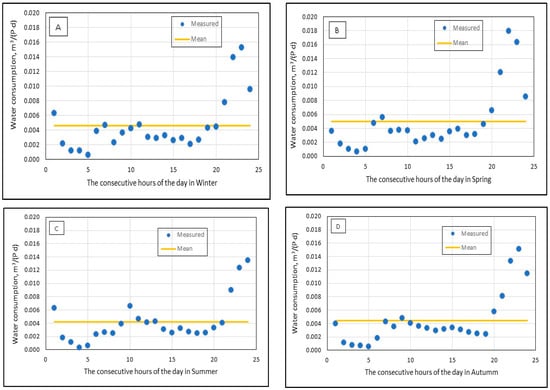
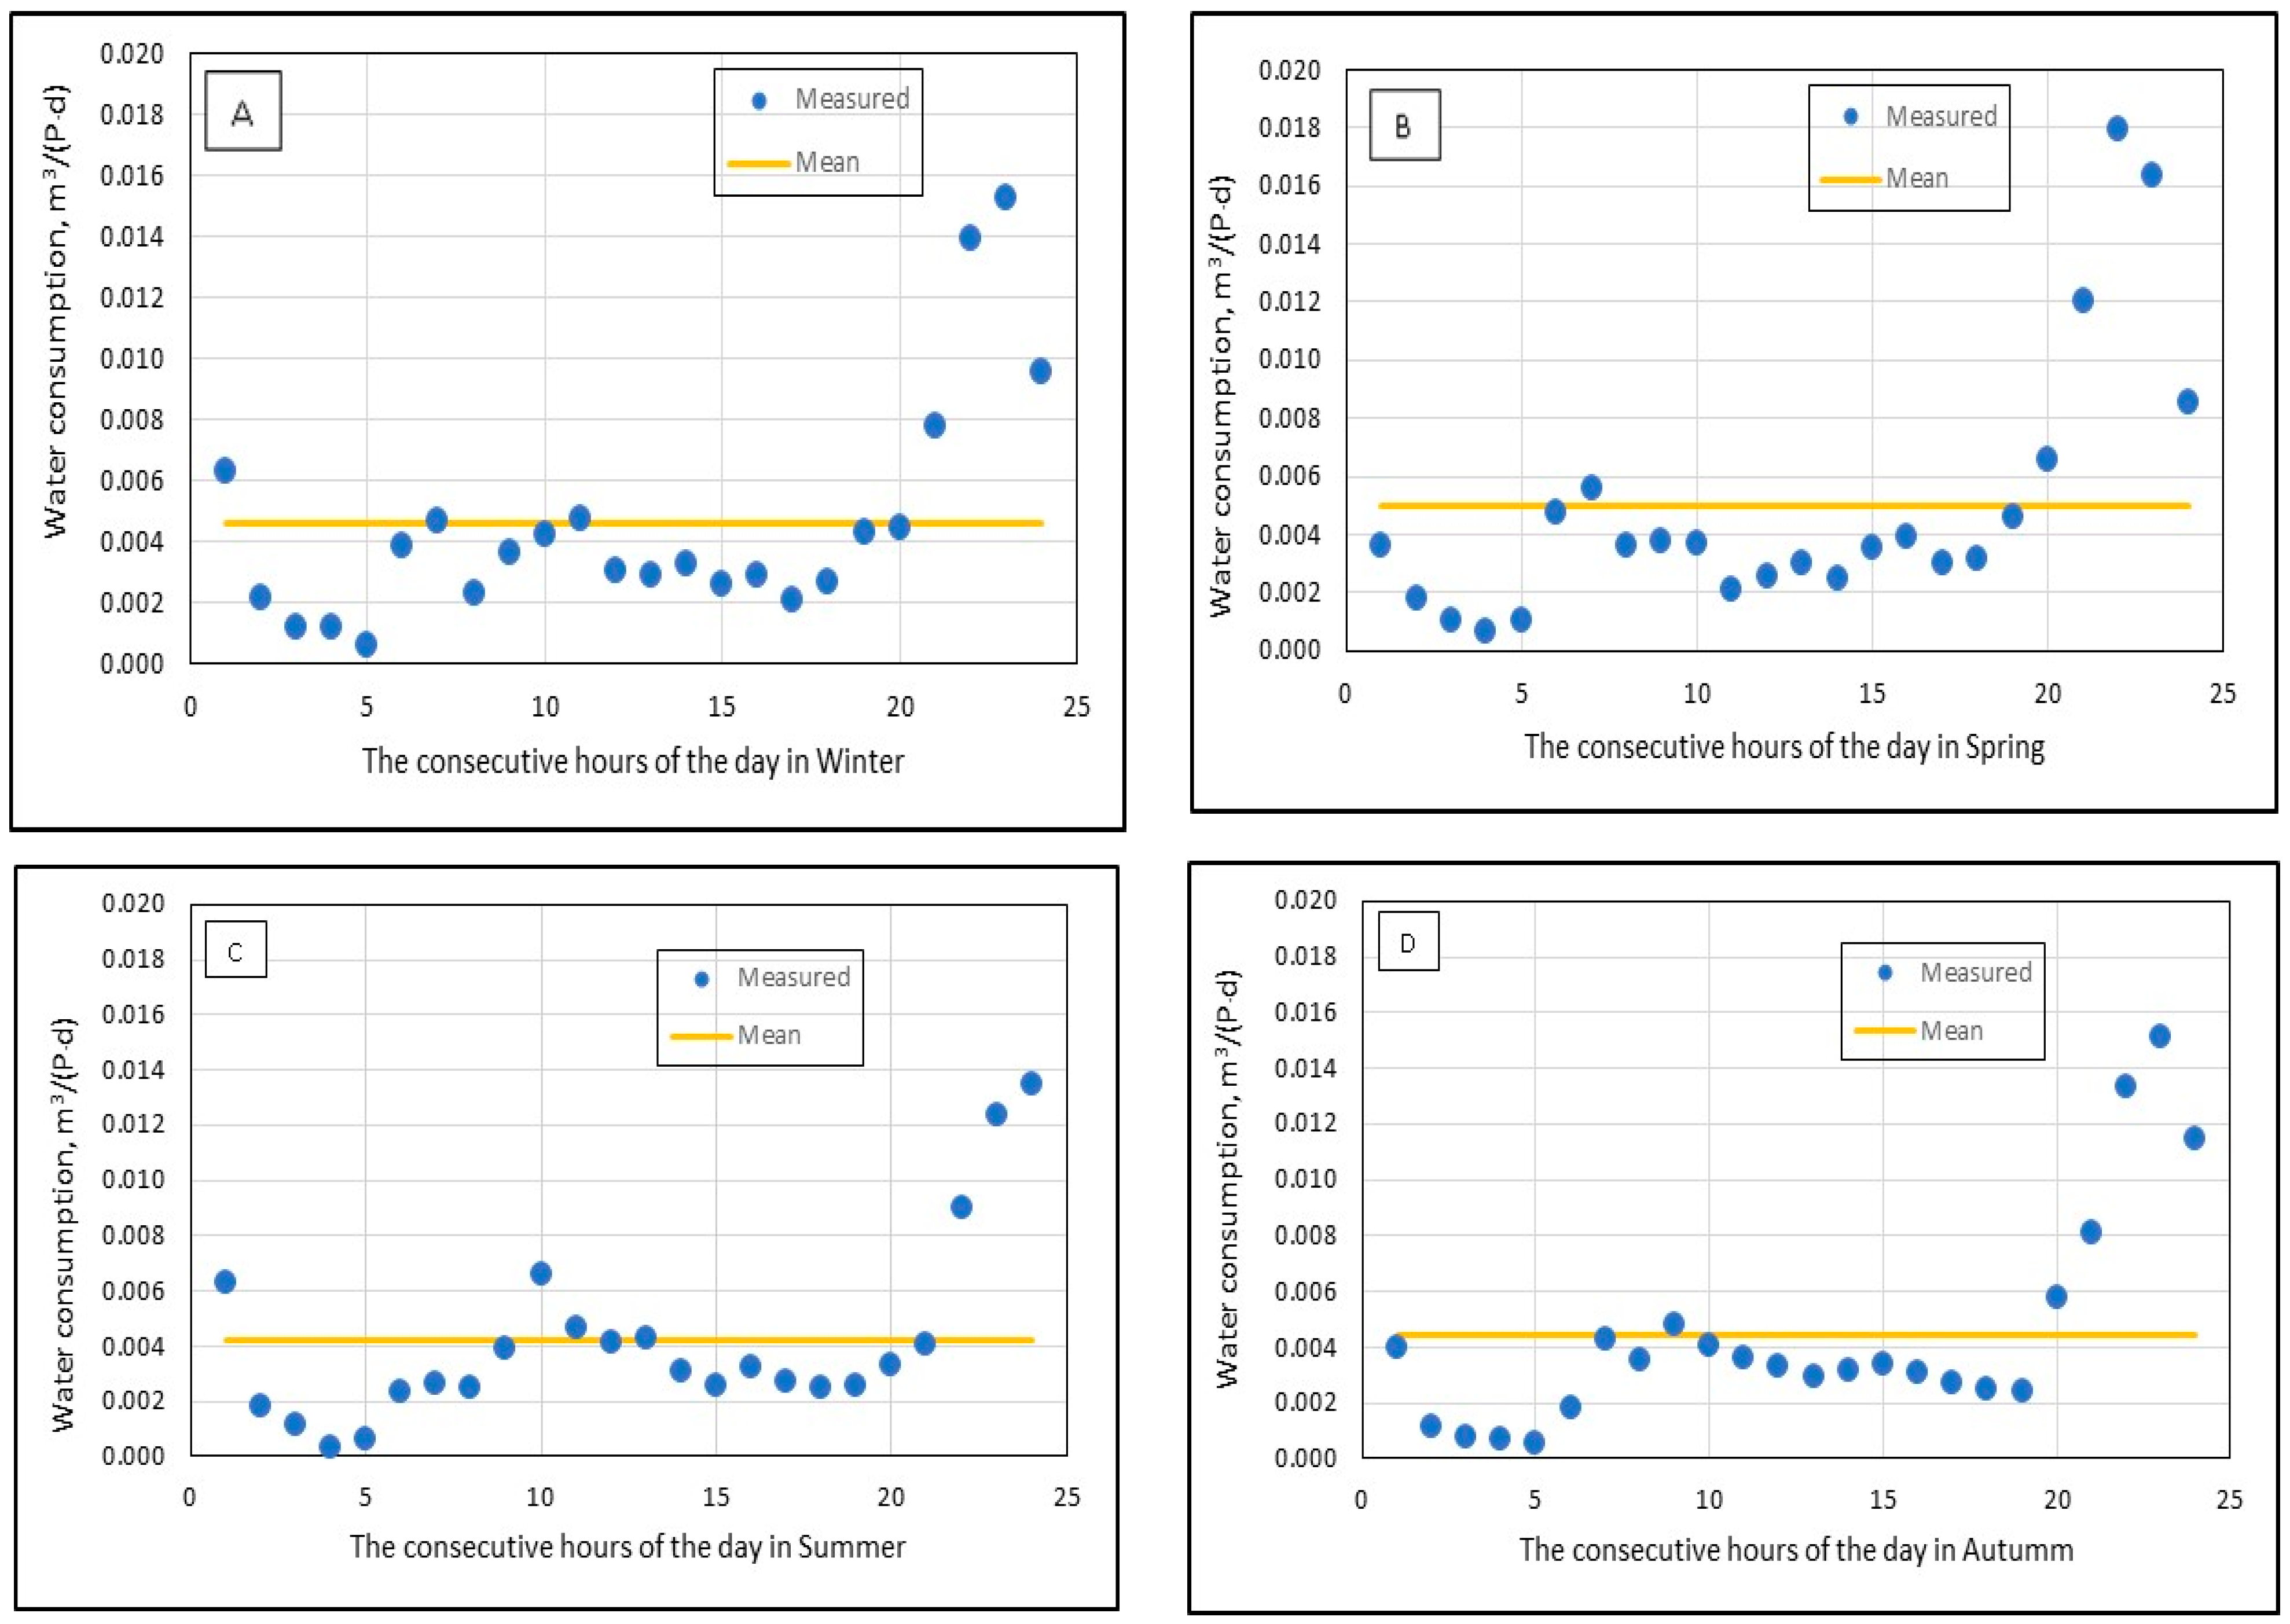
Figure 5.
Mean water consumption during each hour of the day, calculated on the basis of draw-offs on all days of the individual calendar quarters ((A)—Winter, (B)—Spring, (C)—Summer, (D)—Autumm).
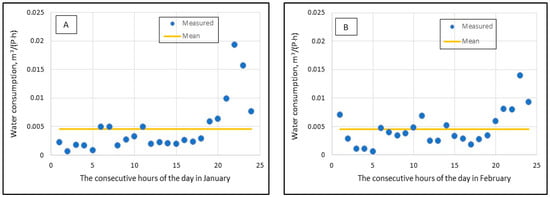
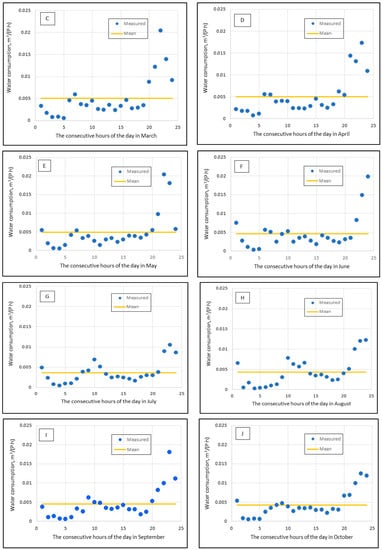
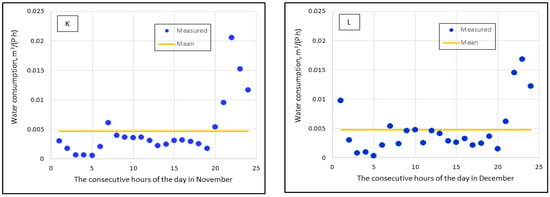
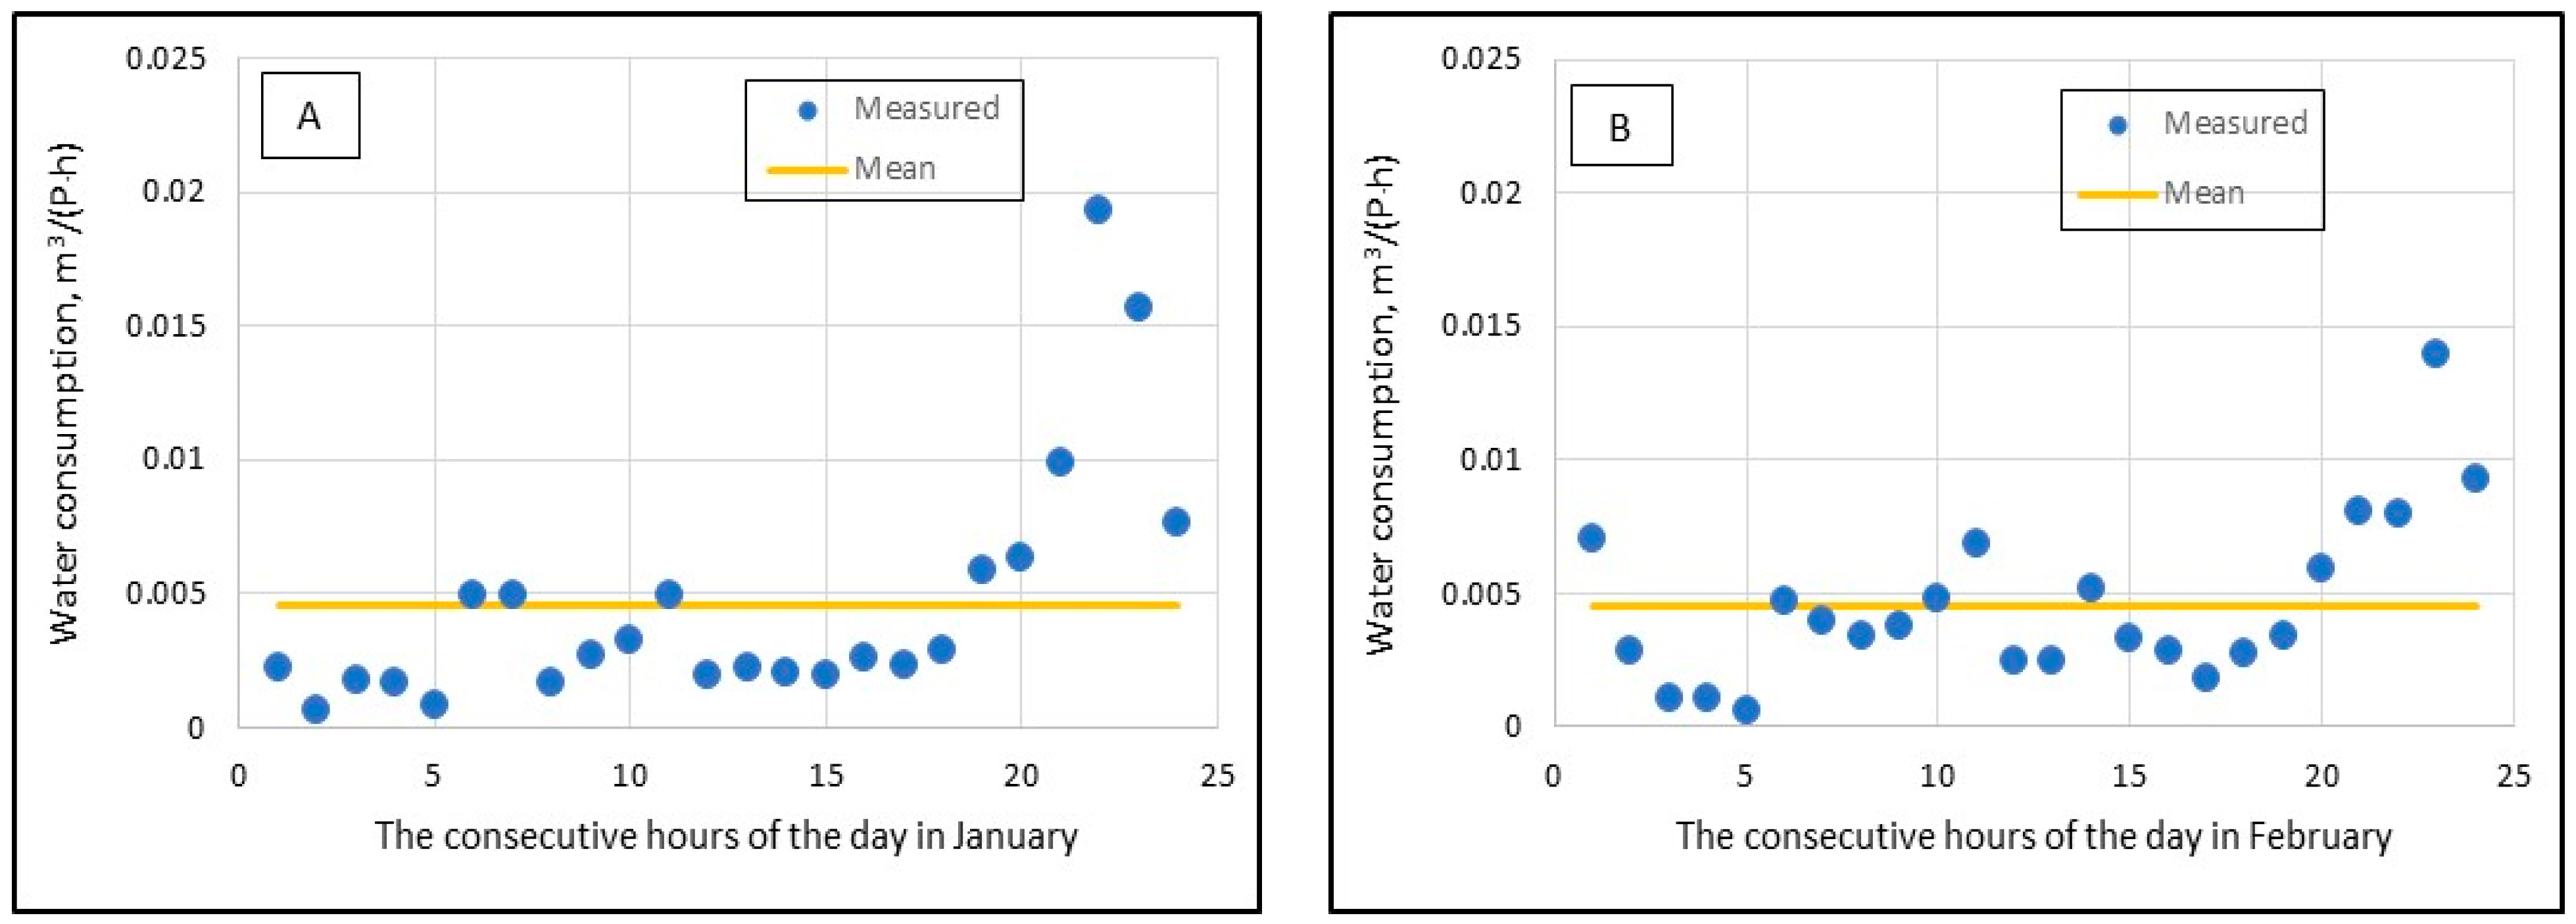
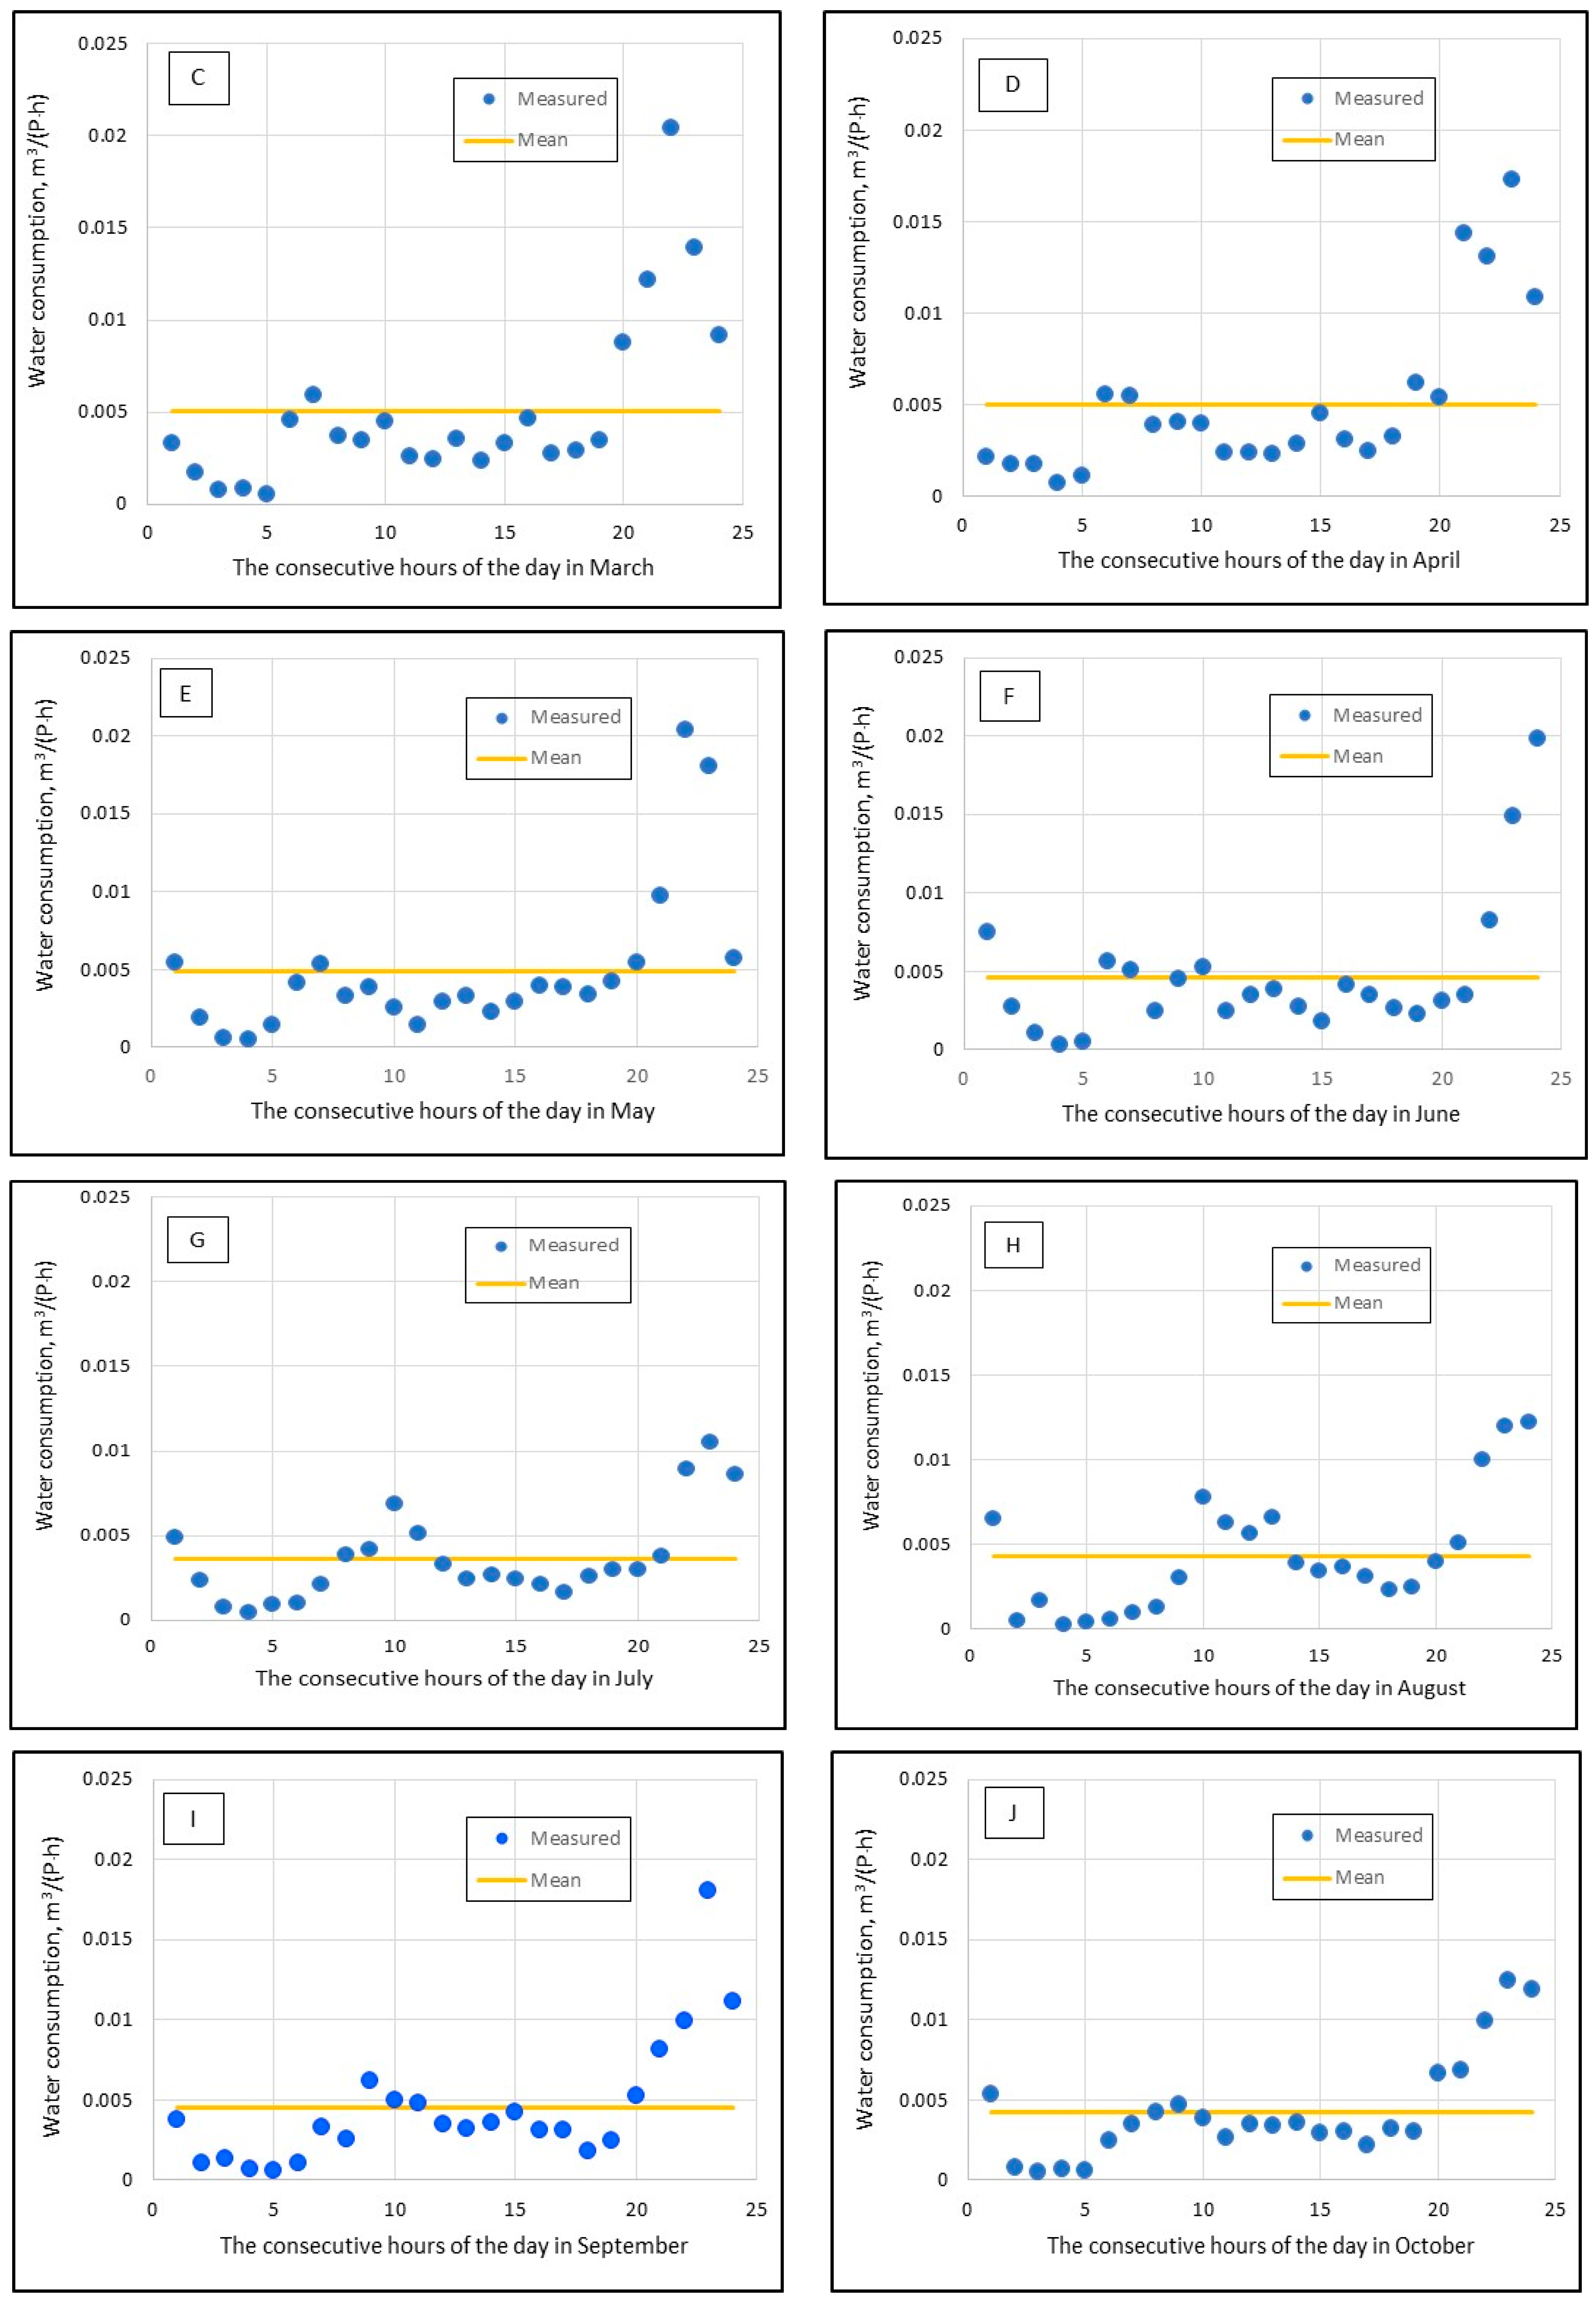
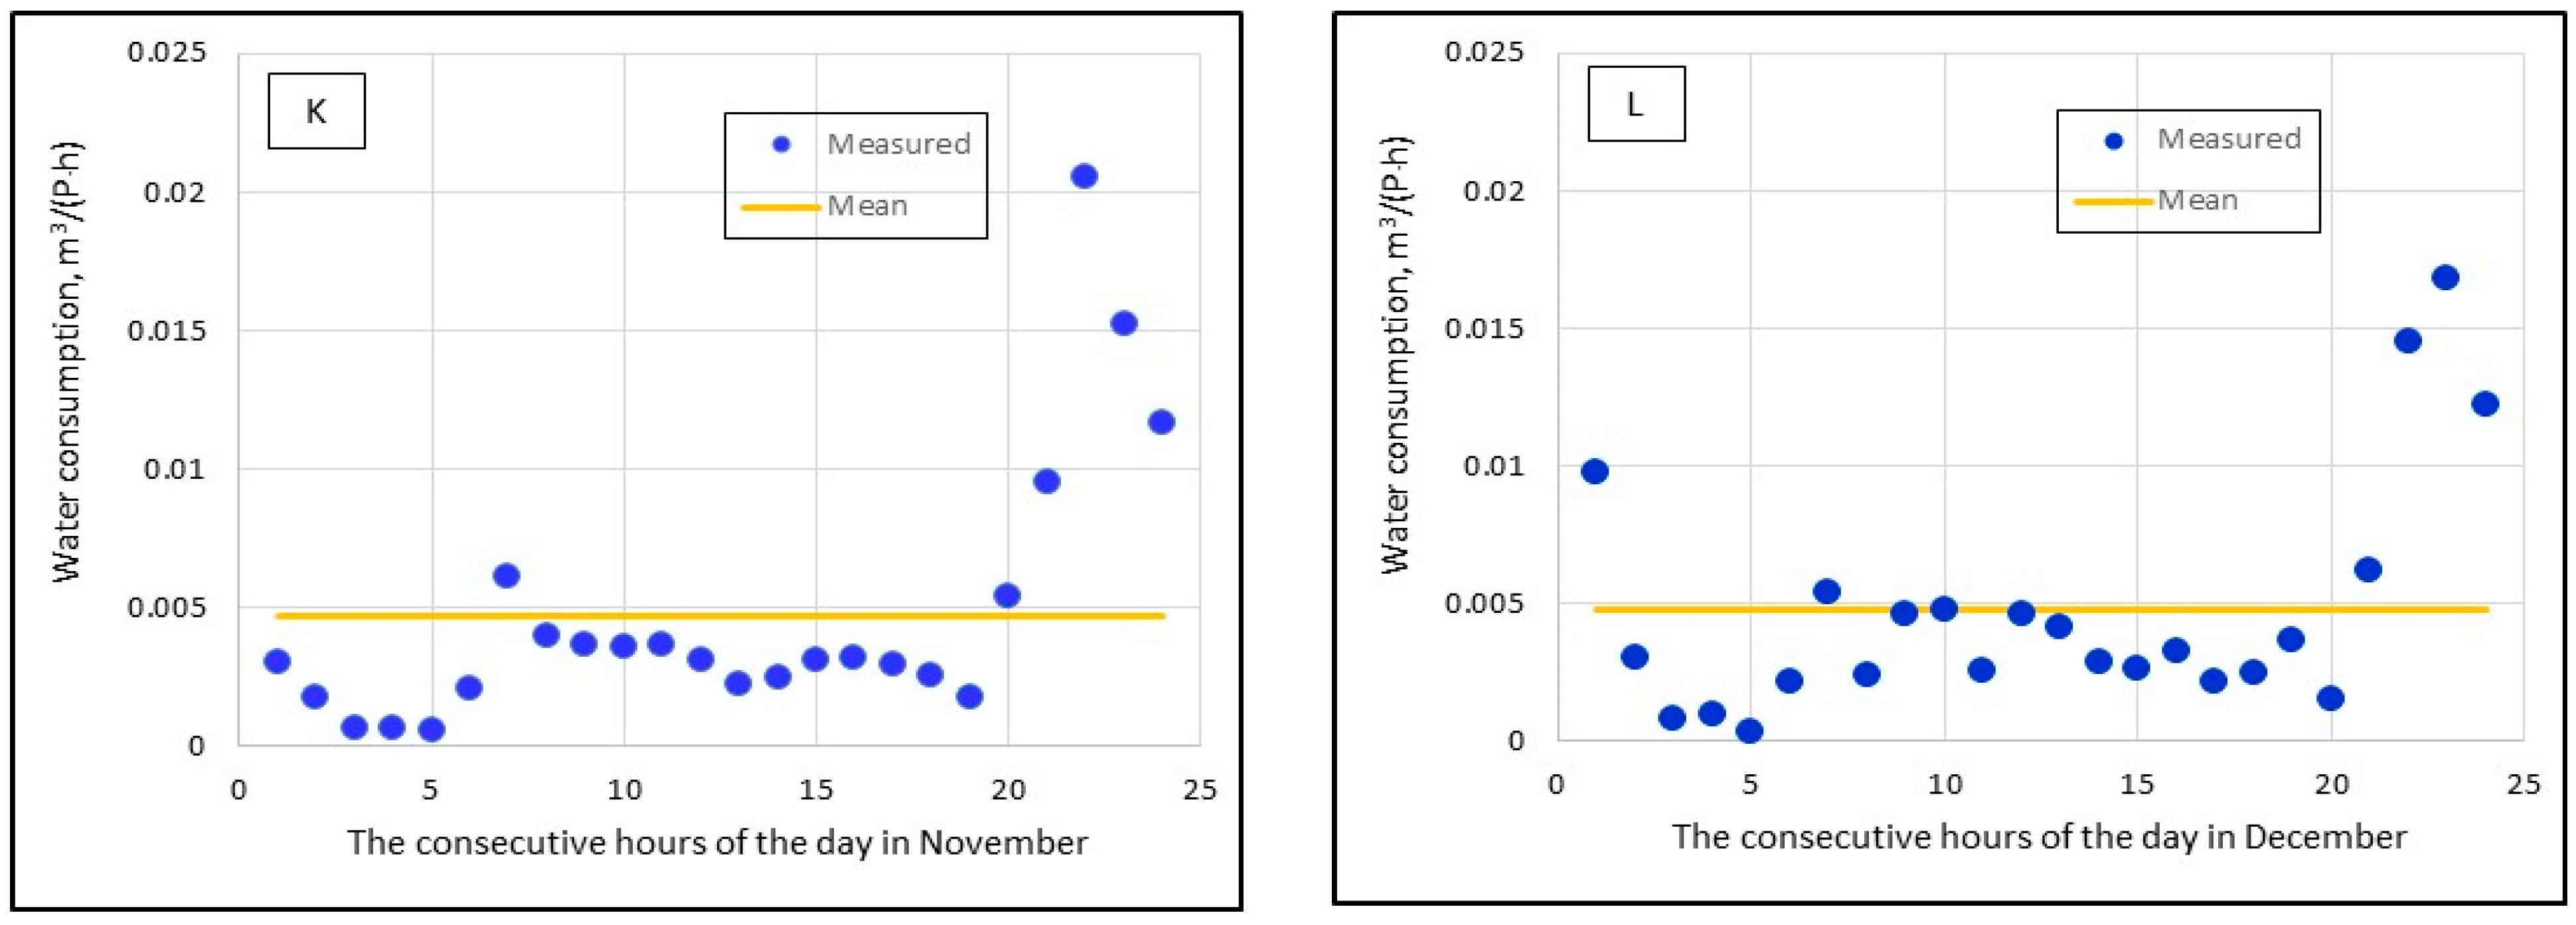
Figure 6.
Mean water consumption for each hour of the day, calculated from measurements taken on all days of each month ((A)—January, (B)—February, (C)—March, (D)—April, (E)—May, (F)—June, (G)—July, (H)—August, (I)—September, (J)—October, (K)—November, (L)—December).
The water consumption distributions for the individual calendar quarters shown in Figure 5 do not confirm the information provided in numerous publications that the largest amounts of water are consumed in the summer months. Gwoździej-Mazur and Świętochowski [41], for example, observed the highest water consumption levels in the growing season from June to September. Such measurement results are likely to be obtained in large settlements, especially in agricultural areas, but not in individual households, especially when the inhabitants are not engaged in agricultural production. An analysis of the data provided in Figure 5 and Figure 6 shows that in all calendar quarters, water consumption clearly peaked in the evenings, with a more diffuse (broader) morning peak observed over a larger number of hours. Water consumption in an individual household is fairly strongly dependent on the inhabitants’ habits and their daily routine, including the adults’ working hours and the children’s school hours. It is worth noting that in the summer quarter, in which children were on holidays, the morning peak, which occurred as late as around 10 o’clock, was rather low.
Deviations from typical water consumption distributions for the individual hours of the day are more prominently displayed in Figure 6. Particular attention should be paid to Figs. 6 G and H, which show two water consumption peaks of a similar height: a morning peak (at about 10 am) and an evening peak (at about 10 or 11 pm), which correspond to the family’s specific daily routine of activities in this period, with the parents working in the PNP’s forester’s lodge and office and the children being on holiday.
To characterise water consumption distributions on the particular days of the week, the results of measurements and calculations related to these days were plotted in the graph in Figure 7.
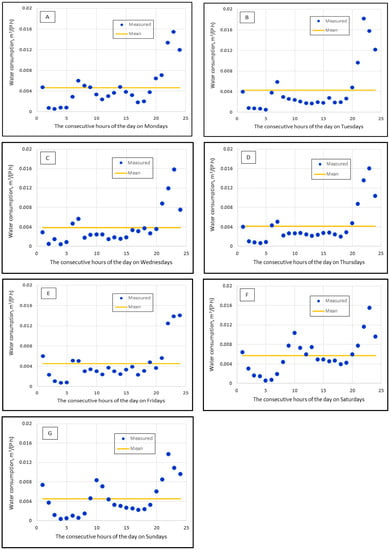
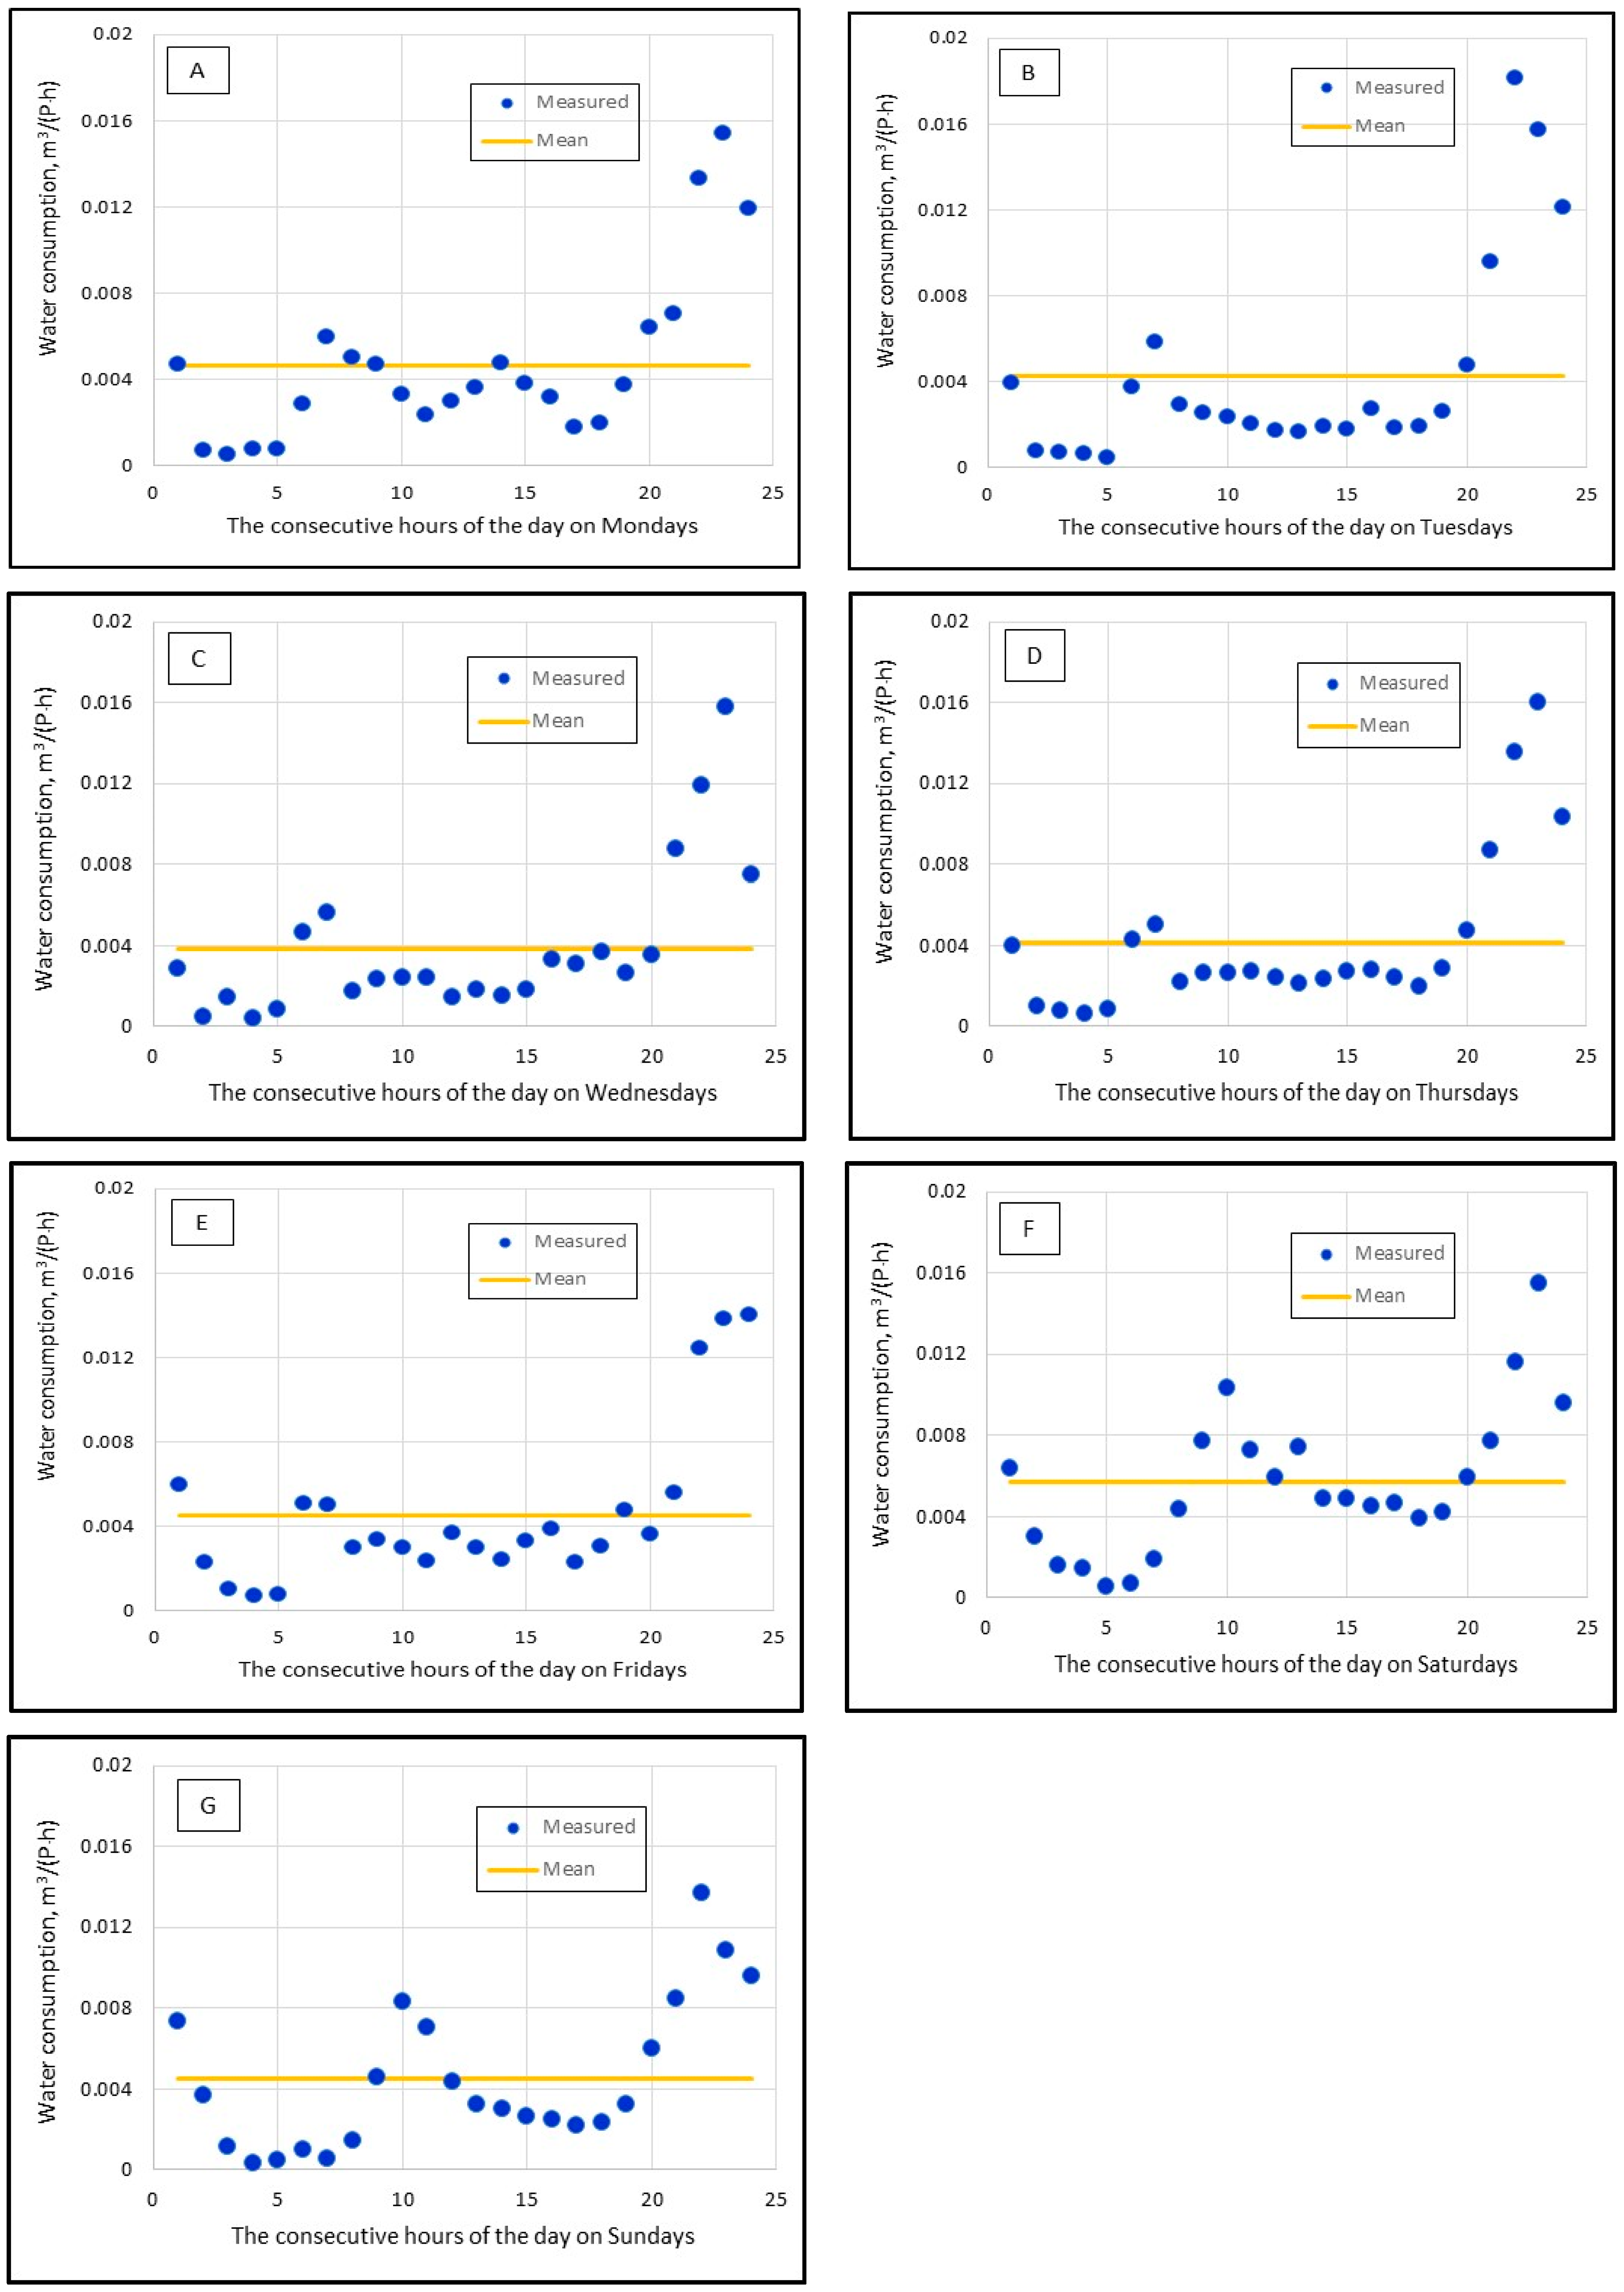
Figure 7.
Mean water consumption during each hour of the day, calculated on the basis of measurements taken on each day of the week ((A)—Mondays, (B)—Tuesdays, (C)—Wednesdays, (D)—Thursdays, (E)—Fridays, (F)—Saturdays, (G)—Sundays).
When analysing the data presented in Figure 7, one observes clear differences between workdays and weekends. This, of course, stands to reason. On weekends, there is a morning peak at around 10 am and an evening peak around 10 or 11 pm. On workdays, the morning peak “spreads” or “blurs” into the adjacent hours. This reflects the fact that the points at which the adults and the children living in the investigated household started their day on weekends were shifted in time relative to weekdays. A similar difference between water consumption levels registered on weekdays and on the weekend was reported by Hrnjadović and Suljić [42].
3.4. Toilet Flushing Water Consumption Relative to Total Water Consumption
Figure 8 shows the amount of water used for flushing toilets relative to the total per capita water consumption in the investigated household.
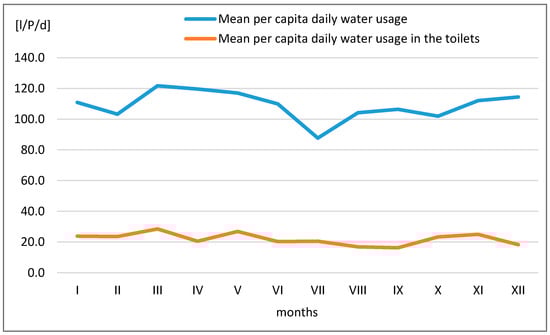
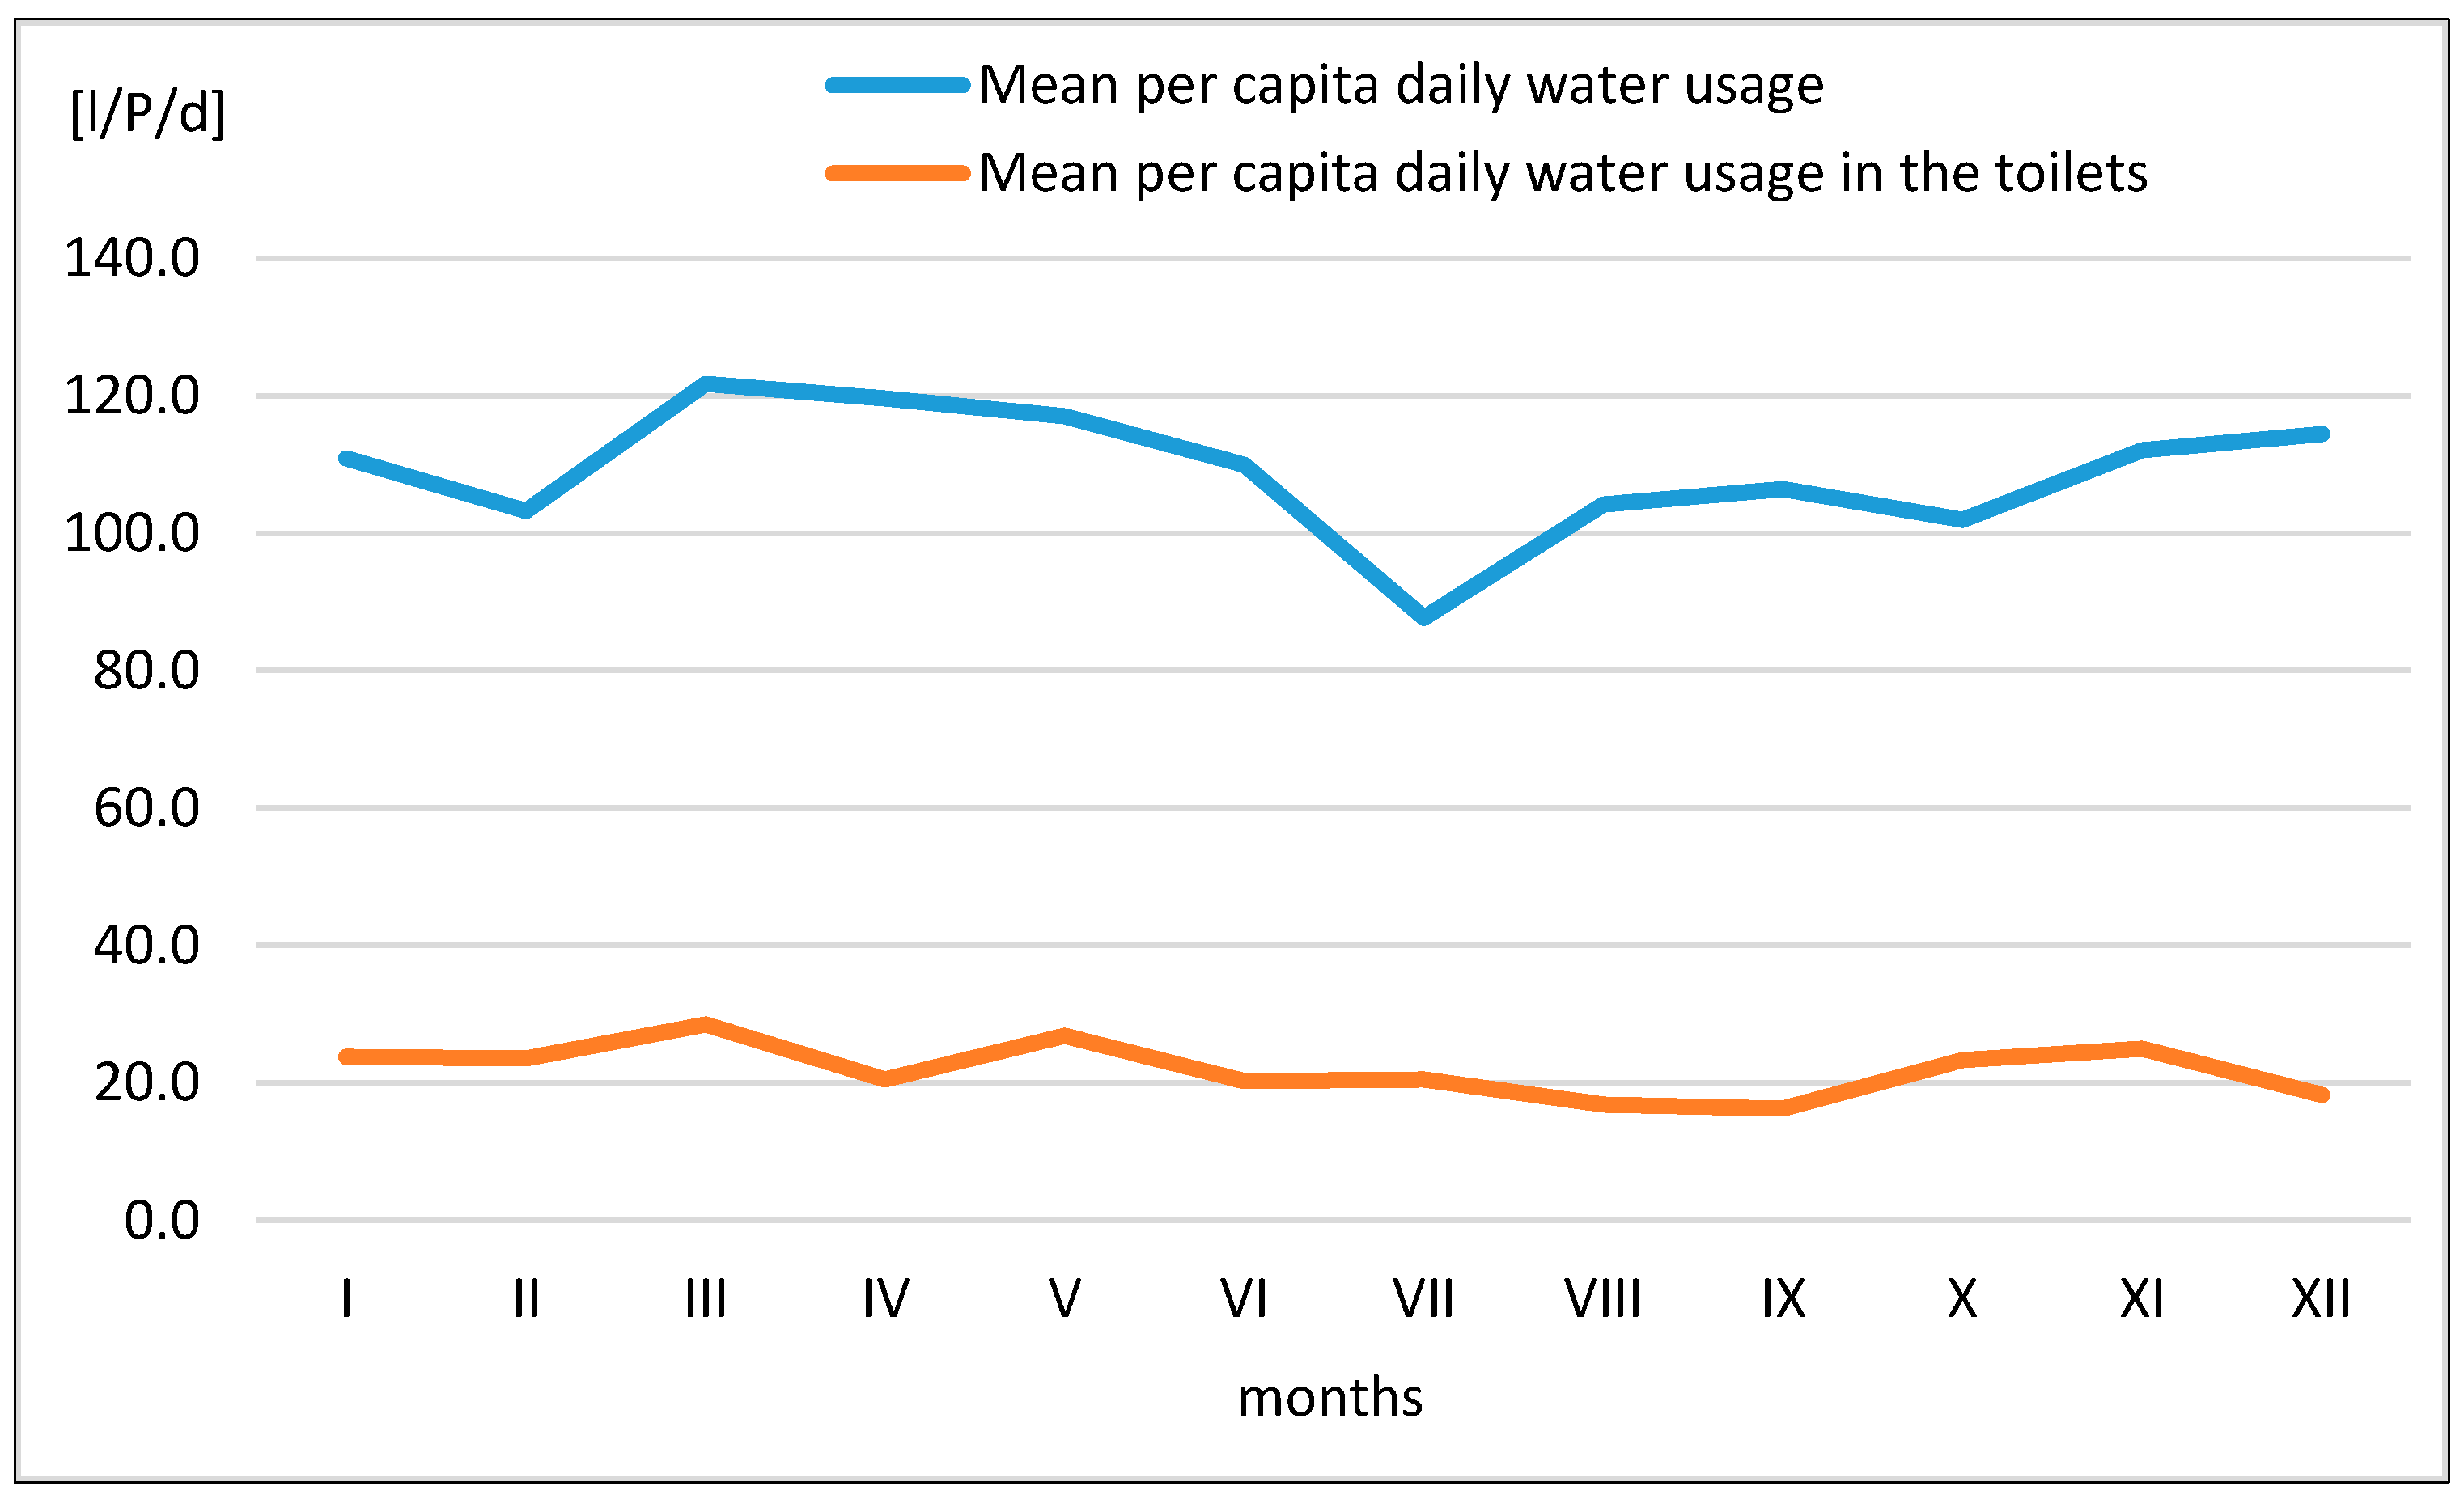
Figure 8.
The amount of water used for flushing toilets in relation to total per capita water consumption.
The data show that the amount of water used by one person in the individual months ranged from 87.7 L/P/d (in July) to 121.8 L/P/d (in March). Per capita consumption of water for flushing toilets, on the other hand, ranged from 16.3 L/P/d (in September) to 28.6 L/P/d (in March) and was usually not correlated with total water consumption. It was shown that the amount of water used by one inhabitant for flushing the toilets ranged from 15.3 to 23.5% of the total amount of water used per capita (a mean of 20.2%, i.e., 22 L/P/d.). Much smaller amounts of water used for flushing toilets have been reported in other countries, e.g., Nigeria—12% [18] or Sri Lanka—11.7% [19]. On the other hand, research conducted by Ludwińska and Paduchowska [20] shows that the amount of water used to flush toilets in Poland represents on average 30% of total water consumption.
4. Conclusions
The study we conducted in 2022 in a household of four people (two adults and two children) not engaged in agricultural activity showed that water consumption in that housing unit was very uneven. The mean water consumption was 109 L/P/d, which is consistent with the data reported in the literature [37] for water consumers in Poland, but much lower than the figures reported for Western European countries, where water consumption usually exceeds 150 L/P/d and can be as high as 250 L/R/d. As it is known, the larger the population of a given locality, the lower are the indices of the daily non-uniformity of water consumption. In large cities, the daily non-uniformity is 1.1–1.2, while in rural areas, it is 1.4–1.6. As shown in this study, the typical non-uniformity indices recommended for calculating water consumption in entire towns or villages differ significantly from those calculated for individual households. In the housing unit under study, the daily non-uniformity index was 3.1, and the hourly non-uniformity index was 4.5. These results can be taken into account in the design of domestic wastewater treatment plants. Significant differences were noted relative to the commonly adopted water consumption peaks during the day. In the analysed household, there was practically no morning water consumption peak, but high amounts of water were consumed in the evenings. This was particularly evident on workdays, when increased water consumption levels without any clear peaks were observed for up to 3 h in the mornings. Weekends (Saturday, Sunday) and part of the holiday period (July, August) were a slight exception, with increased water consumption recorded in the mornings (around 10:00 am) and in the evenings (at 10:00 or 11:00 pm). It was shown that the amount of water used to flush the toilets represented on average about 20% of the total amount of water consumed. This means that approximately 88 L/d of water is required to flush the toilets in the house under study.
The study conducted for this specific case is very important due to further research, which is being continued in a hybrid, constructed, wetland wastewater treatment plant with a closed water circuit at the household under study. The research results presented in this paper showed what proportion of the wastewater flowing out of a residential building can be recycled to flush toilets, which will allow for partial closure of the water circulation in this facility. In further studies, the efficiency of wastewater treatment in the constructed wetland system and the efficiency of wastewater purification using various filters and UV lamps will be analysed. We hope that the presented results and future studies on the researched household and constructed wetland facility with a closed water circuit will allow the use of the described technology in other households in Poland and around the world, especially in national parks and protected areas.
Author Contributions
Conceptualisation, A.M.-R. and K.J.; methodology, A.M.-R., K.J. and T.S.; software, A.M.-R., T.S. and W.R.; validation, A.M.-R. and W.R.; formal analysis, A.M.-R., K.J., T.S. and W.R.; investigation, A.M.-R., K.J. and T.S.; resources, A.M.-R.; data curation, A.M.-R.; writing—original draft preparation, A.M.-R., K.J. and T.S.; writing—review and editing, A.M.-R., K.J. and T.S.; visualisation, A.M.-R., T.S. and W.R.; supervision, A.M.-R. and K.J.; project administration, A.M.-R. and K.J.; funding acquisition, A.M.-R. and K.J. All authors have read and agreed to the published version of the manuscript.
Funding
Research reported in the present paper was conducted as part of the doctoral thesis written by Eng. Anna Myka-Raduj, MSc, under project no. DWD/4/88/2020 entitled “Design, construction and an analysis of the operation of a hybrid constructed wetland with a closed water circuit in the Polesie National Park”, financed by the Polish Ministry of Education and Science.
Data Availability Statement
Not applicable.
Acknowledgments
This study is a result of cooperation with Polesie National Park (PNP) based in Urszulin. The authors would like to thank the Director and staff of PNP for creating a climate for creative work.
Conflicts of Interest
The authors declare no conflict of interest.
References
- Crouch, M.L.; Jacobs, H.E.; Speight, V.L. Defining domestic water consumption based on personal water use activities. AQUA-Water Infrastruct. Ecosyst. Soc. 2021, 70, 1002–1011. [Google Scholar] [CrossRef]
- WHO; UNICEF. Progress on Household Drinking Water, Sanitation and Hygiene 2000–2020; Five Years into the SDGs; WHO: Geneva, Switzerland, 2021; ISBN 978-92-4-003084-8. [Google Scholar]
- Grabowski, T.; Jóźwiakowski, K.; Bochniak, A.; Micek, A. Changes in the Amount of Rainwater in the Roztocze National Park (Poland) in 2001–2020 and the Possibility of Using Rainwater in the Context of Ongoing Climate Variability. Water 2022, 14, 1334. [Google Scholar] [CrossRef]
- Çakir, R.; Gidirislioglu, A.; Çebi, U. A study on the effects of different hydraulic loading rates (HLR) on pollutant removal efficiency of subsurface horizontal-flow constructed wetlands used for treatment of domestic wastewaters. J. Environ. Manag. 2015, 164, 121–128. [Google Scholar] [CrossRef] [PubMed]
- Bugajski, P.M.; Kurek, K.; Młyński, D.; Operacz, A. Designed and real hydraulic load of household wastewater treatment plants. J. Water Land Dev. 2019, 40, 155–160. Available online: https://www.jwld.pl/files/Bugajski-et-al.pdf (accessed on 28 August 2023). [CrossRef]
- Masłoń, A. Impact of Uneven Flow Wastewater Distribution on the Technological Efficiency of a Sequencing Batch Reactor. Sustainability 2022, 14, 2405. [Google Scholar] [CrossRef]
- Bergel, T.; Szeląg, B.; Woyciechowska, O. Influence of a season on hourly and daily variations in water demand patterns in a rural water supply line—Case study. J. Water Land Dev. 2017, 34, 59–64. [Google Scholar] [CrossRef]
- Pawełek, J.; Bergel, T.; Woyciechowska, O. Zmienność zużycia wody w gospodarstwach wiejskich w okresie wielolecia. Acta Scientiarum Polonorum. Form. Circumiectus 2015, 14, 85–94. [Google Scholar] [CrossRef]
- Bergel, T.; Kaczor, G.; Bugajski, P. Analysis of the structure of water consumption in rural households in terms of design guidelines water and sewage systems. Infrastruct. Ecol. Rural Areas 2016, IV/4, 1899–1910. [Google Scholar] [CrossRef]
- Myka-Raduj, A.; Jóźwiakowski, K. Changes in Water Consumption in the Educational-Museum Center of Poleski National Park. J. Ecol. Eng. 2022, 23, 237–244. [Google Scholar] [CrossRef]
- Keshavarzi, A.R.; Sharifzadeh, M.; Kamgar Haghighi, A.A.; Amin, S.; Keshtkar Sh Bamdad, A. Rural domestic water consumption behavior: A case study in Ramjerd area, Fars province, I.R. Iran. Water Res. 2006, 40, 1173–1178. [Google Scholar] [CrossRef]
- Fan, L.; Liu, G.; Wang, F.; Geissen, V.; Ritsema, C.J. Factors affecting domestic water consumption in rural households upon access to improved water supply: Insights from the Wei River Basin, China. PLoS ONE 2013, 8, e71977. [Google Scholar] [CrossRef]
- Basu, M.; Hoshino, S.; Hashimoto, S.; DasGupta, R. Determinants of water consumption: A cross-sectional household study in drought-prone rural India. Int. J. Disaster Risk Reduct. 2017, 24, 373–382. [Google Scholar] [CrossRef]
- Omarova, A.; Tussupova, K.; Hjorth, P.; Kalishev, M.; Dosmagambetova, R. Water supply challenges in rural areas: A case study from central Kazakhstan. Int. J. Environ. Res. Public Health 2019, 16, 688. [Google Scholar] [CrossRef] [PubMed]
- Camara, N.; Mbaye, I.; Ngom, B.; Sarr, D.; Tamba, S. Evolution and Prospect of Dakar Drinking Water Consumption. J. Water Resour. Prot. 2019, 11, 886–895. [Google Scholar] [CrossRef]
- Ferasso, M.; Bares, L.; Ogachi, D.; Blanco, M. Economic and Sustainability Inequalities and Water Consumption of European Union Countries. Water 2021, 13, 2696. [Google Scholar] [CrossRef]
- Regulation of the Minister of Infrastructure of 14 January 2002 on Determining Average Water Consumption Standards (Dz.U. 2002 Nr 8 poz. 70). (In Polish). Available online: https://isap.sejm.gov.pl/isap.nsf/DocDetails.xsp?id=wdu20020080070 (accessed on 28 August 2023).
- Rofiat, B.M.; Maryam, Y.O.; Ismail, O.A.; Mutiu, A.O.; Adeyemi, A.O.; Adekeye, A.W. Evaluation of household water use pattern and determinants using multiple regression models. Int. J. Eng. Res. Technol. 2021, 14, 410–418. [Google Scholar]
- Narmilan, A.; Puvanitha, N.; Niroash, G.; Vassanthini, R.; Sugirtharan, M. Domestic water consumption pattern and awareness of urban households. Int. J. Hum. Cap. Urban Manag. 2021, 6, 225–236. [Google Scholar] [CrossRef]
- Ludwińska, A.; Paduchowska, J. Rainwater Harvesting Systems in Sanitary Installation of Buildings; Rynek Instalacyjny: Warsaw, Poland, 2017. (In Polish) [Google Scholar]
- Palla, A.; Gnecco, I.; Lanza, L.; La Barbera, P. Performance analysis of domestic rainwater harvesting systems under various European climate zones. Resour. Conserv. Recycl. 2012, 62, 71–80. [Google Scholar] [CrossRef]
- Musayev, S.; Burgess, E.; Mellor, J. A global performance assessment of rainwater harvesting under climate change. Resour. Conserv. Recycl. 2018, 132, 62–70. [Google Scholar] [CrossRef]
- Semaan, M.; Day, S.D.; Garvin, M.; Ramakrishnan, N.; Pearce, A. Optimal sizing of rainwater harvesting systems for domestic water usages: A systematic literature review. Resour. Conserv. Recycl. 2020, 6, 100033. [Google Scholar] [CrossRef]
- Grabowski, T.; Jóźwiakowski, K.; Bochniak, A.; Stachyra, P.; Radliński, B. Assessment of Rainwater Quality Regarding Its Use in the Roztocze National Park (Poland)—Case Study. Appl. Sci. 2023, 13, 6110. [Google Scholar] [CrossRef]
- Angelakis, A.; Bontoux, L.; Lazarova, V. Challenges and prospectives for water recycling and reuse in EU countries. Water Sci. Technol. Water Supply 2003, 3, 59–68. [Google Scholar] [CrossRef]
- Bixio, D.; Thoeye, C.; Wintgens, T.; Ravazzini, A.; Miska, V.; Muston, M.; Chikurel, H.; Aharoni, A.; Joksimovic, D.; Melin, T. Water reclamation and reuse: Implementation and management issues. Desalination 2008, 218, 13–23. [Google Scholar] [CrossRef]
- Voulvoulis, N. Water reuse from a circular economy perspective and potential risks from an unregulated approach. Curr. Opin. Environ. Sci. Health 2018, 2, 32–45. [Google Scholar] [CrossRef]
- Sapkota, A.R. Water reuse, food production and public health: Adopting transdisciplinary, systems-based approaches to achieve water and food security in a changing climate. Environ. Res. 2019, 171, 576–580. [Google Scholar] [CrossRef]
- Hagenvoort, J.; Ortega-Reig, M.; Botella, S.; García, C.; de Luis, A.; Palau-Salvador, G. Reusing Treated Waste-Water from a Circular Economy Perspective—The Case of the Real Acequia de Moncada in Valencia (Spain). Water 2019, 11, 1830. [Google Scholar] [CrossRef]
- Shevah, Y. Water scarcity, water reuse, and environmental. Pure Appl. Chem. 2014, 86, 1205–1214. [Google Scholar]
- Batista, L.T.; Franco, J.R.Q.; Fakury, R.H.; Porto, M.F.; Braga, C.M.P. Methodology for Determining Sustainable Water Consumption Indicators for Buildings. Sustainability 2022, 14, 5695. [Google Scholar] [CrossRef]
- Smol, M.; Koneczna, R. Economic Indicators in Water and Wastewater Sector Contributing to a Circular Economy (CE). Resources 2021, 10, 129. [Google Scholar] [CrossRef]
- Hobbs, I.; Anda, M.; Bahri, P.A. Estimating peak water demand: Literature review of current standing and research challenges. Results Eng. 2019, 4, 100055. [Google Scholar] [CrossRef]
- Almeida, A.P.; Sousa, V.; Silva, C.M. Methodology for estimating energy and water consumption patterns in university buildings: Case study, Federal University of Roraima (UFRR). Heliyon 2021, 7, e08642. [Google Scholar] [CrossRef] [PubMed]
- Schumann, D.; Kroner, C.; Unsal, B.; Haack, S.; Kondrup, J.B.; Christophersen, N.; Benková, M.; Knotek, S. Measurements of water consumption for the development of new test regimes for domestic water meters. Flow Meas. Instrum. 2021, 79, 101963. [Google Scholar] [CrossRef]
- Tamason, C.C.; Bessias, S.; Villada, A.; Tulsiani, S.M.; Ensink, J.H.J.; Gurley, E.S.; Jensen, P.K.M. Measuring domestic water use: A systematic review of methodologies that measure unmetered water use in low-income settings. Trop. Med. Int. Health 2016, 21, 1389–1402. [Google Scholar] [CrossRef]
- European Commission, Eurostat. 2023. Available online: https://ec.europa.eu/eurostat/data/database (accessed on 1 July 2023).
- Fuentes, H.; Mauricio, D. Smart water consumption measurement system for houses using IoT and cloud computing. Environ. Monit. Assess. 2020, 192, 602. [Google Scholar] [CrossRef]
- El-Zahab, S.; Zayed, T. Leak detection in water distribution networks: An introductory overview. Smart Water 2019, 4, 5. [Google Scholar] [CrossRef]
- Ávila, C.A.M.; Sánchez-Romero, F.-J.; López-Jiménez, P.A.; Pérez-Sánchez, M. Improve leakage management to reach sustainable water supply networks through by green energy systems. Optimized case study. Sustain. Cities Soc. 2022, 83, 103994. [Google Scholar] [CrossRef]
- Gwozdziej-Mazur, J.; Świętochowski, K. Analysis of the water meter management of the urban-rural water supply system. E3S Web Conf. 2018, 44, 00051. [Google Scholar] [CrossRef]
- Hrnjadović, J.; Suljić, N. Unevenness of water consumption in settlement on the case of Doboj. Arch. Tech. Sci. 2020, 1, 35–42. [Google Scholar] [CrossRef]

Disclaimer/Publisher’s Note: The statements, opinions and data contained in all publications are solely those of the individual author(s) and contributor(s) and not of MDPI and/or the editor(s). MDPI and/or the editor(s) disclaim responsibility for any injury to people or property resulting from any ideas, methods, instructions or products referred to in the content. |
© 2023 by the authors. Licensee MDPI, Basel, Switzerland. This article is an open access article distributed under the terms and conditions of the Creative Commons Attribution (CC BY) license (https://creativecommons.org/licenses/by/4.0/).