Article

Analysis of Vegetation Dynamics and Driving Mechanisms on the Qinghai-Tibet Plateau in the Context of Climate Change

1
School of Geography and Information Engineering, China University of Geosciences, Wuhan 430074, China
2
Key Laboratory of Geological Survey and Evaluation, Ministry of Education, China University of Geosciences, Wuhan 430074, China
3
National Engineering Research Center of Geographic Information System, China University of Geosciences, Wuhan 430074, China
*
Author to whom correspondence should be addressed.
Water 2023, 15(18), 3305; https://doi.org/10.3390/w15183305
Submission received: 2 August 2023 / Revised: 12 September 2023 / Accepted: 16 September 2023 / Published: 19 September 2023

Abstract

:
The Qinghai-Tibet Plateau (TP) is susceptible to climate change and human activities, which brought about drastic alterations in vegetation on the plateau. However, the trends and driving mechanisms of vegetation changes remain unclear. Therefore, the normalized difference vegetation index (NDVI) was used to analyze the spatiotemporal distribution of vegetation and the consistency of dynamic trends in the TP from 2000 to 2020 in this study. The independent contributions and interactive factors of natural and human activities on vegetation changes were investigated through the Geodetector model. The drivers of vegetation under different dry–wet zones and precipitation gradients were quantitatively separated, and the internal mechanisms of vegetation changes were discussed from multiple perspectives. The results showed that from 2000 to 2020, the NDVI had an overall increasing trend, with an increasing rate of 0.0027 a−1, and the spatial pattern was different, increasing gradually from the northwest to the southeast. Consistent improvement occurred in the central and southeastern parts of the TP, while the western and northern parts consistently deteriorated. The annual mean precipitation had the greatest explanatory power for vegetation changes (0.781). The explanatory power of the integrated effects between two factors was greater than that of individual factors. The integrated effects between annual mean precipitation and other driving factors had the strongest explanatory power on vegetation variations. The driving mechanisms of vegetation dynamics varied among different dry–wet zones, and the vegetation growth was more sensitive to the response of precipitation in arid and semi-arid climate zones. This study enhances our understanding of the intrinsic mechanisms of vegetation changes on the plateau, which can provide a reference for ecological conservation, and has implications for further prediction and assessment of vegetation ecosystem stability.

1. Introduction

Vegetation evolution and its driving mechanisms are one of the research focuses under a changing climate [1,2]. As the most important component of terrestrial ecosystems, vegetation has an important impact on retaining soil moisture, preserving biodiversity, and maintaining ecological balance [3]. Moreover, it is recognized as a highly responsive indicator that reflects how ecosystems react to both climate change and man-made activities [4]. Therefore, exploring the vegetation changes and their driving mechanisms is crucial for making effective ecological conservation policies [5].
High-altitude regions are more sensitive to climate change than lower altitude regions due to the fragility and irreversibility of their ecosystems [6,7]. Vegetation changes on the Qinghai-Tibetan Plateau (TP), located at high altitudes, have attracted great attention [8,9]. The vegetation plays an integral role in providing rich ecosystem services and sustaining the ecological stability in the TP region. Therefore, vegetation changes and their driving mechanisms in the TP region must be comprehensively evaluated. Since the 1980s, the TP region has experienced a more rapid warming rate compared to the global average. Meanwhile, vegetation changes indicated an overall improvement and local degradation trends. There are clear distinctions in driving mechanisms for vegetation dynamics in various areas [7]. Different vegetation types are influenced by different hydrothermal conditions, such as alpine meadows by temperature and alpine grasslands influenced by a combination of precipitation and temperature [10]. In addition, alpine shrublands were also regulated by climate factors [11]. Hence, it is crucial to investigate the vegetation evolution in different sub-regions.
The rapid advancement of remote sensing technology has facilitated precise monitoring of vegetation evolution at large spatial scales [12,13]. Previous researchers have mostly used remote-sensing-based vegetation index datasets for analyzing large-scale vegetation evolution, among which the Normalized Difference Vegetation Index (NDVI) is widely used. This dataset can effectively reflect vegetation evolution, and monitor vegetation and other ecological environments. Currently, NDVI datasets can be utilized to monitor global-, national-, and regional-scale vegetation; land use change monitoring; and net primary productivity estimation [14,15]. Long-time series NDVI data can help to make a scientific assessment of the vegetation changes.
Vegetation changes play a crucial role in reflecting changes in the entire ecosystem. Climate change has the potential to disrupt vegetation evolution, thus appealing to continuous global interest [1,16]. As surface organisms, natural factors directly affect the plants’ growth. These factors are sunlight, elevation, and soil environment [17,18]. They are the basic natural forces that determine the growth of vegetation [19]. Existing research focusing on the driving forces of vegetation changes has primarily concentrated on analyzing both temperature and precipitation [20,21]. Precipitation can regulate vegetation productivity, and its fluctuations can effectively explain the NDVI changes [22,23]. Temperature directly affects the photosynthesis, evaporation, and phenology of plants, thus affecting vegetation changes [24]. Additionally, factors of natural and man-made activities affect vegetation changes, such as intensive human activities, road construction, and ecological planning. The grazing also affects control vegetation changes [25,26,27,28]. Extensive human activities have caused environmental issues, including biodiversity loss, soil erosion, and vegetation degradation [29,30]. Some scholars believe that in the long term, the effects of man-made activities are greater than natural factors [21]. Hence, the coupling relationships between vegetation evolution with drivers are not a simple linear relationship, but a non-linear and interactive joint influence. As such, reasonably quantifying the response of the vegetation evolution to natural factors and man-made activities remains a challenging task.
Traditional analysis methods based on linear relationships have certain limitations. Linear regression can be vulnerable to abnormal values. Residual analysis is not able to effectively differentiate between the explanation of independent and dependent factors. Correlation and regression analyses are valid only when linear relationships between vegetation evolution and drivers exist [31]. Based on assumptions about the data, these statistical methods are not only unable to reflect the integrated effects but also cannot prevent the issue of multicollinearity among drivers [32]. Therefore, traditional linear models have difficulty accurately explaining this coupled relationship. In contrast, the Geodetector model provides a simple and effective way to assess driver effects [33]. This model defies the limited assumptions of traditional statistical methods and possesses the ability to identify interactions among factors, without being encumbered by issues for multicollinearity [34]. It found successful applications in diverse fields such as soil degradation, grassland restoration, environmental pollution, etc. [35,36]. Meanwhile, the model is also often used to detect the driving mechanisms of vegetation evolution [37,38], which are an effective tool to address vegetation changes in highland ecosystems.
This paper investigates the vegetation growth changes and driving mechanisms in the TP region utilizing long-term NDVI data. The objectives of this work are to (1) analyze the spatial and temporal vegetation changes in the TP from 2000 to 2020, (2) investigate the explanatory power of vegetation changes by both natural factors and man-made activities, and (3) explore the driving mechanisms of vegetation changes under different dry–wet zones and different precipitation gradients. We attempted to investigate the differences in vegetation change mechanisms under different sub-regions and the sensitivity of highland vegetation growth to precipitation levels, thus providing corresponding references for vegetation conservation in the TP region.

2. Materials and Methods
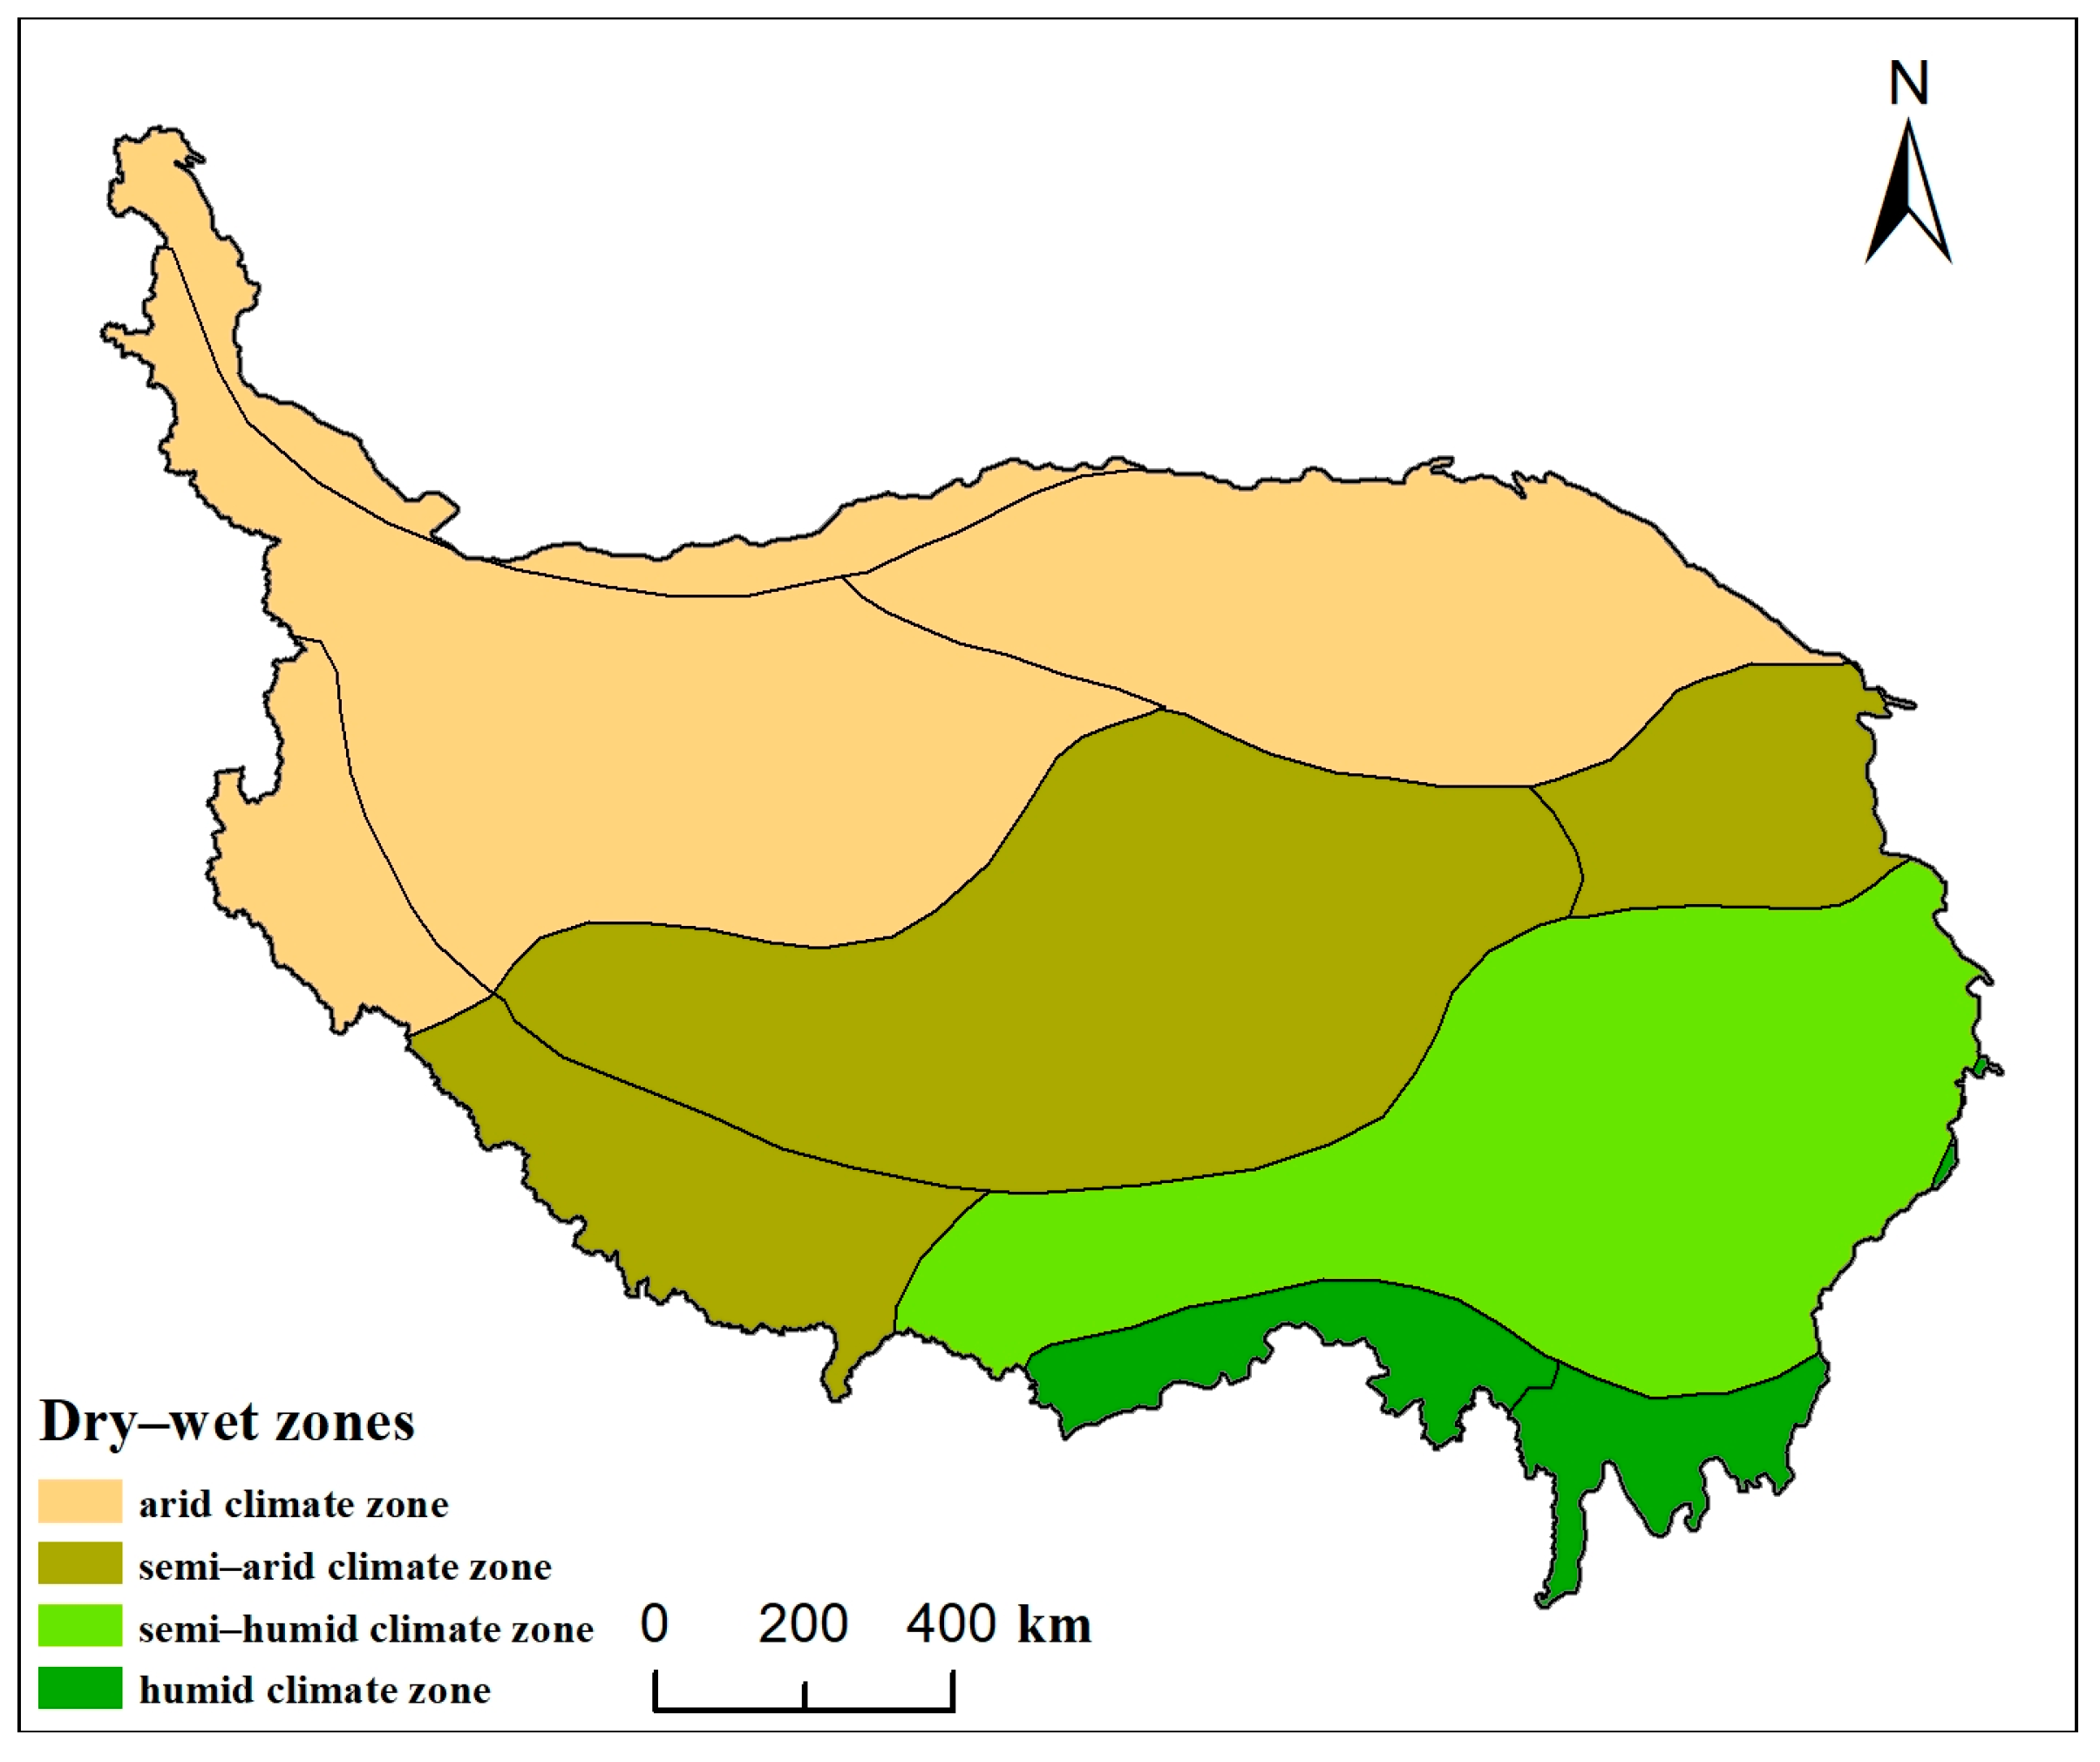
2.1. Study Area

The Qinghai-Tibetan Plateau (TP) is located in the southwest of China, with a regional range between 73°19′–104°47′ E and 26°00′–39°47′ N. It spans six provinces, namely, Xinjiang, Tibet, Gansu, Qinghai, Sichuan, and Yunnan (the People’s Republic of China) (Figure 1). The TP area is 2.61 million km2, which is about 25% of China’s land area. Most of its areas belong to arid and semi-arid zones, accounting for 73.7% of the TP area. Only some areas in the southeast are semi-humid and humid zones, accounting for 26.3% of the TP area. The average altitude of TP is approximately 4 km, and its climate type is a typical plateau climate, characterized by strong radiation, low temperature, and small annual precipitation that varies significantly in different regions, making the TP vulnerable to climate changes. Given the influence of climatic and topography, the region is rich in vegetation types with horizontal–vertical geographical differences.

2.2. Data Sources and Processing

2.2.1. Factors Selection

In this study, we chose the NDVI to be the dependent variable for analyzing vegetation variations. Environmental changes and man-made activities influence NDVI changes, and vegetation growth is sensitive to soil conditions and complex topography [39,40,41,42,43]. Therefore, we combined the characteristics of the TP region, referred to the previous research results, and constructed the index system considering the accessibility and availability of data, as shown in Table 1 [44,45,46,47]. We selected 15 influencing factors from climate, topography, human activities, and rivers as important explanatory variables of vegetation changes. The five climate factors, namely precipitation, temperature, sunshine, wind, and actual evaporation, are commonly used as important driving forces to explore vegetation changes. Although topography elements such as elevation, slope, and aspect, and surface elements such as vegetation, soil, and land cover type, have relatively minor impacts on vegetation growth, they are still factors that cannot be ignored when exploring vegetation changes. The distance to roads, settlements, and rivers can effectively reflect anthropogenic impacts on vegetation changes. Given the importance of rivers to vegetation growth, we treat the distance to rivers as a separate category as the impact factor.

2.2.2. Data Sources and Processing

The NDVI data based on SPOT VEGETATION were acquired from the Resource and Environment Data Cloud Platform of the Chinese Academy of Sciences (www.resdc.cn) (accessed on 10 September 2022). The original data were masked and projected to obtain the NDVI dataset in the TP area. The maximum value synthesis method (MVC) was used to process the NDVI dataset. The MVC was employed to reduce or further minimize the effects of cloud cover and atmosphere on the remotely sensed images [48].
The data sources related to the independent variables are described as follows: annual mean precipitation (X1), annual mean temperature (X2), sunshine duration (X3), mean wind speed (X4), and actual evaporation (X5). These were obtained from the National Centre for Earth System Science Data Acquired (http://www.geodata.cn) (accessed on 10 December 2022). Digital elevation model (DEM) data was obtained from the geospatial data cloud (http://www.gscloud.cn/) (accessed on 10 December 2022). The 30 m resolution DEM data of the TP (X6) was obtained by stitching, format conversion, and cropping. The slope (X7) and aspect (X8) data were extracted using the 3D analysis module in the ArcGIS 10.8 software. Population density (X9) data were provided through WorldPop (https://hub.worldpop.org/geodata/listing?id=76) (accessed on 15 December 2022). The data of the settlement were obtained from the Baidu LBS open platform through Place API V2.0. Road and river data were derived from OpenStreetMap (https://www.openstreetmap.org/) (accessed on 15 December 2022). Distance from the road (X10), distance from the settlement (X11), and distance from the river (X12) were calculated by the immediate neighborhood analysis tool in ArcGIS software. Vegetation types (X13), soil types (X14), landform types (X15), and the dry–wet zone data (Figure 1) were obtained from the Data Centre for Resource and Environmental Science (https://www.resdc.cn/) (accessed on 20 December 2022). The class space distribution of each driver is shown in Figure 2. Auxiliary data, such as vector boundaries, were obtained from the basic geographic information data provided by the National Basic Geographic Information Centre (http://www.ngcc.cn/) (accessed on 15 September 2022).
The acquired data were constructed as a geospatial database in ArcGIS 10.8 software, and the coordinate system was unified using WGS-1984. A regular grid of 10 km × 10 km was created using the create fishnet tool of ArcGIS 10.8 software. The grid covers the TP region with a total of 24,182 units as the base unit for subsequent analysis. The NDVI was divided into five categories [49] (Table 2). We used the equal interval classification method to rank continuous variables to fulfill the input requirements of the Geodetector [50,51]. The continuous variables (X1, X2, X3, X4, X5, X6, X7, X9, X10, X11, X12) were divided into 10 categories. The independent variable X8 was classified into nine categories concerning the existing classification standards [38,52]: flat slope, north slope, northeast slope, east slope, southeast slope, south slope, southwest slope, west slope, and northwest slope. The classification of X13, X14, and X15 is shown in Figure 2m–o, which were classified into 12, 13, and 7 categories, respectively.

2.3. Methods

2.3.1. Theil–Sen Trend Analysis and Mann–Kendall Significance Test

The Theil–Sen trend analysis combined with the Mann–Kendall test method can be used to determine the trend in vegetation evolution [53,54]. The MK significance test can effectively reduce the effect of outliers [55]. Sen’s slope formula is the following:
S l o p e = M e d i a n ( x j x i j i ) , j > i
where Median is the median function, and xi and xj distributions are time series values. Slope > 0 indicates an upward trend of the data, whereas Slope < 0 indicates a downward trend. Meanwhile, Slope = 0 indicates no change in the data.
The MK significance test formula is as follows:
S = i = 1 n 1 j = i + 1 n sgn ( x j x i )
sgn ( x j x i ) = { 1 ,   x j x i > 0 0 ,   x j x i = 0 1 ,   x j x i < 0
Z = { S 1 V a r ( S ) ,   i f   S > 0 0 ,   i f   S = 0 S 1 V a r ( S ) ,   i f   S < 0
V a r ( S ) = n ( n 1 ) ( 2 n + 5 ) 18
where S is the value of the standardized statistic, i, j denotes the time series, n denotes the length of the time series (n = 21), and sgn is the sign function. The Z value is used for the trend test, when |Z| > Z1−α/2, the NDVI series shows a significant change. When Z > 0, it indicates that the NDVI series has an upward trend. When Z < 0, it indicates that the NDVI series has a downward trend. α is the given confidence level, when |Z| > 1.96, it indicates that it passes the significance test at the 95% confidence level.

2.3.2. Hurst Index and R/S Analysis

The Hurst index is the main method for quantitatively describing self-similarity and long-term correlation. It is used to describe the sustainability of long-term data and is widely adopted in environmental science, ecology, and geology [56,57,58,59]. The Hurst index can be calculated using many methods. This study used the rescaled polar difference analysis (R/S) with more reasonable results [60]. The specific formula is as follows:
X ( t ) = 1 t i = 1 t X ( i )
X ( i , t ) = i = 1 t ( X ( t ) X ( i ) )
R ( t ) = max X ( i , t ) min X ( i , t )
S ( t ) = 1 t i = 1 t ( X ( i ) X ( t ) ) 2
R ( t ) S ( t ) = ( C t ) H H = ( ln R ( t ) ln S ( t ) ) ln C t
where X(t) is the mean series, X(i,t) is the cumulative deviation, R(t) is the polar difference, and S(t) is the standard deviation. H is the Hurst index, taking values in the range of [0–1]. If H < 0.5, the time series has inverse persistence, which also means that the future trend of the data is opposite to the past trend. As H approaches 0, the inverse persistence becomes stronger. If H = 0.5, the time series is randomly varying. If H > 0.5, the time series is continuous, in which the future trend of the data is consistent with the past trend.
To obtain the dual information of the vegetation changes trend and persistence test, the results of Equations (1)–(5) are superimposed with the Hurst index [61] to produce Table 3.

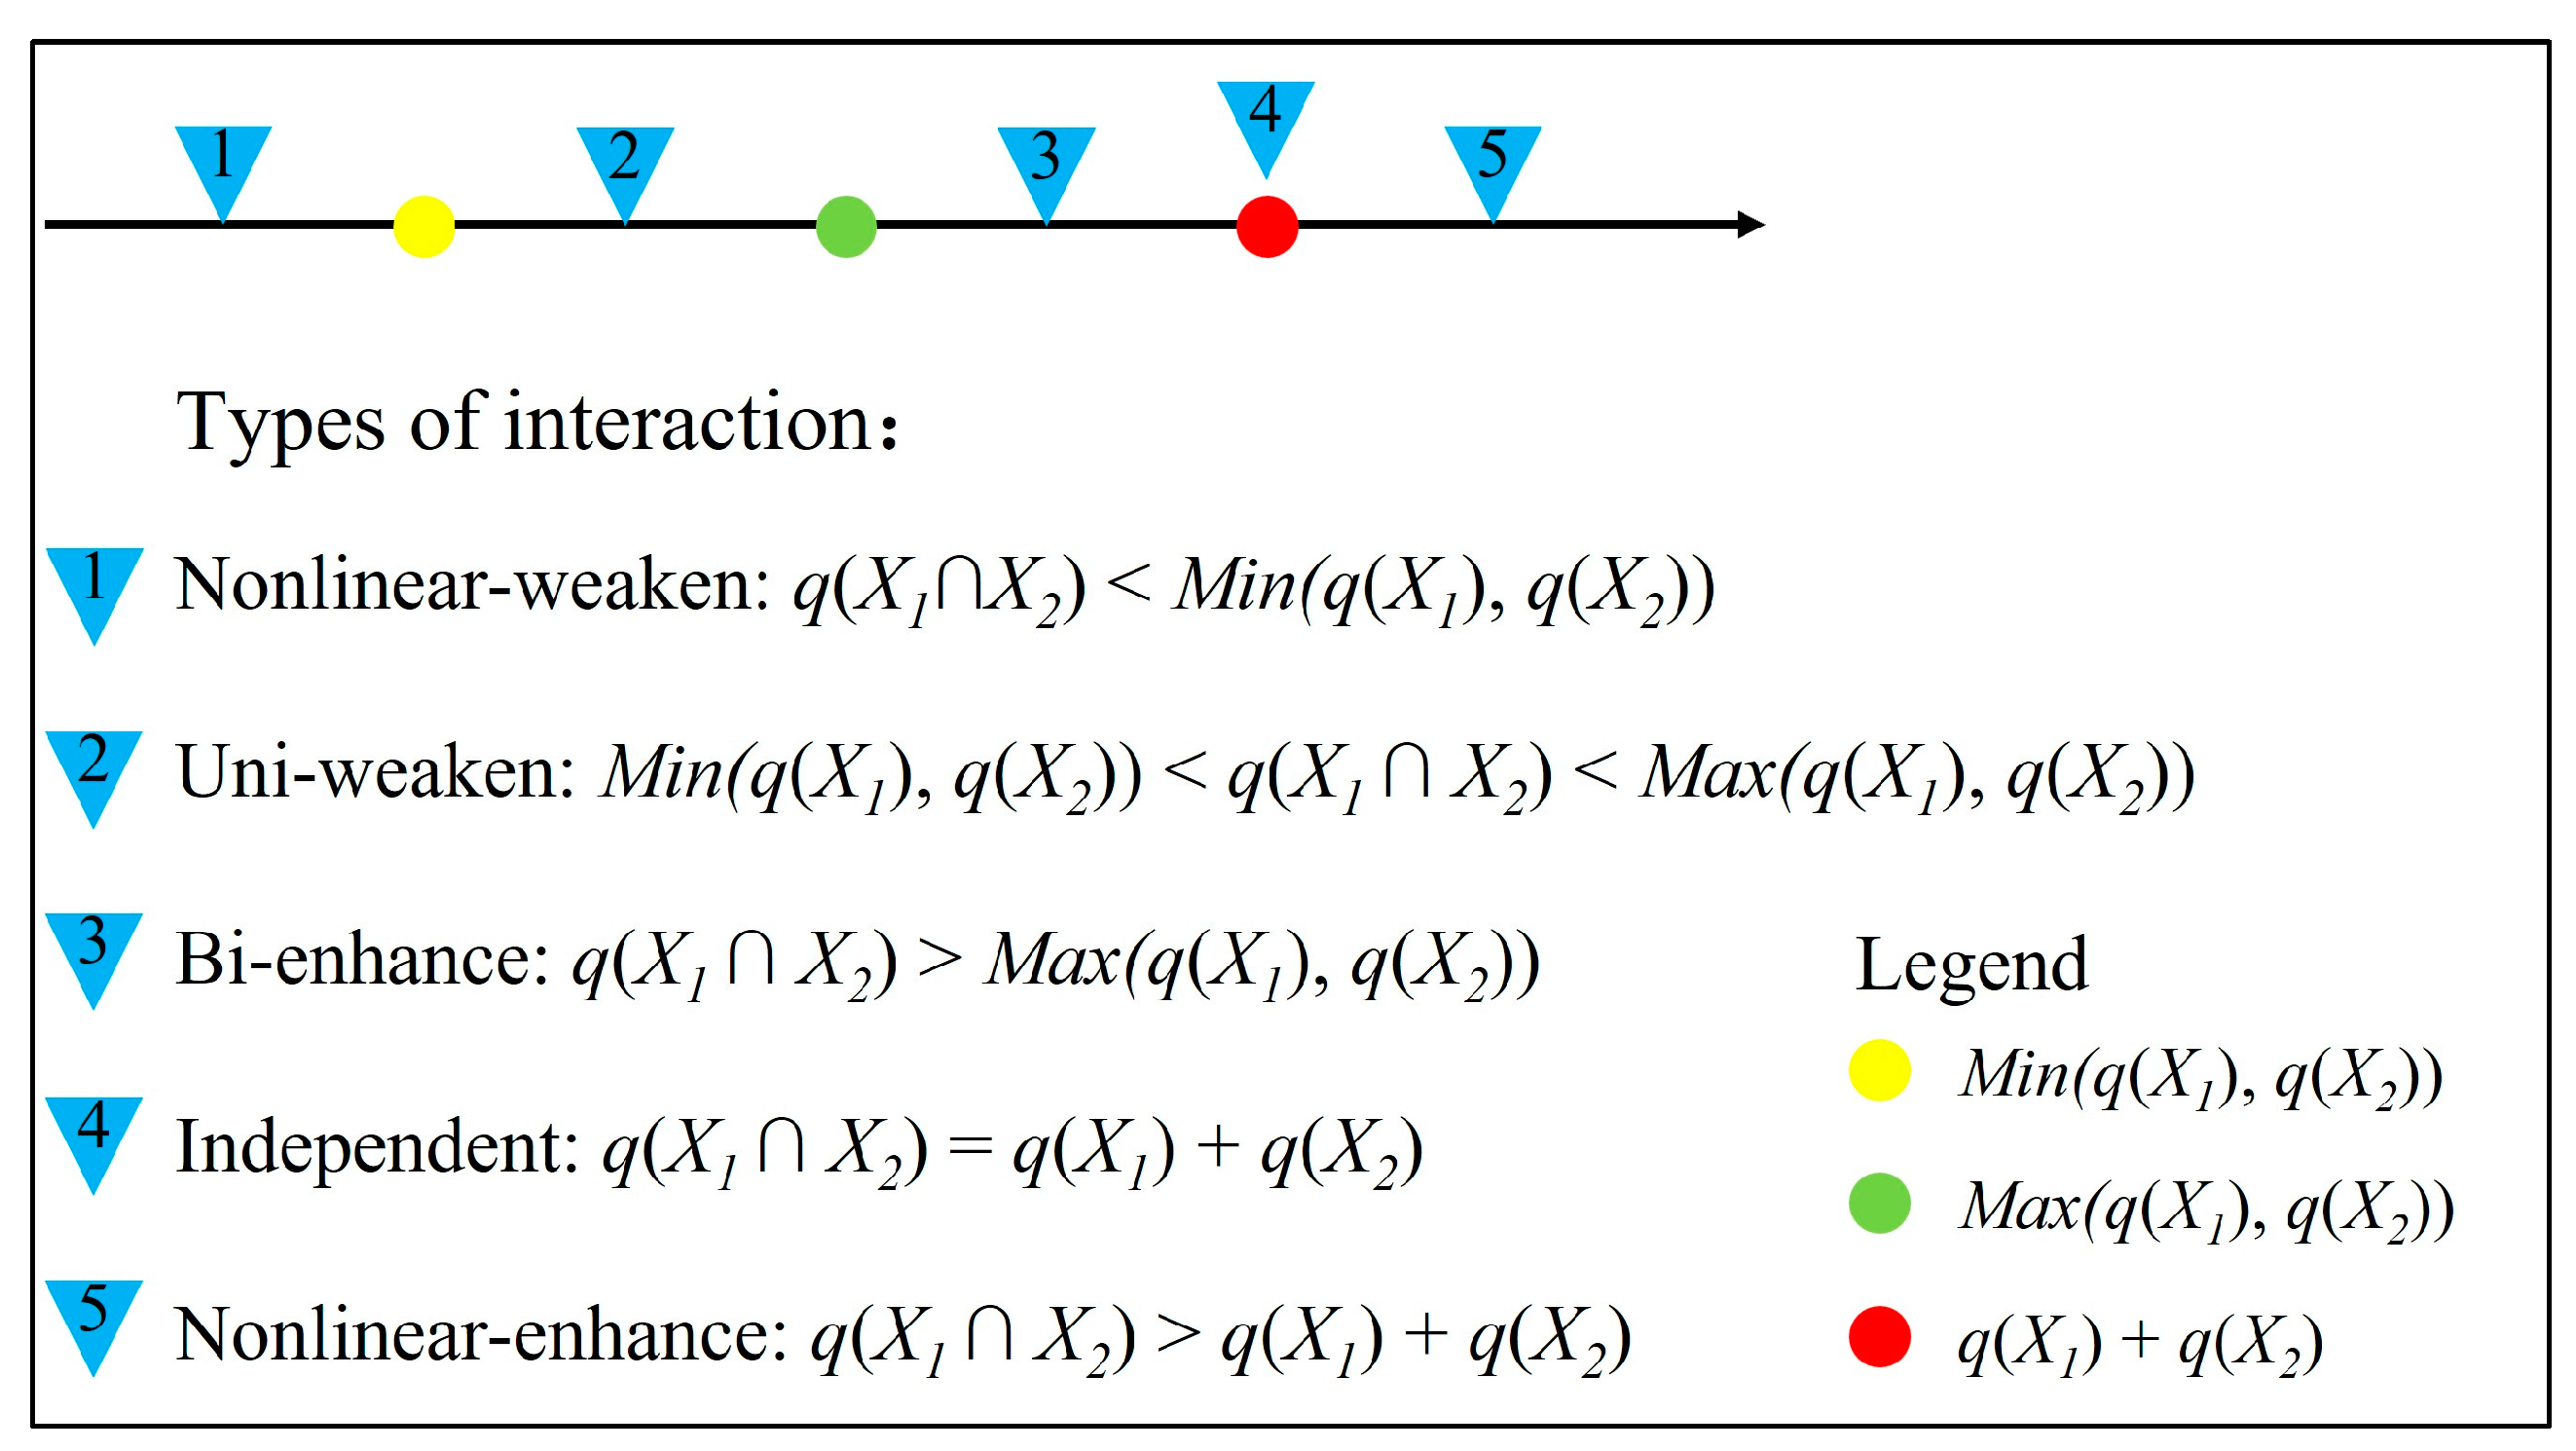
2.3.3. Geodetector Model

The Geodetector is a method for detecting spatial non-homogeneity and quantifying the impact of drivers on spatial statistics. The idea of the method is that X and Y are similar in spatial distribution if some independent variable X has a strong explanatory power on the dependent variable Y [33]. In this study, we used factor detectors and interaction detectors to explore the driver force of the dependent variable pairs on the NDVI in Table 1.
The factor detector is utilized to quantify the extent of the detection factor and explains the spatial heterogeneity of the dependent variable.
q = 1 1 N σ 2 h = 1 L N h σ h 2
where h is the stratification of factors X1, …, Xn. Nh and N are the numbers of units in layer h and the whole area, respectively. σh2 and σ2 are the variances of the Y value of layer h and the whole area. q is the influence value of the factor and takes a range of [0–1]. A larger value of q indicates a stronger explanatory power of X on Y, while a smaller value of q has a weaker explanatory power.
The interaction detector is used to detect the explanatory power of the interactions of different independent variables on the dependent variable. It determines whether the explanatory power of the two-factor interaction on the dependent variable increases or decreases. Interactions can occur in several ways as in Figure 3.

3. Results

3.1. Spatial and Temporal Variability of the NDVI in the Qinghai-Tibet Plateau

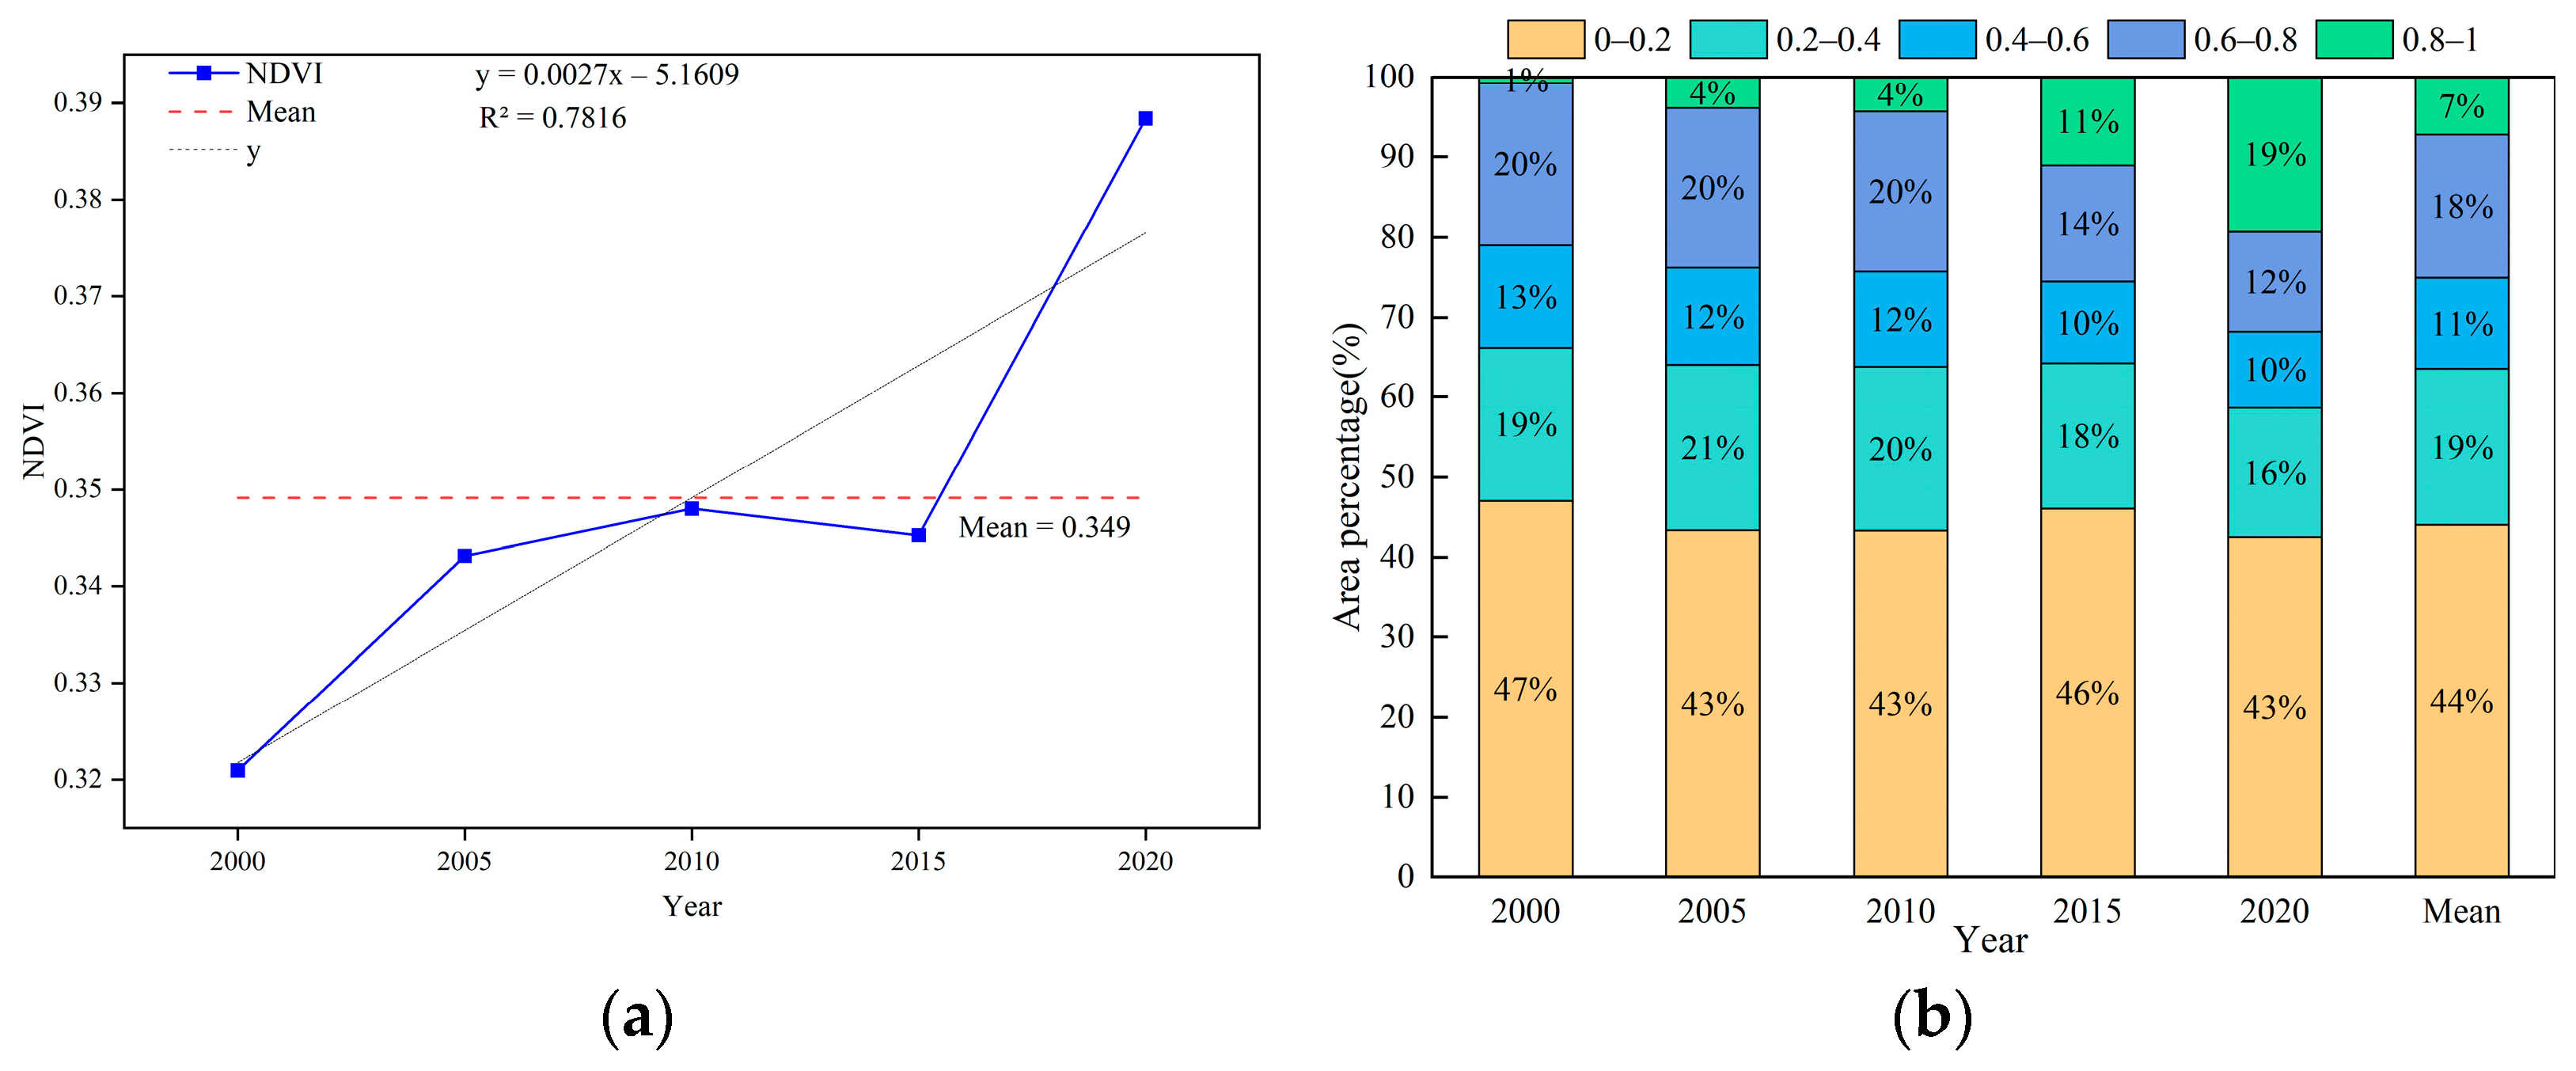
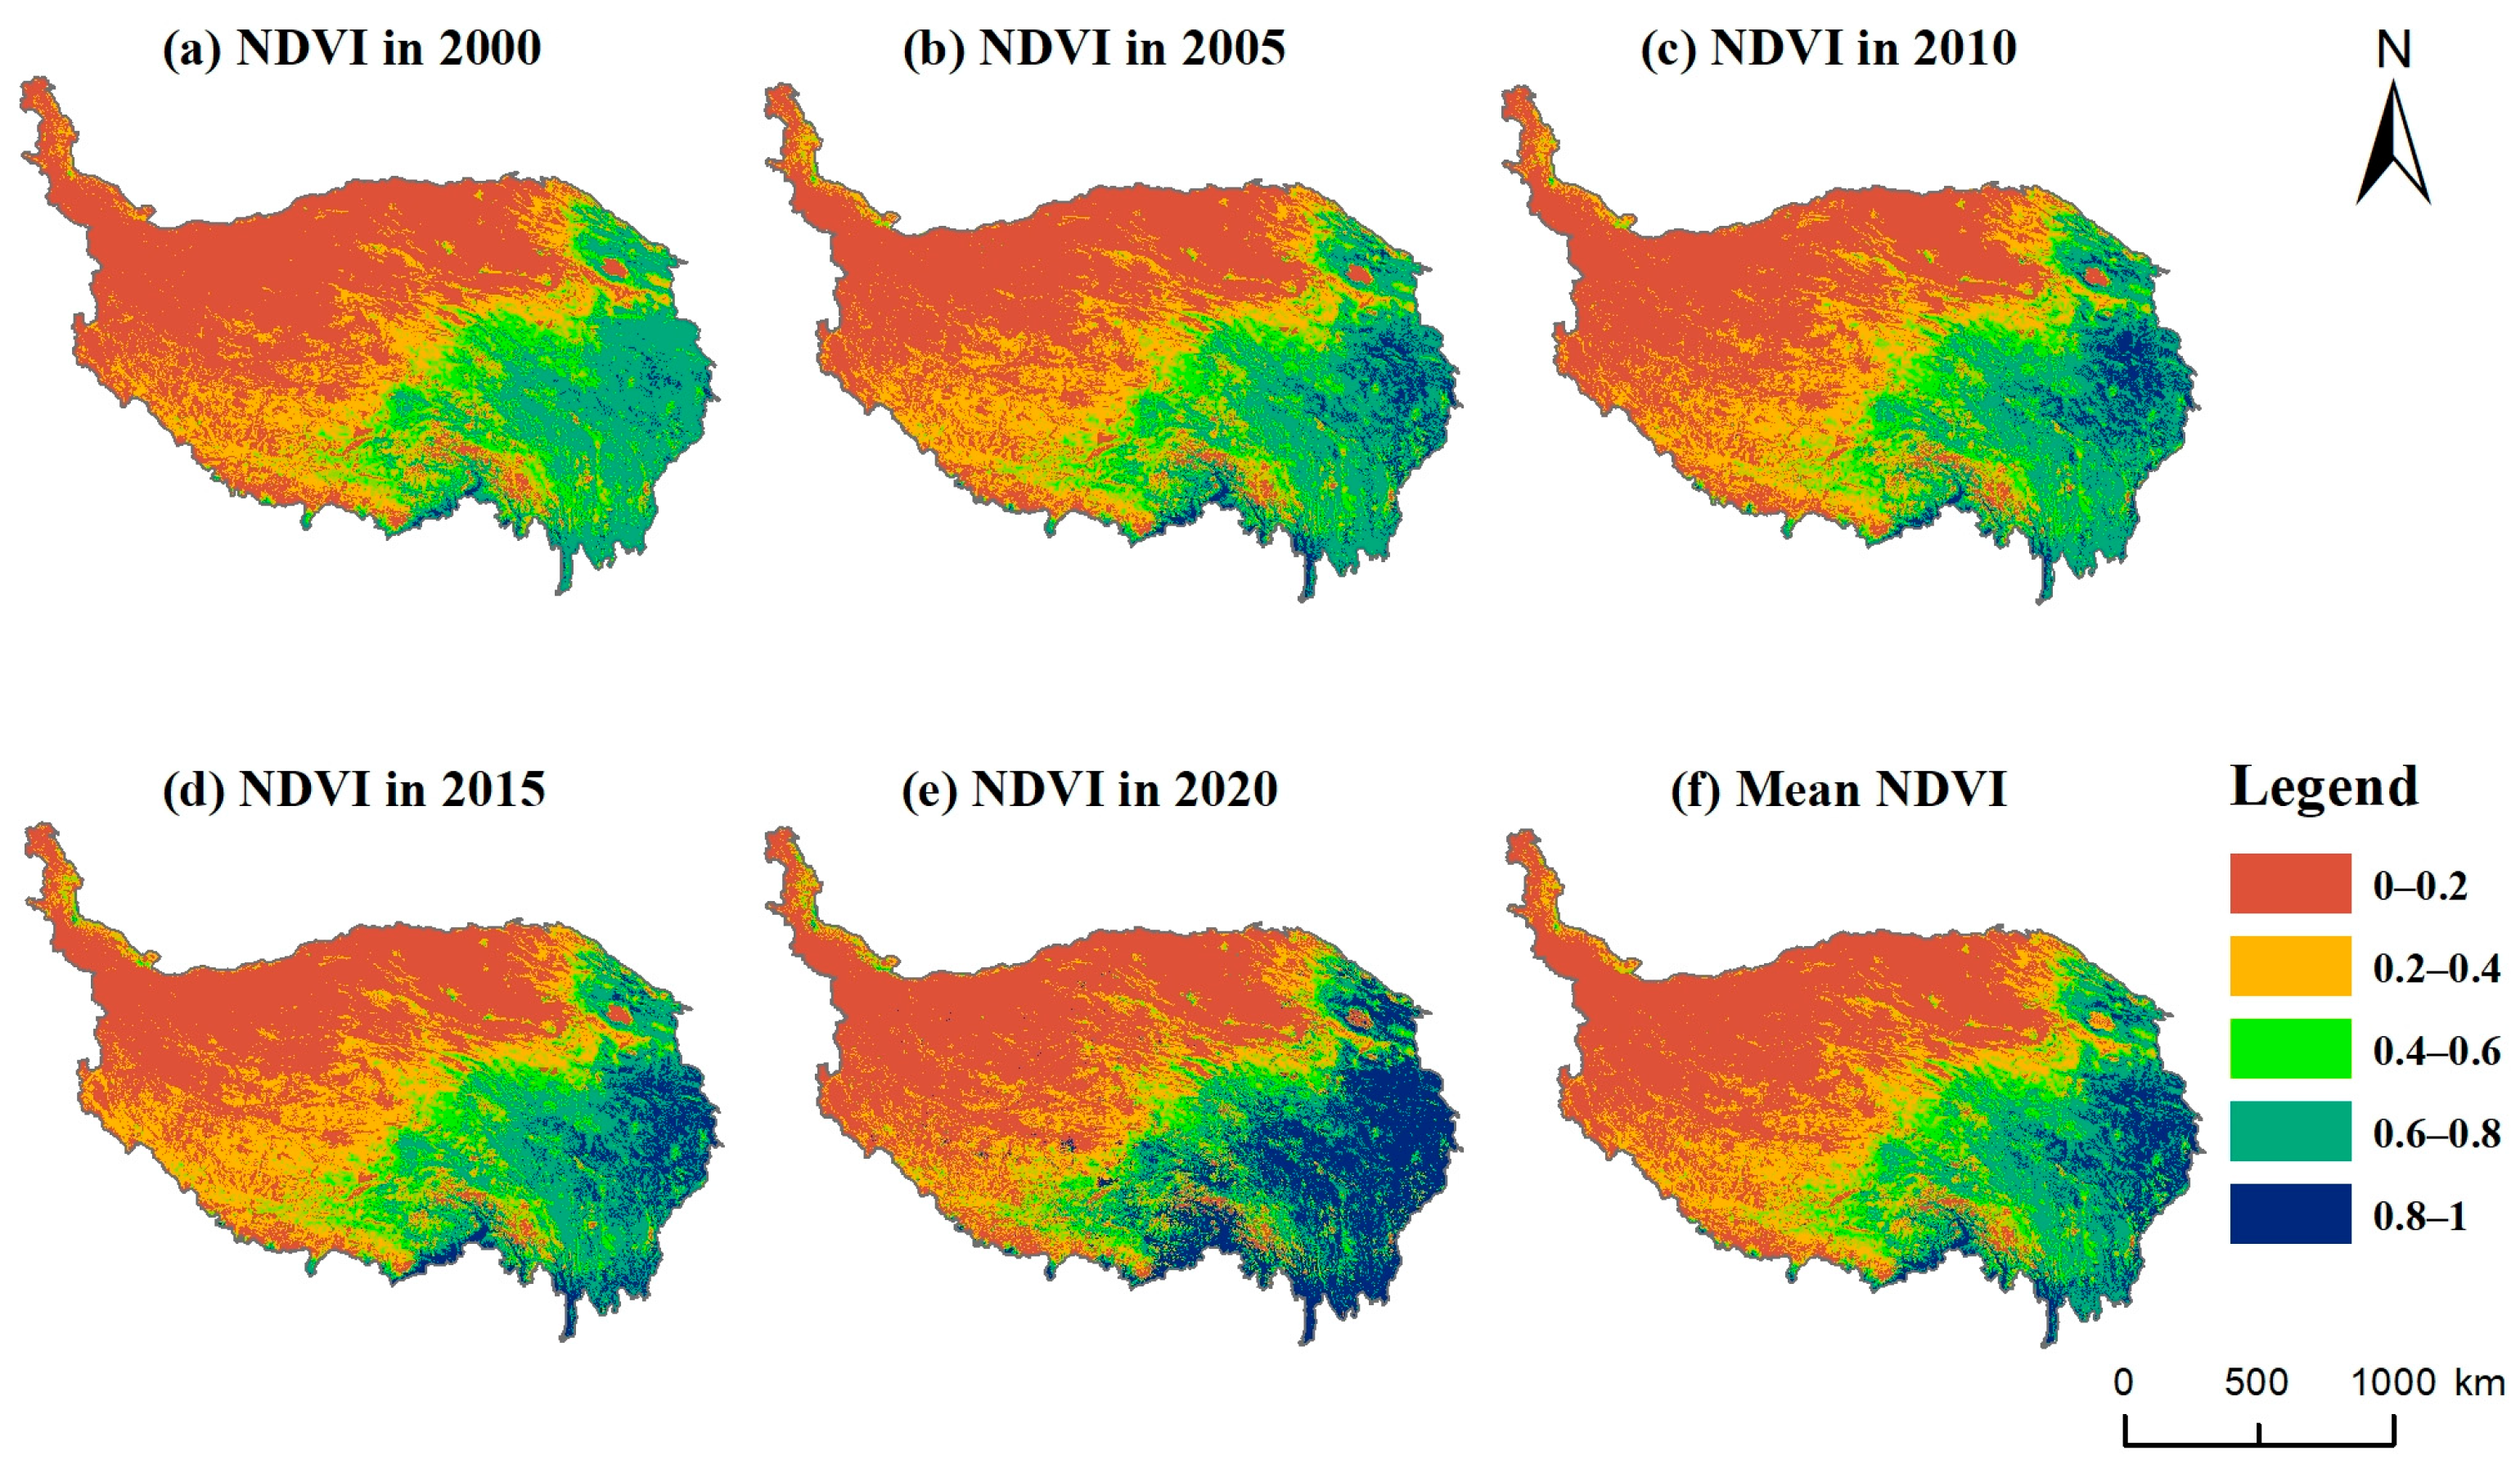
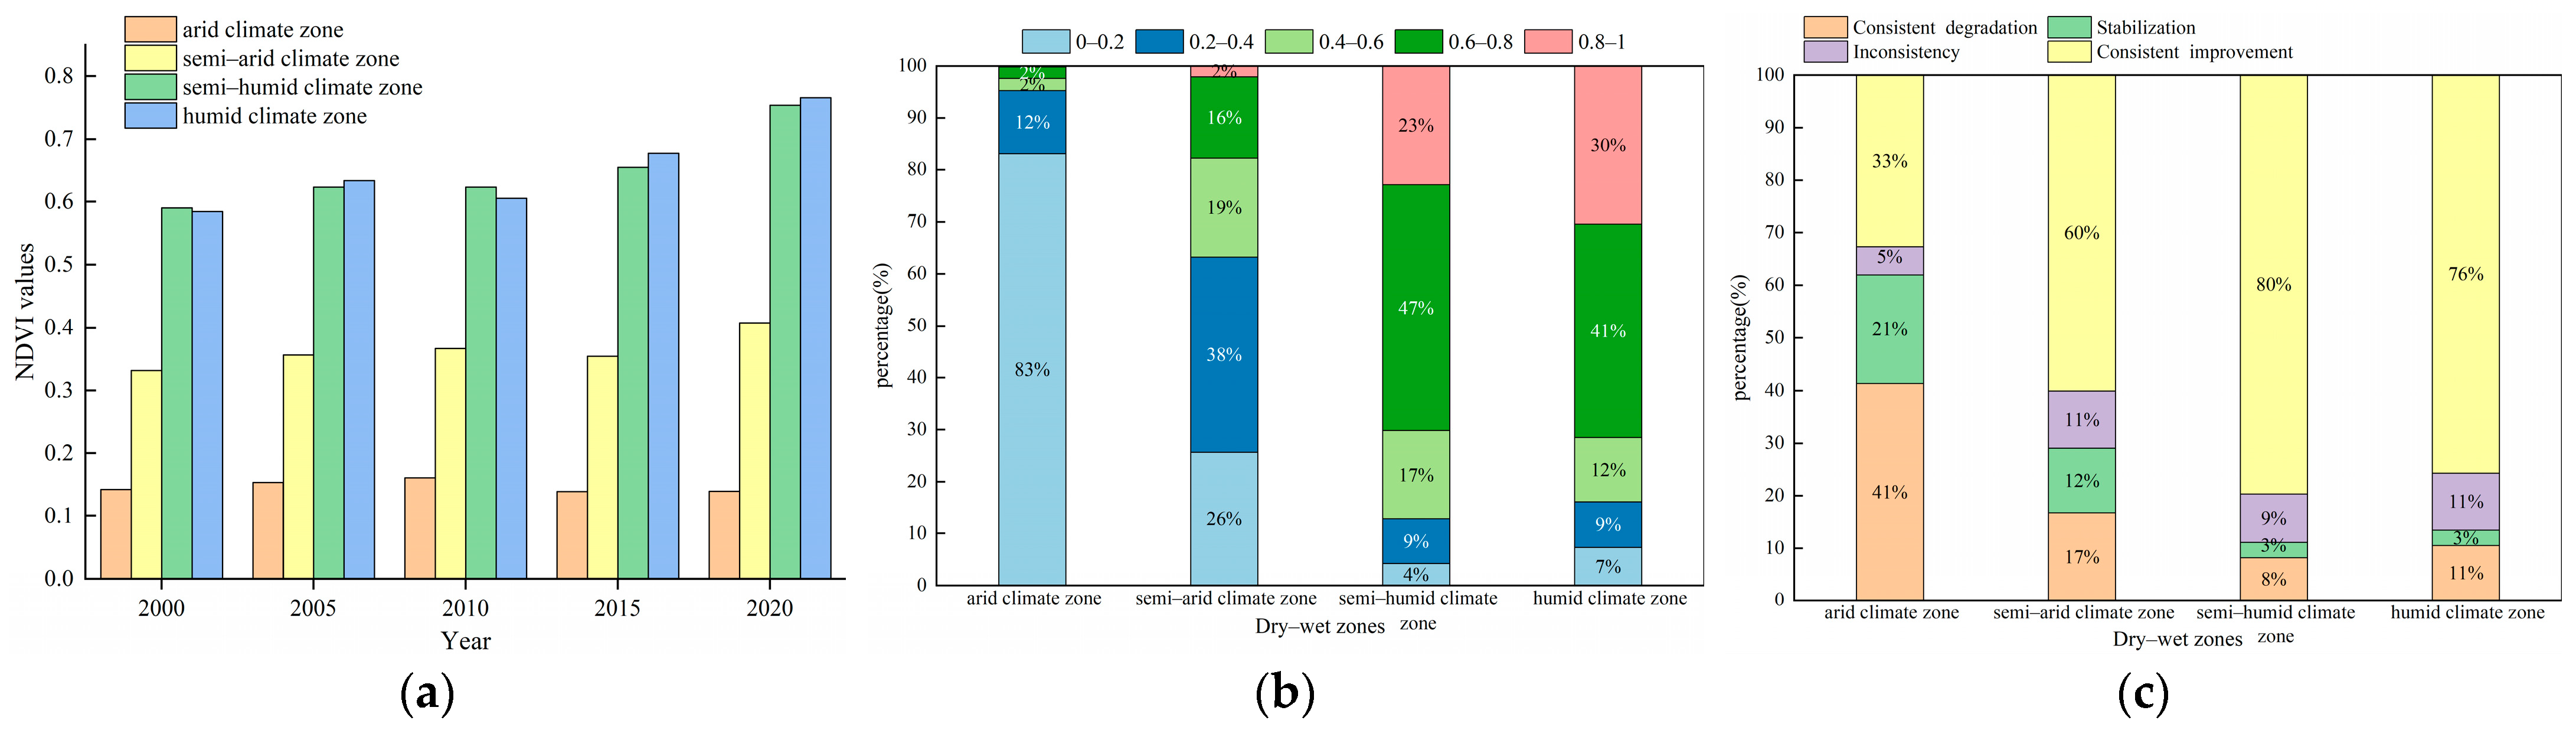
3.1.1. Spatial and Temporal Evolution Characteristics of the NDVI

The overall trend of the NDVI in the TP region has fluctuated and increased during the past 21 years, with a range of 0.321–0.388, a mean value of 0.349 (Figure 4a), and an overall growth rate of 0.0027 a−1. The evolution of the NDVI was characterized by phases in the TP, which could be divided into three phases: the rising phase (2000–2010, with a growth rate of 0.0135 a−1), the falling phase (2010–2015, with a decline rate of −0.0028 a−1), and the rising phase (2015–2020, with a growth rate of 0.0432 a−1). The spatial distribution of the NDVI varied significantly in different years, displaying a gradually increasing trend from northwest to southeast (Figure 5), and the distribution pattern was relatively stable in the TP.
We displayed the percentage of areas classified by the NDVI in different years (Figure 4b). Combined with Table 2, the area of class 1 (0–0.2), class 2 (0.2–0.4), class 3 (0.4–0.6), class 4 (0.6–0.8), and class 5 (0.8–1) accounted for 44%, 19%, 11%, 18%, and 7% of the TP area in the 2000–2020 NDVI mean, respectively. Among them, the area of bare soil vegetation is the largest percentage, and the area with NDVI values greater than 0.6 only accounted for 25% of the TP area, which demonstrated that the vegetation cover was relatively poor in the TP.
Based on the NDVI changes in different years, the area covered by high vegetation experienced the greatest change, increasing from 1% in 2000 to 19% in 2020. Meanwhile, the rest of the vegetation classification decreased slightly, but the general trend remained stable. It showed that high vegetation was the dominant classification of the NDVI for the TP region. Combined with Figure 5, the increased high vegetation type was mostly transformed from relatively high vegetation.

3.1.2. Consistency of Trend in Vegetation Dynamics

The Sen–MK method was employed to simulate the trend of the NDVI in the TP, reflecting the spatial characteristics of NDVI changes (Figure 6a). The vegetation improvement area accounted for 59.41% of the TP area, the degradation area accounted for 26.78% of the TP area, and the rest were stable and unchanged areas. The vegetation improvement area was about 2.22 times more than the degradation area, and the overall improvement was predominant. Specifically, areas with significant improvement and slight improvement accounted for 41.65% and 17.76% of the TP area, respectively. Only 12.90% and 13.89% of the areas had significant and slight degradation, respectively. These values indicated that the vegetation changes trend had generally developed in a positive direction in the TP. The improvement areas were mainly distributed in the central and eastern parts of the TP. The degradation areas were mainly distributed in the northwestern region of the TP. Figure 6b shows the Hurst index value, which was used to predict future vegetation growth trends. Consistent changing areas of vegetation accounted for 88.34% of the TP area, while inconsistent changing areas accounted for 11.66% of the TP area.
To investigate the sustainability of vegetation dynamics trends and future development trends, the results of the Sen–MK test and Hurst index were overlaid and analyzed by ArcGIS 10.8 software. The results are shown in Figure 6c. Combined with Table 3, 77.34% of the vegetation area is consistent changes, of which 24.54% and 52.80% were consistent degradation and consistent improvement, respectively. The consistent improvement areas were mainly concentrated in the central and southeastern part of the TP, and the consistent degradation areas were mainly concentrated in the northwest part of the TP, similar to the changing trend of the NDVI in Figure 6a. The inconsistent areas accounted for 8.76% of the TP area and were mostly scattered in the central part of the TP. The stable or non-vegetation areas accounted for 13.91% of the TP area, which was mainly non-vegetation and non-water areas. Overall, the vegetation in the TP area was mostly in a state of consistent changes. Surprisingly, 8.76% of inconsistent areas were still likely to undergo inconsistent changes in the future despite the upward trend of vegetation status from 2000 to 2020 in the TP.
To have a deeper understanding of the evolution status of different vegetation types in the TP, the NDVI area share of different classifications according to different vegetation types was counted (Figure 7a). Combined with Table 2, Marsh, Grassland, BF, MF, and CF were mainly distributed in the high vegetation area. AL, Steppe, Desert, and Other were mainly distributed in the bare soil vegetation area, among which 82% of the Desert surface were distributed in this area.
Figure 7b shows the results of the evolutionary trend for different vegetation types. The vegetation types dominated by consistent improvement were AR, Marsh, Meadow, Grassland, Scrub, BF, MF, and CF. MF had overwhelmingly consistent improvement, which accounted for as much as 89%. The vegetation types that were mainly consistent degradation were AL, Desert, and Other. Other had overwhelmingly consistent degradation, which accounted for 67% of the area. The Steppe-type vegetation changes state was mainly stable, which accounted for 41%. The share of inconsistency was not dominant in any of the different vegetation types, which indirectly confirmed that the future of the vegetation changes pattern will remain relatively stable in the TP. Forest soils can store large amounts of water and can release it over a longer period to avoid direct climatic impacts on vegetation. Meanwhile, grasslands are more vulnerable to climate change and man-made activities [62,63].

3.1.3. The Evolution Trends of Vegetation under Different Dry–Wet Zones

To explore the evolution trends of the NDVI in the TP, we combined Figure 1 with zoning statistics according to different dry–wet zones and explored the characteristics of NDVI evolution and the consistency of vegetation dynamic trends under different dry–wet zones (Figure 8). Figure 8a shows that the NDVI values generally showed humid climate zone > semi-humid climate zone > semi-arid climate zone > arid climate zone. The NDVI values of the humid climate zone and semi-humid climate zone increased significantly from 2000 to 2020, and the NDVI values of the arid climate zone and semi-arid climate zone changed relatively little. Figure 8b presents significant differences in the area of the NDVI in different dry–wet zones in the TP. The high values of the NDVI (>0.6) were mainly concentrated in the humid and semi-humid climate zones; the low values (<0.4) were mainly concentrated in the arid and semi-arid climate zones. Figure 8c demonstrates that the proportions of vegetation showing consistent improvement in the humid and semi-humid climate zones were 76% and 80%, respectively, and the proportions of consistent degradation were 11% and 8%, respectively. The proportions of consistent degradation in the arid and semi-arid climate zones were 41% and 17%, respectively. The proportions of inconsistency were 5% and 11%, respectively. Combined with Figure 6a, the arid climate zone might have been the dominant area of vegetation degradation in the TP, while the humid climate zone might have been the main area of vegetation showing local improvement. Therefore, we concluded that the vegetation evolution trend was significantly related to the dry–wet zones (i.e., precipitation).

3.2. Identification of Driving Forces

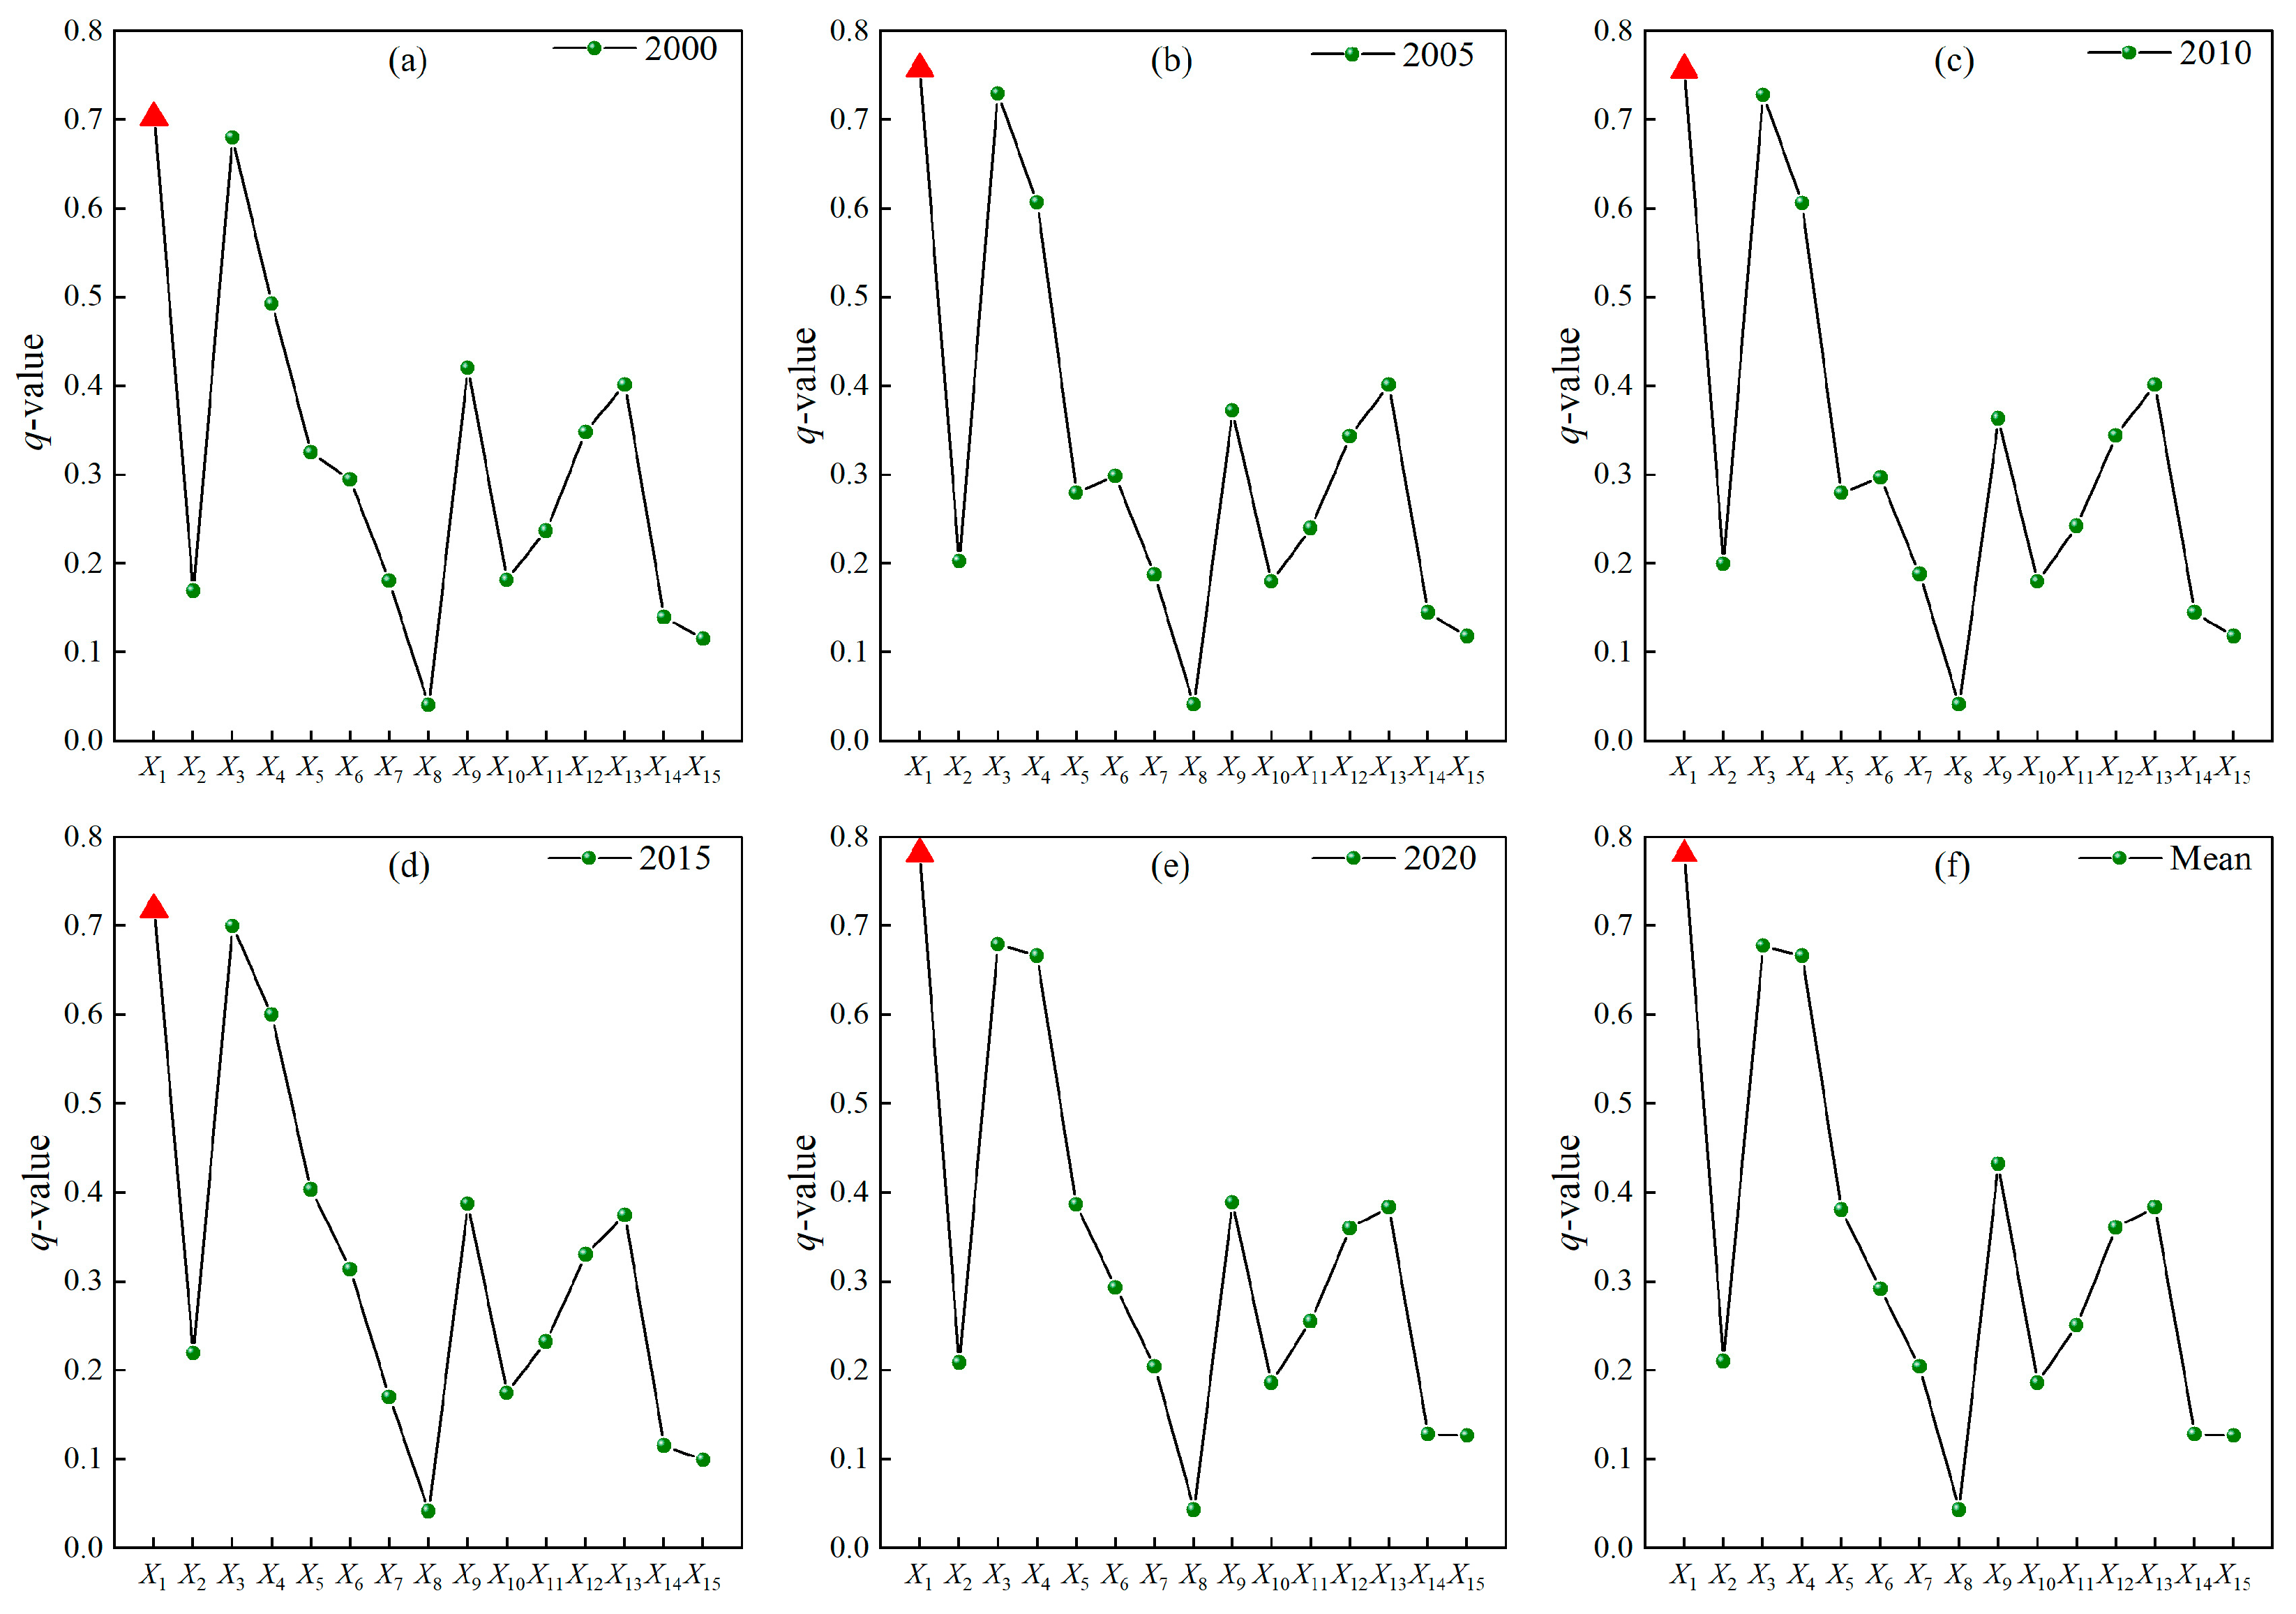
3.2.1. Independent Effects of Drivers on Vegetation Changes

To investigate the underlying drivers on vegetation changes in the TP, we detect the explanatory power of drivers in Table 1 on the NDVI through the Geodetector model. Figure 9a–e presents the results of the explanatory power of different factors of the NDVI at different time points from 2000 to 2020, and the results showed that all the drivers in the index system had differences in the NDVI. The q-values of annual mean precipitation (X1), annual mean temperature (X2), mean wind speed (X4) and actual evaporation (X5) showed an overall upward trend. Mean wind speed (X4) owned the greatest enhancement, from 0.493 in 2000 to 0.667 in 2020. In contrast, the q-value of population density (X9) showed more evident declining trends, from 0.420 in 2000 to 0.389 in 2020. The q-values of the rest of the drivers changed relatively and were mostly stable and ordered.
In terms of the average value from 2000 to 2020 (Figure 9f), the factor with the strongest explanatory power was the annual mean precipitation (X1) (q = 0.781), followed by sunshine duration (X3) > mean wind speed (X4) > population density (X9), all with q values above 0.4. The annual mean temperature (X2), actual evaporation (X5), elevation (X6), slope (X7), distance to settlement (X11), distance to the river (X12), and vegetation type (X13) had relatively significant effects on vegetation with q values ranging from 0.204 to 0.383. The q values of aspect (X8), distance to the road (X10), soil type (X14), and landform type (X15) were all less than 0.2, and these drivers had fewer effects on vegetation changes.
From the relative trends among the influencing factors, the q-values of the drivers at each time point were consistent (Figure 9a–e), and the drivers with larger q-values at each time point were annual mean precipitation (X1), sunshine duration (X3), mean wind speed (X4), and population density (X9). The q-value of annual mean precipitation (X1) was always the largest (>0.7). It indicated an evident synchronization between the influencing factors in different years. These three influencing factors have always possessed considerable influence on the vegetation growth in the TP. Compared with the results of Figure 9f, the variation trend of each factor was slightly different. However, the key influencing factor remained unchanged, and annual mean precipitation (X1) was still the highest value. Overall, annual mean precipitation (X1) was the main driver affecting vegetation growth for TP over the past 21 years.

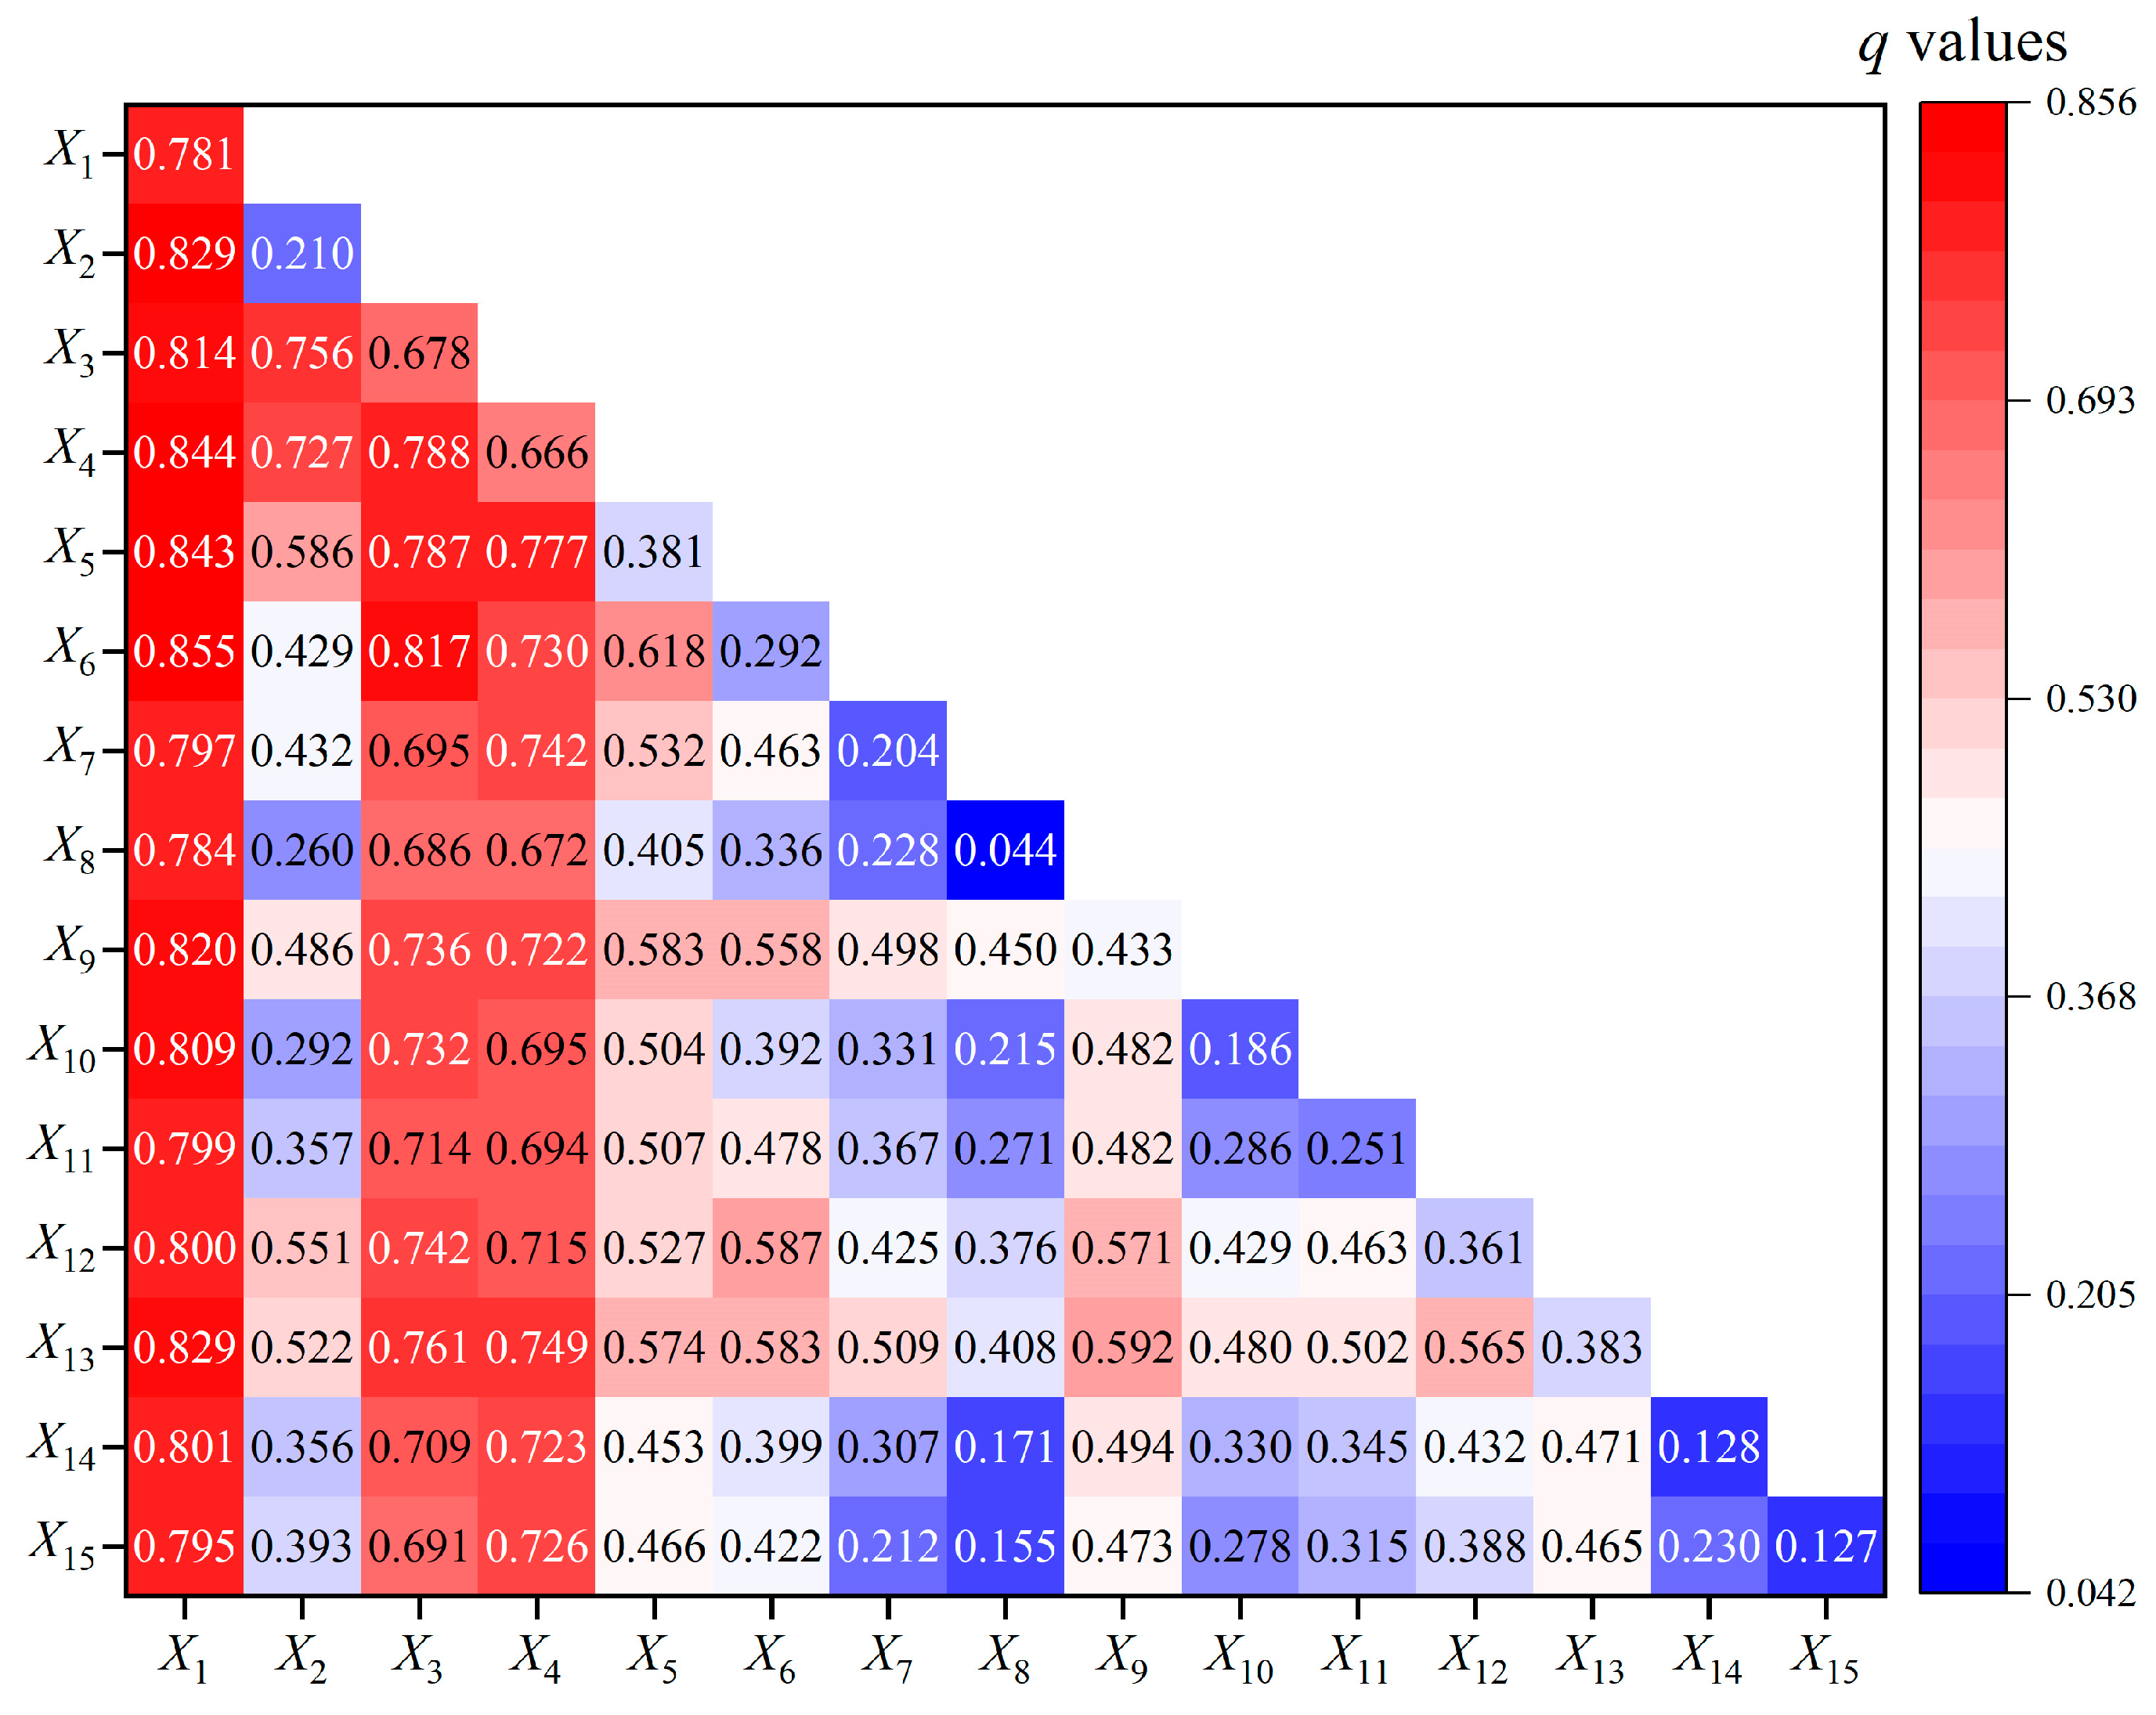
3.2.2. Integrated Effects of Different Factors on Vegetation Changes

We analyzed the interaction of drivers on vegetation changes using the interaction detector (Figure 10). It can be seen that there are interactions between the influencing factors. The strongest dominant synergistic effect of the NDVI was the interaction between annual mean precipitation (X1) and other factors, with the dominant interaction factor combinations of q(X1X6) = 0.855, q(X1X4) = 0.844 and q(X1X5) = 0.843. This outcome indicated that precipitation, wind speed, actual evaporation, and elevation could better explain the vegetation changes in the TP.
Based on Figure 3 and Figure 10, the driving forces of the integrated effects of any two drivers were stronger than that of a single driver. The interaction results were both bi-enhance and nonlinear-enhance, with most of them being bi-enhance. The vegetation changes had no combinations of nonlinear-weaken, uni-weaken, and independent effects. This result indicated that the integrated effects between the drivers were evident and all the influencing factors interacted with other factors to increase the explanatory power of NDVI evolution to different degrees. It also indicated that the influence of the drivers on the NDVI was not independent, but synergistically enhanced. It illustrated that the vegetation changes in the TP were the synergistic effect of multiple drivers, and their influence showed a strong spatial heterogeneity.

3.3. Interpretation of Vegetation System Stability

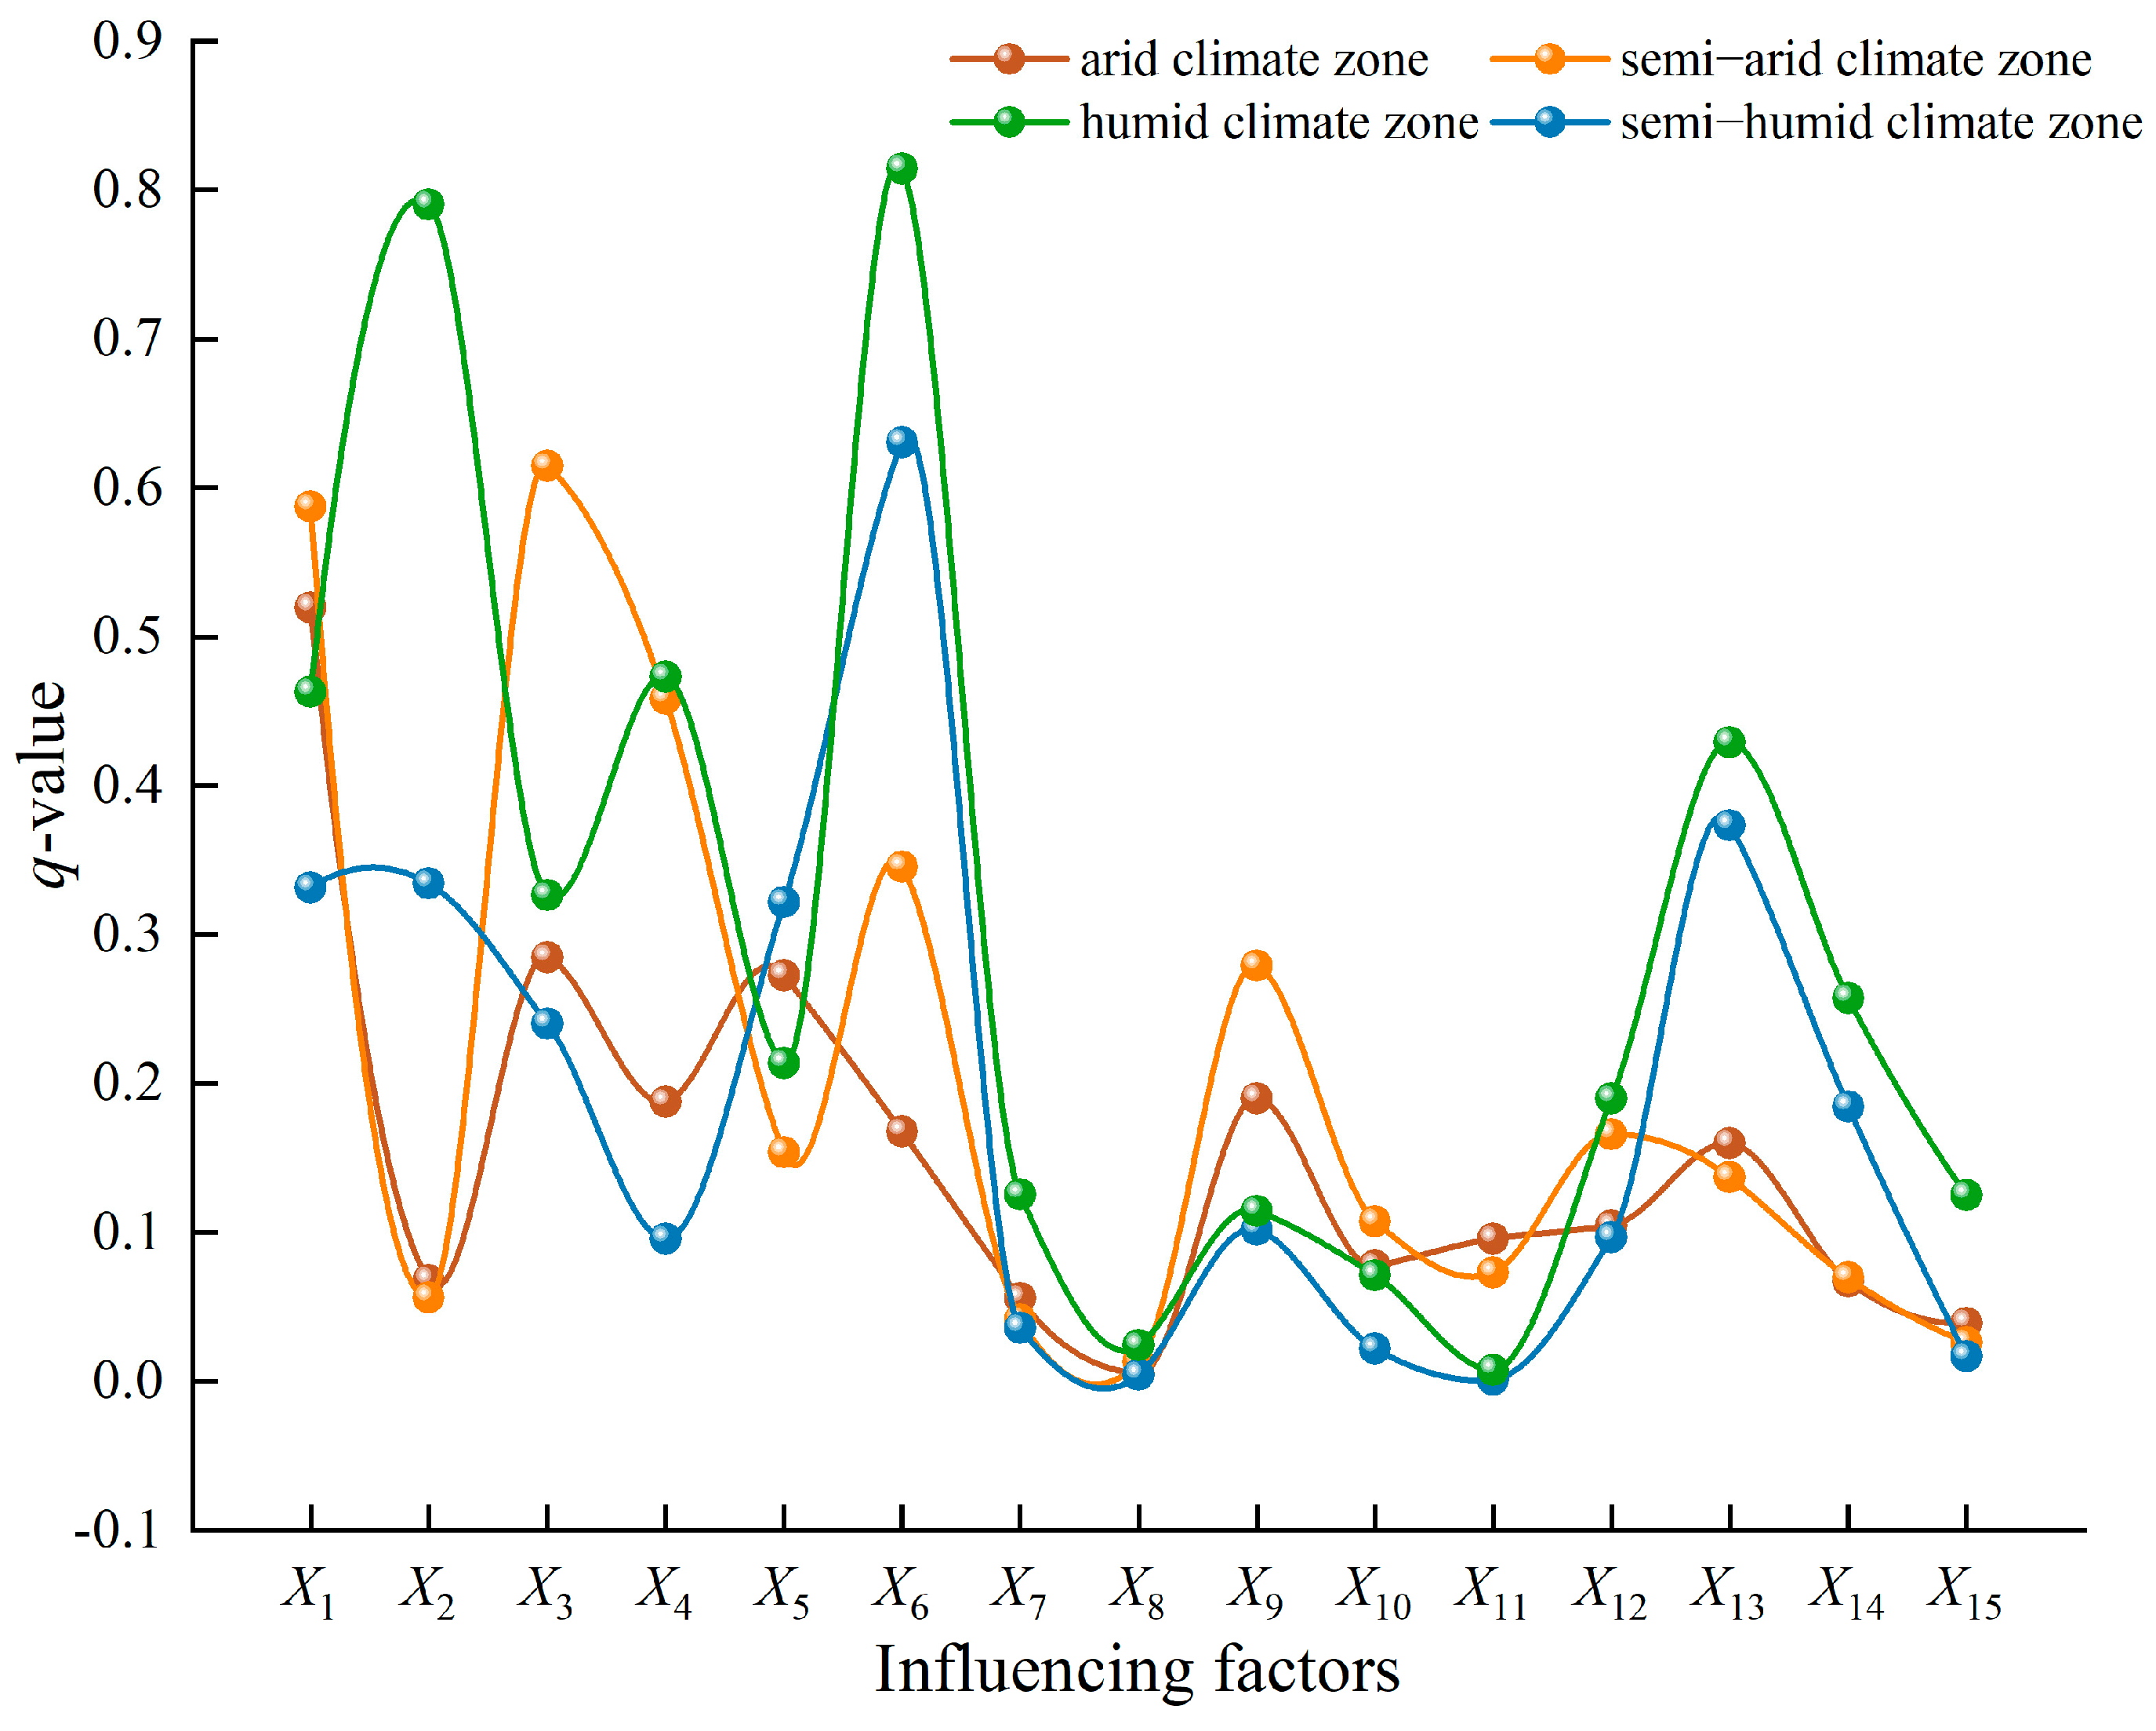
3.3.1. Driving Mechanisms of the NDVI under Different Dry–Wet Zones

We found that there exists spatial heterogeneity in NDVI trends in different regions (Figure 5 and Figure 8). Precipitation (X1) was the most significant driver affecting vegetation evolution in the TP (Figure 9). To analyze the response of vegetation changes in the TP to the local area, we separated the influence factors of each area according to different dry–wet zones (Figure 1) and analyzed the driving forces of the different factors of vegetation changes in different dry–wet zones in the TP in the past 21 years (Figure 11).
Figure 11 showed that the drivers affecting the NDVI in different regions were not consistent, thus indicating that the drivers affecting vegetation growth had a local effect. Specifically, the major drivers affecting NDVI changes in the arid climate zone were annual mean precipitation (X1) and sunshine duration (X3), with q-values of 0.520 and 0.285, respectively. The main drivers affecting NDVI changes in the semi-arid climate zone were sunshine duration (X3) and annual mean precipitation (X1), with q-values of 0.615 and 0.587, respectively. This indicated that vegetation growth in the arid and semi-arid climate zones was more sensitive to the response of precipitation and insolation. The main factor affecting NDVI variation in the semi-humid climate zone was elevation (X6), with a q value of 0.631. The main factors affecting NDVI variation in the humid climate zone were elevation (X6) and annual mean temperature (X2), with q values of 0.814 and 0.790, respectively. This outcome indicated that for the humid and semi-humid climate zones, vegetation growth was more influenced by temperature and elevation. Figure 9 and Figure 11 demonstrate that precipitation was the main factor affecting NDVI changes in the TP region. However, differences emerged in the explanatory power of precipitation for local areas. Specifically, annual mean precipitation (X1) ranked first and second in the influence factor (q value) in the arid and semi-arid climate zones. Annual mean precipitation (X1) ranked fourth in the influence factor in the humid and semi-humid climate zones. It reflected that vegetation evolution in the arid and semi-arid zones was more sensitive to the response of precipitation.
Overall, the drivers affecting vegetation changes in different dry–wet zones differed in the TP, and vegetation growth in arid and semi-arid climate zones was more sensitive to the response of precipitation and sunshine. For the humid and semi-humid climate zones, temperature and elevation have stronger influences on vegetation growth.

3.3.2. Driving Mechanisms of the NDVI under Different Precipitation Gradients

For the TP region with fragile environments and limited humidity, precipitation was the main environmental factor, and local differences in precipitation had an impact on vegetation (Figure 11). To study the explanation of precipitation on the stability of vegetation systems, we concentrated on the effect of drivers on vegetation changes under different precipitation gradients based on zonal statistics. The precipitation data were classified into five gradients using the natural segment point method provided by ArcGIS. The influence factors were separated quantitatively according to different precipitation gradients, and the results of the drivers affecting vegetation evolution in the TP under different precipitation gradients were calculated (Figure 12).
When the annual mean precipitation gradient was Level 1, the main factor affecting vegetation changes was actual evaporation (X5). These areas are mainly located in the northwestern part of the TP region, where precipitation was insufficient for vegetation growth, water and heat use were limited, and the primary drivers of vegetation growth were groundwater availability and water resources supplied by inland rivers [64,65]. The vegetation type was mainly desert vegetation, and the soil type was mainly desert and arid soil. Furthermore, the structure of the regional desert ecosystem was relatively simple. The diversity of biological species was low, the self-regulation ability was weak, the anti-disturbance ability was poor, and the ecosystem was fragile [66]. When the annual mean precipitation gradient was Level 2, the main factor affecting vegetation changes was annual mean precipitation (X1). The explanatory power of three factors on NDVI changes, namely, sunshine duration (X3), mean wind speed (X4), and evaporation (X5), was relatively close. As the annual mean precipitation increased, the change curve of driving forces of different drivers on the NDVI became consistent with Level 4 and Level 5 when the precipitation gradient reached Level 3. The relative importance of the drivers on vegetation gradually stabilized, and the change curve is approximated in Figure 9. Annual mean precipitation (X1), sunshine duration (X3), and mean wind speed (X4) had greater explanatory power for NDVI changes in the TP. The region was mainly located in the central and southeastern areas of the TP region, and the vegetation types were mainly Meadow and CF. The natural conditions such as precipitation, sunshine, and temperature in this region were superior and beneficial for vegetation growth. Hence, the precipitation gradient determined the relative importance of drivers on vegetation. The lower precipitation made the vegetation-driven explanatory system unstable, and the vegetation was vulnerable to environmental and human factors. The influence of natural factors, such as temperature, sunshine duration, and mean wind speed, on vegetation gradually increased with the increase in annual mean precipitation.

4. Discussion

4.1. Vegetation Evolution Characteristics in the TP

The results of spatial and temporal vegetation evolution indicated that vegetation in the TP had a continuous improvement over the past 21 years but there existed a large heterogeneity in space and time, which corresponds to the results of previous studies for vegetation dynamics in the TP [67,68]. The reason might be relevant to the implementation of national ecological construction and protection projects. Since 2001, China has initiated several ecological conservation programs, including the Returning Farmland to Forests Project and the Wildlife Protection and Nature Reserve Development Project [69]. These national policies have prohibited man-made activities such as indiscriminate logging, reckless reclamation, and nomadic hunting. These measures had active effects on vegetation conservation and ecological restoration in the TP region, and were one of the contributing factors to the increase in the NDVI from 0.321 to 0.388. In addition, high vegetation (NDVI > 0.8) was the main type of variation, mainly distributed in the southeastern part of the TP, where higher precipitation and suitable temperature are benefits for vegetation growth. Numerous snow-capped mountains exist in the northwestern part of the TP. The complex topography and harsh climate affected vegetation growth, thus resulting in low vegetation cover [51].
The results of the Sen–MK test showed that the vegetation changes in the TP from 2000 to 2020 mainly improved. The Hurst index revealed that 88.34% of the vegetation area was consistent whereas 11.66% of the vegetation area was inconsistent. The superimposed results of the Sen–MK test and the Hurst index showed that the consistent improvement was concentrated in the central and southeastern parts of the TP, with 52.8% of the TP area. Meanwhile, the western and northern parts showed consistent degradation, with 24.54% of the TP area. The main vegetation types in this area are Desert and Other, and the corresponding NDVI classification is bare soil vegetation (NDVI < 0.2). It has a high altitude and harsh natural conditions that are not conducive to vegetation growth, while it is also an arid climate zone. Figure 8c shows that the arid climate region is dominated by continuous degradation. The future change trend of inconsistent areas accounted for 8.76% of the total area and was mostly scattered in the central part of the TP. These areas were likely to be located in Forest–Grassland interspersed areas, which would also be a key concern for ecological conservation. While the Hurst index is used for predicting vegetation evolution trends, it does not provide a more definite time. Therefore, exploring the duration of vegetation change trends should be a research priority in the future [14,53].
According to the different vegetation types, classification exploration found that various vegetation types had different evolutionary trends. Figure 7b shows that most vegetation types in the TP region are mainly consistent improvement, such as AR, Marsh, and MF. Among them, 89% of MF showed a consistent improvement trend, which was mainly distributed in the southeastern region of the TP. According to Figure 2, the region had a low altitude and suitable natural conditions such as temperature and wind speed. Sufficient precipitation enables the soil in the region to store a large amount of water, which can prevent vegetation from being affected by extreme climate change and contribute to the long-term stable growth of MF. Figure 6a reflected a significant improvement in the evolution trend of the NDVI in this region. Only the AL, Desert, and Other areas were characterized by consistent degradation. The areas with 41% of Steppe showed stabilization. It might be that different vegetation types were influenced by different hydrothermal conditions [70]. The spatial distribution of vegetation was found to be spatially heterogeneous in the different dry–wet zones. The humid and semi-humid climate zones were mainly distributed in areas with high NDVI values, and the vegetation development trend mostly showed consistent improvement. The arid and semi-arid climate zones were mainly concentrated in areas with low NDVI values, and the vegetation development trend was mainly consistent with degradation.

4.2. Driving Forces of Vegetation Changes

Vegetation evolution is driven by a combination of environmental changes and man-made activities. Annual mean precipitation was the key driver affecting vegetation spatial distribution and vegetation changes, which was consistent with previous studies [71,72]. Moisture was a key limiting factor affecting vegetation conditions. This limitation was especially true for environmentally sensitive and fragile areas, where vegetation was more sensitive to precipitation than other influencing factors. Studies have demonstrated that water availability is a key factor influencing vegetation growth [73] and that there exists a positive correlation between soil moisture and vegetation cover [6]. In addition to the factor of annual mean precipitation, sunshine duration, mean wind speed, and population density also influenced the evolution of the NDVI to a large extent (Figure 9f). Sunshine duration was the second significant driver of vegetation changes for the TP, which is the main indicator of solar radiation that maximizes vegetation photosynthesis and indirectly affects vegetation growth [74]. However, excessive solar radiation can cause plant water deficit, which can damage the vegetation growth environment [75]. Vegetation is more sensitive to sunshine duration, and high wind speeds can lead to increased evaporation and accelerated transpiration of vegetation, thus affecting vegetation growth [76].
The TP region is sparsely populated, with the population concentrated in a few urban areas, so the explanatory power of human activities on the spatial distribution of the NDVI is weak relative to natural factors. However, studies suggest that human activities would reduce the positive effects of climate change [77]. High population density has a negative impact on vegetation growth [78,79]. Increasing population density and rapid urban development cause problems such as the destruction of forests and grasslands, as well as the shrinking of natural habitats, thus affecting vegetation growth [20,26]. According to a study, human activities caused stronger influences on global vegetation growth than climate change [80]. During the period 1999–2018, human activities affected 57.11% of the vegetation to alterations [81]. However, human activities have relatively small impacts on vegetation growth in the TP compared to natural factors. For long periods, vegetation growth is expected to be primarily influenced by human activities.
The complexity of ecosystems and geographic processes suggested that the interaction of any two factors might affect vegetation changes [82,83,84]. Figure 10 demonstrates that the interaction of two factors had a greater effect on vegetation than independent factors. The interaction of annual mean precipitation with mean wind speed, evaporation, and elevation had the greatest effect on the NDVI. It is further verified that natural factors have greater influences on vegetation growth. It was also verified that the interaction between influencing factors improved the explanatory power of the independent variable to the dependent variable [41,85]. While aspect (X8), distance to the road (X10), soil type (X14), and landform type (X15) have limited impact on NDVI changes, their impact can be amplified when interacting with other factors. Furthermore, human activities tend to have a greater impact when interacting with natural factors.

4.3. Explanations for the Stability of Highland Vegetation Ecosystems

This study showed that precipitation was the most important climatic factor affecting vegetation evolution in the TP (Figure 9). Differences in vegetation driving factors under different dry–wet zones and precipitation gradients also influenced the interpretation of vegetation system stability. In arid and semi-arid areas, vegetation growth is more sensitive to precipitation and sunshine, whereas, in humid and semi-humid regions, the impact of precipitation on vegetation is less significant compared to factors such as temperature and elevation. Water availability is a major limiting factor for vegetation growth [72]. Vegetation in relatively water-scarce areas was highly sensitive to precipitation changes, and precipitation promotes vegetation growth in most areas. We found an interesting pattern where precipitation gradients determine the relative importance of natural and anthropogenic factors on vegetation evolution. Actual evaporation replaces mean annual precipitation as the factor with the highest explanatory power for vegetation evolution in low precipitation areas. These areas lack sufficient precipitation to support the water requirements for vegetation growth, with water primarily sourced from nearby river systems [66,70]. The main vegetation type is Desert, which has weak self-regulation ability and a fragile ecosystem. With the increase in precipitation, the annual mean precipitation, sunshine duration, and wind speed become the key factors. An area with high precipitation has good natural conditions and is suitable for vegetation growth. The vegetation types are mainly Meadow, BF, and CF. Compared with the explanatory power of vegetation type (q(X13) = 0.383), the highest NDVI appeared in areas dominated by BF and CF [26,31], which might mean that different vegetation types show different sensitivity to natural and anthropogenic factors [39]. BF has more litter than other vegetation types, which reduces the loss of surface soil moisture through evaporation, thus providing better water and nutrient conditions for vegetation growth [51]. This indicates distinct response mechanisms to climatic factors among sub-regions with varying precipitation levels. In arid climatic zones characterized by scarce precipitation, limited water availability leads to less stable ecosystems, and the natural environment does not provide sufficient support for vegetation growth. Taken together, the mismatched relationship between precipitation and vegetation water demand in different sub-regions affected vegetation growth, thus making precipitation the main driver of spatial heterogeneity of the TP vegetation. This mismatch also illustrated the importance of precipitation for vegetation growth in relatively water-scarce regions. However, in the context of warming and wetting changes, the annual mean precipitation change showed a non-significant trend of weak increase, which was not beneficial for the TP ecosystem stability in the long term.
Long-term vegetation changes are a complex process, especially for sensitive and complex ecosystems of the TP. Different vegetation types have different responses to climatic conditions and disturbances from human activities. Human activities have dual effects on NDVI changes. Vegetation growth near human settlements is generally disturbed by human activities. However, human conservation measures for vegetation growth are increasing the stability of ecosystems [86]. Elevation, temperature, precipitation, and other natural factors have certain thresholds for vegetation growth [70], beyond which vegetation growth may be inhibited. Therefore, it is necessary to analyze the effects of climate factors on vegetation growth in different vegetation types and formulate targeted protection measures to improve the plateau vegetation ecosystem stability.

4.4. Implications and Limitations

Although we demonstrated the usefulness of analyzing the drivers of vegetation changes in the TP region through the Geodetector model, there are limitations in the selection of factors that affect the vegetation dynamic. The increase in CO2 concentration was one of the drivers of vegetation greening [44,87]. In addition, human behaviors such as tourism, hunting, and grazing also affect vegetation growth [88,89], but this paper did not discuss the corresponding indicators that were difficult to quantify precisely. In future research, the comprehensiveness of the analysis of vegetation dynamic factors will be further improved in terms of grazing behavior, socioeconomic development, ecological engineering implementation, and more bioclimatic aspects.

5. Conclusions

The spatial and temporal change characteristics and driving mechanisms of vegetation in the Qinghai-Tibetan Plateau were analyzed using long-time series vegetation remote sensing data. The explanatory power of the driving factors for vegetation evolution under different wet-dry zones and precipitation gradients was quantitatively separated, which explored the sensitivity of vegetation evolution to precipitation in the Qinghai-Tibetan Plateau from multiple perspectives. The results found that the NDVI showed an overall increasing trend during 2000–2020, with a continuous increase at a rate of 0.0027 a−1. Vegetation changes were affected by natural and anthropogenic factors, with annual mean precipitation as the main influencing factor. Double-factor interactions can enhance the explanatory power of single factors for vegetation changes. The interaction between the annual mean precipitation and other factors had the strongest explanatory power on vegetation changes. The response of vegetation growth to precipitation was more sensitive in arid and semi-arid climate zones, while vegetation changes were more influenced by temperature and elevation in humid and semi-humid climate zones. The mismatch between precipitation and vegetation water requirements in different sub-regions can affect vegetation growth. This study highlights the responses of vegetation to dry–wet zones and different precipitation gradients, which can better assess different factors affecting the vegetation ecosystems’ stability in environmentally sensitive and fragile areas and provide references for the conservation of plateau ecosystems in the context of climate change.

Author Contributions

Y.C. contributed to the study design and wrote the manuscript; C.Y. discussed the original idea, revised the manuscript, and provided financial support; L.X., D.L., H.S. and F.G. were involved in drafting and checking the manuscript. All authors have read and agreed to the published version of the manuscript.

Funding

This study was supported by the Opening Fund of the Key Laboratory of Geological Survey and Evaluation of the Ministry of Education (grant No. GLAB 2022ZR01) and the Fundamental Research Funds for the Central Universities.

Data Availability Statement

All data that support the findings of the study are available from the corresponding author upon reasonable request.

Acknowledgments

The authors would like to thank the anonymous reviewers for their helpful and valuable comments and suggestions.

Conflicts of Interest

The authors declare no conflict of interest.

References

  1. Gao, J.; Jiao, K.; Wu, S.; Ma, D.; Zhao, D.; Yin, Y.; Dai, E. Past and future effects of climate change on spatially heterogeneous vegetation activity in China. Earth’s Future 2017, 5, 679–692. [Google Scholar] [CrossRef]
  2. Mao, T.; Wang, G.; Zhang, T. Impacts of climatic change on hydrological regime in the Three-River Headwaters Region, China, 1960–2009. Water Resour. Manag. 2016, 30, 115–131. [Google Scholar] [CrossRef]
  3. Newbold, T.; Hudson, L.N. Global effects of land use on local terrestrial biodiversity. Nature 2015, 520, 45–50. [Google Scholar] [CrossRef] [PubMed]
  4. Derakhshannia, M.; Dalvand, S.; Asakereh, B.; Ostad, K. Corrosion and deposition in Karoon River, Iran, based on hydrometric stations. Int. J. Hydrol. Sci. Technol. 2020, 10, 334. [Google Scholar] [CrossRef]
  5. Fang, X.; Zhu, Q.; Ren, L.; Chen, H.; Wang, K.; Peng, C. Large-scale detection of vegetation dynamics and their potential drivers using MODIS images and BFAST: A case study in Quebec, Canada. Remote Sens. Environ. 2018, 206, 391–402. [Google Scholar] [CrossRef]
  6. Wang, X.; Wang, B.; Xu, X.; Liu, T.; Duan, Y.; Zhao, Y. Spatial and temporal variations in surface soil moisture and vegetation cover in the Loess Plateau from 2000 to 2015. Ecol. Indic. 2018, 95, 320–330. [Google Scholar] [CrossRef]
  7. Liu, L.; Wang, Y.; Wang, Z.; Li, D.; Zhang, Y.; Qin, D.; Li, S. Elevation-dependent decline in vegetation greening rate driven by increasing dryness based on three satellite NDVI datasets on the Tibetan Plateau. Ecol. Indic. 2019, 107, 105569. [Google Scholar] [CrossRef]
  8. Liu, H.; Mi, Z.; Lin, L.; Wang, Y.; Zhang, Z.; Zhang, F.; Wang, H.; Liu, L.; Zhu, B.; Cao, G.; et al. Shifting plant species composition in response to climate change stabilizes grassland primary production. Proc. Natl. Acad. Sci. USA 2018, 115, 4051–4056. [Google Scholar] [CrossRef]
  9. Dakhil, M.A.; Xiong, Q.L.; Farahat, E.A.; Zhang, L.; Pan, K.; Pandey, B.; Olatunji, O.A.; Tariq, A.; Wu, X.; Zhang, A.; et al. Past and future climatic indicators for distribution pattern and conservation planning of temperate coniferous forests in southwestern China. Ecol. Indic. 2019, 107, 105559. [Google Scholar] [CrossRef]
  10. Liang, D.L.; Tang, H.P. Analysis of vegetation changes and water temperature driving factors in two alpine grasslands on the 0ingnai-Tibet Plateau. Acta Ecol. Sin. 2022, 42, 287–300. [Google Scholar] [CrossRef]
  11. Nie, X.; Yang, L.; Xiong, F.; Li, C.; Fan, L.; Zhou, G. Aboveground biomass of the alpine shrub ecosystems in Three-River Source Region of the Tibetan Plateau. J. Mt. Sci. 2018, 15, 357–363. [Google Scholar] [CrossRef]
  12. Guo, Y.; Fu, Y.; Hao, F.; Zhang, X.; Wu, W.; Jin, X.; Bryant, C.; Senthilnath, J. Integrated phenology and climate in rice yields prediction using machine learning methods. Ecol. Indic. 2021, 120, 106935. [Google Scholar] [CrossRef]
  13. Gillespie, T.W.; Ostermann-Kelm, S.; Dong, C.; Willis, K.S.; Okin, G.S.; MacDonald, G.M. Monitoring change of NDVI in protected areas of southern California. Ecol. Indic. 2018, 88, 485–494. [Google Scholar] [CrossRef]
  14. Guo, Y.; Chen, S.; Li, X.; Mario, C.; Senthilnath, J.; Davide, C.; Fu, Y. Machine Learning-Based Approaches for Predicting SPAD Values of Maize Using Multi-Spectral Images. Remote Sens. 2022, 14, 1337. [Google Scholar] [CrossRef]
  15. Lin, M.; Hou, L.; Qi, Z.; Wan, L. Impacts of climate change and human activities on vegetation NDVI in China’s Mu Us Sandy Land during 2000–2019. Ecol. Indic. 2022, 142, 109164. [Google Scholar] [CrossRef]
  16. Liu, C.; Li, W.; Wang, W.; Zhou, H.; Liang, T.; Hou, F.; Xu, J.; Xue, P. Quantitative spatial analysis of vegetation dynamics and potential driving factors in a typical alpine region on the northeastern Tibetan Plateau using the Google Earth Engine. Catena 2021, 206, 105500. [Google Scholar] [CrossRef]
  17. Piao, S.; Wang, X.; Park, T.; Chen, C.; Lian, X.; He, Y.; Bjerke, J.W.; Chen, A.; Ciais, P.; Tømmervik, H.; et al. Characteristics, drivers and feedbacks of global greening. Nat. Rev. Earth Environ. 2020, 1, 14–27. [Google Scholar] [CrossRef]
  18. Deng, Y.; Wang, X.; Wang, K.; Ciais, P.; Tang, S.; Jin, L.; Li, L.; Piao, S. Responses of vegetation greenness and carbon cycle to extreme droughts in China. Agric. For. Meteorol. 2021, 298–299, 108307. [Google Scholar] [CrossRef]
  19. Piao, S.; Cui, M.; Chen, A.; Wang, X.; Ciais, P.; Liu, J.; Tang, Y. Altitude and temperature dependence of change in the spring vegetation green-up date from 1982 to 2006 in the Qinghai-Xizang Plateau. Agric. For. Meteorol. 2011, 151, 1599–1608. [Google Scholar] [CrossRef]
  20. Zhang, Z.X.; Chang, J.; Xu, C.Y.; Zhou, Y.; Wu, Y.; Chen, X.; Jiang, S.; Duan, Z. The response of lake area and vegetation cover variations to climate change over the Qinghai-Tibetan Plateau during the past 30 years. Sci. Total Environ. 2018, 635, 443–451. [Google Scholar] [CrossRef]
  21. Jin, K.; Wang, F.; Han, J.Q.; Shi, S.; Ding, W. Contribution of climatic change and human activities to vegetation NDVI change over China during 1982–2015. Acta Geogr. Sin. 2020, 75, 961–974. [Google Scholar] [CrossRef]
  22. Otto, M.; Höpfner, C.; Curio, J.; Maussion, F.; Scherer, D. Assessing vegetation response to precipitation in northwest Morocco during the last decade: An application of MODIS NDVI and high resolution reanalysis data. Theor. Appl. Climatol. 2016, 123, 23–41. [Google Scholar] [CrossRef]
  23. Eckert, S.; Hüsler, F.; Liniger, H.; Hodel, E. Trend analysis of MODIS NDVI time series for detecting land degradation and regeneration in Mongolia. J. Arid. Environ. 2015, 113, 16–28. [Google Scholar] [CrossRef]
  24. Yamori, W.; Hikosaka, K.; Way, D.A. Temperature response of photosynthesis in C3, C4 and CAM plants: Temperature acclimation and temperature adaptation. Photosynth. Res. 2014, 119, 101–117. [Google Scholar] [CrossRef] [PubMed]
  25. Shen, Q.; Gao, G.; Han, F.; Xiao, F.; Ma, Y.; Wang, S.; Fu, B. Quantifying the effects of human activities and climate variability on vegetation cover change in a hyperarid endorheic basin. Land Degrad. Dev. 2018, 29, 3294–3304. [Google Scholar] [CrossRef]
  26. Wang, J.; Wang, K.; Zhang, M.; Zhang, C. Impacts of climate change and human activities on vegetation cover in hilly southern China. Ecol. Eng. 2015, 81, 451–461. [Google Scholar] [CrossRef]
  27. Yao, R.; Cao, J.; Wang, L.; Zhang, W.; Wu, X. Urbanization effects on vegetation cover in major African cities during 2001–2017. Int. J. Appl. Earth Obs. Geoinf. 2019, 75, 44–53. [Google Scholar] [CrossRef]
  28. Nie, X.; Li, C.; Ren, L.; Chen, Y.; Du, Y.; Li, X.; Wang, D.; Zhou, G. Different responses of soil element contents and their stoichiometry (C: N: P) to different grazing intensity on the Tibetan Plateau shrublands. Front. Environ. Sci. 2023, 11, 1170507. [Google Scholar] [CrossRef]
  29. Zhang, Y.; Zhang, S.; Zhai, X.; Xia, J. Runoff variation and its response to climate change in the Three Rivers Source Region. J. Geogr. Sci. 2012, 22, 781–794. [Google Scholar] [CrossRef]
  30. Shen, X.; An, R.; Feng, L.; Ye, N.; Zhu, L.; Li, M. Vegetation changess in the Three-River Headwaters Region of the Tibetan Plateau of China. Ecol. Indic. 2018, 93, 804–812. [Google Scholar] [CrossRef]
  31. Du, Z.; Zhang, X.; Xu, X.; Zhang, H.; Wu, Z.; Pang, J. Quantifying influences of physiographic factors on temperate dryland vegetation, Northwest China. Sci. Rep. 2017, 7, 40092. [Google Scholar] [CrossRef] [PubMed]
  32. Shrestha, A.; Luo, W. Analysis of groundwater nitrate contamination in the Central Valley: Comparison of the geodetector method, principal component analysis and geographically weighted regression. ISPRS Int. J. Geo. Inf. 2017, 6, 297. [Google Scholar] [CrossRef]
  33. Wang, J.F.; Xu, C.D. Geodetector: Principles and Prospective. J. Geogr. 2017, 72, 116–134. [Google Scholar]
  34. Xu, L.; Du, H.; Zhang, X. Driving forces of carbon dioxide emissions in China’s cities: An empirical analysis based on the geodetector method. J. Clean. Prod. 2021, 287, 125169. [Google Scholar] [CrossRef]
  35. Han, J.; Wang, J.; Chen, L.; Xiang, J.; Ling, Z.; Li, Q.; Wang, E. Driving factors of desertification in Qaidam Basin, China: An 18-year analysis using the geographic detector model. Ecol. Indic. 2021, 124, 107404. [Google Scholar] [CrossRef]
  36. Guo, G.H.; Li, K.; Zhang, D.G.; Lei, M. Quantitative source apportionment and associated driving factor identification for soil potential toxicity elements via combining receptor models, SOM, and geo-detector method. Sci. Total Environ. 2022, 830, 154721. [Google Scholar] [CrossRef]
  37. Pan, H.; Huang, P.; Xu, J. The spatial and temporal pattern evolution of vegetation NPP and its driving forces in middle-lower areas of the Min river based on geo-graphical detector analyses. Acta Ecol. Sin. 2019, 39, 7621–7631. [Google Scholar] [CrossRef]
  38. Peng, W.; Kuang, T.; Tao, S. Quantifying influences of natural factors on vegetation NDVI changes based on geographical detector in Sichuan, western China. J. Clean. Prod. 2019, 233, 353–367. [Google Scholar] [CrossRef]
  39. Liu, H.; Jiao, F.; Yin, J.; Li, T.; Gong, H.; Wang, Z.; Lin, Z. Nonlinear relationship of vegetation greening with nature and human factors and its forecast—A case study of Southwest China. Ecol. Indic. 2020, 111, 106009. [Google Scholar] [CrossRef]
  40. Meng, X.; Gao, X.; Li, S.; Lei, J. Spatial and temporal characteristics of vegetation NDVI change and the driving forces in Mongolia during 1982–2015. Remote Sens. 2020, 12, 603. [Google Scholar] [CrossRef]
  41. Yin, L.; Dai, E.; Zheng, D.; Wang, Y.; Ma, L.; Tong, M. What drives the vegetation dynamics in the Hengduan Mountain region, southwest China: Climate change or human activity? Ecol. Indic. 2020, 112, 106013. [Google Scholar] [CrossRef]
  42. Zhu, L.; Meng, J.; Zhu, L. Applying Geodetector to disentangle the contributions of natural and anthropogenic factors to NDVI variations in the middle reaches of the Heihe River Basin. Ecol. Indic. 2020, 117, 106545. [Google Scholar] [CrossRef]
  43. Piao, S.; Yin, G.; Tan, J.; Cheng, L.; Huang, M.; Li, Y.; Liu, R.; Mao, J.; Myneni, R.B.; Peng, S. Detection and attribution of vegetation greening trend in China over the last 30 years. Glob. Chang. Biol. 2015, 21, 1601–1609. [Google Scholar] [CrossRef]
  44. Liang, P.; Yang, X. Landscape spatial patterns in the Maowusu (Mu Us) Sandy Land, northern China and their impact factors. Catena 2016, 145, 321–333. [Google Scholar] [CrossRef]
  45. Pei, W.; Lin, X.; Pan, X.; Hu, Q.; Li, Q.; Zhang, X.; Shao, C.; Wang, C.; Wang, X. Spatio-temporal variations in vegetation types based on a climatic grassland classification system during the past 30 years in Inner Mongolia, China. Catena 2020, 185, 104298. [Google Scholar] [CrossRef]
  46. Tian, H.; Cao, C.; Chen, W.; Bao, S.; Yang, B.; Myneni, R.B. Response of vegetation activity dynamic to climatic change and ecological restoration programs in Inner Mongolia from 2000 to 2012. Ecol. Eng. 2015, 82, 276–289. [Google Scholar] [CrossRef]
  47. Wang, S.; Li, R.; Wu, Y.; Zhao, S. Effects of multi-temporal scale drought on vegetation dynamics in Inner Mongolia from 1982 to 2015, China. Ecol. Indic. 2022, 136, 108666. [Google Scholar] [CrossRef]
  48. Maxwell, S.K.; Sylvester, K.M. Identification of “ever-cropped” land (1984–2010) using Landsat annual maximum NDVI image composites: Southwestern Kansas case study. Remote Sens. Environ. 2012, 121, 186–195. [Google Scholar] [CrossRef]
  49. Liu, H.; Li, X.; Mao, F.; Zhang, M.; Zhu, D.; He, S.; Huang, Z.; Du, H. Spatiotemporal Evolution of Fractional Vegetation Cover and Its Response to Climate Change Based on MODIS Data in the Subtropical Region of China. Remote Sens. 2021, 13, 913. [Google Scholar] [CrossRef]
  50. Cao, F.; Ge, Y.; Wang, J.F. Optimal discretization for geographical detectors-based risk assessment. GIScience Remote Sens. 2013, 50, 78–92. [Google Scholar] [CrossRef]
  51. Huo, H.; Sun, C. Spatiotemporal variation and influencing factors of vegetation dynamics based on Geodetector: A case study of the northwestern Yunnan Plateau, China. Ecol. Indic. 2021, 130, 108005. [Google Scholar] [CrossRef]
  52. Zhang, J.; Zheng, H.; Zhu, L.; Cui, Y.; Zhang, X.; Ye, L. Multi-dimensional changes of vegetation NDVI and its response to climate in Western Henan Mountains. Geogr. Res. 2017, 36, 765–778. [Google Scholar]
  53. Tong, S.; Zhang, J.; Bao, Y.; Lai, Q.; Lian, X.; Li, N.; Bao, Y. Analyzing vegetation dynamic trend on the Mongolian Plateau based on the Hurst exponent and influencing factors from 1982–2013. J. Geogr. Sci. 2018, 28, 595–610. [Google Scholar] [CrossRef]
  54. Zhang, M.; Wu, X. The rebound effects of recent vegetation restoration projects in Mu Us Sandy land of China. Ecol. Indic. 2020, 113, 106228. [Google Scholar] [CrossRef]
  55. Sen, P.K. Estimates of the regression coefficient based on Kendall’s Tau. J. Am. Stat. Assoc. 1968, 63, 1379–1389. [Google Scholar] [CrossRef]
  56. Gu, Z.; Duan, X.; Shi, Y.; Li, Y.; Pan, X. Spatiotemporal variation in vegetation coverage and its response to climatic factors in the Red River Basin, China. Ecol. Indic. 2018, 93, 54–64. [Google Scholar] [CrossRef]
  57. Jiang, W.; Yuan, L.; Wang, W.; Cao, R.; Zhang, Y.; Shen, W. Spatio-temporal analysis of vegetation variation in the Yellow River Basin. Ecol. Indic. 2015, 51, 117–126. [Google Scholar] [CrossRef]
  58. Liu, X.; Zhang, J.; Zhu, X.; Pan, Y.; Liu, Y.; Zhang, D.; Lin, Z. Spatiotemporal changes in vegetation coverage and its driving factors in the Three-River Headwaters Region during 2000–2011. J. Geogr. Sci. 2014, 24, 288–302. [Google Scholar] [CrossRef]
  59. Qu, S.; Wang, L.; Lin, A.; Yu, D.; Yuan, M.; Li, C. Distinguishing the impacts of climate change and anthropogenic factors on vegetation dynamics in the Yangtze River Basin, China. Ecol. Indic. 2020, 108, 105724. [Google Scholar] [CrossRef]
  60. Hurst, H.E. Long-Term Storage Capacity of Reservoirs. Trans. Am. Soc. Civ. Eng. 1951, 116, 770–808. [Google Scholar] [CrossRef]
  61. Jiang, L.; Bao, A.; Guli, J.; Liu, R.; Yuan, Y.; Yu, T. Monitoring land degradation and assessing its drivers to support sustainable development goal 15.3 in Central Asia. Sci. Total Environ. 2021, 807, 150868. [Google Scholar] [CrossRef] [PubMed]
  62. Nie, X.; Wang, D.; Ren, L.; Du, Y.; Zhou, G. Storage and controlling factors of soil organic carbon in alpine wetlands and meadow across the Tibetan Plateau. Eur. J. Soil Sci. 2023, 74, e13383. [Google Scholar] [CrossRef]
  63. Jiang, L.; Guli, J.; Bao, A.; Guo, H.; Ndayisaba, F. Vegetation dynamics and responses to climate change and human activities in Central Asia. Sci. Total Environ. 2017, 599–600, 967–980. [Google Scholar] [CrossRef] [PubMed]
  64. Ting, H.; Xunming, W.; Caixia, Z.; Lang, L.; Li, H. Responses of Vegetation Activity to Drought in Northern China. Land Degrad. Dev. 2017, 28, 1913–1921. [Google Scholar] [CrossRef]
  65. Zeng, X.; Hu, Z.; Chen, A.; Yuan, W.; Hou, G.; Han, D.; Liang, M.; Di, K.; Cao, R.; Luo, D. The global decline in the sensitivity of vegetation productivity to precipitation from 2001–2018. Glob. Chang. Biol. 2022, 28, 6823–6833. [Google Scholar] [CrossRef]
  66. Chen, J.; Wang, X.; Song, N.; Wang, Q.; Wu, X. Water utilization of typical plant communities in desert steppe, China. J. Arid. Land 2022, 14, 1038–1054. [Google Scholar] [CrossRef]
  67. Pan, T.; Zou, X.; Liu, Y.; Wu, S.; He, G. Contributions of climatic and non-climatic drivers to grassland variations on the Tibetan Plateau. Ecol. Eng. 2017, 108, 307–317. [Google Scholar] [CrossRef]
  68. Xu, B.; Li, J.; Luo, Z.; Wu, J.; Liu, Y.; Yang, H.; Pei, X. Analyzing the spatiotemporal vegetation dynamics and their responses to climate change along the Ya’an–Linzhi section of the Sichuan–Tibet Railway. Remote Sens. 2022, 14, 3584. [Google Scholar] [CrossRef]
  69. Chen, H.; Shao, L.; Zhao, M.; Zhang, X.; Zhang, D. Grassland conservation programs, vegetation rehabilitation and spatial dependency in Inner Mongolia, China. Land Use Policy 2017, 64, 429–439. [Google Scholar] [CrossRef]
  70. Li, H.Y.; Zhang, C.G.; Wang, S.Z.; Ma, W.D.; Liu, F.G.; Chen, Q.; Zhou, Q.; Xia, X.S.; Niu, B.C. Response of vegetation dynamics to hydrothermal conditions on the Qinghai-Tibet Plateau in the last 40 years. Acta Ecol. Sin. 2022, 42, 4770–4783. [Google Scholar] [CrossRef]
  71. Liu, C.; Liu, B.; Zhao, W.; Zhu, Z. Temporal and spatial variability of water use efficiency of vegetation and its response to precipitation and temperature in Heihe River Basin. Acta Ecol. Sin. 2020, 40, 888–899. [Google Scholar] [CrossRef]
  72. Shi, S.; Yu, J.; Wang, F.; Wang, P.; Zhang, Y.; Jin, K. Quantitative contributions of climate change and human activities to vegetation changess over multiple time scales on the Loess Plateau. Sci. Total Environ. 2021, 755, 142419. [Google Scholar] [CrossRef] [PubMed]
  73. Ostad-Ali-Askari, K.; Ghorbanizadeh Kharazi, H.; Shayannejad, M.; Javad Zareian, M. Effect of climate change on precipitation patterns in an arid region using GCM models: Case study of Isfahan-Borkhar Plain. Nat. Hazards Rev. 2020, 21, 04020006. [Google Scholar] [CrossRef]
  74. Jia, A.; Liang, S.; Wang, D.; Jiang, B.; Zhang, X. Air pollution slows down surface warming over the Tibetan Plateau. Atmos. Chem. Phys. 2020, 20, 881–899. [Google Scholar] [CrossRef]
  75. Che, M.; Chen, B.; Innes, J.L.; Wang, G.; Dou, X.; Zhou, T.; Zhang, H.; Yan, J.; Xu, G.; Zhao, H. Spatial and temporal variations in the end date of the vegetation growing season throughout the Qinghai-Tibetan Plateau from 1982 to 2011. Agric. For. Meteorol. 2014, 189–190, 81–90. [Google Scholar] [CrossRef]
  76. Li, S.; Li, X.; Gong, J.; Dang, D.; Dou, H.; Lyu, X. Quantitative Analysis of Natural and Anthropogenic Factors Influencing Vegetation NDVI Changes in Temperate Drylands from a Spatial Stratified Heterogeneity Perspective: A Case Study of Inner Mongolia Grasslands, China. Remote Sens. 2022, 14, 3320. [Google Scholar] [CrossRef]
  77. Chen, C.; Li, T.; Sivakumar; Li, J.; Wang, G. Attribution of growing season vegetation activity to climate change and human activities in the Three-River Headwaters Region, China. J. Hydroinform. 2020, 22, 186–204. [Google Scholar] [CrossRef]
  78. Hao, J.; Xu, G.; Luo, L.; Zhang, Z.; Yang, H.; Li, H. Quantifying the relative contribution of natural and human factors to vegetation coverage variation in coastal wetlands in China. Catena 2020, 188, 104429. [Google Scholar] [CrossRef]
  79. Zhang, X.; Yue, Y.; Tong, X.; Wang, K.; Qi, X.; Deng, C.; Martin, B. Ecoengineering controls vegetation trends in southwest China karst. Sci. Total. Env. 2021, 770, 145160. [Google Scholar] [CrossRef]
  80. Zhang, X.L.; Huang, X.R. Human disturbance caused stronger influences on global vegetation change than climate change. PeerJ 2019, 7, e7763. [Google Scholar] [CrossRef]
  81. Yang, L.; Zhicheng, Z.; Yaochen, Q.; Rong, P. Relative contributions of natural and man-made factors to vegetation cover change of environmentally sensitive and vulnerable areas of China. J. Clean. Prod. 2021, 321, 128917. [Google Scholar] [CrossRef]
  82. Gu, X.; Fang, X.; Xiang, W.; Zeng, Y.; Zhang, S.; Lei, P.; Peng, C.; Yakov, K. Vegetation restoration stimulates soil carbon sequestration and stabilization in a subtropical area of southern China. Catena 2019, 181, 104098. [Google Scholar] [CrossRef]
  83. Zheng, K.; Tan, L.; Sun, Y.; Wu, Y.; Duan, Z.; Xu, Y.; Gao, C. Impacts of climate change and anthropogenic activities on vegetation changes: Evidence from typical areas in China. Ecol. Indic. 2021, 126, 107648. [Google Scholar] [CrossRef]
  84. Liu, Q.; Liu, L.; Zhang, Y.; Wang, Z.; Wu, J.; Li, L.; Li, S.; Basanta, P. Identification of impact factors for differentiated patterns of NDVI change in the headwater source region of Brahmaputra and Indus. Southwestern Tibetan Plateau. Ecol. Indic. 2021, 125, 107604. [Google Scholar] [CrossRef]
  85. Bai, L.; Jiang, L.; Yang, D.Y.; Liu, Y.B. Quantifying the spatial heterogeneity influences of natural and socioeconomic factors and their interactions on air pollution using the geographical detector method: A case study of the Yangtze River Economic Belt, China. J. Clean. Prod. 2019, 232, 692–704. [Google Scholar] [CrossRef]
  86. Mao, Z.; Steven, W. Running. Drought-Induced Reduction in Global Terrestrial Net Primary Production from 2000 through 2009. Science 2010, 329, 940–943. [Google Scholar] [CrossRef]
  87. Zhu, Z.; Piao, S.; Myneni, R.B.; Huang, M.; Zeng, Z.; Canadell, J.G.; Ciais, P.; Sitch, S.; Friedlingstein, P.; Arneth, A.; et al. Greening of the earth and its drivers. Nat. Clim. Chang. 2016, 6, 791–795. [Google Scholar] [CrossRef]
  88. Zhang, Q.; Kong, D.; Shi, P.; Singh, V.; Sun, P. Vegetation phenology on the Qinghai-Tibetan Plateau and its response to climate change (1982–2013). Agric. For. Meteorol. 2018, 248, 408–417. [Google Scholar] [CrossRef]
  89. Wu, J.; Zhang, Q.; Li, A.; Liang, C. Historical landscape dynamics of Inner Mongolia: Patterns, drivers, and impacts. Landsc. Ecol. 2015, 30, 1579–1598. [Google Scholar] [CrossRef]
Figure 1. The Qinghai-Tibetan Plateau.
Water 15 03305 g001
Figure 2. Spatial distribution of influencing factors in the TP: (a) elevation; (b) slope; (c) aspect; (d) annual mean precipitation; (e) annual mean temperature; (f) sunshine duration; (g) mean wind speed; (h) evaporation; (i) population density; (j) distance to the road; (k) distance to the river; (l) distance to the residence; (m) vegetation type; (n) soil type; (o) landform type.
Water 15 03305 g002
Figure 3. Interaction detector result type.
Water 15 03305 g003
Figure 4. Interannual temporal changes of the NDVI. (a) The variation trend of the NDVI; (b) area percentage of NDVI classification.
Water 15 03305 g004
Figure 5. Spatial distribution of the NDVI, 2000–2020.
Water 15 03305 g005
Figure 6. Spatial changes of the NDVI in the TP, 2000–2020.
Water 15 03305 g006
Figure 7. The change trends of the NDVI in different vegetation types (AR: artificial vegetation; AL: alpine vegetation; BF: broad-leaved forest; MF: mixed forest; CF: coniferous forest). (a) Statistical results of area percentage; (b) NDVI trend statistics results.
Water 15 03305 g007
Figure 8. The change trends of the NDVI in different dry–wet zones. (a) The mean NDVI values; (b) area percentage of the NDVI; (c) NDVI trend.
Water 15 03305 g008
Figure 9. (af) Factor detection results of vegetation changes (The red triangle represents the maximum value).
Water 15 03305 g009
Figure 10. The integrated effects of different drivers on vegetation changes.
Water 15 03305 g010
Figure 11. The explanatory power of influence drivers of the NDVI under different dry–wet zones.
Water 15 03305 g011
Figure 12. The q-values affect vegetation changes under different precipitation gradients (Level 1: 0–192 mm/year; Level 2: 192–421 mm/year; Level 3: 421–629 mm/year; Level 4: 629–1022 mm/year; Level 5: 1022–2804 mm/year).
Water 15 03305 g012
Table 1. The influencing factors of the NDVI.
Data TypeFactorsUnitResolutionCode
ClimateAnnual mean precipitation mm1 kmX1
Annual mean temperature°C1 kmX2
Sunshine durationhour1 kmX3
Mean wind speedm/s1 kmX4
Actual evaporationmm1 kmX5
TopographyElevationm30 mX6
Slope°30 mX7
Aspect°30 mX8
Human activityPopulation densityPerson/km20.1 kmX9
Distance to the roadkm0.25 kmX10
Distance to settlementkm0.25 kmX11
RiverDistance to the riverkm0.25 kmX12
OtherVegetation type-1 kmX13
Soil type-1 kmX14
Landform type-1 kmX15
Table 2. Classifications of the NDVI.
ClassLevelNDVI
1Bare soil vegetation 0–0.2
2Low vegetation 0.2–0.4
3Medium vegetation0.4–0.6
4Relatively high vegetation0.6–0.8
5High vegetation 0.8–1
Table 3. Consistency of vegetation changes trend.
Slope|Z|Hurst IndexChange Types
>0>1.96H > 0.5Consistent and significant improvement
<0>1.96H > 0.5Consistent and significant degradation
>0<1.96H > 0.5Consistent and slight improvement
=0--Stable or non-vegetated area
<0<1.96H > 0.5Consistent and slight degradation
>0-H < 0.5Inconsistent and changed from improvement
<0-H < 0.5Inconsistent and changed from degradation
Disclaimer/Publisher’s Note: The statements, opinions and data contained in all publications are solely those of the individual author(s) and contributor(s) and not of MDPI and/or the editor(s). MDPI and/or the editor(s) disclaim responsibility for any injury to people or property resulting from any ideas, methods, instructions or products referred to in the content.

