Article

Characteristics, Source and Risk Assessment of Soil Polycyclic Aromatic Hydrocarbons around Oil Wells in the Yellow River Delta, China

1
Chinese Research Academy of Environmental Sciences, Beijing 100012, China
2
Command Center for Comprehensive Survey of Natural Resources, China Geological Survey Bureau, Beijing 100055, China
3
College of Ecology, Lanzhou University, Lanzhou 730000, China
*
Authors to whom correspondence should be addressed.
Water 2023, 15(18), 3324; https://doi.org/10.3390/w15183324
Submission received: 29 July 2023 / Revised: 11 September 2023 / Accepted: 15 September 2023 / Published: 21 September 2023
(This article belongs to the Special Issue Water Environment Pollution and Control, Volume II)

Abstract

:
The Yellow River Delta (YRD) is the most complete wetland ecosystem in the warm temperate zone of China and is rich in oil resources. However, with petroleum extraction and the development of the economy, pollution of the YRD has been paid increasing attention, in particular, pollution via polycyclic aromatic hydrocarbons (PAHs), as they have caused great harm to human health and the ecosystem balance. Based on the investigations of a research group in 2009, this study re-collected samples according to the same sampling points and analyzed the concentration, composition, source, ecological risk and health risk of PAHs in 2021. The concentration of ΣPAH16 in the surface soil of YRD in 2009 ranged from 2.6 to 8275.46 ng/g, with an average of 1744.41 ng/g. The concentration of ΣPAH16 in 2021 ranged from 56.25 to 582.56 ng/g, with an average of 149.63 ng/g. Therefore, the pollution situation in the YRD in 2021 was significantly improved compared with 2009. The composition of PAHs in soil in 2009 and 2021 was similar, which was dominated by low-ring PAHs. The evaluation results of the toxicity equivalent factor method showed that there was no potential ecological risk in the soil in 2009 and 2021. The evaluation results of the lifetime cancer risk increment model showed that the incremental lifetime cancer risk models (ILCRs) of soil PAHs in 2009 and 2021 were lower than the safety threshold of 10−6; therefore, there was no carcinogenic risk. The existing management measures for oil wells need to be further promoted to protect the regional ecological environment in the YRD.

1. Introduction

The Yellow River Delta (YRD) is the most primitive, youngest and most complete wetland ecosystem in the warm temperate zone of China and even the world [1]. There are abundant mineral resources dominated by oil in the Yellow River Delta. With the in-depth development of oil resources and the production and construction of other industries, the ecological environment of the Yellow River Delta has also undergone great changes [2]. The discharge of a large number of pollutants seriously threatens the safety of the ecosystem in the region [3,4], among which the problem of oil pollution is particularly prominent. Previous studies have shown that PAH pollution in surface water and groundwater was low, and the soil and sediment pollution was moderate. The former pollution was mainly from oil input and oil combustion, and the latter was mainly from wood, coal combustion and oil input [5].
The pollution of polycyclic aromatic hydrocarbons (PAHs) in the YRD has attracted the attention of scholars. PAHs are a class of persistent organic pollutants that are widely present in various environments [6]. The sources of PAHs in the environment are mainly divided into natural sources and anthropogenic sources [7]. The main cause of PAH pollution at present is anthropogenic sources, including petroleum and pyrolysis sources. The large quantity of PAHs produced by human activities usually enter the atmospheric environment first and then eventually converge into the soil, sediment and water environment through surface runoff, dry and wet deposition, etc. [8]. PAHs can also be bioenriched, accumulating and transferring into the food chain, thus increasing the risk level [9]. PAHs are not only carcinogenic, teratogenic and mutagenic but also phototoxic [10,11], causing great harm to human health.
Previous pollution investigations in soil and sediment have been performed in the YRD [10,12,13,14]. For example, the concentration of PAHs in 61 surface soil samples from the YRD has been studied. Results have shown that the total concentration of PAHs ranged from 27 to 735 ng/g, with the highest concentration occurring in the central and southern YRD, which was related to oil exploration. The PAHs in the surface soil of the YRD were mainly from coal and biomass burning, oil leakage and/or vehicle emissions (Yuan et al. 2014). In addition, it was found that the concentration of PAHs in soil around oil wells at different ages increased with the increase in mining time. From the source point of view, the soil near the new oil wells was mainly polluted by oil sources, while the old oil wells were mostly related to combustion sources [15]. The distribution of coastal sediments in the YRD is different. The concentration of PAHs in surface sediments near the Yellow River estuary is lower than that in the northern and southern coastal wetlands of the YRD [16]. Other studies have found that the PAH pollution level in the Yellow River Delta Nature Reserve is relatively low, and the potential ecological risk level is extremely low, but there is a potential carcinogenic risk. In addition, the spatial distribution characteristics of PAH concentration and PAH health risk value are similar, which indicates that the carcinogenic risk of PAHs is proportional to its content [17]. These research results have important theoretical significance for the protection of the ecological environment and the management of the Yellow River Delta.
At present, the study of oil pollution in the YRD is mainly the result of single sampling observations, which renders it difficult to reflect the long-term change characteristics of pollution in the YRD. There are few studies on the distribution of PAHs and their changes in different years in this area. Based on the research group’s survey in the Yellow River Delta in 2009, this paper collected samples from the same sampling points to analyze the concentration, composition, source, ecological risk and health risk of PAHs and to understand the change in PAH pollution in the region in the recent 10 years.

2. Materials and Methods

2.1. Study Area

The Yellow River Delta is located in East China (118°07′–119°18′ E, 36°55′–38°12′ N) (Figure 1). About 96% of its area is distributed in Dongying City, Shandong Province. It is one of the most important wetland protection sites in the world. It is the breeding habitat and migration transit site of rare birds in Northeast Asia and the Western Pacific. The research area of this paper is mainly located in Xianhe Town, Gudao Town and Huanghekou Town of Dongying City, with a total area of 2152.7 km2. Affected by the Eurasian continent and the Western Pacific, the study area belongs to the warm temperate semi-humid continental monsoon climate, with four distinct seasons and a hot summer and cold winter. The annual average temperature is between 11.7 and 12.8 °C. The average annual precipitation is about 530~630 mm, of which the summer rainfall accounts for more than half of the year. The rain and heat are in the same period, which is conducive to the growth of plants and crops and can easily cause flood disasters [18,19]. According to the statistics of soil census data, the study area can be divided into five soil types: cinnamon soil, saline soil, fluvo-aquic soil, mortar black soil and paddy soil, among which fluvo-aquic soil and saline soil account for 95% of the total soil area. The YRD is rich in natural resources, with a large number of brine, oil and gas, geothermal, mineral and other resources. It is an important energy base in China [20].

2.2. Sample Collection

The soil samples in this study were collected in July 2021, and the collection areas were mainly concentrated in Xianhe Town, Gudao Town and Huanghekou Town of Dongying City. The sampling points were collected in accordance with the sampling points of the field survey conducted in 2009 around the wells. At each sample point, soil samples of 0–20 cm of surface layer were taken according to the plum sampling method. The basic physical and chemical properties such as pH and temperature were measured. The samples were mixed evenly; then, about 1kg of the evenly mixed samples were taken by the quartering method and put into a Ziplock bag for marking. A total of 15 soil samples were collected and transported back to the laboratory for freezing (−20 °C) preservation at low temperature and in darkness. The notations O1–O15 are soil points in 2009 and 2021 (Figure 1).

2.3. Laboratory Analysis

2.3.1. Determination of PAHs

According to the HJ805-2016 standard, polycyclic aromatic hydrocarbons in soil were determined by gas chromatography–mass spectrometry. The determination process included sample preparation, extraction, concentration, purification, elution and constant volume determination as follows. After removing impurities such as gravel and roots in the sample, 20 g was weighed and an appropriate amount of anhydrous sodium sulfate was added to dehydrate. The sample was ground into fine particles. About 5 g of samples was weighed and extracted by the Soxhlet extraction method. An amount of 100 mL acetone-n-hexane mixed solvent was added to the sample and extracted for 16~18 h, refluxing 4~6 times per hour. The extract was concentrated to about 2 mL using a parallel concentrator. Then, the samples were purified by a silica gel chromatography column. An amount of 25 mL dichloromethane-pentane mixed solvent was added for elution and the eluent was collected. After the eluent was concentrated again, an appropriate amount of acetone-n-hexane mixed solvent was added, and the volume was fixed to 1 mL for determination. Gas chromatography–mass spectrometry with a quartz column (DB-5MS, 30 m × 0.25 mm × 0.25 μm) was used to quantify the PAH concentrations. The carrier gas type is high-purity helium. The sample was injected without a shunt. The injection volume was 1 μL and the inlet temperature was 280 °C. The oven temperature program was as follows: the initial temperature was 80 °C, held for 2 min, then heated at 20 °C/min to 180 °C, then heated at 10 °C/min to 290 °C, and held for 5 min.

2.3.2. Quality Control

In order to ensure the accuracy and reliability of the data, strict quality control was carried out throughout the experiment. In the determination of PAHs in soil and sediment, not only was o-fluorobiphenyl added to each sample for recovery detection but blank experiments and parallel sample tests were also carried out. The spiked recoveries of 16 PAHs were between 40% and 150%. The blank experiment was performed once every 20 samples, and the relative standard deviations of parallel samples were all within 20%. The external standard method was used to quantitatively analyze PAHs, and the correlation coefficients of the standard curves were all above 0.995.

2.4. PAH Source Apportionment Method

2.4.1. Positive Definite Matrix Factorization Model (PMF)

The most critical step in the source apportionment of the PMF model is the determination of the number of factors. In the robust model, the number of factors is set to 3~6, and 20 iterations are carried out, respectively. Considering the factors such as the residual and fitting effect, the 4-factor model was used to analyze the source of PAHs across the 21 years, and the 6-factor model was used to analyze the source of PAHs in the soil in 2009.

2.4.2. Diagnostic Ratios

Diagnostic ratios are commonly used in the source apportionment of PAHs [21]. Based on the characteristics of similar kinetic mass transfer coefficients and thermodynamic distribution coefficients between isomeric PAHs, the heat source and petroleum source can be distinguished by their concentration ratio [22]. To differentiate the PAHs at our sampling sites with respect to petroleum vs. combustion sources, we applied two isomeric ratios.

2.5. Ecological Risk Assessment Method of PAHs

2.5.1. Toxic Equivalent Factor Method (TEQ)

Among the 16 US EPA priority PAHs, Benzo[a]pyrene (BaP) is used as a marker for estimating the carcinogenic potency of PAHs [23]. To evaluate and quantify the individual PAH and ∑PAH7c carcinogenic toxic potency, the toxicity equivalency factors (TEFs), which define the carcinogenic potency of the individual PAH relative to Benzo[a]pyrene (BaP), were used to estimate the toxic equivalent of PAH monomer relative to BaP (TEQBaP) in this study [24]. This evaluation approach pays attention to the estimation of carcinogenic PAHs. The toxic equivalent factor (TEF) of BaP was set to 1, and the remaining PAHs were assigned to the corresponding TEF according to the difference in toxicity (Table 1). The TEFs listed in Table 1 are the most reasonable values for the relative titers of PAHs currently available and using them would significantly reduce the uncertainty in risk assessments involving PAHs [24]. The calculation formula is as follows:
T E Q B a P = C i × T E F i
where Ci is the exposure concentration of the ith PAHs; TEFi is the toxic equivalent factor corresponding to the ith PAHs. The greater the toxic equivalent factor of monomer PAHs, the greater the toxicity.

2.5.2. Effect Interval Low Median Method (ERL/ERM)

The evaluation criteria proposed by Long et al. [25] are an effective tool to identify the potential ecological risks of PAHs [26,27]. The tool uses the effects range low (ERL) and effects range median (ERM) as thresholds; if the PAH concentration is less than ERL, the probability of adverse toxic effects of PAHs on organisms is less than 10%, and ecological risks rarely occur. ERL greater than or equal to ERM indicates that PAHs have more than 50% probability of causing negative effects on the ecological environment, and risks may occur frequently. Between the two, the PAH concentration will occasionally harm the ecological environment; that is, the concentration has potential ecological risks.
In order to quantitatively predict the comprehensive ecological toxicity of various PAHs, the ecological risk can be further evaluated by the mean quotient of ERM (M-ERM-Q). The calculation formula is:
M E R M Q = i = 1 n C i E R M i / n
where Ci is the exposure concentration of individual PAHs; ERMi is the median effect range (ERM) corresponding to individual PAHs; and n is the type of PAHs. When M-ERM-Q < 0.1, the possibility of ecological risk is low; when 0.1 < M-ERM-Q < 0.5, there is a 30% probability of toxicity; when 0.5 < M-ERM-Q < 1.5, the probability of medium and high toxicity is about 50%; when M-ERM-Q > 1.5, the ecological risk is high, and the probability of high toxicity is about 75%.

2.6. Health Risk Assessment Methods of PAHs

Incremental Lifetime Cancer Risk Models (ILCRs)

The incremental lifetime cancer risks (ILCRs) model was used in this paper to quantitatively evaluate the health risk of PAHs in soil, that is, the incidence of cancer caused by a certain dose of carcinogens at a certain time. There are three main ways for humans to be directly exposed to soil PAHs: ingestion (ILCRingestion), inhalation (ILCRinhalation) and dermal contact (ILCRdermal) [28]. The cancer risk calculation formula for each pathway is as follows:
C S = ( P A H i × T E F i )
I L C R i n g e s t i o n = C S × C S F i n g e s t i o n × B W 70 × I R s o i l × E F × E D / B W × A T × 10 6
I L C R i n h a l a t i o n = C S × C S F i n h a l a t i o n × B W 70 I R a i r × E F × E D / B W × A T × P E F
I L C R d e r m a l = C S × C S F d e r m a l × B W 70 × S A × A F × A B S × E F × E D / B W × A T × 10 6
I L C R s = I L C R i n g e s t i o n + I L C R i n h a l a t i o n + I L C R d e r m a l
where CS is the toxic equivalent concentration (mg/kg) of monomer PAHs; PAHi is the exposure concentration of the i th PAHs; TEFi is the toxic equivalent factor of monomer PAHs (Table 2); CSF is the carcinogenic slope factor (mg/(kg·d)), which was determined by the carcinogenic ability of BaP. The values of CSFingestion, CSFinhalation and CSFdermal were 7.3, 3.85 and 25, respectively. BW is body weight, IRsoil is soil inhalation rate, EF is exposure frequency, ED is exposure time, AT is the average life of carcinogens, IRair is inhalation rate, PEF is soil particle emission factor, SA is skin surface exposure area, AF is skin adhesion factor, and ABS is skin adsorption parameter. The specific parameter values are shown in Table 2. ILCRs are the sum of the carcinogenic risks of the three exposure pathways: when ILCRs < 10−6, the carcinogenic risk is negligible; when ILCRs > 10−4, this indicates a high carcinogenic risk; between the two indicates a potential carcinogenic risk.

3. Results and Discussion

3.1. PAH Concentration Characteristics

In 2009, the concentration of PAHs in the samples varied greatly, ranging from 2.6 to 8275.46 ng/g, with an average of 1744.41 ng/g, according to the analysis of surface soil samples collected by the research group in the YRD (Table 3). Compared with ΣPAH16 concentrations in the YRD studied in other years, such as Yuan et al. (27–753 ng/g, with an average of 118 ± 132 ng/g) [29]; Yuan et al. (79.2–311 ng/g, with an average of 119 ng/g) [30]; and Fu et al. (278.7–733.5 ng/g, with an average of 382.5 ± 128.4 ng/g) [15], PAH concentrations in soil samples investigated in 2009 were higher on average. Among soil samples, four samples exceeded the mean value, accounting for 26.67% of total soil samples, and eleven samples were below the mean value, accounting for 73.33% of total soil samples. The concentration of seven carcinogenic PAHs ranged from ND to 481.35 ng/g, with an average of 59.42 ng/g, accounting for 3.41% of ΣPAH16. The BaP concentration ranged from ND to 22.71 ng/g, with an average of 2.51 ng/g, respectively, accounting for 4.23% and 0.14% of ΣPAH7 and ΣPAH16. The other PAH monomers were detected to varying degrees, except for Ace and DahA, and the detection rate was between 7% and 100%. Flu had the highest detection rate, followed by Nap and Phe, and Acpy had the lowest detection rate (Table 3). According to Maliszewska-Kordybach’s [31] definition of soil PAH pollution, only one sample had a concentration below 200 ng/g, accounting for 6.67% of total soil samples. There were two samples with a concentration range of 200–600 ng/g, two samples with a concentration range of 600–1000 ng/g, and ten samples with a concentration higher than 1000 ng/g, respectively, accounting for 13.33%, 13.33% and 66.67% of total soil samples. The above results show that more than half of the soil samples in the study area reached the level of heavy pollution, which suggests the pollution situation is serious and corresponding measures need to be taken to repair and control the situation.
In 2021, the concentration of PAHs in soil samples ranged from 56.25 to 582.56 ng/g, with an average of 149.63 ng/g, collected from the YRD corresponding to the location information in 2009 (Table 4). According to the study of PAH pollution in the soil around oil wells in the Yellow River Delta in other years, the PAH concentration decreased with the increase in years, which indicates that the PAH pollution has been effectively managed [15,32] (Table 5). From the perspective of spatial distribution, the PAH concentration in the soil of the northern oil field area of the Yellow River Delta is higher than that in the southern area of the Yellow River, the Yellow River estuary and the former route [29,30]. Among them, four samples exceeded the mean value, accounting for 26.67% of total soil samples, and eleven samples were below the mean value, accounting for 73.33% of total soil samples. The concentration of seven carcinogenic PAHs ranged from ND to 291.28 ng/g, with an average of 28.3 ng/g, accounting for 18.91% of ΣPAH16. The BaP content ranged from ND to 107.88 ng/g, with an average of 13.19 ng/g, respectively, accounting for 46.61% and 8.82% of ΣPAH7 and ΣPAH16. The other PAH monomers, except for Ace, Acpy, DahA, BkF and BghiP, were detected to varying degrees, and the detection rate was between 7% and 100%. The detection rate of Nap was the highest, followed by BaP. The detection rate of Chr was the lowest (Table 4). In previous reports, Nap and Phe dominated ΣPAH16 in the soil of the YRD [33], and Chr, Phe and Pyr dominated ΣPAH16 in the soil of the YRD [15]. Among the 15 samples, only two samples were slightly polluted, accounting for 13.33% of total soil samples, and the remaining samples were not polluted. Previous research showed that 60.1% of the soil samples were slightly polluted by ΣPAH16, and 18.1% of the soil samples were moderately polluted [15]. Combined with our research results, the pollution situation in the study area was significantly improved compared with 2009 (Figure 2).
The main reasons may be related to the improvement in production conditions, the enhancement of staff’s awareness of environmental protection and the improvements in technology. According to the research, the water source of the YRD was mostly surface runoff, which caused serious soil and water loss [34,35]. Severe soil erosion may also carry away some PAH pollutants from the soil into rivers and oceans [20,36,37]. This may also be part of the reason for the drop in pollution levels. In addition, there were also studies on oil pollution and soil microbial remediation. Two strains selected by previous researchers from oil-contaminated soil can deal with phenanthrene pollution in a salinity environment, among which strained FM6-1 metabolizes phenanthrene through the “phthalic acid” pathway and strained FM8-1 metabolizes phenanthrene through the “naphthalene” pathway [38]. This may also explain a decrease in the concentration of PAHs in the soil near the well in 2021. However, the proportion of seven carcinogenic PAHs and the most carcinogenic BaP were increasing. The management of PAHs in this area was still worthy of attention.

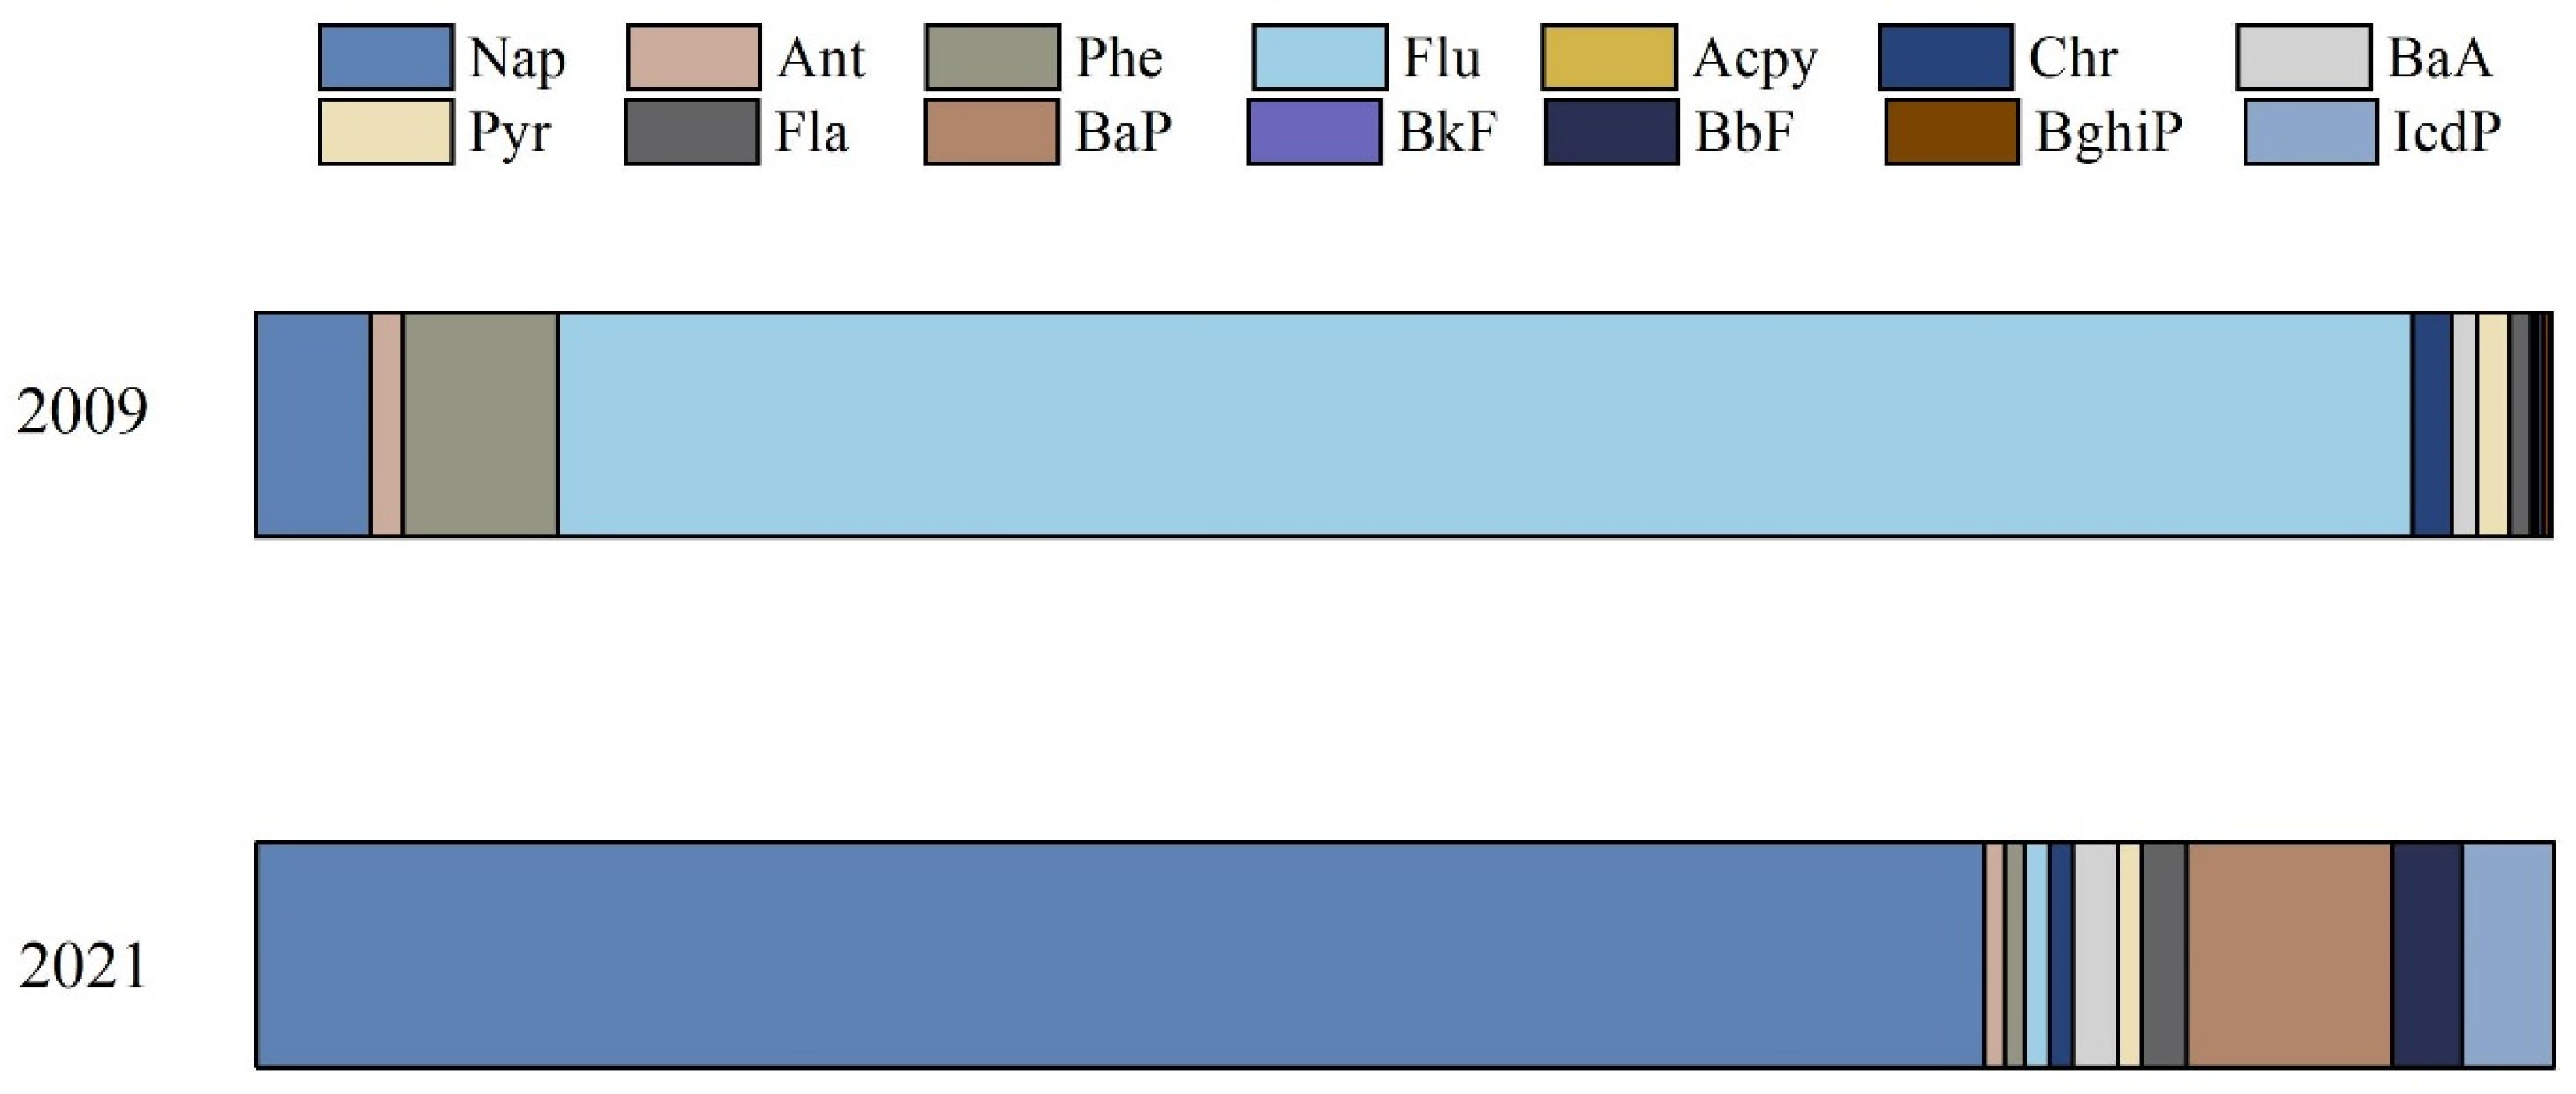
3.2. PAH Component Characteristics

The composition of ΣPAH16 in 2009 and 2021 is shown in Figure 3. In 2009, the soil samples were dominated by low-ring PAHs (2–3 rings). The proportion of each ring in 2009 was 3 rings (88.94%) > 4 rings (5.15%) > 2 rings (4.98%) > 5 rings (0.52%) > 6 rings (0.41%). Among the low-ring PAHs, Flu contributed significantly, accounting for 86.01%. The proportion of each ring in the soil in 2021 was similar to that in 2009, and the low-ring PAHs were dominant. The proportion of each ring in 2021 was 2 rings (75.38%) > 5 rings (12.19%) > 4 rings (5.78%) > 6 rings (3.83%) > 3 rings (2.82%). The difference is that Nap contributed the most to 96.39% of the low-ring PAHs in the soil in 2021, and Flu accounted for only 1.39%. Low-ring PAHs mainly exist in the environment in a non-persistent gaseous form [39,40]. In contrast, high-ring PAHs are relatively resistant to microorganisms and photolysis [41,42]. In addition, the overall decrease in low cyclic PAHs was 15.72%. With the change in time, the proportion of low-ring PAHs gradually decreased [15,39,43]. The proportion of high-ring PAHs gradually increased from 6.08% to 21.8%. It is speculated that this may be related to the rapid economic development in the past ten years. With the increasing number of chemical factory enterprises, vehicles and the increasing intensity of human activities, oil pollution is still the long-term and main source of PAHs in this area.

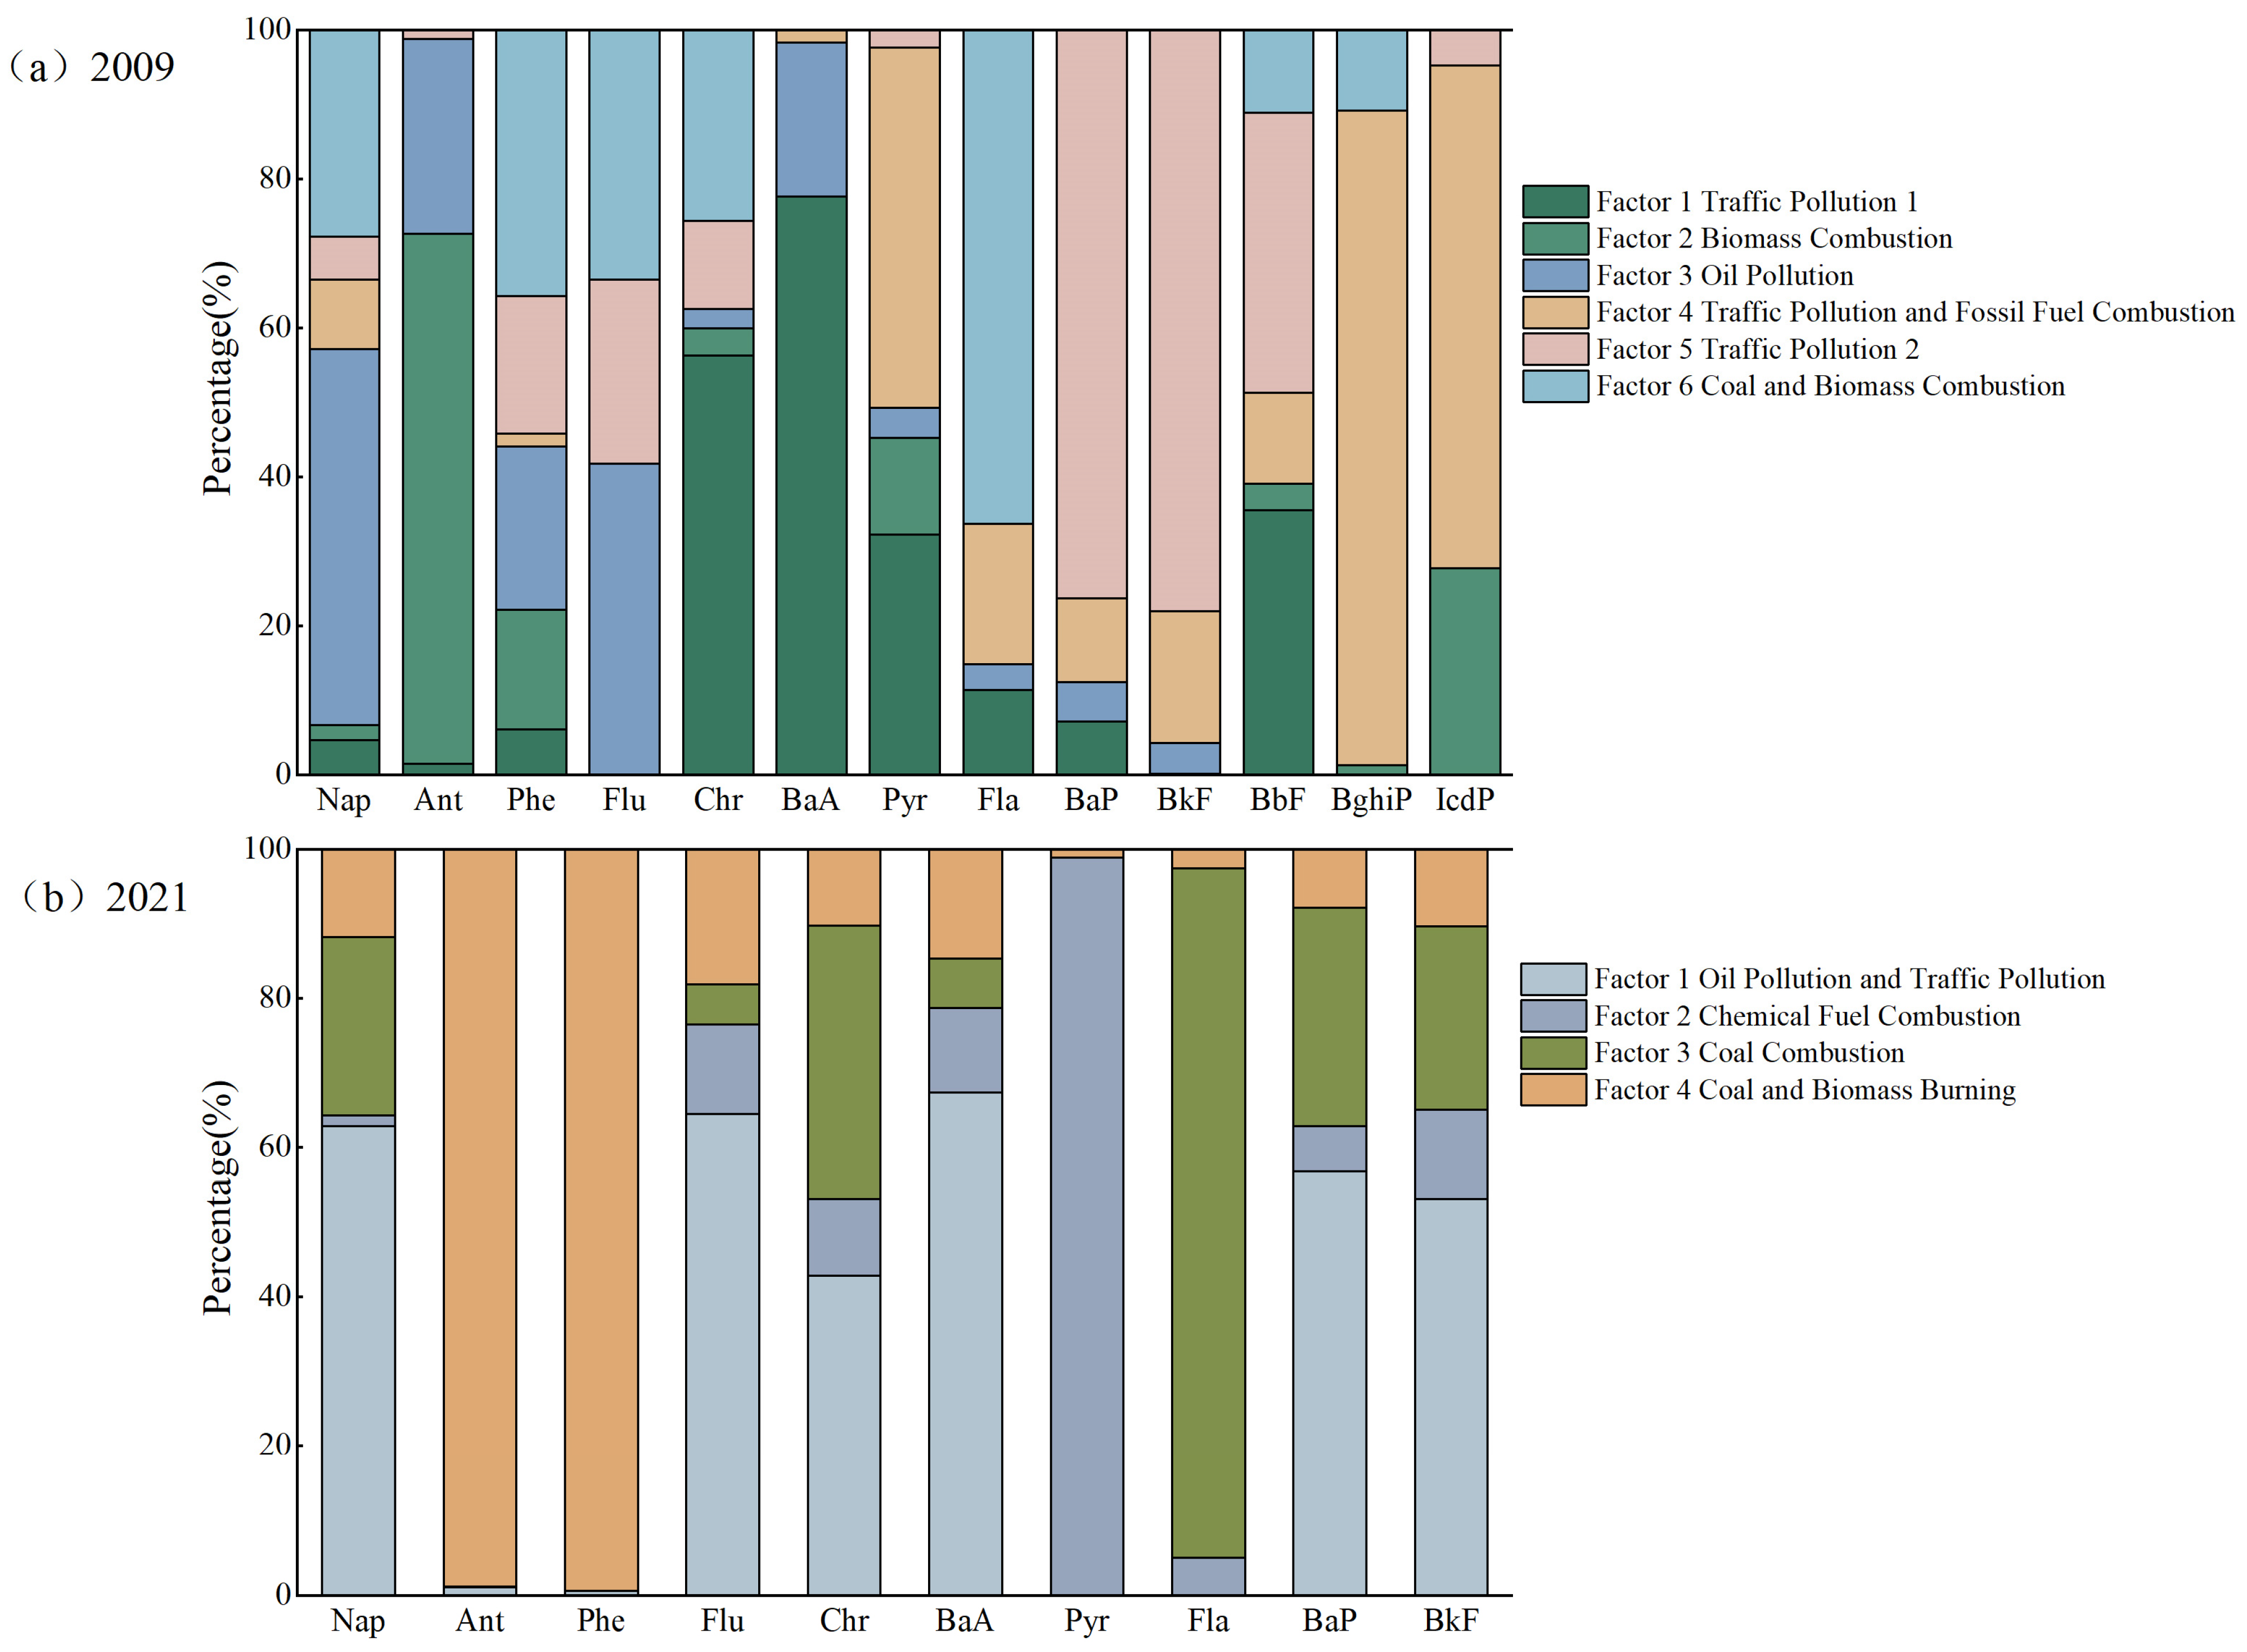
3.3. PAH Source Apportionment

Now, the main cause of PAH pollution is anthropogenic sources, including oil sources and pyrolysis sources. Specifically, oil source refers to oil spill events that occur in the process of oil exploration and development, transportation and storage and offshore ship operations; pyrolysis source refers to the production activities of chemical enterprises such as petroleum processing, coking gas, steel making and iron making, the incomplete combustion of fuel oil, coal, gas, wood and other biomass in daily life, as well as waste incineration, smoking, cooking and frying, and the emission of various vehicle exhaust [44,45]. In general, an individual PAH ratio is used to identify the source of PAHs in the soil [33,46], different PAH molecular weights or different aromatic ring numbers are used to identify different PAH sources [47,48].
Figure 4 shows the source composition of PAHs in soil in 2009 and 2021. The results show that soil PAHs in 2009 were mainly affected by six sources (Figure 4a). The contribution rate of factor 1 to high-ring PAHs is higher, such as BaA (77.7%), Chr (56.36%) and BbF (35.51%). Gasoline and diesel produce BaA and Chr when they are not completely burned [49]. BbF is a typical substance emitted by diesel vehicles [50], so this factor can be identified as traffic pollution source 1. The main load of factor 2 is Ant, which represents the biomass combustion source [51]. Factor 3 has a large load on 2~3 ring PAHs, including NaP, Flu, Ant and Phe. These low molecular weight components are closely related to oil pollution [52,53,54], so factor 3 is considered to be an oil pollution source. BghiP (87.88%), IcdP (67.49%) and Pyr (48.34%) were found to be the higher-loading compounds in factor 4. BghiP is a typical substance of gasoline combustion emissions [55], so factor 4 is a mixed source of traffic pollution and fossil fuel combustion. The load of factor 5 was mainly distributed on BkF (77.98%) and BaP (76.31%), followed by BbF (37.59%). These high molecular weight PAHs represent traffic pollution source 2. The highest contribution rate of factor 6 to Fla was 66.32%. Phe and Flu were medium loads. So, factor 6 could be considered as the combustion of coal and biomass [56].
In 2021, soil PAHs were mainly affected by four sources (Figure 4b). Factor 1 not only has a higher load on low-ring PAHs such as NaP and Flu but also has a greater contribution to the high-ring components BaA, BaP and BkF. Therefore, factor 1 can be identified as a mixed source of oil pollution and traffic pollution [57,58,59]. Factor 2 is dominated by Pyr load, and the contribution rate reaches 98.92%, which is much higher than other compounds, reflecting the source characteristics of fossil fuel combustion [52,60]. Factor 3 has the highest contribution rate to Fla, which is 92.41%, representing the source of coal combustion [52,53,59]. The main loads of factor 4 are Phe (99.38%) and Ant (98.78%), which can be attributed to the combustion of coal and firewood. Therefore, factor 4 can be identified as the combustion source of coal and biomass [51].
Figure 5 shows the contribution rate of each pollution source of soil PAHs in different periods via PMF model analysis. The positive matrix factorization model (PMF) is recommended by the United States Environmental Protection Agency for pollution. A factorization model for source apportionment was first proposed by Paatero et al. [61]. In recent years, it has been widely used in soil, sediment, atmospheric particles and so on. The model can avoid the negative value of factor loading and scores in the application process and further optimize the data by using uncertainty for the model output results to achieve strong reliability.
Common isomeric ratios such as Fla/(Fla + Pyr), Ant/(Ant + Phe), BaA/(BaA + Chr) and Fla/(Fla + Pyr) were used to analyze the possible sources of PAHs in the soil around oil wells in the Yellow River Delta. According to the ratio analysis of Fla/(Fla + Pyr) and Ant/(Ant + Phe) [62,63], the main source of PAHs in the soil of samples A9, A11, A12, A13 and A15 in 2009 was biomass and coal combustion, and the main source of PAHs in the soil of sample A2 in 2009 was petroleum combustion. The PAHs in the soil of other plots were mainly derived from petroleum (Figure 6a). According to the ratio analysis of BaA/(BaA + Chr) and Fla/(Fla + Pyr) [64,65], the main source of PAHs in the soil of samples A11 and A13 in 2009 and B12 in 2021 was biomass and coal combustion, and the main source of PAHs in the soil of plots A2 in 2009 was petroleum combustion. The main source of PAHs in other soil samples was petroleum pollution (Figure 6b).
On the whole, oil pollution, traffic pollution, coal and biomass combustion are the long-term and main sources of PAHs in this area. This is consistent with previous research reports [12,66]. The source contribution rates of PAHs in soil in 2009 and 2021 are slightly different (Figure 5). In 2009, the contribution rate of oil pollution sources was the highest, reaching 39.01%, followed by coal and biomass combustion sources, and traffic pollution and fossil fuel combustion sources (1.53%) contributed the least. In 2021, oil pollution and traffic pollution were the main sources. The other three pollution sources and their contribution rates were coal combustion (29.73%), coal and biomass combustion (2.4%) and fossil fuel combustion (3.99%). Zhao found that PAHs in the surface sediments of the YRD were mainly derived from oil leakage and fossil fuel combustion and had a moderate risk to the local ecosystem [12]. Xu found that PAHs in sediments were mainly derived from oil leakage and fossil fuel combustion and had low to moderate risks to local ecosystems [66]. Studying the sources of PAHs in different periods can not only effectively prevent and control pollution but also provide a theoretical basis for relevant departments to formulate corresponding laws and regulations.

3.4. Ecological Risk Assessment of PAHs

3.4.1. Toxic Equivalent Factor Method (TEQ)

The ecological risk assessment was performed via the toxic equivalent of PAH monomer relative to BaP (TEQBaP) [24]. The TEQ concentrations of ΣPAH16 in soil ranged from 0.003 to 34.76 ng/g in 2009, with an average of 7.49 ng/g. The TEQ of seven carcinogenic PAHs accounted for 73.79% of the total TEQ. The monomer with the largest contribution to the total TEQ was BaP (33.53%), followed by BaA (25.89%). The TEQ concentrations of ΣPAH16 in soil in 2021 ranged from 0.06 to 124.57 ng/g, with an average of 14.71 ng/g, which was about twice the TEQ of 2009. The TEQ of seven carcinogenic PAHs accounted for 99.1% of the total TEQ, an increase of 25.31% from 2009. The carcinogenic risk was also increasing. In general, the TEQ values of different years showed a trend of high-ring PAHs being greater than low-ring PAHs, indicating that high-ring PAHs had high toxicity. Compared with the reference value (33 ng/g), there was basically no potential ecological risk in 2009 and 2021. It is worth noting that although the pollution level in 2009 was much more serious than that in 2021, the ecological risk did not show the same results. On the contrary, the TEQ value in 2021 was larger, which was mainly due to the dominant position of the Flu monomer in soil PAHs in 2009, but its toxic equivalent factor was smaller. In 2021, BaP in the soil was not only the most abundant but also the most toxic, accounting for 89.7% of the total TEQ. Therefore, the TEQ was larger, especially in the O10 plot, which exceeded the target value by about 3.8 times (Figure 7), and may have been affected by PAHs, with potential ecological risks. Based on the analysis of sampling points and human activities, the sampling point is located beside the road. The emissions of motor vehicle exhausts and the lifestyles of the surrounding residents are conducive to the increase in PAH toxicity in the soil. Therefore, the traffic flow should be controlled to reduce the ecological risk. The ecological risk of the O4 plot has been significantly reduced (Figure 7), which may be related to the reduction in the use of fuels such as coal and biomass, which effectively prevents and controls Flu pollution.

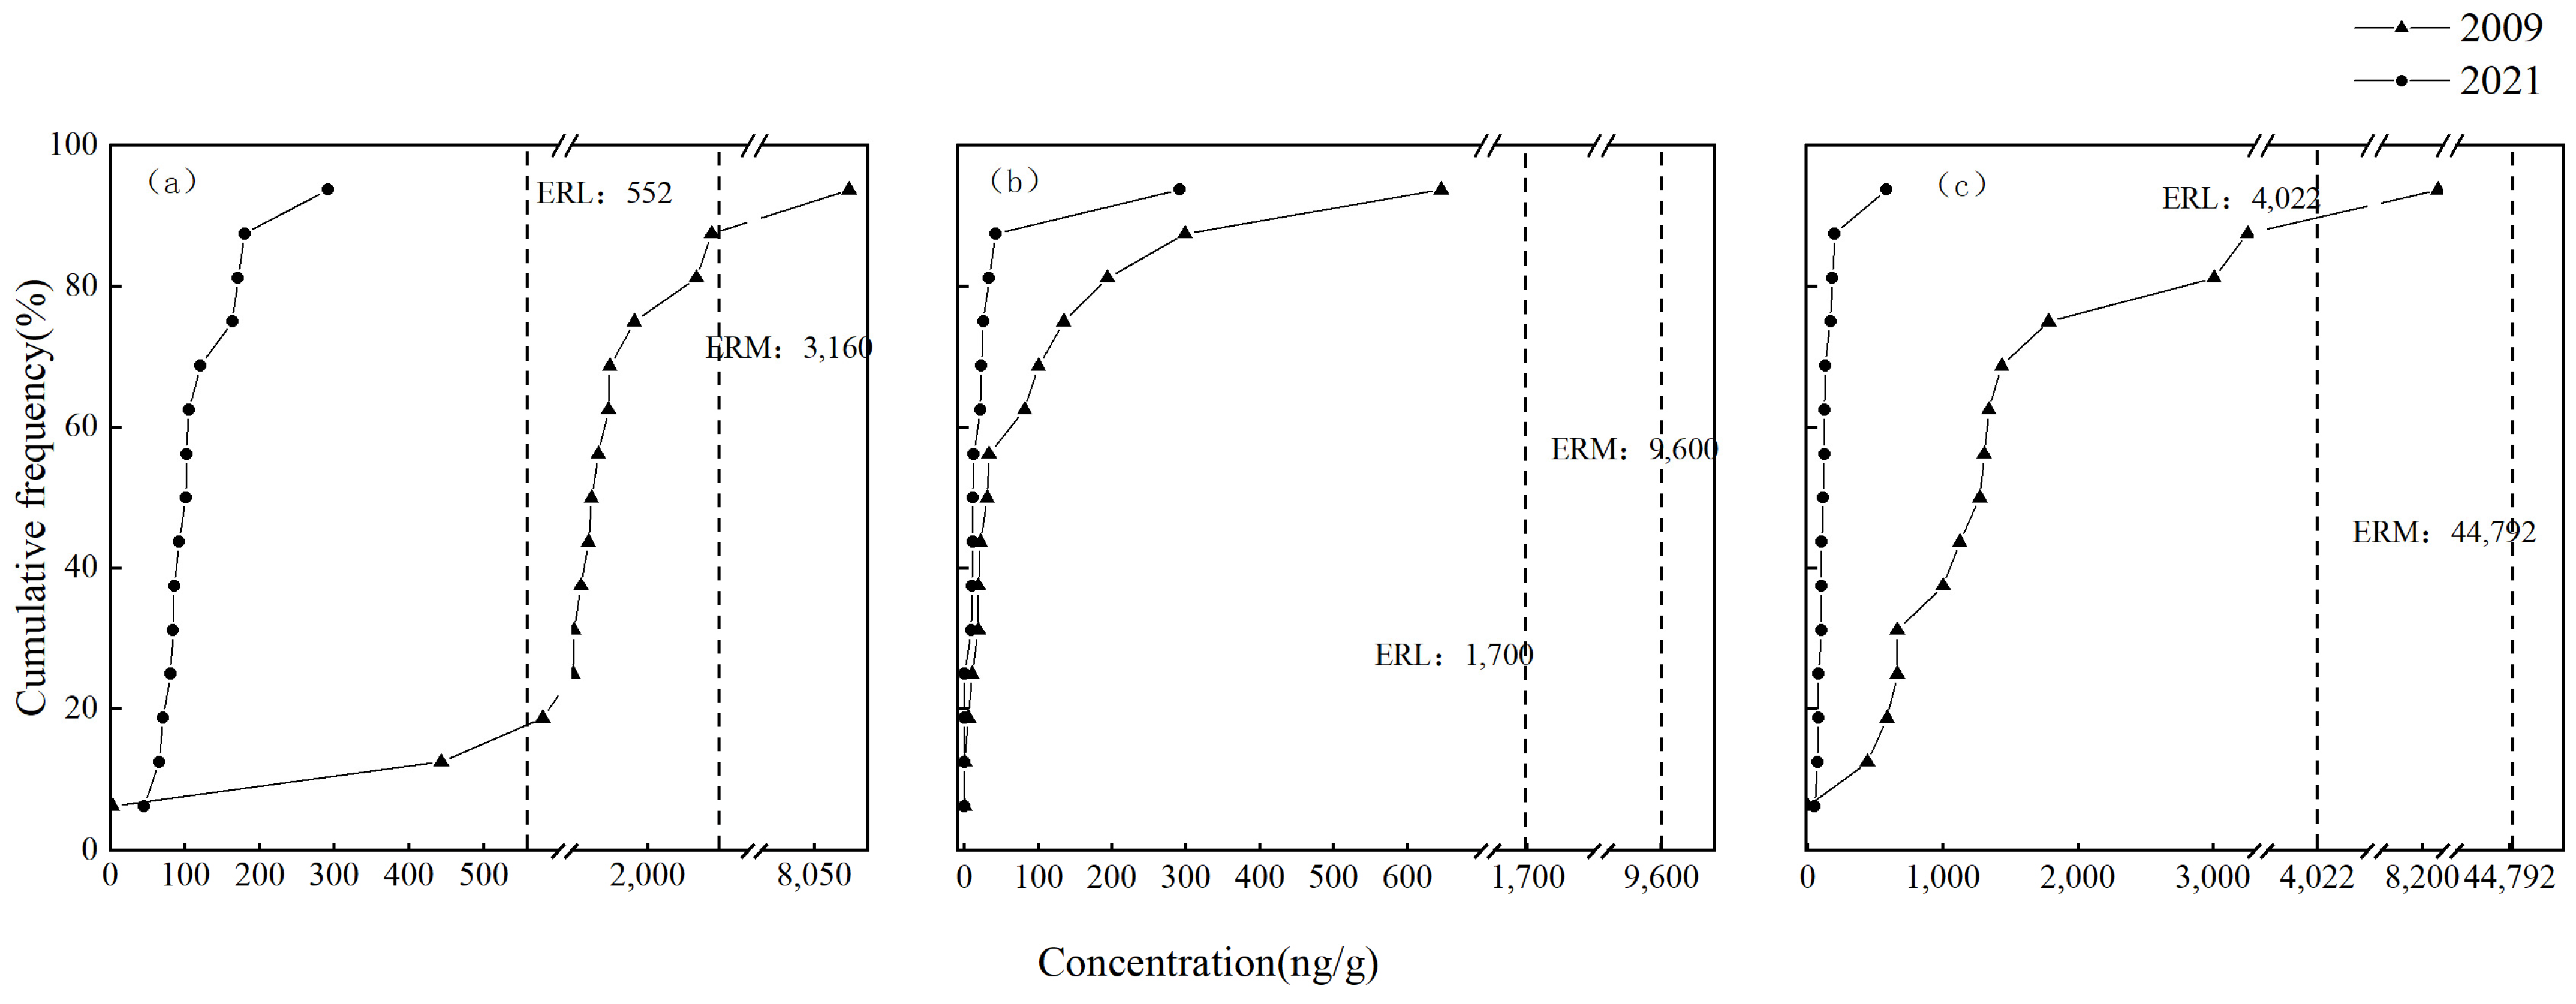
3.4.2. Effect Interval Low Median Method (ERL/ERM)

Figure 8 and Figure 9 show the ecological risk assessment results of individual PAH, low-ring PAHs, high-ring PAHs and ΣPAH16 in soil in 2009 and 2021. According to Figure 8, Flu concentrations detected in 12 of the 15 soil samples in 2009 were higher than the ERM value, indicating that 80% of the samples had frequent ecological risks. In addition, the concentrations of Nap in two sites (13%), Ant in one site (7%), Phe in two sites (13%) and Flu in two sites (13%) were between ERM and ERL, indicating that these monomeric PAHs occasionally produced ecological risks in their corresponding sampling points. At the same time, IcdP was also detected at two sampling points, which was harmful to the ecological environment. The ecological risk of other PAHs was small. In 2021, the ecological risk of each monomer PAH in the soil was significantly improved, and only three sampling points (20%) had Nap concentrations between ERM and ERL, with potential ecological risks. The concentrations of other PAHs in all sampling points were lower than ERL, and there was no negative ecological effect.
Compared with the low-ring PAHs and ΣPAH16 in some samples in 2009 that will cause harm to the ecological environment, the concentrations of low-ring PAHs, high-ring PAHs and ΣPAH16 in soil samples in 2021 will not only decrease but also be less than the ERL values, and there is basically no ecological risk (Figure 9). It shows that the ecological environment quality of the study area is developing well, and the environmental protection system and policy formulated on the prevention and control of PAH pollution have achieved initial success. The future protection in the YRD will continue to be aimed at regulating and reducing PAH pollution and promoting ecological protection and high-quality development in the Yellow River basin.

3.5. Health Risk Assessment of PAHs

Domestic and foreign researchers mainly use the incremental lifetime cancer risk model to assess the health risks of PAHs in soil. Halfadji et al. studied the health risks of PAHs in soil in northwestern Algeria and found that adults and children had the highest potential cancer risk and adolescents had the lowest risk [67]; Zheng et al. combined the PMF model with the lifetime cancer risk increment model to analyze the source of cancer risk and found that biomass burning was the main factor causing the carcinogenicity of soil PAHs in the Chengdu Economic Zone [68]. Table 6 shows the carcinogenic risk values of soil PAHs under three exposure pathways in 2009 and 2021.
In 2009, the carcinogenic risks of soil PAHs to adults and children through three exposure pathways of ingestion of soil, respiratory intake and skin contact were, respectively, 8.25 × 10⁻¹²~1.1 × 10⁻⁷ and 3.34 × 10⁻¹²~4.46×10⁻⁸, and the average values were, respectively, 2.38 × 10⁻⁸ and 9.62 × 10⁻⁹ (Table 6). The carcinogenic risks of PAHs in soil to adults and children in 2021 were 1.78 × 10⁻¹⁰~3.95 × 10⁻⁷ and 7.22 × 10⁻¹¹ and 1.6 × 10⁻⁷, respectively, with an average of 4.67 × 10⁻⁸ and 1.89 × 10⁻⁸, respectively (Table 6). In terms of time, ILCRs in both years were lower than the safety threshold of 10−6, and there was no carcinogenic risk. Compared with other studies on health risk assessment of soil PAHs in the YRD [14,17], the health risks of soil PAHs in this study were lower in 2009 and 2021 on average (Table 7). Consistent with the trend of ecological risk, the health risk in 2021 was slightly higher than that in 2009 mainly because the toxic equivalent factor of BaP was large. Despite this, the average ΣPAH16 content in the surface soil of the Yellow River Delta in 2009 was ten times that of the average ΣPAH16 content in 2021. The soil PAH status in 2021 was at the unpolluted level. Therefore, compared with 2009, the soil pollution situation in 2021 is significantly better. It is worth noting that in many organizations, a lifetime cancer risk in the vicinity of 10−6 and 10−4 connotes a potential hazard. For instance, Tarafdar et al. (2018) found that fly ash PAH ILCR values of adults and children near oil refineries in India were, respectively, 1.823 × 10⁻⁵ and 1.854 × 10⁻⁵ [69]. The simulated risk exceeded the negligible risk of 10−6 but fell below the acceptable risk benchmark of 10−4, which meant that people from both age groups have a plausible threat of cancer occurring [69].
Skin contact and ingestion of soil are the main means of soil PAH exposure, which was consistent with previous studies [13,14,70]. Zheng et al. used the lifetime cancer risk increment (ILCR) to evaluate the polycyclic aromatic hydrocarbons in farmland soil in Ningde. The results showed that the ILCR value ranged from 7.1 × 10⁻⁴ to 1.1 × 10⁻³, which mainly caused moderate to high cancer risk to human health through soil intake and skin contact [13]. Xie found that among the three exposure pathways, skin contact was the most important exposure mode of soil PAHs, followed by oral ingestion, and inhalation exposure was minimal [14]. Studies have shown that long-term exposure to high concentrations of PAHs in the environment through skin contact, oral and nasal intake would cause damage to the respiratory system, nervous system, liver and kidneys, causing lung cancer, nasopharyngeal carcinoma, skin cancer, gastric cancer and other diseases, which would cause great harm to health [71,72,73,74]. Therefore, it is essential to clarify the concentration, content and health risk of ΣPAH16 [43,75] and actively study and improve the pollution status of PAHs. From the perspective of the population, the health risk of soil PAH pollution in adults is higher than that in children, because ILCRdermal contributes the most to ILCRs, which was inconsistent with previous studies [14,17,67,69]. The specific causes need to be further studied, so caution should be taken when referring to the management measures of the threat of PAHS pollution to adults and children in the YRD.

4. Conclusions

Based on the investigation of the research group in 2009, this study re-collected samples according to the same sampling points and analyzed the concentration, composition, source, ecological risk and health risk of PAHs. The concentration of ΣPAH 16 in the surface soil of the Yellow River Delta in 2009 ranged from 2.6 to 8275.46 ng/g, with an average of 1744.41 ng/g, which reached the level of severe pollution. The concentration of ΣPAH 16 in 2021 ranged from 56.25 to 582.56 ng/g, with an average of 149.63 ng/g, which was unpolluted. The composition and distribution characteristics of PAHs in the soil in 2009 and 2021 were similar, and low-ring PAHs are dominant. The main source of soil PAHs in 2009 was oil pollution. In 2021, soil PAHs were mainly affected by oil pollution and traffic pollution, which further confirmed the analysis results of the proportion of rings. The evaluation results of the toxicity equivalent factor method showed that there was no potential ecological risk in the soil in 2009 and 2021, but the TEQ value in 2021 was large. It was mainly because the Flu monomer in the soil PAHs in 2009 was dominant, but its toxicity equivalent factor was small. The ecological risk of each monomer of PAH also improved significantly. Only 20% of the NaP samples had potential ecological risks, and the remaining PAHs had no negative ecological effects. The evaluation results of the lifetime cancer risk increment model showed that the ILCRs of soil PAHs in 2009 and 2021 were lower than the safety threshold of 10−6, and there was no carcinogenic risk. From the perspective of exposure pathways, the highest carcinogenic risk was skin contact, followed by ingestion of soil, and the lowest carcinogenic risk was respiratory intake.

Author Contributions

Conceptualization, Y.W. and Y.Z.; methodology, Y.W., Y.Z. and Y.Q.; software, Y.W., Y.Z., Q.Z. and Y.H.; validation, Y.W. and Y.Z.; formal analysis, Y.W., Y.Z., Y.H. and H.H.; investigation, Y.W., Y.Z., Y.H., H.H. and Q.Z.; resources, Li Junsheng, Y.Q. and N.X.; data curation, Y.W. and Y.Z.; writing—original draft preparation, Y.W. and Y.Z.; writing—review and editing, Y.W. and Y.Z.; visualization, Y.W., Y.Z. and Y.H.; supervision and project administration, J.L., Y.Q. and N.X.; funding acquisition, J.L. and Y.Q. All authors have read and agreed to the published version of the manuscript.

Funding

This research was funded by the Budget Surplus of Central Financial Science and Technology Plan: 2021-JY-05.

Data Availability Statement

The data presented in this study are available on request from the corresponding authors.

Conflicts of Interest

The authors declare no conflict of interest.

References

  1. Wang, C.; Du, J.; Gao, X.; Duan, Y.; Sheng, Y.J. Chemical characterization of naturally weathered oil residues in the sediment from Yellow River Delta, China. Mar. Pollut. Bull. 2011, 62, 2469–2475. [Google Scholar] [CrossRef]
  2. Li, X.; Hou, X.; Song, Y.; Shan, K.; Zhu, S.; Yu, X.; Mo, X. Assessing changes of habitat quality for shorebirds in stopover sites: A case study in Yellow River Delta, China. Wetlands 2018, 39, 66–77. [Google Scholar] [CrossRef]
  3. Feng, W.; Wang, T.; Zhu, Y.; Sun, F.; Giesy, J.P.; Wu, F. Chemical composition, sources, and ecological effect of organic phosphorus in water ecosystems: A review. Carbon Res. 2023, 2, 12. [Google Scholar] [CrossRef]
  4. Kuenzer, C.; Ottinger, M.; Liu, G.; Sun, B.; Baumhauer, R.; Dech, S. Earth Observation-based Coastal Zone Monitoring of the Yellow River Delta: Dynamics in China’s Second Largest Oil Producing Region observed over four Decades. Appl. Geogr. 2014, 55, 92–107. [Google Scholar] [CrossRef]
  5. Li, J.; Li, F.; Liu, Q.J.C. PAHs behavior in surface water and groundwater of the Yellow River estuary: Evidence from isotopes and hydrochemistry. Chemosphere 2017, 178, 143–153. [Google Scholar] [CrossRef] [PubMed]
  6. Menzie, C.A.; Potocki, B.B.; Santodonato, J.J. Exposure to carcinogenic PAHs in the environment. Environ. Sci. Technol. 1992, 26, 1278–1284. [Google Scholar] [CrossRef]
  7. Deng, W.; Li, X.G.; Li, S.Y.; Ma, Y.Y.; Zhang, D.H. Source apportionment of polycyclic aromatic hydrocarbons in surface sediment of mud areas in the East China Sea using diagnostic ratios and factor analysis. Mar. Pollut. Bull. 2013, 70, 266–273. [Google Scholar] [CrossRef]
  8. Huang, W.; Wang, Z.; Wen, Y. Distribution and sources of polycyclic aromatic hydrocarbons (PAHs) in sediments from Zhanjiang Bay and Leizhou Bay, South China. Mar. Pollut. Bull. 2012, 64, 1962–1969. [Google Scholar] [CrossRef]
  9. Gu, Y.G.; Lin, Q.; Lu, T.T.; Ke, C.L.; Sun, R.X.; Du, F.Y. Levels, composition profiles and sources of polycyclic aromatic hydrocarbons in surface sediments from Nan’ao Island, a representative mariculture base in South China. Mar. Pollut. Bull. 2013, 75, 310–316. [Google Scholar] [CrossRef]
  10. Zheng, B.; Wang, L.; Lei, K.; Nan, B.J.C. Distribution and ecological risk assessment of polycyclic aromatic hydrocarbons in water, suspended particulate matter and sediment from Daliao River estuary and the adjacent area, China. Chemosphere 2016, 149, 91–100. [Google Scholar] [CrossRef]
  11. Cetin, B.; Yurdakul, S.; Gungormus, E.; Ozturk, F.; Sofuoglu, S.C. Source apportionment and carcinogenic risk assessment of passive air sampler-derived PAHs and PCBs in a heavily industrialized region. Sci. Total Environ. 2018, 633, 30–41. [Google Scholar] [CrossRef] [PubMed]
  12. Zhao, M.; Wang, W.; Liu, Y.; Dong, L.; Jiao, L.; Hu, L.; Fan, D.J. Distribution and sources of polycyclic aromatic hydrocarbons in surface sediments from the Bering Sea and western Arctic Ocean. Mar. Pollut. Bull. 2016, 104, 379–385. [Google Scholar] [CrossRef] [PubMed]
  13. Zheng, H.; Qu, C.; Zhang, J.; Talpur, S.A.; Ding, Y.; Xing, X.; Qi, S. Polycyclic aromatic hydrocarbons (PAHs) in agricultural soils from Ningde, China: Levels, sources, and human health risk assessment. Environ. Geochem. Health 2019, 41, 907–919. [Google Scholar] [CrossRef] [PubMed]
  14. Xie, X.; Liu, Y.; Qiu, H.; Zhang, M.; Wang, W.; Yang, X.; Du, Z.; Zhang, R. Distribution characteristics and risk assessment of polycyclic aromatic hydrocarbons in farmland soil-corn system from oil mining area of Yellow River Delta. Environ. Geochem. Health 2021, 44, 987–997. [Google Scholar]
  15. Fu, X.W.; Li, T.Y.; Ji, L.; Wang, L.L.; Zheng, L.W.; Wang, J.N.; Zhang, Q. Occurrence, sources and health risk of polycyclic aromatic hydrocarbons in soils around oil wells in the border regions between oil fields and suburbs. Ecotoxicol. Environ. Saf. 2018, 157, 276–284. [Google Scholar] [CrossRef]
  16. Qi, Y.; Li, J.; Ma, Y.; He, J.; Fu, G.; Shen, Q.; Zhao, C.; Cao, M. Distribution and Risk Assessment of Heavy Metals of Surface Sediments in Intertidal Flats of the Yellow River Delta, China. Res. Environ. Sci. 2020, 33, 1488–1496. [Google Scholar]
  17. Zhang, K.; Liu, Z.; Wang, Y.; Wang, J.; Cui, D.; Liu, X. Risk assessment and spatial characteristics of PAHs in soils in the Yellow River Delta Nature Reserve. Ecol. Environ. Sci. 2022, 31, 2198–2205. [Google Scholar]
  18. Qi, Y.; Zhao, Y.; Fu, G.; Li, J.; Zhao, C.; Guan, X.; Zhu, S. The Nutrient and Heavy Metal Contents in Water of Tidal Creek of the Yellow River Delta, China: Spatial Variations, Pollution Statuses, and Ecological Risks. Water 2022, 14, 713. [Google Scholar] [CrossRef]
  19. Zhao, Y.; Li, J.; Qi, Y.; Guan, X.; Zhao, C.; Wang, H.; Zhu, S.; Fu, G.; Zhu, J.; He, J. Distribution, sources, and ecological risk assessment of polycyclic aromatic hydrocarbons (PAHs) in the tidal creek water of coastal tidal flats in the Yellow River Delta, China. Mar. Pollut. Bull. 2021, 173, 113110. [Google Scholar] [CrossRef]
  20. Zheng, M. The Environmental Effects of Oil Pollution in Yellow River Delta. Master’s thesis, Jinan University, Guangzhou, China, 2013; p. 56. [Google Scholar]
  21. Soclo, H.H.; Garrigues, P.H.; Ewald, M. Origin of polycyclic aromatic hydrocarbons (PAHs) in coastal marine sediments: Case studies in Cotonou (Benin) and Aquitaine (France) areas. Mar. Pollut. Bull 2000, 40, 387–396. [Google Scholar] [CrossRef]
  22. Che, L.N.; Liu, S.; Yu, Y.; Wan, L.H. Ecological risk assessment of polycyclic aromatic hydrocarbons pollution in snowmelt runoff in Harbin. Acta Sci. Circumst. 2019, 39, 3508–3515. [Google Scholar]
  23. Nyarko, E.; Botwe, B.O.; Klubi, E.J. Polycyclic Aromatic Hydrocarbons (PAHs) Levels in Two Commercially Important Fish Species from the Coastal Waters of Ghana and their Carcinogenic Health Risks. West Afr. J. Appl. Ecol. 2011, 19, 53–66. [Google Scholar]
  24. Nisbet, I.C.; Lagoy, P.K. Toxic equivalency factors (TEFs) for polycyclic aromatic hydrocarbons (PAHs). Regul. Toxicol. Pharmacol. 1992, 16, 290–300. [Google Scholar] [CrossRef] [PubMed]
  25. Long, E.R.; Macdonald, D.D.; Smith, S.L.; Calder, F.D. Incidence of adverse biological effects within ranges of chemical concentrations in marine and estuarine sediments. Environ. Manag. 1995, 19, 81–97. [Google Scholar] [CrossRef]
  26. Liu, G.; Niu, J.; Guo, W.; An, X.; Zhao, C. Ecological and health risk-based characterization of agricultural soils contaminated with polycyclic aromatic hydrocarbons in the vicinity of a chemical plant in China. Chemosphere 2016, 163, 461–470. [Google Scholar] [CrossRef]
  27. Zhang, J.; Li, B.; Bi, E.; Hao, Z.; Huang, J. Pollutant characteristics and risk assessment of polycyclic aromatic hydrocarbons in the sediment of the North Canal Basin (Beijing section). Res. Environ. Sci. 2019, 32, 9. [Google Scholar]
  28. Yu, X.; Ding, Y. Research progress of environmental distribution and bioremediation of polycyclic aromatic hydrocarbons. J. Dalian Marit. Univ. 2004, 30, 55–59. [Google Scholar]
  29. Yuan, H.; Li, T.; Ding, X.; Zhao, G.; Ye, S. Distribution, sources and potential toxicological significance of polycyclic aromatic hydrocarbons (PAHs) in surface soils of the Yellow River Delta, China. Mater. Proc. 2014, 83, 258–264. [Google Scholar] [CrossRef]
  30. Yuan, Z.; Liu, G.; Da, C.; Wang, J.; Liu, H. Occurrence, Sources, and Potential Toxicity of Polycyclic Aromatic Hydrocarbons in Surface Soils from the Yellow River Delta Natural Reserve, China. Arch. Environ. Contam. Toxicol. 2015, 68, 330–341. [Google Scholar] [CrossRef]
  31. Maliszewska-Kordybach, B.J. Polycyclic aromatic hydrocarbons in agricultural soils in Poland: Preliminary proposals for criteria to evaluate the level of soil contamination. Appl. Geochem. 1996, 11, 121–127. [Google Scholar] [CrossRef]
  32. Cao, J.; Liu, Y.; Yu, S. The concentrations and sources of PAHs and PCBs in soil from an oil field and estuary in the Yellow River Delta, China. Toxicol. Pollut. Environ. 2022, 10, 1028299. [Google Scholar]
  33. Xie, W.; Chen, A.; Li, J.; Liu, Q.; Lu, Z. County-scale distribution of polycyclic aromatic hydrocarbons in topsoil of the Yellow River Delta Region. Environ. Lett. 2012, 47, 1419–1427. [Google Scholar] [CrossRef] [PubMed]
  34. Chen, M.; Mu, N.; Wang, Y.; Liu, G.; Zhao, Z. Quantitative Analysis of the Adsorded Nitrogen Pollution of the Yellow River Delta in the Past Three Decades. Chin. J. Ecol. 2022, 41, 1324–1333. [Google Scholar]
  35. Gao, Z. Experimental Stduy on Remediation of Groundwater/Soil Polluted by Petroleum Hydrocarbon in Dongying City. China Univ. Geosci. 2012, 8, 147. [Google Scholar]
  36. Gao, Y.F.; Zhang, D.; Zhao, B.; Yin, B.; Zhang, J.; Li, J.; Cao, X. Dynnamic Changes of Soil and Water Loss in the Yellow River Basin from 1990 to 2019. Soil Water Conserv. China 2020, 10, 64–67. [Google Scholar]
  37. Wang, Y. Analysis on the Water and Sediment Variation in the Yellow River and its Influence on the Change of the Yellow River Delta. Master’s Thesis, University of Chinese Academy of Sciences (Research Center for Soil and Water Conservation and Ecological Environment, Ministry of Education, Chinese Academy of Sciences), Beijing, China, 2018; p. 67. [Google Scholar]
  38. Xu, X.; Liu, W.; Wang, W.; Tian, S.; Jiang, P.; Qi, Q.; Li, F.; Li, H.; Wang, Q.; Li, H. Potential biodegradation of phenanthrene by isolated halotolerant bacterial strains from petroleum oil polluted soil in Yellow River Delta. Sci. Total Environ. 2019, 664, 1030–1038. [Google Scholar] [CrossRef]
  39. Agarwal, T.; Khillare, P.S.; Shridhar, V.; Ray, S. Pattern, sources and toxic potential of PAHs in the agricultural soils of Delhi, India. J. Hazard. Mater. 2009, 163, 1033–1039. [Google Scholar] [CrossRef]
  40. Oyo-Ita, O.E.; Oyo-Ita, I.O. PAH depositional history sources in recent sediment core from Ukwa Ibom Lake, S.E. Nigeria. Environ. Geochem. Health 2013, 35, 185–199. [Google Scholar] [CrossRef]
  41. Jiang, Y.F.; Wang, X.T.; Wang, F.; Jia, Y.; Wu, M.H.; Sheng, G.Y.; Fu, J.M. Levels, composition profiles and sources of polycyclic aromatic hydrocarbons in urban soil of Shanghai, China. Chemosphere 2009, 75, 1112–1118. [Google Scholar] [CrossRef]
  42. Liu, S.; Xia, X.; Yang, L.; Shen, M.; Liu, R. Polycyclic aromatic hydrocarbons in urban soils of different land uses in Beijing, China: Distribution, sources and their correlation with the city’s urbanization history. Environ. Res. 2010, 177, 1085–1092. [Google Scholar] [CrossRef]
  43. Wang, X.C.; Sun, S.; Ma, H.Q.; Liu, Y. Sources and distribution of aliphatic and polyaromatic hydrocarbons in sediments of Jiaozhou Bay, Qingdao, China. Mar. Pollut. Bull. 2006, 52, 129–138. [Google Scholar] [CrossRef] [PubMed]
  44. Abdel-Shafy, H.I.; Mansour, M.S.M. A review on polycyclic aromatic hydrocarbons: Source, environmental impact, effect on human health and remediation. Egypt. J. Pet. 2016, 25, 107–123. [Google Scholar] [CrossRef]
  45. Khairy, M.A.; Lohmann, R.J.C. Source apportionment and risk assessment of polycyclic aromatic hydrocarbons in the atmospheric environment of Alexandria, Egypt. Atmos. Environ. 2013, 91, 895–903. [Google Scholar] [CrossRef]
  46. Liu, Y.; Chen, L.; Zhao, J.; Huang, Q.; Zhu, Z.; Gao, H. Distribution and sources of polycyclic aromatic hydrocarbons in surface sediments of rivers and an estuary in Shanghai, China. Environ. Pollut. 2008, 154, 298–305. [Google Scholar] [CrossRef] [PubMed]
  47. Wang, X.T.; Miao, Y.; Zhang, Y.; Li, Y.C.; Wu, M.H.; Yu, G. Polycyclic aromatic hydrocarbons (PAHs) in urban soils of the megacity Shanghai: Occurrence, source apportionment and potential human health risk. Sci. Total Environ. 2013, 447, 80–89. [Google Scholar] [CrossRef]
  48. Ping, L.F.; Luo, Y.M.; Zhang, H.B.; Li, Q.B.; Wu, L. Distribution of polycyclic aromatic hydrocarbons in thirty typical soil profiles in the Yangtze River Delta region, east China. Environ. Pollut. 2007, 147, 358–365. [Google Scholar] [CrossRef]
  49. Bi, X.; Luo, W.; Gao, J.; Xu, L.; Guo, J.; Zhang, Q.; Romesh, K.Y.; Giesy, J.P.; Kang, S.; de Boer, J. Polycyclic aromatic hydrocarbons in soils from the Central-Himalaya region: Distribution, sources, and risks to humans and wildlife. Sci. Total Environ. 2016, 556, 12–22. [Google Scholar] [CrossRef]
  50. Hamid, N.; Syed, J.H.; Junaid, M.; Mahmood, A.; Li, J.; Zhang, G.; Malik, R.N. Elucidating the urban levels, sources and health risks of polycyclic aromatic hydrocarbons (PAHs) in Pakistan: Implications for changing energy demand. Sci. Total Environ. 2017, 619, 165–175. [Google Scholar] [CrossRef]
  51. Yu, G.G.; Wang, T.G.; Wu, D.P. Study on fingerprints of PAHs from the combustion of bavin and coal. Ecol. Environ. 2007, 16, 285–289. [Google Scholar]
  52. Khalili, N.R.; Scheff, P.A.; Holsen, T.M. PAH source fingerprints for coke ovens, diesel and, gasoline engines, highway tunnels, and wood combustion emissions. Atmos. Environ. 1995, 29, 533–542. [Google Scholar] [CrossRef]
  53. Simcik, M.F.; Eisenreich, S.J.; Lioy, P.J. Source apportionment and source/sink relationships of PAHs in the coastal atmosphere of Chicago and Lake Michigan. Atmos. Environ. 1999, 33, 5071–5079. [Google Scholar] [CrossRef]
  54. Yunker, M.B.; Macdonald, R.W.; Vingazan, R.; Mitchell, R.H.; Goyette, D.; Sylvestre, S.J.O.G. PAHs in the Fraser River basin: A critical appraisal of PAH ratios as indicators of PAH source and composition. Org. Geochem. 2002, 33, 489–515. [Google Scholar] [CrossRef]
  55. Wang, C.; Wu, S.; Zhou, S.; Wang, H.; Li, B.; Chen, H.; Yu, Y.; Shi, Y. Polycyclic aromatic hydrocarbons in soils from urban to rural areas in Nanjing: Concentration, source, spatial distribution, and potential human health risk. Sci. Total Environ. 2015, 527–528, 375–383. [Google Scholar] [CrossRef] [PubMed]
  56. Yang, B.; Zhou, L.; Xue, N.; Li, F.; Li, Y.; Vogt, R.D.; Cong, X.; Yan, Y.; Liu, B.J. Source apportionment of polycyclic aromatic hydrocarbons in soils of Huanghuai Plain, China: Comparison of three receptor models. Sci. Total Environ. 2013, 443, 31–39. [Google Scholar] [CrossRef] [PubMed]
  57. Yang, W.; Lang, Y.; Li, G.; Liu, W. Distribution and health risk assessment of polycyclic aromatic hydrocarbons in Jiaozhou Bay wetland soil. Environ. Chem. 2013, 32, 1989–1990. [Google Scholar]
  58. Kannan, K.; Johnson-Restrepo, B.; Yohn, S.S.; Giesy, J.P.; Long, D. Spatial and temporal distribution of polycyclic aromatic hydrocarbons in sediments from Michigan inland lakes. Environ. Sci. Technol. 2005, 39, 4700–4706. [Google Scholar] [CrossRef]
  59. Ravindra, K.; Sokhi, R.; Van Grieken, R. Atmospheric polycyclic aromatic hydrocarbons: Source attribution, emission factors and regulation—ScienceDirect. Atmos. Environ. 2008, 42, 2895–2921. [Google Scholar] [CrossRef]
  60. Larsen, R.K.; Baker, J.E. Source Apportionment of Polycyclic Aromatic Hydrocarbons in the Urban Atmosphere: A Comparison of Three Methods. Environ. Sci. Technol. 2003, 37, 1873–1881. [Google Scholar] [CrossRef]
  61. Paatero, P.; Tapper, U.J.E. Positive matrix factorization: A non-negative factor model with optimal utilization of error estimates of data values. Environmetrics 1994, 5, 111–126. [Google Scholar] [CrossRef]
  62. Qi, H.X.; Chen, X.L.; Du, Y.E.; Niu, X.; Guo, F.; Li, W. Cancer risk assessment of soils contaminated by polycyclic aromatic hydrocarbons in Shanxi, China. Ecotoxicol. Environ. Saf. 2019, 182, 109381. [Google Scholar] [CrossRef]
  63. Tarafdar, A.; Sinha, A. Health risk assessment and source study of PAHs from roadside soil dust of a heavy mining area in India. Arch. Environ. Occup. Health 2019, 74, 252–262. [Google Scholar] [CrossRef] [PubMed]
  64. Li, C.; Rong, Q.Y.; Zhu, C.M.; Han, J.; Li, P. Distribution, sources, and risk assessment of polycyclic aromatic hydrocarbons in the estuary of Hongze Lake, China. Environments 2019, 6, 92. [Google Scholar] [CrossRef]
  65. Liang, X.X.; Junaid, M.; Wang, Z.F.; Li, T.; Xu, N. Spatiotemporal distribution, source apportionment and ecological risk assessment of PBDEs and PAHs in the Guanlan River from rapidly urbanizing areas of Shenzhen, China. Environ. Pollut. 2019, 250, 695–707. [Google Scholar] [CrossRef] [PubMed]
  66. Xu, J.; Yu, Y.; Wang, P.; Guo, W.; Dai, S.; Sun, H. Polycyclic aromatic hydrocarbons in the surface sediments from Yellow River, China. Chemosphere 2007, 67, 1408–1414. [Google Scholar] [CrossRef] [PubMed]
  67. Halfadji, A.; Naous, M.; Bettiche, F.; Touabet, A. Human Health Assessment of Sixteen Priority Polycyclic Aromatic Hydrocarbons in Contaminated Soils of Northwestern Algeria. J. Health Pollut. 2021, 11, 210914. [Google Scholar] [CrossRef]
  68. Zheng, H.; Xing, X.; Hu, T.; Zhang, Y.; Zhang, J.; Zhu, G.; Li, Y.; Qi, S. Biomass burning contributed most to the human cancer risk exposed to the soil-bound PAHs from Chengdu Economic Region, western China. Ecotoxicol. Environ. Saf. 2018, 159, 63–70. [Google Scholar] [CrossRef]
  69. Abhrajyoti, T.; Alok, S. Public health risk assessment with bioaccessibility considerations for soil PAHs at oil refinery vicinity areas in India. Sci. Total Environ. 2018, 616–617, 1477–1484. [Google Scholar]
  70. Cai, C.Y.; Li, J.Y.; Wu, D.; Wang, X.; Tsang, D.; Li, X.D.; Sun, J.T.; Zhu, L.Z.; Shen, H.Z.; Shu, T. Spatial distribution, emission source and health risk of parent PAHs and derivatives in surface soils from the Yangtze River Delta, eastern China. Chemosphere 2017, 178, 301. [Google Scholar] [CrossRef]
  71. Huang, X.D.; Zeiler, L.F.; Dixon, D.G.; Greenberg, B.M. Photoinduced toxicity of PAHs to the foliar regions of Brassica napus (canola) and Cucumbis sativus (cucumber) in simulated solar radiation. Ecotoxicol. Environ. Saf. 1996, 35, 190–197. [Google Scholar] [CrossRef]
  72. Lu, D.; Zhang, F. Researh progress on occupational hazards of polycyclic aromatic hydroarbons, China. Occup. Med. 2017, 44, 4. [Google Scholar]
  73. Sheng, S.; Cao, X.; Song, Y.; Liu, Y.; Sheng, Z.; Qin, L. Properties and hazards of polycyclic aromatic hydrocarbons. Guizhou Chem. Industy 2008, 33, 61–63. [Google Scholar]
  74. Toyooka, T.; Ibuki, Y. DNA damage induced by coexposure to PAHs and light. Environ. Toxicol. Pharmacol. 2007, 23, 256–263. [Google Scholar] [CrossRef] [PubMed]
  75. Wang, C.; Wang, W.; He, S.; Du, J.; Sun, Z.J. Sources and distribution of aliphatic and polycyclic aromatic hydrocarbons in Yellow River Delta Nature Reserve, China. Appl. Geochem. 2011, 26, 1330–1336. [Google Scholar] [CrossRef]
Figure 1. Locations of sampling sites in the study area of the Yellow River Delta.
Water 15 03324 g001
Figure 2. The concentrations of PAHs at each sampling site in 2009 and 2021.
Water 15 03324 g002
Figure 3. Composition of PAHs in 2009 and 2021.
Water 15 03324 g003
Figure 4. Sources of soil PAHs in 2009 and 2021 via PMF model analysis.
Water 15 03324 g004
Figure 5. Contribution rate of soil PAHs in 2009 and 2021.
Water 15 03324 g005
Figure 6. Diagnostic ratios of PAH sources at different sampling sites in 2009 and 2021. A1–A15 represent soil samples from 15 plots in 2009, and B1–B15 represent soil samples from 15 plots in 2021.
Water 15 03324 g006
Figure 7. TEQ values of PAHs at each sampling site in 2009 and 2021.
Water 15 03324 g007
Figure 8. Probability of ecological risk of individual PAH concentration at each sampling site in 2009 and 2021.
Water 15 03324 g008
Figure 9. Accumulative probability distributions of LMW (a), HMW PAHs (b) andΣPAH16 concentrations (c) in 2009 and 2021.
Water 15 03324 g009
Table 1. Toxicity equivalent factors of individual PAHs.
Monomer PAHsRing NumberToxic Equivalent FactorMonomer PAHsRing NumberToxic Equivalent Factor
Naphthalence (Nap)20.001Pyrene (Pyr)40.001
Anthracence (Ant)30.01Fluoranthene (Fla)40.001
Phenanthrene (Phe)30.001Dibenzo[a,h]anthracene (DahA) *51
Fluorene (Flu)30.001Benzo[a]pyrene (BaP) *51
Acenapthene (Ace)30.001Benzo[k]fluoranthene (BkF) *50.1
Acenaphthylene (Acpy)30.001Benzo[b]fluoranthene (BbF) *50.1
Chrysene (Chr) *40.01Benzo[g,h,i]perylene (BghiP)60.01
Benzo[a]anthracene (BaA) *40.1Indenol [1,2,3-cd]pyrene (IcdP) *60.1
Note: * means carcinogenic compound.
Table 2. Parameters of incremental lifetime cancer risks.
ParameterUnitAdultChild
BWKg61.515
IRsoilmg·d−1100200
EFd·a−1350350
EDa246
ATd25,55025,550
IRairm3·d−12010
PEFm3·kg−11.36 × 1091.36 × 109
SAcm2·d−157002800
AFmg·cm−20.070.2
ABSzero dimension0.130.13
Table 3. Descriptive statistics of PAHs in soils in 2009 (ng/g).
Monomer PAHRing NumberRangeMean ValueStandard DeviationCoefficient of VariationDetection Rate
Nap2ND~218.6786.8258.330.6793
Ant3ND~188.8125.2246.651.8573
Phe3ND~1002.96117.00243.432.0893
Flu32.6~7651.991409.201794.761.27100
Ace3NDNDNDNDND
Acpy3ND~2.160.140.543.747
Chr4ND~230.9329.7158.161.9667
BaA4ND~227.5619.4056.382.9147
Pyr4ND~137.9724.5944.821.8280
Fla4ND~52.5216.2014.820.9180
DahA5NDNDNDNDND
BaP5ND~22.712.515.942.3640
BkF5ND~14.782.034.802.3620
BbF5ND~19.934.446.671.5060
BghiP6ND~86.775.8221.643.7220
IcdP6ND~10.771.323.372.5613
ΣPAH7ND~481.3559.42118.882.0073
ΣPAH162.6~8275.461744.411941.101.11100
Note: ND means “Not Detected”.
Table 4. Descriptive statistics of PAHs in soils in 2021 (ng/g).
Monomer PAHRing NumberRangeMean ValueStandard DeviationCoefficient of VariationDetection Rate
Nap245~291.28112.79 59.64 0.53 100
Ant3ND~10.21.30 3.32 2.55 13
Phe3ND~10.21.30 3.32 2.55 13
Flu3ND~8.481.63 3.26 2.00 20
Ace3NDNDNDNDND
Acpy3NDNDNDNDND
Chr4ND~21.581.44 5.38 3.74 7
BaA4ND~32.362.89 8.34 2.88 13
Pyr4ND~11.251.37 3.51 2.56 13
Fla4ND~12.632.94 4.91 1.67 27
DahA5NDNDNDNDND
BaP5ND~107.8813.19 26.18 1.98 53
BkF5NDNDNDNDND
BbF5ND~53.945.04 13.58 2.69 20
BghiP6NDNDNDNDND
IcdP6ND~75.525.74 18.83 3.28 13
ΣPAH7ND~291.2828.30 71.04 2.51 53
ΣPAH1656.25~582.56149.63 122.33 0.82 100
Note: ND means “Not Detected”.
Table 5. Concentrations (ng/g) of PAHs in sediments or soils from other research on the YRD.
Sampling PointsSampling Year∑PAHs, ng/gConcentration Mean, ng/g Reference
61 Stations within the YRD2006–200827–753 118 ± 132[29]
The Experimental, Buffer and Core area of the YRDNR201379.2–311119[30]
Around Oil Wells with Different Extraction Histories in the YRD2015278.7–733.5382.5 ± 128.4[15]
The Oil Field Soil and the Estuary Soil of the YRD2018157.8–481.7274[32]
Around the wells in Xianhe Town, Gudao Town and Huanghekou Town of Dongying City 2009
2021
2.6–8275.46
56.25–582.56
1744.41
149.63
This study
This study
Note: YRDNR means “Yellow River Delta Natural Reserve”.
Table 6. ILCR values of PAHs in soils under three exposure pathways in 2009 and 2021.
Exposure Pathways20092021
AdultChildAdultChild
ILCRingestion8.56 × 10−94.28 × 10−91.68 × 10−88.4 × 10⁻⁹
ILCRinhalation6.64 × 10−134.74 × 10−201.3 × 10−129.31 × 10⁻²⁰
ILCRdermal1.52 × 10−85.34 × 10−92.99 × 10−81.05 × 10⁻⁸
ILCRs2.38 × 10−89.62 × 10−94.67 × 10−81.89 × 10⁻⁸
Table 7. ILCR values of PAHs in soil samples reported in the previous literature.
Study AreaStudy YearMean of ILCRs (Adult)Mean of ILCRs (Child)Reference
Yellow River Delta Natural Reserve20171.14 × 10−61.23 × 10⁻⁶[17]
Farmland soil in the YRD20209.00 × 10−63.60 × 10⁻⁵[14]
Xianhe Town, Gudao Town and Huanghekou Town of Dongying City in the YRD20092.38 × 10−89.62 × 10⁻⁹This Study
Farmland soil in the YRD20214.67 × 10−81.89 × 10⁻⁸This Study
Disclaimer/Publisher’s Note: The statements, opinions and data contained in all publications are solely those of the individual author(s) and contributor(s) and not of MDPI and/or the editor(s). MDPI and/or the editor(s) disclaim responsibility for any injury to people or property resulting from any ideas, methods, instructions or products referred to in the content.

