Article

Spatial Variations and Distribution Patterns of Soil Salinity at the Canal Scale in the Hetao Irrigation District

1
College of Water Conservancy and Civil Engineering, Inner Mongolia Agricultural University, Hohhot 010018, China
2
High Efficiency Water-Saving Technology and Equipment and Soil and Water Environment Effect in Engineering Research Center of Inner Mongolia Autonomous Region, Hohhot 010018, China
3
School of Materials Science and Engineering, Beihang University, Beijing 100191, China
*
Authors to whom correspondence should be addressed.
These authors contributed equally to this work.
Water 2023, 15(19), 3342; https://doi.org/10.3390/w15193342
Submission received: 17 August 2023 / Revised: 20 September 2023 / Accepted: 21 September 2023 / Published: 23 September 2023
(This article belongs to the Special Issue Water Environment Pollution and Control, Volume II)

Abstract

:
Soil salinization is a major factor impacting global crop yields. To explore the spatial distribution and influencing factors of soil water and salt in typical canals of the Hetao irrigation district, regional soil information was monitored at fixed locations. In this study, classical statistics, geostatistics, and spatial autocorrelation methods were used to conduct quantitative analyses of soil salt content, water content, soil particle size distribution, and groundwater depth. The variation coefficient of the soil salt content in the 20–40 and 40–60 cm soil layers was between 10% and 100%, which corresponds to a medium degree of variation; the other soil layers had strong degrees of variation. The soil moisture content in each layer varied moderately. The gold coefficients of soil salt content and water content were less than 0.25, and the Z value was greater than 0, showing a strong spatial correlation and certain spatial agglomeration characteristics, which were mainly affected by structural factors in the study area. The distribution patterns of soil water and salt were affected by soil particle size. Sand content decreased with increasing depth, soil salt was negatively correlated with sand content, and soil water was positively correlated with sand content. Soil salinity was significantly affected by groundwater depth and increased with decreasing groundwater depth, following an exponential relationship. When the groundwater depth exceeded 1.7 m, the soil salt content exhibited small changes with groundwater depth. The results of this study could play a guiding role in terms of understanding the degree of soil salinization surrounding canals in the Hetao irrigation area and adjusting land management strategies over time.

1. Introduction

As the global food demand and the world population rapidly increase, cultivated soil conditions are gradually deteriorating, leading to a decline in its potential [1,2,3]. Soil salinization is a major factor affecting global crop yield reduction; more than 8 × 10⁸ hm2 of land worldwide is affected by salinization, accounting for more than 6% of the total land area [4,5]. Currently, about 20% of arable land is salinized due to unscientific agricultural practices, and it is projected that by 2050, half of the world’s arable land will be affected by salinization. Thus, there is a pressing need to better understand soil salinization processes and develop agricultural practices that will enable the production of the necessary amount of food to feed humanity while minimizing soil salinization and other degradation processes [3,6].
The main causes of soil salinization in coastal areas were found to be the intensive exploitation of aquifers and the continuous rise of sea level leading to seawater intrusion [7,8]. In contrast, the Hetao irrigation area in Inner Mongolia was identified as a typical salinization mega-irrigation area in the middle and upper reaches of the Yellow River. This area is situated in an inland arid region with low rainfall and high evaporation (the evaporation ratio in this region exceeds 10), resulting in significant salt accumulation [9,10]. Since the 1960s, extensive scientific studies and preventive measures have been undertaken by domestic and foreign scholars regarding water and salt migration, salinization prevention, and environmental effects [11,12]. One approach utilized to address the issue of saline water intrusion in coastal areas involves the abstraction–recharge process [13]. Additionally, in the Hetao irrigation area of Inner Mongolia, measures such as improving canal head engineering and implementing mandatory water-saving measures have been adopted [14]. While these actions enhance water supply security, they can disrupt the regional water balance system and impact the hydrological cycles of farmland within the irrigated area, thus profoundly affecting regional agriculture. Hence, conducting a quantitative study on the spatial distribution of soil salt is crucial in order to discern the patterns of soil salinization change. Such research carries significant implications for the scientific management and rational utilization of saline land [15,16,17,18].
Based on classical statistical theory and geostatistical theory, there have been numerous research studies and applications focused on the theory of regional spatial variation [19]. These studies have explored the heterogeneity and spatiotemporal variability of the riparian undercurrent zone. However, it is important to note that the current methods employed only capture the variability of sediment hydraulic conductivity in the riparian undercurrent zone through calculated values using functions, while they are unable to provide a detailed representation of the spatial variability. Multi-fractal analysis has been used to reveal the changing trends of soil moisture content and conductivity and multi-scale soil properties in small areas [20,21], with several studies indicating that soil does not possess ideal fractal characteristics. Instead, it only exhibits fractal characteristics within specific spatial scales. However, studying soil salinization at large scales requires significant manpower investment and time costs. With the development of geographic information technology, remote sensing technology, and machine learning methods, landscape changes caused by salinization in a region can be more efficiently and directly reflected [22]. This advancement is convenient for studying the macro-level causes of this phenomenon. In recent years, studies have shown that the spatial interpolation method provides good accuracy in predicting soil salinity [23]. But it has been found to have shortcomings in quantifying the degree of spatial correlation. To overcome this limitation, researchers have turned to the use of Moran’s I index in spatial clustering recognition methods. This index has proven to be effective in reflecting the overall degree of spatial correlation and evaluating the significance of independent locations [24]. However, in the context of the modernization of irrigation areas, existing studies have mostly focused on the spatiotemporal variations in soil salinity at the irrigation and farmland scales; there is a lack of medium-scale studies [25]. Moreover, because soil properties are dominated by continuous changes in space, certain spatial structural features can only be displayed at specific sampling scales. Small-scale research should not be blindly extrapolated to a larger scale [26]. Zhang Wencong [14] quantitatively studied the dynamic changes in farmland soil water and groundwater in different irrigation periods at the canal level in the Hetao irrigation district using the water balance method but did not reveal the spatial characteristics or rules of salt variation in different soil layers.
Identifying the spatial variation characteristics and distribution patterns of water and salt in the Hetao irrigation area at the canal scale could allow for the creation of a basic reference system to reveal the spatiotemporal dynamic characteristics and scale transformation features of soil attributes. In this study, typical canals in the Hetao irrigation district were selected as the study area, and the spatial distribution patterns of soil water and salt were evaluated after spring irrigation and at an early stage of crop growth. The degree of soil salinization within a typical canal was determined to provide scientific guidance for subsequent accurate improvement and sustainable development of saline-alkali land.

2. Materials and Methods

2.1. Overview of the Study Area

2.1.1. Physical Geography and Climatic Conditions

The research area is located in Wuyuan County, Bayannaoer City, Inner Mongolia Autonomous Region, China (41°6′44″ N–41°7′41″ N, 108°19′48″ E–108°20′49″ E). Its geographic location is shown in Figure 1. From the Yihe trunk canal in the south, to the highway in the north, to a new canal in the east, and to the left second branch canal in the west, the terrain is relatively flat. This area is 1022–1025 m above sea level and covers an area of 2.344 km2. Corn, sunflowers, beets, and tomatoes are grown in this area. Its annual average solar radiation is 153.44 cal/cm2, its annual sunshine duration is 2702 h, its average temperature is 17.76 °C, its accumulated temperature is 3569 °C, its frost-free period is 117–136 days its average annual amount of rainfall is 153.1 mm, and its average annual groundwater depth is 1.86 m; it has a middle-temperate continental climate. The area’s average soil organic matter content is 9.5 g/kg, and its total nitrogen content is 1.2 g/kg. The meteorological data used in this study were obtained from the National Meteorological Information Center and are shown in Figure 2.

2.1.2. Hydrogeological Framework

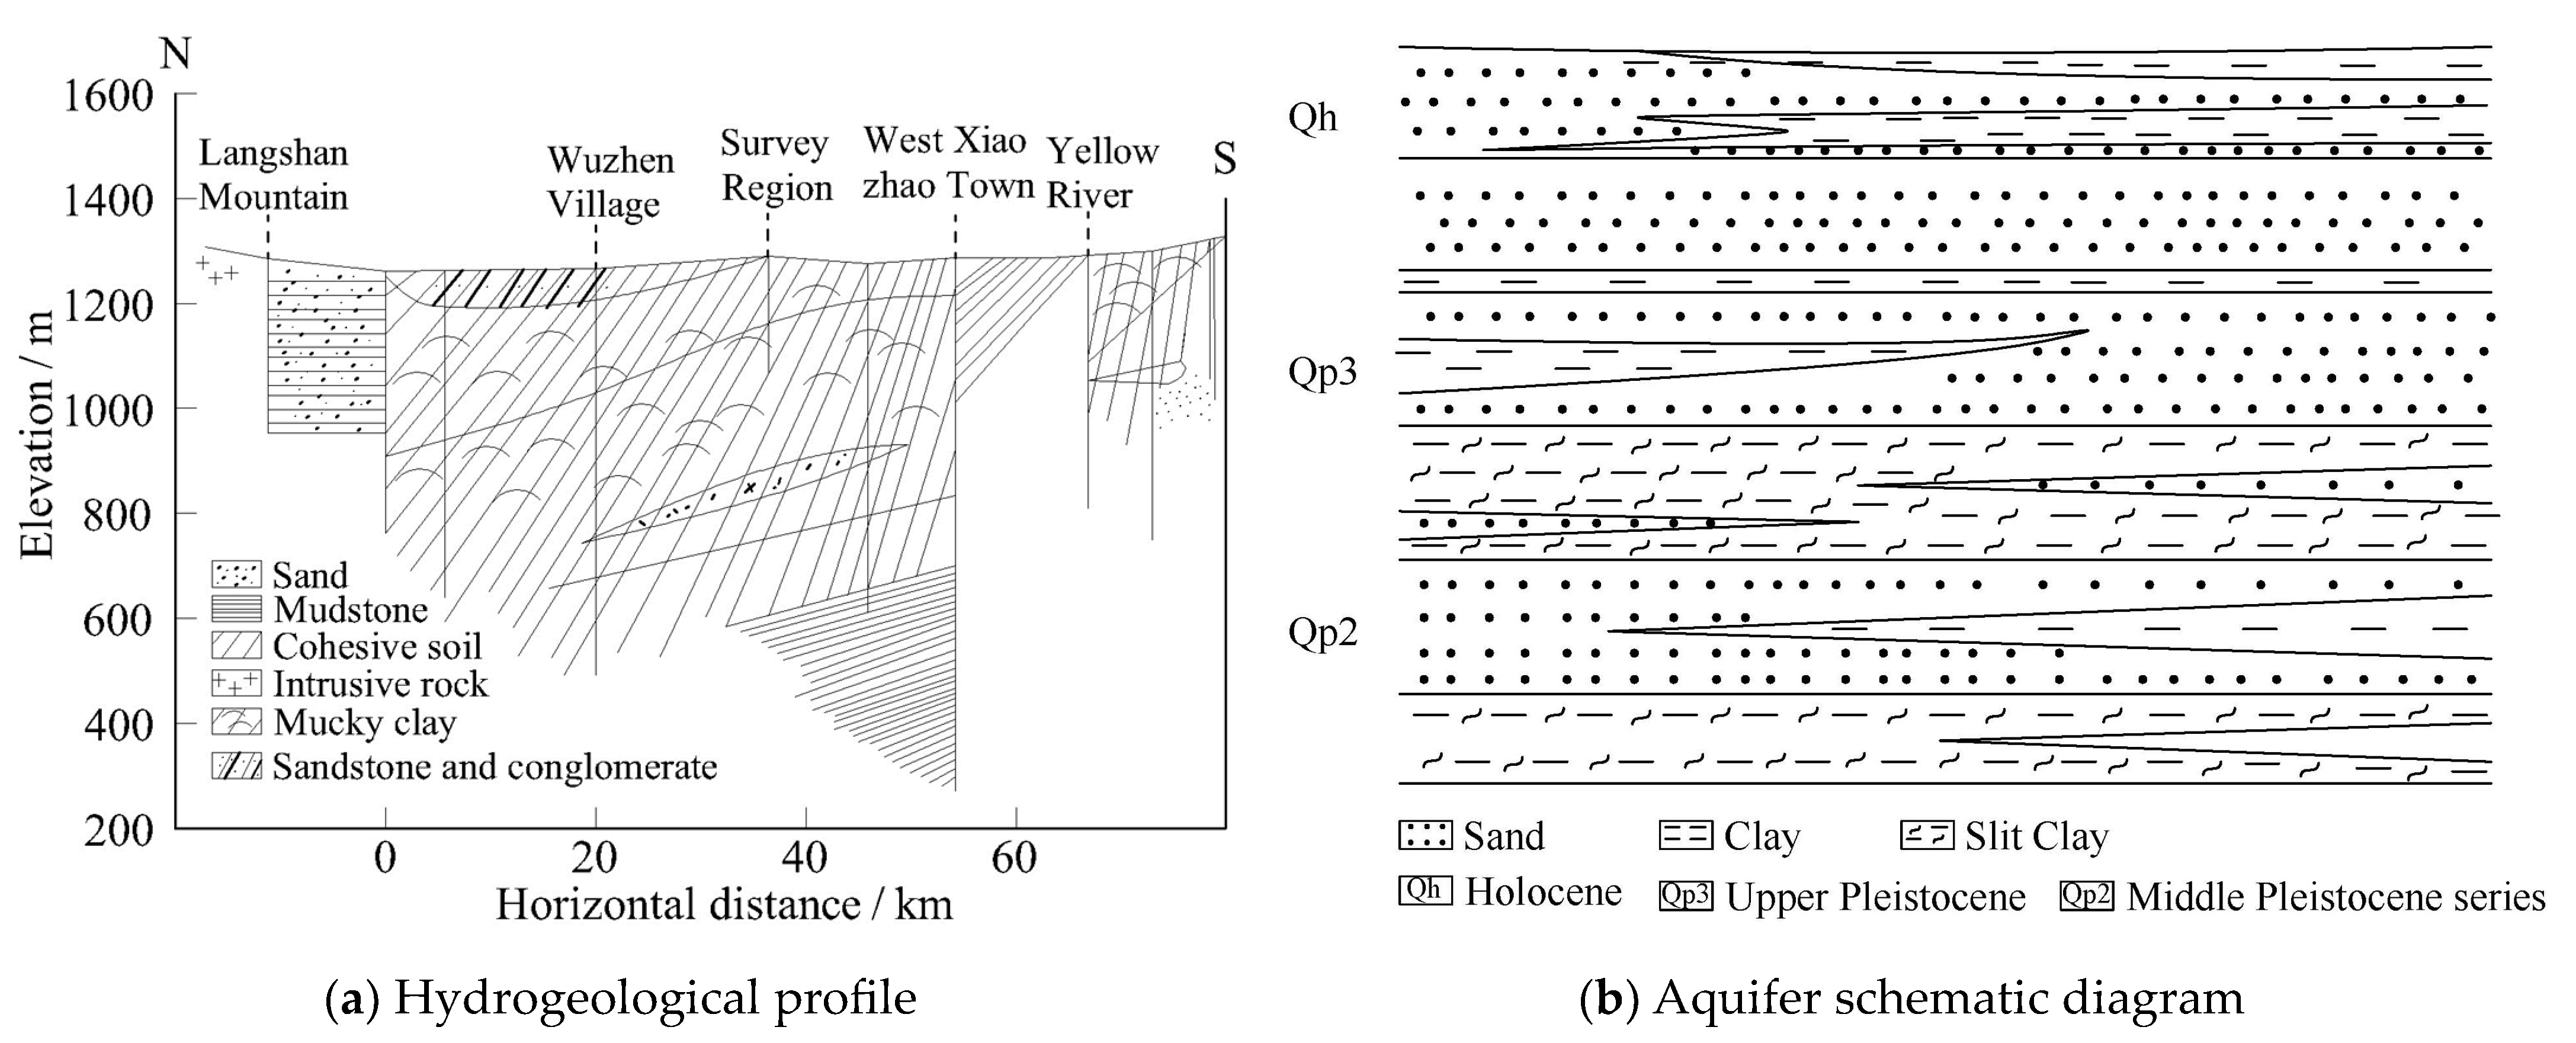
According to the geological survey, the Hetao Irrigation District is a Mesozoic–Cenozoic fault basin that formed in the late Jurassic. It is part of the Ordos platform syncline of the North China Platform in terms of its geological structure (Figure 3a). The sediments in the irrigation area are mainly derived from the river sediments of Langshan and the ancient Yellow River. According to its sedimentary structural conditions, an alluvial lake aquifer system with a fine-grained phase as its main component was formed in the Hetao Basin. The sediment particles are mainly medium-grain sand and coarse sand. The groundwater flows from west to east, with a large permeability coefficient and strong runoff conditions. As shown in Figure 3b, the aquifer in the irrigation area has complex geometry and multi-layer overlap. On the basis of Quaternary stratification, the hydrogeological characteristics of the aquifer, and its development and utilization value according to its burial conditions, it is divided into Upper Pleistocene (Qp3)–Holocene (Qh) and Middle Pleistocene aquifer systems (Qp2). The Qp3-Qh aquifer has the greatest thickness and the widest distribution. The Qp2 aquifer is widely distributed in the piedmont and uplift areas, and its burial depth is relatively shallow.

2.2. Sampling Point Layout and Data Acquisition

2.2.1. Sampling Point Layout

Monitoring points were arranged in accordance with a 200 × 200 m grid in the test area, and 52 soil-water- and -salt-sampling points were slightly adjusted for the special terrain and features (Figure 1). Sampling began in April 2022, when the maize and sunflowers were at the seedling stage. The field coordinates were determined using a handheld global positioning system, and the sampling depth ranged from the surface to a depth of 100 cm. The total sampling depth was divided into six layers (0–10, 10–20, 20–40, 40–60, 60–80, and 80–100 cm), and the excavated samples were collected by layer with a soil drill (stainless steel 1 m) and placed in sealed bags.

2.2.2. Data Measurements

A drying method [27] was used to determine the soil moisture content, and soil conductivity was measured simultaneously. After air drying and grinding, the conductivity of the soil extract in a 1:5 ratio of soil to distilled water was tested using an electrical conductivity meter (INESA DDS-307A, Shanghai, China) after being passed through a 2 mm screen [28]. The depth of the groundwater was measured every seven days using the plumb–plumb method [14].

2.2.3. Soil Texture

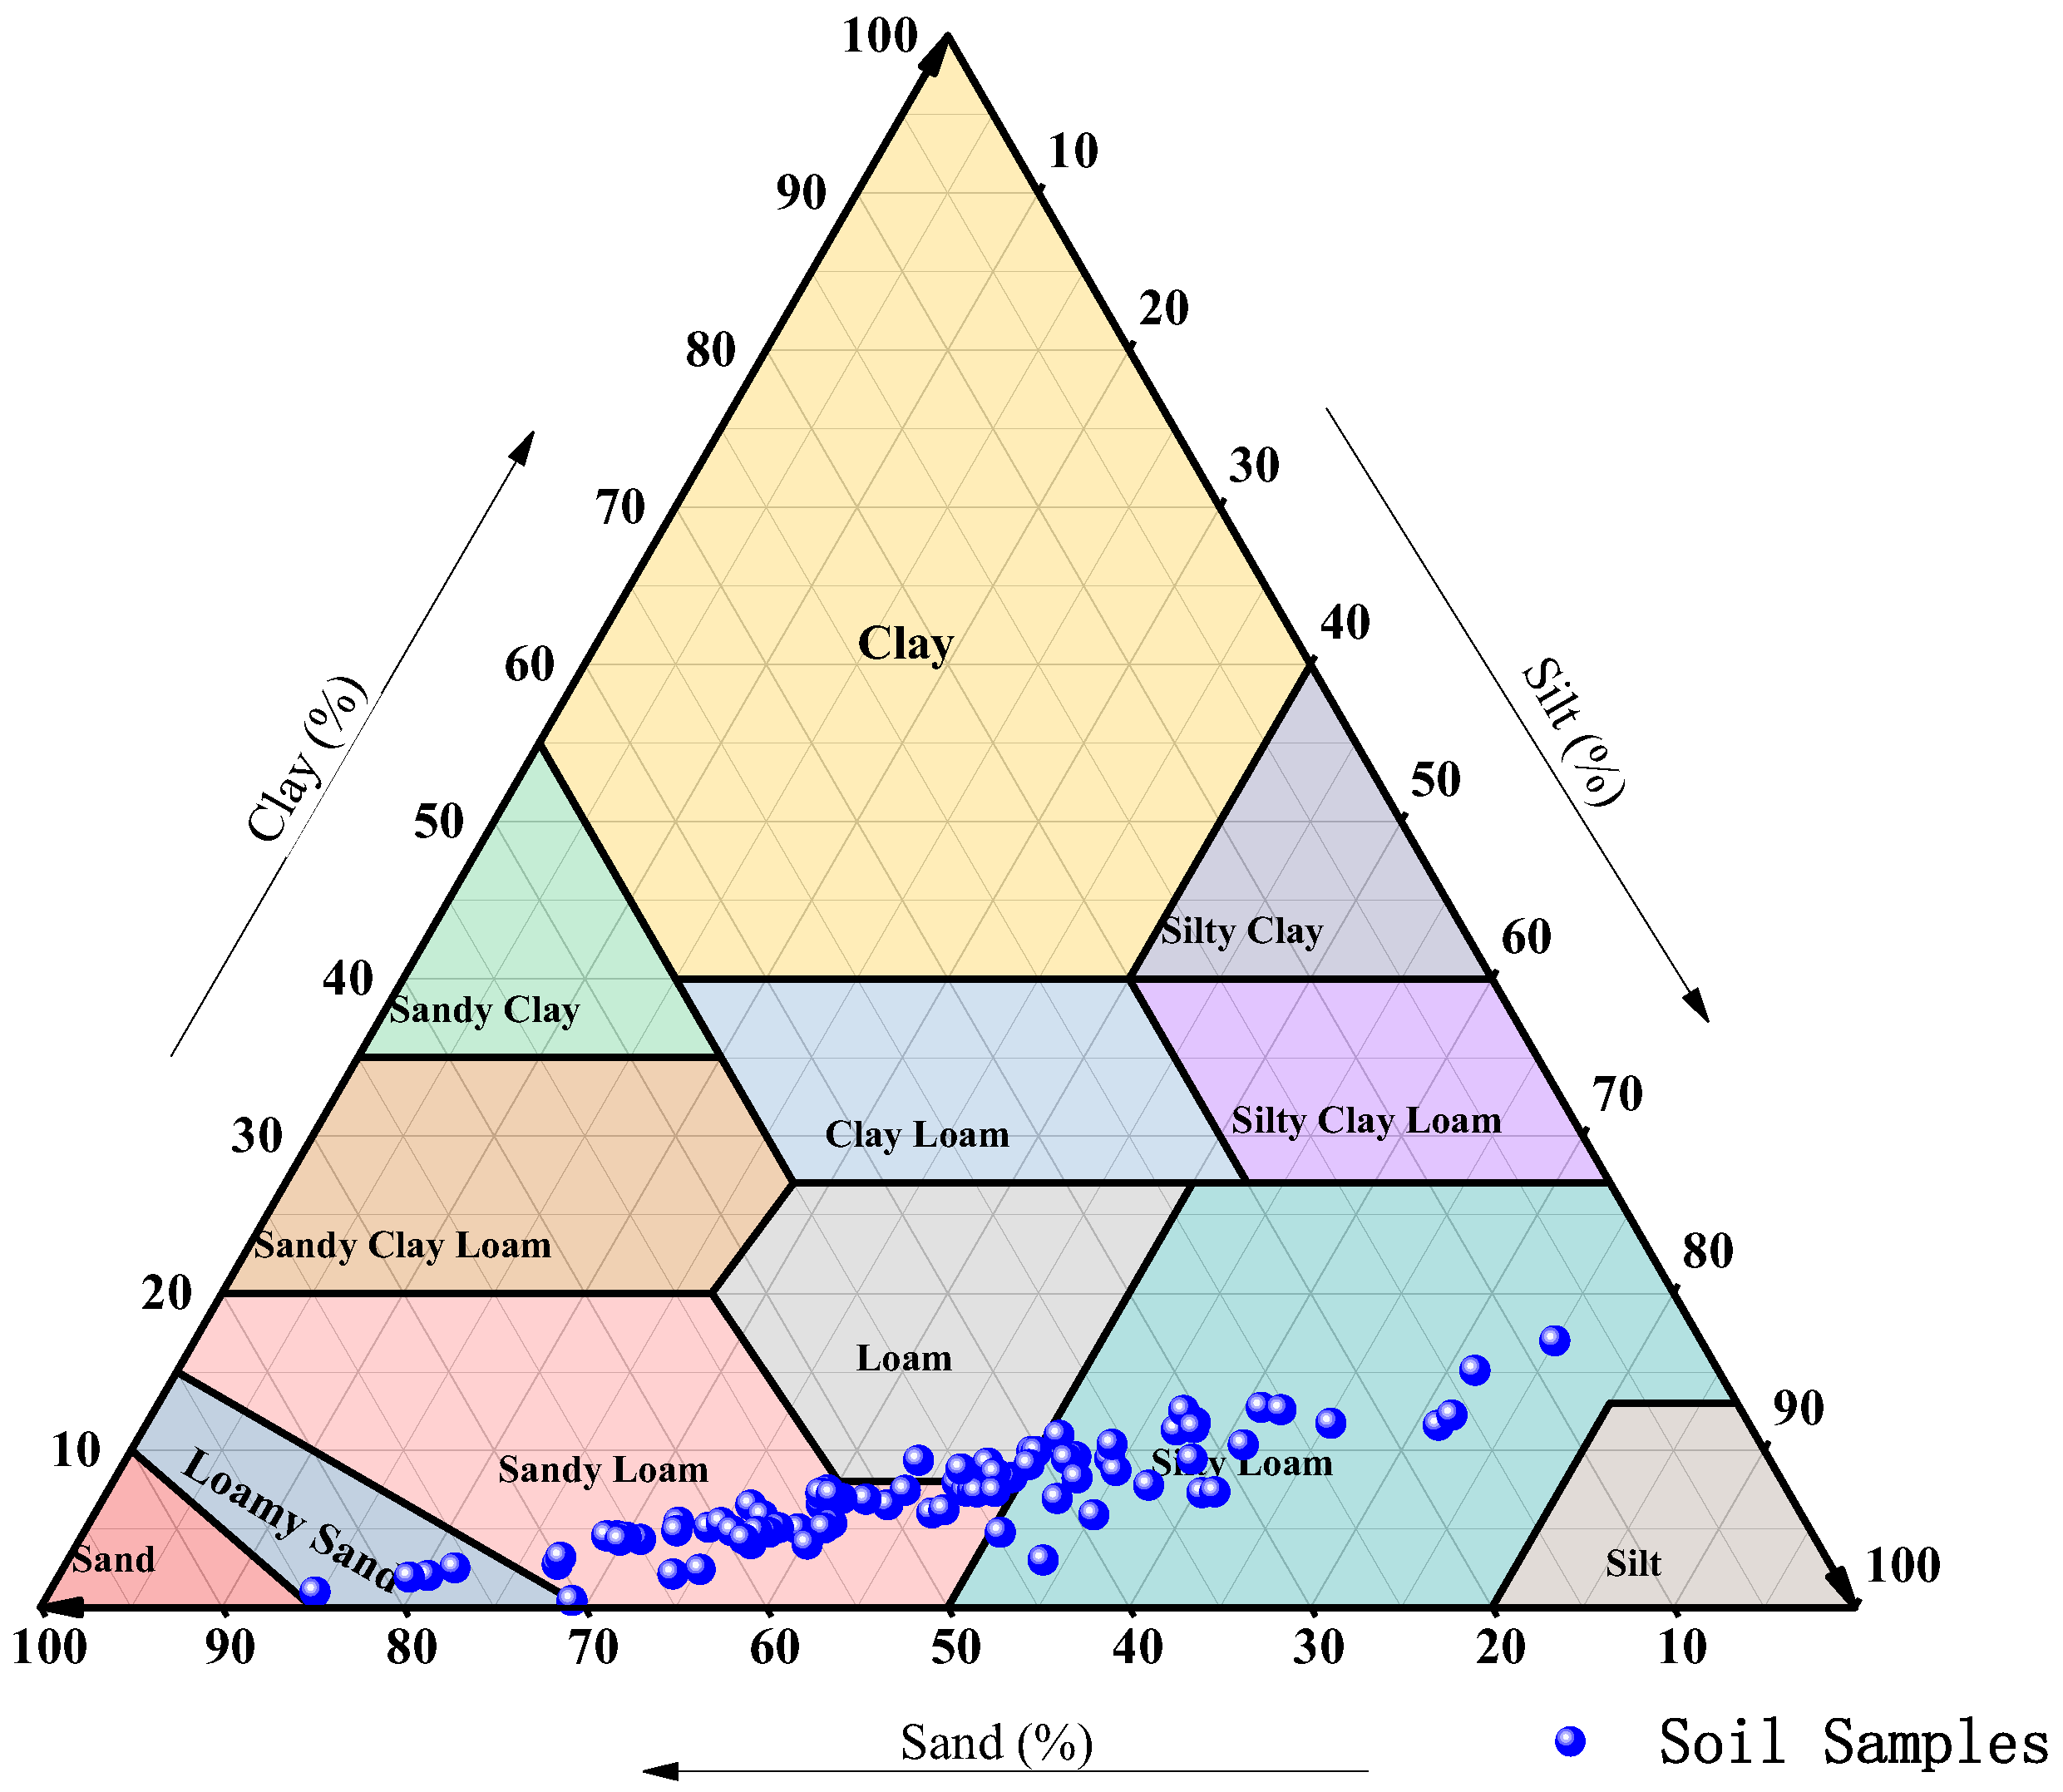
A laser particle size analyzer was used to test the particle size distributions of the ground and sieved soil samples (HELOS & RODOS, Sympatec, Clausthal, Germany). The U.S. Department of Agriculture soil particle grading standard [29,30] was used for the analysis. The soil particle sizes were divided into clay (0–2 μm), silt (2–50 μm), and sand (50–2000 μm). The soil textures in the study area were divided into five categories: loam, sandy loam, silty loam, and silty loam (Figure 4).

2.3. Research Methods

2.3.1. Semi-Variance Function

The semi-variance function is a basic tool used in geostatistics [31]. The spatial variation structure of the regionalized variable is represented by half of the variance between sampling points and is calculated as follows (1):
γ ( h ) = 1 2 N ( h ) i = 1 N ( h ) Z ( x i ) Z ( x i + h ) 2
In Formula (1), N h is the lag distance equal to the logarithm of point h; Z ( x i ) is the measured value of the variable at point x i ; and Z ( x i + h ) is the measured value of the variable deviating from h at point x i .
The fitting accuracy of the semi-variance function was characterized using the determination coefficient (R2) and residual sum of squares (RSS), in which R2 was between 0 and 1; the larger the value, the better the fitting effect. The smaller the RSS value, the better the simulation effect [32].

2.3.2. Ordinary Kriging

Kriging, or spatial local interpolation, is an unbiased optimal estimation method for regionalized variables in a limited region. It utilizes semi-variance theory and structural analysis, making it a key component of geostatistics [1]. Suppose there are n measurement points in the neighborhood of the estimation point x0, that is, x1, x2,…, xn; accordingly, the ordinary Kriging formula used was as follows:
Z ( x 0 ) = i = 1 n λ i Z ( x i )
In Formula 2, Z ( x i ) is the observation value selected for Kriging near the estimate point x0; Z ( x 0 ) is the Kriging estimate at x0; and   λ i is the weight of the ith observation with respect to the estimated point x0, which is obtained from the Kriging equations established via the semi-variance function.
Testing the normal distribution of data has the same premise as using the Kriging method for the spatial analysis of soil characteristics. The Kriging method is effective only when the analyzed data follow a normal distribution; otherwise, there may be a proportional effect. After conducting the Kolmogorov–Smirnov test, it was found that the soil salt content and water content datasets did not conform to a normal distribution; after natural logarithm conversion, they showed an approximate normal distribution, which met the requirements of geostatistical analysis. Therefore, the data adopted for variance function calculations were obtained after logarithmic conversion [33].

2.3.3. Spatial Autocorrelation Method

Spatial autocorrelation analysis, derived from biometrics, is a spatial statistical method that tests for significant spatial dependence between sample elements and describes the spatial distribution of geographical phenomena in a study area. This is the premise behind and basis of linear regression analysis [34]. This method was carried out with the spatial autocorrelation index Moran’s I, which was used to analyze the spatial autocorrelation of soil salinity. The formulae used are as follows:
I = i = 1 n j = 1 n w i j ( x i x ) ( x j x ) S 2 i = 1 n j = 1 n w i j
s 2 = 1 n i = 1 n ( x i     x ) 2
In Equations (3) and (4), I is the spatial autocorrelation index, and w i j is the spatial weight matrix between regions i and j. This study was based on the first-order ROOK weight matrix of the common boundary, where the adjacent space is 1 and the non-adjacent space is 0. x i is the observed value of a variable [1] at sample point I, x - is the mean value of the variable, x j is the observed value at sample point j, s 2 is the variance of the variable, and n is the total number of variables. Moran’s I was converted to a standard normal distribution using the following formula:
Z I = 1 E I var ( i )
In Formula (5), E(I) is the theoretical expected value, and var(i) is the variance. When Z(I) = 0, that is, when I is equal to its mathematical expectation, the observed values show an independent random distribution, corresponding to Moran’s I scatter plot. The observed values were evenly distributed in four quadrants but were not significant in the Local Indicators of Spatial Association (LISA) cluster plot. When Z(I) > 0, there is a positive spatial correlation in the region, corresponding to the distribution of observed values in quadrants 1 and 3 on the Moran’s I scatter plot and spatial similarity in the LISA cluster plot. When Z(I) < 0, there is a negative spatial correlation within the region, which corresponds to the distribution of observed values in quadrants 2 and 4 on Moran’s I scatter plot and presents spatial heterogeneity in the LISA cluster plot [35].

2.4. Data Processing and Analysis

Origin (2018, OriginLab, Northampton, MA, USA) software was used to analyze the data and draw maps, and GS + 9.0 (Youwan Technology, Beijing, China) software was used to perform logarithmic transformation on data sources that did not conform to a normal distribution. A semi-variance function model was obtained after calculation, simulation, and testing. In ArcGIS (10.8, Esri, CA, USA ) software, ordinary Kriging interpolation was used to draw spatial distribution characteristic maps of the soil salinity and groundwater depth. The spatial analysis module of Geoda (1.20.0.36, Luc Anselin, Chicago, IL, USA) software was used to calculate Moran’s I index and Z value and to draw a Moran’s I index scatter plot.

3. Results and Analysis

3.1. Analysis of Soil Salinization Characteristics

Based on the data from the samples collected on 8 June 2022, we conducted a classical statistical analysis of the salt and water content of the soil layers at 0–10, 10–20, 20–40, 40–60, 60–80, and 80–100 cm. The corresponding statistical characteristics are listed in Table 1. Overall, the average soil moisture content of each layer increased with increasing depth. The average soil salt content decreased with increasing depth in the surface layers (0–40 cm) and increased with increasing depth in the deep layers (40–100 cm). The ratios of the maximum to minimum salt content in each soil layer were 99.06, 34.00, 21.98, 20.86, 38.46, and 39.92 in the 0–10, 10–20, 20–40, 40–60, 60–80, and 80–100 cm layers, respectively, while the variation in salt ranges were 50.01, 17.16, 10.70, 10.92, 22.10, and 25.69 g/kg, respectively. There was an evident accumulation of surface soil salt, and the soil salt variability was high in the vertical direction.
It is generally believed that when the coefficient of variation is less than 10%, there is weak variability, while values of 10–100% indicate moderate variability and those greater than 100% indicate strong variability. The coefficient of variation of the soil salt content in each layer was strong, except in the 20–40 and 40–60 cm soil layers. The soil moisture content in each layer had a moderate degree of variation. The variation coefficients of soil salt content and soil water content in the 0–60 cm soil layer decreased layer by layer, indicating that the spatial variability of soil water and salt decreased with increasing soil depth. This may have been due to the influence of factors affecting the spatial variations of the soil water and soil salt content (such as climate, soil texture, and human activities) weakening with increasing soil depth. In addition, the coefficient of variation of the soil salt content was higher than that of the soil water content at the same depth, indicating that the spatial variability of the soil salt content was stronger than that of the soil water content.
Analysis of soil salt and moisture content using traditional statistical methods can only be used to summarize soil conditions. It cannot reflect the characteristics impacting local change; that is, it can produce an estimate of the overall situation, but cannot quantitatively describe the randomness, structure, independence, or correlation of the distribution of soil salt and water. To solve these problems, it is necessary to use further geostatistical methods to analyze and discuss the structure of spatial variation [33].

3.2. Analysis of Spatial Variation Characteristics of Soil Salinization

The geostatistical analysis module of GS + 9.0 software was used to carry out a semi-variance function analysis of salt and water content. The specific fitting results and parameters are listed in Table 2. The salt and water proportions of each layer of soil were well fitted by the index model, with an RSS range of 3 × 10⁻⁶–0.127 and an R2 range of 0.419–0.927, both of which reached significant levels. The ratio of the bullion value (C0) to the abasement value (C0 + C) is the bullion coefficient; the size of the bullion value indicates the degree of spatial correlation between soil properties. A bullion coefficient of less than 0.25 indicates a strong spatial correlation that is mainly affected by structural factors (climate, parent material, terrain, and soil type). A bullion coefficient between 0.25 and 0.75 indicates a moderate special correlation that is affected by structural and random factors. A bullion coefficient greater than 0.75 indicates a weak spatial correlation that is mainly affected by random factors (fertilization, tillage measures, planting systems, and other human activities). A bullion coefficient close to 1 indicates that there is constant variation across the entire scale [23]. The coefficients for salt content in the 0–60 cm soil layer ranged from 0.001 to 0.223, showing a strong spatial correlation that was mainly affected by structural factors. The bullion coefficient for the soil water content ranged from 0.001 to 0.031, showing a strong spatial correlation. In this study, the spatial variation of soil salt and water content was mainly affected by structural factors.

3.3. Soil Salt Content and Water Content Are Spatially Autocorrelated

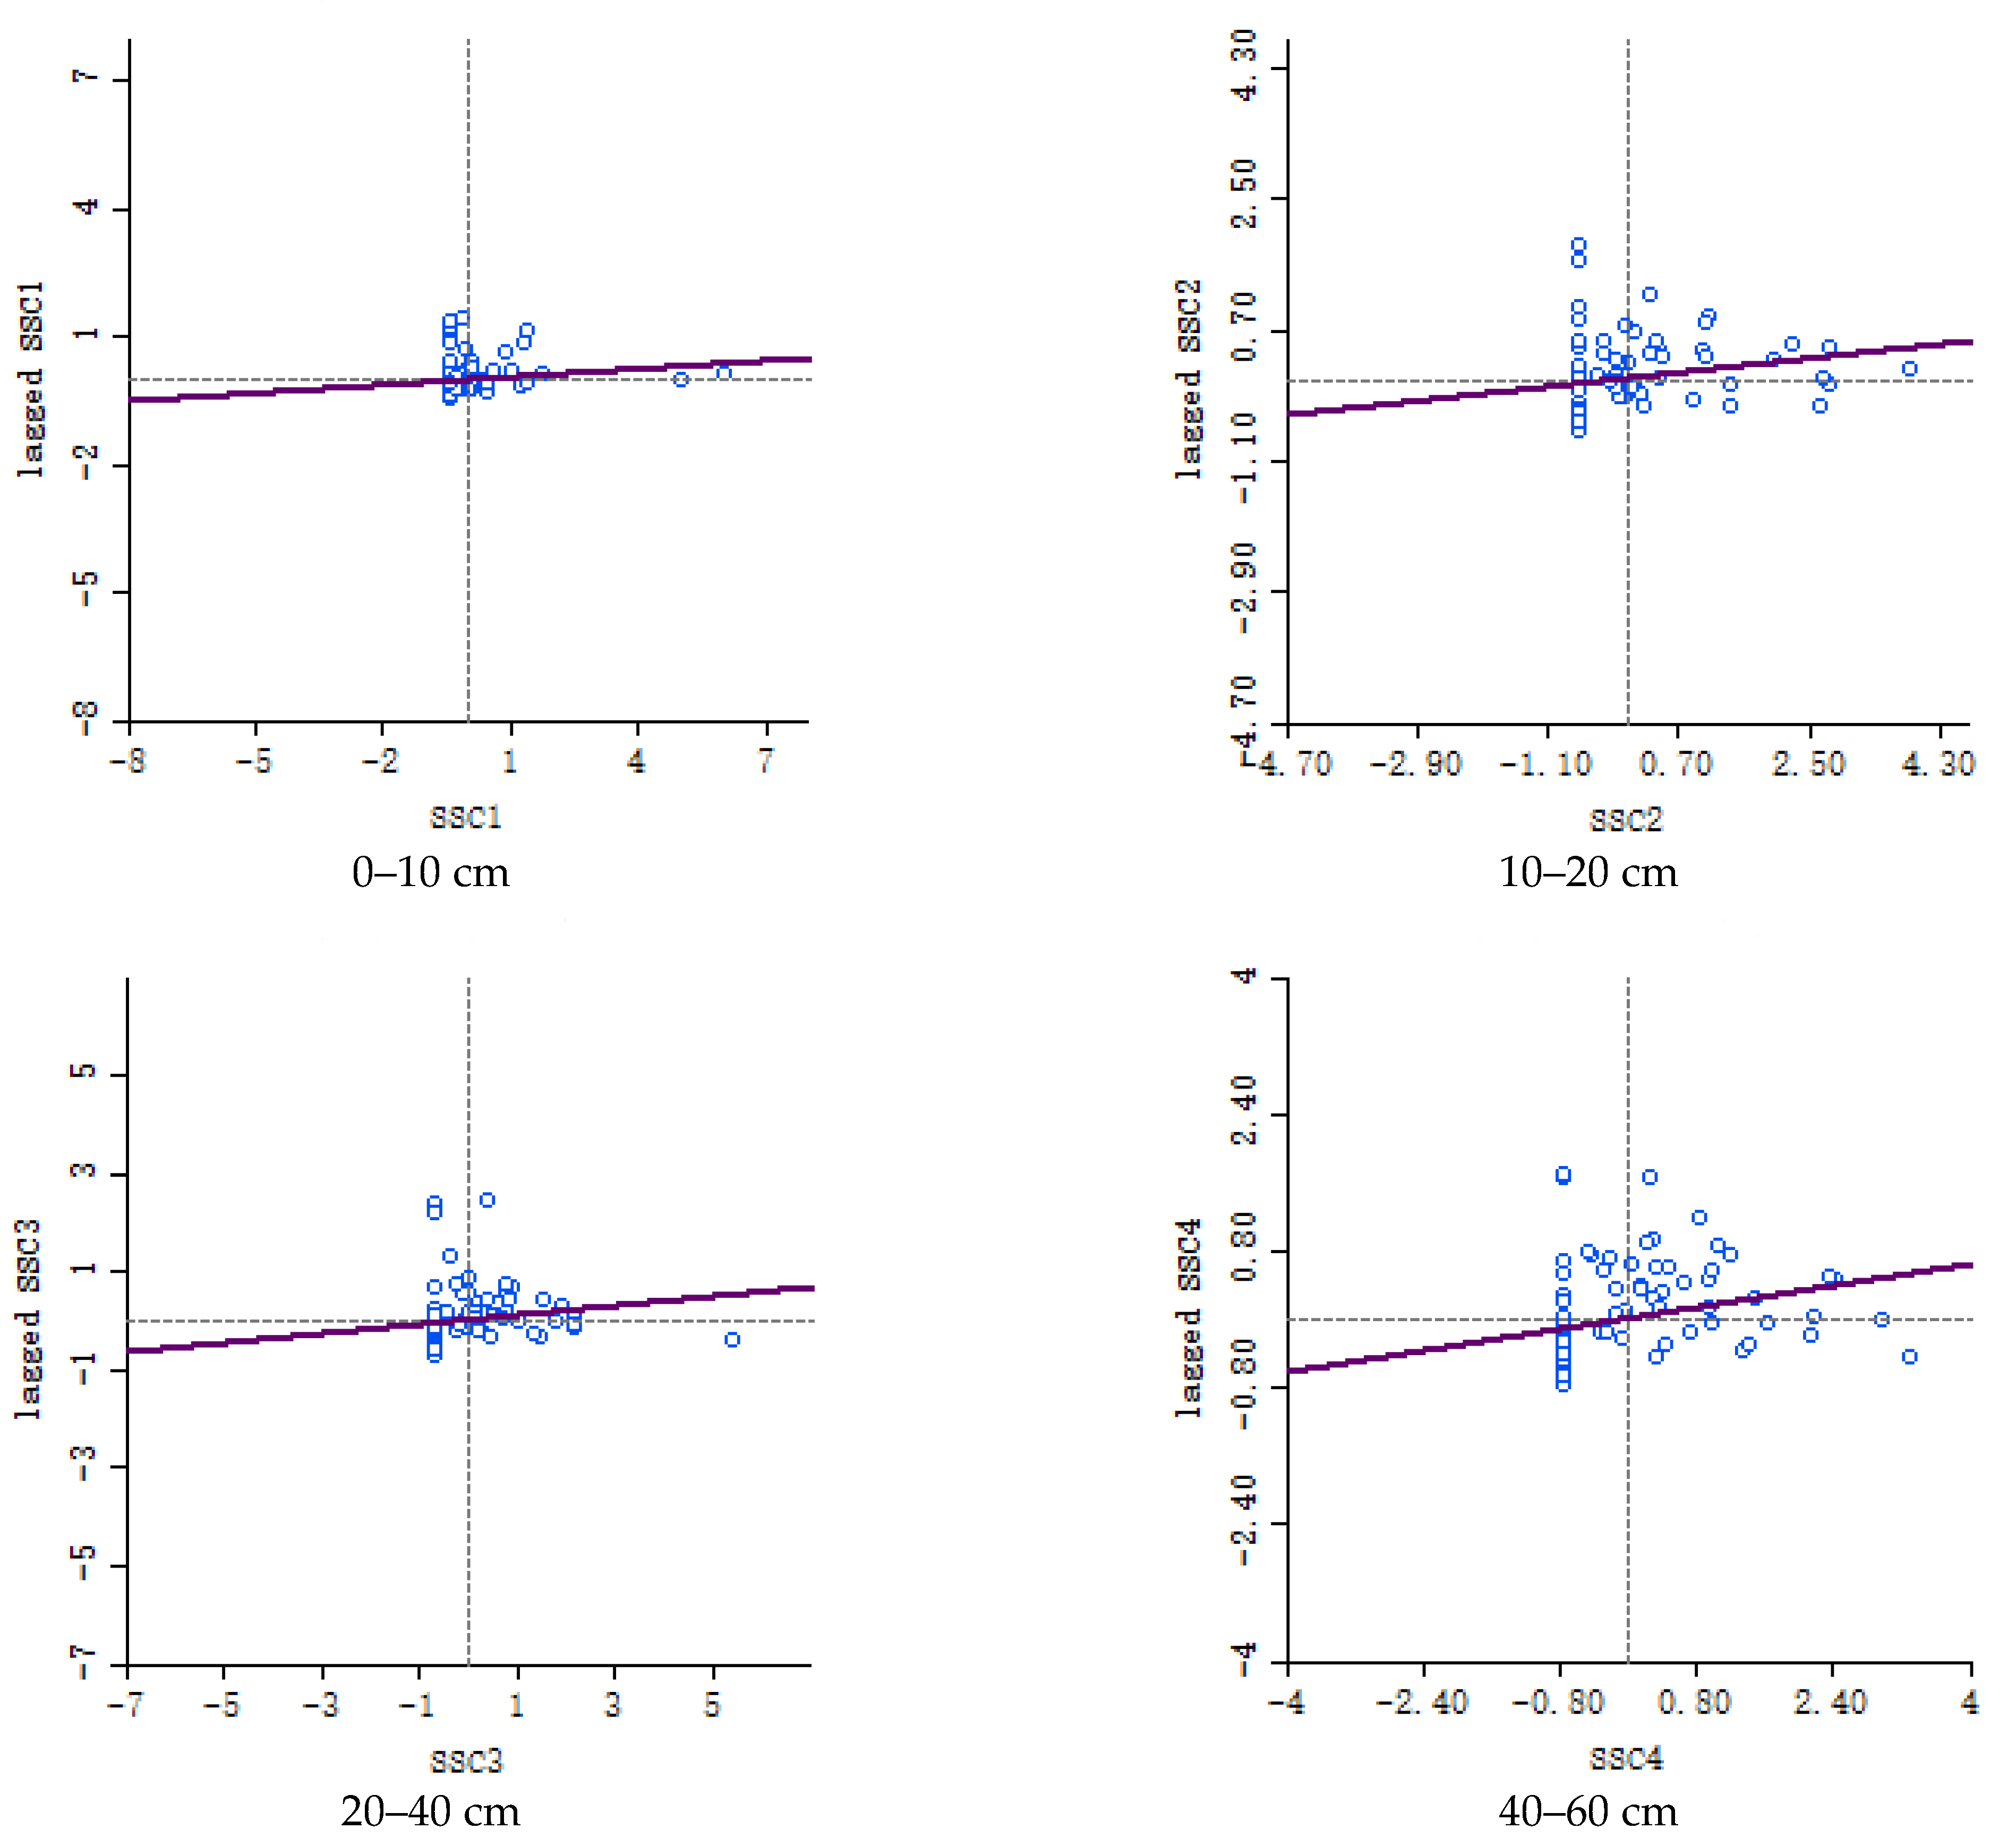
To further study the degree of spatial dependence and the local distribution pattern of soil salinization in the test area, the test area was latticed at a scale of 200 × 200 m to improve research accuracy. As shown in Figure 5, Moran’s I was used as an index to measure the spatial autocorrelation of soil salt content (SSC) and soil moisture (SM). The Geoda platform was used to analyze the global and local spatial autocorrelation of soil salt content and conductivity, and a Moran’s I scatter plot was obtained.
To further study the degree of spatial dependence and the local distribution patterns of soil salinization in the test area, the test area was latticed at a scale of 200 × 200 m to improve research accuracy. Table 3 presents the statistical results of the indicators from each layer of saline soil compared with Moran’s I at a water content depth of the same soil layer. The salt content in the 0–100 cm soil layer ranged from 0.09 to 0.19, and the Z value ranged from 1.59 to 2.62. Moran’s I and Z values of the soil water content ranged from 0.43–0.48 and 5.51–5.85, respectively. The Z values of the overall soil salt and water content in the test area were both greater than 0 (p < 0.05), and the spatial positive correlation was highly significant among all soil layers, indicating that the soil salt and water content had a strong spatial dependence. As presented in Figure 6 and Figure 7, there was a positive correlation between the salt content in the 0–100 cm soil layers, but the accumulation phenomenon was not significant relative to the moisture content. Except for one sample point, the scattered points of most of the sample points fell in the first and third quadrants, indicating a spatial agglomeration trend. These results show that the spatial distribution of the soil salt and water content in the test area was not random but regular, showing specific spatial agglomeration characteristics; these spatial agglomeration characteristics were determined by the spatial heterogeneity of the structural factors in the areas in which the sample points were located. The Geoda platform was used to analyze the global and local spatial autocorrelations of soil salt content and moisture, and a Moran’s I scatter plot was obtained.

3.4. Spatial Distribution Characteristics of Soil Salt and Water Content

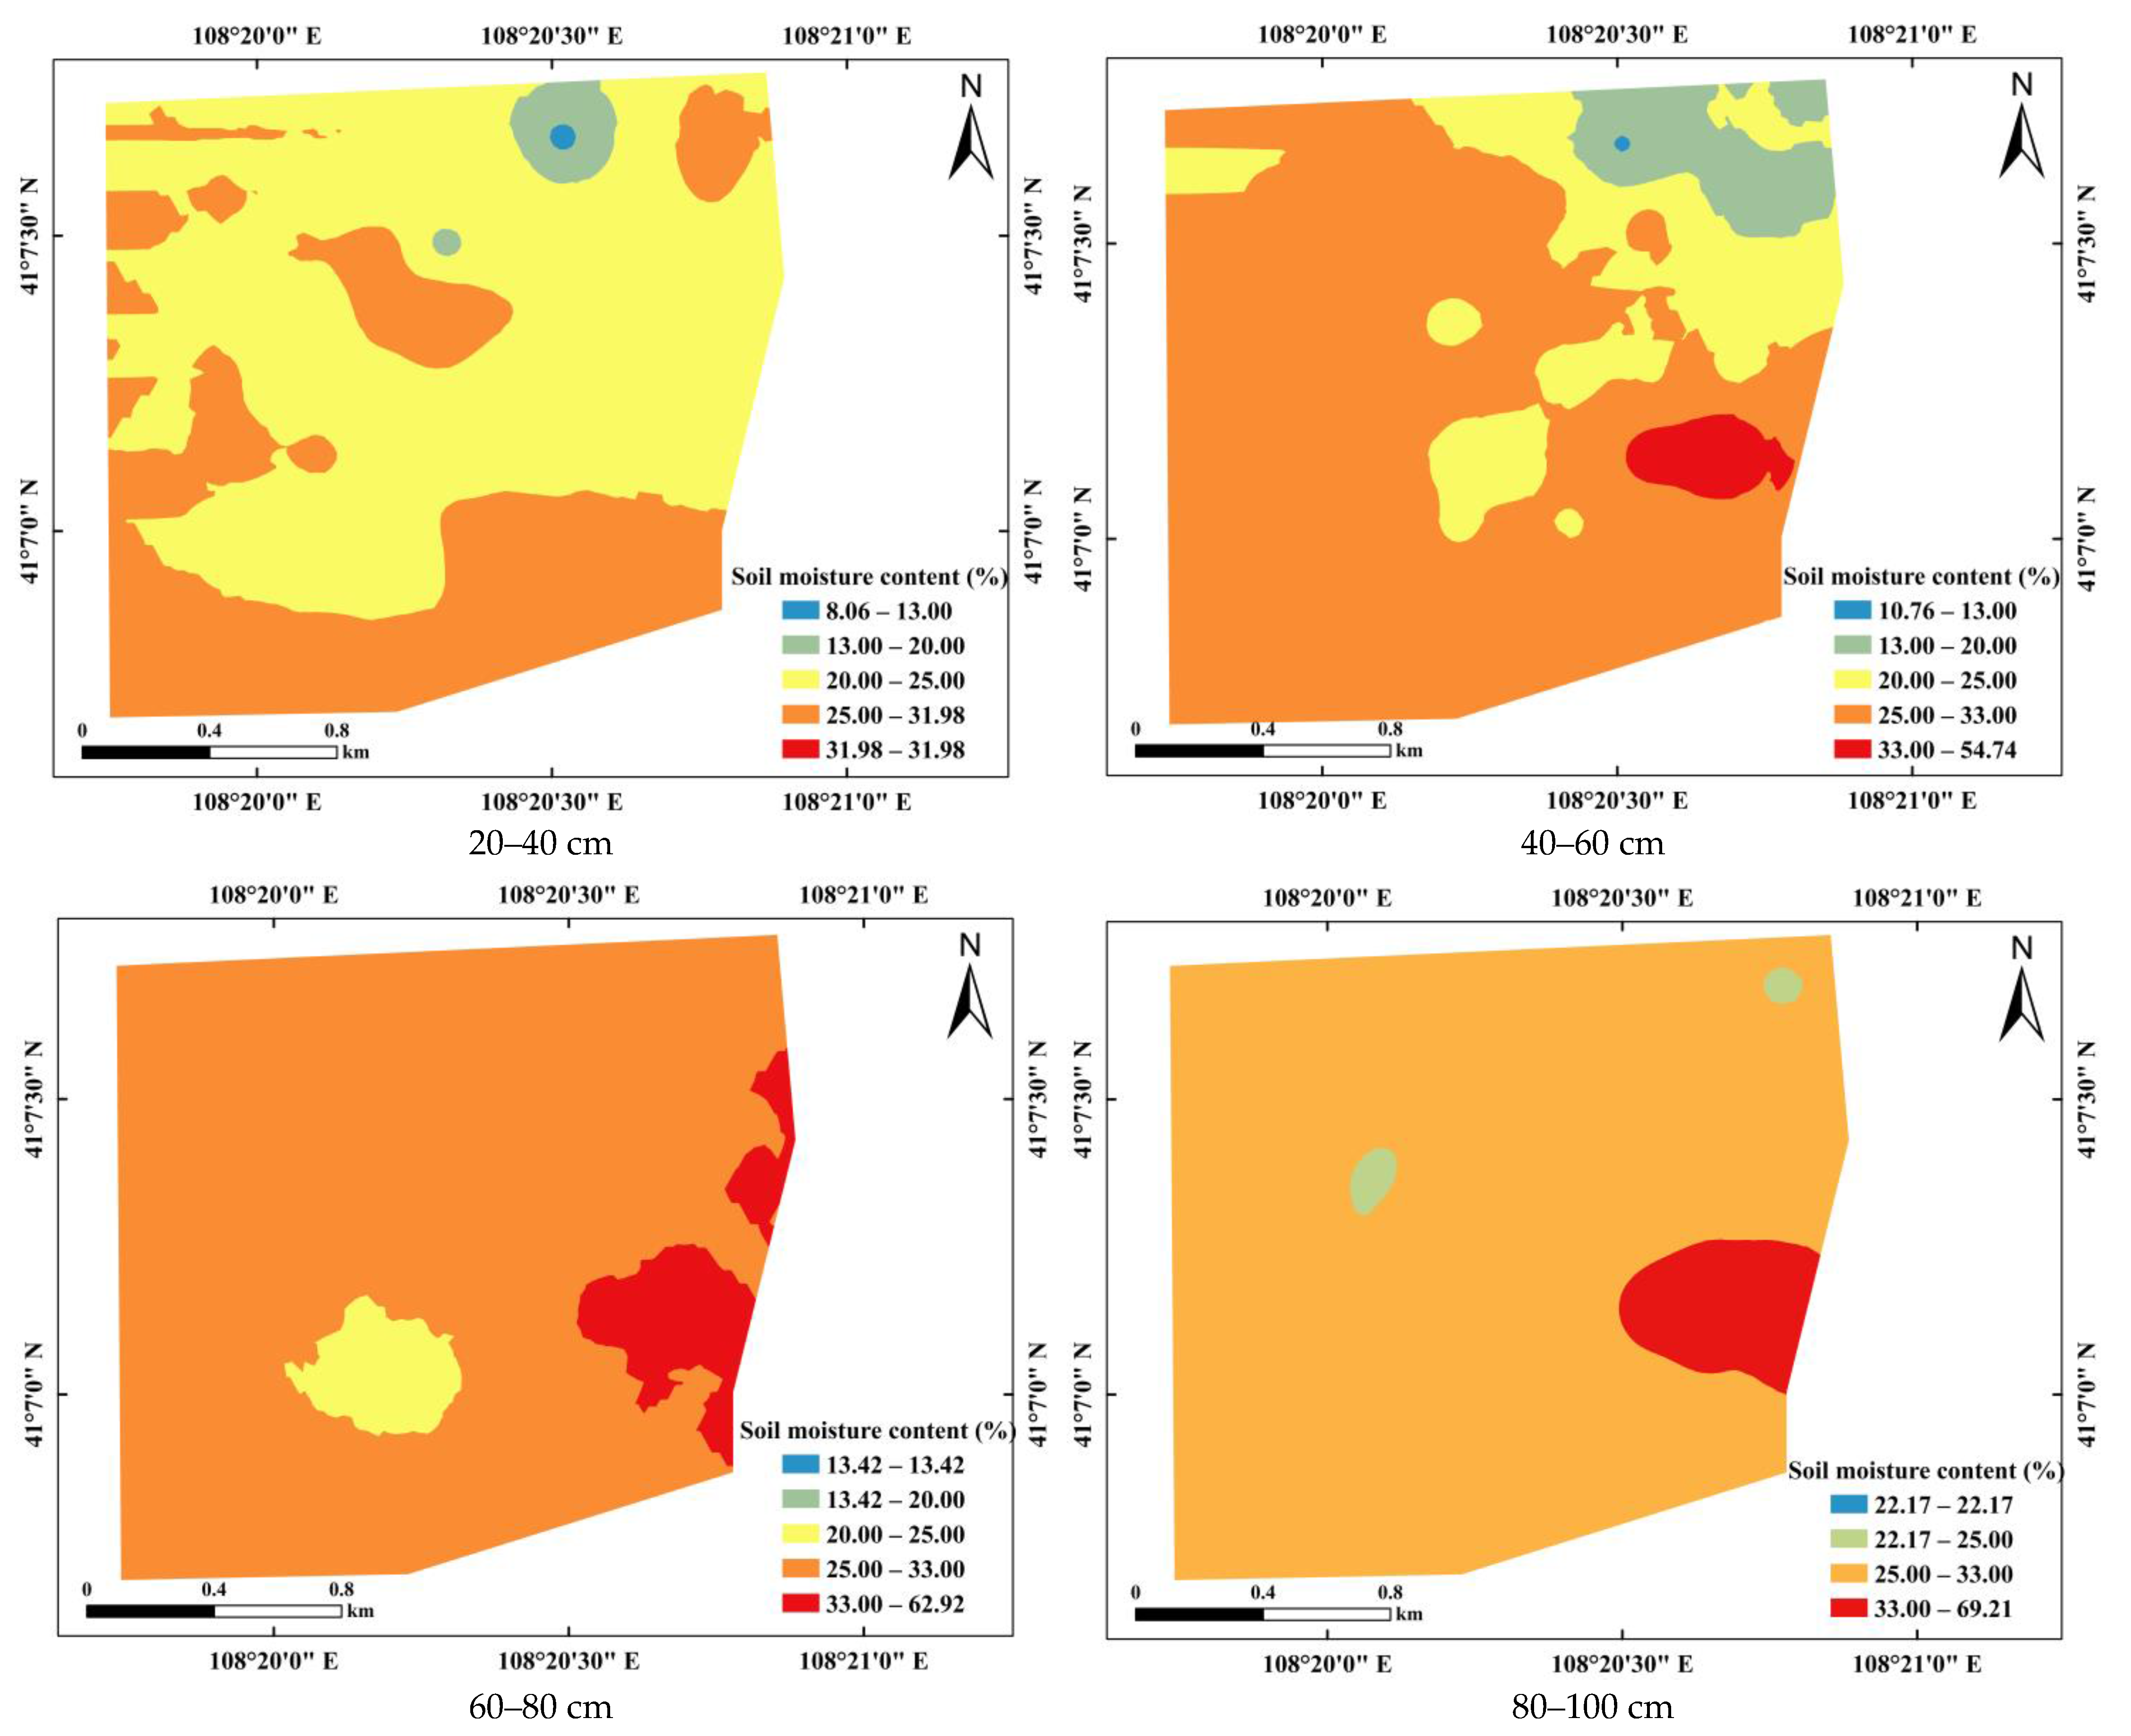
The optimal fitting model and parameters are listed in Table 2. The semi-variance function types and model parameters of the salinity factors in saline soil and the results obtained via ordinary Kriging interpolation are shown in Figure 8 and Figure 9, respectively. From the perspective of spatial distribution, areas with high soil salt content appeared in the wasteland in the transition from cultivated land to villages in the northeast of the study area and the unseeded cultivated land in the southwest of the study area. Areas with a low soil salt content were distributed in the northwest and southeast of the study area where the salt content in the surface and deep soil samples was significantly different. This difference was likely due to the lack of vegetation cover and shallow groundwater depth in these areas. Capillary water in the vadose zone rises under the prolonged action of strong evaporation, and soluble salts in the deep soil and groundwater are brought to the surface, resulting in increased salinity. Fields in the northeast and southwest were irrigated and planted in mid-May, resulting in relatively low salinity.
According to the classification standard for salinized soil [23], soil is divided into non-saline (salt content less than 2 g/kg; secure crop growth), mildly saline (salt content of 2–3 g/kg; mild crop inhibition), moderately saline (salt content of 3–6 g/kg; moderate crop inhibition), severely saline (6–10 g/kg; severe crop inhibition), and saline soil (salt content greater than 10 g/kg; a crop-damaging amount of salt). As shown in Figure 10a, the proportion of areas with different salt and water levels ranges in the different soil layers in the test area increased layer by layer by 18%. The soil salt content increased by 9% layer by layer from 0 to 40 cm in the soil with a salt content of ≤2 g/kg and by 2% and 6% for the soil with a salt content of between 2 and 3 g/kg, respectively. The areas with a 3–6 g/kg soil salt content were 33%, 29%, and 15% decreased layer by layer, respectively. Severely saline soils with 6–10 g/kg soil salt content appeared at the soil layers of 0–10 cm and 10–20 cm, accounting for 12% and 1% of samples, respectively. A soil salt content of >10 g/kg was only observed in samples at a depth of 0–10 cm, accounting for 5% of the total area and located mostly in the local wasteland in the transition area from cultivated land to villages.
As shown in Figure 10b, with an increase in soil depth, soil water content gradually increased. Low-water-content areas of 13% to 20% occurred in the 0–10, 10–20, 20–40, and 40–60 cm soil layers, accounting for 33%, 3%, 2%, and 6% of the total land, respectively. The proportions of the area with a water content of 20–25% were 60%, 82%, 60%, 18%, 3%, and 1%, respectively. The proportions of the area with a water content of 25–33% were 6%, 15%, 38%, 74%, 89%, and 92%. The high-value area with a water content greater than 33% was located in deep soil, and a change in the area’s proportions was not evident [24,36]. Sampling was carried out at the beginning of the growth period in this experiment, and groundwater and its salt moved upward continuously due to strong evaporation, which was the main source of the recharge of the soil water and salt content in the study area.

3.5. Effect of Groundwater Depth on Soil Salt Content in Different Layers

This study shows that soil salt content and soil salinization status are greatly affected by the depth of groundwater. The shallower the groundwater level, the greater the evaporation and the more serious the soil salt accumulation. The soil salt content was lower in areas with deeper groundwater levels. This shows that the groundwater depth in the study area restricted the soil salt content (“salt comes with water, salt goes with water”), and soil salt is transported to the surface soil layer by groundwater through the process of evaporation. In addition, in some parts of the study area, spring irrigation significantly impacted groundwater depth, resulting in shallow groundwater levels. Even if the groundwater salt content is low, more water will be carried via evaporation into the soil, resulting in soil salt accumulation. Therefore, the soil will not be salinized if the groundwater is controlled at a depth that does not allow salt to enter the shallower soil through evaporation.
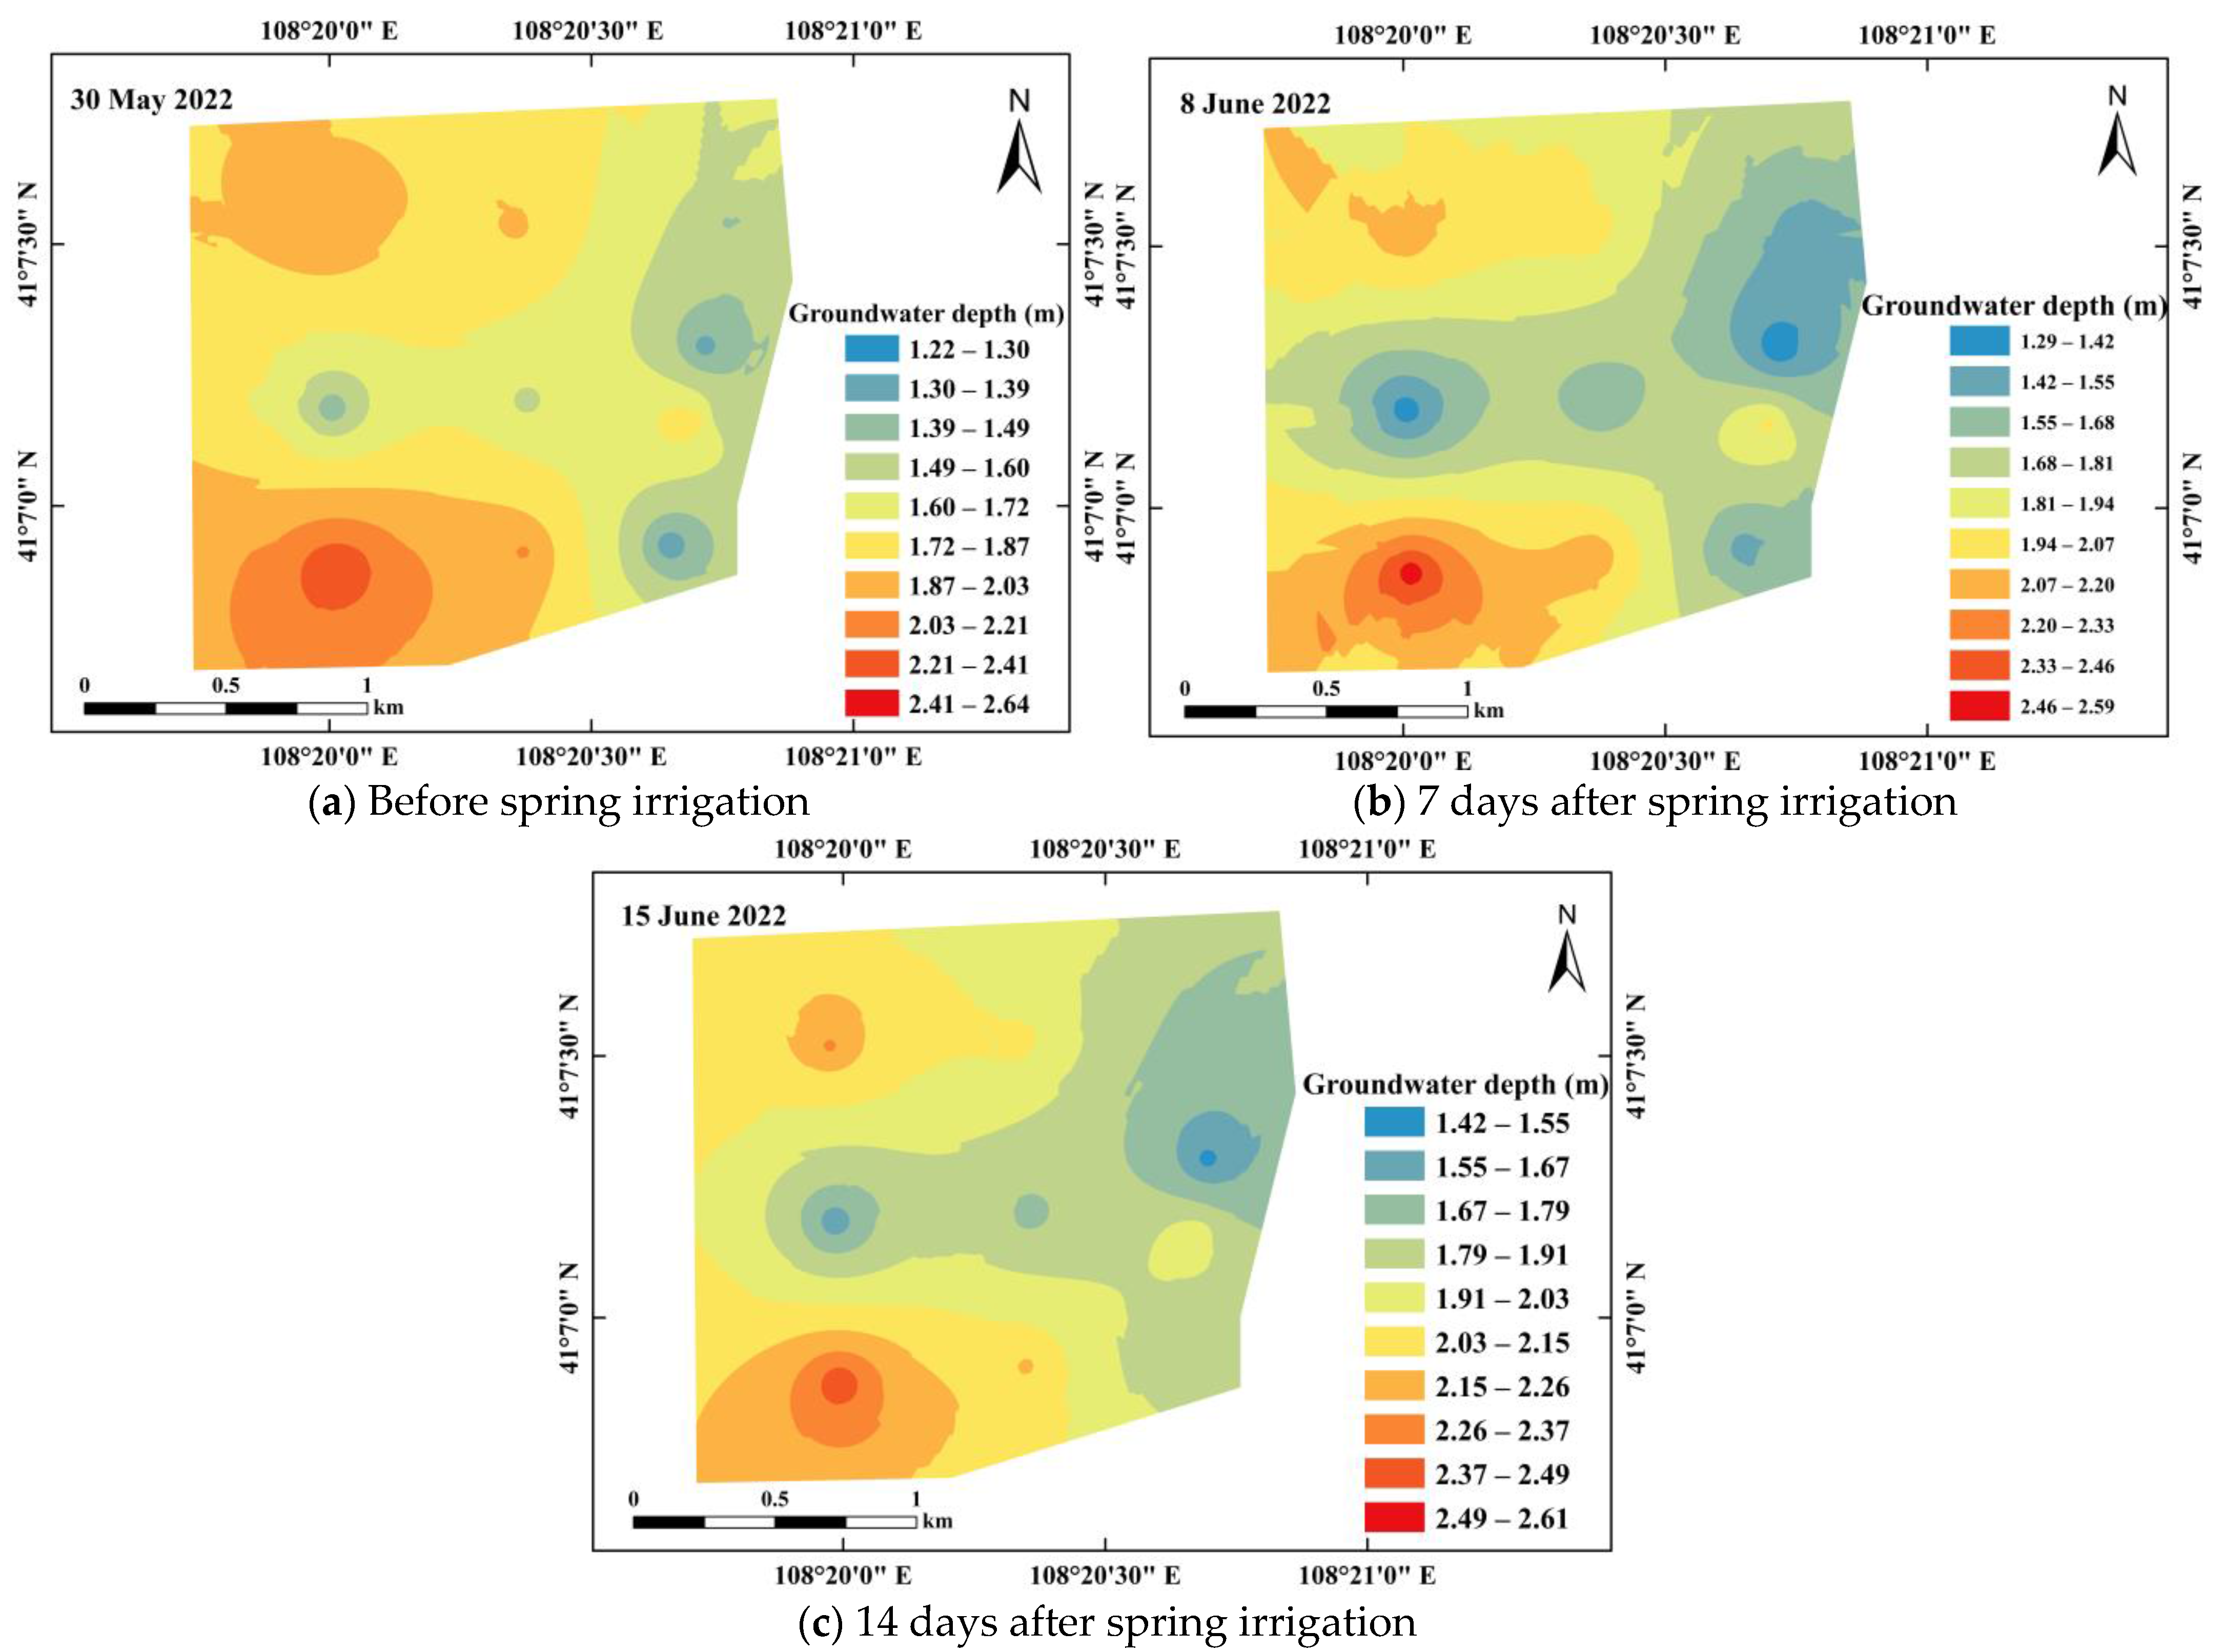
The spatial distribution of shallow groundwater depth in the study area is shown in Figure 11 through interpolation. It can be observed that the groundwater depth changes significantly before and after spring irrigation. The groundwater burial depth on the side of the new channel is obviously less than that on the side of the second channel on the left, likely due to the fact that only some farmers in the area use the new channel for spring irrigation. Furthermore, the drainage ditches in the study area have an impact on the change in groundwater burial depth. Figure 11 demonstrates that the groundwater burial depth in the right region of the study area decreases rapidly, in part, after spring irrigation. This test also reveals that the groundwater burial depth of the drainage ditches exhibits a similar trend of change, indicating its effective role in drainage. In terms of water quality, the EC value of the water in the ditch before spring irrigation was 2.7 dS/m, which increased to 3.5 dS/m after spring irrigation, resulting in a 29.6% increase in salt value.
Through an analysis of the relationship between soil salinity and groundwater depth, we observed that with shallower groundwater depths, the relationship between the two became exponential (Figure 12); the correlation was good, the R2 value was no less than 0.9421, and the fitting degree of these two values was high. Guan Xiaoyan [36,37] found that the local groundwater depth in the area of the present study was greater than 1.5 m. When the electrical conductivity value was less than 0.8 dS/m, the yield of corn, wheat, and sunflower was not affected [22]. When the underground water depth was between 1 and 1.7 m, the soil salt content changed greatly with the underground water depth. When the underground water depth was greater than 1.7 m, the overall soil salt content was low, and the salt content of each layer changed slightly. Therefore, to effectively control soil salinization, the underground water depth should be maintained below 1.7 m.

4. Discussion

4.1. Variability Mechanism of Soil Water and Salt

According to the classical statistical analysis of the soil salt factors in the study area, there is an obvious phenomenon of surface accumulation in the surface soil [12]. The soil water content increases layer by layer in the 0–40 cm deep soil layer, while the soil salt content decreases layer by layer. From the perspective of salt content variation, the maximum salt content of the surface soil is 99 times greater than the minimum value, with a variation range of 50.01 g/kg. This is due to the study area being located in arid and semi-arid regions in the Hetao irrigation area, with high groundwater levels and little rainfall. In this area, spring irrigation is usually used to “wash salt” before crop planting. However, the leaching of salt is limited when irrigation water infiltrates the soil. As a result, when the downward leaching reaches a certain depth, pore water flow reverses upward to supplement the evaporation requirement after irrigation stops. This causes salt to gather on the soil surface again, forming a high-salt zone with strong variability, which aligns with the research conclusions of some scholars in the Hetao irrigation district [37,38].
According to the results of the geostatistical analysis of the study area, soil water and salt in the 0–100 cm soil layer showed a strong spatial correlation, primarily influenced by structural factors. The irrigation areas in Hetao primarily rely on yellow water diversion, which has a high salinity, thereby resulting in the mixing of soil ions. Consequently, the chemical composition of groundwater is altered, and the precipitation behavior of certain minerals, particularly carbonate minerals, is induced. Such behavior impacts the pore microstructure of the soil and leads to changes at the macroscopic scale such as alterations in soil particle size distribution [8]. This study’s findings demonstrate a decrease in soil salinity as the sand content increases, whereas an increase in soil salinity is observed with higher clay and silt content [3]. The relationship between soil water and soil clay is negative, whereas it is positive for clay and silt content. This is mainly due to the large surface area of soil clay and silt, which constitute the active segment of the soil, facilitating effective water penetration and solute leaching [39,40]. Conversely, sand is relatively inert, thus impeding deep seepage and solute transport. This circumstance promotes an increase in the reaction surface area and the production of more mineral precipitation [41]. Maize and sunflowers were the primary crops planted in the study area. Although crop cultivation and management in the area were performed relatively scientifically (mulching, formula fertilization, etc.), the soil organic matter content in the study area was only 9.5 g/kg, meaning the soil had insufficient fertility. Considering the local situation, this cultivated land should probably be subjected to a straw-crushing treatment before future crop planting. This treatment can effectively improve the decomposition rate of organic residues and the synthesis rate of organic matter, promote the soil-ripening process, increase the silt and clay content in the soil, and play a role in soil moisture conservation [42].
The results of Zhang Wencong’s quantification of the conversion between soil water and groundwater at the scale of canals in the Hetao Irrigation District showed that the levels of recharge of soil water into groundwater over a 2-year growth period were 207.73 mm and 236.94 mm [14]. Thus, it can be observed that the bidirectional exchange between soil water and shallow groundwater was frequent during the growth period. This frequent water exchange indicates that there is significant hydrological exchange between surface water and shallow groundwater in the Hetao irrigation area. Furthermore, it is important to note that soil salinization generally occurs in areas where the groundwater depth is low. This occurs when salt-rich pore water from groundwater continuously evaporates at or near the surface, leading to salt precipitation [37]. The key to preventing soil salinization is to control groundwater levels. Therefore, the area’s irrigation and drainage system should be improved, and technical agricultural measures such as reasonable irrigation should be taken to prevent the increase in the groundwater level and soil salt return. Generally, when the groundwater depth is more than 2–3 m, the accumulation of salt generated via soil evaporation is small [37,38]. However, the results of this study show that when the groundwater depth is more than 1.7 m, the soil salt content is low, and the soil salt content changes little in each layer, which does not affect the yield of corn and sunflower in the region. It is important to note that this area’s groundwater depth varies seasonally, so controlling the groundwater depth in the study area is not the only standard with which to control soil salinization. Soil salinization should be controlled in various aspects by combining groundwater composition and other soil improvement methods [43].

4.2. Spatial Correlation of Soil Water and Salt

Kriging interpolation is the most commonly used interpolation method in geostatistics. It can effectively estimate the attribute value of an unsampled area. Some scholars at home and abroad have used inverse-distance-weighted interpolation to study soil spatial variation [23,24,32,44]. However, when the variation coefficient of the predicted object is large, Kriging interpolation has higher accuracy. According to Michael J. Friedel, hydrogeological units can generate variation functions for Kriging interpolation with sufficient support, which can improve the spatial density of spectral remote sensing images [45]. Kriging is the most commonly used interpolation method in geological statistics. Some scholars have used the inverse-distance-weighted interpolation method to study soil spatial variation. However, some studies have indicated that the accuracy of Kriging is higher when the coefficient of variation of the predicted object is large [23,24,32,44,46,47,48]. The combination of ArcGIS and geostatistics can be used to effectively monitor spatial variations in regional soil salt factors [2,20,46,47,48,49,50]. Based on the regionalized variable theory, GS+9 software was used to carry out semi-variance function fitting. We found that the spatial variation in the soil salt and water content at the canal scale was best represented by an exponential model. The ecological processes associated with spatial change on a small scale may be consistent with the conclusions of some factors related to land use, such as crop type, soil texture, and tillage methods, as reported by Guo Xudong et al. [51]. Studies have shown that if there is a large variation in soil properties within a small spatial range, the nugget value will be larger than the absent value, and Moran’s I index is a more robust method to use [35]. Our study area lies between the scale of an irrigation area and the scale of farmland with flat terrain. There was no large wasteland as the object of salt discharge for the cultivated land; therefore, it did not exhibit dry salt discharge [52], and drainage and salt discharge depended on the drainage channels in the area. Future research should investigate how different spatial arrangements of cultivated land and wasteland affect the spatial variability of soil water and salt under varying irrigation and drainage conditions [53].
In this study, it was found that the spatial autocorrelation of soil water and salt at the canal scale is good [23,24], indicating a strong dependence relationship (Figure 5 and Figure 6). Consequently, ordinary Kriging interpolation provides reliable results for soil environmental parameters, rendering them valuable for land salinization management. It is worth noting that the spatial variability of soil is influenced by the variation of the sampling scale. As the sampling scale increases, the complexity of soil water and salt variation increases, potentially because of homogeneity at a small scale. In the future, the research scope of spatial correlation should gradually be expanded to include varying scales, such as canals, branch canals, and irrigation areas [2,3].
In the study area, soil water and salt showed a spatial concentration trend with a strong dependence relationship [29,46,54,55]. This showed that the evaluation of soil salinization is a complex problem, and factors such as crops, soil texture, canal system layout, and groundwater should be considered [56,57,58]. The effects of different planting times and canal system layouts on the spatial variation of soil salinity were investigated, and the effects of different particle size distributions and groundwater depths on soil salinity were studied. The timely determination of the influence of the above factors on the spatial variation and distribution pattern of soil salinity has important reference value for soil salinization prevention and can be used as a reference for land management departments. However, this study only studied the spatial variation of soil water and salt at the aqueduct scale after spring irrigation, and this information cannot be used to predict the future situation of soil salinization in the study area. In future studies, we will study soil salinization at the scale of canals by analyzing groundwater ion components, different irrigation and drainage systems, and different spatial configuration component models of cultivated wasteland. This will provide solid technical support for sustainable agricultural development [59,60].

5. Conclusions

The strong variability of soil water and salt content in the region was indicated by the coefficients of variation, which ranged from 0.1 to 1.0 for soil water content and from 0.77 to 1.75 for soil salt content. The index model provided a good fit for both soil water and salt, with a strong spatial correlation observed. This was supported by the nugget coefficients, all of which were less than 0.25. The spatial variation of soil water and salt content in the region was primarily influenced by structural factors.
A positive spatial correlation was observed between soil water and salt, with Moran’s I values ranging from 0.09 to 0.48. The Z values were all greater than 0, indicating a significant relationship (p < 0.05). Furthermore, spatial interpolation revealed a well-distributed pattern of water and salt in the study area. Moreover, a strong exponential relationship between groundwater depth and soil salt was found. Consequently, it was determined that the levels of soil salinization were low in the study area.
A combination of geostatistics, ordinary Kriging, and spatial autocorrelation was used to reveal the spatial variation and distribution patterns of soil water and salt at the canal scale. The distribution map of soil water and salt was obtained via conventional Kriging interpolation and then divided according to a grid. Moran’s I index was used to determine the accumulation behavior of water and salt in the soil samples at the aqueduct scale.

Author Contributions

Conceptualization, H.S.; Methodology, H.S.; Validation, H.S.; Formal analysis, Z.H. and Q.M.; Investigation, Z.H., Q.M., H.S., C.H., C.Y. and Y.M.; Resources, H.S.; Data curation, H.S.; Writing—original draft, Z.H.; Writing—review & editing, H.S. and W.F.; Visualization, Z.H., H.S. and W.F.; Supervision, H.S. and W.F.; Project administration, H.S. All authors have read and agreed to the published version of the manuscript.

Funding

The work was financially supported by the 14th Five-Year Plan National Key Research and Development Plan (2021YFC3201202-05), the Inner Mongolia Autonomous Region science and technology project (2023JBGS0003), the National Natural Science Foundation of China (52269014), and the Research Program of Science and Technology at Universities of Inner Mongolia Autonomous Region, China (2022YFHH0044).

Data Availability Statement

The data already exist in this manuscript.

Conflicts of Interest

The authors declare that they have no competing financial interests or personal relationships that could have influenced the work reported in this manuscript.

References

  1. AbdelRahman, M.A.; Zakarya, Y.M.; Metwaly, M.M.; Koubouris, G. Deciphering soil spatial variability through geostatistics and interpolation techniques. Sustainability 2020, 13, 194. [Google Scholar] [CrossRef]
  2. Kosma, C.; Triantafyllidis, V.; Zotos, A.; Pittaras, A.; Kouneli, V.; Karydogianni, S.; Mavroeidis, A.; Kakabouki, I.; Beslemes, D.; Tigka, E.L.; et al. Assessing spatial variability of soil properties in Mediterranean smallholder farming systems. Land 2022, 11, 557. [Google Scholar] [CrossRef]
  3. Ke, Z.; Liu, X.; Ma, L.; Jiao, F.; Wang, Z. Spatial distribution of soil water and salt in a slightly salinized farmland. Sustainability 2023, 15, 6872. [Google Scholar] [CrossRef]
  4. Pouryazdankhah, H.; Shahnazari, A.; Ahmadi, M.Z.; Khaledian, M.; Andersen, M.N. Rice yield estimation based on forecasting the future condition of groundwater salinity in the Caspian coastal strip of Guilan Province, Iran. Environ. Monit. Assess. 2019, 191, 492. [Google Scholar] [CrossRef]
  5. Xu, X.; Huang, G.; Sun, C.; Pereira, L.S.; Ramos, T.B.; Huang, Q.; Hao, Y. Assessing the effects of water table depth on water use, soil salinity and wheat yield: Searching for a target depth for irrigated areas in the upper Yellow River basin. Agric. Water Manag. 2013, 125, 46–60. [Google Scholar] [CrossRef]
  6. Nachshon, U. Cropland soil salinization and associated hydrology: Trends, processes and examples. Water 2018, 10, 1030. [Google Scholar]
  7. Aeman, H.; Shu, H.; Abbas, S.; Aisha, H.; Usman, M. Sinking delta: Quantifying the impacts of saltwater intrusion in the Indus Delta of Pakistan. Sci. Total Environ. 2023, 880, 163356. [Google Scholar] [CrossRef]
  8. Zheng, T.; Fang, Y.; Zhang, X.; Gao, S.; Li, P.; Zheng, X.; Liu, T.; Walther, M. Saltwater intrusion induced micro-scale mineral precipitation and evolution in porous media. J. Hydrol. 2023, 625, 129968. [Google Scholar] [CrossRef]
  9. Shi, H.; Yang, S.; Li, R.; Li, X.; Li, W.; Yan, J.; Miao, Q.; Li, Z. Soil water and salt movement and soil salinization control in Hetao Irrigation District: Current state and future prospect. J. Irrig. Drain 2020, 39, 1–17. [Google Scholar]
  10. Loescher, W.; Chan, Z.; Grumet, R. Options for developing salt-tolerant crops. HortScience 2011, 46, 1085–1092. [Google Scholar] [CrossRef]
  11. Wang, X.; Gao, Q.; Lu, Q. Salt-water balance and dry drainage desalting in Hetao Irrigating Area, Inner Mongolia. Sci. Geogr. Sin. 2006, 26, 460. [Google Scholar]
  12. Li, B.; Shi, H.; Yan, J.; Li, Z.; Zhang, J.; Zhou, J. Relation between groundwater depth and soil water and salt after water saving reform in salinization irrigation district. J. Soil Water Conserv. 2014, 28, 117–122. [Google Scholar]
  13. Abd-Elaty, I.; Zelenakova, M. Saltwater intrusion management in shallow and deep coastal aquifers for high aridity regions. J. Hydrol. Reg. Stud. 2022, 40, 101026. [Google Scholar] [CrossRef]
  14. Zhang, W.; Shi, H.; Li, X.; Li, Z.; Zhou, H.; Wang, W. Dynamic and transformational relationship between soil water and groundwater in typical areas of Hetao Irrigation District. Trans. Chin. Soc. Agric. Mach. 2022, 53, 352–362. (In Chinese) [Google Scholar]
  15. Zhang, S.; He, Y.; Fang, H. Spatial variability of soil properties in the field based on GPS and GIS. Nongye Gongcheng Xuebao (Trans. Chin. Soc. Agric. Eng.) 2003, 19, 39–44. [Google Scholar]
  16. Yao, R.; Yang, J.; Liu, G. Spatial variability of soil salinity and moisture and their estimations by co kriging method—A case study in characteristic field of Yellow River delta. J. Soil Water Conserv. 2006, 20, 133–138. [Google Scholar]
  17. Qianji, H.; Shaoyuan, F.; Zhou, G. Intra-annual spatiotemporal variation in salt content in the plough layer in Hetao Irrigation District. J. Irrig. Drain. 2020, 39, 26–34. [Google Scholar]
  18. Yan, A.; Jiang, P.; Sheng, J.; Wang, X.; Wang, Z. Spatial variability of surface soil salinity in Manas River basin. Acta Pedofil. Sin 2014, 51, 410–414. [Google Scholar]
  19. Wu, C.; Lu, C.; Chen, J.; Liu, J.; Zhang, H.; Saidy, E.; Liu, B.; Shu, L. Spatio-temporal variability of hydraulic conductivity in the floodplain riverbank of a hyporheic zone. CATENA 2023, 228, 107172. [Google Scholar] [CrossRef]
  20. Liu, J.; Ma, X.; Zhang, Z. Multifractal study on spatial variability of soil water and salt and its scale effect. Trans. Chin. Soc. Agric. Eng. 2010, 26, 81–86. [Google Scholar]
  21. Guan, X.; Yang, P.; Lv, Y. Analysis on spatial variability of soil properties based on multifractal theory. J. Basic Sci. Eng 2011, 19, 712–720. [Google Scholar]
  22. Mondal, P.; Walter, M.; Miller, J.; Epanchin-Niell, R.; Gedan, K.; Yawatkar, V.; Nguyen, E.; Tully, K.L. The spread and cost of saltwater intrusion in the US Mid-Atlantic. Nat. Sustain. 2023, 1–11. [Google Scholar] [CrossRef]
  23. Shi, H.; Wu, D.; Yan, J.; Li, X.; Zhu, K. Spatial temporal Variation of Soil Salinity after Water Saving Transformation in Salinized Irrigation District. Trans. Chin. Soc. Agric. Mach. 2020, 51, 318–331. [Google Scholar]
  24. Zhang, F.; Li, Y.; Wang, D.; Wang, X.; Zhang, H.; Chen, L. Analysis of Distribution Patterns and Spatial Variability of Soil Salinity Affecting Factors in Topsoil Layer ofSalinized Soil in Jinghe Oasis. J. Ecol. Rural Environ. 2018, 34, 64–73. (In Chinese) [Google Scholar]
  25. Chen, L.; Lü, Y.; Fu, B.; Wei, W. A framework on landscape pattern analysis and scale change by using pattern recognition approach. Acta Ecol. Sin. 2006, 26, 663–670. [Google Scholar]
  26. Zhang, Q.; Pan, X.; Wang, H.; Liu, F.; Shi, X. Study on spatial distribution of soil quality and quantitative evaluation of soil fertility quality under middle spatial scale. Chin. J. Soil Sci. 2003, 34, 493–497. [Google Scholar]
  27. Xu, Y.; Chen, Y.; Shi, H.; Wei, Z. Scale effect of spatial variability of soil water-salt. Trans. Chin. Soc. Agric. Eng. 2004, 20, 1–5. [Google Scholar]
  28. Ren, D.; Xu, X.; Huang, G. Irrigation water use in typical irrigation and drainage system of Hetao Irrigation District. Trans. Chin. Soc. Agric. Eng 2019, 35, 98–105. [Google Scholar]
  29. Rousseva, S. Data transformations between soil texture schemes. Eur. J. Soil Sci. 1997, 48, 749–758. [Google Scholar] [CrossRef]
  30. Liu, W.; Ma, L.; Smanov, Z.; Samarkhanov, K.; Abuduwaili, J. Clarifying Soil Texture and Salinity Using Local Spatial Statistics (Getis-Ord Gi* and Moran’s I) in Kazakh–Uzbekistan Border Area, Central Asia. Agronomy 2022, 12, 332. [Google Scholar] [CrossRef]
  31. Li, L.; Yi, Y.; Ling, G.; Wang, S. Utilization of geostatistics in soil spatial variability. Chin. J. Soil Sci. 2005, 36, 265–268. [Google Scholar]
  32. Franco, T.C.; Ferraz, G.A.; Carvalho, L.C.; Silva, F.M.; Alves, M.C.; Marin, D.B. Spatial variability of soil physical properties in longitudinal profiles. An. Acad. Bras. Ciências 2022, 94, e20200411. [Google Scholar] [CrossRef] [PubMed]
  33. Yao, R.; Yang, J.; Liu, G.; Zou, P. Spatial variability of soil salinity in characteristic field of the Yellow River Delta. Trans. CSAE 2006, 22, 61–66. [Google Scholar]
  34. Fang, L.; Li, Y.; Li, F.; Zhu, H. Analysis of spatial variation of soil moisture-salinity-nutrient in Ebinur Lake wetlands, China. J. Agro-Environ. Sci. 2019, 38, 157–167. [Google Scholar]
  35. Li, Y.; Zhao, G. Spatial prediction of cultivated land soil nutrients in typical region of yellow river delta. J. Nat. Resour. 2018, 33, 489–503. [Google Scholar]
  36. Liu, Y.; Sun, G.; Mao, W.; Cheng, X.; Zhu, Y.; Yang, J. Geostatistical Analysis of Spatial Variability of Soil Water and Salt in Hetao Irrigation District. J. Irrig. Drain. 2022, 41, 101–109. (In Chinese) [Google Scholar]
  37. Guan, X.; Wang, S.; Gao, Z.; Lv, Y.; Fu, X. Spatio-temporal variability of soil salinity and its relationship with the depth to groundwater in salinization irrigation district. Acta Ecol. Sin 2012, 32, 1202–1210. [Google Scholar] [CrossRef]
  38. Dou, X.; Shi, H.; Miao, Q.; Tian, F.; Yu, D.; Zhou, L.; Liang, Z. Temporal and spatial variability analysis of soil water and salt and the influence of groundwater depth on salt in saline irrigation area. J. Soil Water Conserv. 2019, 33, 246–253. [Google Scholar]
  39. Bin, L.; Haibin, S.; Debao, T. Soil salinity profile characteristics and its spatial distribution before and after water saving. Arid Zone Res. 2015, 32, 663–673. [Google Scholar]
  40. Paz-Ferreiro, J.; Vázquez, E.V.; Miranda, J.G.V. Assessing soil particle-size distribution on experimental plots with similar texture under different management systems using multifractal parameters. Geoderma 2010, 160, 47–56. [Google Scholar] [CrossRef]
  41. Zhou, Z.; Zhou, Z. Investigating the hydrodynamic and biogeochemical evolutions of the hyporheic zone due to large-scale reservoir impoundment. J. Hydrol. 2023, 620, 129475. [Google Scholar] [CrossRef]
  42. Mazzoncini, M.; Sapkota, T.B.; Barberi, P.; Antichi, D.; Risaliti, R. Long-term effect of tillage, nitrogen fertilization and cover crops on soil organic carbon and total nitrogen content. Soil Tillage Res. 2011, 114, 165–174. [Google Scholar] [CrossRef]
  43. Xu, Y.; Ge, Z.; Wang, J.; Li, W.; Feng, S. Study on relationship between soil salinization and groundwater table depth based on indicator Kriging. Trans. Chin. Soc. Agric. Eng. 2019, 35, 123–130. [Google Scholar]
  44. Xu, D.; Liu, C.; Cai, T.; Zhang, S. 3D spatial distribution characteristics of soil organic matter and total nitrogen in farmland. Trans. Chin. Soc. Agric. Mach. 2015, 46, 157–163. [Google Scholar]
  45. Friedel, M.J. Estimation and scaling of hydrostratigraphic units: Application of unsupervised machine learning and multivariate statistical techniques to hydrogeophysical data. Hydrogeol. J. 2016, 24, 2103. [Google Scholar] [CrossRef]
  46. Liu, G.; Wu, Y.; Yang, J.; Yu, S.; Wang, X. Regional 3-D soil salt spatial variability based on electromagnetic induction technology. Nongye Jixie Xuebao = Trans. Chin. Soc. Agric. Mach. 2013, 44, 78–82. [Google Scholar]
  47. Laslett, G.; McBratney, A.; Pahl, P.J.; Hutchinson, M. Comparison of several spatial prediction methods for soil pH. J. Soil Sci. 1987, 38, 325–341. [Google Scholar] [CrossRef]
  48. Hosseini, E.; Gallichand, J.; Marcotte, D. Theoretical and experimental performance of spatial interpolation methods for soil salinity analysis. Trans. ASAE 1994, 37, 1799–1807. [Google Scholar] [CrossRef]
  49. Yao, R.; Yang, J.; Han, J. Comparative study of simulations of spatial variability of soil salinity in coastal polders. Acta Pedol. Sin. 2012, 49, 275–281. [Google Scholar]
  50. Oliver, M.; Webster, R. A tutorial guide to geostatistics: Computing and modelling variograms and kriging. Catena 2014, 113, 56–69. [Google Scholar] [CrossRef]
  51. Guo, X.; Fu, B.; Ma, K.; Chen, L. Spatial variability of soil nutrients based on geostatistics combined with GIS—A case study in Zunghua City of Hebei Province. Chin. J. Appl. Ecol. 2000, 11, 557–563. (In Chinese) [Google Scholar]
  52. Wang, G.; Shi, H.; Li, X.; Zheng, Q.; Guo, J.; Wang, W. Analysis of water and salt transportation and balance during cultivated land, waste land and lake system in Hetao Irrigation Area. J. Hydraul. Eng. 2019, 50, 1518–1528. [Google Scholar]
  53. Huang, Y.; Ma, Y.; Zhang, S.; Li, Z.; Huang, Y. Optimum allocation of salt discharge areas in land consolidation for irrigation districts by SahysMod. Agric. Water Manag. 2021, 256, 107060. [Google Scholar] [CrossRef]
  54. Zhao, Y.; Feng, Q.; Yang, H. Soil salinity distribution and its relationship with soil particle size in the lower reaches of Heihe River, Northwestern China. Environ. Earth Sci. 2016, 75, 810. [Google Scholar] [CrossRef]
  55. Xia, J.; Zhao, X.; Zhao, Z.; Chen, Y.; Liu, J. Migration characteristics of soil water and salt and their interaction under different groundwater levels. Trans. Chin. Soc. Agric. Eng. 2015, 31, 93–100. [Google Scholar]
  56. Feng, W.; Yang, F.; Cen, R.; Liu, J.; Chen, H. Effects of straw biochar application on soil temperature, available nitrogen and growth of corn. J. Environ. Manag. 2021, 277, 111331. [Google Scholar] [CrossRef]
  57. Feng, W.; Gao, J.; Cen, R.; Yang, F.; He, Z.; Wu, J.; Miao, Q.; Liao, H. Effects of polyacrylamide-based super absorbent polymer and corn straw biochar on the arid and semi-arid salinized soil. Agriculture 2020, 10, 519. [Google Scholar] [CrossRef]
  58. Feng, W.; Wang, T.; Yang, F.; Cen, R.; Liao, H.; Qu, Z. Effects of biochar on soil evaporation and moisture content and the associated mechanisms. Environ. Sci. Eur. 2023, 35, 66. [Google Scholar] [CrossRef]
  59. Inam, A.; Adamowski, J.; Prasher, S.; Albano, R. Parameter estimation and uncertainty analysis of the Spatial Agro Hydro Salinity Model (SAHYSMOD) in the semi-arid climate of Rechna Doab, Pakistan. Environ. Model. Softw. 2017, 94, 186–211. [Google Scholar] [CrossRef]
  60. Inam, A.; Adamowski, J.; Prasher, S.; Halbe, J.; Malard, J.; Albano, R. Coupling of a distributed stakeholder-built system dynamics socio-economic model with SAHYSMOD for sustainable soil salinity management–Part 1: Model development. J. Hydrol. 2017, 551, 596–618. [Google Scholar] [CrossRef]
Figure 1. The distribution of the study area and sampling points.
Water 15 03342 g001
Figure 2. Rainfall and temperature during the growth period of 2022.
Water 15 03342 g002
Figure 3. Schematic diagrams of hydrogeological conditions in Hetao Irrigation District.
Water 15 03342 g003
Figure 4. Soil textures in the study area.
Water 15 03342 g004
Figure 5. A grid map of the study area.
Water 15 03342 g005
Figure 6. Moran’s I scatter plots of the soil salt content.
Water 15 03342 g006aWater 15 03342 g006b
Figure 7. Moran’s I scatter plots of the soil moisture content.
Water 15 03342 g007aWater 15 03342 g007b
Figure 8. The spatial distribution of the soil salt content.
Water 15 03342 g008aWater 15 03342 g008b
Figure 9. The spatial distribution of the soil moisture content.
Water 15 03342 g009aWater 15 03342 g009b
Figure 10. The proportionate areas of different soil salt and water content intervals in different layers.
Water 15 03342 g010
Figure 11. Groundwater depth in different periods in the study area.
Water 15 03342 g011
Figure 12. The relationship between soil salt content and groundwater depth.
Water 15 03342 g012
Table 1. Statistical analysis of soil salinity.
Depth/cmMinimumMaximumAverage ValueStandard DeviationVarianceSkewnessKurtosisCoefficient of Variation/%
Soil salt content (g/kg)0–100.5150.524.648.1165.774.4121.961.75
10–200.5217.682.902.948.672.8911.571.01
20–400.5111.212.582.214.892.195.220.86
40–600.5511.472.952.265.091.683.190.77
60–800.5922.693.634.1216.953.0511.131.13
80–1000.6626.353.594.0316.203.8919.931.12
Soil moisture content (%)0–1013.7144.6521.124.8423.432.6810.720.23
10–2015.6038.5422.943.6813.561.565.790.16
20–408.0631.9824.193.6413.28−1.616.760.15
40–6010.7654.7426.485.7933.471.8812.580.21
60–8013.4262.9228.486.7745.893.2514.750.23
80–10022.1769.2120.017.1050.374.2421.340.35
Table 2. Semi-variance function types and model parameters of salinity factors in saline soil.
IndexDepth/cmModelNugget (C0)Sill (C0 + C)Partial Sill C0/(C0 + C)RSSR2Range/km
Soil salt content0–10Exponential0.0191.7630.0110.1020.9270.031
10–20Exponential0.0320.8260.0390.0690.8260.018
20–40Exponential0.0860.6390.1350.0720.7210.015
40–60Exponential0.1330.5960.2230.0890.5460.011
60–80Exponential0.0010.7520.0010.1270.4190.004
80–100Exponential0.1130.6750.1670.0120.6630.005
Soil moisture content0–10Exponential0.00020.0470.0040.00030.7990.012
10–20Exponential0.0010.0290.0310.00010.7640.015
20–40Exponential0.01014.9400.0010.0010.6190.009
40–60Exponential0.0010.6360.0020.2910.8560.034
60–80Exponential0.00010.0430.0020.0010.6790.008
80–100Exponential0.00010.0360.0030.00030.7310.008
Table 3. Statistics of indicators of each layer of saline soil.
Depth/cmMoran’IZP
Soil Salt Content (g/kg)Soil Moisture Content (%)Soil Salt Content (g/kg)Soil Moisture Content (%)Soil Salt Content (g/kg)Soil Moisture Content (%)
0~100.160.461.615.61<0.05<0.05
10~200.110.461.585.64<0.05<0.05
20~400.090.461.555.58<0.05<0.05
40~600.160.482.145.85<0.05<0.05
60~800.190.432.625.21<0.05<0.05
80~1000.100.451.845.51<0.05<0.05
Disclaimer/Publisher’s Note: The statements, opinions and data contained in all publications are solely those of the individual author(s) and contributor(s) and not of MDPI and/or the editor(s). MDPI and/or the editor(s) disclaim responsibility for any injury to people or property resulting from any ideas, methods, instructions or products referred to in the content.