

An Evaluation System for Assessing the Operational Efficiency of Urban Combined Sewer Systems Using AHP—Fuzzy Comprehensive Evaluation: A Case Study in Shanghai, China

Abstract
:1. Introduction
2. Evaluation System for Operation Efficiency of Combined Sewer System
2.1. Establishment of the Evaluation Index System

| Evaluation Objectives | Common Indexes | Authors |
|---|---|---|
| Combined sewer overflow control and waterlogging control | Descriptive indexes: waterlogging nodes, waterlogging volume, waterlogging duration, waterlogging area, waterlogging depth, overflow water volume, overflow duration, overflow distribution, etc.; Predictive indexes: proportion of waterlogged pipe sections, potential waterlogging hazards, proportion of overflow volume, potential overflow pollution, etc.; Guiding indexes: waterlogging reduction potential, overflow reduction potential, regulation and storage capacity, dispatching capacity, etc. | Chen F(2016) [2], Leimgruber J et al.(2018) [3], Jiang Z(2020) [16], Zhang D et al.(2020) [4], Cai Z et al.(2020) [18] |
| Prediction and diagnosis of pipe network performance | Pipeline network design indexes: drainage pipe diameter, storm water outlet elevation, dispatching capacity, storage capacity, etc.; Hydraulic performance indexes: pipeline water depth, pipeline flow velocity, pipeline fullness, pipeline bearing capacity, etc.; Pipeline status indexes: pipe age, pipe material, burial depth, cushion, pipeline blockage, pipeline inspection, pipeline maintenance, etc. | Zheng M et al.(2020) [5], Okwori E et al.(2020) [6], Ghavami S et al.(2020) [7], Yang L et al.(2021) [20], Jin H et al.(2021) [19], Wang Z et al.(2018) [17], He F et al.(2023) [21] |
| Management and operation of sewer systems | Ecological effect indexes: greenhouse gas emissions, drainage pollution, environmental benefits, etc.; Social effect indexes: service population, customer service satisfaction, etc.; Economic effect indexes: maintenance costs, investment in fixed assets, etc.; Pipe network planning indexes: pipe network coverage, pipe network density, pipe network structure at all levels, etc.; | Young J (2017) [15], Lee J et al. (2018) [27], Ananda J (2020) [8] |
| Comprehensive evaluation of sewer systems | Sewage treatment capacity, drainage pipe network density, sewage treatment rate, low carbon conservation, recycling, natural symbiosis, value creation, smart management and control, etc. | Wang Z et al. (2018) [17], Nam S et al.(2019) [12], Wang J et al.(2022) [13] |
2.2. Optimization of Evaluation Indexes
- (1)
- Pumping station discharge time: Despite some experts believing it could effectively represent overflow duration, it was removed due to the challenges in accurately measuring pumping station discharge into the river, especially during rainy days.
- (2)
- Wastewater treatment plant overflow time: Similar to the previous index, it was removed because accurately measuring wastewater treatment plant discharge into the river, especially during rainy days, posed significant challenges.
- (3)
- Ponding area ratio: Although some experts saw potential in this indicator for characterizing waterlogging severity, it was removed because, in practice, ponding areas can result from topographical factors unrelated to waterlogging.
- (4)
- Fullness degree: While some experts thought this index could characterize hydraulic properties within drainage pipes and aid in predicting flooding, others believed it was mostly reflective of full pipe flow during rainy days, rendering it irrelevant for evaluation. It was removed based on the study’s actual context.
- (5)
- Waterlogging potential hazards: This index was challenging to measure accurately, leading to its removal.
- (6)
- Variation coefficient of inflow quality: Although considered by some to reflect overflow pollution extent and hazards, experts argued that changes in this index were not directly related to overflows and waterlogging. As a result, this indicator was deleted based on expert recommendations.
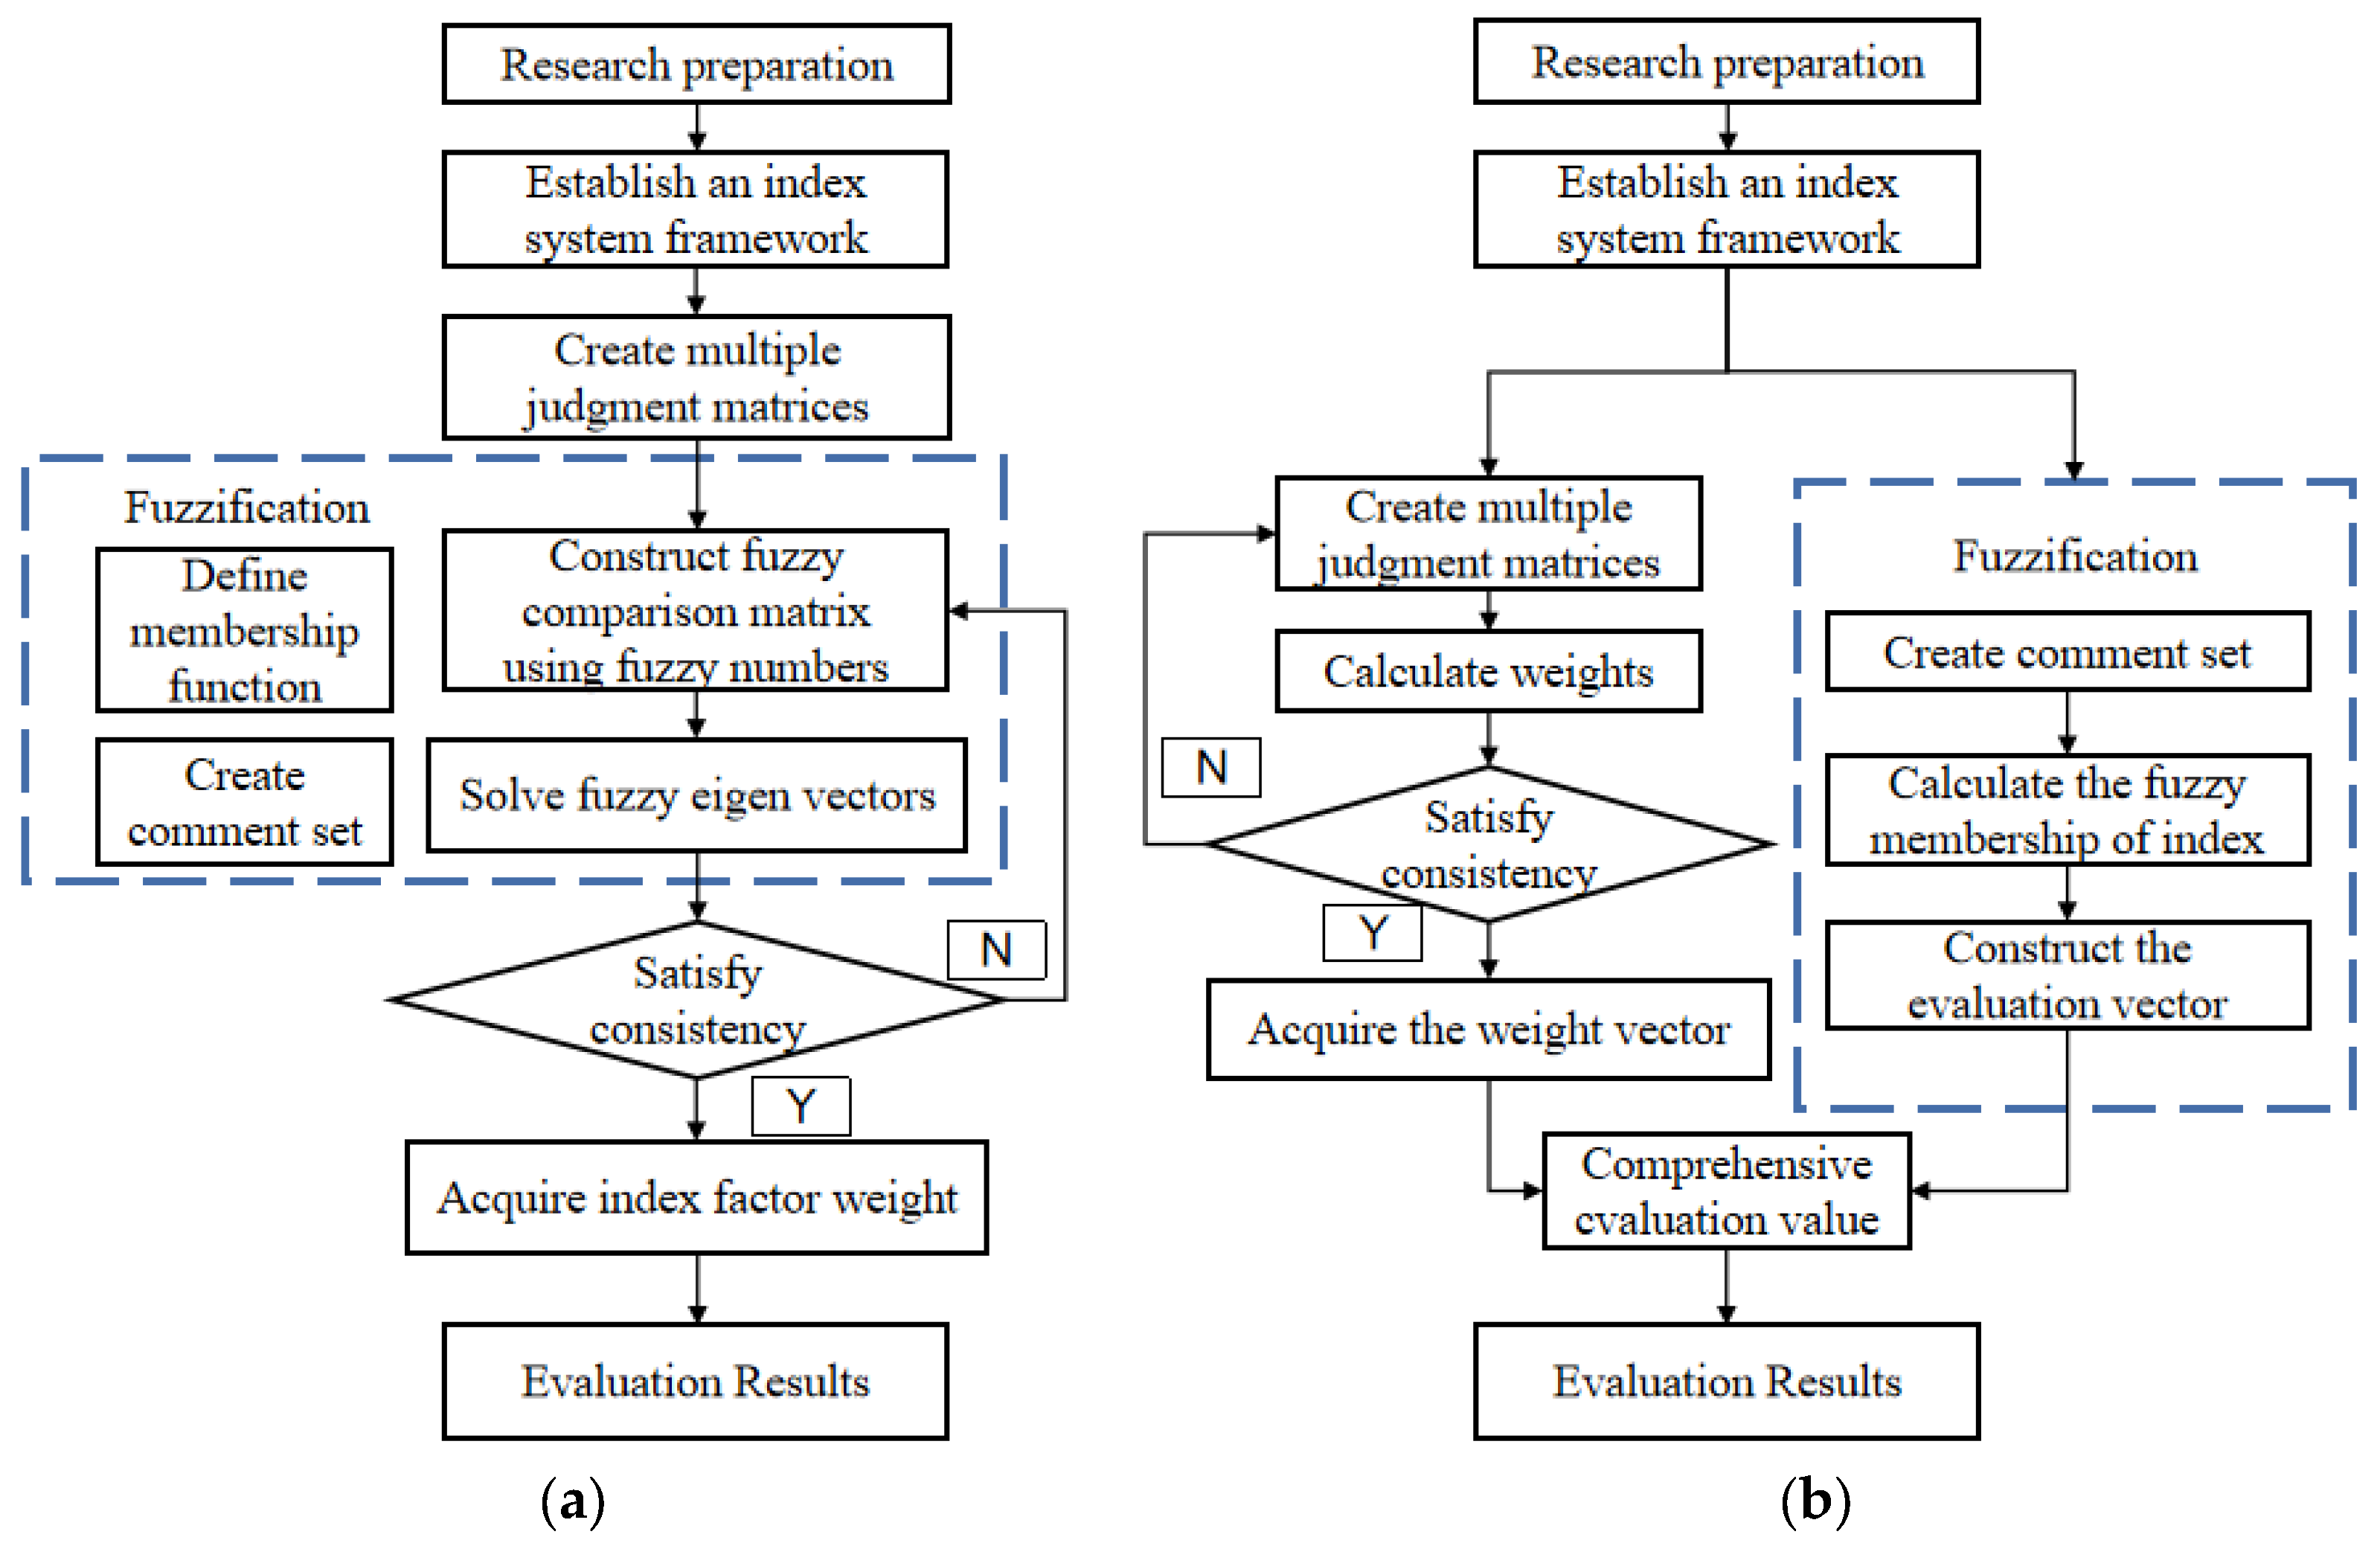
3. AHP—Fuzzy Comprehensive Evaluation Method
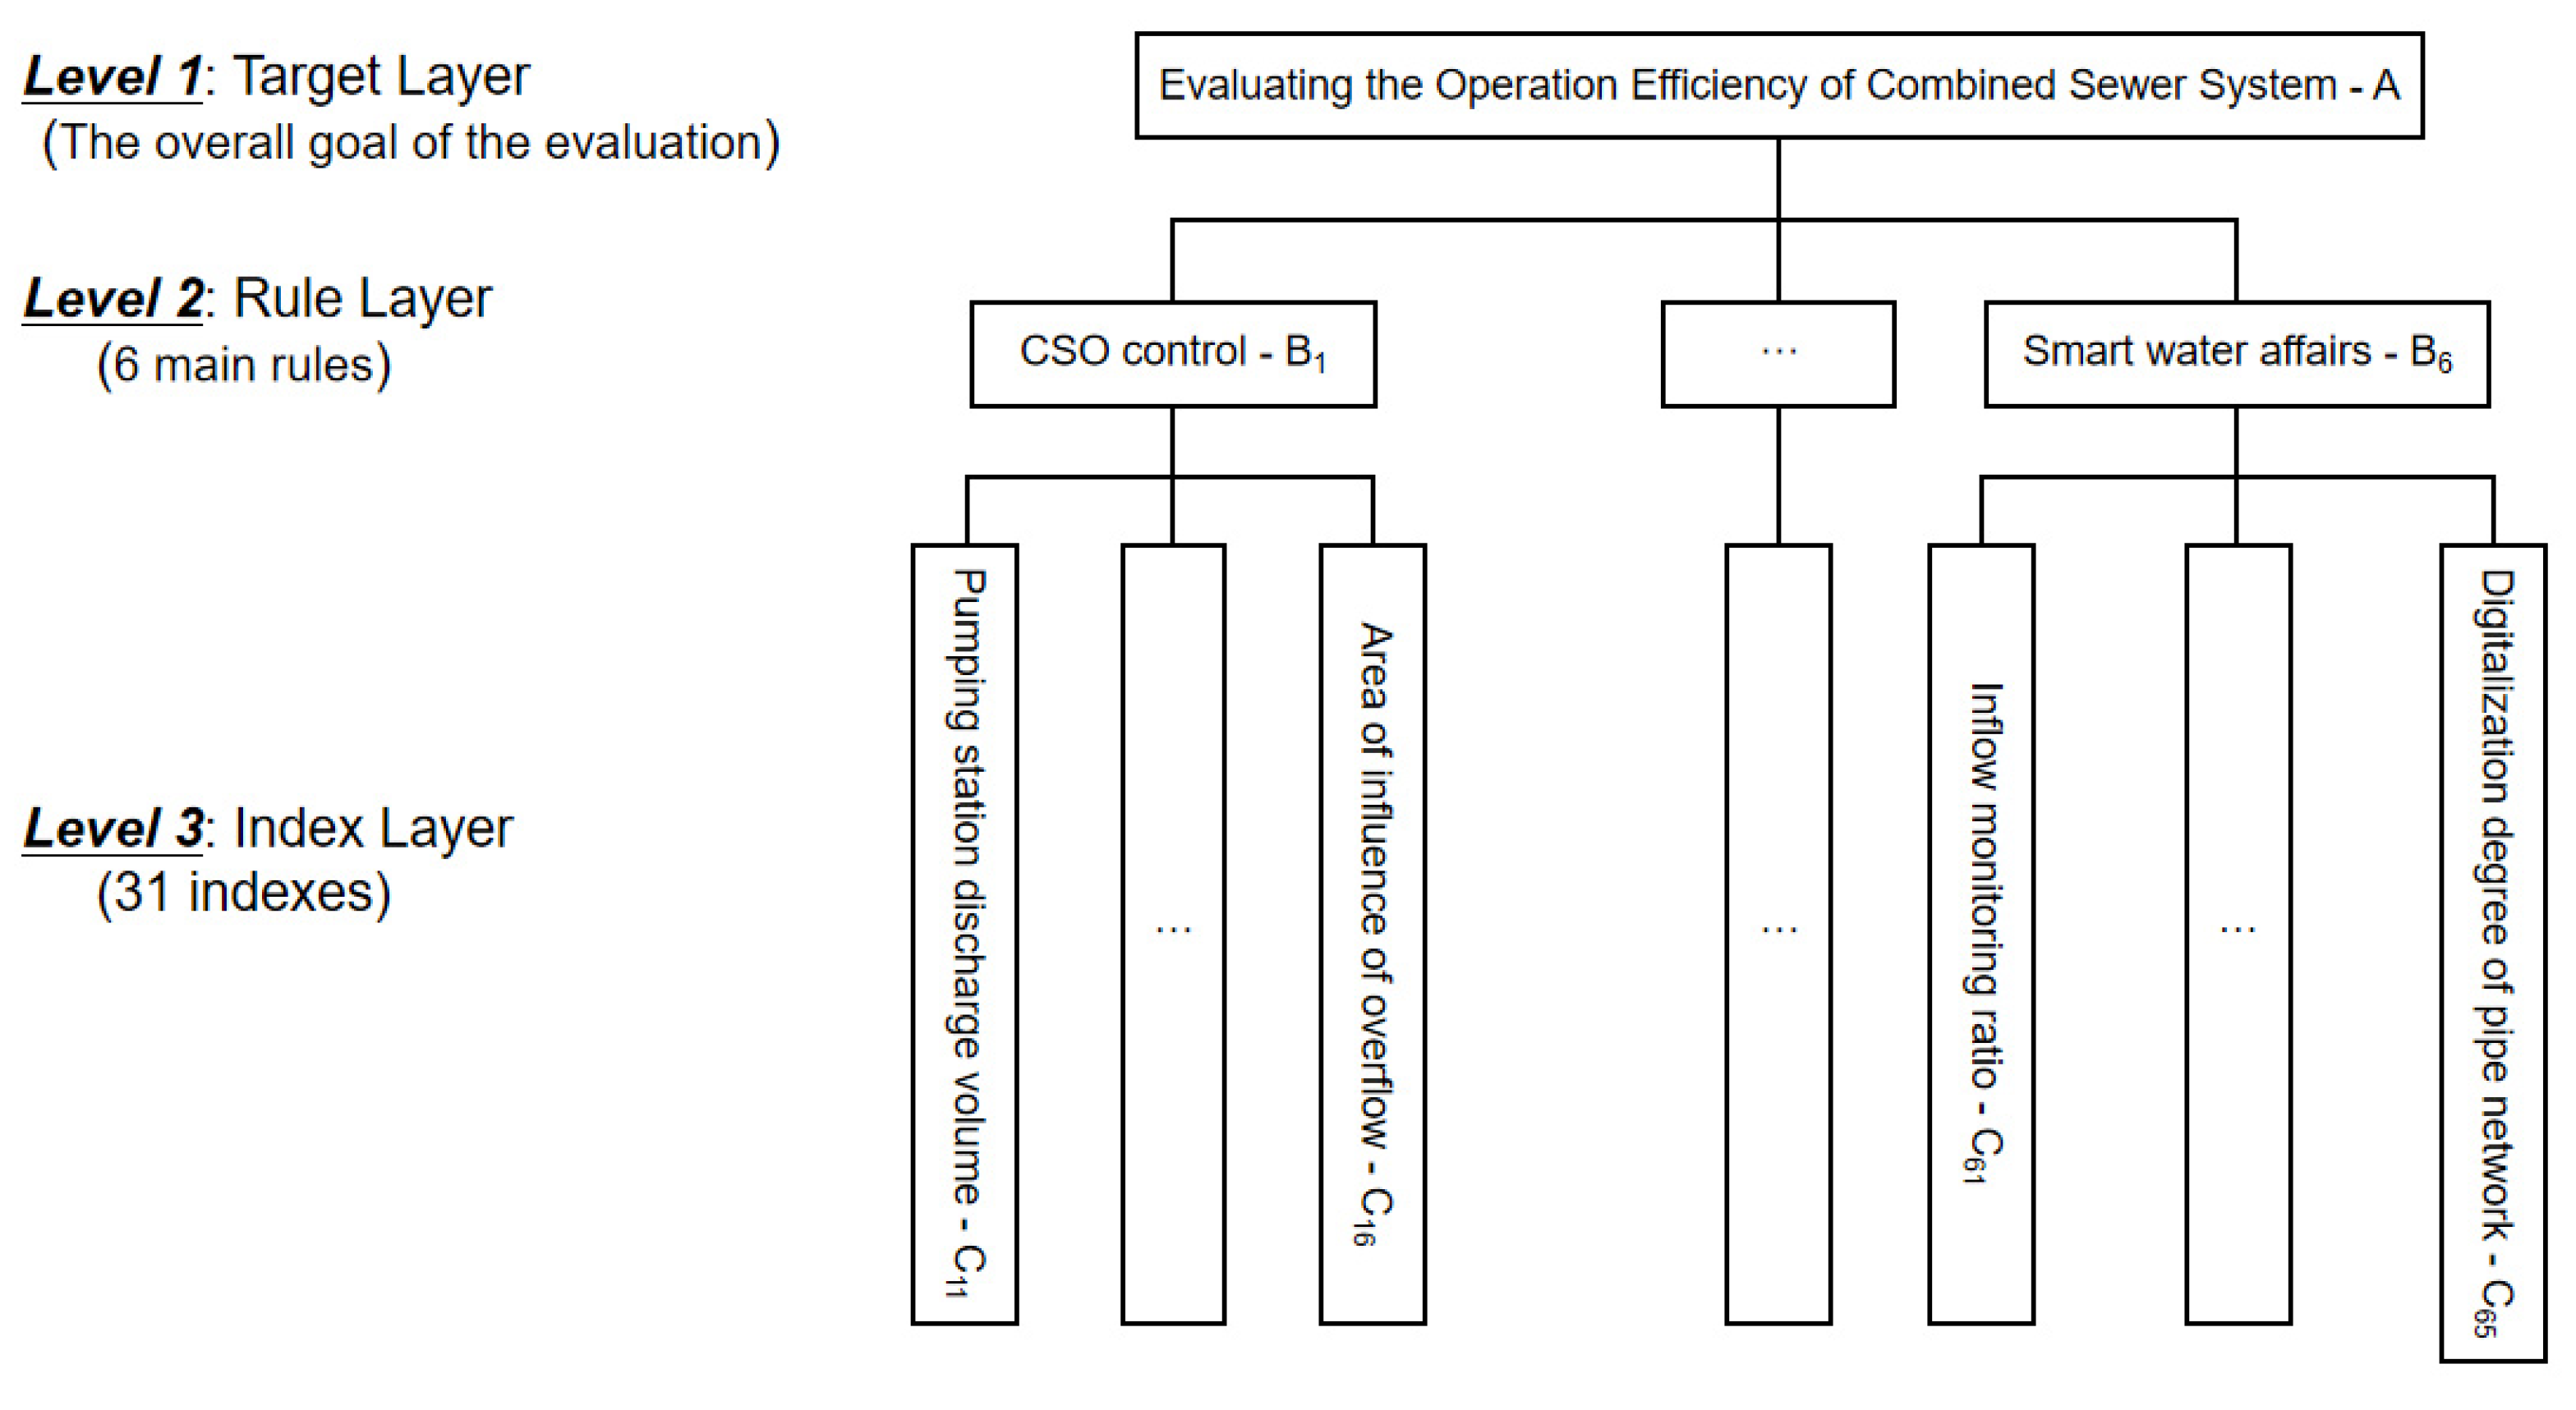
3.1. Construct the Hierarchical Structure of the Evaluation Index System
3.2. Make Pairwise Comparisons and Obtain the Judgmental Matrix
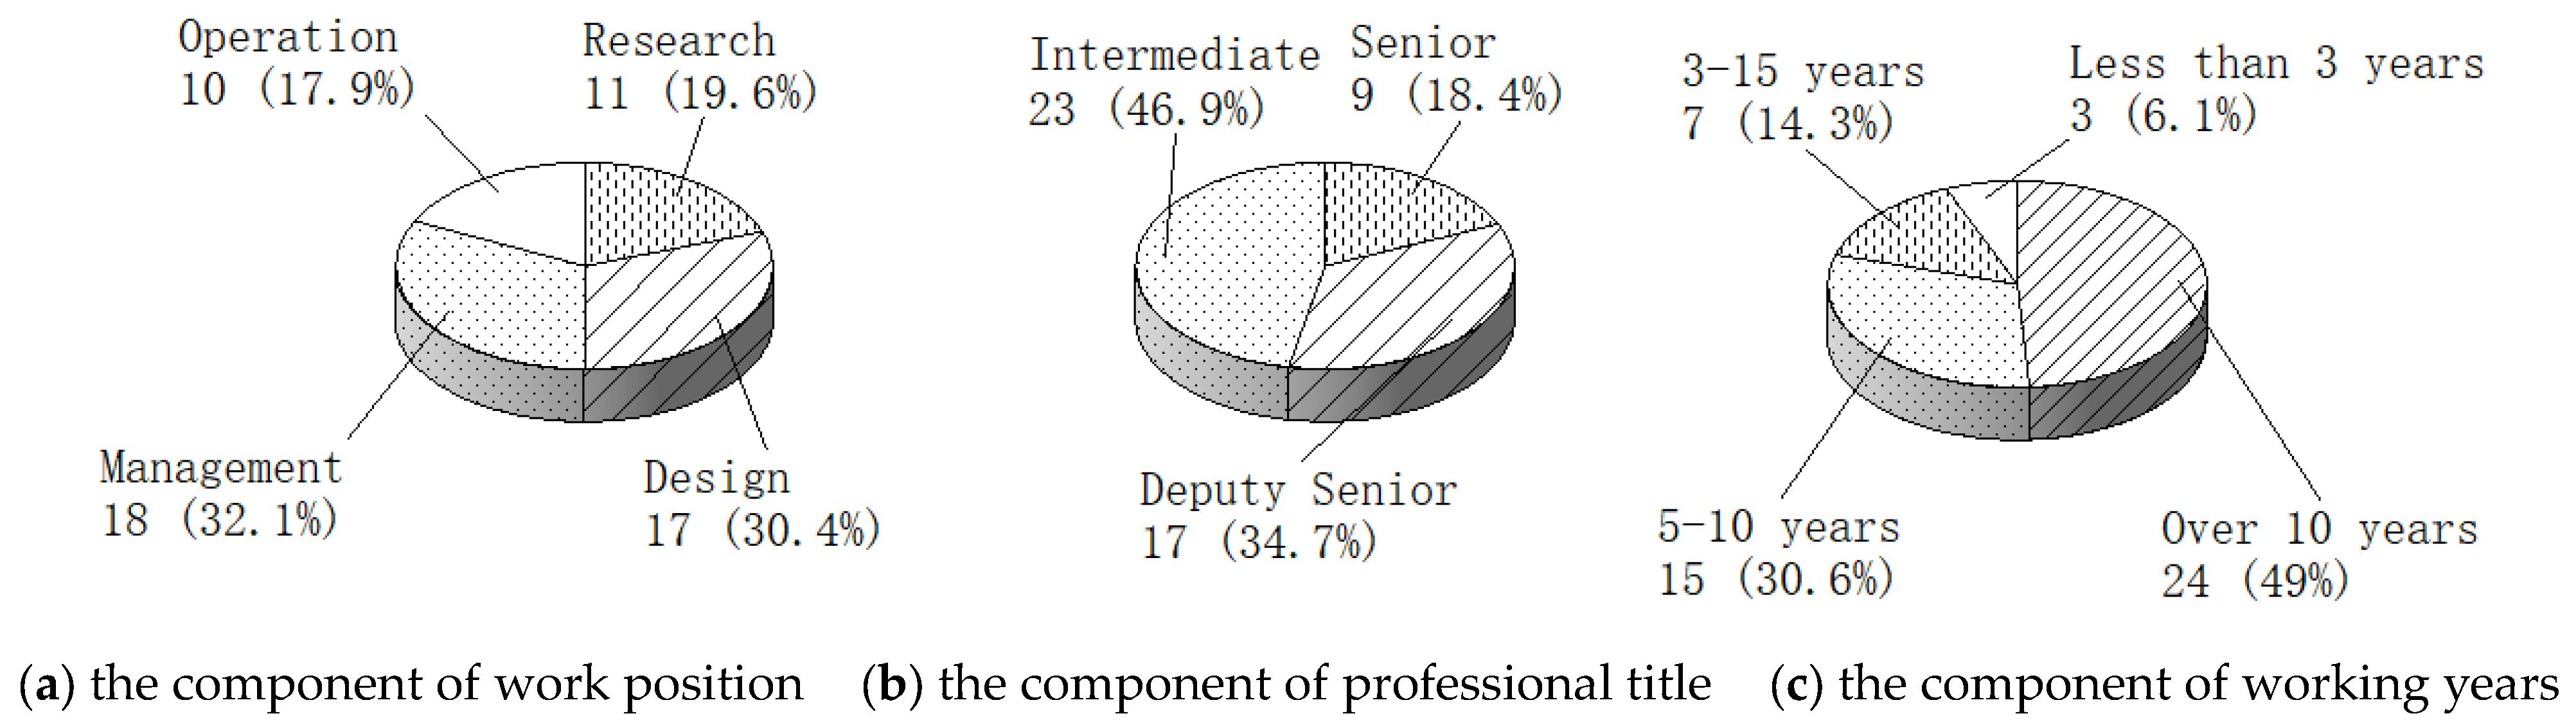
3.2.1. Pairwise Comparisons Scoring
3.2.2. Computation of Weights and Consistency of Comparisons
3.3. Construct the Membership Matrix
3.3.1. Determine and Divide the Factor Set
3.3.2. Determine the Comment Set
3.3.3. Second-Level Factor Set Evaluation Calculation
3.4. Calculation of Comprehensive Fuzzy Evaluation
4. Case Application
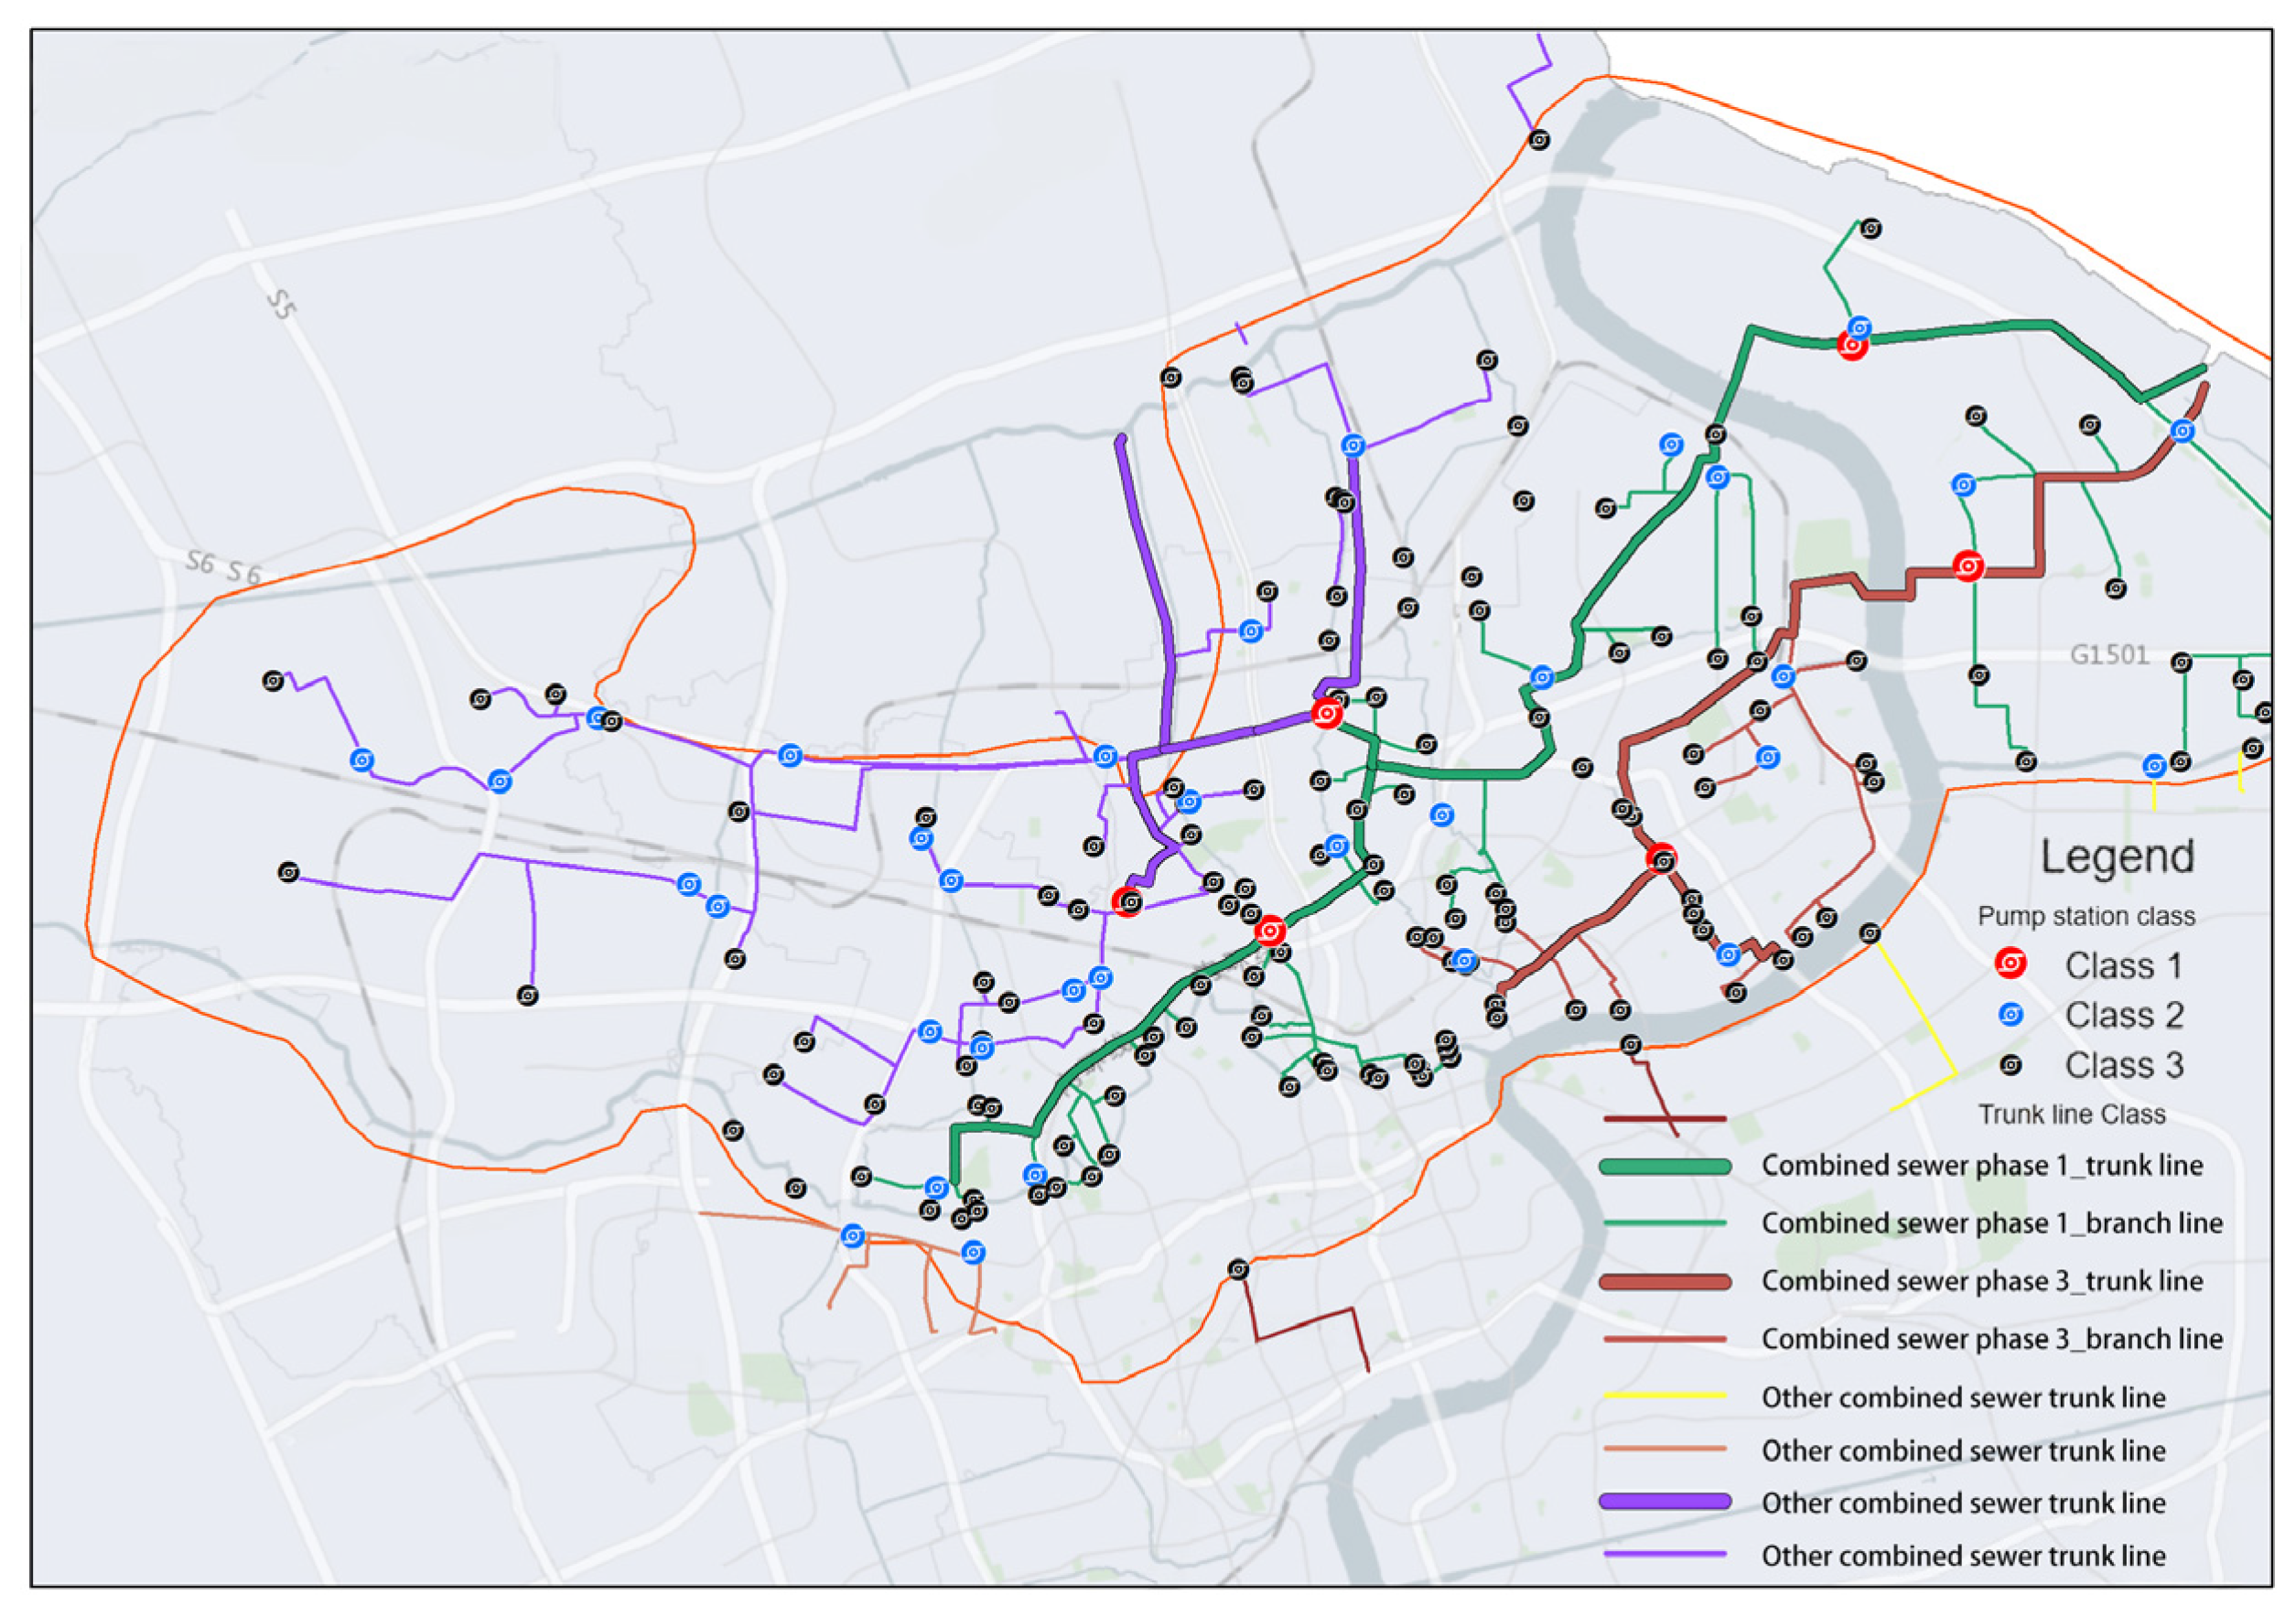
4.1. Overview of the Situation in a Certain Combined Sewer Area of Shanghai
4.2. Evaluating the Operation Efficiency of the Combined Sewer Area
4.2.1. Empowerment of Indexes Use the AHP Method
4.2.2. Determining the Degree of Membership Function
4.2.3. Multi-Level Fuzzy Comprehensive Evaluation and Quantitative Scoring
4.3. Analysis of Operation Efficiency Evaluation Results
5. Conclusions
- (1)
- Multiple rounds of screening were conducted using methods such as the coefficient of variation to identify specific indexes that can accurately characterize the operation efficiency of the combined sewer system. Ultimately, a total of 31 specific indexes were identified, covering six essential aspects: CSO control, Waterlogging control, Stable transportation of wastewater, Management and maintenance of pipeline, Energy conservation, and Smart water affairs. This comprehensive evaluation index system model was constructed to assess the operation efficiency of urban combined sewer systems.
- (2)
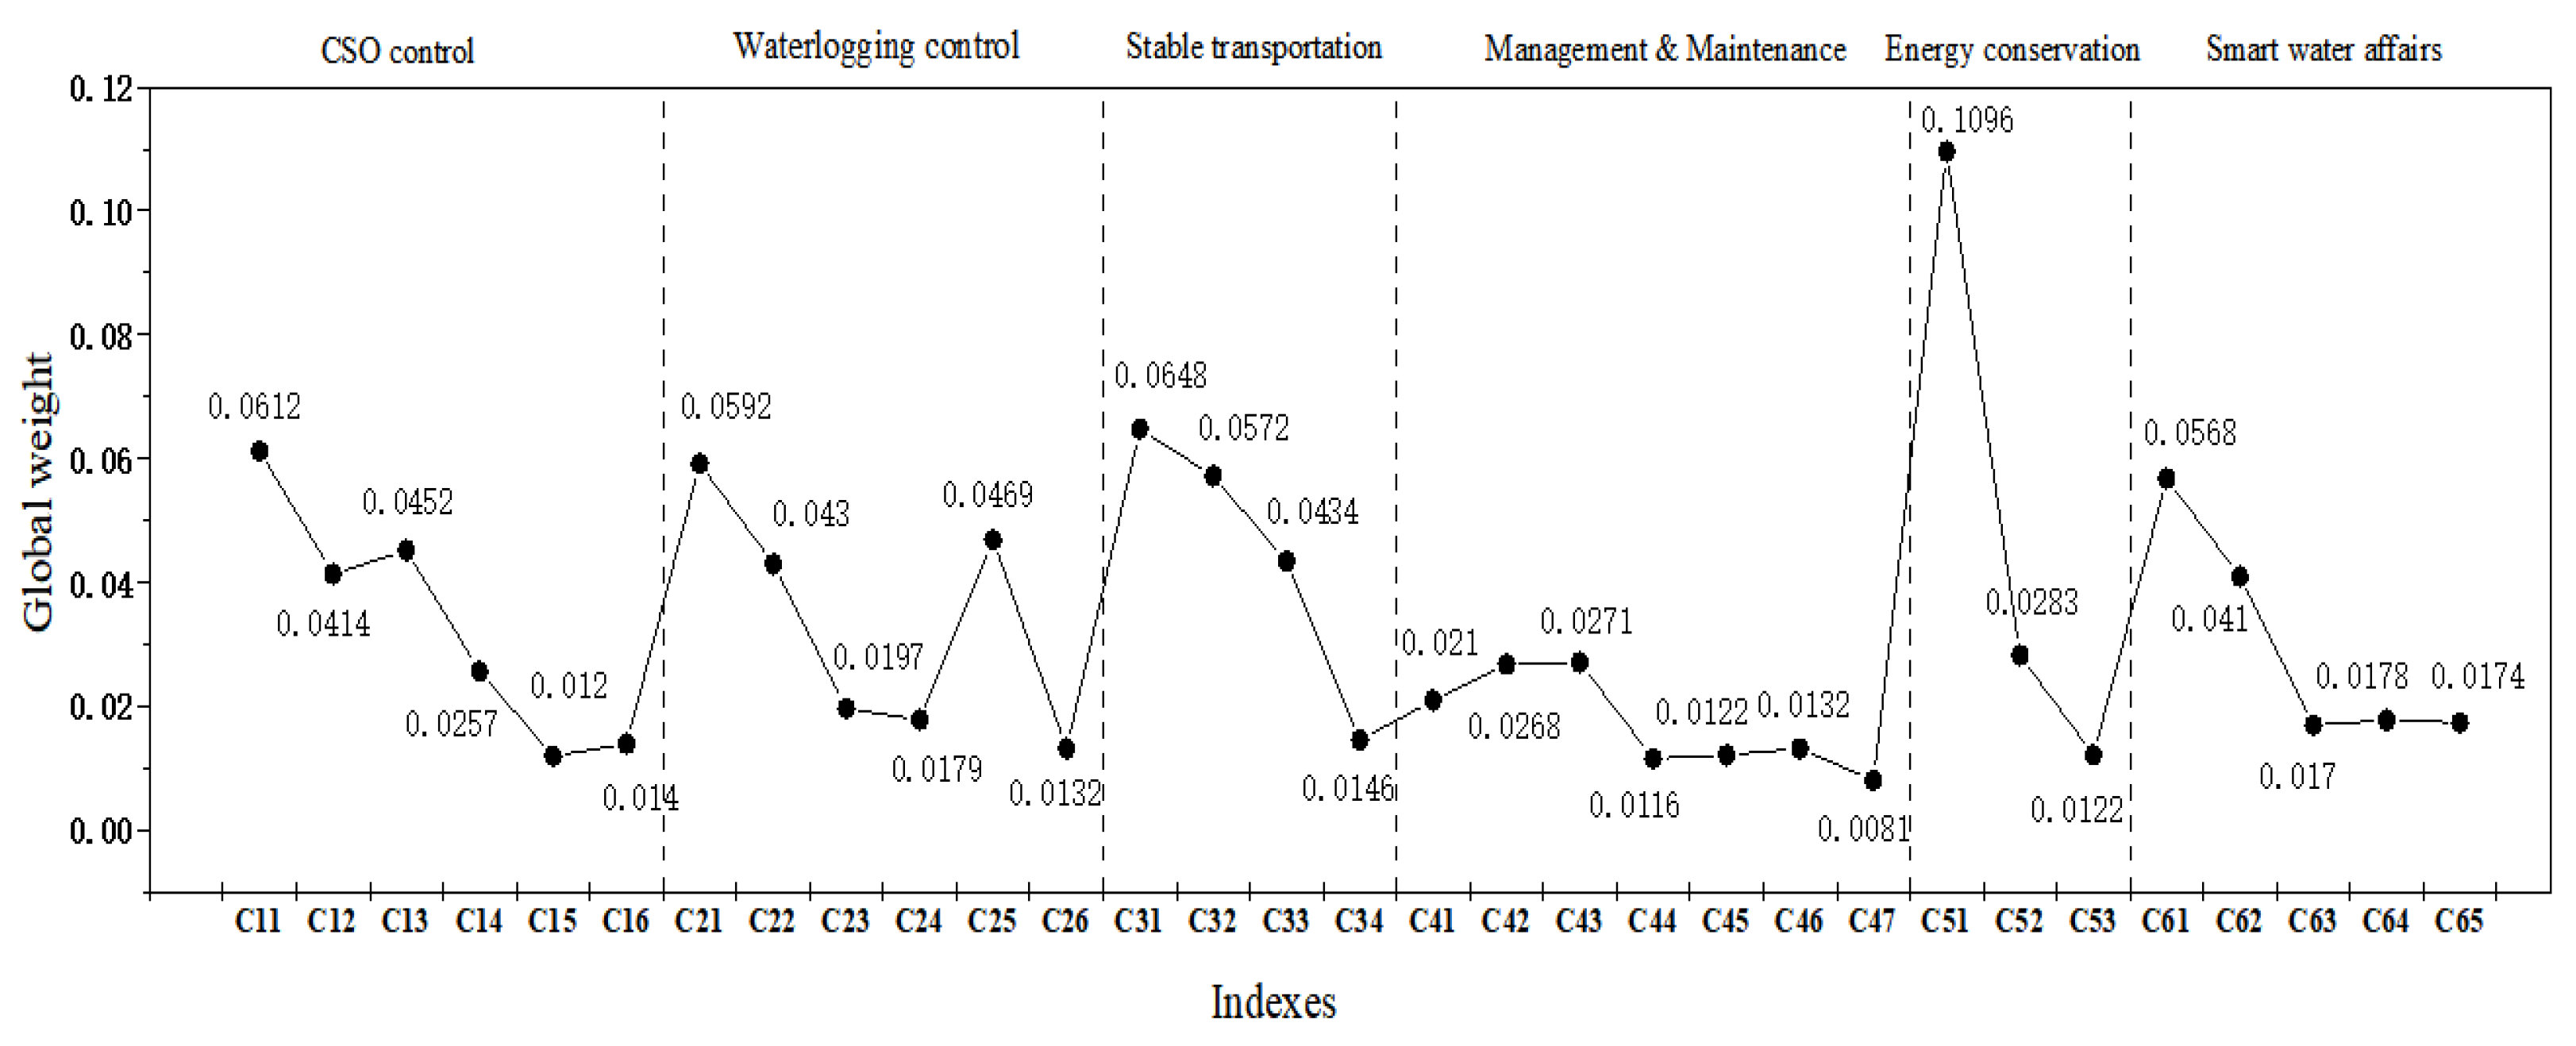
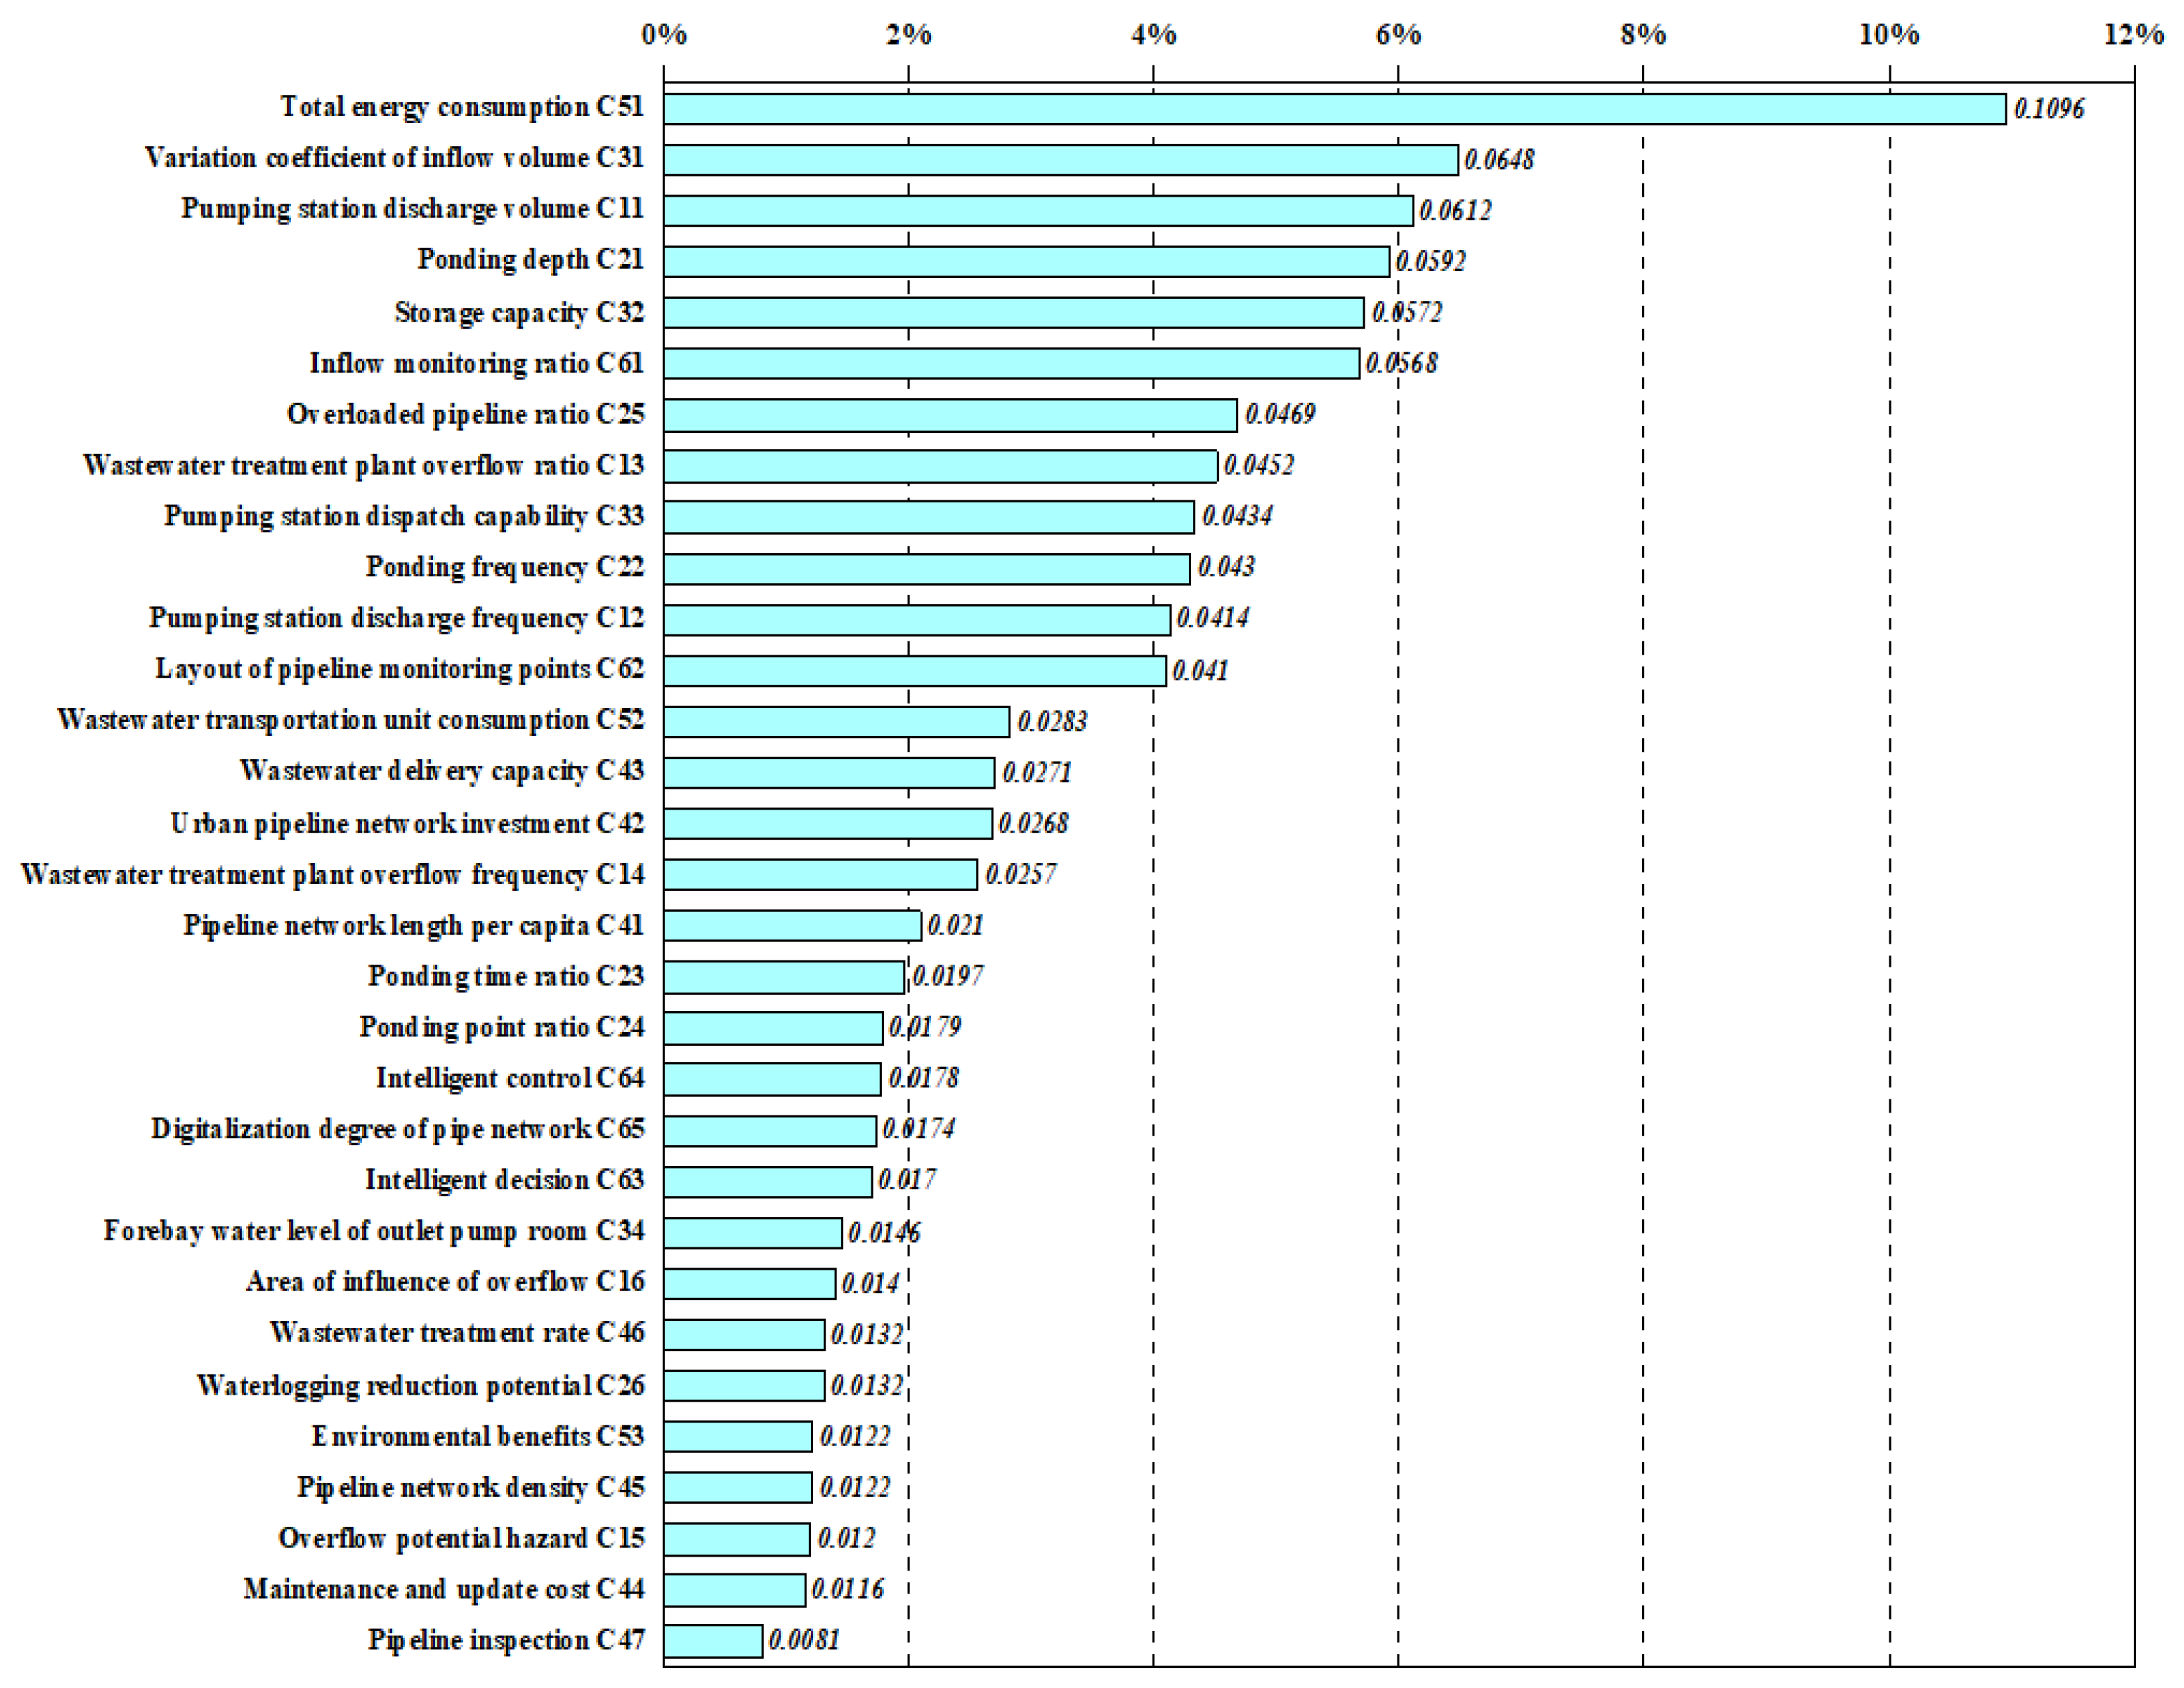
- The constructed operation efficiency model for the combined sewer system was then applied to the combined sewer area of Shanghai, enabling a thorough evaluation of its operational efficiency over the period from 2020 to 2022. The results highlighted 12 critical influencing indexes in the combined sewer system in this area: total energy consumption, variation coefficient of inflow volume, pumping station discharge volume, ponding depth, storage capacity, inflow monitoring ratio, overloaded pipeline ratio, wastewater treatment plant overflow ratio, pumping station dispatch capability, ponding frequency, pumping station discharge frequency, and layout of pipeline monitoring points.
- (3)
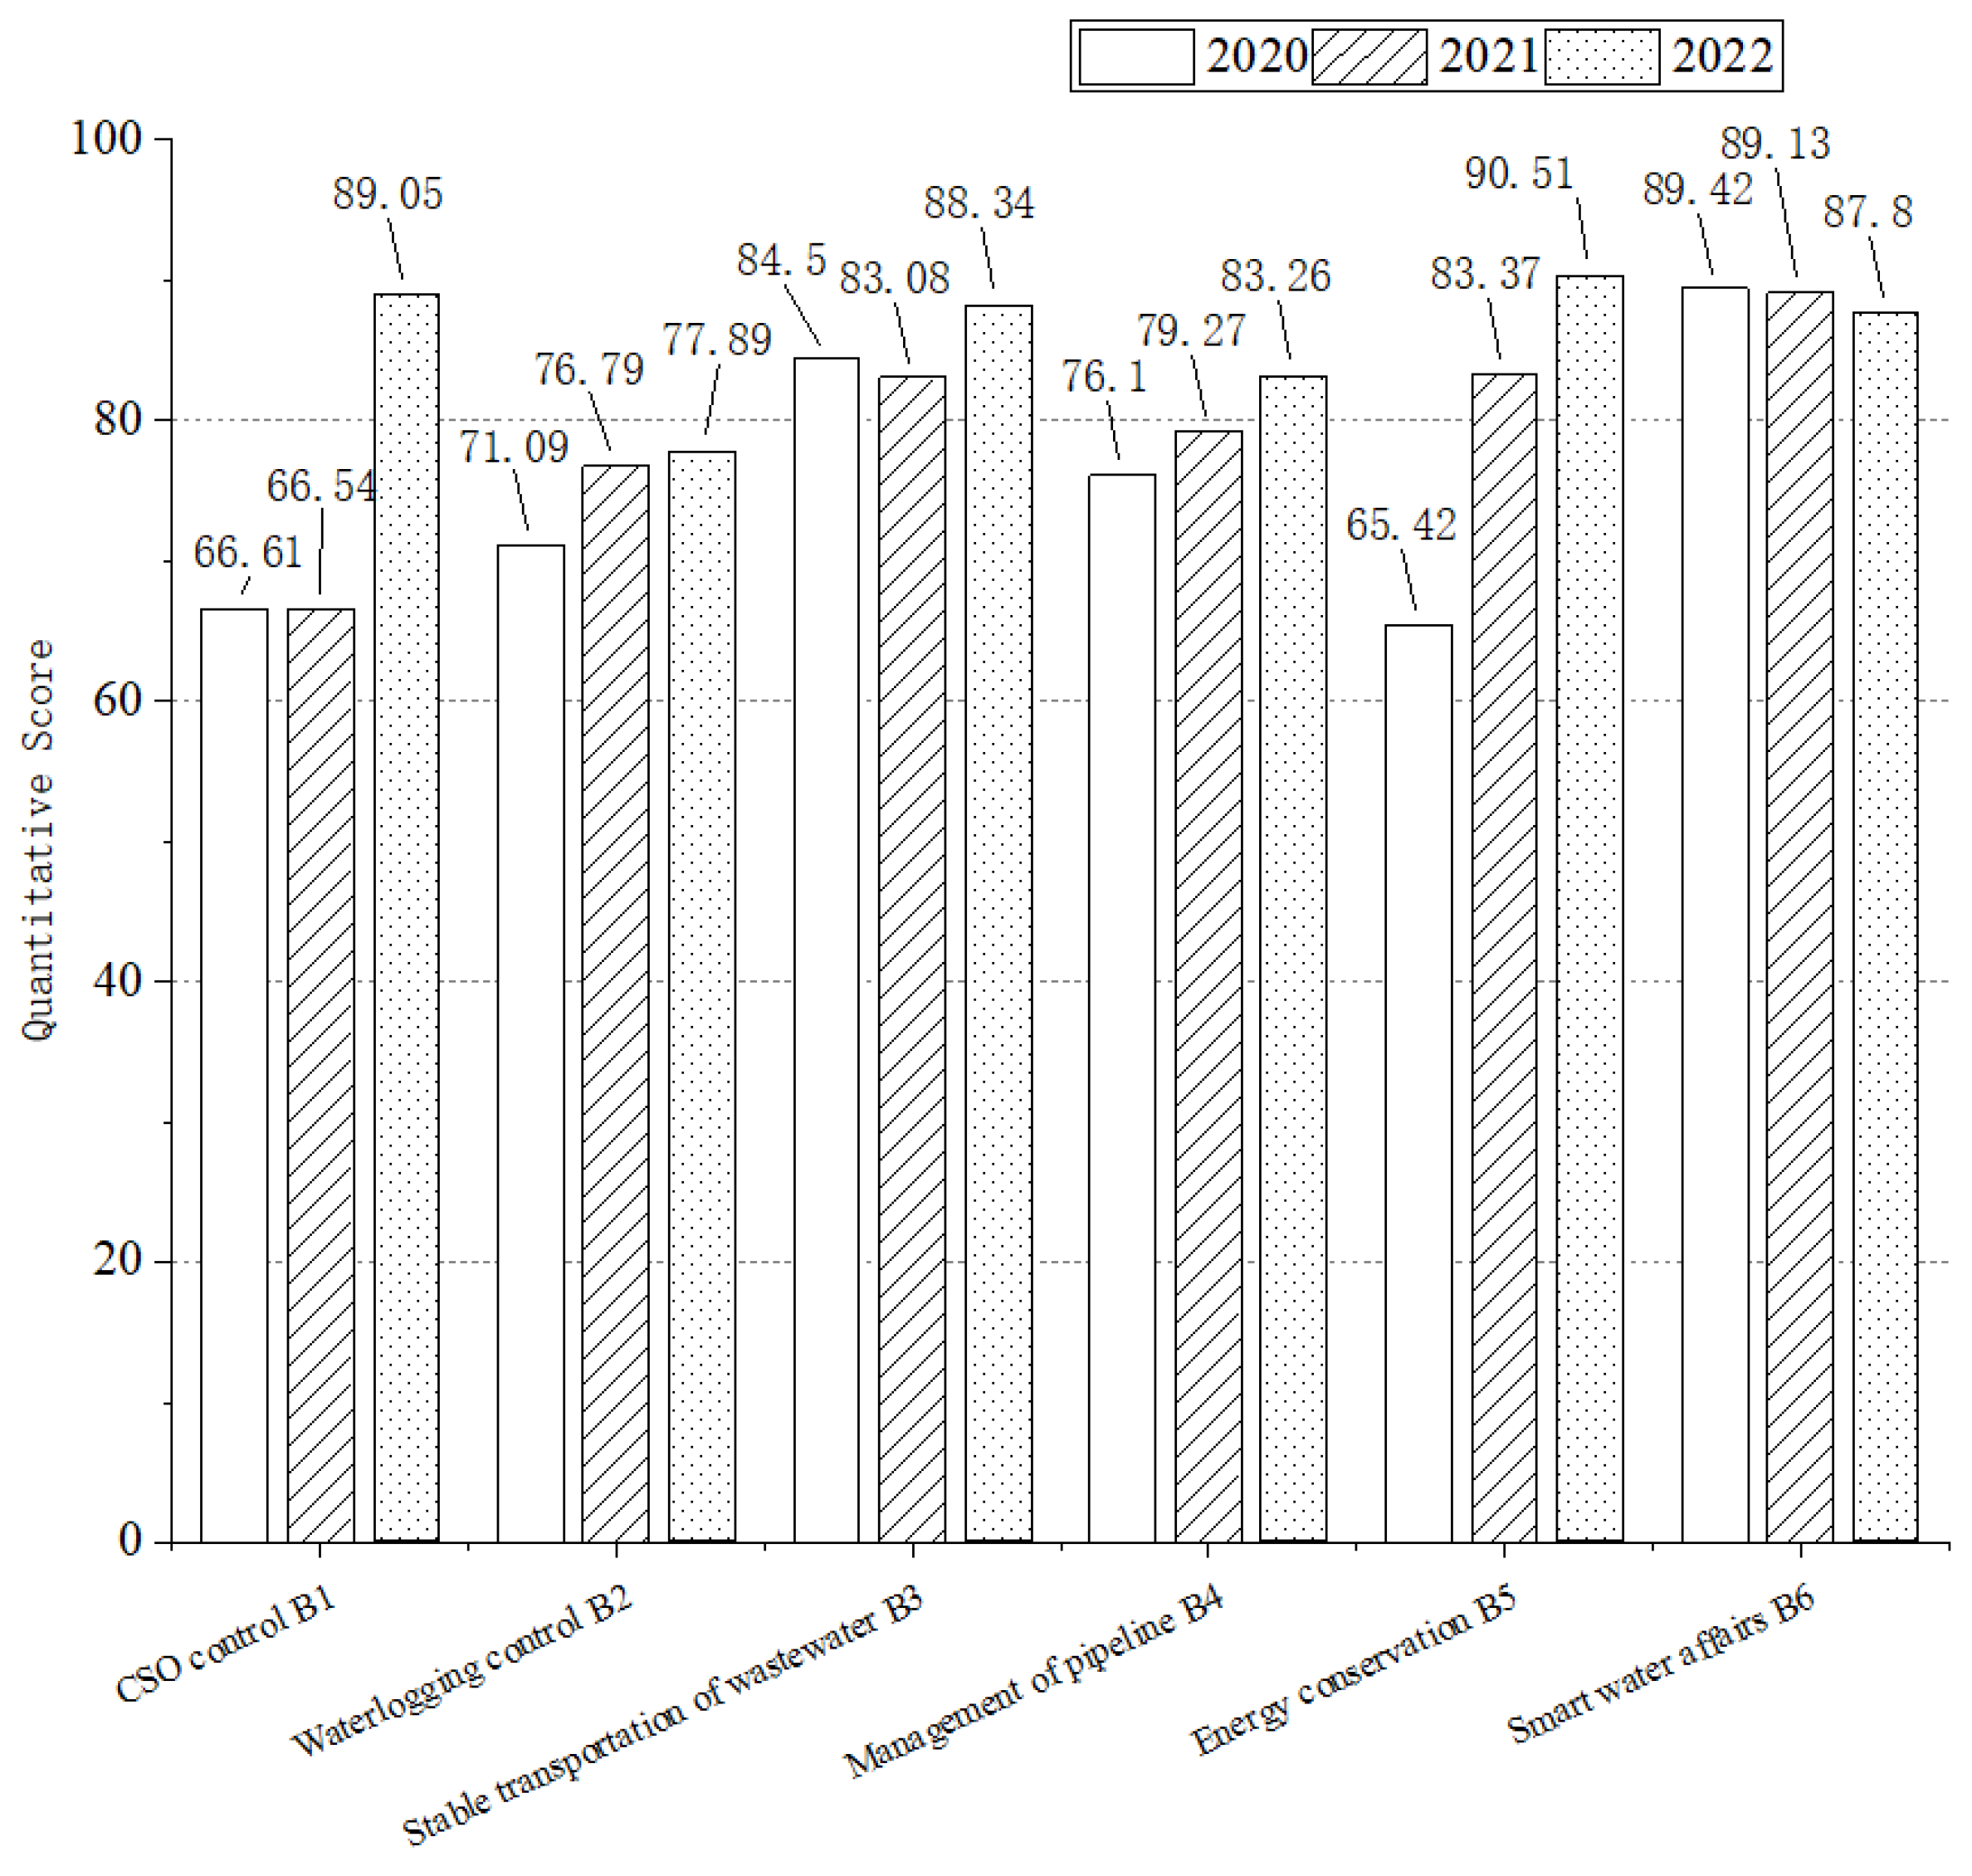
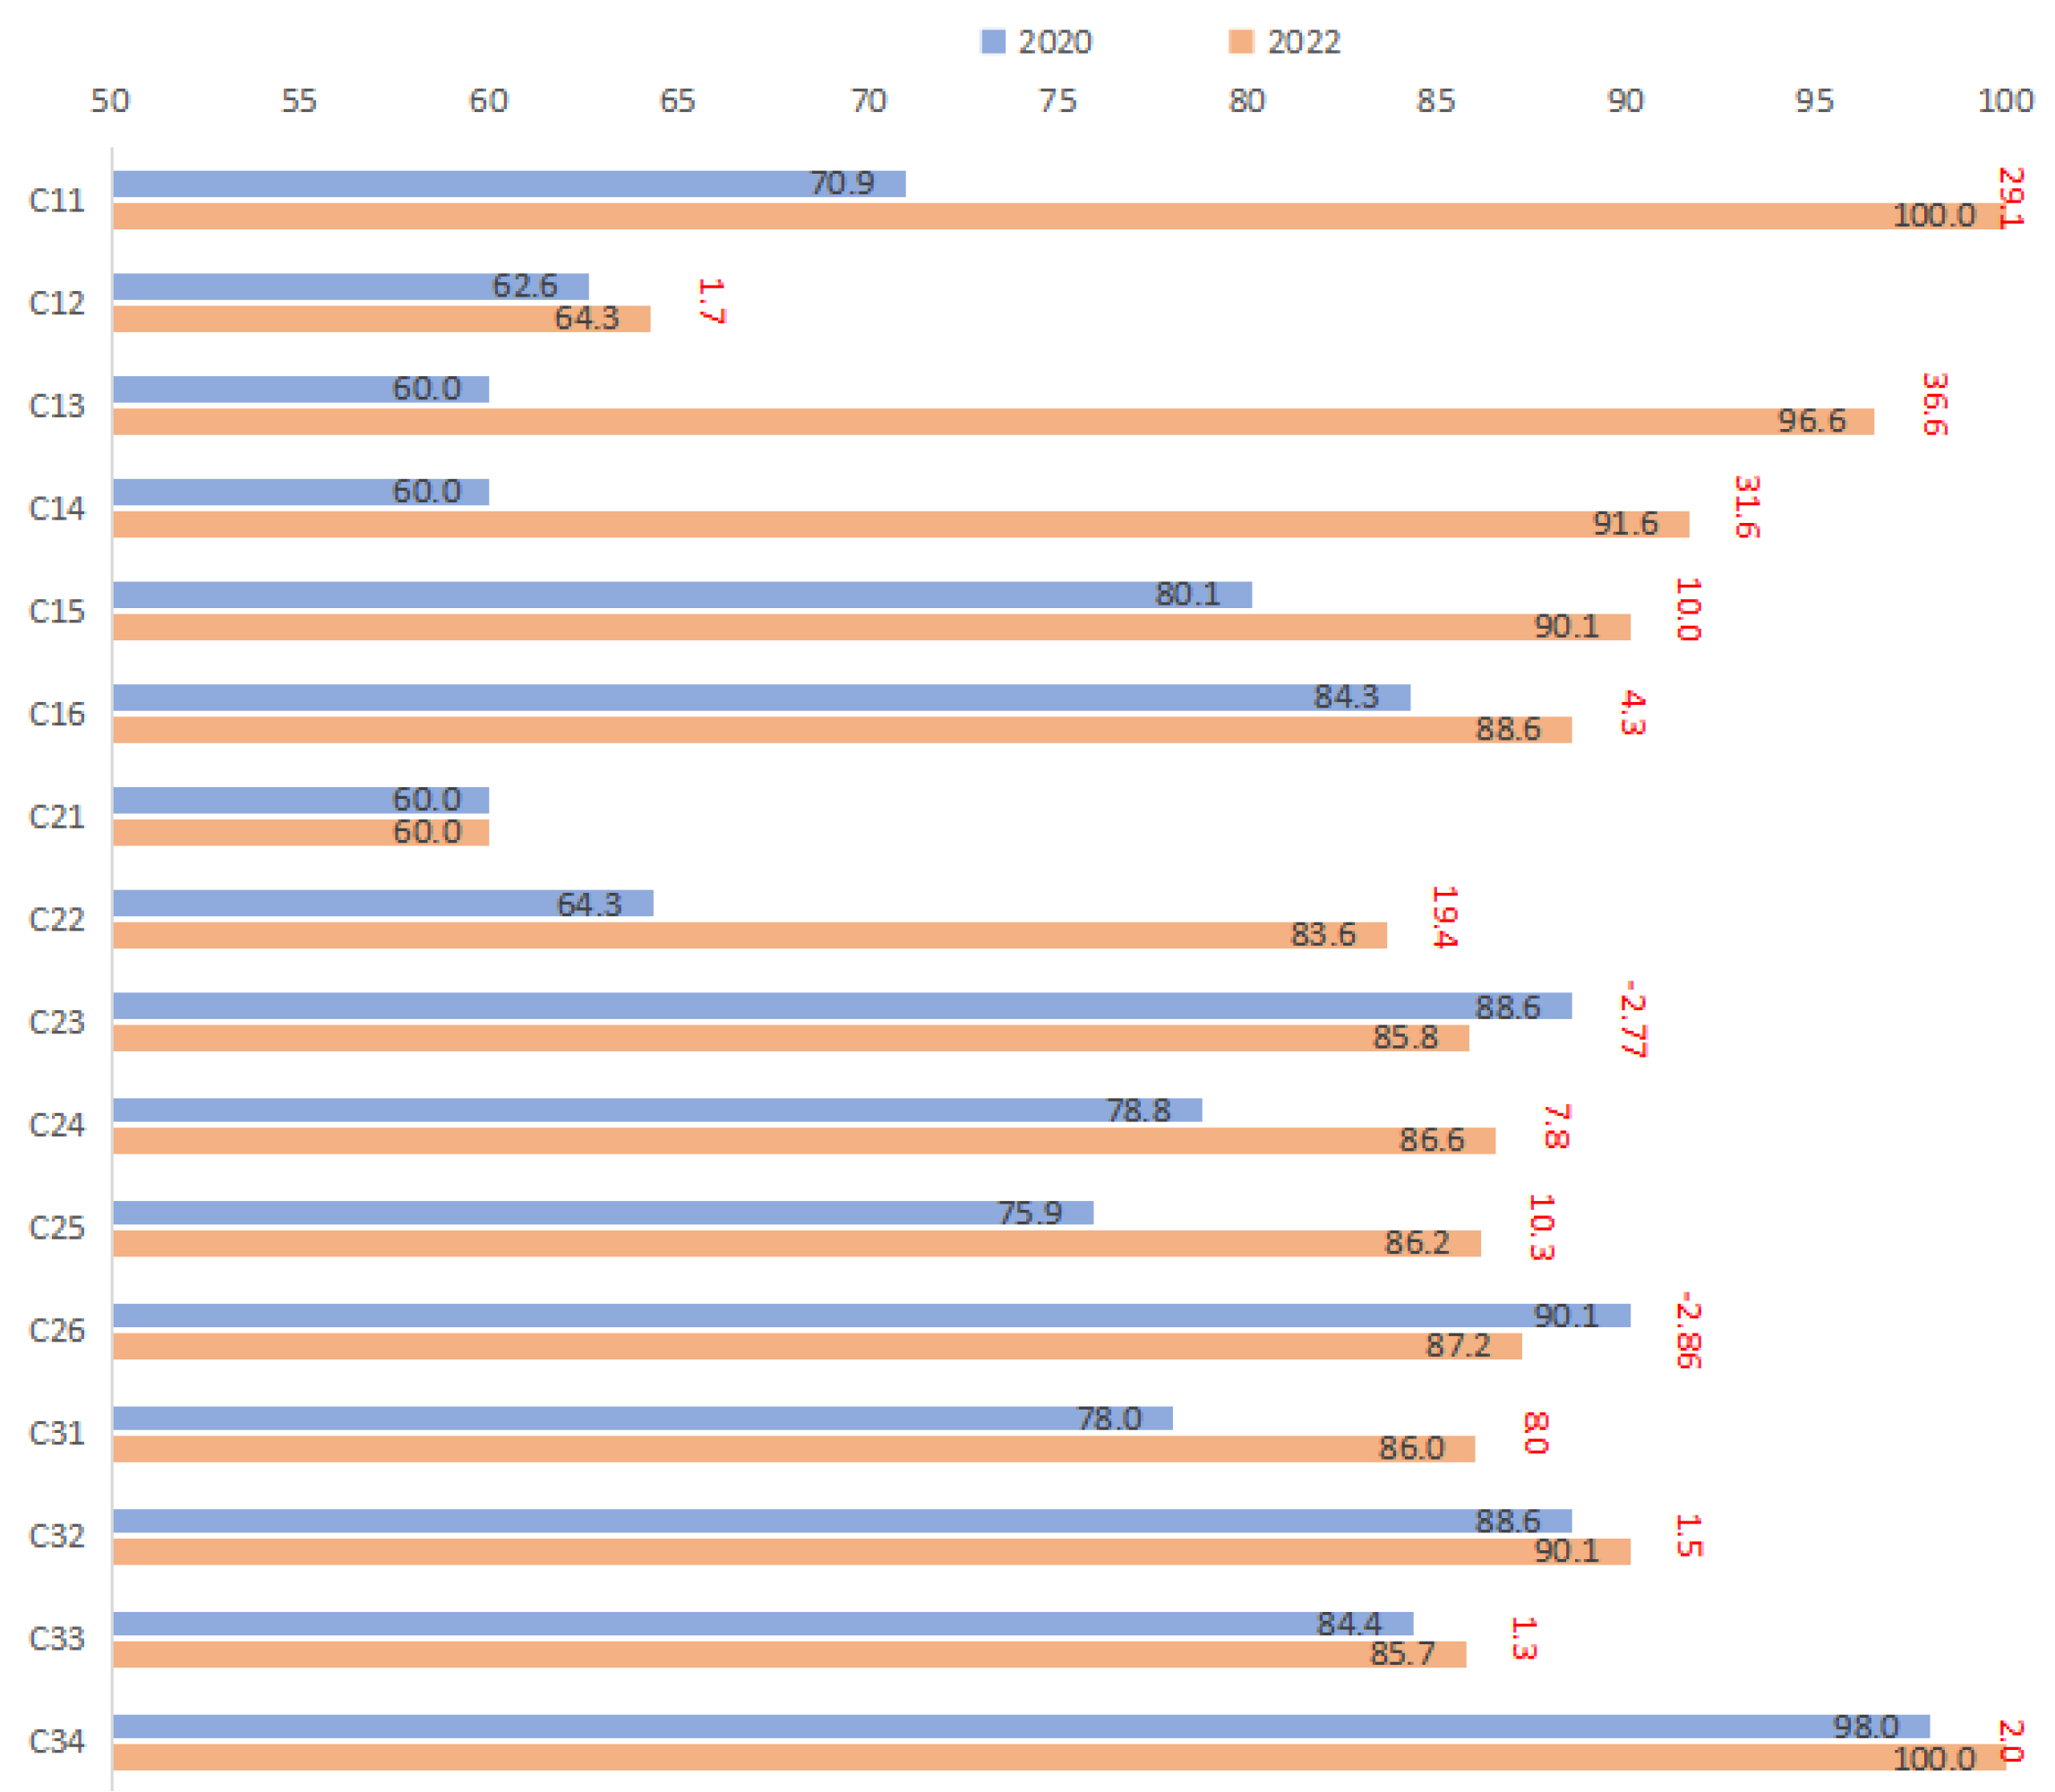
- The comprehensive evaluation results for the three-year period indicate continuous improvement in the combined sewer system’s operational efficiency in this area. The system has progressed from a relatively low level to a relatively good level. Notably, there have been significant enhancements in CSO control and energy conservation. However, there is still scope for improvement in waterlogging control and the management and maintenance of pipelines, highlighting these aspects as primary areas of focus for further enhancement in the future.
Author Contributions
Funding
Data Availability Statement
Conflicts of Interest
References
- Yin, H.; Zhang, H.; Xu, Z. Review of Intelligent Decision-Making Technologies for Urban Drainage System. J. Tongji University. Nat. Sci. 2021, 49, 1426–1434. [Google Scholar]
- Chen, F. Research on Evaluation and Optimisation of Flood and Overflow Control Capacity of Urban Drainage System; Tsinghua University: Beijing, China, 2016. [Google Scholar]
- Leimgruber, J.; Steffelbauer, D.; Krebs, G.; Tscheikner-Gratl, F.; Muschalla, D. Selecting a series of storm events for a model-based assessment of combined sewer overflows. Urban Water J. 2018, 15, 453–460. [Google Scholar] [CrossRef]
- Zhang, D.; Shen, J.; Liu, P.; Zhang, Q.; Sun, F. Use of Fuzzy Analytic Hierarchy Process and Environmental Gini Coefficient for Allocation of Regional Flood Drainage Rights. Int. J. Environ. Res. Public Health 2020, 17, 2063. [Google Scholar] [CrossRef] [PubMed]
- Zheng, M.; Liu, S.; Liu, Y.; Li, H. Structural Condition Assessment of Urban Drainage Pipes Based on Particle Swarm Optimization-Extreme Learning Machine. J. Tongji Univ. (Nat. Sci.) 2020, 48, 513–516+551. [Google Scholar]
- Okwori, E.; Viklander, M.; Hedstrom, A. Performance assessment of Swedish sewer pipe networks using pipe blockage and other associated performance indicators. H2Open J. 2020, 3, 46–57. [Google Scholar] [CrossRef]
- Ghavami, S.; Borzooei, Z.; Maleki, J. An effective approach for assessing risk of failure in urban sewer pipelines using a combination of GIS and AHP-DEA. Process Saf. Environ. Prot. 2020, 133, 275–285. [Google Scholar] [CrossRef]
- Ananda, J. Assessing the operational efficiency of wastewater services whilst accounting for data uncertainty and service quality: A semi-parametric approach. Water Int. 2020, 45, 921–944. [Google Scholar] [CrossRef]
- Baah, K.; Dubey, B.; Harvey, R.; McBean, E. A risk-based approach to sanitary sewer pipe asset management. Sci. Total Environ. 2015, 505, 1011–1017. [Google Scholar] [CrossRef]
- Ba, Z.; Fu, J.; Liang, J.; Liang, K.; Wang, M. Risk Assessment Method of Drainage Network Operation Based on Fuzzy Comprehensive Evaluation Combined with Analytic Network Process. J. Pipeline Syst. Eng. Pract. 2021, 12, 04021009. [Google Scholar] [CrossRef]
- Liu, W.; Dong, W. Risk assessment on the drainage pipe network based on the AHP-entropy weight method. J. Saf. Environ. 2021, 21, 949–956. [Google Scholar]
- Nam, S.; Nguyen, T.; Oh, J. Performance Indicators Framework for Assessment of a Sanitary Sewer System Using the Analytic Hierarchy Process (AHP). Sustainability 2019, 11, 2746. [Google Scholar] [CrossRef]
- Wang, J.; Xiong, Y.; Zhang, X.; Deng, Y. Evaluation of the state and operational effectiveness of urban drainage pipe network based on AHP-fuzzy comprehensive evaluation method: Taking Huai’an District of Huai’an City as an example. J. Environ. Eng. Technol. 2022, 12, 1162–1169. [Google Scholar]
- Xu, D.; Zhang, Q. Risk assessment of the integrated sewage pipeline conduction based on the AHP–GRA formula. J. Saf. Environ. 2019, 19, 1149–1154. [Google Scholar]
- YOUNG, J.; Suho, B. Evaluating the Efficiency of Public Sewer Systems in Korean Local Governments: Focusing on Economies of Scale, Density, and Scope. Korean J. Local Public Enterp. 2017, 13, 1–28. [Google Scholar]
- Jiang, Z. Research on Multi-Scenario Waterlogging Risk Assessment Based on Entropy Weighting and GIS; Nanchang University: Nanchang, China, 2020. [Google Scholar]
- Wang, Z.; Zhou, P.; Liu, C.; Xu, H.; Wang, S.; Hou, W. A potential evaluating methods of sponge city and on the underground drainage system. J. Harbin Inst. Technol. 2018, 50, 118–127. [Google Scholar]
- Cai, Z.; Li, D.; Deng, L. Risk evaluation of urban rainwater system waterlogging based on neural network and dynamic hydraulic model. J. Intell. Fuzzy Syst. 2020, 39, 5661–5671. [Google Scholar]
- Jin, H.; Jin, X.; Jin, J. Performance Assessment Framework for Reinforced Concrete Pipes in Rainwater Drainage System Using a Combined Weights-Fuzzy Theory. J. Perform. Constr. Facil. 2021, 35, 04021001. [Google Scholar] [CrossRef]
- Yang, L.; Xing, W.; Zhang, L.; Zhao, C.; Zhou, Y.; Lu, P.; Li, H. Evaluation of the health status of sewage pipeline system based on GA optimized BP neural network model. Water Wastewater Eng. 2021, 47, 123–131. [Google Scholar]
- He, F.; Cheng, S.; Zhu, J. Enhancing the Vulnerability Assessment of Rainwater Pipe Networks: An Advanced Fuzzy Borda Combination Evaluation Approach. Buildings 2023, 13, 1396. [Google Scholar] [CrossRef]
- Matos, R.; Duarte, P.; Ashley, R.; Molinari, A.; Schulz, A. Performance Indicators for Wastewater Services; IWA: London, UK, 2003. [Google Scholar]
- Danilenko, C.; Macheve, B.; Mofitt, L. The IBNET Water Supply and Sanitation Blue Book 2014; World Bank: Washington, DC, USA, 2014. [Google Scholar]
- OFWAT. Key Performance Indicators—Guidance; Water Services Regulation Authority: Birmingham, UK, 2013.
- EPA US. Guide for Evaluation Capacity, Management, Operation, and Maintenance (CMOM) Programs at Sanitary Sewer Collection Systems; United States Environmental Protection Agency: Cincinnati, OH, USA, 2005.
- AWWA. Benchmarking Performance Indicators for Water and Wastewater Utilities–2013 Survey Data and Analyses Report; American Water Works Association: Denver, CO, USA, 2015. [Google Scholar]
- Lee, J.; Chung, G.; Park, H.; Park, I. Evaluation of the Structure of Urban Stormwater Pipe Network Using Drainage Density. Water 2018, 10, 1444. [Google Scholar] [CrossRef]
- Saaty, T.L. How to make a decision—The analytic hierarchy process. Eur. J. Oper. Res. 1990, 48, 9–26. [Google Scholar] [CrossRef]
- Chen, J.; Hsieh, H.N.; Do, Q.H. Evaluating teaching performance based on fuzzy AHP and comprehensive evaluation approach. Appl. Soft Comput. 2015, 28, 100–108. [Google Scholar] [CrossRef]
- Dong, L.; Shi, Z. Discussion on Control of the Overflow from the Bumping Stations In the Main City of Shanghai. Shanghai Water 2014, 30, 5–7. [Google Scholar]
- Shanghai Municipal Water Affairs Bureau. 2020–2022 Water Situation Bulletin, Shanghai, China. 2023. Available online: http://swj.sh.gov.cn/fxft-sqtb/index.html (accessed on 20 May 2023).
- Ministry of Housing and Urban-Rural Development of the People’s Republic of China; State Administration for Market Regulation. Code for Design of Outdoor Wastewater Engineering GB 50014-2021; Publisher: Beijing, China, 2021.
- Ministry of Housing and Urban-Rural Construction of the People’s Republic of China; General Administration of Quality Supervision, Inspection and Quarantine of the People’s Republic of China. Technical Code for Urban Flooding Prevention and Control GB 51222-2017; Publisher: Beijing, China, 2017.
- Liao, Q.; Tan, Q.; Shi, Z. Research on optimization of stable transportation operation of urban wastewater treatment plant and pipeline network linkage. Water Wastewater Eng. 2016, 52, 20–24. [Google Scholar]
- Shanghai Municipal Statistics Bureau. 2020 Shanghai Statistical Yearbook. Shanghai, China. 2021. Available online: https://tjj.sh.gov.cn/tjnj/20210303/2abf188275224739bd5bce9bf128aca8.html (accessed on 20 May 2023).
- Shanghai Municipal Statistics Bureau. 2021 Shanghai Statistical Yearbook. Shanghai, China. 2022. Available online: https://tjj.sh.gov.cn/tjnj/20220309/0e01088a76754b448de6d608c42dad0f.html (accessed on 20 May 2023).
- Shanghai Municipal Statistics Bureau. 2022 Shanghai Statistical Yearbook. Shanghai, China. 2023. Available online: https://tjj.sh.gov.cn/tjnj/20230206/804acea250d44d2187f2e37d2e5d36ba.html (accessed on 20 May 2023).
- Ministry of Housing and Urban-Rural Construction of the People’s Republic of China. 2019 China Urban Construction Statistical Yearbook. China. 2020. Available online: https://www.mohurd.gov.cn/file/2022/20221012/20f60c18-a721-4f75-85fb-e3ed8e0113d9.xls?n=2021%E5%B9%B4%E5%9F%8E%E5%B8%82%E5%BB%BA%E8%AE%BE%E7%BB%9F%E8%AE%A1%E5%B9%B4%E9%89%B4 (accessed on 20 May 2023).
- Ministry of Housing and Urban-Rural Construction of the People’s Republic of China. 2020 China Urban Construction Statistical Yearbook. China. 2021. Available online: https://www.mohurd.gov.cn/file/2021/20211012/f88e6161ebf4bcbd4ffde8d1e9b64f0e.xls?n=2020%E5%B9%B4%E5%9F%8E%E5%B8%82%E5%BB%BA%E8%AE%BE%E7%BB%9F%E8%AE%A1%E5%B9%B4%E9%89%B4 (accessed on 20 May 2023).
- Ministry of Housing and Urban-Rural Construction of the People’s Republic of China. 2021 China Urban Construction Statistical Yearbook. China. 2022. Available online: https://www.mohurd.gov.cn/file/old/2020/20201231/w02020123122485271423125000.xls (accessed on 20 May 2023).
- Shanghai Municipal Statistics Bureau. 2022 Statistical Bulletin of Shanghai National Economic and Social Development. Shanghai, China. 2023. Available online: http://bx2200.com/tjgongbao/huadong/5563.html (accessed on 20 May 2023).
- State Council in China. Water Pollution Prevention and Control Project. China. 2019. Available online: http://www.gov.cn/zhengce/content/2015-04/16/content_9613.htm (accessed on 20 May 2023).
- Shanghai Municipal Water Affairs Bureau. Notice of Shanghai Municipal Water Administration on the Maintenance and Supervision of Drainage Pipe Networks in 2022. Shanghai, China. 2023. Available online: http://swj.sh.gov.cn/swyw/20230329/e0fc142d9ffa4063910d64d44f915995.html (accessed on 20 May 2023).
- Shanghai Municipal Engineering Design Institute (Group) Co. Ltd.; Qidi Water (Group) Co. Ltd. Technical Specification for On-line Monitoring of Urban Drainage Pipe Network T∕CECS 869-2021; Publisher: Beijing, China, 2021. [Google Scholar]
- Kut, P.; Pietrucha-Urbanik, K. Most Searched Topics in the Scientific Literature on Failures in Photovoltaic Installations. Energies 2022, 15, 8108. [Google Scholar] [CrossRef]


| Method | Features | Application Cases |
|---|---|---|
| AHP | Subjective weighting method; suitable for consulting experienced experts, convenient and efficient, but too subjective; applicable to index systems with both quantitative and qualitative indexes | Evaluate the performance of the operation of the Korean sewer system [12] |
| AHP-FCE | Subjective weighting method; qualitative indexes can be quantified through membership functions | Comprehensive evaluation of the state and operation efficiency of the drainage network in a region of Huai’an City, China [13] |
| AHP-DEA | Subjective weighting method; suitable for multi-criteria evaluation and subsequent optimization; significantly improving the optimality and fairness of the evaluation system | Combining Bayesian Networks to evaluate the probability of failure and consequences in sewer pipelines [7] |
| AHP-GRA | Subjective weighting method; applicable to problems where the sample data are relatively small and regression analysis cannot be conducted; quantifying scores through grey correlation analysis | Risk assessment of combined sewer pipes [14] |
| FAHP | Subjective weighting method; reduced the difficulty of determining the consistency of the matrix, which is a fuzzification of AHP, resulting in increased uncertainty | Research the allocation of the flood drainage rights about each administrative region [4] |
| ANP-FCE | Subjective weighting method; allow mutual control and influence between indexes; suitable for complex systems | Risk assessment of the industrial park drainage system [10] |
| DEA | Objective weighting method; a planning model established from the perspective of input–output can be used for multi-objective optimization and decision making | Measuring the economic efficiency of Australian wastewater treatment services [8]; Using tobit regression analysis to evaluate the efficiency of wastewater company [15] |
| Entropy | Objective weighting method; determine indicator weights based on information entropy theory; applicable to quantitative indexes | |
| Entropy-TOPSIS | Objective weighting method; applicable to ranking or comparison problems of multi-objective evaluations | Assessment of waterlogging control capacity in 31 provinces in China [16] |
| Entropy-FCE | Objective weighting method; qualitative indexes can be quantified through membership functions | Urban waterlogging risk assessment [17] |
| ANN-FCE | Objective weighting method, with adaptive learning ability; suitable for situations with a large amount of high-quality data available | Comprehensive assessment of urban waterlogging control capabilities and risks [18]; Using the PSO-ELM model to predict and diagnose drainage pipelines [5] |
| AHP-Entropy | Subjective and objective combination weighting method; this not only reduces the subjectivity of AHP, but also avoids the sensitivity of entropy weight method to data, and uses membership function to quantify the evaluation results | Performance evaluation of rainwater concrete pipes [19]; The operation efficiency of a regional sewer pipe network in a city was evaluated [11] |
| AHP-ANN | Subjective and objective combination weighting method; suitable for situations with a large amount of high-quality data available | Establish of an evaluation model of GA-optimized BP neural network to evaluate the health status of sewer pipes [20] |
| Fuzzy Borda | Subjective and objective combination weighting method; combining multiple evaluation methods to improve the reliability and applicability of evaluation | Combining entropy, TOPSIS, efficiency coefficient, FCE, etc. through Borda combination evaluation method to evaluate the vulnerability of rainwater pipe network [21] |
| IWA | IBNET | OFWAT | US EPA | AWWA |
|---|---|---|---|---|
| Water Resources | Service Coverage | Sewer overflow | Serving population | Pipe service life |
| Personnel Index | Water Consumption and Production | Applicable drainage non-infrastructure | Total length of drainage pipe | Wastewater collection cost per km of pipeline |
| Operating Index | Treated wastewater volume | Applicable drainage infrastructure | Pipe internal and external status | Customer service satisfaction |
| Fixed Assets | Pipe network performance | Leakage | Pipe slope | Operation and maintenance cost per km of pipeline |
| Service Quality | Cost and personnel | GHG emission | Pipe length, diameter, material, etc. | Number of wastewater treatment facilities |
| Financial Situation | Service quality | Serious pollution incident | Construction status of ancillary sewer facilities | Treated wastewater volume |
| Fixed asset investment | Sewage Discharge Permit Compliance | Use of auxiliary drainage facilities | Sewage treatment rate | |
| Revenue and expenditure | Economic index | Income and expenditure status | ||
| Financial performance | Pipe network coverage |
| Rule Layer | Index Layer | Index Meaning |
|---|---|---|
| CSO control | Pumping station discharge volume (m3) | The discharge volume of trunk line pumping stations discharged into rivers in rainy days. |
| Pumping station discharge frequency (%) | The frequency of discharge of trunk line pumping stations into the river within a year. | |
| Pumping station discharge time (min) | The average time for the trunk line pumping station to discharge the river. | |
| Wastewater treatment plant overflow ratio (%) | The ratio of the overflow of the wastewater treatment plant to the water inflow at the end of the pipe network. | |
| Wastewater treatment plant overflow frequency (%) | Overflow frequency of wastewater treatment plant in one year. | |
| Wastewater treatment plant overflow time (min) | Average duration of wastewater treatment plant overflow. | |
| Overflow potential hazard | Hazardous consequences of overflow (Pumping station discharge to the river + overflow in wastewater treatment plant). | |
| Overflow reduction potential | Construction level of overflow pollution control facilities. | |
| Area of influence of overflow | Area affected by pollution from overflow (Pumping station discharge to the river + overflow in wastewater treatment plant). | |
| Interception capacity | Overall interception capacity of trunk line pumping station. | |
| Waterlogging control | Ponding depth (m) | The maximum rainwater depth at which ponding occurs within the catchment area. |
| Ponding frequency (%) | Frequency of ponding during rainfall. | |
| Ponding time ratio | The ratio of the maximum duration of ponding to the rainfall duration. | |
| Ponding area ratio (%) | Percentage of catchment areas that are flooded. | |
| Ponding point ratio (%) | The ratio of points with ponding water within one year to the total monitoring points. | |
| Fullness Degree | Average fullness degree of downstream trunk pipelines during rainfall. | |
| Overloaded pipeline ratio (%) | The ratio of pipelines overloaded during rainfall to total pipelines. | |
| Waterlogging reduction potential | Construction level of waterlogging facilities. | |
| Waterlogging potential hazards | Harmful consequences of waterlogging. | |
| Stable transportation of wastewater | Variation coefficient of inflow volume | Changes in wastewater volume at the end of the drainage pipeline network. |
| Variation coefficient of inflow quality | Changes in wastewater quality at the end of the drainage pipeline network. | |
| Storage capacity | The storage capacity of the drainage system. | |
| Pumping station dispatch capability | Dispatching capability of drainage system trunk line pumping station. | |
| Forebay water level of outlet pump room (m) | Forebay wastewater level of outlet pump room at end of pipeline network. | |
| Management and maintenance of pipeline | Pipeline network length per capita (km/10,000 people) | The length of the pipeline network per 10,000 people in the drainage pipe network service area. |
| Urban pipeline network investment (10,000 yuan/km2) | Urban drainage investment divided by urban built-up area. | |
| Wastewater delivery capacity (%) | The water delivery of the pipeline network divided by the design flow of the wastewater treatment plant. | |
| Maintenance and update cost (10,000 yuan/km) | Equipment maintenance and renewal costs per kilometer of drainage pipeline network facilities. | |
| Pipeline network density (km/km2) | Drainage pipe network construction density. | |
| Wastewater treatment rate (%) | Matching degree of wastewater supply in the service area and terminal treatment capacity. | |
| Operator level | Working years and professional titles of sewer system operators. | |
| Pipeline inspection (%) | Percentage of lengths of sewer pipes inspected annually. | |
| Amount of sludge removed (t/km) | Amount of pipeline sludge removed per kilometer of pipeline. | |
| Energy conservation | Total energy consumption (kW·h) | The total energy consumption of sewer trunk line transportation, flood control, etc. |
| Wastewater transportation unit consumption (kW·h/1000 m3) | Power consumption per thousand cubic meters of water transported by the drainage pipe network. | |
| Environmental benefits | Comprehensive benefits to the urban environment. | |
| Increase energy consumption value | Total energy consumption (tons of standard coal) divided by industrial added value (10,000 yuan). | |
| Smart water affairs | Inflow monitoring ratio (%) | Proportion of liquid level monitoring installed in the inflow section of the main branch line on the trunk sewer line. |
| Layout of pipeline monitoring points (points/10 km) | On-line monitoring points in every kilometer of pipeline. | |
| Intelligent decision | Intelligent decision-making level in drainage network diagnosis. | |
| Intelligent control | Sewage plant–drainage network–river joint dispatch and intelligent control level. | |
| Digitalization degree of pipe network (%) | Proportion of digitally managed pipe segments. |
| Work Position | k1 | Professional Title | k2 | Working Years | k3 |
|---|---|---|---|---|---|
| Research | 1 | Senior | 1 | Over 10 years | 1 |
| Design | 0.9 | Deputy Senior | 0.9 | 5–10 years | 0.8 |
| Management | 0.7 | Intermediate | 0.7 | 3–15 years | 0.7 |
| Operation | 0.5 | Primary | 0.5 | Less than 3 years | 0.5 |
| Mean | CV | Situation Description | Process Result |
|---|---|---|---|
| ≥4 | ≤0.3 | A relatively large number of experts believe that the importance of this index is high | Adopt |
| ≥4 | >0.3 | The importance of this index is relatively high, but there are large differences in the scores among experts | Further argumentation, prudently adopt |
| <4 | ≤0.3 | A relatively large number of experts believe that the importance of this index is low | Eliminate |
| <4 | >0.3 | The importance of this index is relatively low, but there are large differences in the scores among experts | Further argumentation, prudently eliminate |
| Rule Layer | Index Layer | Mean | CV | Result |
|---|---|---|---|---|
| CSO control | Pumping station discharge volume | 4.37 | 0.2611 | Adopted |
| Pumping station discharge frequency | 3.97 | 0.3191 | Adopted after expert argumentation | |
| Pumping station discharge time | 3.63 | 0.3847 | Eliminated after expert argumentation | |
| Wastewater treatment plant overflow ratio | 4.17 | 0.2809 | Adopted | |
| Wastewater treatment plant overflow frequency | 3.98 | 0.3243 | Adopted after expert argumentation | |
| Wastewater treatment plant overflow time | 3.74 | 0.3532 | Eliminated after expert argumentation | |
| Overflow potential hazard | 4.07 | 0.2647 | Adopted | |
| Overflow reduction potential | 3.89 | 0.2754 | Eliminated | |
| Area of influence of overflow | 4.14 | 0.2418 | Adopted | |
| Interception capacity | 4.37 | 0.2355 | Eliminated due to small weight | |
| Waterlogging control | Ponding depth | 4.57 | 0.2366 | Adopted |
| Ponding frequency | 4.21 | 0.2678 | Adopted | |
| Ponding time ratio | 4.37 | 0.2677 | Adopted | |
| Ponding area ratio | 3.82 | 0.3360 | Eliminated after expert argumentation | |
| Ponding point ratio | 4.14 | 0.2740 | Adopted | |
| Fullness Degree | 3.79 | 0.3569 | Eliminated after expert argumentation | |
| Overloaded pipeline ratio | 3.94 | 0.2865 | Adopted after expert argumentation | |
| Waterlogging reduction potential | 4.08 | 0.2833 | Adopted | |
| Waterlogging potential hazards | 3.73 | 0.3182 | Eliminated after expert argumentation | |
| Stable transportation of wastewater | Variation coefficient of inflow volume | 4.32 | 0.2523 | Adopted |
| Variation coefficient of inflow quality | 3.89 | 0.3191 | Eliminated after expert argumentation | |
| Storage capacity | 4.19 | 0.2317 | Adopted | |
| Pumping station dispatch capability | 4.20 | 0.2390 | Adopted | |
| Forebay water level of outlet pump room | 3.96 | 0.2827 | Adopted after expert argumentation | |
| Management and maintenance of pipeline | Pipeline network length per capita | 4.27 | 0.2431 | Adopted |
| Urban pipeline network investment | 4.16 | 0.2453 | Adopted | |
| Wastewater delivery capacity | 4.60 | 0.2109 | Adopted | |
| Maintenance and update cost | 4.19 | 0.2553 | Adopted | |
| Pipeline network density | 4.40 | 0.2127 | Adopted | |
| Wastewater treatment rate | 4.27 | 0.2426 | Adopted | |
| Operator level | 4.21 | 0.2498 | Eliminated due to small weight | |
| Pipeline inspection | 4.00 | 0.2387 | Adopted | |
| Amount of sludge removed | 4.37 | 0.2154 | Eliminated due to small weight | |
| Energy conservation | Total energy consumption | 4.21 | 0.2678 | Adopted |
| Wastewater transportation unit consumption | 3.93 | 0.2845 | Adopted after expert argumentation | |
| Environmental benefits | 4.10 | 0.2401 | Adopted | |
| Increase energy consumption value | 3.86 | 0.2826 | Eliminated | |
| Smart water affairs | Inflow monitoring ratio | 4.23 | 0.2350 | Adopted |
| Layout of pipeline monitoring points | 4.16 | 0.2345 | Adopted | |
| Intelligent decision | 4.24 | 0.2272 | Adopted | |
| Intelligent control | 4.07 | 0.2527 | Adopted | |
| Digitalization degree of pipe network | 4.10 | 0.2448 | Adopted |
| Intensity of Importance of aij | Compare Index of i and j |
|---|---|
| 1 | Equally Important |
| 3 | Weakly Important |
| 5 | Strongly Important |
| 7 | Very Strongly Important |
| 9 | Extremely Important |
| 2, 4, 6, 8 | Intermediate value between adjacent |
| Authoritative Coefficient Sub-Items | Grading Rules | |||||
|---|---|---|---|---|---|---|
| Basis for judgment (Ca) | Large | Medium | Small | |||
| Theoretical knowledge | 0.3 | 0.2 | 0.1 | |||
| Experience | 0.5 | 0.4 | 0.3 | |||
| Personal intuition | 0.1 | 0.1 | 0.1 | |||
| References | 0.1 | 0.1 | 0.05 | |||
| Familiarity (Cs) | very familiar | familiar | general | less familiar | no familiar | |
| 1 | 0.8 | 0.5 | 0.2 | 0 | ||
| Academic title (C) | Senior | Deputy Senior | Medium | Primary | ||
| 1 | 0.9 | 0.8 | 0.7 | |||
| N | 2 | 3 | 4 | 5 | 6 | 7 |
| RI | 0.00 | 0.58 | 0.90 | 1.12 | 1.24 | 1.32 |
| Code | Index Layer | Level | Classification Reference | ||||
|---|---|---|---|---|---|---|---|
| A+ | A | A− | B | C | |||
| C11 | Pumping station discharge volume (m3) | 252 | 266 | 280 | 294 | 308 | Engineering data, Literature [30] |
| C12 | Pumping station discharge frequency (%) | 10 | 20 | 30 | 40 | 50 | Engineering data, Water situation bulletin [31] |
| C13 | Wastewater treatment plant overflow ratio (%) | 2 | 4 | 6 | 8 | 10 | Engineering data |
| C14 | Wastewater treatment plant overflow frequency(%) | 30 | 40 | 50 | 60 | 70 | Engineering data |
| C21 | Ponding depth (m) | 0.27 | 0.4 | 0.6 | 0.7 | 1 | Standard [32,33] |
| C22 | Ponding frequency (%) | 10 | 15 | 20 | 25 | 30 | Engineering data |
| C24 | Ponding point ratio (%) | 4 | 8 | 12 | 16 | 20 | Engineering data |
| C25 | Overloaded pipeline ratio (%) | 4 | 8 | 12 | 16 | 20 | Engineering data |
| C31 | Variation coefficient of inflow volume (%) | 0.1 | 0.15 | 0.20 | 0.25 | 0.3 | Standard [32] |
| C34 | Forebay water level of outlet pump room (m) | 2.0–2.5 | 1.8 3.2 | 1.5 3.5 | 1.2 3.8 | 0.9 4.0 | Literature [34] |
| C41 | Pipeline network length per capita (km/10,000 people) | 28 | 23 | 18 | 13 | 8 | Statistical yearbook [35,36,37,38,39,40] |
| C42 | Urban pipeline network investment (10,000 yuan/km2) | 650 | 500 | 350 | 200 | 50 | Statistical yearbook, Statistical bulletin [41] |
| C43 | Wastewater delivery capacity (%) | 90 | 95 | 100 | 110 | 120 | Statistical yearbook |
| C44 | Maintenance and update cost (10,000 yuan/km) | 30 | 25 | 20 | 15 | 10 | Statistical yearbook [35,36,37,38,39,40] |
| C45 | Pipeline network density (km/km2) | 19 | 15 | 11 | 7 | 3 | Statistical yearbook [35,36,37,38,39,40] Literature [42] |
| C46 | Wastewater treatment rate (%) | 99.8 | 98.6 | 97.4 | 96.2 | 95 | Statistical yearbook [35,36,37,38,39,40] |
| C48 | Pipeline inspection (%) | 180 | 140 | 100 | 80 | 50 | Policy document [43] |
| C51 | Total energy consumption (kW·h) | 7650 | 8075 | 8500 | 8925 | 9350 | Engineering data |
| C52 | Wastewater transportation unit consumption (kW·h/1000 m3) | 57.6 | 60.8 | 64 | 67.2 | 70.4 | Engineering data |
| C61 | Inflow monitoring ratio (%) | 90 | 70 | 50 | 30 | 10 | Standard [44] |
| C62 | Layout of pipeline monitoring points (points/10 km) | 20 | 10 | 4 | 1 | 0.5 | Standard [44] |
| C65 | Digitalization degree of pipe network (%) | 90 | 80 | 70 | 60 | 50 | Standard [44] |
| Code | Index Layer | Level | Classification Reference | ||||
|---|---|---|---|---|---|---|---|
| A+ | A | A− | B | C | |||
| C15 | Overflow potential hazard | very small | small | general | large | very large | Expert Consultation |
| C16 | Area of influence of overflow | very small | small | general | large | very large | |
| C23 | Ponding time ratio | very short | short | general | long | very long | |
| C26 | Waterlogging reduction potential | very large | large | general | small | very small | |
| C32 | Storage capacity | very large | large | general | small | very small | |
| C33 | Pumping station dispatch capability | very good | better | general | poor | worse | |
| C53 | Environmental benefits | very good | better | general | poor | worse | |
| C63 | Intelligent decision | very good | better | general | poor | worse | |
| C64 | Intelligent control | very good | better | general | poor | worse | |
| Pairwise Comparison Indexes | Expert Scoring Results Combined with Expert Authority Coefficient Weighted Statistics | Weighted Average Scaled Results | ||||||||
|---|---|---|---|---|---|---|---|---|---|---|
| 1/9 | 1/7 | 1/5 | 1/3 | 1 | 3 | 5 | 7 | 9 | ||
| C11–C12 | 0 | 0 | 0.97 | 0 | 0 | 1.63 | 0 | 0 | 0 | 1.96 |
| C11–C13 | 0 | 0 | 0 | 0 | 1.8 | 0 | 0.8 | 0 | 0 | 2.23 |
| C11–C14 | 0 | 0 | 0.97 | 0 | 0 | 0.83 | 0 | 0.8 | 0 | 3.19 |
| C11–C15 | 0 | 0 | 0 | 0 | 0.97 | 0.8 | 0.83 | 0 | 0 | 2.89 |
| C11–C16 | 0 | 0 | 0 | 0 | 0.97 | 0 | 1.63 | 0 | 0 | 3.51 |
| C12–C13 | 0 | 0 | 0.97 | 0.83 | 0 | 0 | 0.8 | 0 | 0 | 1.72 |
| C12–C14 | 0 | 0 | 0 | 0 | 1.8 | 0.8 | 0 | 0 | 0 | 1.62 |
| C12–C15 | 0 | 0 | 0 | 0 | 0.97 | 0.83 | 0.8 | 0 | 0 | 2.87 |
| C12–C16 | 0 | 0 | 0 | 0 | 0.97 | 1.63 | 0 | 0 | 0 | 2.26 |
| C13–C14 | 0 | 0 | 0.97 | 0 | 0 | 1.63 | 0 | 0 | 0 | 1.96 |
| C13–C15 | 0 | 0 | 0 | 0 | 0 | 0 | 1.63 | 0.97 | 0 | 5.74 |
| C13–C16 | 0 | 0 | 0 | 0 | 0 | 0.8 | 0.83 | 0.97 | 0 | 5.13 |
| C14–C15 | 0 | 0 | 0 | 0 | 1.77 | 0.83 | 0 | 0 | 0 | 1.64 |
| C14–C16 | 0 | 0 | 0 | 0 | 0.97 | 1.63 | 0 | 0 | 0 | 2.26 |
| C15–C16 | 0 | 0 | 0 | 0.83 | 1.77 | 0 | 0 | 0 | 0 | 0.79 |
| C11 | C12 | C13 | C14 | C15 | C16 | Eigenvalues (Weights) | |
|---|---|---|---|---|---|---|---|
| C11 | 1 | 1.96 | 2.23 | 3.19 | 2.89 | 3.51 | 0.3062 |
| C12 | 0.51 | 1 | 1.72 | 1.62 | 2.87 | 2.26 | 0.2070 |
| C13 | 0.45 | 0.58 | 1 | 1.96 | 5.74 | 5.13 | 0.2259 |
| C14 | 0.31 | 0.62 | 0.51 | 1 | 1.64 | 2.26 | 0.1283 |
| C15 | 0.35 | 0.35 | 0.17 | 0.61 | 1 | 0.79 | 0.0598 |
| C16 | 0.28 | 0.44 | 0.20 | 0.44 | 1.27 | 1 | 0.0698 |
| CR = 0.045 < 0.1 | |||||||
| Rule Layer | Code | Weight | Index Layer | Code | Local Weight | Global Weight |
|---|---|---|---|---|---|---|
| CSO control | B1 | 0.2 | Pumping station discharge volume | C11 | 0.3062 | 0.0612 |
| Pumping station discharge frequency | C12 | 0.2070 | 0.0414 | |||
| Wastewater treatment plant overflow ratio | C13 | 0.2259 | 0.0452 | |||
| Wastewater treatment plant overflow frequency | C14 | 0.1283 | 0.0257 | |||
| Overflow potential hazard | C15 | 0.0598 | 0.0120 | |||
| Area of influence of overflow | C16 | 0.0698 | 0.0140 | |||
| Waterlogging control | B2 | 0.2 | Ponding depth | C21 | 0.2961 | 0.0592 |
| Ponding frequency | C22 | 0.2151 | 0.0430 | |||
| Ponding time ratio | C23 | 0.0983 | 0.0197 | |||
| Ponding point ratio | C24 | 0.0895 | 0.0179 | |||
| Overloaded pipeline ratio | C25 | 0.2347 | 0.0469 | |||
| Waterlogging reduction potential | C26 | 0.0661 | 0.0132 | |||
| Stable transportation of wastewater | B3 | 0.18 | Variation coefficient of inflow volume | C31 | 0.3599 | 0.0648 |
| Storage capacity | C32 | 0.3178 | 0.0572 | |||
| Pumping station dispatch capability | C33 | 0.2411 | 0.0434 | |||
| Forebay water level of outlet pump room | C34 | 0.0813 | 0.0146 | |||
| Management and maintenance of pipeline | B4 | 0.12 | Pipeline network length per capita | C41 | 0.1749 | 0.0210 |
| Urban pipeline network investment | C42 | 0.2234 | 0.0268 | |||
| Wastewater delivery capacity | C43 | 0.2256 | 0.0271 | |||
| Maintenance and update cost | C44 | 0.0965 | 0.0116 | |||
| Pipeline network density | C45 | 0.1019 | 0.0122 | |||
| Wastewater treatment rate | C46 | 0.1103 | 0.0132 | |||
| Pipeline inspection | C47 | 0.0674 | 0.0081 | |||
| Energy conservation | B5 | 0.15 | Total energy consumption | C51 | 0.7306 | 0.1096 |
| Wastewater transportation unit consumption | C52 | 0.1884 | 0.0283 | |||
| Environmental benefits | C53 | 0.0810 | 0.0122 | |||
| Smart Water affairs | B6 | 0.15 | Inflow monitoring ratio | C61 | 0.3786 | 0.0568 |
| Layout of pipeline monitoring points | C62 | 0.2732 | 0.0410 | |||
| Intelligent decision | C63 | 0.1135 | 0.0170 | |||
| Intelligent control | C64 | 0.1189 | 0.0178 | |||
| Digitalization degree of pipe network | C65 | 0.1158 | 0.0174 |
| Code | Index Layer | Actual Value | 2022 Actual Value of Membership | ||||||
|---|---|---|---|---|---|---|---|---|---|
| 2020 | 2021 | 2022 | A+ | A | A− | B | C | ||
| C11 | Pumping station discharge volume (m3) | 292.69 | 325.78 | 223.76 | 1 | 0 | 0 | 0 | 0 |
| C12 | Pumping station discharge frequency (%) | 47.40 | 47.12 | 45.75 | 0 | 0 | 0 | 0.425 | 0.575 |
| C13 | Wastewater treatment plant overflow ratio (%) | 12.51 | 6.96 | 2.69 | 0.655 | 0.345 | 0 | 0 | 0 |
| C14 | Wastewater treatment plant overflow frequency(%) | 91.44 | 77.72 | 38.36 | 0.164 | 0.836 | 0 | 0 | 0 |
| C15 | * Overflow potential hazard | — | — | — | 0.286 | 0.429 | 0.286 | 0 | 0 |
| C16 | * Area of influence of overflow | — | — | — | 0.143 | 0.571 | 0.286 | 0 | 0 |
| C21 | Ponding depth (m) | 1 | 0.98 | 1 | 0 | 0 | 0 | 0 | 1 |
| C22 | Ponding frequency (%) | 27.86 | 18.62 | 18.18 | 0 | 0.364 | 0.636 | 0 | 0 |
| C23 | *Ponding time ratio | — | — | — | 0.143 | 0.429 | 0.286 | 0.143 | 0 |
| C24 | Ponding point ratio (%) | 12.50 | 10.71 | 9.38 | 0 | 0.655 | 0.345 | 0 | 0 |
| C25 | Overloaded pipeline ratio (%) | 13.67 | 11.28 | 9.57 | 0 | 0.608 | 0.393 | 0 | 0 |
| C26 | * Waterlogging reduction potential | — | — | — | 0.143 | 0.429 | 0.429 | 0 | 0 |
| C31 | Variation coefficient of inflow volume (%) | 0.21 | 0.22 | 0.17 | 0 | 0.6 | 0.4 | 0 | 0 |
| C32 | Storage capacity | — | — | — | 0.286 | 0.429 | 0.286 | 0 | 0 |
| C33 | Pumping station dispatch capability | — | — | — | 0.143 | 0.286 | 0.571 | 0 | 0 |
| C34 | Forebay water level of outlet pump room (m) | 2.64 | 2.56 | 2.50 | 1 | 0 | 0 | 0 | 0 |
| C41 | Pipeline network length per capita (km/10,000 people) | 11.63 | 11.68 | 11.62 | 0 | 0 | 0 | 0.724 | 0.276 |
| C42 | Urban pipeline network investment (10,000 yuan/km2) | 530.59 | 577.94 | 532.28 | 0.215 | 0.785 | 0 | 0 | 0 |
| C43 | Wastewater delivery capacity (%) | 119.12 | 111.19 | 100.44 | 0 | 0 | 0.956 | 0.044 | 0 |
| C44 | Maintenance and update cost (10,000 yuan/km) | 17.57 | 13.39 | 24.20 | 0 | 0.84 | 0.16 | 0 | 0 |
| C45 | Pipeline network density (km/km2) | 13.92 | 19.08 | 20.03 | 1 | 0 | 0 | 0 | 0 |
| C46 | Wastewater treatment rate (%) | 96.68 | 96.89 | 97.38 | 0 | 0 | 0.983 | 0.017 | 0 |
| C47 | Pipeline inspection (%) | 120 | 118 | 102 | 0 | 0.05 | 0.95 | 0 | 0 |
| C51 | Total energy consumption (kW·h) | 9217.87 | 8455.60 | 8096.07 | 0 | 0.950 | 0.050 | 0 | 0 |
| C52 | Wastewater transportation unit consumption (kW·h/1000 m3) | 69.77 | 61.13 | 59.72 | 0.338 | 0.663 | 0 | 0 | 0 |
| C53 | Environmental benefits | — | — | — | 0.571 | 0.143 | 0.286 | 0 | 0 |
| C61 | Inflow monitoring ratio (%) | 50 | 50 | 50 | 0 | 0 | 1 | 0 | 0 |
| C62 | Layout of pipeline monitoring points (points/10 km) | 20 | 20 | 20 | 1 | 0 | 0 | 0 | 0 |
| C63 | Intelligent decision | — | — | — | 0 | 0.143 | 0.429 | 0.286 | 0.143 |
| C64 | Intelligent control | — | — | — | 0.143 | 0.429 | 0.143 | 0.286 | 0 |
| C65 | Digitalization degree of pipe network (%) | 100 | 100 | 100 | 1 | 0 | 0 | 0 | 0 |
| Years | Rule Layer | Code | Evaluation Level Proportion % | Quantitative Score | ||||
|---|---|---|---|---|---|---|---|---|
| A+ | A | A− | B | C | ||||
| 2020 | CSO control | B1 | 1 | 2.71 | 10.41 | 34.85 | 50.74 | 66.61 |
| Waterlogging control | B2 | 3.29 | 8.45 | 26.20 | 20.12 | 41.91 | 71.09 | |
| Stable transportation of wastewater | B3 | 14.49 | 26.67 | 48.20 | 10.64 | 0 | 84.50 | |
| Management and maintenance of pipeline | B4 | 4.56 | 28.59 | 15.49 | 25.99 | 25.37 | 76.10 | |
| Energy conservation | B5 | 4.63 | 2.31 | 1.16 | 26.42 | 65.48 | 65.42 | |
| Smart water affairs | B6 | 43.92 | 8.34 | 46.12 | 1.62 | 0 | 89.42 | |
| 2021 | CSO control | B1 | 0 | 3.70 | 18.30 | 19.51 | 58.19 | 66.54 |
| Waterlogging control | B2 | 2.35 | 21.50 | 45.58 | 2.92 | 27.64 | 76.79 | |
| Stable transportation of wastewater | B3 | 15.42 | 17.76 | 48.99 | 17.84 | 0 | 83.08 | |
| Management and maintenance of pipeline | B4 | 21.80 | 13.77 | 10.05 | 43.98 | 10.41 | 79.27 | |
| Energy conservation | B5 | 3.47 | 26.84 | 69.68 | 0 | 0 | 83.37 | |
| Smart water affairs | B6 | 43.92 | 6.72 | 46.12 | 3.24 | 0 | 89.13 | |
| 2022 | CSO control | B1 | 50.23 | 25.07 | 3.70 | 8.80 | 11.90 | 89.05 |
| Waterlogging control | B2 | 2.35 | 35.00 | 31.62 | 1.40 | 29.61 | 77.89 | |
| Stable transportation of wastewater | B3 | 20.65 | 42.10 | 37.25 | 0 | 0 | 88.34 | |
| Management and maintenance of pipeline | B4 | 15.00 | 25.98 | 40.36 | 13.84 | 4.83 | 83.26 | |
| Energy conservation | B5 | 10.99 | 83.08 | 5.94 | 0 | 0 | 90.51 | |
| Smart water affairs | B6 | 40.60 | 6.72 | 44.42 | 6.64 | 1.62 | 87.80 | |
| Years | Evaluation Level Proportion % | Result | Score | ||||
|---|---|---|---|---|---|---|---|
| A+ | A | A− | B | C | |||
| 2020 | 11.29 | 12.06 | 24.95 | 20.24 | 31.40 | B | 75.15 |
| 2021 | 12.97 | 14.92 | 40.17 | 13.46 | 18.41 | A− | 79 |
| 2022 | 23.77 | 36.18 | 26.17 | 4.70 | 9.12 | A | 86 |
Disclaimer/Publisher’s Note: The statements, opinions and data contained in all publications are solely those of the individual author(s) and contributor(s) and not of MDPI and/or the editor(s). MDPI and/or the editor(s) disclaim responsibility for any injury to people or property resulting from any ideas, methods, instructions or products referred to in the content. |
© 2023 by the authors. Licensee MDPI, Basel, Switzerland. This article is an open access article distributed under the terms and conditions of the Creative Commons Attribution (CC BY) license (https://creativecommons.org/licenses/by/4.0/).
Share and Cite
Wang, H.; Yan, M.; Gao, Y.; Wang, Y.; Dai, X. An Evaluation System for Assessing the Operational Efficiency of Urban Combined Sewer Systems Using AHP—Fuzzy Comprehensive Evaluation: A Case Study in Shanghai, China. Water 2023, 15, 3434. https://doi.org/10.3390/w15193434
Wang H, Yan M, Gao Y, Wang Y, Dai X. An Evaluation System for Assessing the Operational Efficiency of Urban Combined Sewer Systems Using AHP—Fuzzy Comprehensive Evaluation: A Case Study in Shanghai, China. Water. 2023; 15(19):3434. https://doi.org/10.3390/w15193434
Chicago/Turabian StyleWang, Hongwu, Ming Yan, Yuan Gao, Yanqiong Wang, and Xiaohu Dai. 2023. "An Evaluation System for Assessing the Operational Efficiency of Urban Combined Sewer Systems Using AHP—Fuzzy Comprehensive Evaluation: A Case Study in Shanghai, China" Water 15, no. 19: 3434. https://doi.org/10.3390/w15193434