Abstract
The water seepage zone affects dryland salinity, soil sodicity, land degradation, waterlogging, and rainfall pollution. The priority in terms of the remediation measures was determining the cause of the seepages. Nine water and six soil samples were collected from the Al Tayseer area of the Wadi Bani Malik, Jeddah, Saudi Arabia (SA). The water samples were analyzed for major and toxic metals. For the soil samples, granulometric analysis and infiltration rate analysis were performed. The total dissolved solids (TDS) in water seepages ranged from 1880 to 54,499, whereas boron (B) and iron (Fe) values ranged from 1.9 to 38 mg/L and 0.02 and 0.47 mg/L, respectively. These concentrations were the same for the aquifer in Lake Al Misk, confirming that groundwater infiltration from the lake area was the main reason for the water seepage. The concentrations of silica (Si), aluminum (Al), cobalt (Co), nickel (Ni), zinc (Zn), arsenic (As), cadmium (Cd), chromium (Cr), copper (Cu), and lead (Pb) were low, indicating that there was no contamination. The nitrate (NO32−) value ranged from 2.2 to 35 mg/L, indicating agricultural wastewater contribution. According to the granulometric examination, most sediment was sand, followed by gravel, with few fine-grain particles. The infiltration rate ranged from 85 to 864 cm/d, indicating significant leakage. The percentage of ferrugination, ferromagnesian, OH-bearing, and carbonate (CO₃2−) minerals is determined by the 4/2, 5/6, and 6/7 band ratios.
1. Introduction
Groundwater is the primary source of freshwater in inland regions, particularly arid or semi-arid ones. This has been highlighted in various studies [1,2,3,4]. The significance of groundwater as a water supply for domestic, industrial, and agricultural purposes is growing, as indicated by research conducted by the authors of [5,6,7]. Nonetheless, groundwater quality often needs to meet the requirements for water supply due to both natural phenomena and human actions. The issue of saline groundwater is a prominent concern on a global scale, particularly in regions with limited water resources [8,9,10,11,12]. The phenomenon of groundwater salinization frequently correlates with elevated concentrations of total or specific dissolved elements, excluding sodium (Na) and chloride (Cl). For example, in various regions of China [13,14,15], Africa [16,17,18,19,20,21], India [22,23,24,25], and Argentina [26,27], the presence of high levels of fluoride in groundwater is associated with increased salinity and is a significant factor contributing to the prevalence of dental and skeletal fluorosis. Hence, the issue of “salinity” is merely the surface manifestation of a more substantial problem, as elevated salinity levels often coincide with increased concentrations of specific inorganic contaminants such as sulfate [13,28], boron [26,29], fluoride [22,30], selenium [31,32], and arsenic [33,34].
The agriculture industry and consumer demand predominantly rely on groundwater resources. According to the authors of [35,36], the contamination of aquifers has been identified as a significant factor contributing to around 80% of infections in India, primarily due to unsanitary conditions. Groundwater pollution can be attributed to lithogenic sources, which involve the interaction between rocks (for example limestone, hard rocks, and phosphates rocks) and water, and anthropogenic causes, including agricultural activities, industry, seawater intrusion, and population increase. The presence of elevated levels of trace metals in aquifers presents potential hazards to the quality of groundwater and soils, plants, and human well-being [37]. Trace elements are transported into soils and undergo bioaccumulation via plants, animals, and water, ultimately entering the human body through the food chain [38,39,40]. The factors mentioned above contribute to the decline of human health and are associated with the onset of numerous diseases and infections.
Dryland salinity is a significant environmental issue prevalent in numerous arid and semi-arid regions across the globe. The problem arises when the water table connects with the earth’s surface [41]. To comprehend the issue of land and water, it is imperative to consider a comprehensive grasp of the various components, including groundwater chemistry and their respective geochemical cycles. The hydrogeochemical salts in soil undergo mobilization, transportation, and deposition. Salts infiltrate the pore spaces, resulting in reduced permeability and the subsequent detachment of soil moisture from the root zones of plants [42]. The ultimate stage encompasses the mortality of the plants, deterioration of the soil, and decline in per capita income. An aquifer system experiencing rising water tables will enhance waterlogging and soil salinization. The absence of clay in an area prevents the occurrence of dryland salinity, as salts that build on the surface or in the root zone are effectively removed through flushing by rainfall events.
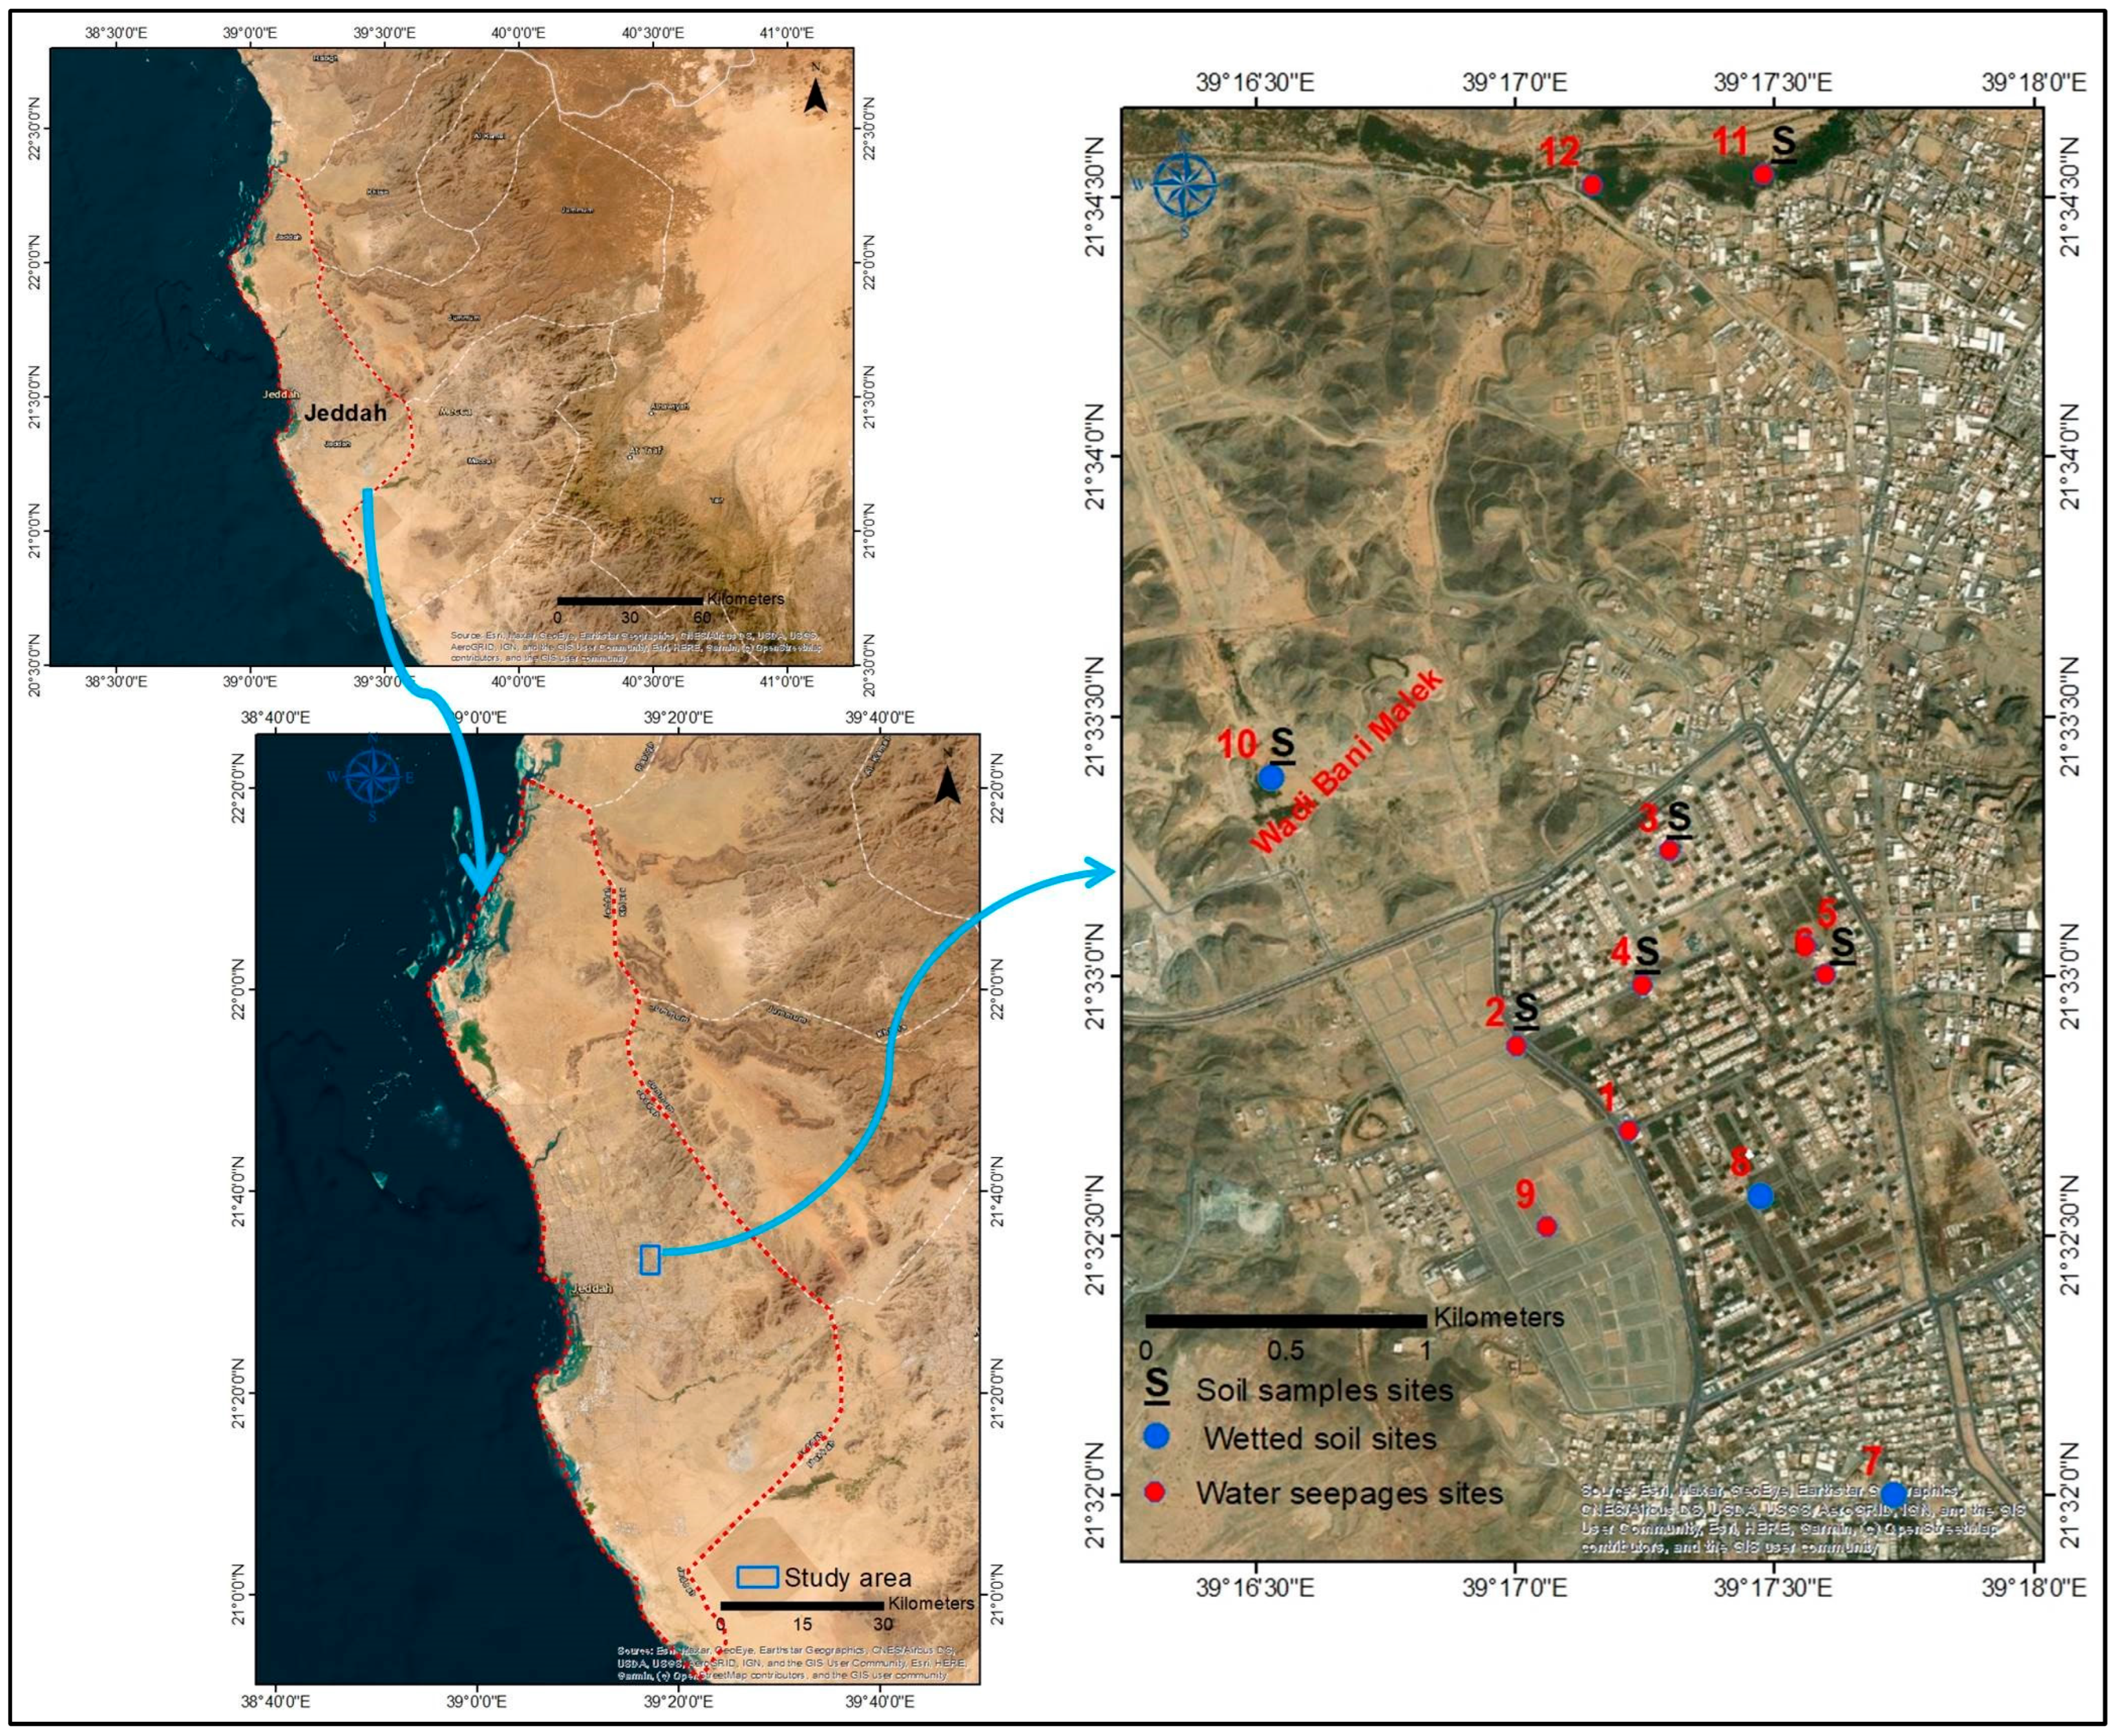
The recent advancements in SA have led to a significant increase in water use and demand across the industrial, municipal, and agricultural sectors [43,44]. According to the findings in [45], the disparity between supply and demand amounted to 11,423 million m3 per year in 2010. Groundwater is the principal water source in dry regions, such as the Wadi Bani Malik, in western Saudi Arabia (Figure 1). Projects that are linked to rapid development have a significant impact on the quality of groundwater. The use of Al Misk Lake as a disposal site in Wadi Bani Malik, Jeddah (Figure 1) commenced in the late 1990s and continued until 2011.

Figure 1.
Base map of the study area.
Figure 2b depicts the geographical region after the year 2011, during which the local governing body was compelled to discontinue the practice of depositing waste materials. The dumping procedures employed in Jeddah have been found to result in groundwater contamination and an increase in the groundwater table. The daily sewage water discharge into the Al Misk Lake region amounts to around 100,000 cubic meters. This effluent is distributed along surface and groundwater pathways throughout the northern regions. The soil conditions have undergone alterations due to excavation activities, leading to modifications in the drainage morphology. In the year 2011, the decision was made to intentionally desiccate Al Misk Lake, hence prohibiting any further disposal activities within its vicinity. Nevertheless, the aforementioned non-point source of contamination underwent migration and dispersion into the groundwater of the unconfined fractured alluvial aquifer located in Wadi Bani Malik, ultimately reaching populated areas and the shoreline of the Red Sea.
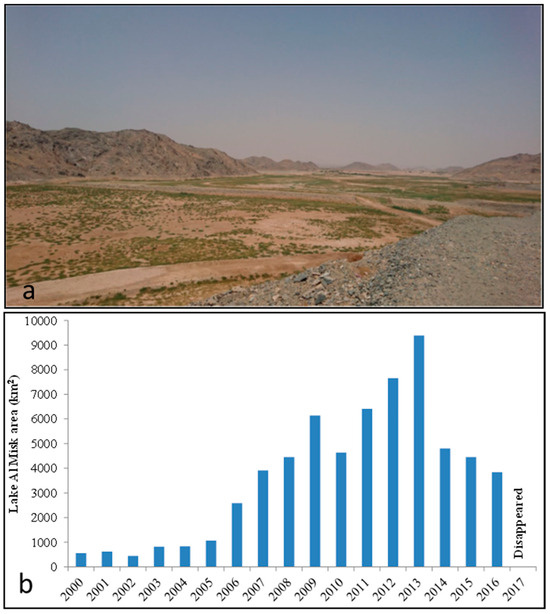
Figure 2.
(a) Al Misk Lake in Wadi Bani Malik after 2011 (after [46]) and (b) Lake Al Misk area during different periods (after [47]).
The Wadi Bani Malik, located in Jeddah, has been investigated in numerous academic research. The study by the authors of [48] examined the flood potential of the area and the corresponding hazards. The authors of [49] employed a solute transport model to assess the anticipated travel time of the groundwater pollution plume. The specific scenario considered was the presence of an uninterrupted point source of untreated sewage. The estimated journey time was determined to be approximately 50 years. According to the authors of [50], the elevated electrical conductivity observed in the groundwater is a diagnostic feature that can identify and characterize a plume from a waste disposal site.
The hydrogeochemistry of saline groundwater seepage zones in Bani Malik and their impacts on soil and water resources have not received adequate attention in recent years. This research aimed to detect the hydrogeology and hydrogeochemistry of water seepages to identify their sources. Granulometric and infiltration analyses were done to determine the infiltration rate. The ArcGIS software and remote sensing data classify the digital geological map and iron-bearing rocks.
2. Study Area
Jeddah has a population density of over 3 million, leading to a heightened volume of wastewater disposal. This wastewater was released into Wadi Uranah [51] and Lake Al Misk [48], resulting in soil and aquifer system degradation. The primary location for wastewater disposal was Lake Al Misk (Figure 1), which was established in 1990, with a daily discharge rate of 4 × 10⁴ m3 [48,49]. Approximately 20 × 104 m3 of wastewater was discharged into Lake Al Misk, resulting in partial leakage into the alluvium and foundation aquifer, which possess a high permeability [50]. According to the authors of [48], the lake area expanded to 2.5 square km in 2010, with a 9 × 10⁶ cubic meters volume. The residential neighborhoods are subject to a potential threat—the act of dumping and dewatering lake water ceased by the official administration in 2011. Recently, Lake Al Misk was drained entirely (Figure 2b), replacing it with agricultural land. Assessing the ecological consequences associated with the desiccation of lakes on soil and aquifer systems is imperative. Lake Al Misk is situated in the Wadi Bani Malik, with a more than 300 km2 drainage area and ten streams. The sediments found at the bottom of the lake consisted of alluvium deposits, encompassing various materials such as gravel, sand, silt, and clay [52]. The saline water seepages originate from broken alluvium and hard rocks on the lower slopes and valleys (Figure 1).
Geology and Hydrogeology
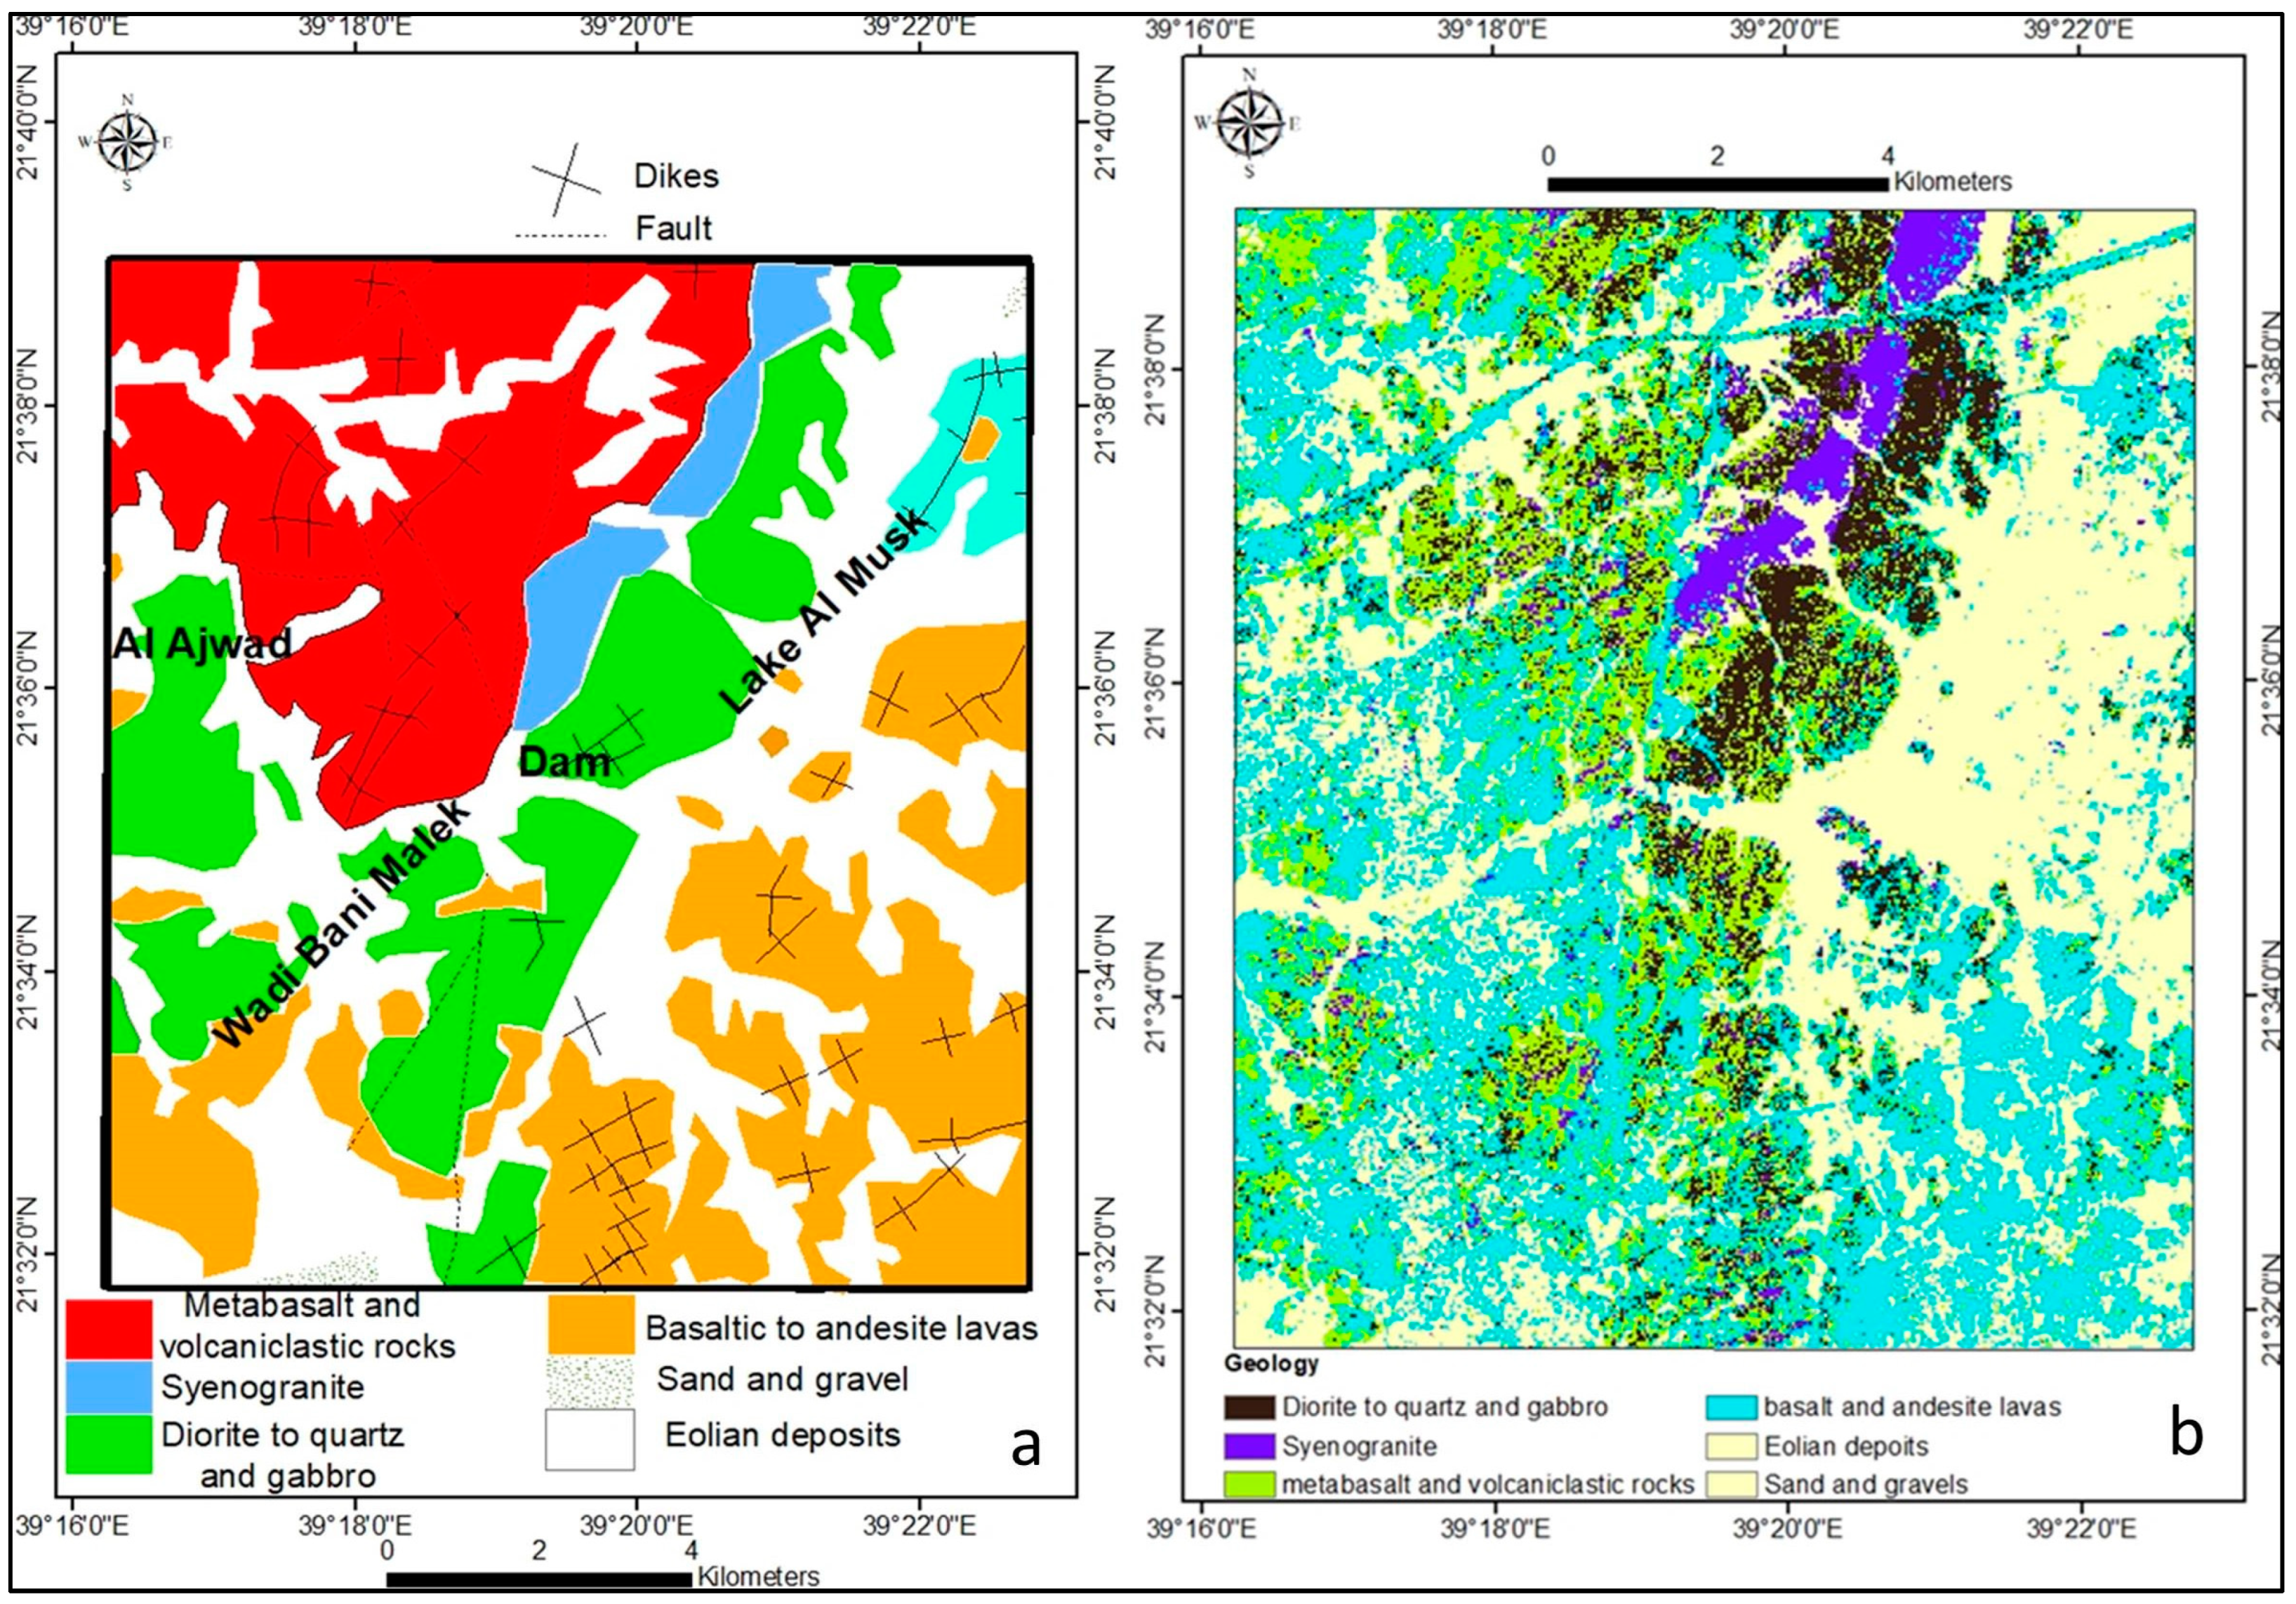
Precambrian and Cambrian sediments are overlain by Cretaceous–Tertiary sedimentary sediments, Tertiary–Quaternary basaltic lava flows, and Quaternary–recent alluvial sediments [53]. The authors of [54] determined that the outcrops of the valley sides with less proportion of intrusive igneous rocks (granite, granodiorite, tonalite, and andesite) are composed of basement rocks, particularly gabbro. The undulating rock formation consists primarily of metabasalt to volcaniclastic rocks in the northwest and basaltic to andesite lavas in the southeast (Figure 3a). The diorite-quartz and syenogranite are distributed in the central and western parts (Figure 3a).
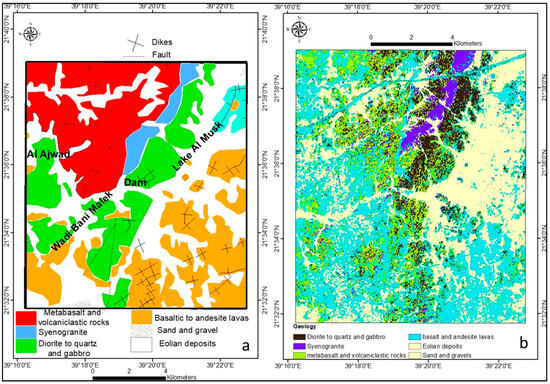
Figure 3.
(a) Geologic map and (b) digital geologic map by supervised classification of the study area.
The Wadi sediments are composed of sand, gravel, and particles. The maximal likelihood algorithm is used for multispectral supervised classification [55]. Five geological categories were represented by 87 supervised training or areas of interest (AOIs) as shown in Table 1. It is convenient to include tonal, texture, shadow, and pattern distinctions for each class using the number of AOIs. The method distinguishes between distinct geological entities and generates the digital geological map (Figure 3b).

Table 1.
Approximate spatial distribution of the main rock types in the study area.
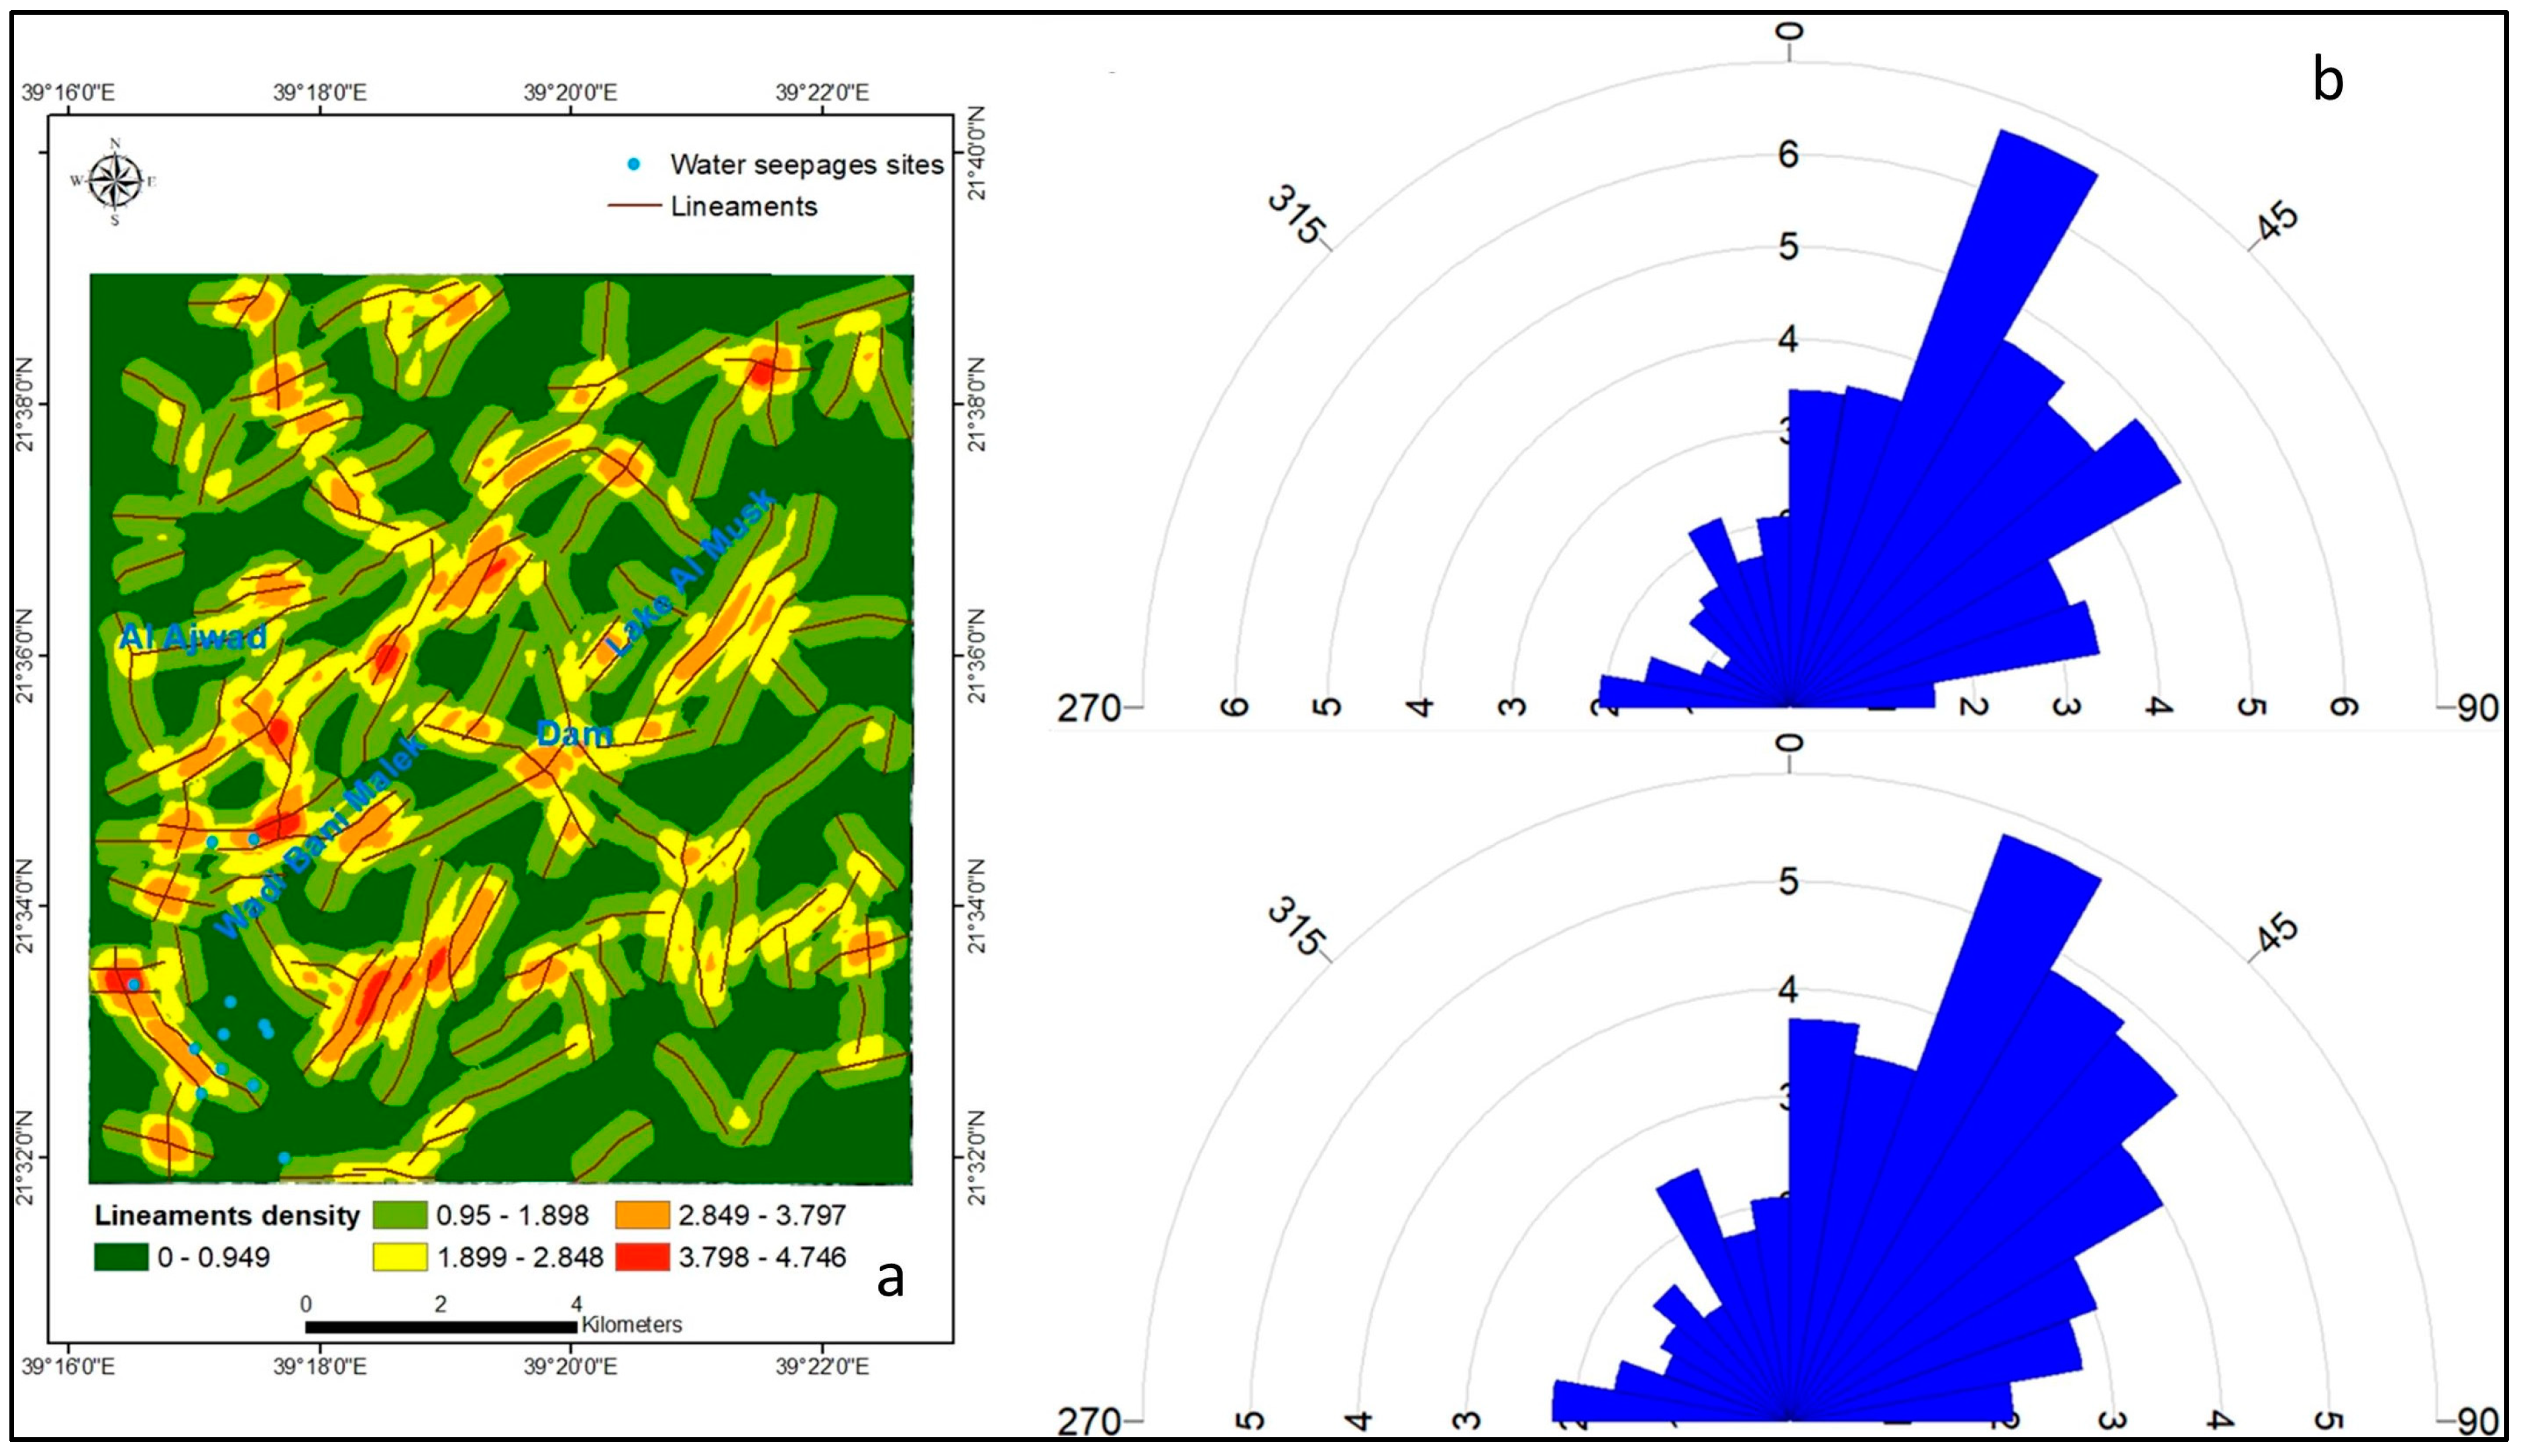
The basalt-andesite and lava eolian deposit sand-gravels comprised most regions (Table 1). These geological units contain joints, fissures, and faults. Significant faults and extracted lineaments strike northeast–southwest (Figure 4a,b). High-density lineaments are associated with metabasalt-volcaniclastic and diorite-quartz rocks. In contrast, low-density lineaments are observed in basaltic to andesite lavas (Figure 4a). The valley is located on a major NE–SW fault plane (Figure 4b) and other structural lineaments with various orientations, which influence the flow of groundwater and the movement of pollutants. The volcanic and Quaternary deposits facilitate the formation of springs and aquifers, which are reflective of the inhabitants.

Figure 4.
(a) Lineament density and (b) rose diagrams.
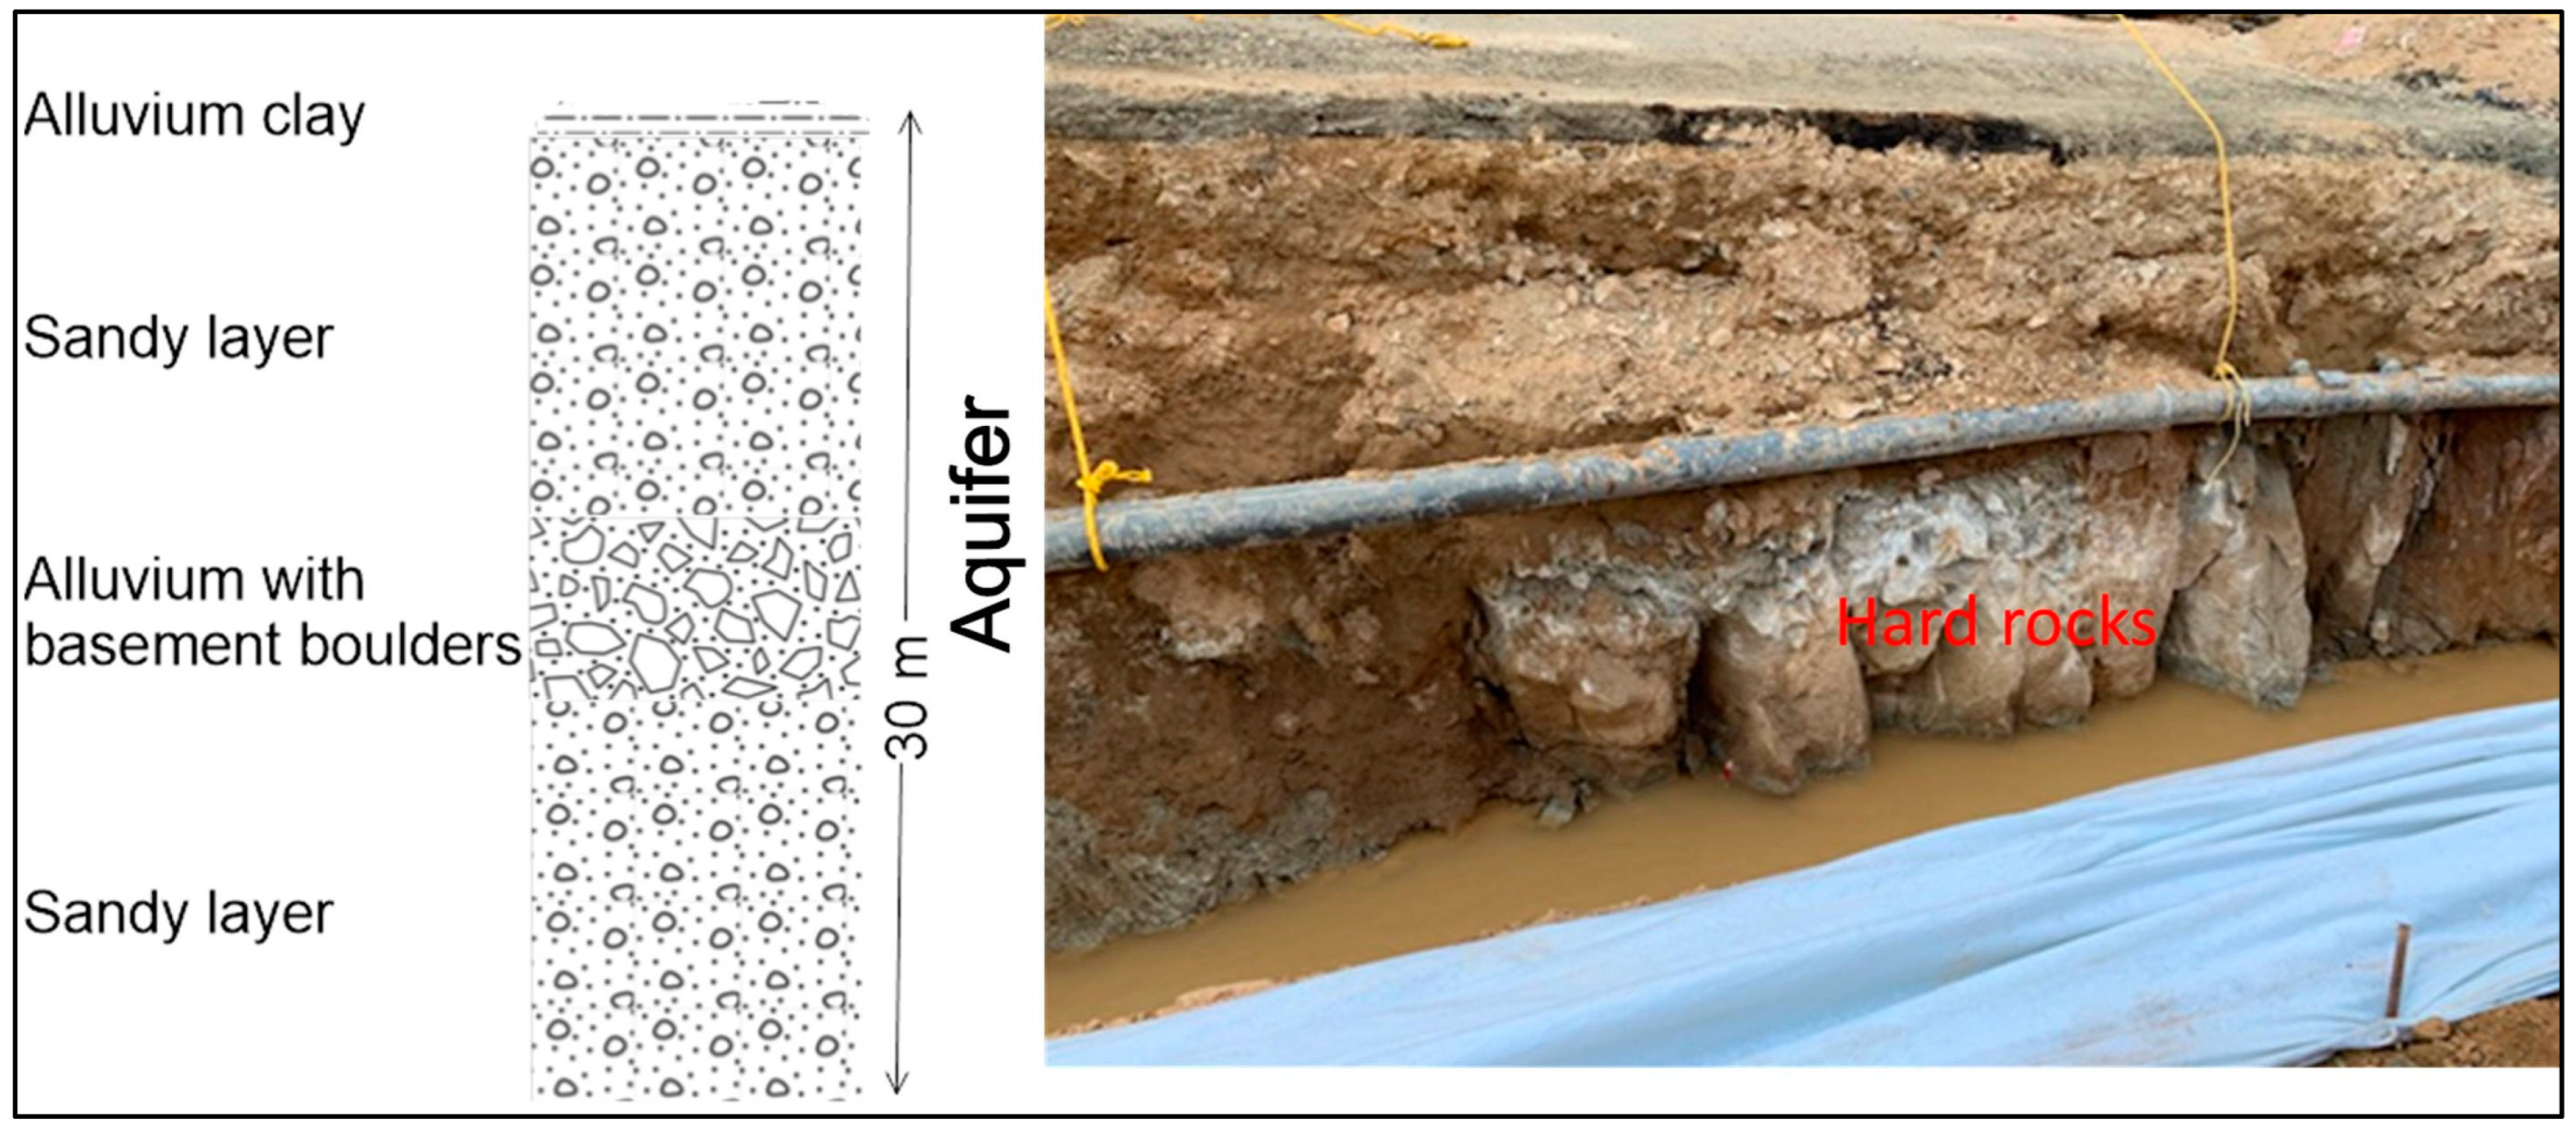
The aquifer consists of sand, gravel, and low mud content. The alluvium deposits alternate with basement fragments (Figure 5). In the study location, the uppermost layer of clayey sediment in Lake Al Misk disappeared (Figure 5). The estimated hydraulic conductivity of the soil samples (upper part of the aquifer) ranged from 9 × 10⁻⁵ to 4 × 10⁻⁴ m/s (Figure 6), representing medium permeability. The aquifer alternated with hard rocks (Figure 5). The average hydraulic conductivity of the aquifer in the Lake Al Misk area was the order of 10−3 m/s, which indicated the porous nature of the aquifer [38] and was higher than those in the area of investigation.
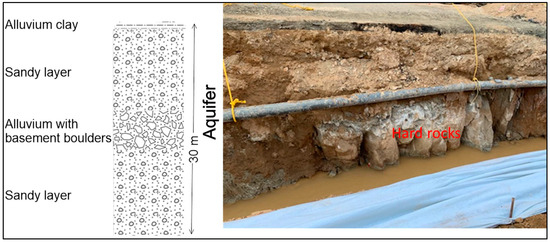
Figure 5.
Subsurface geological profile of Lake Al Misk (modified after Hakami et al., 2020 [46]).
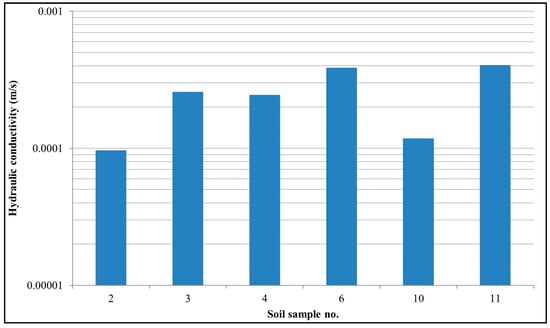
Figure 6.
The hydraulic conductivity of the soil samples.
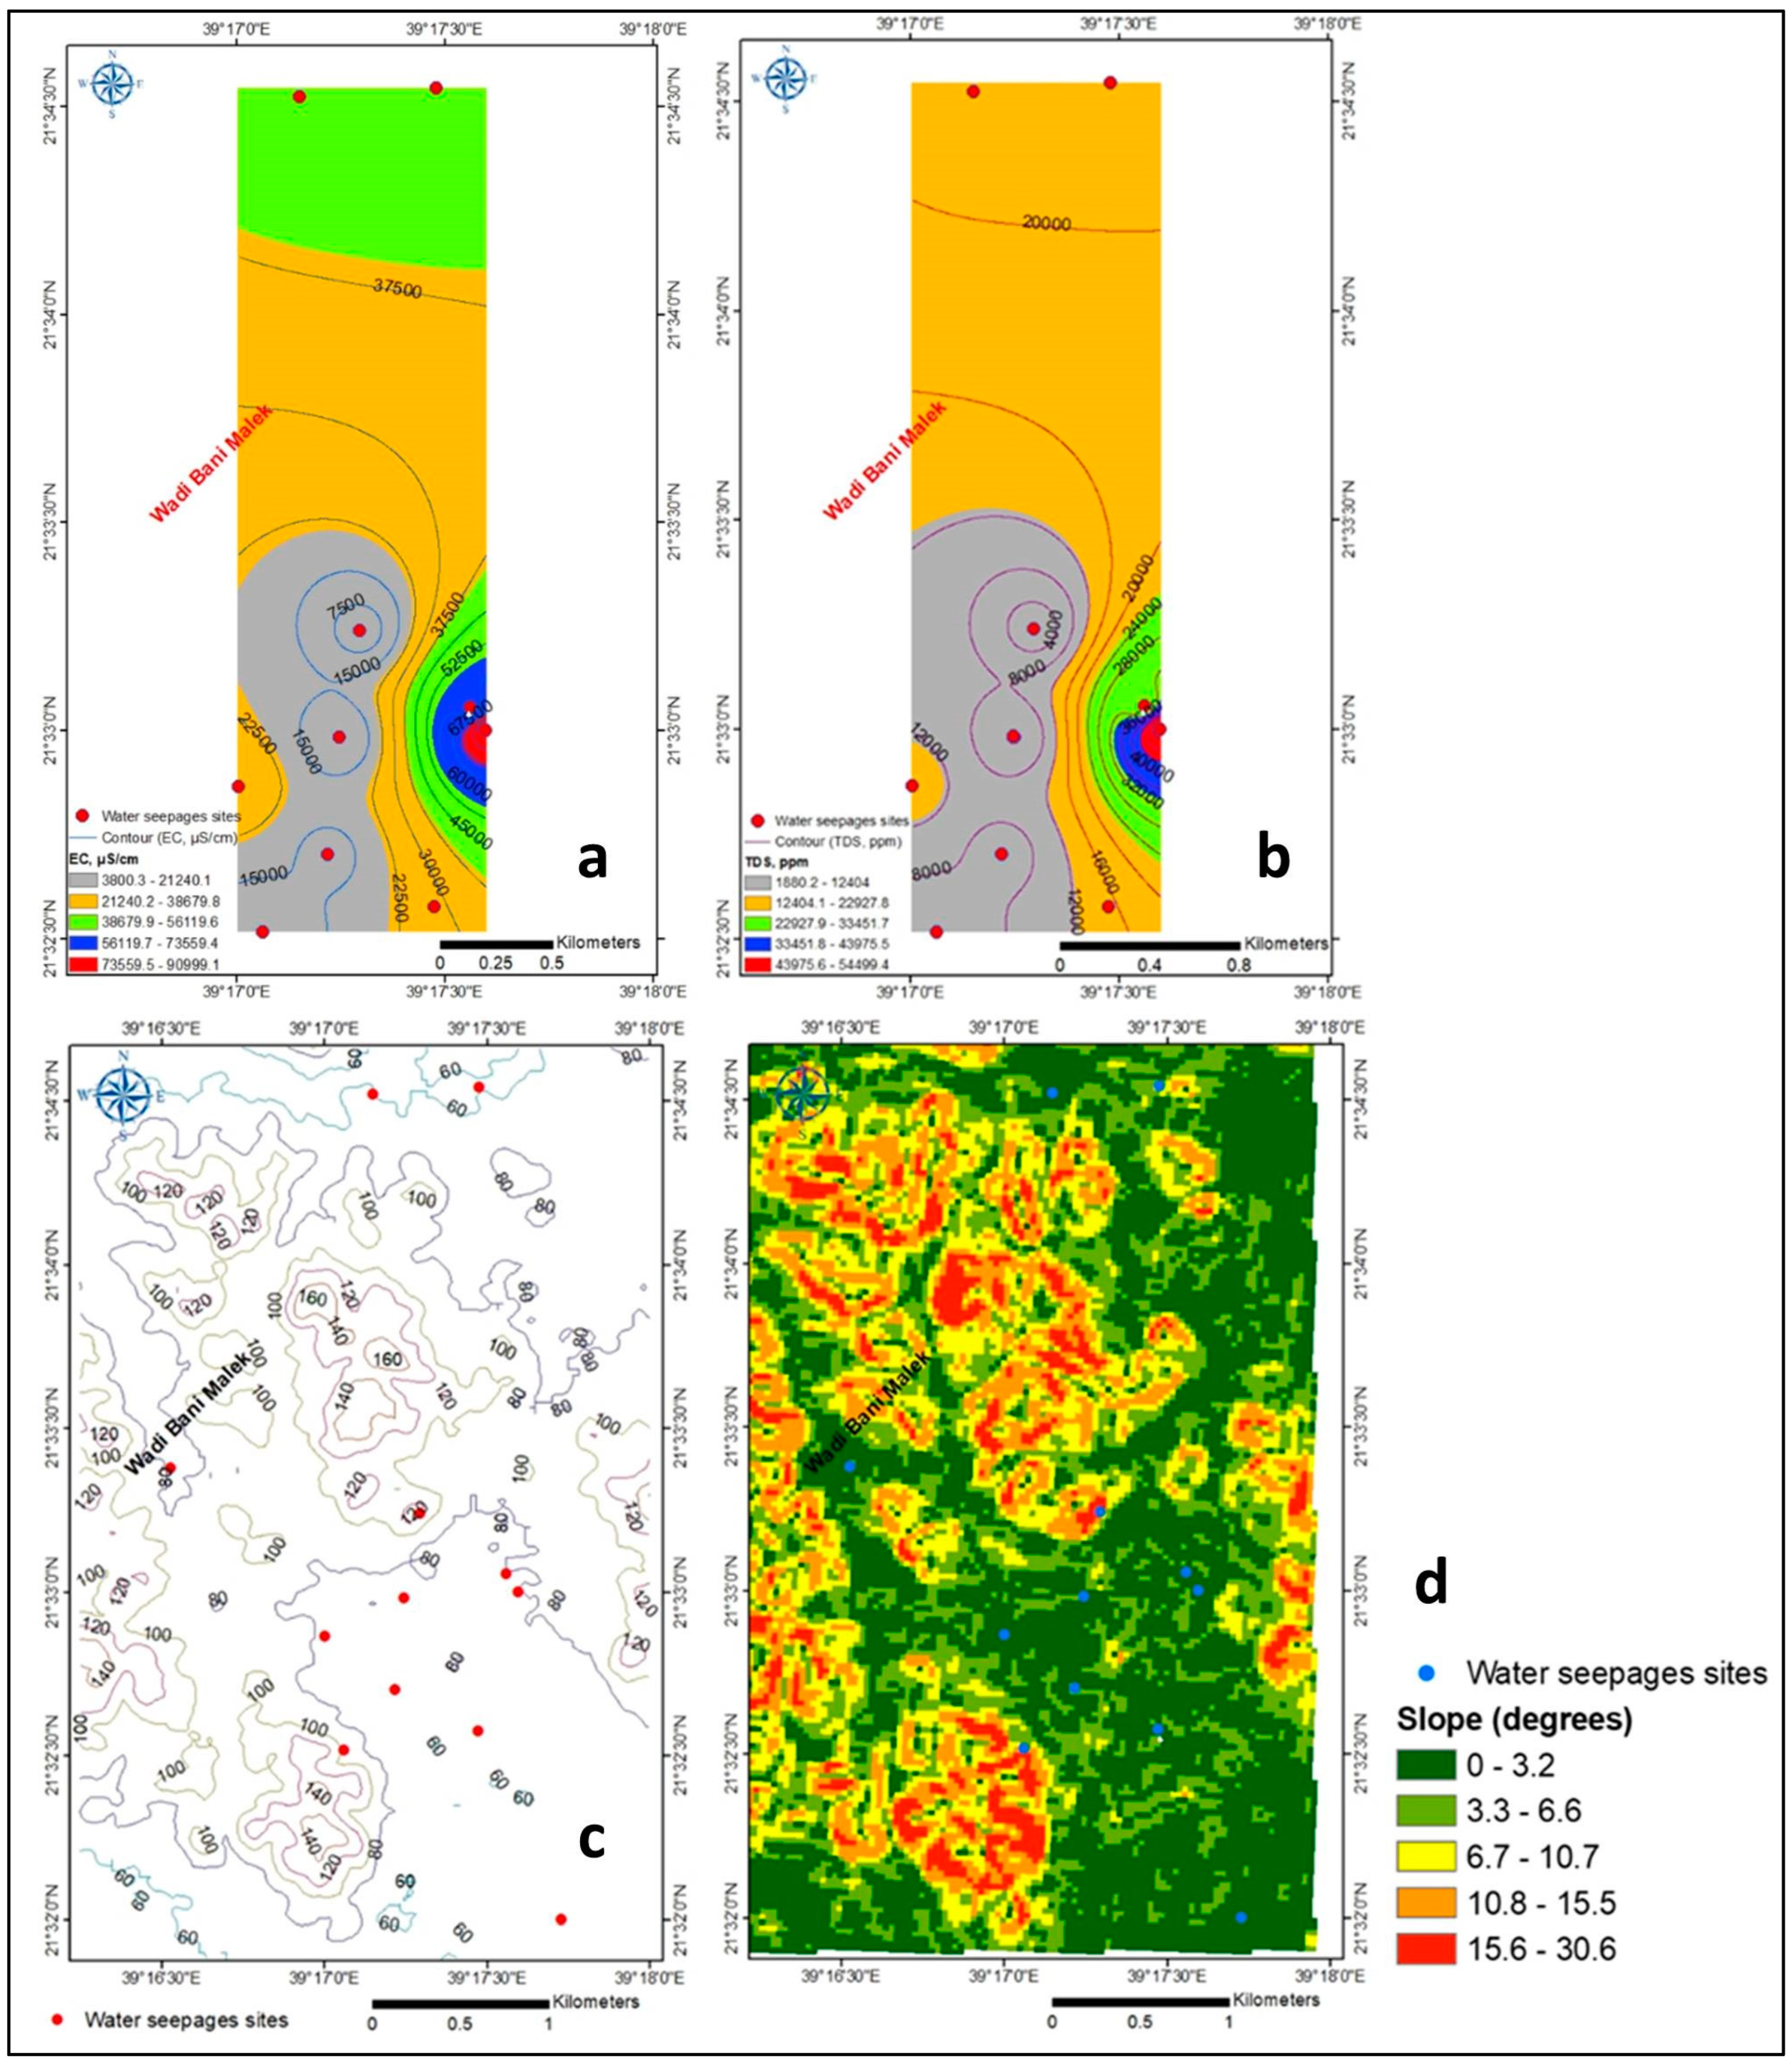
The water seepages are governed by the distribution patterns of lineament density (Figure 4), hydraulic conductivity contrasts (Figure 6), and slope (Figure 7d). The interaction between rock and water increases the aquifer and soil salinity. The average boron (B) concentration was 13.2 mg/L [52,56].

Figure 7.
(a) EC, (b) TDS, (c) DEM, and (d) slope of the study area.
The TDS ranged from 10,008 to 57,240 ppm in the aquifer surrounding Lake Al Misk. Due to gravitational forces (from high elevation to low area), the shallow aquifer surrounding the investigation readily receives the wastewater dump from Jeddah and groundwater inflows from the Lake Al Misk area.
3. Materials and Methods
Nine water seepages were collected from the Al Tayseer area of the Wadi Bani Malik in September 2020. The location of the sampling site is depicted in Figure 1. The samples were placed in polypropylene bottles that had previously been rinsed and securely sealed. Using portable field kites, pH, electrical conductivity (EC), TDS, and temperature were measured in situ. OxiTop®-C Measuring Heads were used to ascertain biological oxygen femand (BOD), and NO32− was measured using a spectrophotometer DR 3000. Cl, bicarbonate (HCO3−), and CO32− were estimated using titration techniques. To avoid complexation, precipitate, and adsorption, the samples were acidified in situ with ultra-pure nitric acid following filtration to determine trace elements. The samples were transported to the laboratory, where they were refrigerated to prevent volume loss from evaporation. Inductively coupled plasma mass spectrometry (ICP-OES) was used to measure Na, K, Ca, Mg, SO42−, and trace elements (B, Fe, Si, Al, As, Ba, Cd, Co, Cr, Cu, Ni, Pb, and Zn). The application of QA/QC [57] guidelines ensured that no elemental concentration changes occurred during sampling, storage, and transportation.
Six soil samples were collected with a hand auger from the alluvium shallow aquifer (1.5 m depth). These samples were analyzed granulometrically using sieves of 4 mm, 2 mm, 1 mm, 710 µm, 500 µm, 300 µm, 250 µm, 125 µm, 63 µm, and <63 µm. The ASTM [58] test was employed, and the sieving analysis determined the effective particle size (D10), D30, D60, coefficient of uniformity (Cu), coefficient of curvature (Cc), and sorting coefficient (C).
To investigate leakage in the field, a single double-ring flooding infiltrometer was used to quantify the leakage rate. The ring was buried at a depth of 6 cm. The area within the ring was inundated with water, and the time required for one mm of water to permeate was measured. The measurements continued until the rate stabilized or rapid lateral water spread began.
The Shuttle Radar Topography Mission–Digital Elevation Model (SRTM-DEM) and a 30 m-resolution Enhanced Thematic Mapper Plus (ETM+) image of Landsat-8 with path 170/row 45 (“LC08_L1TP_170045_20201116_20201210_01_T1”) were downloaded from the United States Geological Survey (USGS) website (http://earthexplorer.usgs.gov/; accessed on 23 April 2023). The image has eleven bands and a low cloud cover of 0.01 percent. Corrections have been made to the ETM+ image for wavelengths, atmospheric velocity, UTM projection WSG84, and anisotropy. The geological map [53] was scanned and georeferenced using the satellite imagery’s coordinates. These images differentiate and digitize the various exposed rock units, which are then classified using supervised image classification accuracy assessment (ML classifier). ETM+ imagery was utilized to generate a base map for the studied region. The software ENVI v 5.1 was used for digital image processing. The steps of lineament delineation are extraction by Envi v 5.1, automatic extraction lineaments (using PCI Line), extraction lineament handling (Arc GIS 10.2), and trend analysis (RockWork v 16). The principal component image (PCI) is appropriate for lineament extraction (PCI Geomatica). ArcGIS 10.3 software was used to create slope and elevation thematic maps using SRTM-DEM imagery.
4. Results and Discussion
4.1. Hydrogeochemistry
4.1.1. Major Ions
EC and TDS concentrations range from 3800 to 90,999 µS/cm and from 1850 to 54,499 ppm, respectively (Figure 7a,b).
The studied area had the lowest topography among the regions surrounding the base map, particularly in the southeast (60 m elevation) and the north (60 m elevation) (Figure 7c,d). The lowest location (area under investigation) attracts the Jeddah sewage dump and the Lake Al Misk aquifer (131 m elevation).
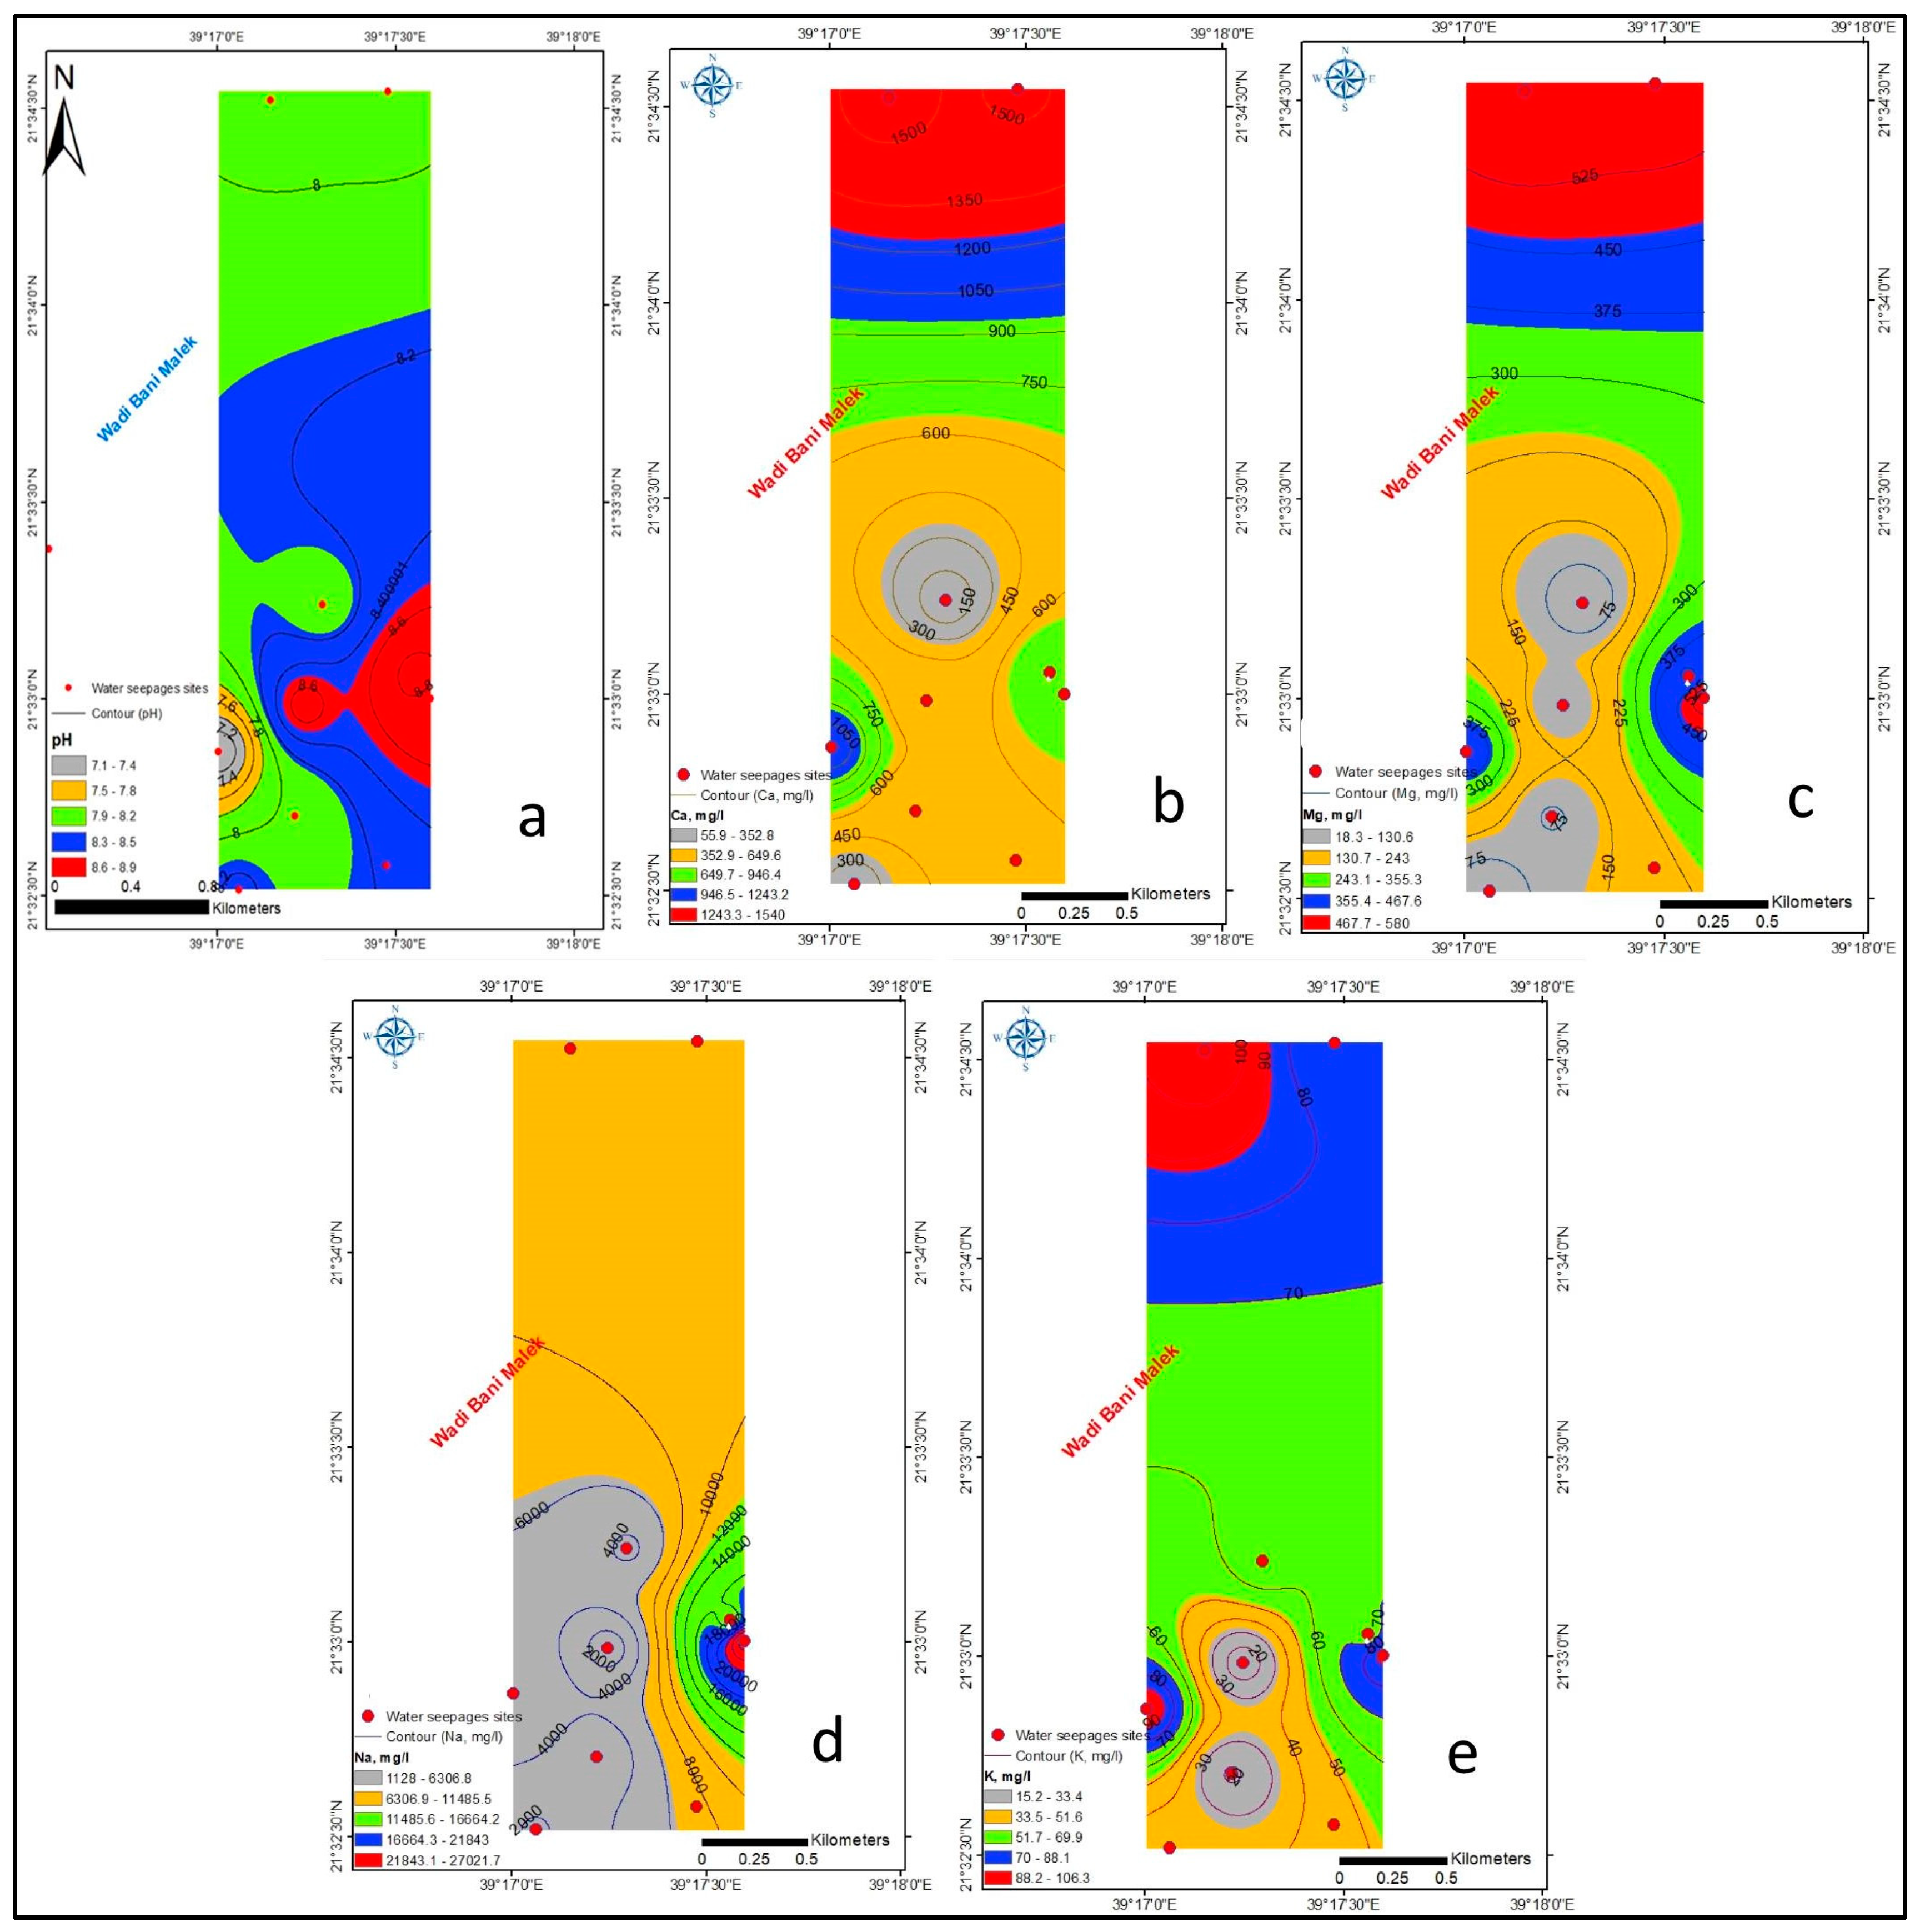
The wastewater is released through the force of gravity, flowing from the highest point in the region (Lake Al Misk) to the lowest point (study area) in terms of topography. The concentrations of EC and TDS exhibit an upward trend as one moves toward the northern direction. The observed phenomenon can be attributed to the outflow of water from the surface and subsurface of Lake Al Misk, which occurs before the lake’s northward drying process. The lake’s height of 131 m is higher compared to the 60 m elevation in the northern region. The elevated concentrations of EC and TDS in the eastern region can be attributed to the predominant drainage and evaporation of water seepages in that area [59,60,61]. The leading possibility for the occurrence of water seepages in the investigated region was the influx of groundwater from Lake Al Misk, which exhibited TDS concentrations ranging from 10,008 to 57,240 ppm [52]. The TDS concentration of seepages observed in the research area showed similarity to the TDS concentration of the aquifer in the Lake Al Misk region. This finding suggests that the contaminated aquifers beneath the lake serve as the primary source of the seepages. The TDS exhibits a strong positive correlation with EC with a coefficient of 0.992, as seen in Table 2. The pH values observed in the study ranged from 7.1 to 8.9, as depicted in Figure 8a. These results suggest that the water samples analyzed can be classified as having a basic nature.
Table 2.
Correlation analysis of water seepages with respect to major and trace elements.

Figure 8.
(a) pH, (b) Ca, (c) Mg, (d) Na and (e) K concentration in water seepages.
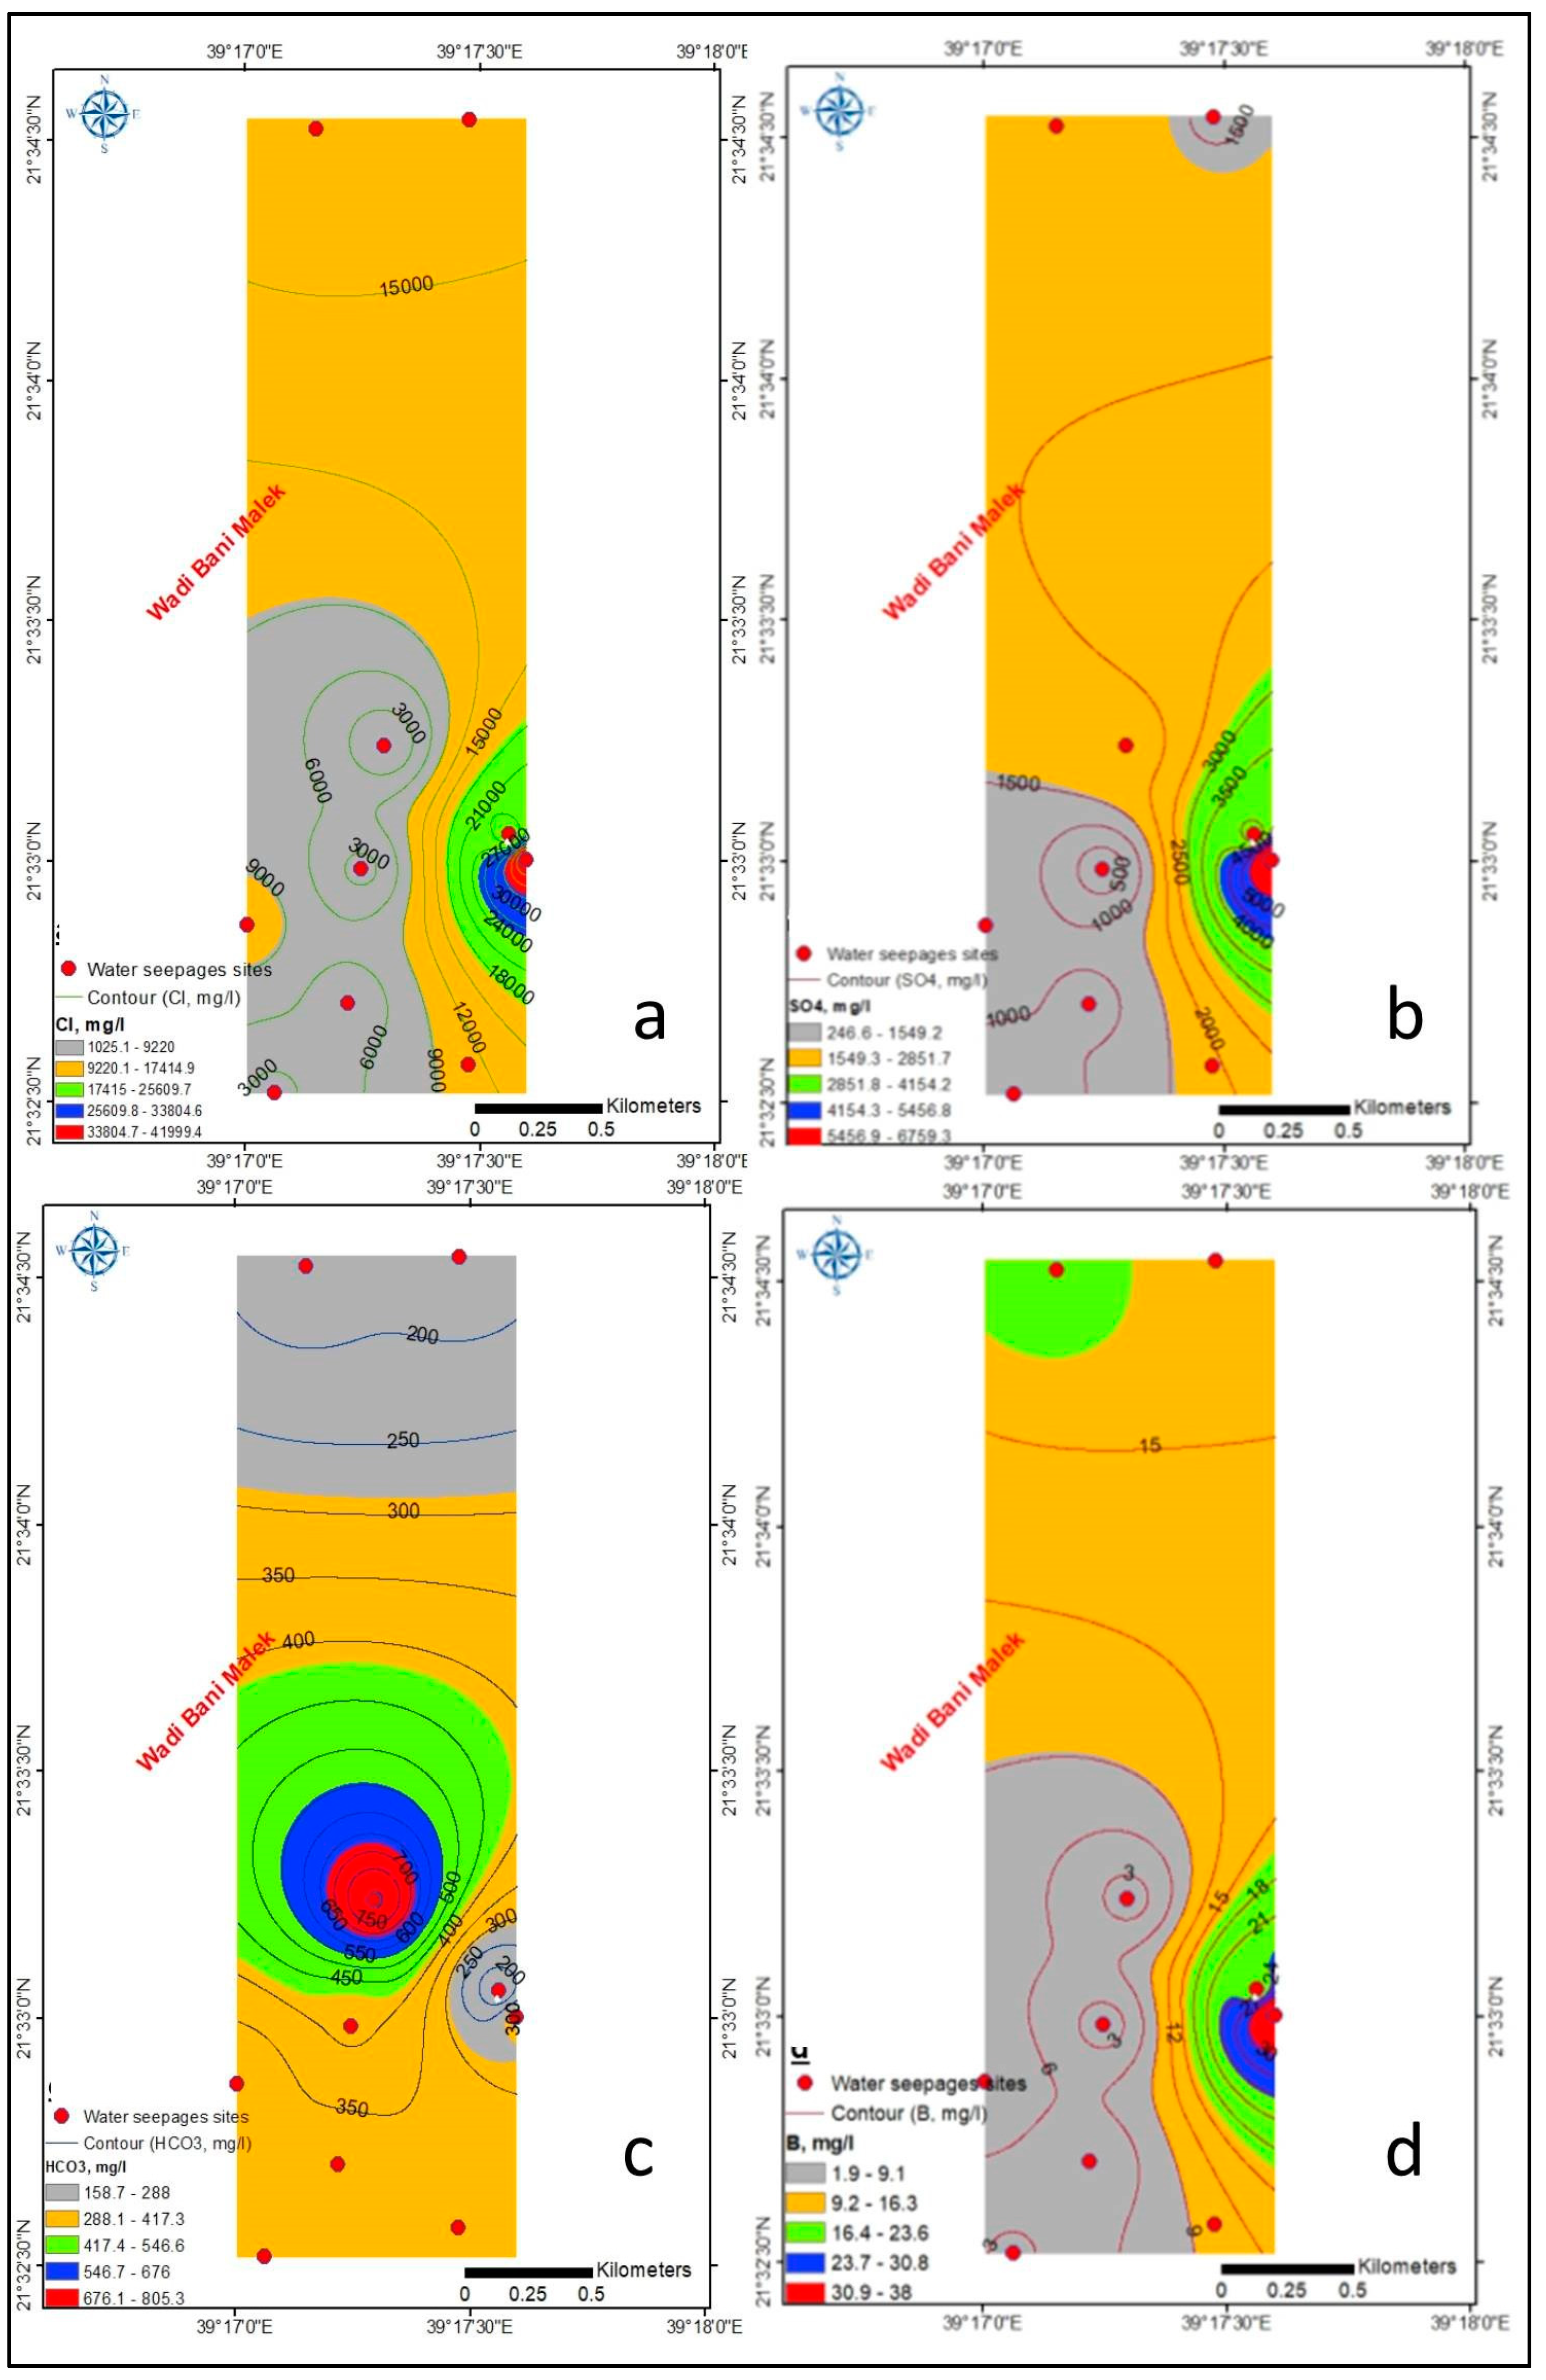
The calcium (Ca), magnesium (Mg), Na, Cl, and SO42− concentrations (Figure 8b,d and Figure 9a,b) follow the same trend as the TDS content. The Ca concentration in the eastern portion (Figure 8b) precipitated partially as Ca (HCO3−)2 and calcium chloride (CaCl2) salts (pH 8.6–8.9, Figure 8a). In contrast, in the northern portion, it precipitated little due to the exceptional water surface area and pH range (Figure 8a). The HCO3− concentration increases in the center of the map and decreases toward the edges (Figure 9c). The electrical conductivity (EC) and concentration of total dissolved solids (TDS) were better than those for consumption and irrigation (Figure 7a,b). Table 2 displays a strong correlation between the TDS and Mg (0.77), Na (0.99), SO42− (0.93), and Cl (1). They represent the interaction between rock and water and evaporation processes during groundwater inflow from lake areas into seepage zones. Due to precipitation as calcium carbonate (CaCO3), the TDS exhibited a weak correlation with Ca (0.38), as measured by the correlation coefficient. These water seepages originate from the upward flow of groundwater, with significant ion concentrations exceeding WHO recommendations (Table 3).
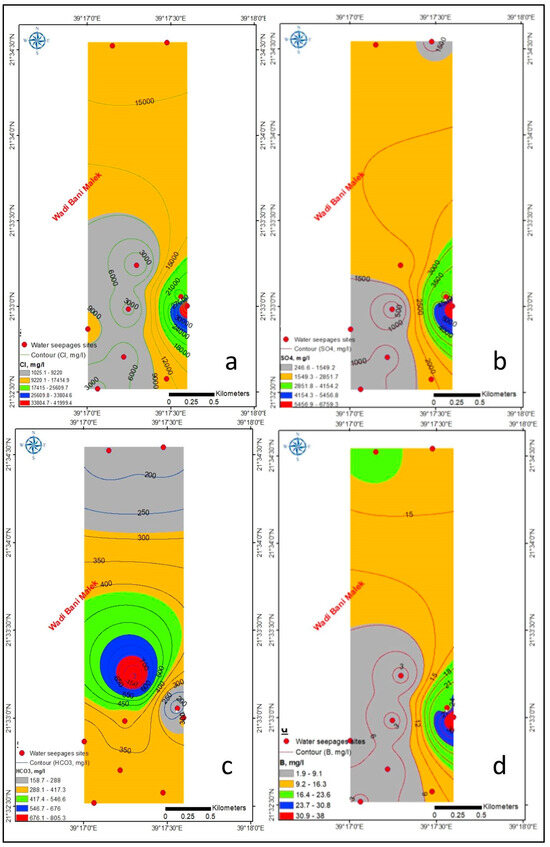
Figure 9.
(a–c) Anion and (d) boron concentrations in water seepages.
Table 3.
Average water quality parameters and their recommended values.
4.1.2. Trace Elements
B concentrations in water seepages were greater (1.9–38 mg/L, Figure 9d) than recommended levels for drinking and agriculture in SA (0.5 mg/L [63]). According to Table 2, the correlation coefficient between TDS and B concentrations was at its highest (0.993), indicating that the B element was used in sanitary and industrial waste dump applications.
According to the authors of [56], the average B concentration in the aquifer in the Lake Misk area was 13.24 mg/L, confirming that groundwater infiltration from the lake into the investigation region was the primary suspect for water seepages. High B content (9.2–16.3 mg/L) was present in the northeast. In contrast, medium B concentration (1.9–9.1 mg/L) was present in the southwest (Figure 9d). Aquifer influx from a high elevation (131 m in the lake region) to a low elevation (60 m in the study area) brought B concentration to the former location, which was near the lake (Figure 4a,b). The permeability of the aquifer in the lake area was 10−3 m/s [56], increasing the flow of contaminants from the lake aquifer to the study area. A very high B concentration (23.7–38 mg/L) was found in the eastern part, indicating the fact that this part receives wastewater from all sides (Figure 9d). In the northeastern region (facing the lake), the Fe concentration rises and reaches > 0.3 mg/L (Figure 10a), exceeding drinking standards [62]. Boron compounds were used to create a variety of anthropogenic pollution sources, including soaps, detergents, bleach, insecticides, fertilizers (borax), glass, and flame retardants. The aquifer, soil, and lake all impact the boron level since the wastewater dump in Lake Al Misk comprises different ratios of the previous chemical sources. Drinking water and seawater had B concentrations of 0.5 mg/L and 2.4 mg/L, respectively [62,63,64]. High B content harms animal reproduction and the brain, liver, stomach, and kidney [62,63,65,66,67,68]. The authors of [69] stated that high B concentrations in drinking and irrigation waters impact environmental health. According to the authors of [56], the Fe concentration in the study region ranged from 0.02 mg/L to 0.47 mg/L (Figure 10a), which is similar to that of the lake aquifer region (0.01–0.91 mg/L).
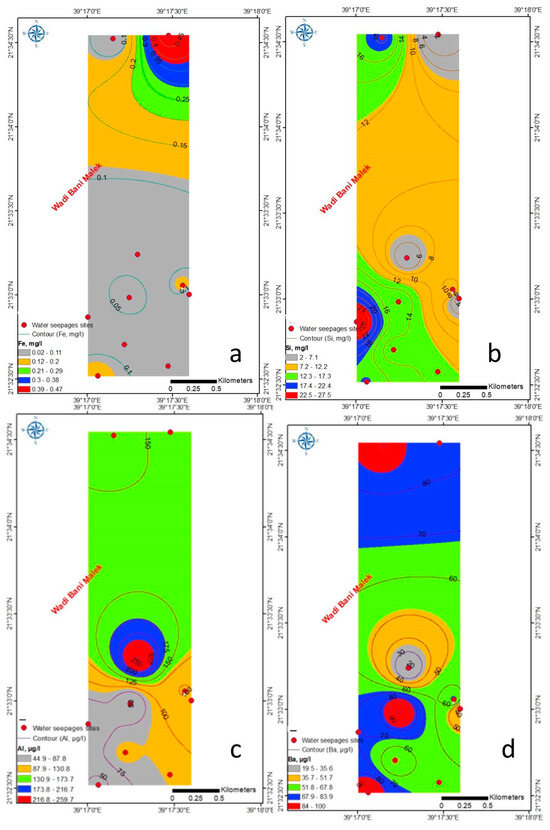
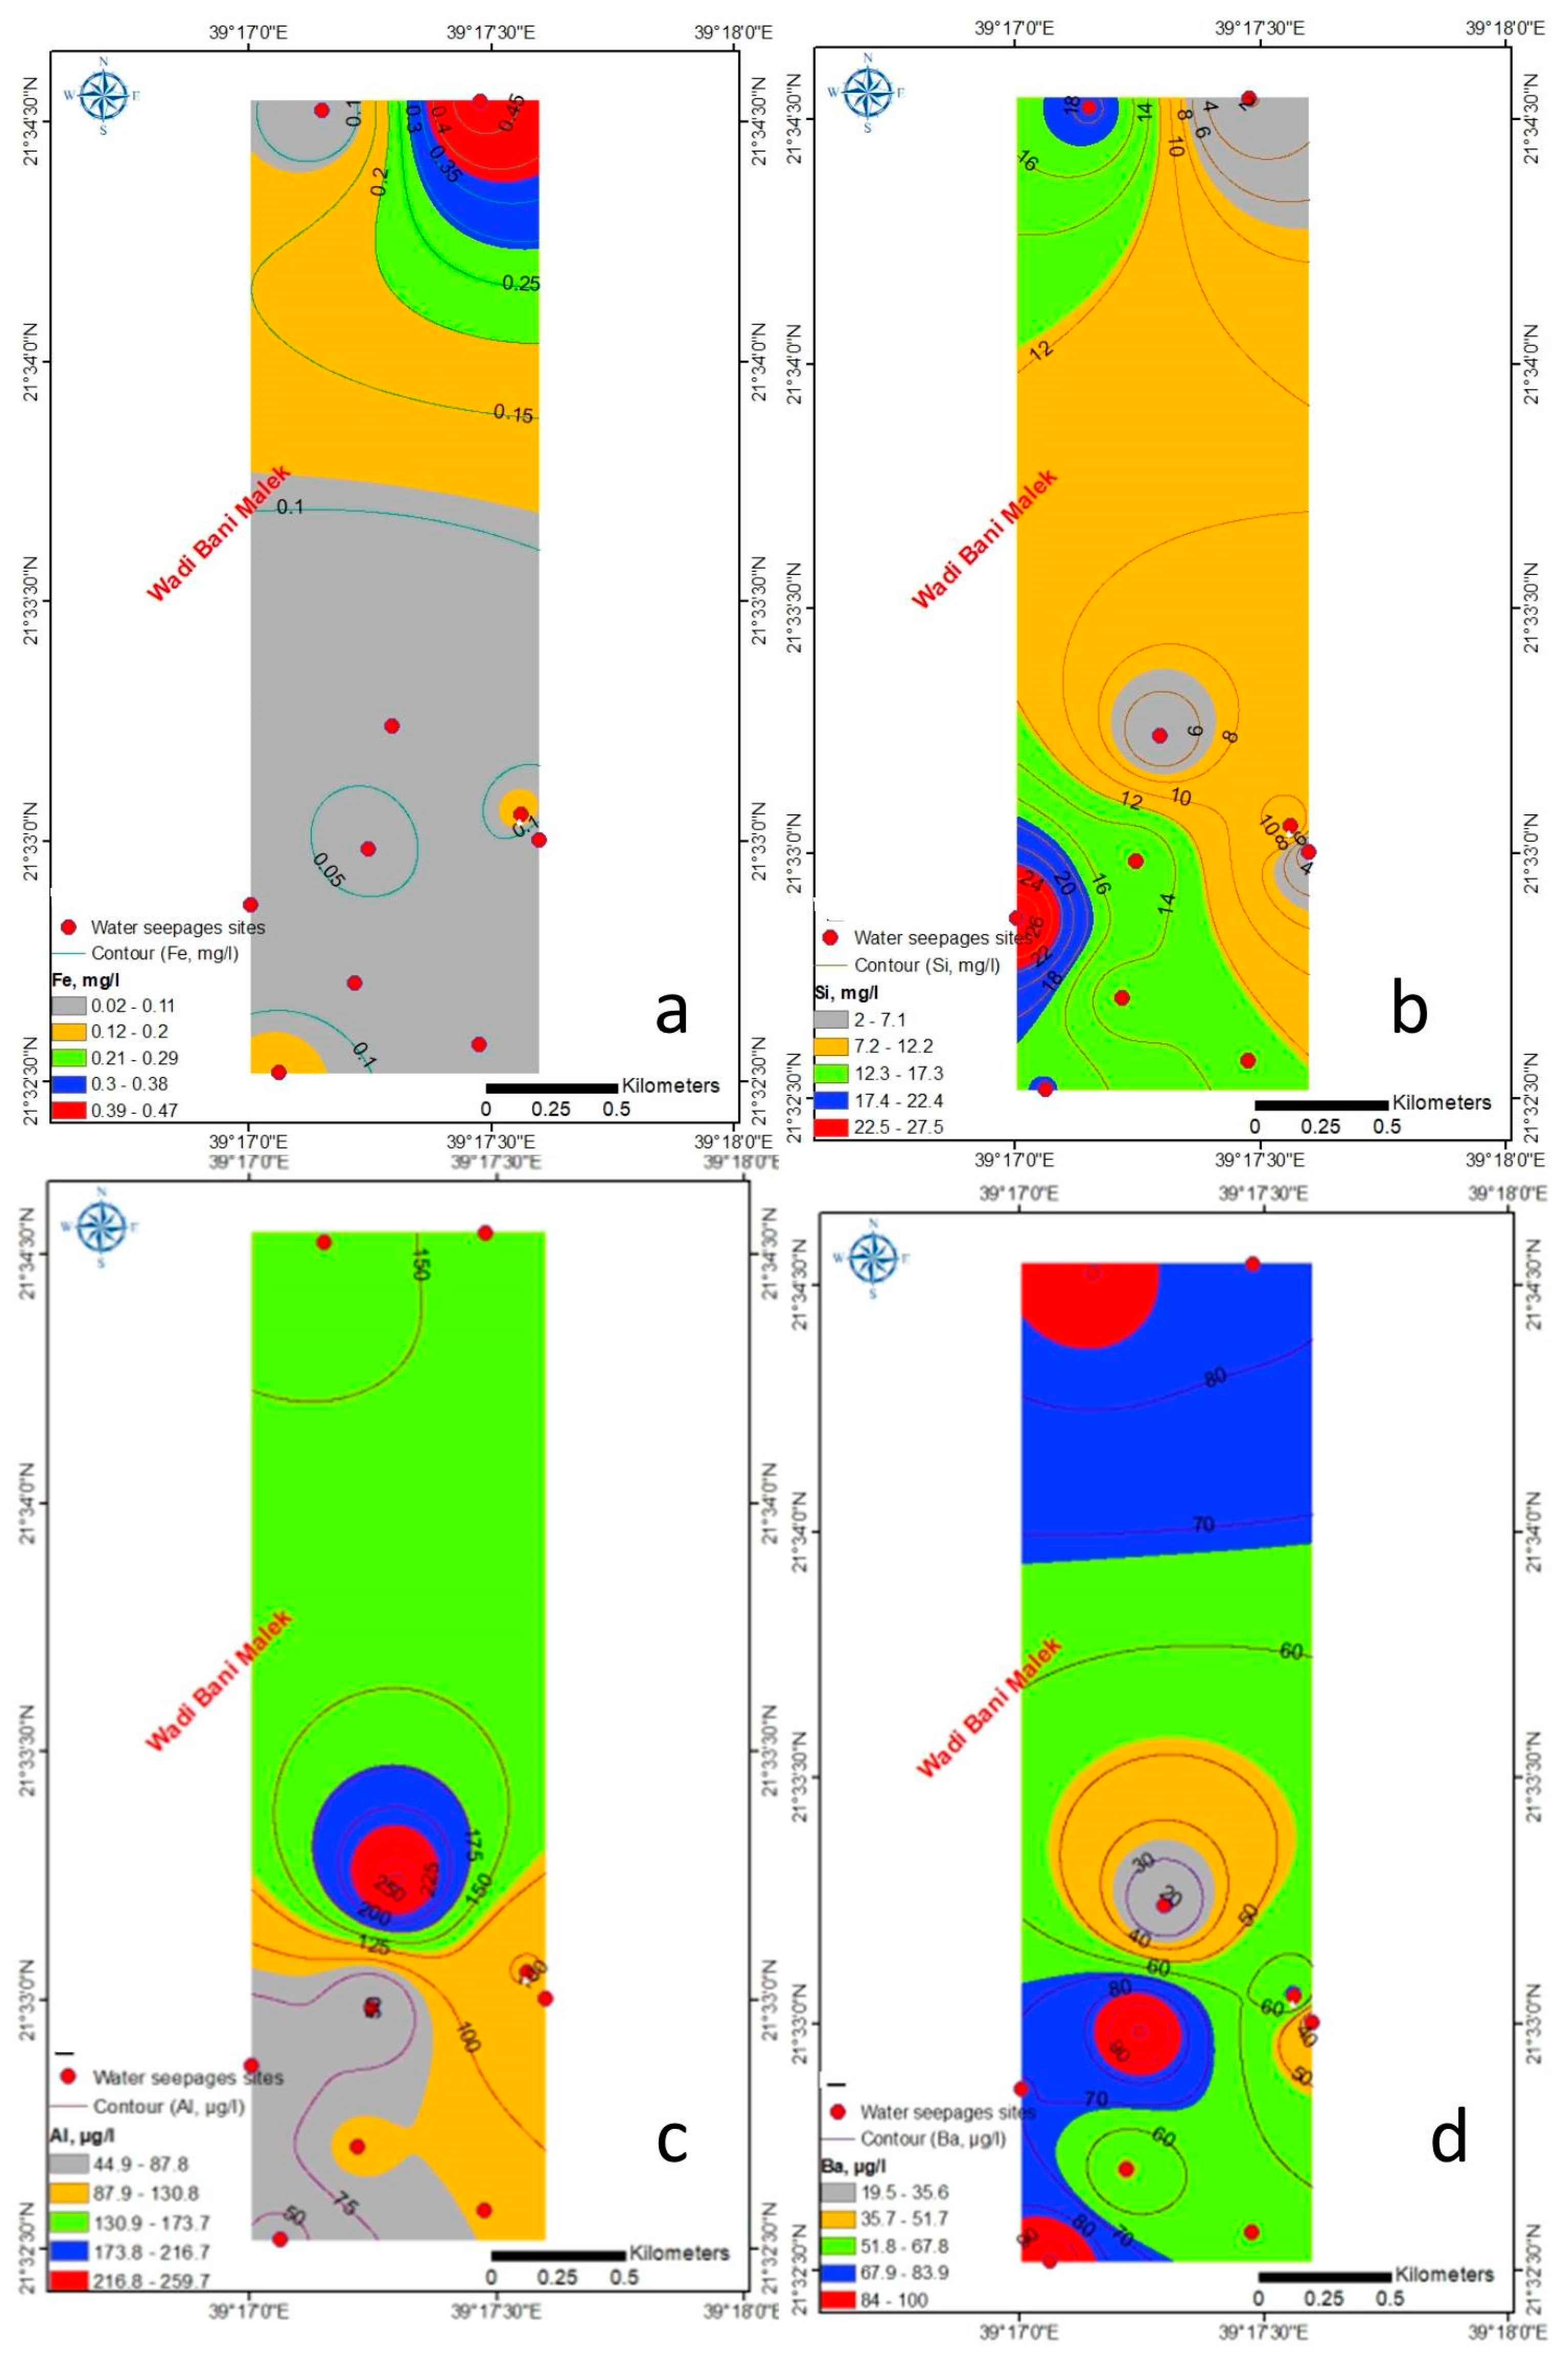
Figure 10.
(a) Fe, (b) Si, (c) Al, and (d) Ba concentration in water seepages.
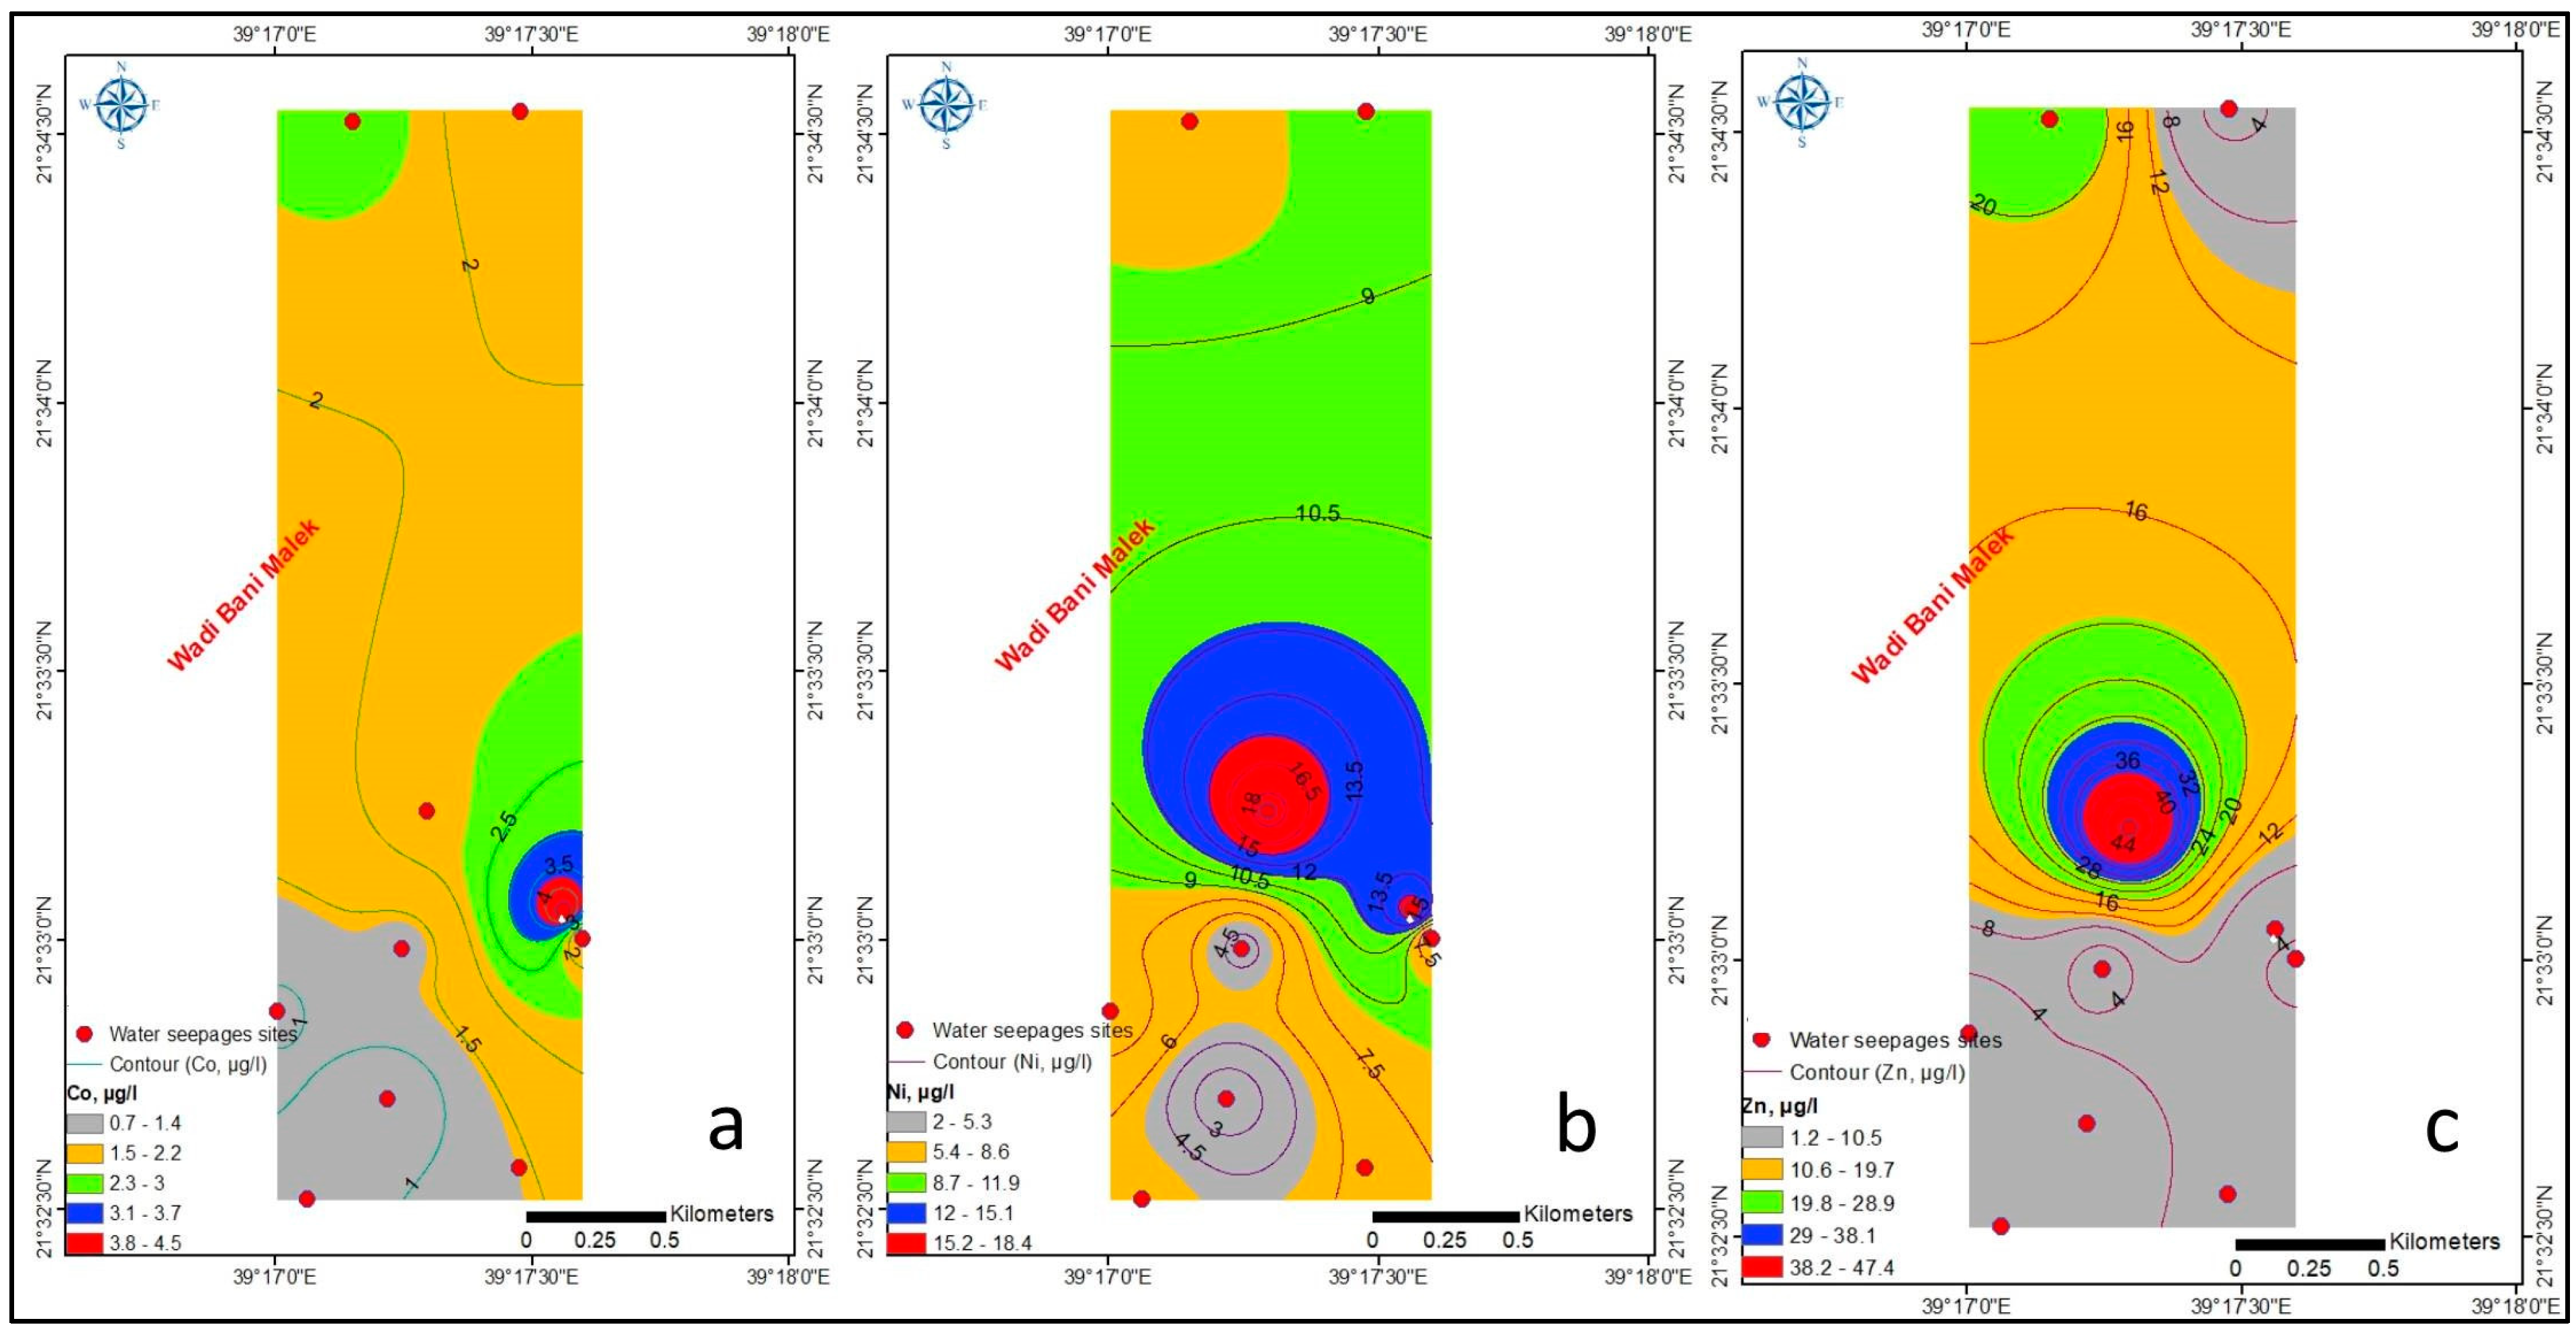
Si and Al concentrations were within the recommended ranges [62] (Figure 10b,c), confirming that these elements have not been released from the alluvium aquifer. They show no lithogenic or human-made pollution caused by the Si and Al content. The sand and gravel were the main grain-size distribution with low amounts of fine-grained material (Figure 11a), confirming the low soil diffusion because of low ion concentration in the mud (silt and clay) sediment. According to Figure 10b, the soils with the highest fine particles and Si concentration show the least amount of soil–water interaction (soil diffusion). Al and Si had a negative correlation (−0.58), confirming the existence of two sources for both elements. Table 2 shows a significant correlation between Al and Zn (0.89), suggesting lithogenic causes for the presence of Zn in water seepages. The Ba concentration distribution is lower than the recommended limit [62] (Figure 10d). It is comparable to the Ba content found in the aquifer in the lake area. Co, Ni, and Zn values were lower (Figure 12) than those recommended by the WHO ([62], Table 3), indicating no pollution due to these elements.

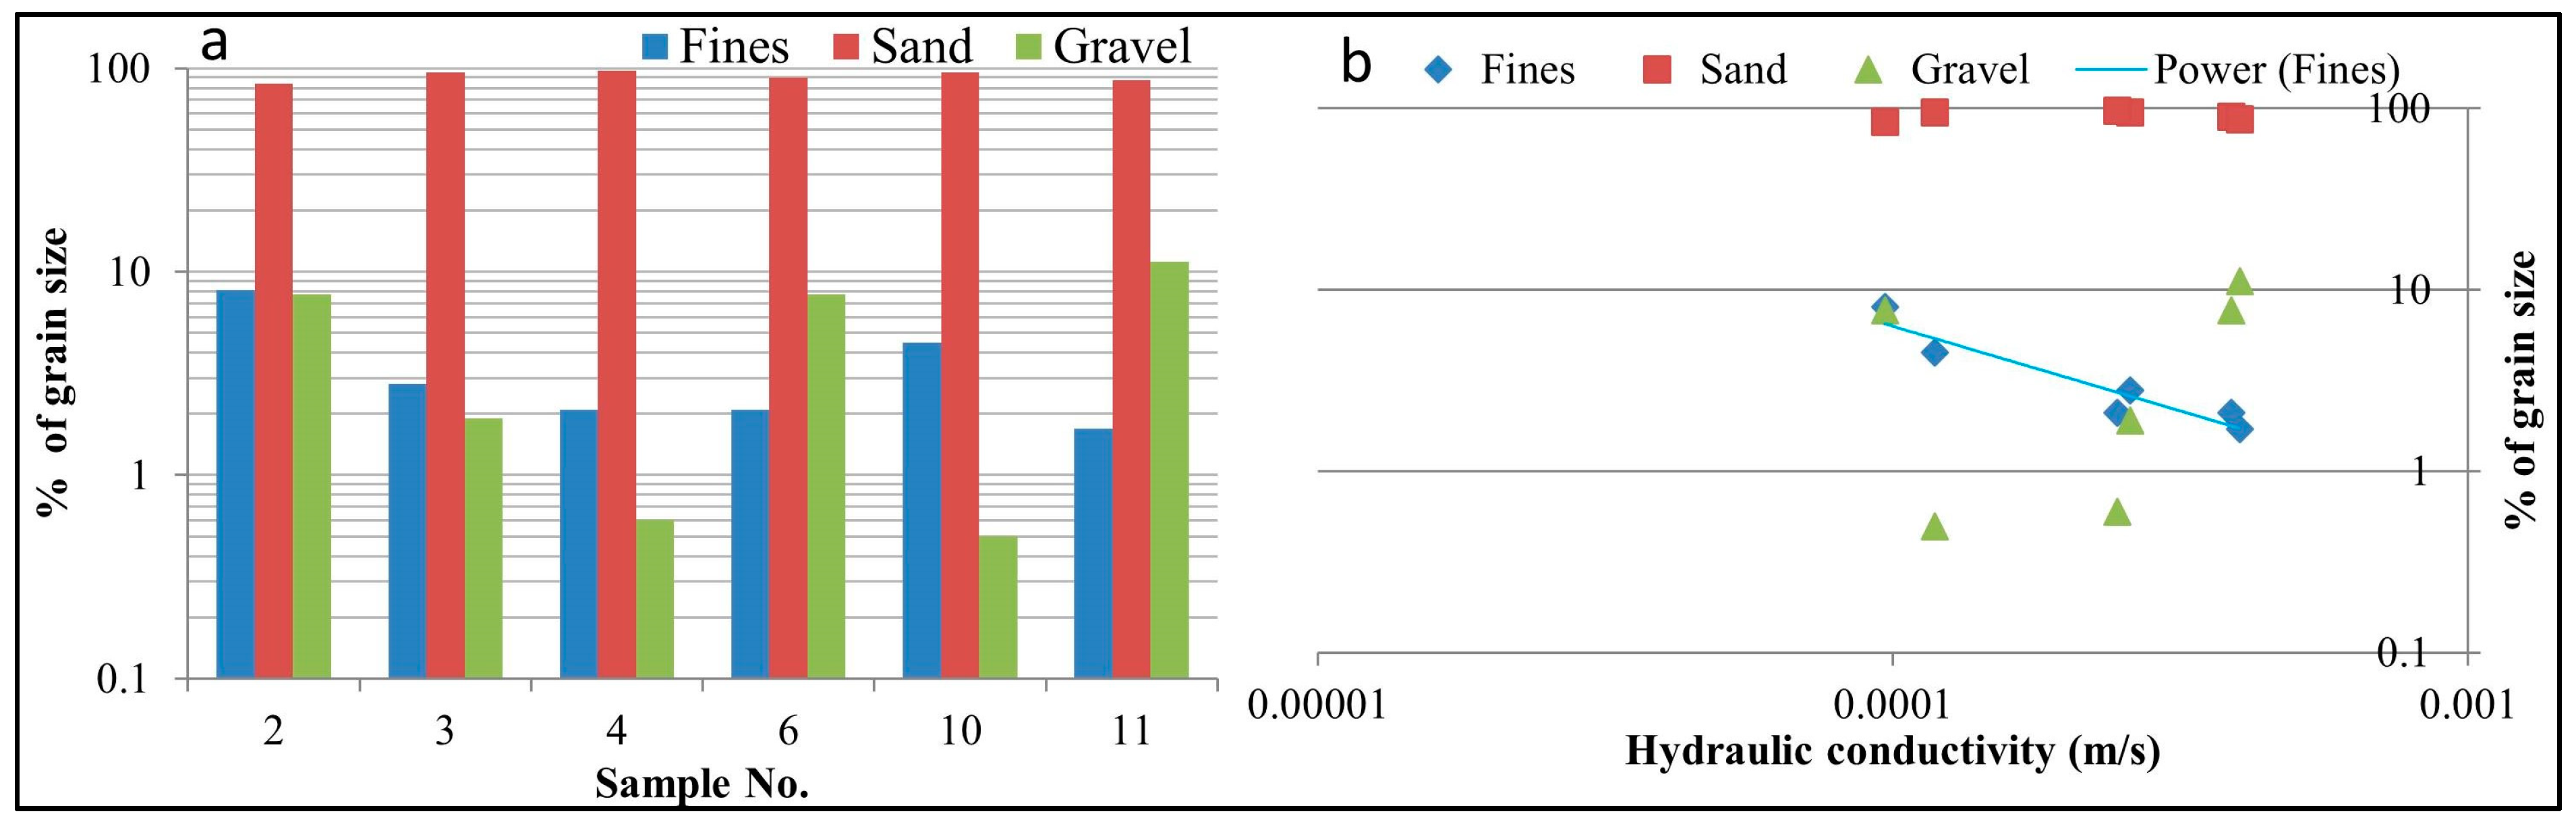
Figure 11.
(a) Percent of sediment fraction and (b) sizes vs. hydraulic conductivity.
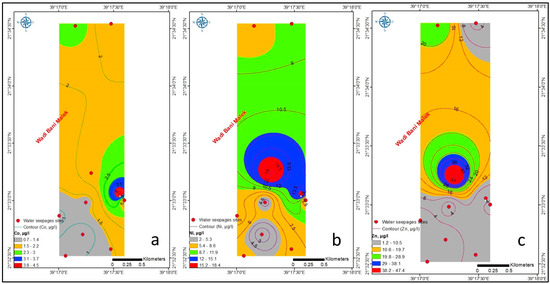
Figure 12.
(a) Co, (b) Ni, and (c) Zn concentrations in water seepages.
The BOD represents the concentrations of soluble organic matter in water. According to [70], the BOD concentrations for extremely clean, clean, and little contaminated waters were 1–2, 3–5, and >5 mg/L, respectively. Water seepages had BOD concentrations ranging from 2.8 mg/L to 11.3 mg/L. BOD was greater than 5 mg/L in samples 5 and 9 but less than 5 mg/L in the remaining samples (Table 4). The sewage dump and aquifer input from the lake area have contaminated samples 5 and 9 with organic compounds. The NO3 concentration ranged from 2.2 mg/L to 35 mg/L in water seepages. The NO32− content of more than 10 mg/L (Table 4) found in some samples reflects the impact on agriculture.
Table 4.
Trace elements contents in water seepages.
Agricultural wastewater had a relatively small contribution to the water seepage issue and, therefore, is not considered the primary suspect. No pollution was found involving As, Cd, Cr, Cu, and Pb because the concentrations (Table 4) were below [62] (Table 3) recommendations. Because wastewater was dumped in the lowest topographic areas, most of the water seepage’s TDS content was high. They went upward, creating marshes, damp soils, and water ponds. The high boron concentration confirms the presence of wastewater from the aquifer in the lake area, which is thought to be the primary suspect in water seepages. The Lake Misk area wastewater dump inflow impacted the northern portion of the study region. The TDS and B concentrations in Lake Al Misk’s aquifer were similar to the levels of water seepage. The inflow of the aquifer from Lake Al Misk (131 m elevation) into the lowest topographic parts (area under investigation, 60 m elevation) is confirmed as the primary suspect for the water contribution into the study area. Saline groundwater seepages have developed by polluted groundwater migrating through higher permeability in the Lake Al Misk area (order of 10−3 m/s) and then forced to discharge at the lowest topographic areas (area under interest). The medium hydraulic conductivity in the study area (9 × 10⁻⁵ m/s to 4 × 10⁻⁴ m/s), topographic contrast (Figure 7d), and lineament density (Figure 4) may also drive groundwater in the lake area to flow to the surface, resulting in waterlogging conditions and soil salinization.
4.2. Grain Size Analysis
The grain size distribution of soils, which make up the top part of the aquifer, affects how long contaminants take to enter the aquifer. The adsorption of hazardous metals is enhanced and maintained by soils’ greater fine grain size concentration. Low sorption–desorption reactions occur in conjunction with a drop in the contents of fine-grained materials in the soil. The soil’s permeability is what causes the majority of wastewater poisoning of aquifers. Hydraulic conductivity is governed by the grain sizes and effective sizes of the soils [71,72]. The coefficient of uniformity (Cu); coefficient of curvature (Cc); sorting coefficient (C); and particle sizes—D10, D25, D30, D50, D60, and D75 in mm, as well as 10%, 25%, 30%, 60%, and 75% by weight of soil, passing the corresponding sieve sizes, were used to describe particle size distribution [72,73]. D10 is the sieve size where 10% of the material passes (which is 10% finer than the size), D30 is the size where 30% of the material passes (30% finer than the size), and D60 is the size where 60% of the material passes (which is 60% finer than the size).
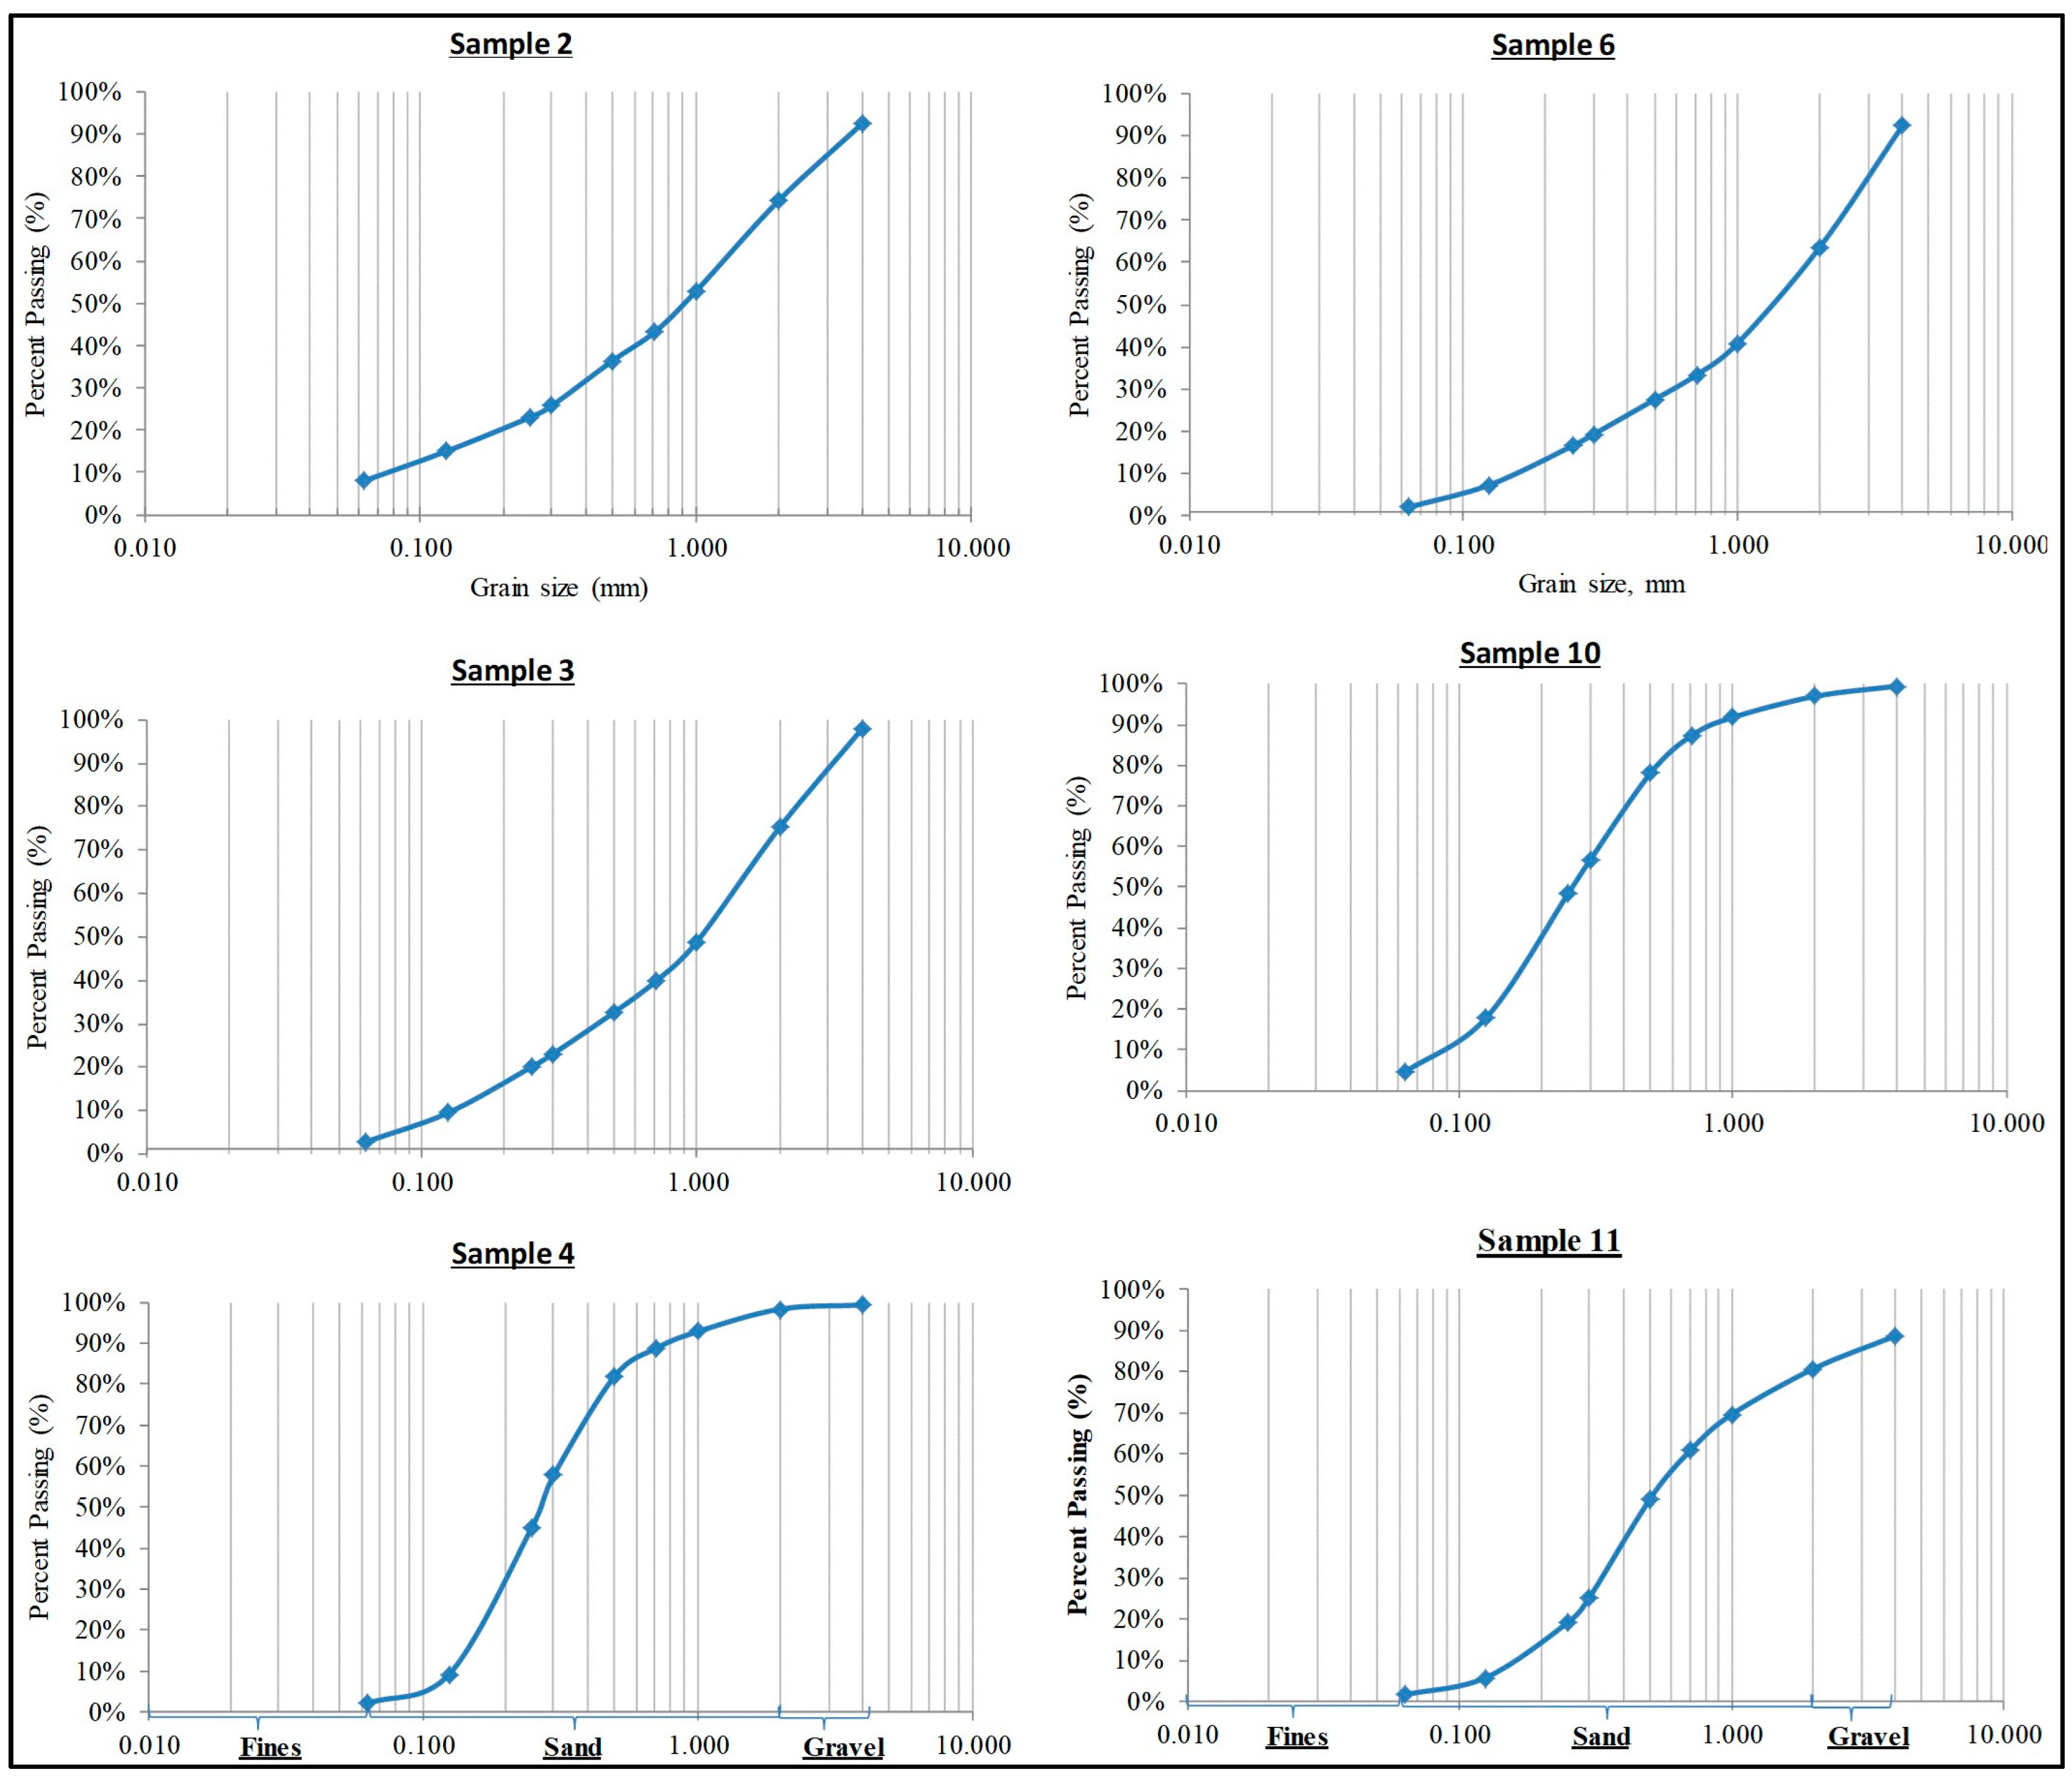
Figure 13 depicts the particle size distribution curves. Gravel is separated into the 0.06–2 mm and >2 mm sieve sizes. The fine-grain size, in contrast, is measured below 0.06 mm (Figure 13). According to the granulometric analysis, the major particle concentration was sand, which was followed by gravel and a very low concentration of fine-grained material (Figure 11a).
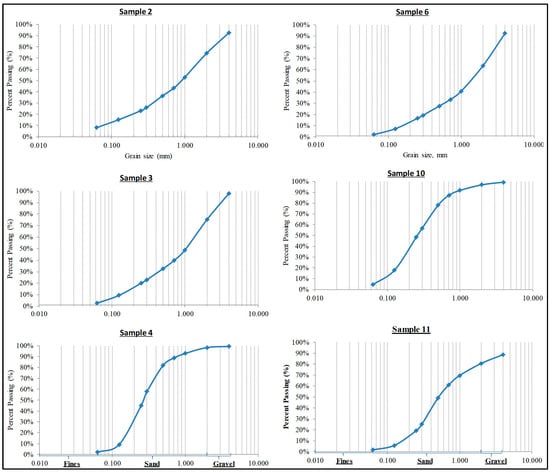
Figure 13.
Particle size distribution curves of soil samples.
The soil samples were sandy as a result. The particle sizes indices (Table 5) are determined by the particle sizes vs. the % passing plot (Figure 13). Factors Cu and Cc described the slope of the particle size distribution curve and the soil gradation, respectively. Refs. [72,74] established the following equations for the particle size indices.
Cu = D60/D10
Cc = (D30)2/D60 × D10
C = (D75/D25)1/2
K (hydraulic conductivity in m/d) = C (constant is 1300) × (D10)2
Table 5.
Particle size indices of the soil samples.
The Cu values of 10.9 and 11.5 in samples 3 and 6, respectively, point to well-graded soil or soil having a distribution of particles over a wide range. Sample 2 has a Cu value of 16.7, which clarifies a significantly higher value, meaning that the largest grain size in the soil sample is huge compared to the lowest size grain. The Cu values for samples 4, 10, and 11 are 2.5, 3.74, and 4.21, respectively (Table 5), indicating a homogenous soil with a relatively small range of particle sizes (poorly graded soils). Cc values of the soil samples ranged between 1 and 3, confirming well-graded soil. Regardless of the size of the sand and gravel particles, the hydraulic conductivity value decreases as the percentage of fine grain size increases (Figure 11b).
4.3. Infiltration Test
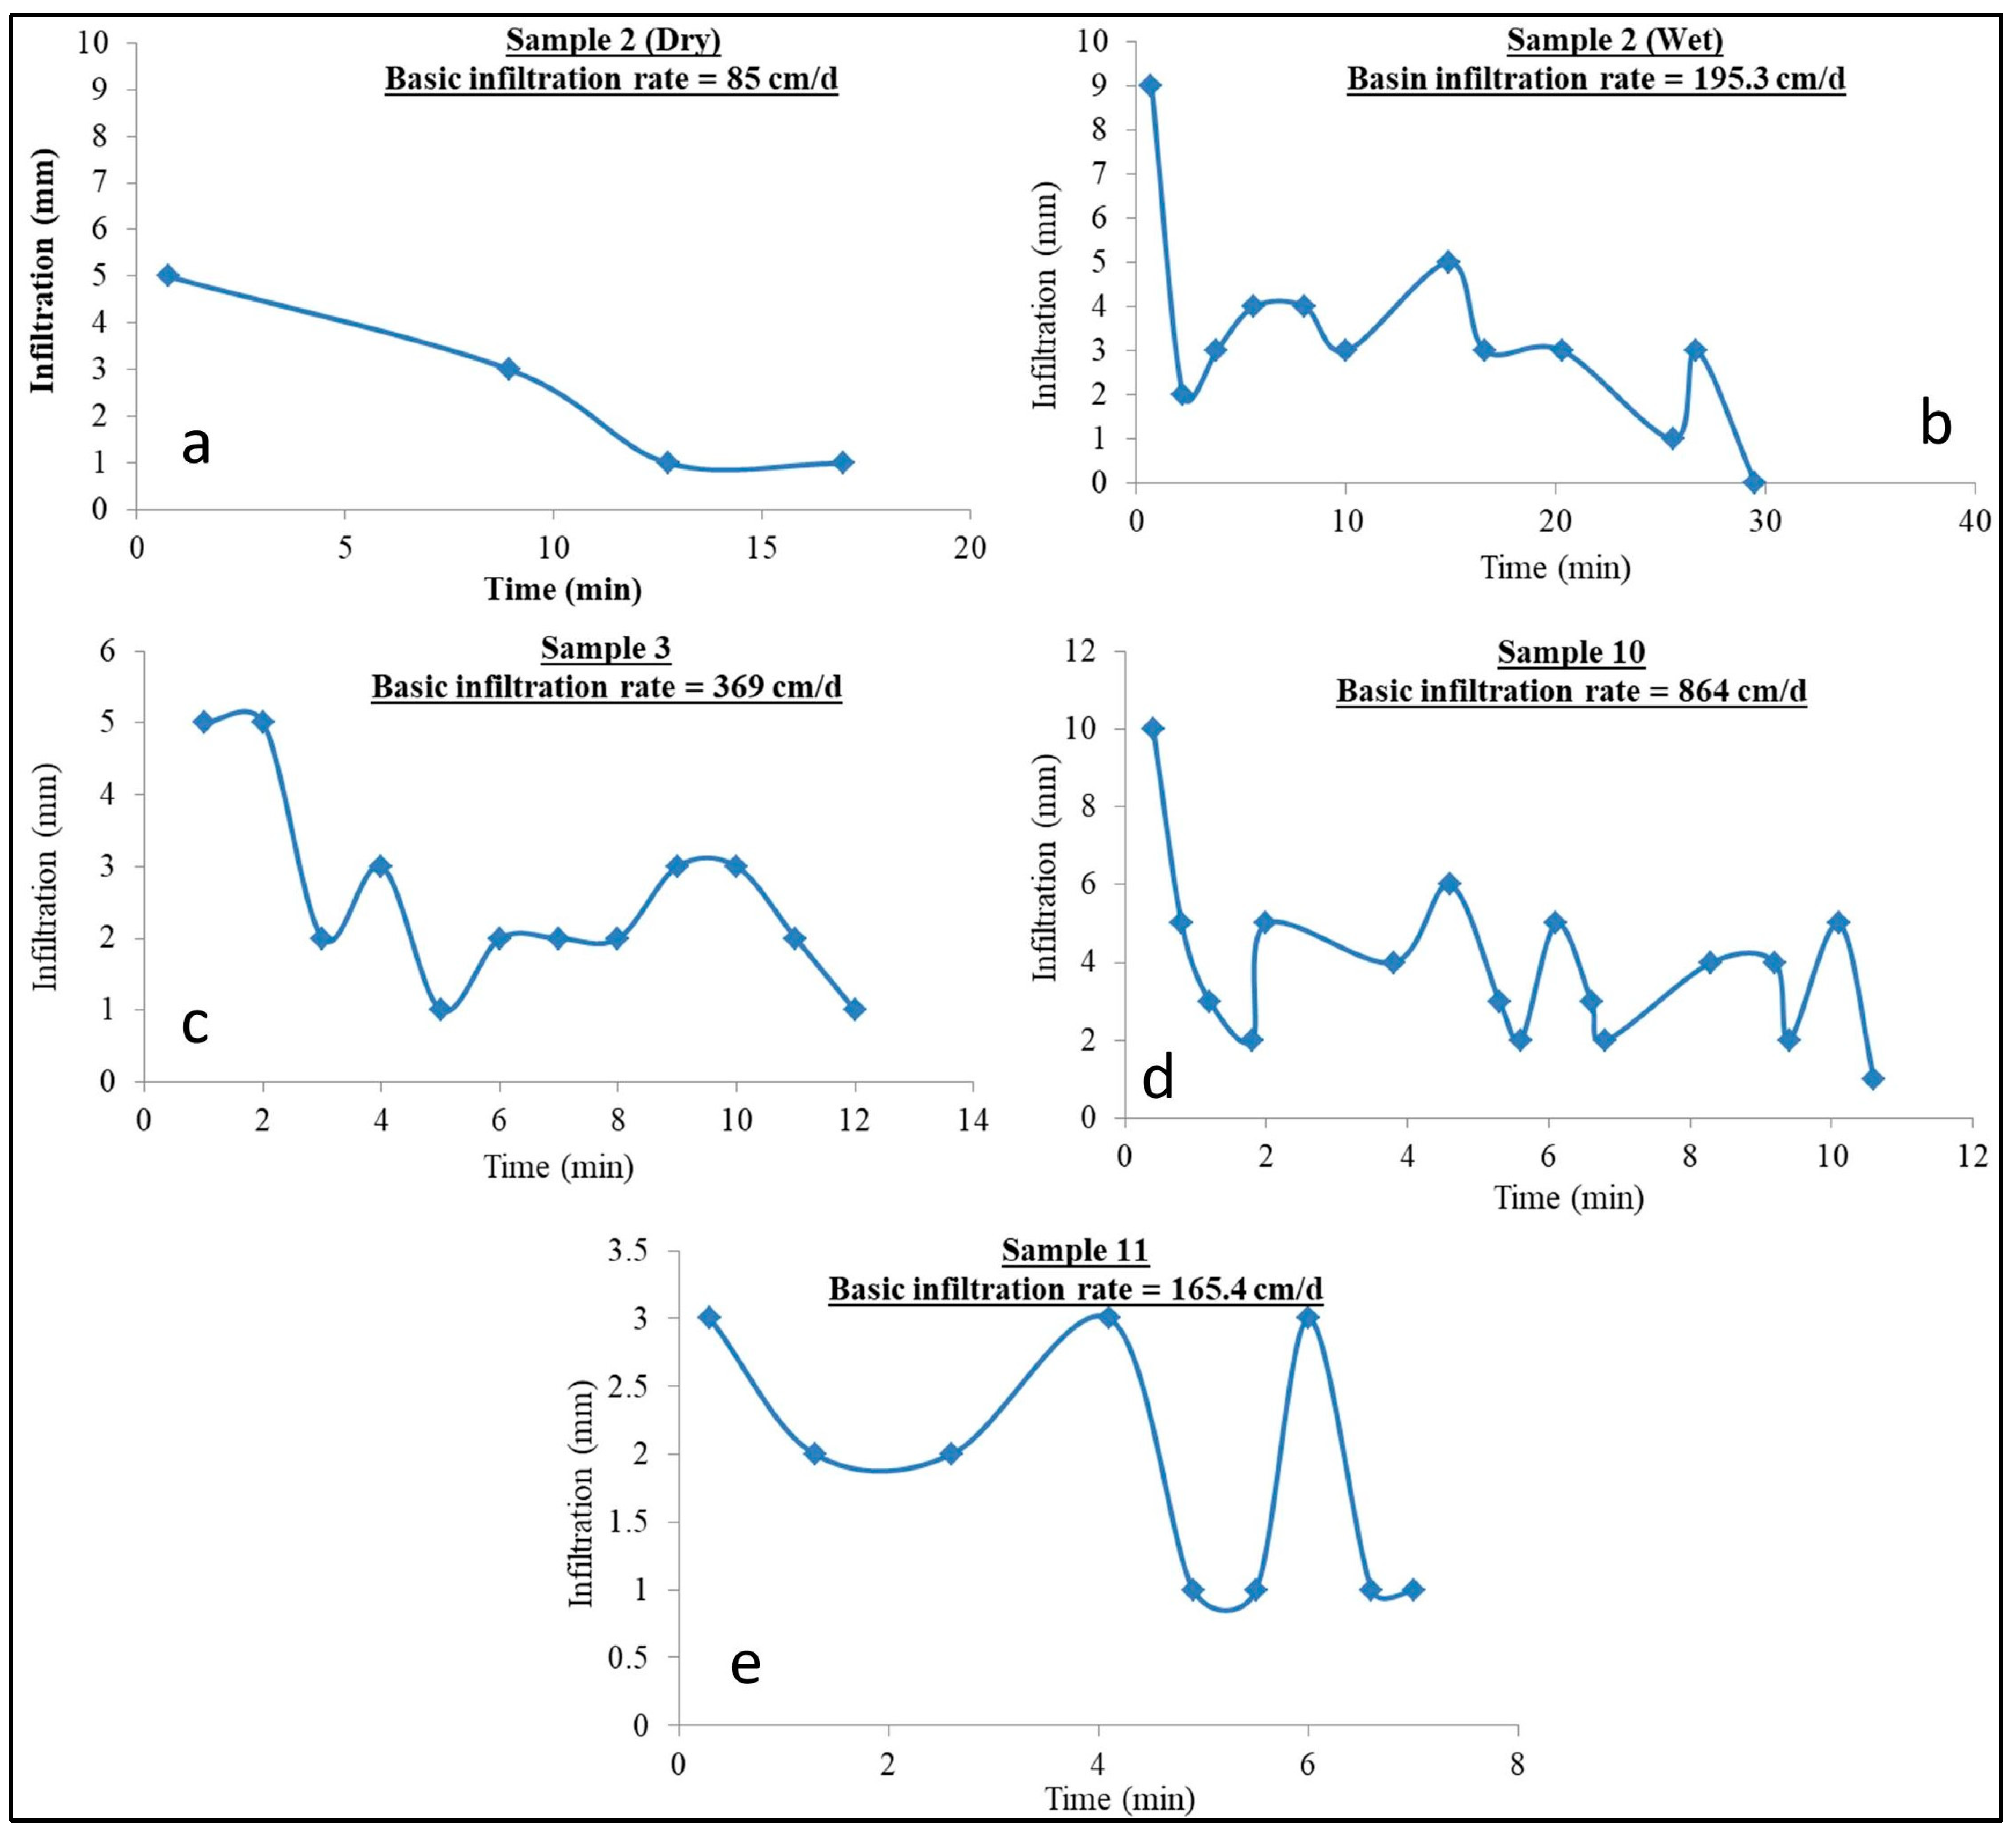
Infiltration refers to the hydrological process through which water permeates into the soil, and its occurrence is contingent upon the quantity of precipitation received and the geological characteristics of the soil. The system controls surface flow [75] and regulates flood behavior [76]. The leakage rate has implications for both natural and anthropogenic aquifer recharge processes, and it influences the quality of water within the soil. According to the authors of [77], there is an inverse relationship between the infiltration rate in the soil and the soil’s water-holding capacity. Except for sample 2 (dry), all of the samples exhibited a significant reduction or elevation in the leakage rate, as depicted in Figure 14b,d. The observed heterogeneity in leakage rate (Figure 13) was hypothesized to be attributable to the substantial presence of sand and gravel in the soil composition. The fundamental infiltration rate exhibited variability ranging from 85 cm/d to 864 cm/d, with a mean value of 336 cm/d, as depicted in Figure 14. The second sample showed the lowest basic infiltration rate. This characteristic can be attributed to the soil sample containing the largest concentration of fine-grain particles, as depicted in Figure 14a,b. The potential for increased infiltration is suggested by the observation that the rate of leakage in dry sample 2 (Figure 14a) is lower compared to the wet sample (Figure 14b). This discrepancy may be attributed to the presence of moist soil conditions. The observed soil samples exhibited robust infiltration due to their high concentration of sand and gravel, coupled with a low concentration of fine-grain particles. The primary factor contributing to the occurrence of water seepages in these areas was hypothesized to be infiltration rates ranging from moderate to high, occurring in both uphill and downhill directions.
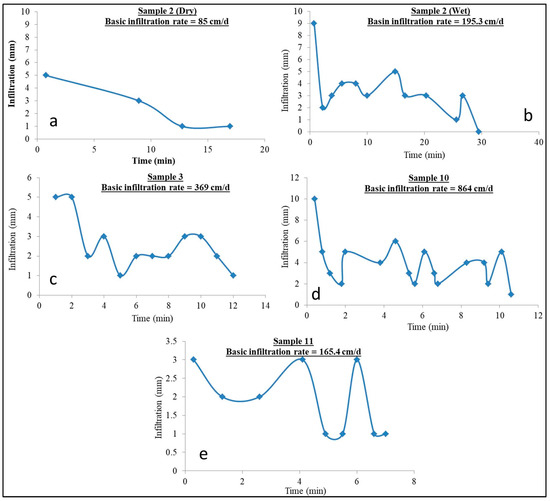
Figure 14.
Infiltration rate vs. time of soil samples (a) sample 2 “dry”, (b) sample 2 “wet”, (c) sample 3, (d) sample 10 and (e) sample 11.
4.4. Landsat Oli 8 Band Ratio (BR) and Color Composite Images
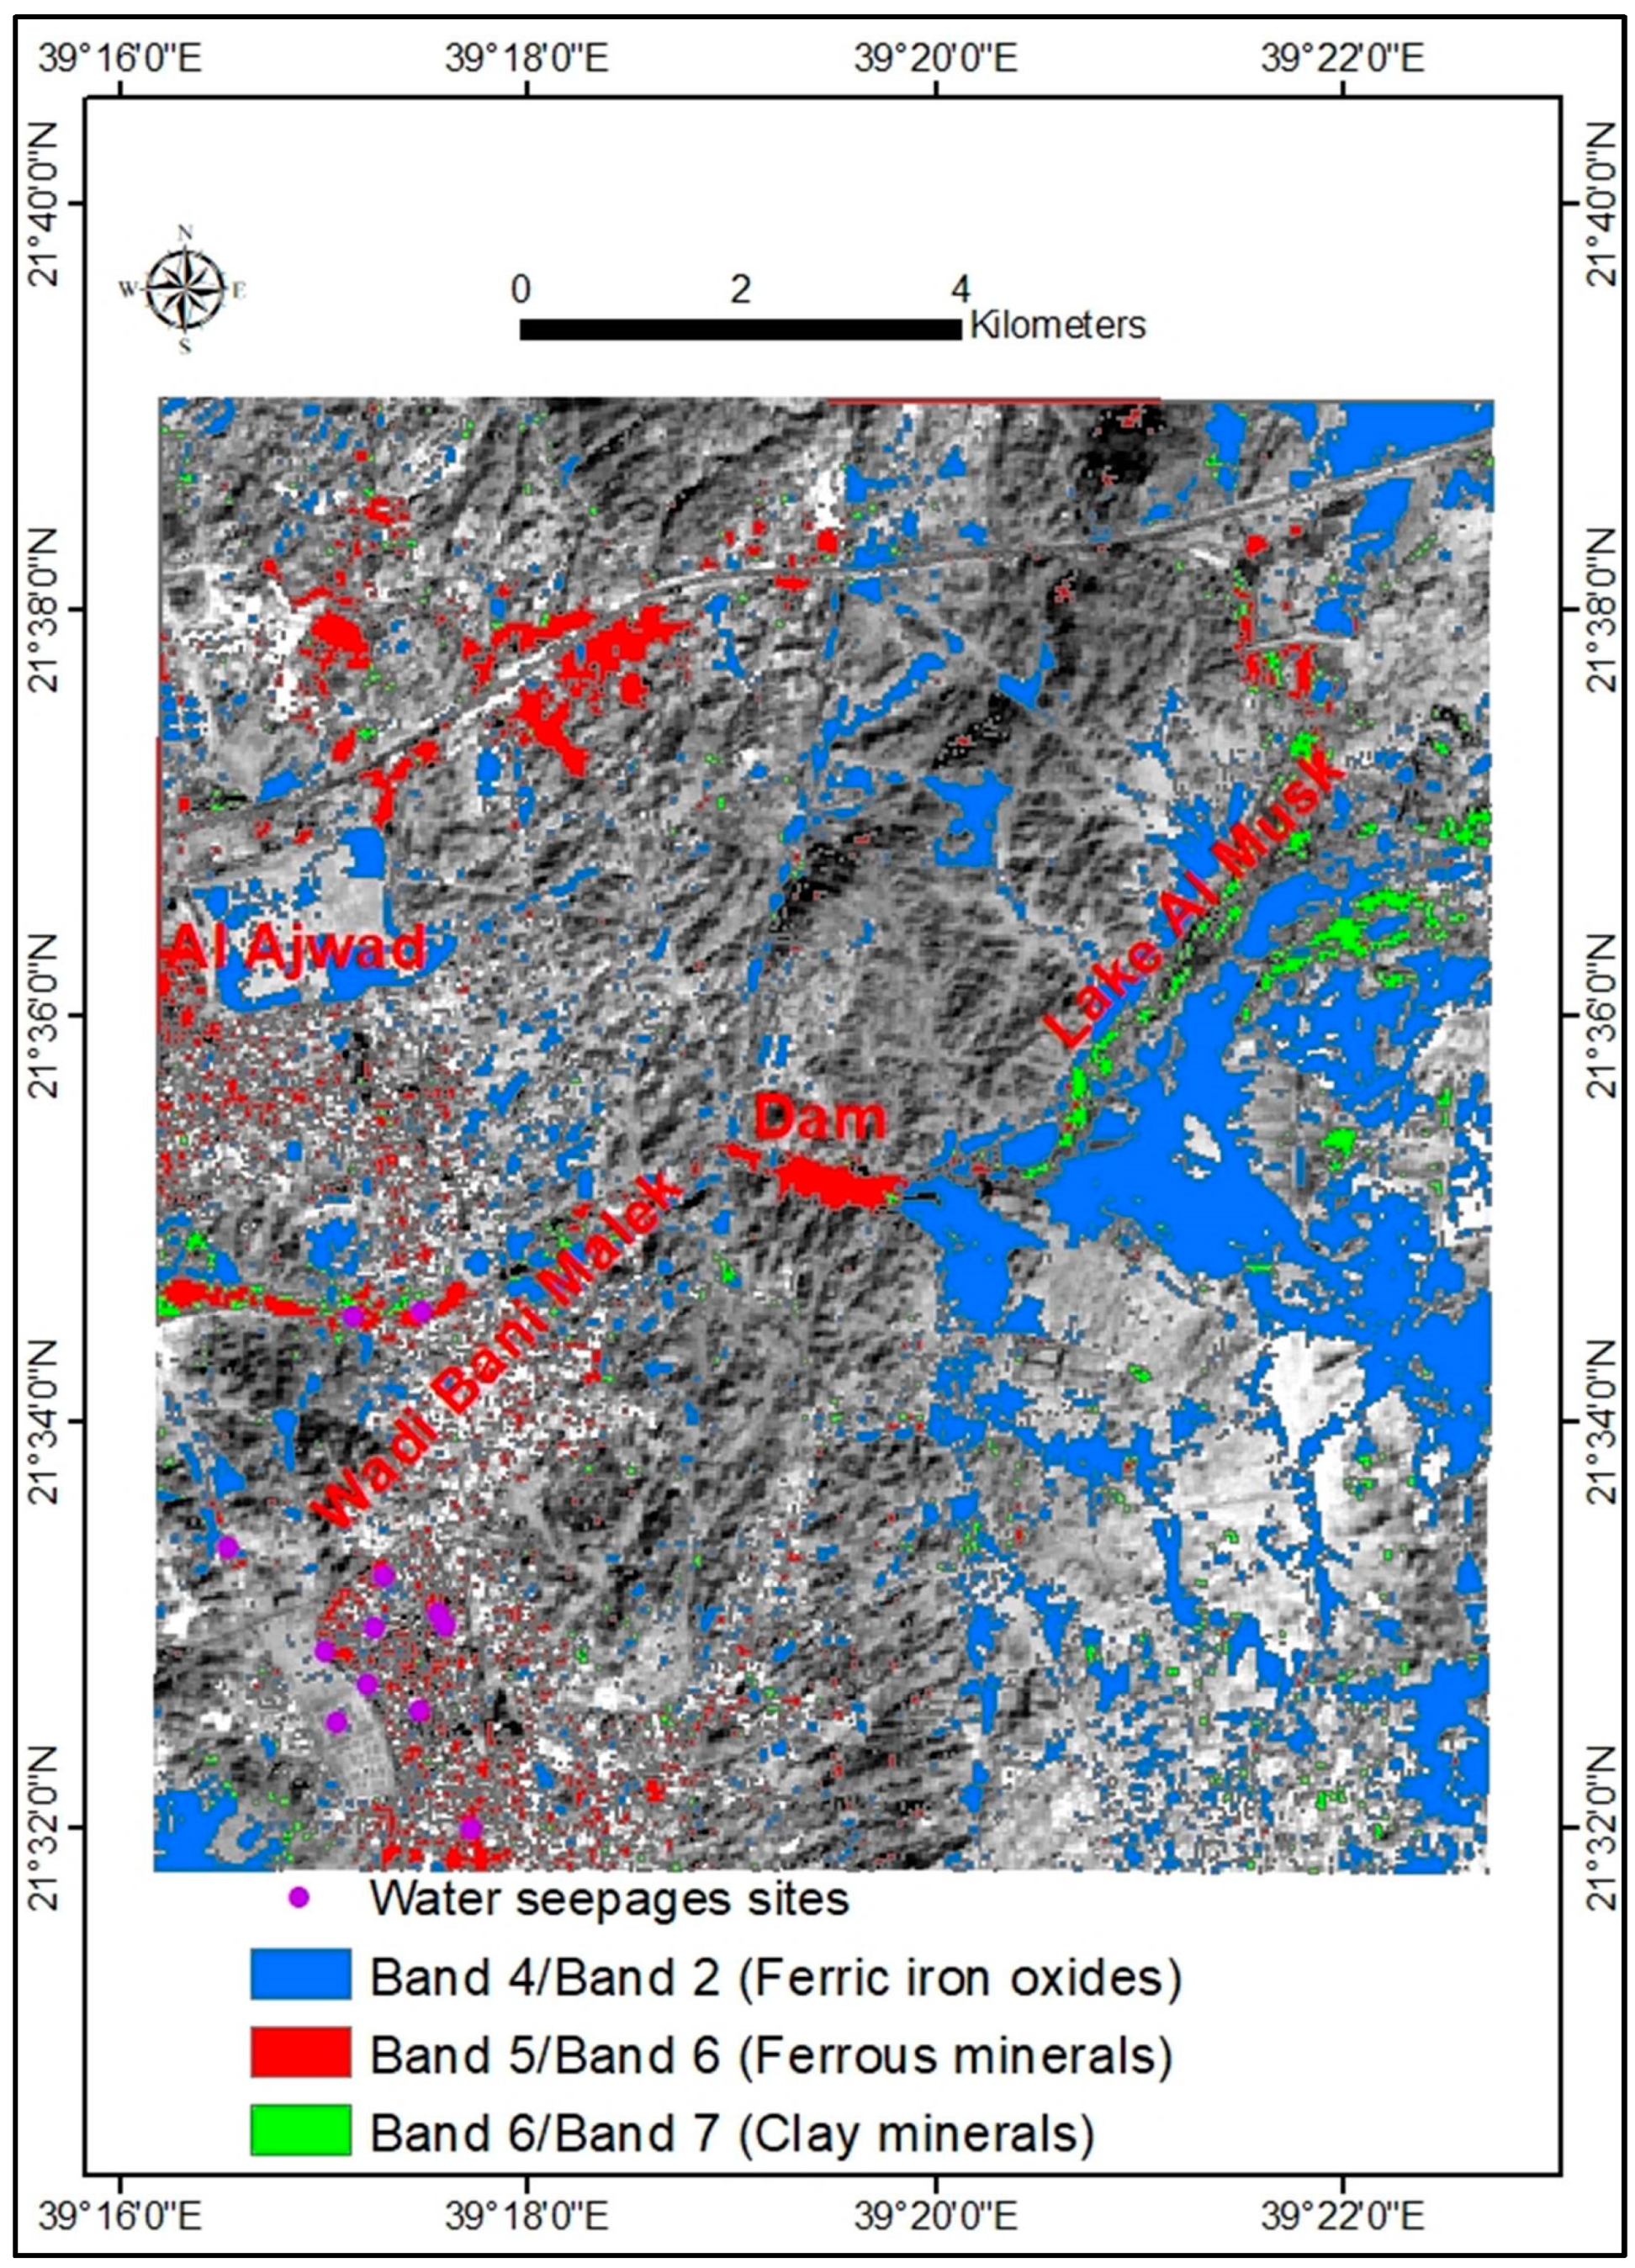
The most frequent alteration is the breakdown of feldspar and ferromagnesian minerals into different clays and other hydroxyl-bearing minerals. Since these minerals’ spectra exhibit absorption in the short-wave infrared (SWIR) band, remote sensing techniques can identify them [78]. Additionally, many ore occurrences contain ferric hydroxides and complex sulfate (SO42−), both are intensely colored and have crystal field absorption in the visible and near-infrared range (VNIR) [78,79]. Pyrite (FeS2), in particular, is a sulfide mineral that breaks down to sulfuric acid. This group of alteration signatures made the delineation of numerous hydrothermal ore deposits possible [78]. It has been well established that ferric iron exhibits pronounced absorption features at around 0.82 μm and 0.35 μm, whereas ferrous iron has absorption at 1.0, 4.8–2.0, and 0.55–0.45. Clays and other hydroxyl-bearing minerals exhibit substantial absorption at 1.9, 2.35, and 2.5 [80].
The minerals above have been utilized as a prospecting guide for ore deposits. Due to its absorption in the blue region and strong reflection in the red, the ratio 4/2 helps map ferric iron oxides. Due to the strong reflectance of these minerals in this ratio, the ratio 5/6 was chosen for mapping ferrous minerals. In this work, the kaolinite, montmorillonite, and clay minerals were mapped using the ratio 6/7. In band 6 of the Landsat 8 image, all of these features have a high reflectance, while band 7 has a low reflectance. The histogram of the threshold anomalies for the three band ratios of clay minerals and iron oxides substitutes the grayscale in the color density slice version of the band ratio images.
The RGB colors represent ferric iron oxides, ferrous iron oxides, and clay minerals. The statistical results of the band ratios 4/2, 5/6, and 6/7 in the Envi 5.1 software can be used to estimate the threshold values. The background (threshold) values and the expected anomalies of each band ratio image can be obtained using one of the following equations.
where M is the mean pixel reflectance value, SD is the standard deviation, and TH is the threshold pixel reflectance value.
TH = M + Sd at confidence 92%
TH = M + 2 × Sd at confidence 95%
TH = M + 3 × Sd at confidence 95%
The results are summarized in Table 6. The band ratios 4/2, 5/6, and 6/7 give the best output for determining ferrugination, ferromagnesian, and OH-bearing and CO₃2− minerals, respectively (Figure 15). This is because the FeO (ferrous minerals) charge transfer transition is characterized by a broad absorption band at a wavelength of less than 0.55 µm.
Table 6.
Results of reflectance from statistical outputs.

Figure 15.
Iron-bearing rocks.
This is responsible for the strong red coloration of rocks rich in iron oxides and hydroxides (Figure 15), which are concentrated in the southeastern parts and distributed in the northwestern area (Figure 15). Basalt had a high FeO concentration (5–14 wt%). In contrast, andesite rocks have a lower FeO concentration. The ferric iron oxides are primarily found in the eastern region and are dispersed over the western area (Figure 15). The northern portion contains clay minerals (Figure 15).
5. Conclusions and Recommendations
Water discharge has resulted in saturated regions and dryland salinization, impacting agricultural practices within the catchment area. The EC and TDS concentrations of water seepages range from 3800 to 90,999 µS/cm and from 1880 to 54,499 ppm, respectively. The concentrations of B and Fe ranged from 1.9 to 38 mg/L and from 0.02 to 0.47 mg/L, respectively. The low quantities of Si, Al, Co, Ni, Zn, As, Cd, Cr, Cu, and Pb in water seepage suggest the absence of pollution concerning these elements. The NO32− concentration exhibited a range of 2.2 to 35 mg/L, indicating moderate agricultural influence. The hydrogeochemistry of water seepage showed similarities to the Lake Al Misk region aquifer. The findings support the hypothesis that the primary water source in the study area was the inflow of the aquifer from Lake Al Misk, located at an altitude of 131 m, into the lowest topographic region (study area), which is situated at an elevation of 60 m. The granulometric analysis results revealed that the sample’s predominant particle size was sand, with gravel and fine-grained particles present in lower concentrations. The water seepages in these regions were primarily ascribed to infiltration rates that ranged from modest to high, occurring in either an uphill or downward direction. The concentration of the FeO mineral in basalt exhibited a notable elevation, ranging from 5 to 14 wt%.
Conversely, a reduction in FeO mineral concentration was seen in andesite rocks. The concentration of the phenomenon is primarily observed in the southern regions, although its distribution extends to the northern area. The drainage project in the Al Tayseer neighborhood encountered challenges related to mixing several types of water, including precipitation and seepage. Saline water seepages and rainwater infiltration contribute to the degradation of rainwater quality. To effectively utilize the gathered rainwater resource, it is advisable to segregate the two distinct types of water. It is recommended to create and design a network of piezometers to monitor fluctuations in groundwater levels. Consequently, individuals can strategically identify optimal locations for dewatering to mitigate groundwater levels effectively.
Author Contributions
Conceptualization, M.E. and M.Y.A.K.; methodology, M.E. and K.A.; software, M.E.; validation, M.E.; writing—original draft preparation, M.Y.A.K. and M.E.; writing—review and editing, M.Y.A.K., C.B.P., A.M.S. and F.T. All authors have read and agreed to the published version of the manuscript.
Funding
The Deanship of Scientific Research (DSR) at King Abdulaziz University, Jeddah, Saudi Arabia has funded this project, under grant no. (KEP-2-155-42).
Data Availability Statement
Not applicable.
Acknowledgments
This project was funded by the Deanship of Scientific Research (DSR) at King Abdulaziz University Jeddah, Saudi Arabia, under grant no. KEP-2-155-42. The authors, therefore, acknowledge with thanks the DSR for technical and financial support.
Conflicts of Interest
The authors declare no conflict of interest.
References
- Dehbandi, R.; Abbasnejad, A.; Karimi, Z.; Herath, I.; Bundschuh, J. Hydrogeochemical controls on arsenic mobility in an arid inland basin, southeast of Iran: The role of alkaline conditions and salt water intrusion. Environ. Pollut. 2019, 249, 910–922. [Google Scholar] [CrossRef]
- Morris, B.L.; Lawrence, A.R.L.; Chilton, P.J.C.; Adams, B.; Calow, R.C.; Klinck, B.A. Groundwater and Its Susceptibility to Degradation: A Global Assessment of the Problemand Options for Management: Early Warning and Assessment Report Series; United Nations Environment Programme: Nairobi, Kenya, 2003. [Google Scholar]
- van Loon, G.W.; Duffy, S.J. Environmental Chemistry: A Global Perspective, 3rd ed.; Oxford University Press: Oxford, UK, 2011. [Google Scholar]
- Khan, M.Y.A.; ElKashouty, M.; Bob, M. Impact of rapid urbanization and tourism on the groundwater quality in Al Madinah city, Saudi Arabia: A monitoring and modeling approach. Arab. J. Geosci. 2020, 13, 922. [Google Scholar] [CrossRef]
- Bovolo, C.I.; Parkin, G.; Sophocleous, M. Groundwater resources, climate and vulnerability. Environ. Res. Lett. 2009, 4, 035001. [Google Scholar] [CrossRef]
- Gleick, P.H. China and Water. In The World’s Water 2008–2009: The Biennial Report on Freshwater Resources; Gelick, P.H., Morikawa, C.M., Palaniappan, M., Morrison, J., Cohen, M.J., Eds.; Island Press: Washington, DC, USA, 2009. [Google Scholar]
- Jago-on, K.A.B.; Siringan, F.P.; Balangue-Tarriela, R.; Taniguchi, M.; Reyes, Y.K.; Lloren, R.; Peña, M.A.; Bagalihog, E. Hot spring resort development in Laguna Province, Phillppines: Challenges in water use regulation. J. Hydrol. 2017, 11, 96–106. [Google Scholar]
- Lapworth, D.J.; Krishan, G.; MacDonald, A.M.; Rao, M.S. Groundwater quality in the alluvial aquifer system of northwest India: New evidence of the extent of anthropogenic and geogenic contamination. Sci. Total Environ. 2017, 599–600, 1433–1444. [Google Scholar] [CrossRef] [PubMed]
- Vengosh, A.; Rosenthal, E. Saline groundwater in Israel: Its bearing on the water crisis in the country. J. Hydrol. 1994, 156, 389–430. [Google Scholar] [CrossRef]
- Wang, Y.; Jiao, J.J. Origin of groundwater salinity and hydrogeochemical processes in the confined Quaternary aquifer of the Pearl River Delta, China. J. Hydrol. 2012, 438–439, 112–124. [Google Scholar] [CrossRef]
- Khan, M.Y.A.; ElKashouty, M.; Abdellattif, A.; Egbueri, J.C.; Taha, A.I.; Al Deep, M.; Shaaban, F. Influence of natural and anthropogenic factors on the hydrogeology and hydrogeochemistry of Wadi Itwad Aquifer, Saudi Arabia: Assessment using multivariate statistics and PMWIN simulation. Ecol. Indic. 2023, 151, 110287. [Google Scholar] [CrossRef]
- Khan, M.Y.A.; ElKashouty, M.; Khan, N.; Subyani, A.M.; Tian, F. Spatio-temporal evaluation of trace element contamination using multivariate statistical techniques and health risk assessment in groundwater, Khulais, Saudi Arabia. Appl. Water Sci. 2023, 13, 123. [Google Scholar] [CrossRef]
- Guo, H.M.; Wang, Y.X. Geochemical characteristics of shallow groundwater in Datong Basin, northwestern China. J. Geochem. Explor. 2005, 87, 109–120. [Google Scholar] [CrossRef]
- Li, D.N.; Gao, X.B.; Wang, Y.X.; Luo, W.T. Diverse mechanisms drive fluoride enrichment in groundwater in two neighboring sites in northern China. Environ. Pollut. 2018, 237, 430–441. [Google Scholar] [CrossRef]
- Dong, C.; Wu, X.; Gao, Z.; Yang, P.; Khan, M.Y.A. A novel and efficient metal oxide fluoride absorbent for drinking water safety and sustainable development. Sustainability 2021, 13, 883. [Google Scholar] [CrossRef]
- Elumalai, V.; Nwabisa, D.P.; Rajmohan, N. Evaluation of high fluoride contaminated fractured rock aquifer in South Africageochemical and chemometric approaches. Chemosphere 2019, 235, 1–11. [Google Scholar] [CrossRef]
- Gizaw, B. The origin of high bicarbonate and fluoride concentrations in waters of the Main Ethiopian Rift Valley, east African rift system. J. Afr. Earth Sci. 1996, 22, 391–402. [Google Scholar] [CrossRef]
- Rango, T.; Bianchini, G.; Beccaluva, L.; Tassinari, R. Geochemistry and water quality assessment of central Main Ethiopian Rift natural waters with emphasis on source and occurrence of fluoride and arsenic. J. Afr. Earth Sci. 2010, 57, 479–491. [Google Scholar] [CrossRef]
- Egbueri, J.C.; Agbasi, J.C.; Ayejoto, D.A.; Khan, M.I.; Khan, M.Y.A. Extent of anthropogenic influence on groundwater quality and human health-related risks: An integrated assessment based on selected physicochemical characteristics. Geocarto Int. 2023, 38, 2210100. [Google Scholar] [CrossRef]
- Egbueri, J.C.; Agbasi, J.C.; Ikwuka, C.F.; Chiaghanam, O.I.; Khan, M.I.; Khan, M.Y.A.; Khan, N.; Uwajingba, H.C. Nitrate health risk and geochemical characteristics of water in a semi-urban: Implications from graphical plots and statistical computing. Int. J. Environ. Anal. Chem. 2023, 1–21. [Google Scholar] [CrossRef]
- Agbasi, J.C.; Chukwu, C.N.; Nweke, N.D.; Uwajingba, H.C.; Khan MY, A.; Egbueri, J.C. Water pollution indexing and health risk assessment due to PTE ingestion and dermal absorption for nine human populations in Southeast Nigeria. Groundw. Sustain. Dev. 2023, 21, 100921. [Google Scholar] [CrossRef]
- Jacks, G.; Bhattacharya, P.; Chaudhary, V.; Singh, K.P. Controls on the genesis of some high-F groundwaters in India. Appl. Geochem. 2005, 20, 221–228. [Google Scholar] [CrossRef]
- Vikas, C.; Kushwaha, R.; Ahmad, W.; Prasannakumar, V.; Reghunath, R. Genesis and geochemistry of high fluorine-bearing groundwater from a semi-arid terrain ofNWIndia. Environ. Earth Sci. 2013, 68, 289–305. [Google Scholar] [CrossRef]
- Krishan, G.; Rao, M.S.; Vashisht, R.; Chaudhary, A.; Singh, J.; Kumar, A. Isotopic assessment of groundwater salinity: A case study of the Southwest (SW) Region of Punjab, India. Water 2022, 14, 133. [Google Scholar] [CrossRef]
- Krishan, G.; Kumar, B.; Sudarsan, N.; Rao, M.S.; Ghosh, N.C.; Taloor, A.K.; Bhattacharya, P.; Singh, S.; Kumar, C.P.; Sharma, A.; et al. Isotopes (δ18O, δD and 3H) variations in groundwater with emphasis on salinization in the state of Punjab, India. Sci. Total Environ. 2021, 789, 148051. [Google Scholar] [CrossRef] [PubMed]
- Smedley, P.L.; Kinniburgh, D.G.; Macdonald, D.M.J.; Nicolli, H.B.; Barros, A.J.; Tullio, J.O.; Pearce, J.M.; Alonso, M.S. Arsenic associations in sediments from the loess aquifer of La Pampa, Argentina. Appl. Geochem. 2005, 20, 989–1016. [Google Scholar] [CrossRef]
- Zabala, M.E.; Manzano, M.; Vives, L. Assessment of processes controlling the regional distribution of fluoride and arsenic in groundwater of the Pampeano aquifer in the Del Azul Creek basin (Argentina). J. Hydrol. 2016, 541, 1067–1087. [Google Scholar] [CrossRef]
- Avrahamov, N.; Antler, G.; Yechieli, Y.; Gavrieli, I.; Joye, S.B.; Saxton, M.; Turchyn, A.V.; Sivan, O. Anaerobic oxidation of methane by sulfate in hypersaline groundwater of the Dead Sea aquifer. Geobiology 2014, 12, 511–528. [Google Scholar] [CrossRef] [PubMed]
- Deng, Y.M.; Wang, Y.X.; Ma, T. Isotope and minor element geochemistry of high arsenic groundwater from Hangjinhouqi, the Hetao Plain, Inner Mongolia. Appl. Geochem. 2009, 24, 587–599. [Google Scholar] [CrossRef]
- Li, C.C.; Gao, X.B.; Liu, Y.S.; Wang, Y.X. Impact pf anthropogenic activities on the enrichment of fluoride and salinity in groundwater in the Yuncheng Basin constrained by cl/Br ratio, δ18O, δ2H, δ13C and δ7Li isotopes. J. Hydrol. 2019, 579, 124211. [Google Scholar] [CrossRef]
- Naftz, D.L.; Bullen, T.D.; Stolp, B.J.; Wilkowske, C.D. Utilizing geochemical, hydrologic, and boron isotopic data to assess the success of a salinity and selenium remediation project, Upper Colorado River Basin, Utah. Sci. Total Environ. 2008, 392, 1–11. [Google Scholar] [CrossRef]
- Santucci, L.; Carol, E.; Kruse, E. identification of palaeo-seawater intrusion in groundwater using minor ions in a semi-confined aquifer of the Rio de la Plata littoral (Argentina). Sci. Total Environ. 2016, 566–567, 1640–1648. [Google Scholar] [CrossRef] [PubMed]
- Rango, T.; Vengosh, A.; Dwyer, G.; Bianchini, G. Mobilization of arsenic and other naturally occurring contaminants in groundwater of the Main Ethiopian Rift aquifers. Water Res. 2013, 47, 5801–5818. [Google Scholar] [CrossRef] [PubMed]
- Scanlon, B.R.; Nicot, J.P.; Reedy, R.C.; Kurtzman, D.; Mukherjee, A.; Nordstrom, D.K. Elevated naturally occurring arsenic in a semi-arid oxidizing system, southern high plain aquifer, Texas, USA. Appl. Geochem. 2009, 24, 2061–2071. [Google Scholar] [CrossRef]
- Singh, R.K.; Sengupta, B.; Bal, R.; Shukla, B.P.; Gurunadharao, V.S.; Srivatstava, R. Identification and mapping of chromium (VI) plume in groundwater for remediation: A case study at Kanpur Uttar Pradesh. J. Geol. Soc. India 2009, 74, 49–57. [Google Scholar] [CrossRef]
- Brindha, K.; Rajib, P.; Julien, W.; Mou, L.T.; Mahesh, K.S. Trace metals contamination in groundwater and implications on human health: Comprehensive assessment using hydrogeochemical and geostatistical methods. Environ. Geochem. Health 2020, 42, 3819–3839. [Google Scholar] [CrossRef] [PubMed]
- Vasanthavigar, M.; Srinivasamoorthy, K.; Rajiv Ganthi, R.; Vijayaraghavan, K.; Sarma, V. Characterisation and quality assessment of groundwater with a special emphasis on irrigation utility: Thirumanimuttar sub-basin, Tamil Nadu, India. Arab. J. Geosci. 2012, 5, 245–258. [Google Scholar] [CrossRef]
- Belkhiri, L.; Tiri, A.; Mouni, L. Assessment of heavy metals contamination in groundwater: A case study of the south of setif area, East Algeria. In Achievements and Challenges of Integrated River Basin Management; IntechOpen: London, UK, 2018; pp. 17–31. [Google Scholar]
- Khademi, H.; Gabarrón, M.; Abbaspour, A.; Martínez-Martínez, S.; Faz, A.; Acosta, J.A. Environmental impact assessment of industrial activities on heavy metals distribution in street dust and soil. Chemosphere 2019, 217, 695–705. [Google Scholar] [CrossRef] [PubMed]
- Stavi, I.; Thevs, N.; Priori, S. Soil salinity and sodicity in drylands: A review of causes, effects, monitoring, and restoration measures. Front. Environ. Sci. 2021, 9, 330. [Google Scholar] [CrossRef]
- Shaxson, T.F.; Barber, R.G. Optimizing Soil Moisture for Plant Production: The Significance of Soil Porosity (No. 79); Food and Agriculture Organization: Rome, Italy, 2003. [Google Scholar]
- Zhao, K.; Fu, W.; Qiu, Q.; Ye, Z.; Li, Y.; Tunney, H.; Dou, C.; Zhou, K.; Qian, X. Spatial patterns of potentially hazardous metals in paddy soils in a typical electrical waste dismantling area and their pollution characteristics. Geoderma 2019, 337, 453–462. [Google Scholar] [CrossRef]
- Food and Agriculture Organization of the United Nation (FAO). Saudi Arabia irrigation in the Middle East regions in figure. Aquatat Survey 2008. In Land FAO and Water Division Report; Freken, K., Ed.; FAO: Rome, Italy, 2009; Volume 34, pp. 325–337. [Google Scholar]
- Khan, M.Y.A.; El Kashouty, M.; Gusti, W.; Kumar, A.; Subyani, A.M.; Alshehri, A. Geo-temporal signatures of physicochemical and heavy metals pollution in Groundwater of Khulais region—Makkah Province, Saudi Arabia. Front. Environ. Sci. 2022, 9, 699. [Google Scholar] [CrossRef]
- Ouda, O.K.M.; Shawesh, A.; Al-Olabi, T.; Younes, F.; Al-Waked, R. Review of domestic water conservation practices in Saudi Arabia. Appl. Water Sci. 2013, 3, 689–699. [Google Scholar] [CrossRef]
- Hakami, B.A.; Seif ES, S.A.; El-Shater, A.A. Environmental pollution assessment of Al-Musk Lake, Jeddah, Saudi Arabia. Nat. Hazards 2020, 101, 429–448. [Google Scholar] [CrossRef]
- Saleem, H.A.; Subyani, A.M.; Elfeki, A. Solute transport model for groundwater contamination in Wadi Bani Malik, Jeddah, Saudi Arabia. Arab. J. Geosci. 2019, 12, 148. [Google Scholar] [CrossRef]
- Ewea, H.A.S.A. Hydrological analysis of flooding wastewater lake in Jeddah, Saudi Arabia. JKAU Meteorol. Environ. Arid Land Agric. Sci. 2010, 21, 125–144. [Google Scholar] [CrossRef]
- Elfeki, A.; Ewea, H.; Al-Amri, N. Linking groundwater flow and transport models, GIS technology, satellite images and uncertainty quantification for decision making: Buraiman Lake case study Jeddah, Saudi Arabia. Int. J. Water Resour. Arid. Environ. 2011, 1, 295–303. [Google Scholar]
- Rehman, F.; Cheema, T. Effects of sewage waste disposal on the groundwater quality and agricultural potential of a floodplain near Jeddah, Saudi Arabia. Arab. J. Geosci. 2016, 9, 307. [Google Scholar] [CrossRef]
- Bahabri, A.A. Geo-Environmental Assessments of Polluted Water and Soil Due to Sewage Water at Wadi Uranah, Southwest of Makkah. Ph.D. Thesis, King Abdul Aziz University, Jeddah, Saudi Arabia, 2011. [Google Scholar]
- Rashed, M.; Niyazi, B. Environmental impact assessment of the former Al-Musk lake wastewater dumpsite using electromagnetic induction technique. Earth Syst. Environ. 2017, 1, 10. [Google Scholar] [CrossRef]
- Daoudi, M.; Niang, A.J. Flood Risk and Vulnerability of Jeddah City, Saudi Arabia. In Recent Advances in Flood Risk Management; IntechOpen: London, UK, 2019; pp. 634–654. [Google Scholar]
- Moore, T.A.; Al-Rehaili, M.H. Geologic Map of the Makkah Quadrangle, Sheet 21D, Kingdom of Saudi Arabia; Ministry of Petroleum and Mineral Resources, Deputy Ministry For Mineral Resources Publication: Jeddah, Saudi Arabia, 1989. [Google Scholar]
- Lecia Geosystems & GIS Mapping Division. Erdas Field Guide, 7th ed.; Erdas: Atlanta, GA, USA, 2003; 698p. [Google Scholar]
- APHA. Standard Methods of Water and Wastewater, 21st ed.; American Public Health Association: Washington, DC, USA, 2005; pp. 2–61. ISBN 0875530478. [Google Scholar]
- ASTM Standards. Annual Book of ASTM Standards 11.01; American Society for Testing and Materials: Easton, MD, USA, 1980; p. 83. [Google Scholar]
- Rehman, F.; Cheema, T. Boron contamination in groundwater at a sewage waste disposal facility near Jeddah, Saudi Arabia. Environ. Earth Sci. 2017, 76, 218. [Google Scholar] [CrossRef]
- Maghrebi, M.; Noori, R.; Partani, S.; Araghi, A.; Barati, R.; Farnoush, H.; Torabi Haghighi, A. Iran’s groundwater hydrochemistry. Earth Space Sci. 2021, 8, e2021EA001793. [Google Scholar] [CrossRef]
- Mirani Moghadam, H.; Karami, G.H.; Bagheri, R.; Barati, R. Death time estimation of water heritages in Gonabad Plain, Iran. Environ. Earth Sci. 2021, 80, 127. [Google Scholar] [CrossRef]
- Maghrebi, M.; Noori, R.; Sadegh, M.; Sarvarzadeh, F.; Akbarzadeh, A.E.; Karandish, F.; Barati, R.; Taherpour, H. Anthropogenic decline of ancient, sustainable water systems: Qanats. Groundwater 2023, 61, 139–146. [Google Scholar] [CrossRef] [PubMed]
- World Health Organization (WHO). Guidelines for Drinking-Water Quality, 4th ed.; WHO: Geneva, Switzerland, 2011; pp. xx, 3, 47, 161–162, 164, 177, 183, 223–224, 311, 323–324, 343, 387, 389–390, 394, 398–399, 413–415, 430. [Google Scholar]
- WHO. Boron in Drinking-Water: Background Document for Development of WHO Guidelines for Drinking-Water Quality; Report WHO/HSC/WSH/09.01/2; WHO: Geneva, Switzerland, 2009; p. 28. [Google Scholar]
- Weast, R.C. Handbook of Chemistry and Physics; CRC Press: Boca Raton, FL, USA, 1985; pp. D165–D166. [Google Scholar]
- EPA. Regulatory Determinations Support Document for Selected Contaminants for the Second Drinking Water Contaminant Candidate List (CCL2); Office of Water (4607M), EPA 815-R-08-012; EPA: Washington, DC, USA, 2008. [Google Scholar]
- ISO 9390; Water Quality—Determination of Borate—Spectrometric Method Using Azomethine-H. International Organization for Standardization: Geneva, Switzerland, 1990.
- Moss, S.A.; Nagpal, N.; Branch, W.P. Ambient Water Quality Guidelines for Boron; British Columbia Technical Report; Water Protection Branch, Ministry of Water, Land and Air Protection: Victoria, BC, Canada, 2003; p. 112. [Google Scholar]
- Vengosh, A.; Kolodny, Y.; Spivack, A. Application of isotopes techniques to investigate groundwater pollution. IAEA TECHDOC 1998, 1046, 17–38. [Google Scholar]
- Ravenscroft, P.; McArthur, J. Mechanism of regional enrichment of groundwater by boron: The examples of Bangladesh and Michigan, USA. Appl. Geochem. 2004, 19, 1413–1430. [Google Scholar] [CrossRef]
- Koda, E.; Miszkowska, A.; Sieczka, A. Levels of organic pollution indicators in groundwater at the old landfill and waste management site. Appl. Sci. 2017, 7, 638. [Google Scholar] [CrossRef]
- Ukah, B.U.; Egbueri, J.C.; Unigwe, C.O.; Ubido, O.E. Extent of heavy metals pollution and health risk assessment of groundwater in a densely populated industrial area, Lagos, Nigeria. Int. J. Energy Water Resour. 2019, 3, 291–303. [Google Scholar] [CrossRef]
- Casagrande, A. Classification and Identification of Soils. Trans. Am. Soc. Civ. Eng. 1948, 113, 901–930. [Google Scholar] [CrossRef]
- Onur, E.M. Predicting the Permeability of Sandy Soils from Grain Size Distributions. Ph.D. Dissertation, Kent State University, Portage County, OH, USA, 2014. [Google Scholar]
- Hazen, A. Some Physical Properties of Sands and Gravels, with Special Reference to Their Use in Filtration; 24th Annual Report; Massachusetts State Board of Health, Pub. Doc.: Boston, MA, USA, 1892; Volume 34, pp. 539–556. [Google Scholar]
- Diamond, J.; Shanley, T. Infiltration rate assessment of some major soils. Ir. Geogr. 2003, 36, 32–46. [Google Scholar] [CrossRef]
- Bhave, S.; Sreeja, P. Influence of initial soil condition on infiltration characteristics determined using a disk infiltrometer. ISH J. Hydraul. Eng. 2013, 19, 291–296. [Google Scholar] [CrossRef]
- Singh, B.; Sihag, P.; Singh, D. Study of infiltration characteristics of locally soils. J. Civ. Eng. Environ. Technol. 2014, 1, 9–13. [Google Scholar]
- Drury, S.A. Image Interpretation in Geology, 2nd ed.; Chapman & Hall: New York, NY, USA, 1993. [Google Scholar]
- Lillesand, T.M.; Kiefer, R.W. Remote Sensing and Image Interpretation, 4th ed.; John Wiley & Sons, Inc.: New York, NY, USA, 2000; 724p. [Google Scholar]
- Gupta, R.P. Remote Sensing Geology; Springer: Berlin/Heidelberg, Germany; New York, NY, USA; London, UK; Paris, France; Tokyo, Japan; Hong Kong, China, 1991; xvi + 356p, ISBN 3 540 52805 9. Price DM 198.00 (Hard Covers). [Google Scholar]


Disclaimer/Publisher’s Note: The statements, opinions and data contained in all publications are solely those of the individual author(s) and contributor(s) and not of MDPI and/or the editor(s). MDPI and/or the editor(s) disclaim responsibility for any injury to people or property resulting from any ideas, methods, instructions or products referred to in the content. |
© 2023 by the authors. Licensee MDPI, Basel, Switzerland. This article is an open access article distributed under the terms and conditions of the Creative Commons Attribution (CC BY) license (https://creativecommons.org/licenses/by/4.0/).