
Methodological Approach for an Online Water Quality Monitoring System in an Iron Ore Tailing Dam
 and
and
Abstract
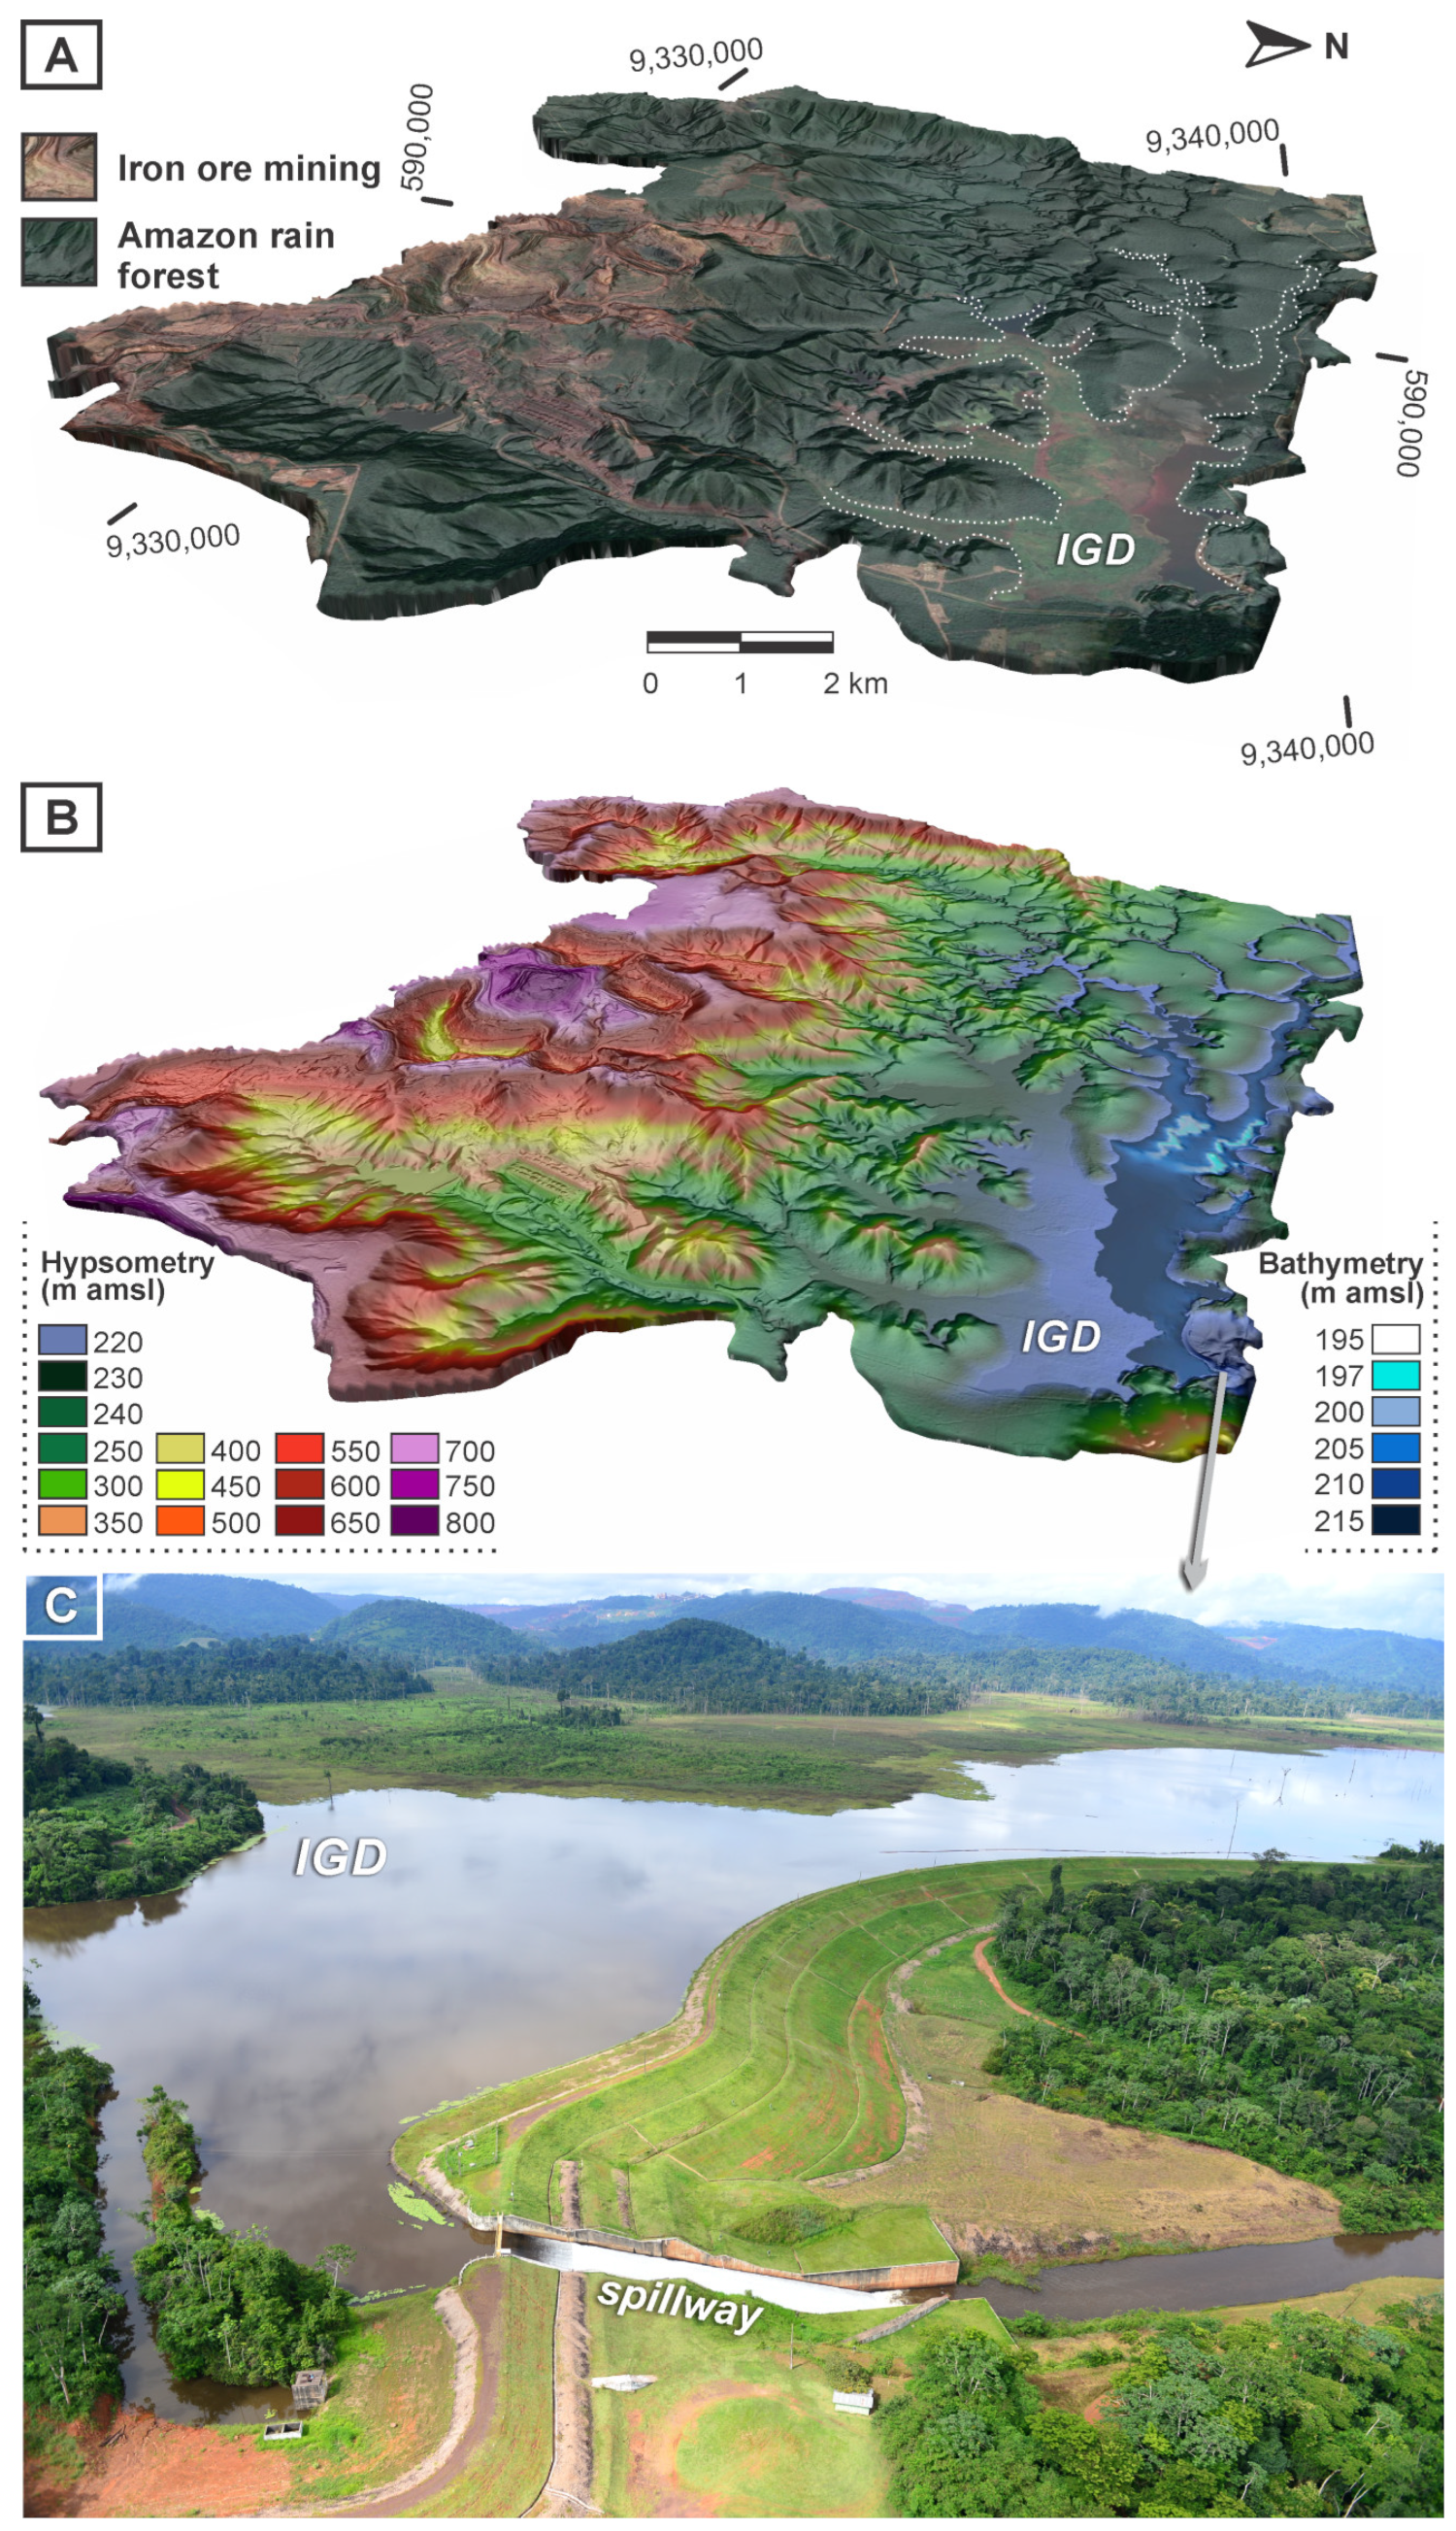
:1. The Gelado Project in Carajás
2. The System for Sampling and Automatic Analysis of IGD’s Water Quality (IGD-WQ)
2.1. Process Analyzers
2.2. Software for Communication between Analyzers
2.3. Laboratory Support
3. Problems during System Operation
4. First Results and Quality Control
4.1. Calibration of Analyzers
- S: blank standard deviation;
- s: angular coefficient of the analytical curve.
- t: abscissa of Student’s distribution, dependent on sample size and confidence level;
- s: sample standard deviation of sample blanks with addition.
4.2. Key Advantages of an Online Water Quality Monitoring
5. Conclusions
Author Contributions
Funding
Data Availability Statement
Conflicts of Interest
References
- AMPLO ENGINEERING AND PROJECT MANAGEMENT. Gelado Dam Waste Reprocessing Project. ENVIRONMENTAL CONTROL REPORT—RCA GELADO DAM TAILING REPROCESSING PROJECT. 2008. Available online: http://licenciamento.ibama.gov.br/Mineracao/PCA-RCA_Reprocessamento_Gelado/RT-001_089-515-5018_01-J%20-%20PCA.pdf (accessed on 10 August 2023).
- VALE. Consultation on 10 August 2023 16:03. 2023. Available online: https://www.vale.com/pt/w/vale-inicia-reutilização-de-rejeitos-em-dam-de-carajas-utilizando-equipamentos-sem-emissao-de-co2 (accessed on 10 August 2023).
- Armada, C.A.S. The Environmental Disasters of Mariana and Brumadinho and the Brazilian Social Environmental Law State. Available online: https://ssrn.com/abstract=3442624 (accessed on 10 August 2023).
- METROHM. The Columm Program. The Whole World of Ion Chromatography; METROHM: Herisau, Switzerland, 2020. [Google Scholar]
- METROHM. Determination of Mercury at the Rotating Gold Electrode by Anodic Stripping Voltammetry. Application Bulletin. Available online: https://www.metrohm.com/pt_br/applications/ab-application-bulletins/ab-096.html (accessed on 6 September 2023).
- Skoog, D.A.; Holler, F.J.; Crouch, S.R. Principles of Instrumental Analysis, 6th ed.; Brooks/Cole: Belmont, CA, USA, 2007. [Google Scholar]
- APHA. Standard Methods for The Examination and Standardization Water and Wastewater, 20th ed.; American Public Health Association; American Water Work Association; Water Enviornmental Federation: Washington, DC, USA, 1998. [Google Scholar]
- METROHM. PP-153797_19—Technique: Online Analytical System for Monitoring Ice Cream Dam Output Metrohm Process Analytics; Technical Specification; METROHM: Herisau, Switzerland, 2019. [Google Scholar]
- ISO/IEC 17025:2017; General Requirements for the Competence of Testing and Calibration Laboratories, Is the International Reference for Testing and Calibration Laboratories Wanting to Demonstrate Their Capacity to Deliver Reliable Results. ISO: Geneva, Switzerland, 2017. Available online: https://www.iso.org/files/live/sites/isoorg/files/store/en/PUB100424.pdf (accessed on 9 October 2023).
- BRASIL, National Council for the Environment. CONAMA Resolution No. 357, of March 17, 2005. Federal Official Gazette, 18 March 2005; pp. 58–63. [Google Scholar]
- BRASIL, National Council for the Environment. CONAMA Resolution No. 430, of May 13, 2011. Federal Official Gazette, 16 May 2011; pp. 90–94. [Google Scholar]
- INMETRO. Guidance Document: DOQ-CGCRE-008 Guidance on Validation of Analytical Methods; INMETRO: Rio de Janeiro, Brasil, 2020; pp. 15–17. [Google Scholar]
- Adu-Manu, K.S.; Tapparello, C.; Heinzelman, W.; Katsriku, F.A.; Abdulai, J.-D. Water quality monitoring using wireless sensor networks: Current trends and future research directions. ACM Trans. Sens. Netw. 2017, 13, 4. [Google Scholar] [CrossRef]
- Barabde, M.; Danve, S. Real time Water Quality Monitoring System. Int. J. Innov. Res. Comput. Commun. Eng. 2015, 3, 5064–5069. [Google Scholar]
- Geetha, S.; Gouthami, S. Internet of things enabled real time water quality monitoring system. Smart Water 2017, 2, 1. [Google Scholar] [CrossRef]
- Wong, Y.; Nakayama, R.; Shimizu, Y.; Kamiya, A.; Shen, S.; Rashid, I.Z.M.; Sulaiman, N. Toward industrial revolution 4.0: Development, validation, and application of 3D-printed IoT-based water quality monitoring system. J. Clean. Prod. 2021, 324, 129230. [Google Scholar] [CrossRef]
- Moparthi, N.R.; Mukesh, C.; Sagar, P.V. Water Quality Monitoring System Using IOT. In Proceedings of the 2018 Fourth International Conference on Advances in Electrical, Electronics, Information, Communication and Bio-Informatics (AEEICB), Chennai, India, 27–28 February 2018; pp. 1–5. [Google Scholar] [CrossRef]


| Parameters | Limits of Detection (mg/L) |
|---|---|
| Dissolved Cupper (Cu) | 0.01 |
| Dissolved Nickel (Ni) | 0.003 |
| Dissolved Iron (Fe) | 0.04 |
| Dissolved Cobalt (Co) | 0.003 |
| Dissolved Manganese (Mn) | 0.19 |
| Dissolved Cadmium (Cd) | 0.009 |
| Dissolved Lead (Pb) | 0.006 |
| Dissolved Lithium (Li) | 0.06 |
| Dissolved Sodium (Na) | 0.04 |
| Dissolved Ammonium (NH4+) | 0.18 |
| Dissolved Potassium (K) | 0.05 |
| Dissolved Magnesium (Mg) | 0.32 |
| Dissolved Calcium (Ca) | 0.06 |
| Fluoride (F−) | 0.02 |
| Chloride (Cl−) | 0.26 |
| Nitrite (NO2−) | 0.21 |
| Phosphate (PO4−) | 0.006 |
| Sulfate (SO42−) | 1.63 |
| Total Aluminum (Al3+) | 0.0001 |
| Total Phosphorus (P) | 0.0001 |
| Parameter | R2 | Curve Type |
|---|---|---|
| Cu | 0.99947 | Quadratic throughout 0 |
| Ni | 0.99957 | |
| Co | 0.99999 | |
| Mn | 0.99670 | |
| Cd | 0.99827 | |
| Pb | 0.99506 | |
| Li | 0.99591 | |
| Na | 0.99721 | |
| Ca | 0.99637 | |
| F− | 0.99991 | |
| Cl− | 0.99963 | |
| NO2− | 0.99986 | |
| NO3− | 0.99996 | |
| Fe | 0.99870 | Linear |
| Al3+ | 0.99450 | |
| P | 0.99958 |
| Parameters | N | mg/L | |||||||
|---|---|---|---|---|---|---|---|---|---|
| LD | Mean | SD | Min. | Median | Max. | CONAMA 430 | CONAMA 357 (Class II) | ||
| Cu | 15 | 0.01 | <LD | - | - | - | - | 1 | 0.009 |
| Ni | 15 | 0.003 | <LD | - | - | - | - | 2 | 0.02 |
| Fe | 15 | 0.15 | 0.23 | 0.029 | 0.199 | 0.250 | 0.273 | 15 | 0.3 |
| Co | 15 | 0.003 | <LD | - | - | - | - | - | 0.05 |
| Mn | 15 | 0.19 | 0.02 | 0.012 | 0.002 | 0.015 | 0.035 | - | 0.1 |
| Cd | 15 | 0.009 | <LD | - | - | - | - | 0.2 | 0.001 |
| Li | 15 | 0.06 | <LD | - | - | - | - | - | 2.5 |
| Na | 15 | 0.04 | 1.03 | 0.058 | 0.963 | 1.02 | 1.141 | - | - |
| Ca | 15 | 0.06 | 6.92 | 0.131 | 6.724 | 6.949 | 7.09 | - | - |
| F− | 15 | 0.02 | <LD | - | - | - | - | 10 | 1.4 |
| Cl− | 15 | 0.26 | 2.03 | 0.234 | 1.638 | 1.952 | 2.49 | - | 250 |
| NO2− | 15 | 0.21 | <LD | - | - | - | - | - | 1 |
| NO3− | 15 | 0.19 | <LD | - | - | - | - | - | 10 |
| Al3+ | 14 | 0.0001 | <LD | - | - | - | - | - | 0.1 |
| P | 14 | 0.0001 | <LD | - | - | - | - | - | 0.1 |
Disclaimer/Publisher’s Note: The statements, opinions and data contained in all publications are solely those of the individual author(s) and contributor(s) and not of MDPI and/or the editor(s). MDPI and/or the editor(s) disclaim responsibility for any injury to people or property resulting from any ideas, methods, instructions or products referred to in the content. |
© 2023 by the authors. Licensee MDPI, Basel, Switzerland. This article is an open access article distributed under the terms and conditions of the Creative Commons Attribution (CC BY) license (https://creativecommons.org/licenses/by/4.0/).
Share and Cite
da Silva Júnior, R.O.; Almeida, H.P.; da Silva, M.S.; França, A.C.; Balleroni, E.; dos Santos, N.; Vilela, P.H.; de Melo, A.M.Q.; Guimarães, J.T.F. Methodological Approach for an Online Water Quality Monitoring System in an Iron Ore Tailing Dam. Water 2023, 15, 3663. https://doi.org/10.3390/w15203663
da Silva Júnior RO, Almeida HP, da Silva MS, França AC, Balleroni E, dos Santos N, Vilela PH, de Melo AMQ, Guimarães JTF. Methodological Approach for an Online Water Quality Monitoring System in an Iron Ore Tailing Dam. Water. 2023; 15(20):3663. https://doi.org/10.3390/w15203663
Chicago/Turabian Styleda Silva Júnior, Renato Oliveira, Helena Pereira Almeida, Marcio Sousa da Silva, Adriano Cuenya França, Eduardo Balleroni, Nailson dos Santos, Paulo Henrique Vilela, Adayana Maria Queiroz de Melo, and José Tasso Felix Guimarães. 2023. "Methodological Approach for an Online Water Quality Monitoring System in an Iron Ore Tailing Dam" Water 15, no. 20: 3663. https://doi.org/10.3390/w15203663