Article

Spatial and Temporal Variation Characteristics of Stable Isotopes in Precipitation and Their Relationships with Meteorological Factors in the Shiyang River Basin in China

1
College of Geography and Environmental Science, Northwest Normal University, Lanzhou 730070, China
2
Key Laboratory of Resource Environment and Sustainable Development of Oasis, Lanzhou 730070, China
3
Shiyang River Ecological Environment Observation Station, Northwest Normal University, Lanzhou 730070, China
*
Author to whom correspondence should be addressed.
Water 2023, 15(21), 3836; https://doi.org/10.3390/w15213836
Submission received: 23 September 2023 / Revised: 25 October 2023 / Accepted: 29 October 2023 / Published: 2 November 2023
(This article belongs to the Section Water and Climate Change)

Abstract

:
Stable isotopes of precipitation play an important role in understanding hydrological and climatic processes of arid inland river basins. In order to better understand the difference of regional water cycle and precipitation patterns, precipitation samples were collected in Shiyang River Basin from June 2018 to May 2020, and spatial and temporal variation characteristics of stable isotopes in precipitation and their relationships with meteorological factors were discussed. The results showed that stable isotopes in precipitation showed seasonal variation characteristics, that δ2H and δ18O values were higher in summer and autumn and lower in winter and spring, and d-excess values were higher in spring and autumn and lower in winter and summer. Slopes and intercepts of the local meteoric water lines gradually increased with elevation increasing. δ18O significantly showed a positive correlation with temperature but a negative correlation with precipitation in summer. Contrary to below 15 hPa, δ18O significantly showed a negative correlation with water vapor pressure above 15 hPa. Due to the influence of meteorological factors, there are significant differences in stable isotopes of precipitation in arid inland river basins, which were more influenced by local moisture recycling in upstream area but by below-cloud secondary evaporation in mid-downstream area.

1. Introduction

Atmospheric precipitation is an important part of the water cycle process and a major source of recharge for terrestrial water resources [1,2]. Stable hydrogen and oxygen isotopes (2H and 18O) are the important constituents of water molecules. During isotopic fractionation, the lighter isotopes (1H and 16O) evaporate into the gas phase first, while the heavier isotopes (2H and 18O) condense into the liquid phase first. 18O and 2H are constantly condensed preferentially from moist air when water vapor in clouds condenses to form raindrops. Hydrogen and oxygen stable isotopes (2H and 18O) are natural tracers of the water cycle, which are susceptible to various meteorological parameters, such as atmospheric temperature, relative humidity, precipitation and water vapor pressure, and decrease or increase with environmental factor changes [2,3,4], and precipitation isotope changes have continental effects, latitude effects, temperature effects, rainfall amount effects, seasonal effects, and elevation effects [5,6,7,8,9,10,11,12,13]. Temperature effects were found mainly in mid-high-latitude continents [14], and rainfall amount effects were exhibited in the low-latitude coastal, island and monsoonal humid zones [14], and elevation effects existed in mountainous areas [6]. Craig [15] determined the global meteoric water line (GMWL) equation as δ2H = 8δ18O + 10, but there is a significant deviation between the local meteoric water line (LMWL) and the GMWL. To quantify the extent to which the LMWL deviates from the GMWL, Dansgaard [14] proposed a deuterium excess (defined as d-excess = δ2H − 8δ18O) to quantify the extent to which the LMWL deviates from the GMWL [1]. The mean value of d-excess in global atmospheric precipitation is about 10‰, and its variation depends mainly on the relative humidity and temperature of the moisture source, with lower d-excess values under the conditions of higher moisture source humidity, lower temperature (with weaker evaporation from ocean to atmosphere), and vice versa [1,16]. In addition, d-excess values are affected by moisture recirculation and secondary evaporation [17,18]. Therefore, the study on isotope variation in precipitation can contribute to understanding the precipitation process and water cycle mechanism.
The arid area of the northwest China is distant from the sea and is difficult for water vapor to reach, thus the climate is arid and the precipitation is scarce. Therefore, the limited water resource is crucial for regional socio-economic development. Using stable isotope techniques, many scholars have conducted numerous studies on atmospheric precipitation and its hydrological processes in the area. For example, Juan et al. [2] studied the patterns of precipitation isotopes in the Qilian Mountains and their controlling factors; Wu et al. [19] investigated the effects of different condensation mechanisms or different moisture sources on precipitation isotopes in the Heihe River Basin; Pang et al. [9] showed that the isotopic composition in precipitation under arid climate conditions was affected by sub-cloud secondary evaporation and moisture recycling; Li et al. [20] found that oases and mountainous areas formed a complete local water cycle. The above studies investigated the variation of precipitation isotopes or water cycle processes in different locations in the arid area of the northwest China, which can be a reference for other basins in this arid area.
The Shiyang River Basin is located in the northwest China and the transition zone between the monsoon area and the arid area, including three major ecosystems of mountain, oasis and desert. Influenced by global warming, the Shiyang River Basin will suffer more evaporation during precipitation, thus making the water cycle process more complex [21]. It has been shown that the changes of δ18O and δ2H values in precipitation in the Shiyang River Basin were significantly influenced by temperature, elevation and sub-cloud evaporation [22]. Ma et al. [23] found that the temperature was the dominant factor controlling δ18O values in precipitation in the Shiyang River Basin. Yuan et al. [24] pointed out that there were regional differences of stable isotopes in precipitation in the Shiyang River Basin and decreased with the increase of elevation. Gui et al. [25] found that the seasonal variation of precipitation isotopes in the upstream area of Shiyang River was significant. Zhao et al. [26] showed that the temperature effect of precipitation isotopes in the downstream area of Shiyang River was significant. The above studies have researched preliminarily the characteristics and environmental effects of precipitation isotopes in the Shiyang River Basin in short time series and small space scales, but the studies on a large spatial scale are lacking.
The previous studies were relatively short in time scale and influenced by special precipitation events, which could not comprehensively reflect the objective pattern of stable isotopes of precipitation in the study area. Spatially, they focused on certain or a few sampling points and could not fully reflect the spatial differences in stable isotope changes in precipitation in the study area. Using stable isotope and meteorological data from 11 stations in the Shiyang River Basin from June 2018 to May 2020, the spatial and temporal variation characteristics of stable isotopes in precipitation and their relationships with meteorological factors were analyzed in order to understand the process and influencing factors of stable isotope changes in precipitation in arid inland river basins. This helps to realize the difference of regional water cycle and precipitation patterns in the upstream and mid-downstream of the Shiyang River Basin, and further to provide a theoretical basis for scientific management and utilization of water resources in arid inland river basins.

2. Material and Methods

2.1. Study Area

The Shiyang River Basin is located in the inland of the northwest China and on the northern slope of the Qilian Mountains (Figure 1), with a total area of about 4.16 × 10⁴ km2. The terrain sloping from southwest to northeast is high in the south and low in the north, with the highest elevation of 5125 m and the lowest elevation of 1254 m. The Shiyang River Basin has a temperate continental arid climate with strong solar radiation and evaporation as well as a little precipitation mainly from May to October. The vapor source of precipitation is mainly controlled by the westerly and influenced by the local recirculated moisture during its transportation [24]. From south to north, the Shiyang River Basin can be roughly divided into three climatic and geomorphological units, which are the alpine semi-arid and semi-humid area in the Qilian Mountains, the warm and cool arid area in the central corridor plain, and the warm and arid area in the northern desert [27]. In the southern Qilian Mountains, the central corridor plain and the northern desert, the average annual temperatures of them are 0.2 °C, 6.9 °C and 8.6 °C, respectively, the annual precipitation of them are 300–600 mm, 150–300 mm and 0–150 mm, respectively, the average annual evaporation of them are 700–1200 mm, 1300–2000 mm and 2000–2600 mm, respectively [28,29]. The Shiyang River originates from the northern slope of Lenglongling in the eastern Qilian Mountains and is mainly recharged by precipitation and meltwater of glaciers and snow in the mountains. The upstream of the Shiyang River flows through the Qilian Mountains and its rich precipitation becomes the recharge source of the river, the midstream and downstream areas of the region are relatively flat, with more arable land and relatively intensive agricultural activity. Because midstream and downstream areas are surrounded by the Badanjilin Desert and the Tengger Desert, they become runoff dissipation areas for arid climates [30,31,32].

2.2. Sampling Procedure

In this study, 11 sampling points of precipitation collection were laid out along the Shiyang River (Figure 1), among which four sampling points (Lenglongling, Hulinzhan, Huajianxiang and Xiyingwugou) were located in the upstream area, four points (Xiyingzhen, Yangxiaba, Jiuduntan and Hongqigu) were located in the midstream area, and three points (Xuebaizhen, Datanxiang and Qingtuhu) were located in the downstream area. The terrain of the midstream and downstream areas is relatively flat, but due to being surrounded by the Badanjilin Desert and the Tengger Desert, they become runoff dissipation areas for arid climates, as well as irrigation, cropland and wind-sand areas [30,31]. Because of their similar climatic and geomorphologic features [32], they are subject to similar local geographic environments. Therefore, they are referred to as the mid-downstream area and discussed as a whole. A total of 688 samples were collected during the two hydrological years from June 2018 to May 2020 (Table 1). Precipitation samples were collected using the standard rainfall barrel of the weather station, which was placed on 1.5 m high above the ground and without obstacles around. A precipitation event was considered from 20:00 on the day to 20:00 on the next day, and the water samples were filled into high-density polyethylene (HDPE) bottles and sealed with waterproof tape. Solid precipitation samples were sealed in low-density polyethylene (LDPE) bags and placed in a room to melt completely at room temperature before they were filled and sealed. During precipitation sample collection, automatic meteorological observation stations record meteorological parameters simultaneously and include temperature, dew point temperature, precipitation, relative humidity and barometric pressure.

2.3. Methods

The precipitation samples were tested in the stable isotope laboratory of Northwest Normal University with the LGR-DLT-100 liquid water isotope analyzer (DLT-100, Los Gatos Research Inc., Mountain View, CA, USA). The analytical precision of δ2H and δ18O are ±0.6‰ and ±0.2‰, respectively. The results of the sample analysis are expressed as the thousandths of the Vienna Standard Mean Ocean Water (V-SMOW) equivalent:
δ 18 O ( δ 2 H ) = R s R V S M O W 1 × 1000 ,
where Rs is the ratio of 18O/16O (2H/1H) in water samples and RV−SMOW is the ratio of 18O/16O (2H/1H) in Vienna Mean Standard Ocean Water.
The weighted average value of precipitation isotope is calculated as:
δ w = p i × δ i / p i ,
where δi is the isotope value and pi is the respective precipitation amount.
Craig [15] determined the global meteoric water line (GMWL) equation as:
δ 2 H = 8 δ 18 O + 10 ,
Dansgaard [14] defined excess deuterium (d-excess) based on isotope data of global precipitation. It can be calculated as:
d excess = δ 2 H 8 δ 18 O ,
An ordinary least squares regression (OLSR) is widely used to determine the LMWL, and this regression method logically gives all data points equal weighting, which may be sensitive for some heavy and small precipitation events [33]. In order to reduce the bias of small rainfall events, Hughes and Crawford [33] introduced the Precipitation Weighted Least Squares Regression (PWLSR). In our study, the PWLSR method was used to calculate LWML, and data from daily precipitation events were used to calculate LMWL (Including the LMWL of the upstream areas, Upstream, Mid-downstream and each station). The event-based datasets provide a wider range of values to better constrain the regression than that achieved using monthly data over a short period.
The Lifting Condensation Level (LCL) can be calculated as [34]:
L C L = T T dew Γ d Γ dew
where T (°C) is the ambient temperature, Tdew (°C) is the dew point temperature, Γd (°C/m) is the dry adiabatic lapse rate, and Γdew (°C/m) is the wet adiabatic lapse rate.

3. Results

3.1. Temporal Variation Characteristics of Stable Isotopes of Precipitation

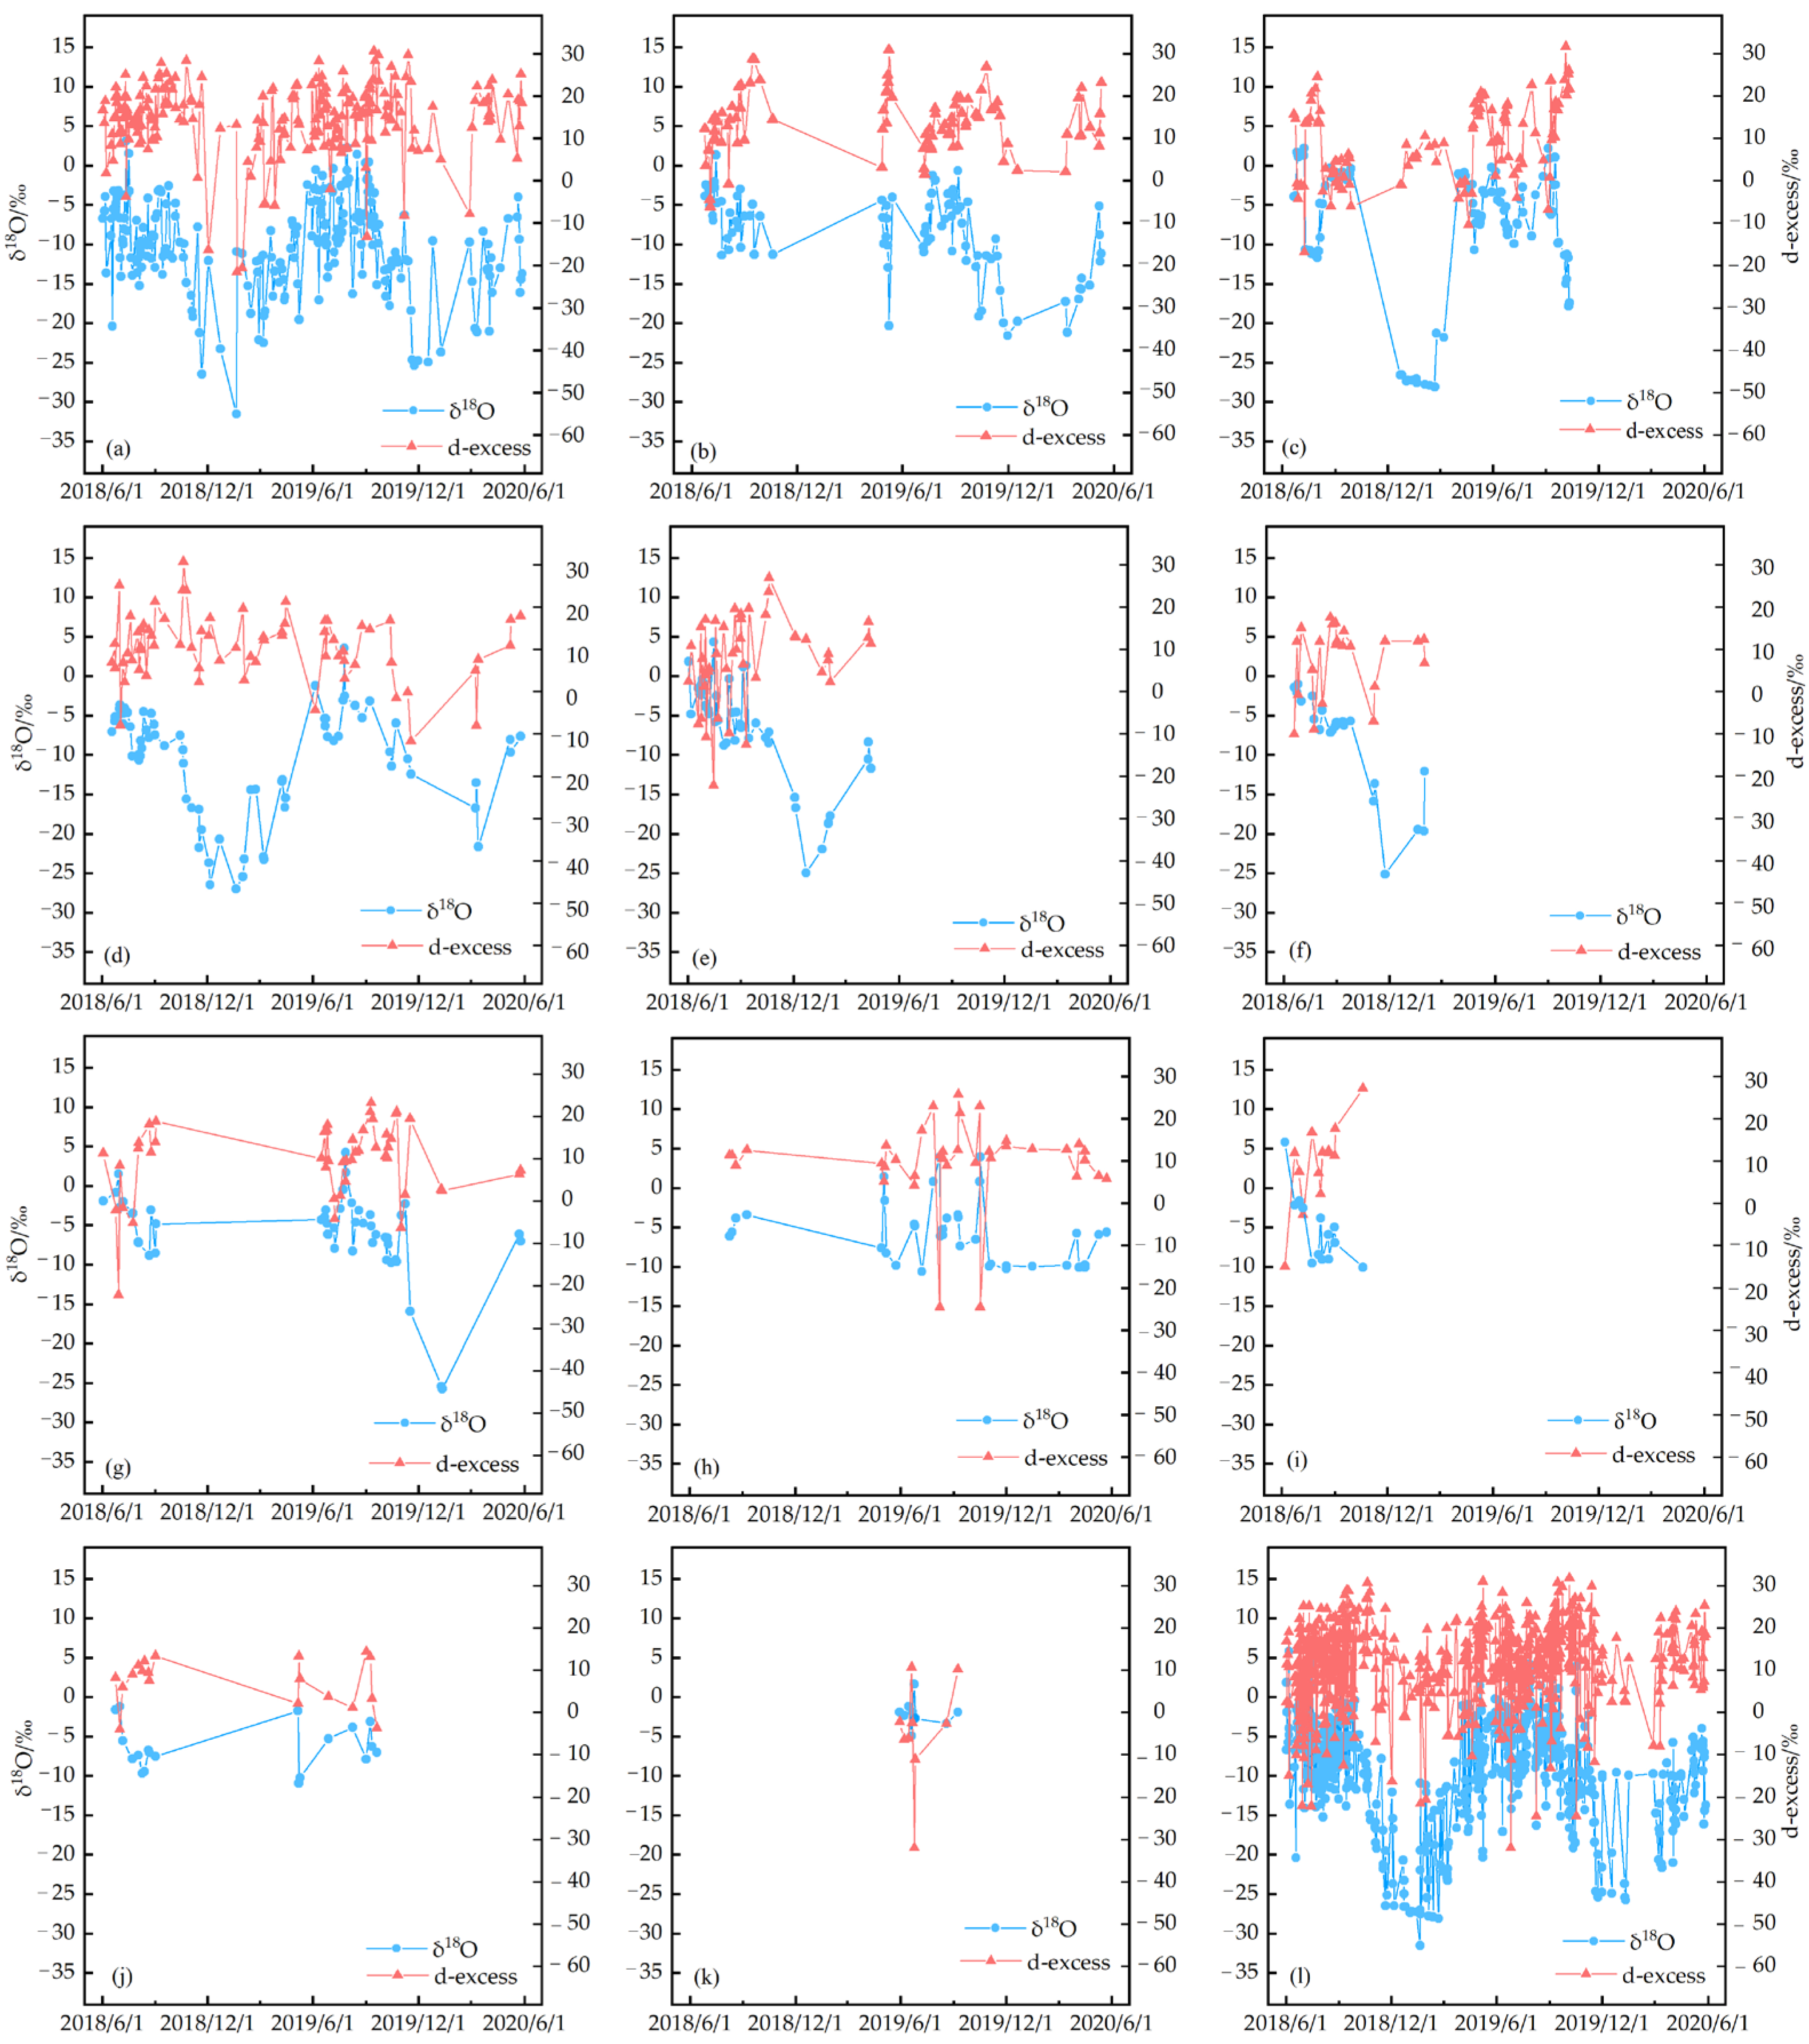
3.1.1. Daily Variations

For all precipitation events, the daily variation of δ18O values ranged from −31.5 to 5.8‰, with a weighted-average value of −8.0‰, and the variation of δ2H values ranged from −238.6 to 38.6‰, with a weighted-average value of −51.5‰ (Figure 2). Figure 2 shows the variation of δ18O values over time at each sampling point, among sample data of three sampling points (Xiyingzhen, Yangxiaba and Xuebaizhen) in the mid-downstream area mainly in the first hydrologic year. The daily variation ranges of δ18O values were larger in the upstream area, among which it was the largest at Lenglongling with the largest difference of 34.6‰. While they were smaller in the mid-downstream area, among which it was the smallest at Datanxiang with a difference of 9.8‰. The highest and lowest values of δ18O were 3.1‰ (Lenglongling, 12 July 2018) and −31.5‰ (Lenglongling, 19 January 2019) respectively in the upstream area, and they were 5.8‰ (Xuebaizhen, 6 June 2018) and −25.7‰ (Jiuduntan, 10 January 2020) respectively in the mid-downstream area. In addition, the δ18O values were also lower at Xiyingwugou, which may be related to the local microclimate influenced by the Xiying reservoir nearby [35]. The daily variations of δ18O and δ2H values had similarities, and all sampling points showed the characteristics of higher in the warm season (May–October) and lower in the cold season (November-April). For example, the δ18O and δ2H values at Lenglongling, Hulinzhan, Xiyingwugou and Jiuduntan appeared the highest values on 12 July 2018, 13 July 2018, 25 July 2019 and 27 July 2019 respectively, and appeared the lowest values on 19 January 2019, 30 November 2019, 19 January 2019 and 10 January 2020 respectively. Among all precipitation events, a total of 34 precipitation events had positive δ18O values, all of which occurred in summer and autumn.
The daily variation of d-excess values (or simply d-values) ranged from −32.0‰ to 31.8‰, with a weighted-average value of 12.7‰. The d-values in the upstream area varied in a wide range, among which it was the largest at Lenglongling with a difference of 52.1‰. While it is smaller in the mid-downstream area, among which it was the smallest at Datanxiang with a difference of 18.3‰. The highest and lowest values of d-excess were 31.8‰ (Huajianxiang, 5 October 2019) and −21.4‰ (Lenglongling, 20 January 2019) respectively in the upstream area, and they were 27.2‰ (Xuebaizhen, 19 October 2018) and −32.0‰ (Qingtuhu, 8 September 2019) in the mid-downstream area respectively. For each sampling point, the daily variation of d-values showed the same characteristics of higher in autumn but lower in summer. For example, the d-values at Huajianxiang, Xiyingzhen, Jiuduntan, Xuebaizhen and Datanxiang emerged the highest values on 5 October 2019, 19 October 2018, 9 September 2019, 19 October 2018 and 1 September 2019 respectively, and it emerged the lowest values on 9 July 2018, 15 July 2018, 29 June 2018, 6 June 2018 and 1 July 2018 respectively. For all precipitation events, 62.7% of d-values were greater than 10‰. In addition, 11.3% of the precipitation events had negative d-values, most of which occurred in summer. This may be related to the strong sub-cloud secondary evaporation effect caused by high temperatures.
The daily variation trend of δ18O values and d-values in the mid-downstream area was the opposite, while it was unobvious in the upstream area. This is because the below-cloud secondary evaporation is strong in the mid-downstream area, which makes δ18O values rise and d-values decrease, and further makes δ18O values and d-values show a reverse trend. However, as can be seen in Figure 3, the lifting condensation level (LCL) in the upstream region is lower than that in the middle-downstream region, so the distance of raindrop landing is shorter and the sub-cloud secondary evaporation is lower.

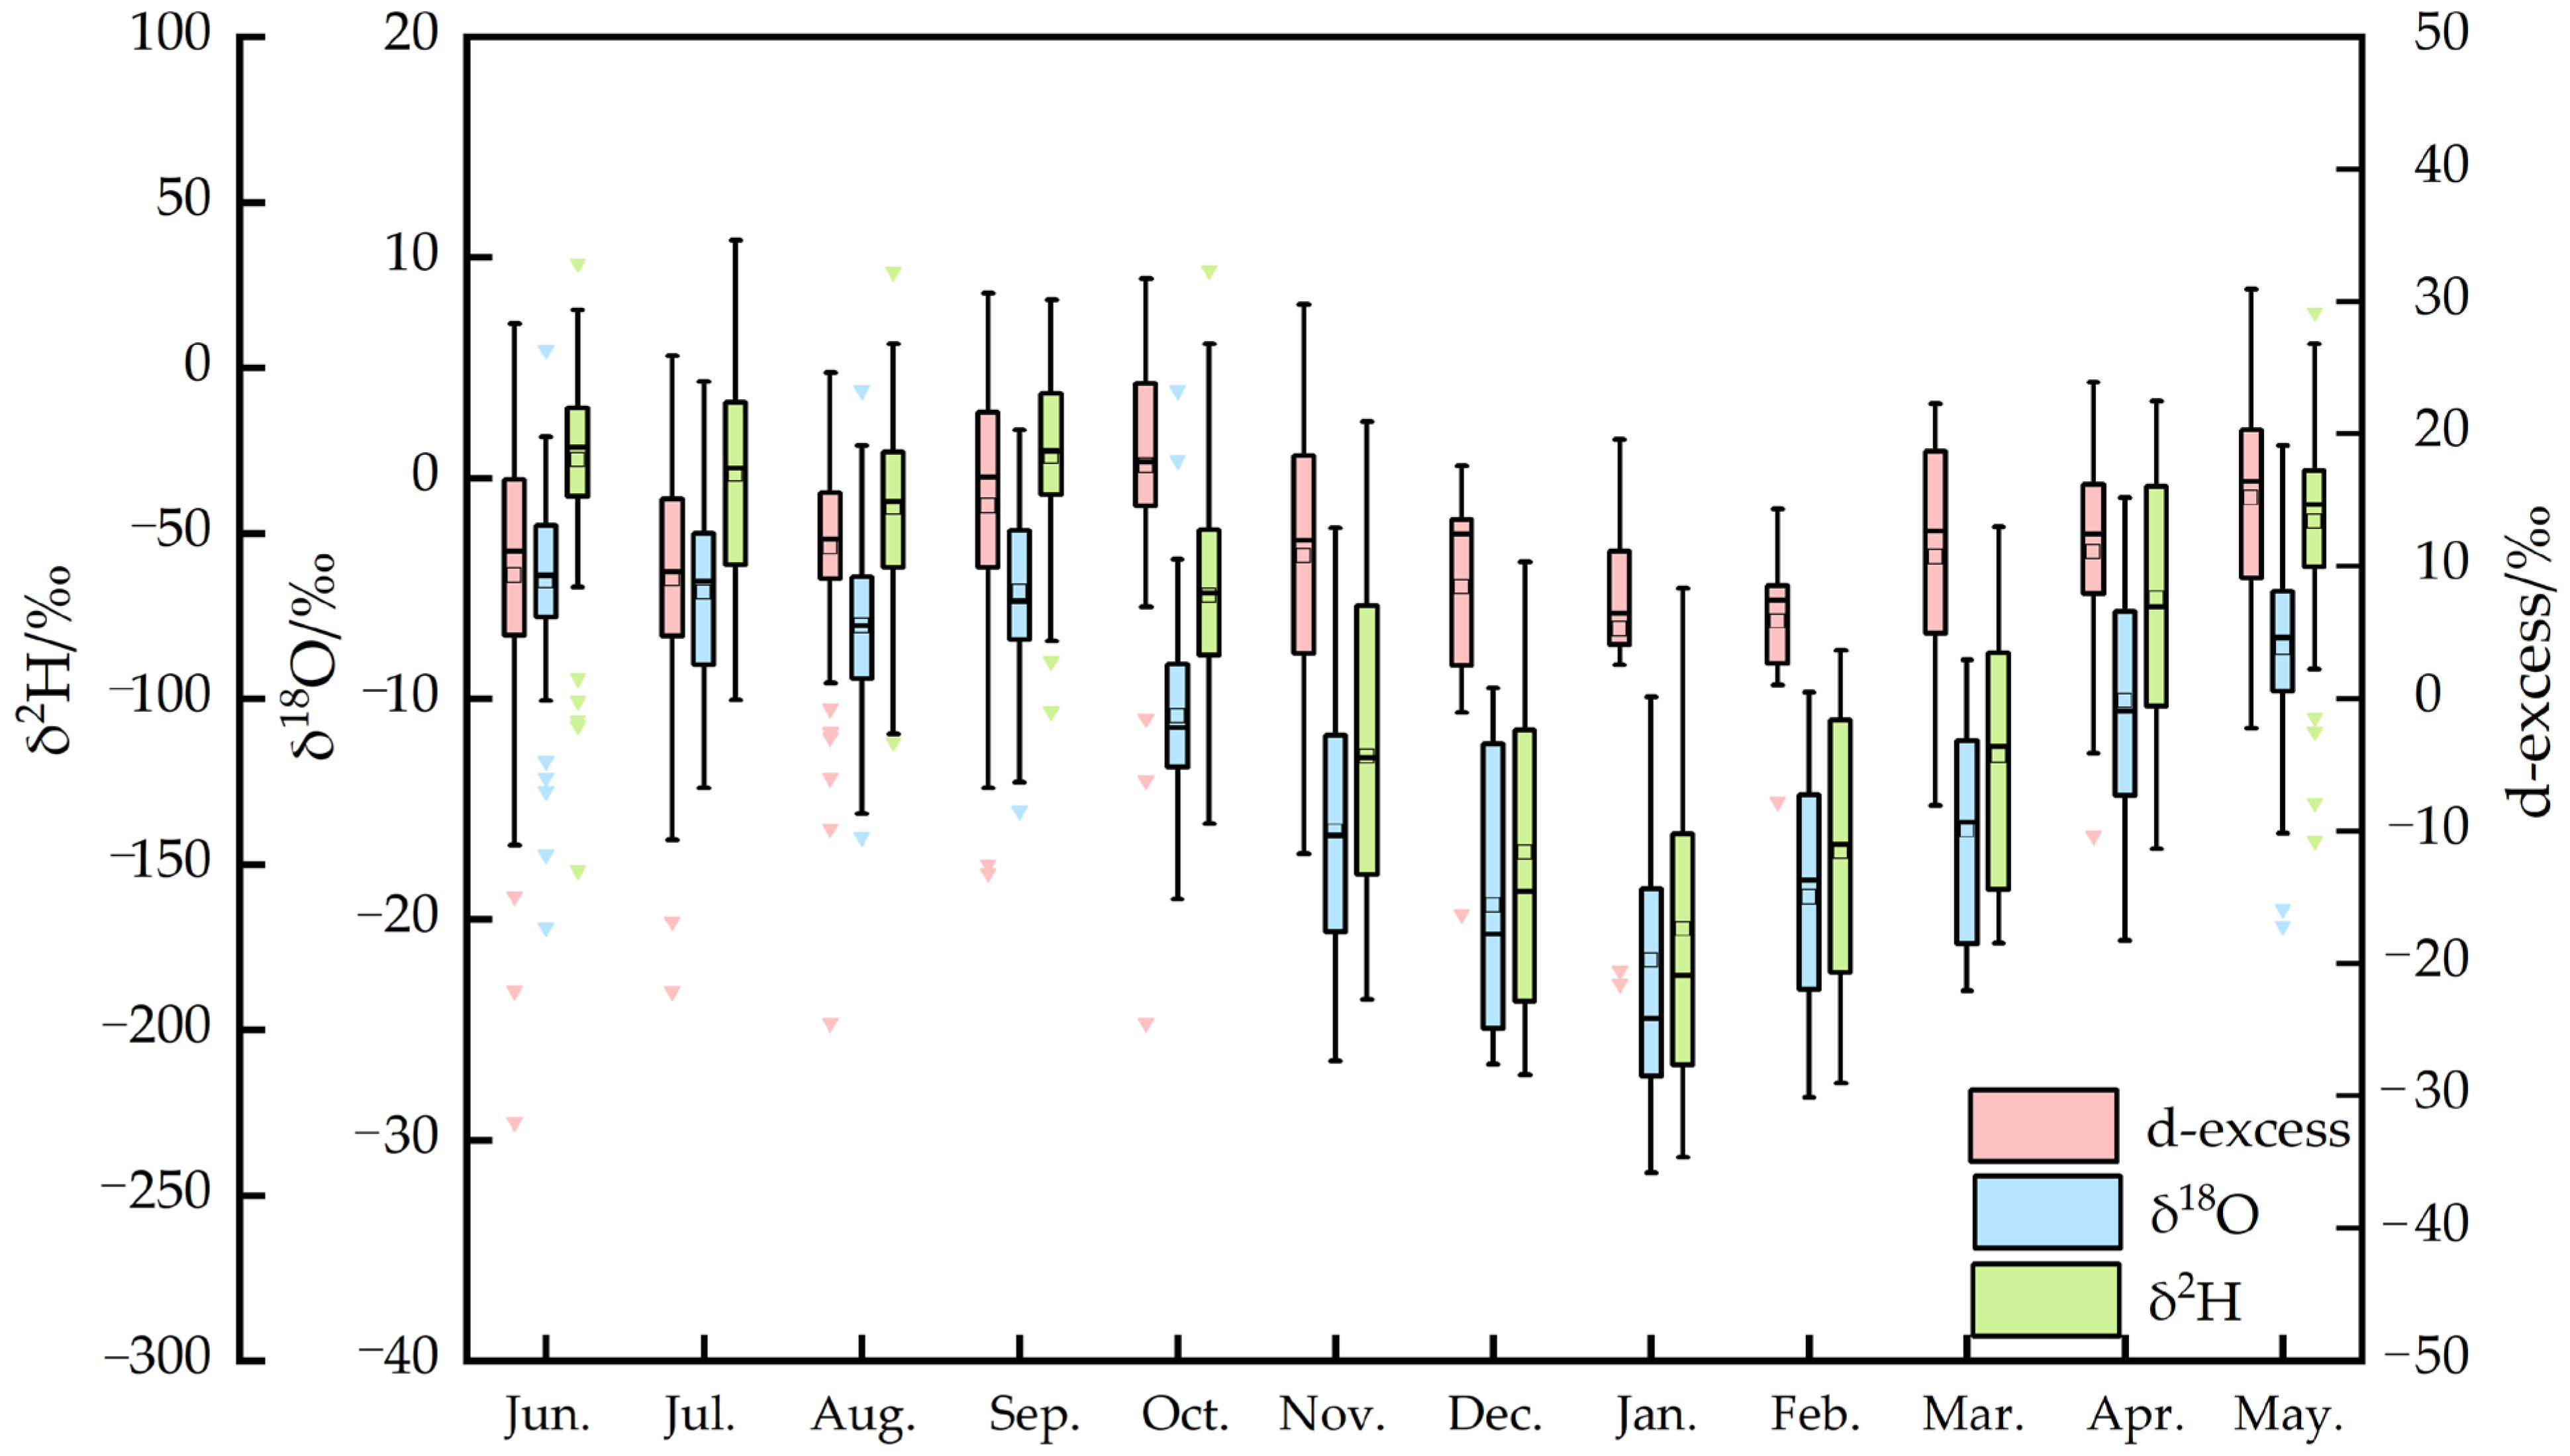
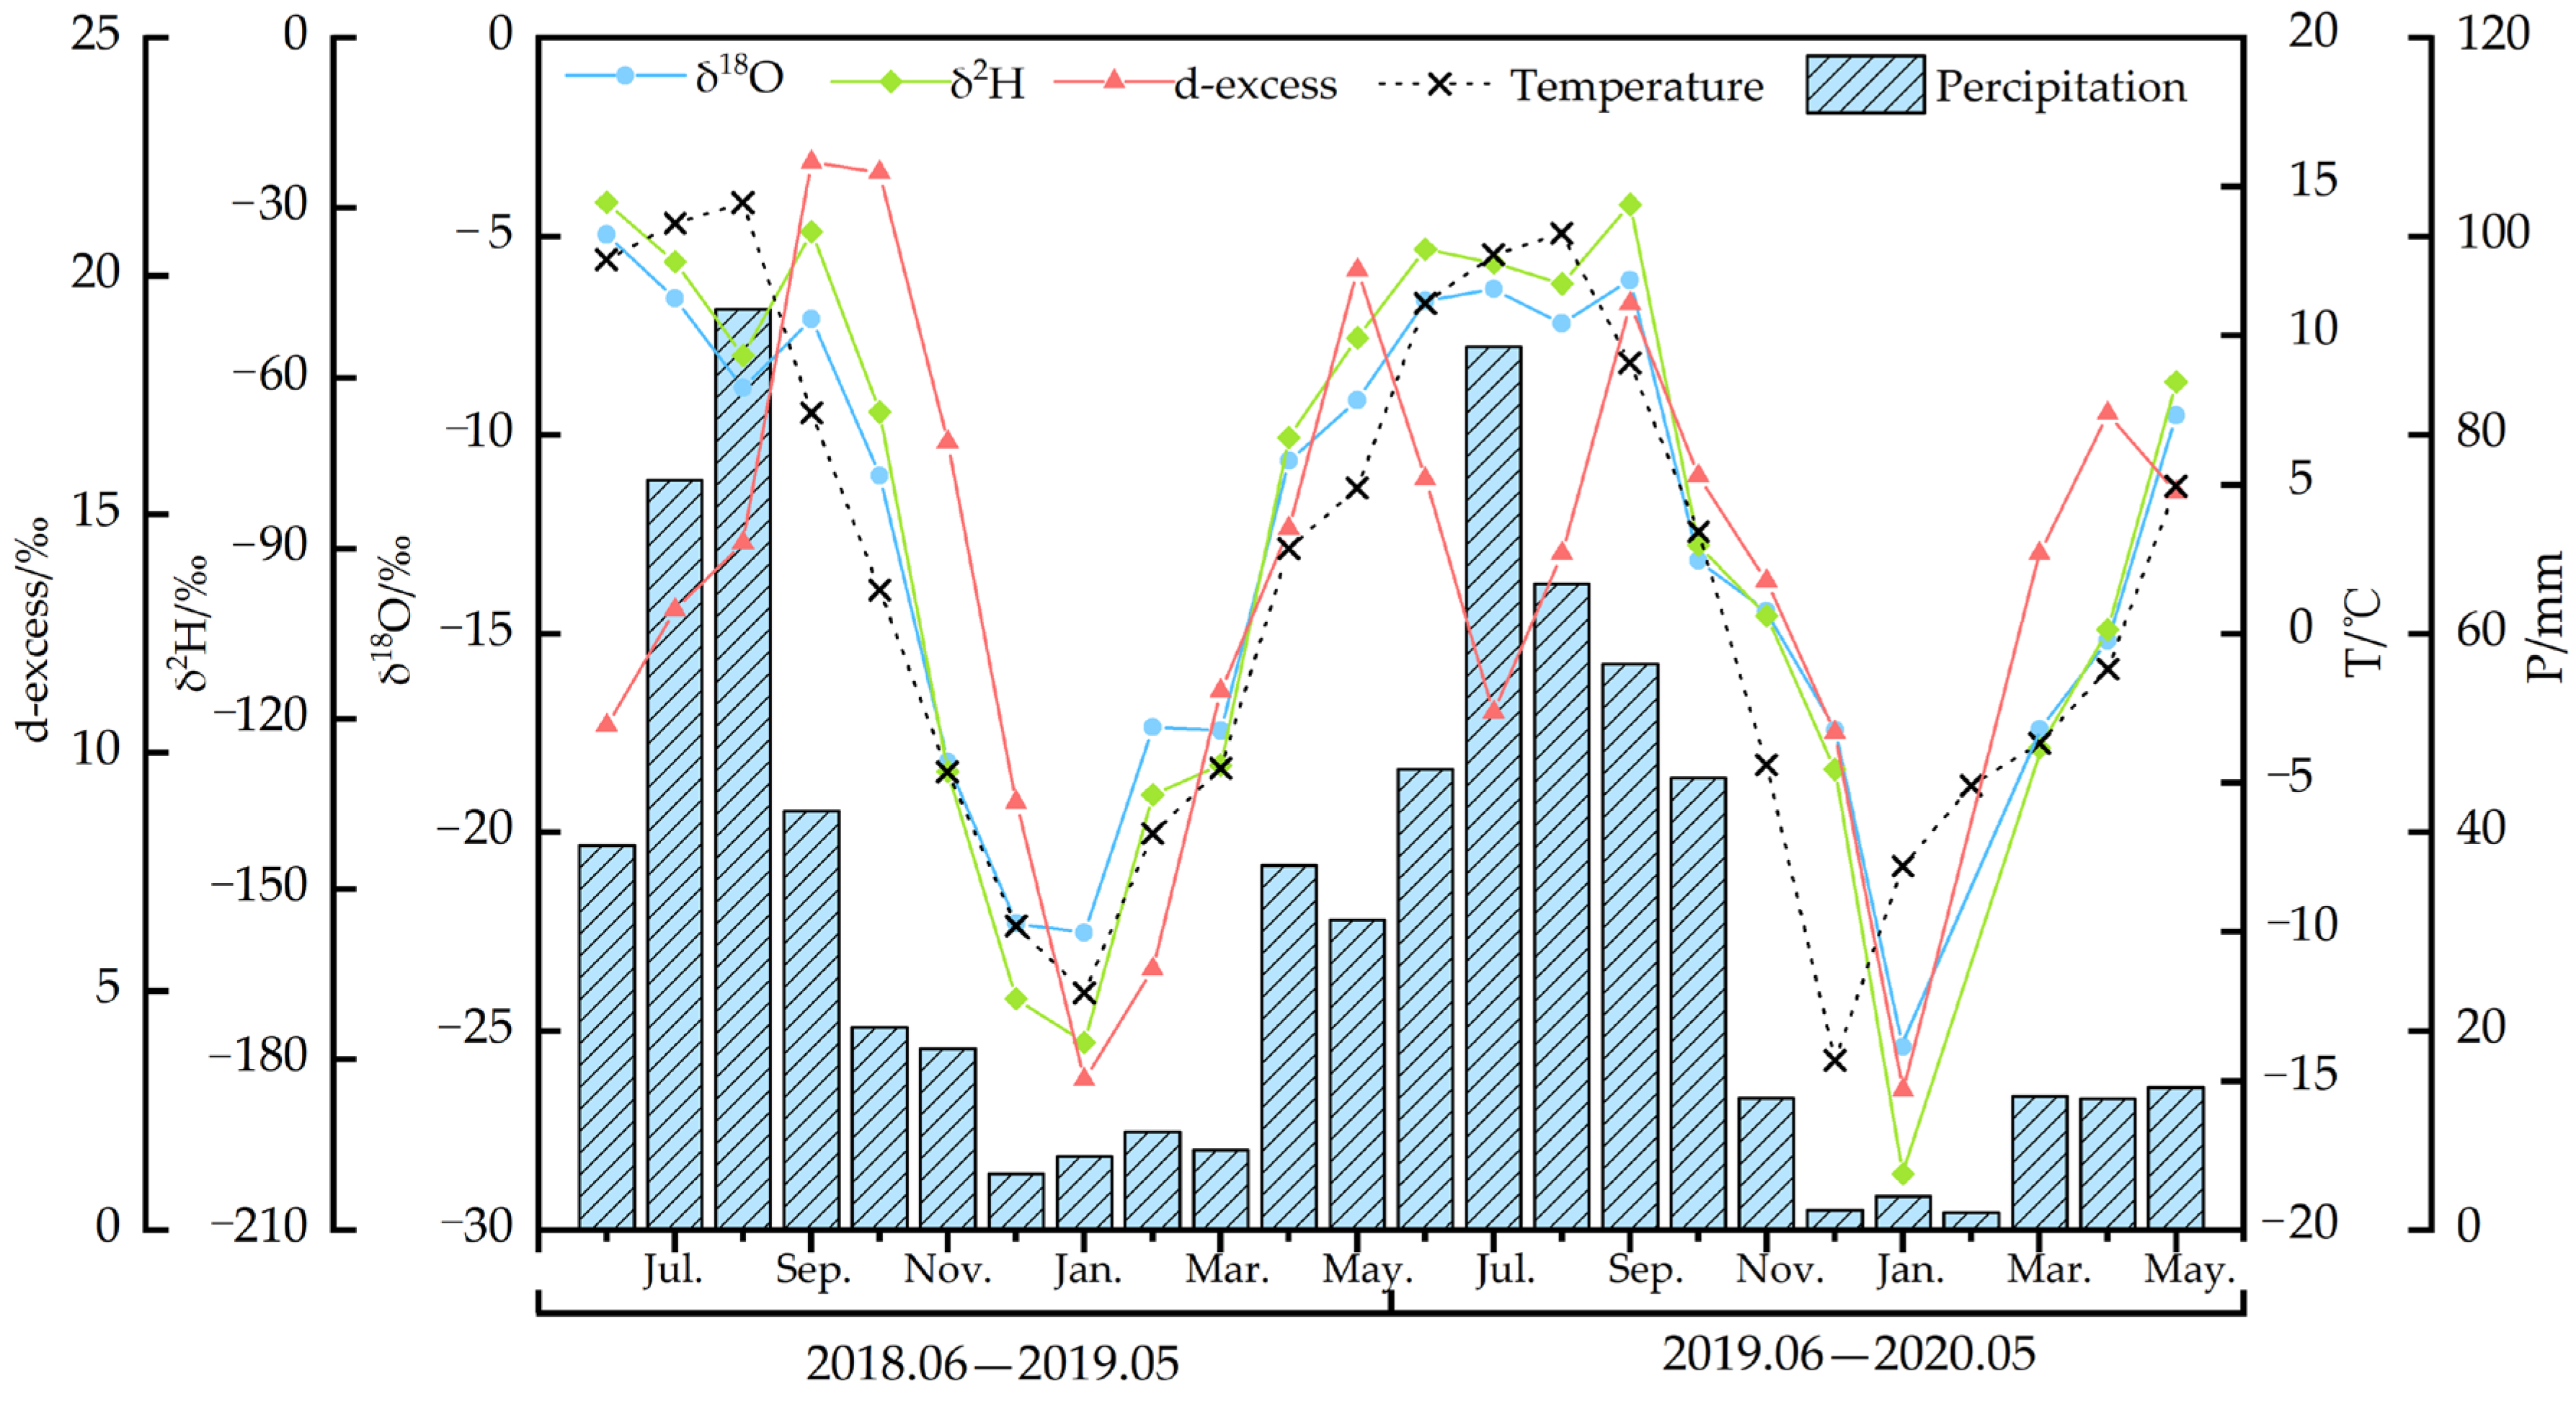
3.1.2. Monthly and Seasonal Variations

On the monthly scale (Figure 4), the maximum values of δ2H and δ18O values occurred in June and the minimum values occurred in January. δ2H and δ18O values showed consistent trends, maintaining high values from June to September, a decreasing trend from September to January and an increasing trend from January to June. On the seasonal scale, the weighted-average values of δ2H were −64.0‰, −39.3‰, −51.8‰ and −164.9‰ in spring, summer, autumn and winter respectively, and those of δ18O were −9.9‰, −6.3‰, −8.5‰ and −21.4‰ respectively. The seasonal variations of δ2H and δ18O values showed that summer > autumn > spring > winter. It can be seen that the seasonal variation characteristics of stable isotopes in precipitation were higher in summer and autumn but lower in winter and spring. The low values of δ2H and δ18O were mostly found in winter because of the low temperature and the depletion of moisture after long-distance transport [16]. In the study area, moisture in winter is mainly transported by westerly, which originated from the Atlantic passes through Central Asia and then encounters mountains to form precipitation, leading to stable isotope depletion through Rayleigh fractionation during longer distance transportation [36]. As the temperature increases in spring, the values of δ2H and δ18O gradually increase. This is because the higher temperature during condensation influences equilibrium fractionation between water vapor and raindrops, and raindrops are influenced by sub-cloud secondary evaporation during their fall to the Earth’s surface, making the values of δ2H and δ18O gradually increase and appear high values in summer. The opposite was true after autumn when the decreasing temperature led to the values of δ2H and δ18O gradually decreasing. In summer, local moisture is continuously infiltrated along the way during transportation, which compensates for the depletion of the isotopes.
The maximum value of d-excess occurred in October and the minimum value occurred in January. The values of d-excess increased from June to October, decreased from October to January and increased again from January to May. The weighted-average values of d-excess were 14.8‰, 11.1‰, 16.2‰ and 6.5‰ in spring, summer, autumn and winter respectively. The seasonal variation of d-values showed autumn > spring > summer > winter and showed the characteristics of higher in spring and autumn and lower in winter and summer. Overall, spring and summer are primarily influenced by the moisture source area but autumn and winter are primarily influenced by secondary processes. Zhang et al. [36] pointed out that as the lower relative humidity of the westerly moisture source area causes higher d-values in spring, but influenced by the monsoon moisture, the d-values are lower in summer, however, the higher contribution of local recycling moisture causes higher d-values in autumn. In winter, the raindrops that fall in the dry atmosphere are influenced by sub-cloud secondary evaporation, which reduces lower d-values.

3.1.3. Interannual Variations

As stable isotope data of four sampling stations at Lenglongling, Hulinzhan, Xiyingwugou and Jiuduntan from June 2018 to May 2020 were continuous, we used data from these four stations to compare the characterization of precipitation isotopes for the two hydrologic years in June 2018/May 2019 and June 2019/May 2020 (Three of these sites, Lenglongling, Hulinzhan and Xiyingwugou, are located upstream, therefore yield results are more consistent with the characteristics of the upstream area). From the inter-annual trends (Figure 2l and Figure 5), δ2H, δ18O and d-values all showed regular and periodic seasonal variations, i.e., δ2H and δ18O values were higher in summer and autumn and lower in winter and spring, while d-values were higher in spring and autumn and lower in winter and summer. However, inter-annual variations of δ2H and δ18O values were different because the seasonal fluctuations were stronger in the hydrological year of June 2018/May 2019 than in the hydrological year of June 2019/May 2020. The δ2H and δ18O values appeared a rapidly decreasing trend for the former but a slowly and steadily decreasing trend for the latter from June to August. As seen in Figure 5, the precipitation was more in 2018 than in 2019 and it was month-by-month increasing from June to August in 2018, which showed that it had a more significant precipitation effect on δ2H and δ18O values during the summer in 2018. Meanwhile, the inter-annual variation of d-values was also different in that its value in June was lower in the hydrological year of June 2018/May 2019 than in the hydrological year of June 2019/May 2020 significantly. A total of two persistent precipitation events of more than 3 days occurred in June 2018, which all occurred at Lenglongling (16 June 2018 to 18 June 2018 and 23 June 2018 to 27 June 2018). A total of six persistent precipitation events of more than 3 days occurred in June 2019, of which four occurred at Lenglongling (3 June 2019 to 6 June 2019, 9 June 2019 to 11 June 2019, 13 June 2019 to 17 June 2019 and 20 June 2019 to 27 June 2019), once occurred at Xiyingwugou (21 June 2019 to 23 June 2019) and once occurred at Jiuduntan (25 June 2019 to 27 June 2019). During the persistent precipitation, the relative humidity increased and the local moisture recirculation was enhanced, which made the d-values higher.
For the hydrological year of June 2018/May 2019, the precipitation samples were 209, the annual precipitation was 386.4 mm, mean temperature was 1.6 °C, and the variations of δ2H, δ18O and d-values ranged from −238.6 to 22.3‰, −31.5 to 3.2‰ and −22.1 to 31.0‰ respectively, and the weighted-average values were −60.3‰, −9.41‰ and 15.03‰ respectively. For the hydrological year of June 2019/May 2020, the precipitation samples were 221, the annual precipitation was 362.5 mm, mean temperature was 1.5 °C, and the variations of δ2H, δ18O and d-values ranged from −203.4 to 35.9‰, −25.7 to 3.6‰ and −13.2 to 30.6‰ respectively, and the weighted-average values were −55.4‰, −8.8‰ and 14.6‰ respectively. Compared to the hydrological year of June 2019/May 2020, though there were higher mean temperatures and fewer precipitation events, the more precipitation in the hydrological year of June 2018/May 2019 caused the isotope values to have smaller variation ranges and lower mean values, which indicated the precipitation had a significant effect on the variation of stable isotopes.

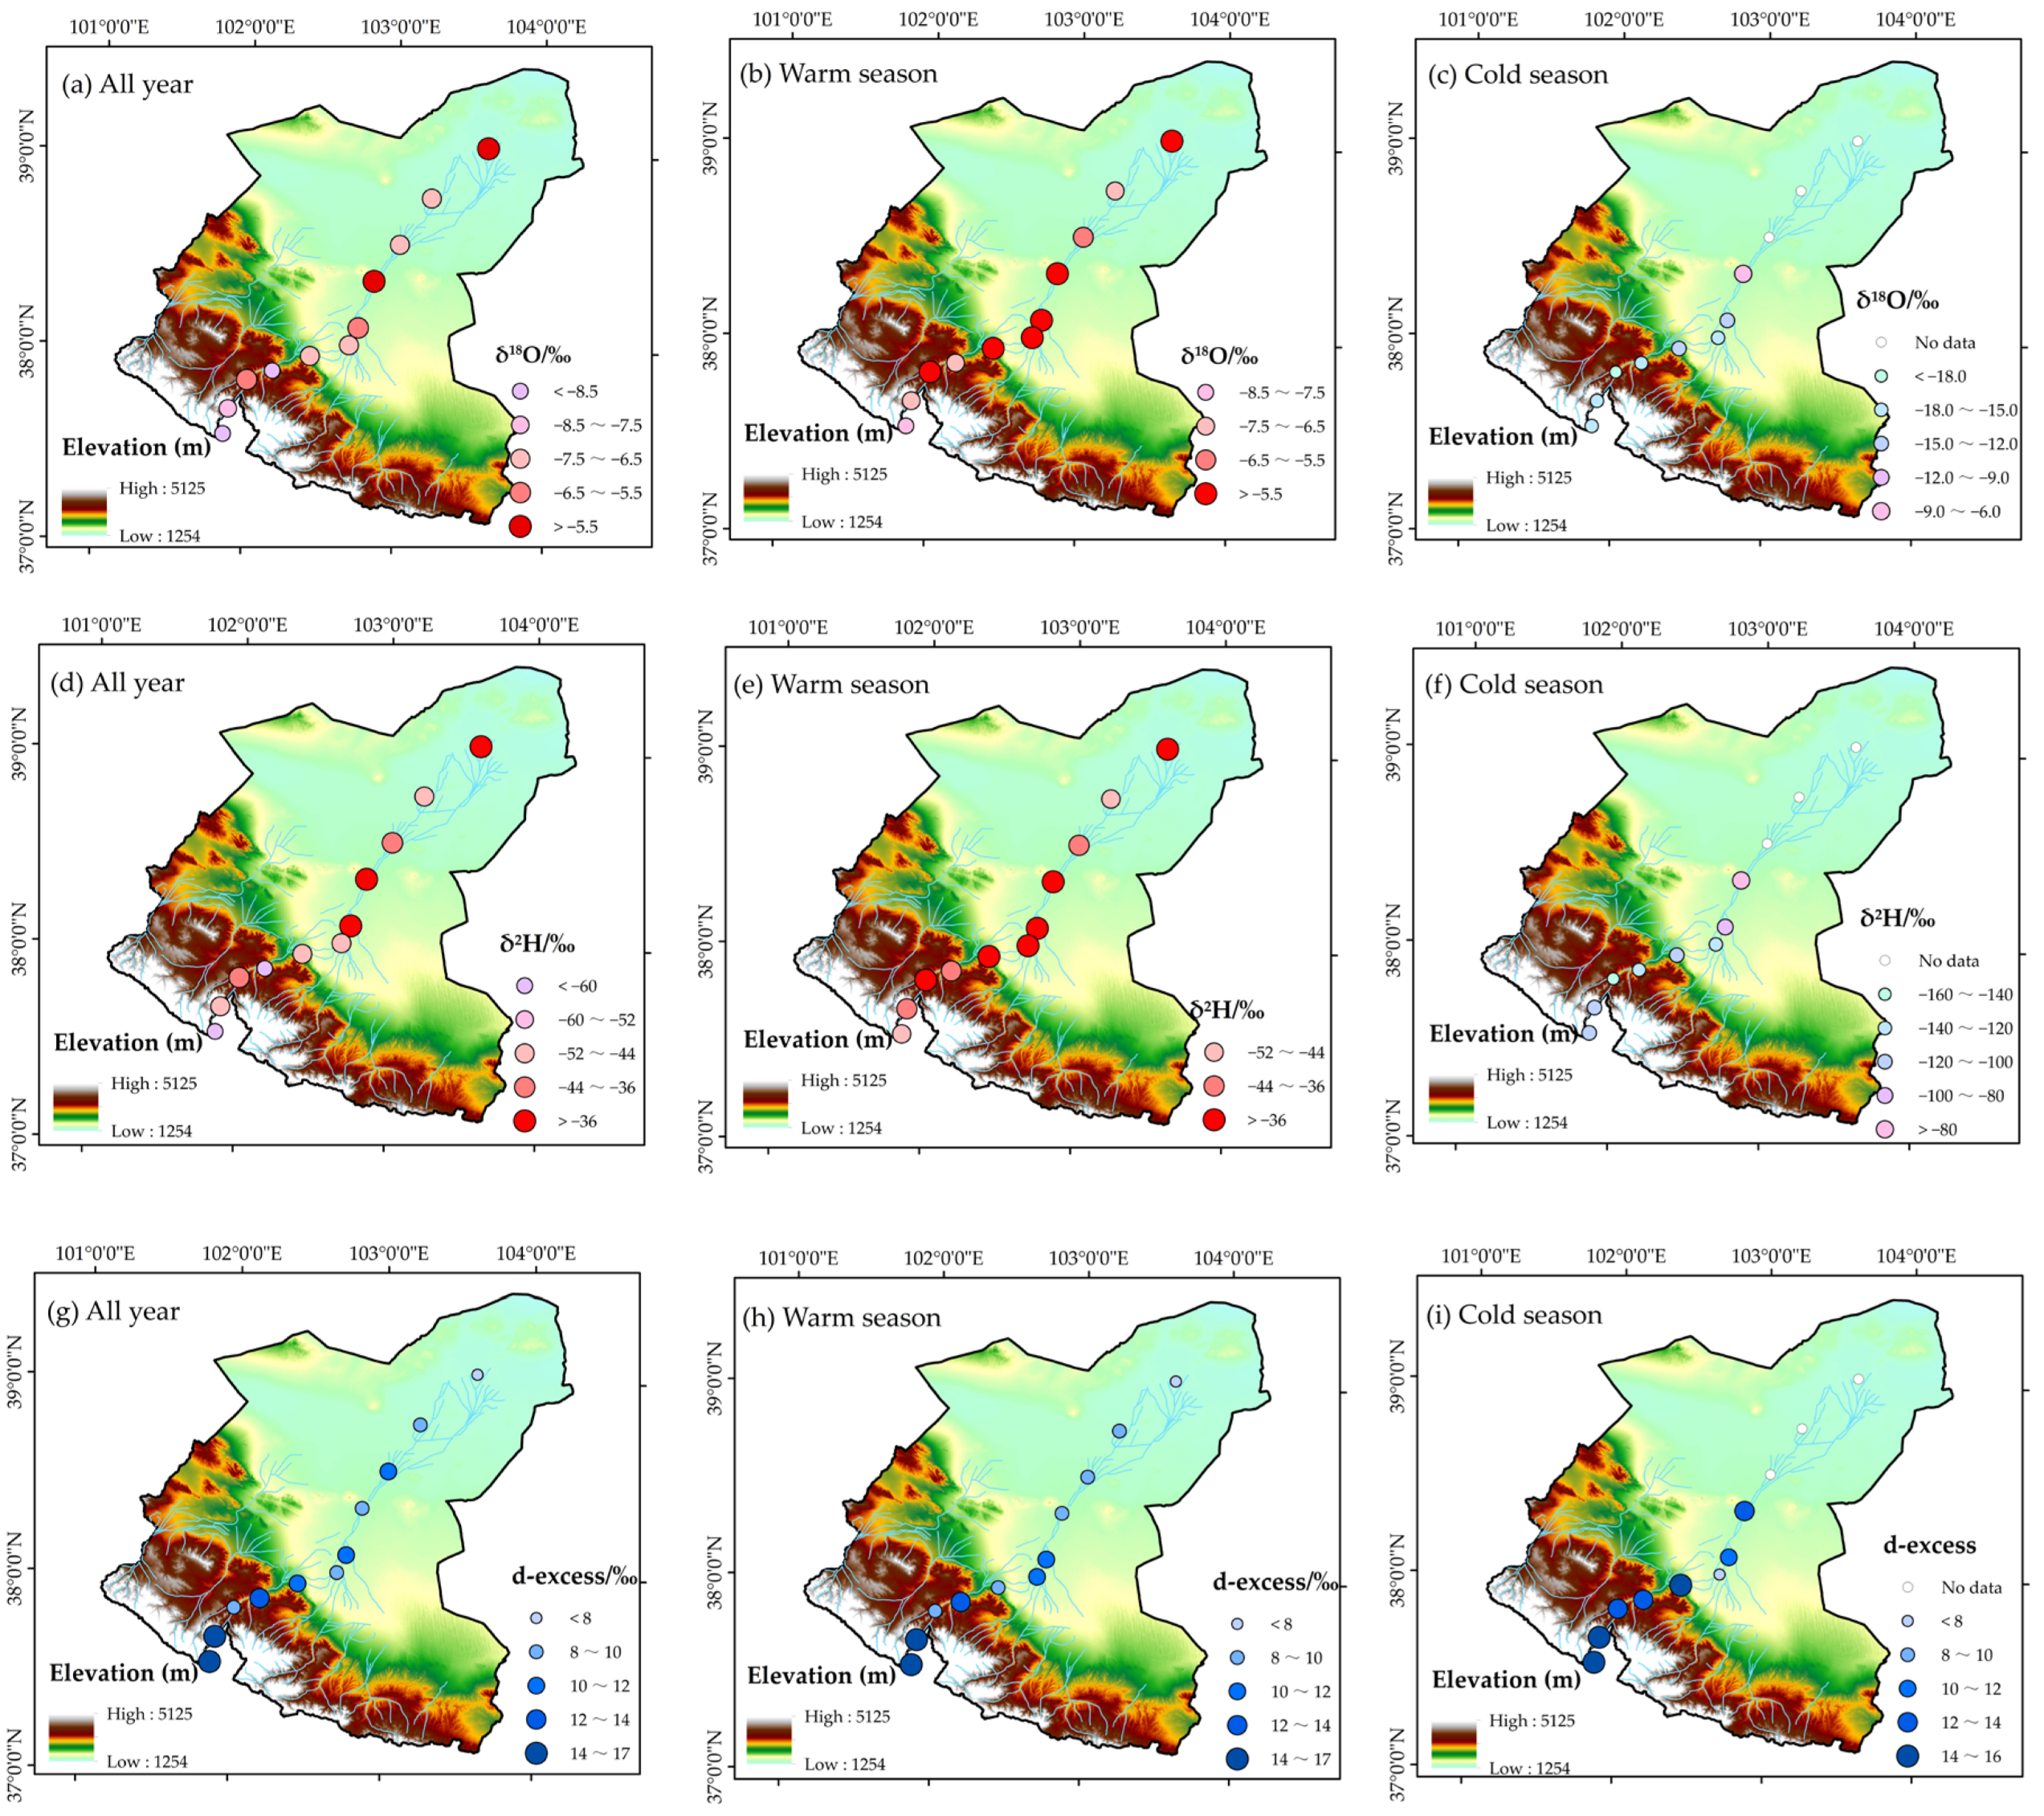
3.2. Spatial Variation Characteristics of Stable Isotopes of Precipitation

3.2.1. Spatial Variations of Stable Isotopes

Divided into all year, warm season (May–October), and cold season (November-April), the spatial variations of stable isotopes in the Shiyang River Basin were drawn (Figure 6). The high values of δ18O and δ2H in all year were mainly distributed in the mid-downstream area, and the low values of them were distributed in the upstream area, reflecting that δ2H and δ18O values decreased with the elevation increasing (Figure 6a,d). The spatial variation of d-values was opposite to δ18O and δ2H values (Figure 6g). During the warm season (Figure 6b,e,h) and cold season (Figure 6c,f,i), the spatial variations of δ2H, δ18O and d-values were consistent with all year. It has been established that the stable isotope decreases with the elevation increasing when water vapor lifts along a certain slope [37], which exhibits the elevation effect. In all year, warm season and cold season, the elevation effects of δ2H in the Shiyang River Basin were −1.19‰/100 m, −1.55‰/100 m and −0.6‰/100 m respectively, and those of δ18O were −0.20‰/100 m, −0.23‰/100 m and −0.12‰/100 m respectively, and those of d-excess were 0.38‰/100 m, 0.28‰/100 m and 0.33‰/100 m respectively. The elevation effect of stable isotope in precipitation is actually a reflection of the temperature effect, where the temperature gradually decreases with elevation increasing and the stable isotope in precipitation also gradually decreases [6,22]. Guo et al. [38] concluded that the mean δ18O value in precipitation in Guilin City was −5.6‰. Zhang et al. [39] concluded that the mean values of δ18O in precipitation in the Tsaidam-Qinghai Lake region and Junggar-Tuha region were −8.7‰ and −9.1‰, respectively. In this study, the mean value of δ18O in precipitation in the Shiyang River basin was −8.0‰, which was lower than that of the coastal area and higher than that of the inland areas, reflecting the gradual depletion of stable isotopes of precipitation from the coast to the inland. In the distribution map of precipitation stable isotope contours in China drawn by Kong et al. [40], δ18O and δ2H show a general trend of depletion from south to north and from east to west, of which the contour lines in the Shiyang River basin area show a decreasing trend from northeast to southwest. This is consistent with the decreasing trend of δ18O and δ2H with increasing altitude in this study.

3.2.2. Spatial Variations of the Local Atmospheric Waterline

Based on 688 event scale precipitation samples, using the PWLSR method, the LMWL of the Shiyang River Basin was established: δ2H = (7.6 ± 0.1) δ18O + (9.8 ± 0.5) (R2 = 0.97, p < 0.01, n = 688). The slope and intercept of the LMWL were slightly smaller than that of the GMWL [15], indicating a relatively dry climate and strong evaporation in the study area. The upstream and Mid-downstream LMWL were: δ2H = (7.7 ± 0.1) δ18O + (11.4 ± 0.6) (R2 = 0.97, p < 0.01, n = 500) and δ2H = (7.4 ± 0.1) δ18O + (6.1 ± 1.1) (R2 = 0.95, p < 0.01, n = 188), respectively. Studies have shown that the LMWL of the semi-arid region generally has a lower slope and intercept [41,42]. Compared to upstream, the LMWL of Mid-downstream has lower slope and intercept values, reflecting a drier climate with more intense evaporation.
As shown in Table 2, the slope of LMWL at Lenglongling was the highest in the whole basin, and that was the lowest at Xuebaizhen. It can be seen that the slope of LMWL increased with the elevation increasing, which was related to the decreasing of temperature and the weakening of the evaporation effect. The intercept of LMWL also showed an increasing trend with the elevation increasing. The intercept of LMWL was the highest at Lenglongling and the lowest at Qingtuhu. The intercept of LMWL was related to sub-cloud secondary evaporation and local moisture circulation. As the elevation increased, the temperature and evaporation gradually decreased while the precipitation, relative humidity and local moisture circulation gradually increased, which led to the slope and intercept of LMWL gradually increasing correspondingly.
Overall, the slope and intercept of LMWL were higher in the upstream area than in the mid-downstream area. In the arid region of the northwest China, the slope and intercept of LMWL are generally low at the river downstream and generally high at the river upstream [43,44], which is consistent with the results of this study. It has been shown that local recycling moisture can lead to them increase, but the effect of sub-cloud secondary evaporation can cause them to decrease [45,46,47,48]. The more rainfall and low temperature in the upstream area make δ2H values more enriched than δ18O values in the precipitation process [43], and the d-excess value increases significantly, further leading to the higher slope and intercept of LMWL [49], however, little precipitation, high temperature, strong evaporation and low relative humidity in the mid-downstream area led to them lower [43], furthermore, topography and subsurface were also important factors affecting them in the arid area of central Asia [50]. In the upstream area, the higher elevation results in a lower temperature, weaker evaporation and more rainfall because of topographic uplift, and the higher vegetation cover causes a higher slope and intercept of the LMWL [43,49]. In the mid-downstream area, the lower elevation, resulting in a higher temperature and stronger sub-cloud secondary evaporation, and the lower vegetation cover cause the lower slope and intercept of LMWL.

4. Discussion

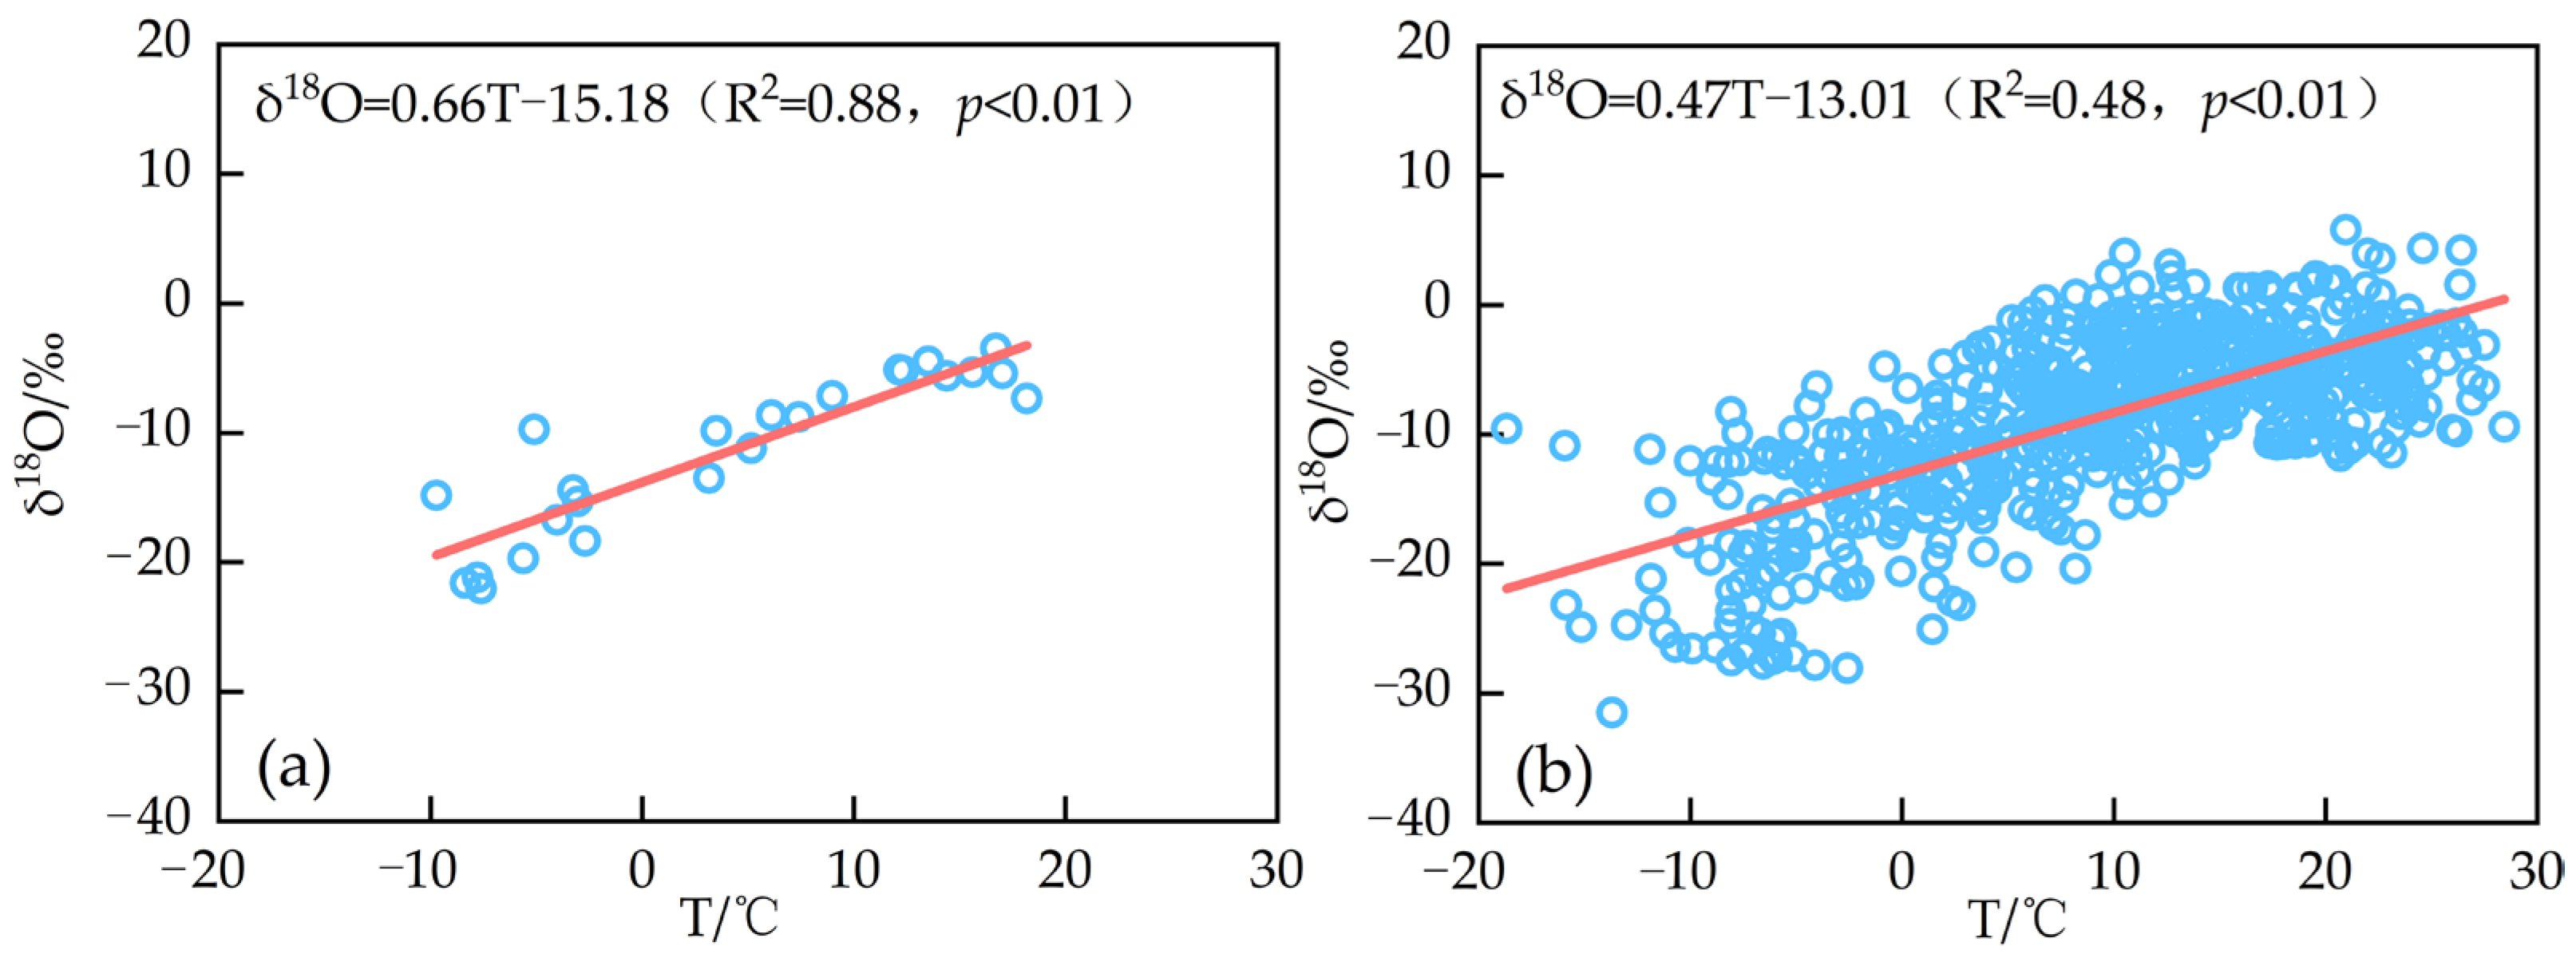
4.1. Relationship between Stable Isotopes in Precipitation and Temperature

At the monthly scales, the linear equations of δ2H, δ18O, and d-excess versus temperature T (°C) in the Shiyang River Basin were obtained as follows: δ2H = 5.42T − 109.69 (R2 = 0.86, p < 0.01), δ18O = 0.66T − 15.18 (R2 = 0.88, p < 0.01) (Figure 7a), and d-excess = 0.15T + 11.75 (R2 = 0.09). At the daily scale, the linear equations of them were: δ2H = 3.61T − 90.94 (R2 = 0.46, p < 0.01), δ18O = 0.47T − 13.01 (R2 = 0.48, p < 0.01) (Figure 7b), d-excess = −0.15T + 13.11 (R2 = 0.02, p < 0.01). At the daily and monthly scales, δ2H and δ18O in the Shiyang River Basin exhibited significant temperature effects, in which δ2H and δ18O were positively correlated with T. At the daily scale, d-excess showed a negative correlation with T. Those were consistent with the results that the stable isotopes of precipitation in the arid area of the northwest China exist the temperature effect [2,19,51].
Because of the good correlation between δ18O and δ2H, δ18O was used mainly for the analysis. The precipitation was divided into three groups according to the temperature: T < 0 °C, 0–10 °C and T > 10 °C (Table 3, Figure 8). From Figure 8a and Table 3, it can be seen that δ18O showed an increasing trend with the temperature increasing. Especially, when the temperature increased from 0 °C to 10 °C, the increasing extent of δ18O with temperature and the correlation coefficient r was the largest. The d-excess showed a decreasing trend when T > 0 °C, and the decreasing extent of d-excess was the largest when T > 10 °C.
At the whole basin scale, when T < 0 °C, the temperature effect was 0.52‰/°C, and the d-excess was positively correlated with T. At this temperature, precipitation was usually snowfall, and stable isotope changes were influenced by equilibrium fractionation [2,27,52]. When 0 °C < T < 10 °C, the temperature effect was 0.77‰/°C, but the d-excess showed a weak negative correlation with T. At this temperature, the temperature effect was the most significant and the stable isotope concentration of precipitation was influenced by below-cloud secondary evaporation. When the temperature was greater than 10 °C, the temperature effect was not obvious, but the d-excess showed an obvious negative correlation with T and its temperature effect was −0.39‰/°C. The temperature in the Shiyang River Basin is relatively high in the summer half-year when the precipitation is relatively concentrated. The effect of sub-cloud secondary evaporation will be weakened with the increase in precipitation [53]. At the same time, the higher temperature-induced isotope enrichment and the circulating water vapor-induced isotope depletion make the variation of δ18O with T in a relatively stable state [54]. Thus, the r between δ18O and T is small at this temperature. Influenced by monsoon moisture in the summer half-year [55], there was an obvious negative correlation between d-excess and T.
The temperature effects showed regional differences in different temperature conditions (Table 3, Figure 8). When T < 0 °C, the temperature effect was obvious in the upstream area. When 0 °C < T < 10 °C, the temperature effect was more significant in the mid-downstream area than in the upstream area. When T > 10 °C, the temperature effect weakened in the mid-downstream area, while δ18O and temperature showed a weak negative correlation in the upstream area. At this temperature, the negative correlation between d-excess and T was obvious in the mid-downstream area. This was because the stable isotopes in precipitation were more affected by sub-cloud secondary evaporation in the mid-downstream area, while they were more influenced by local recirculated moisture in the upstream area [43].

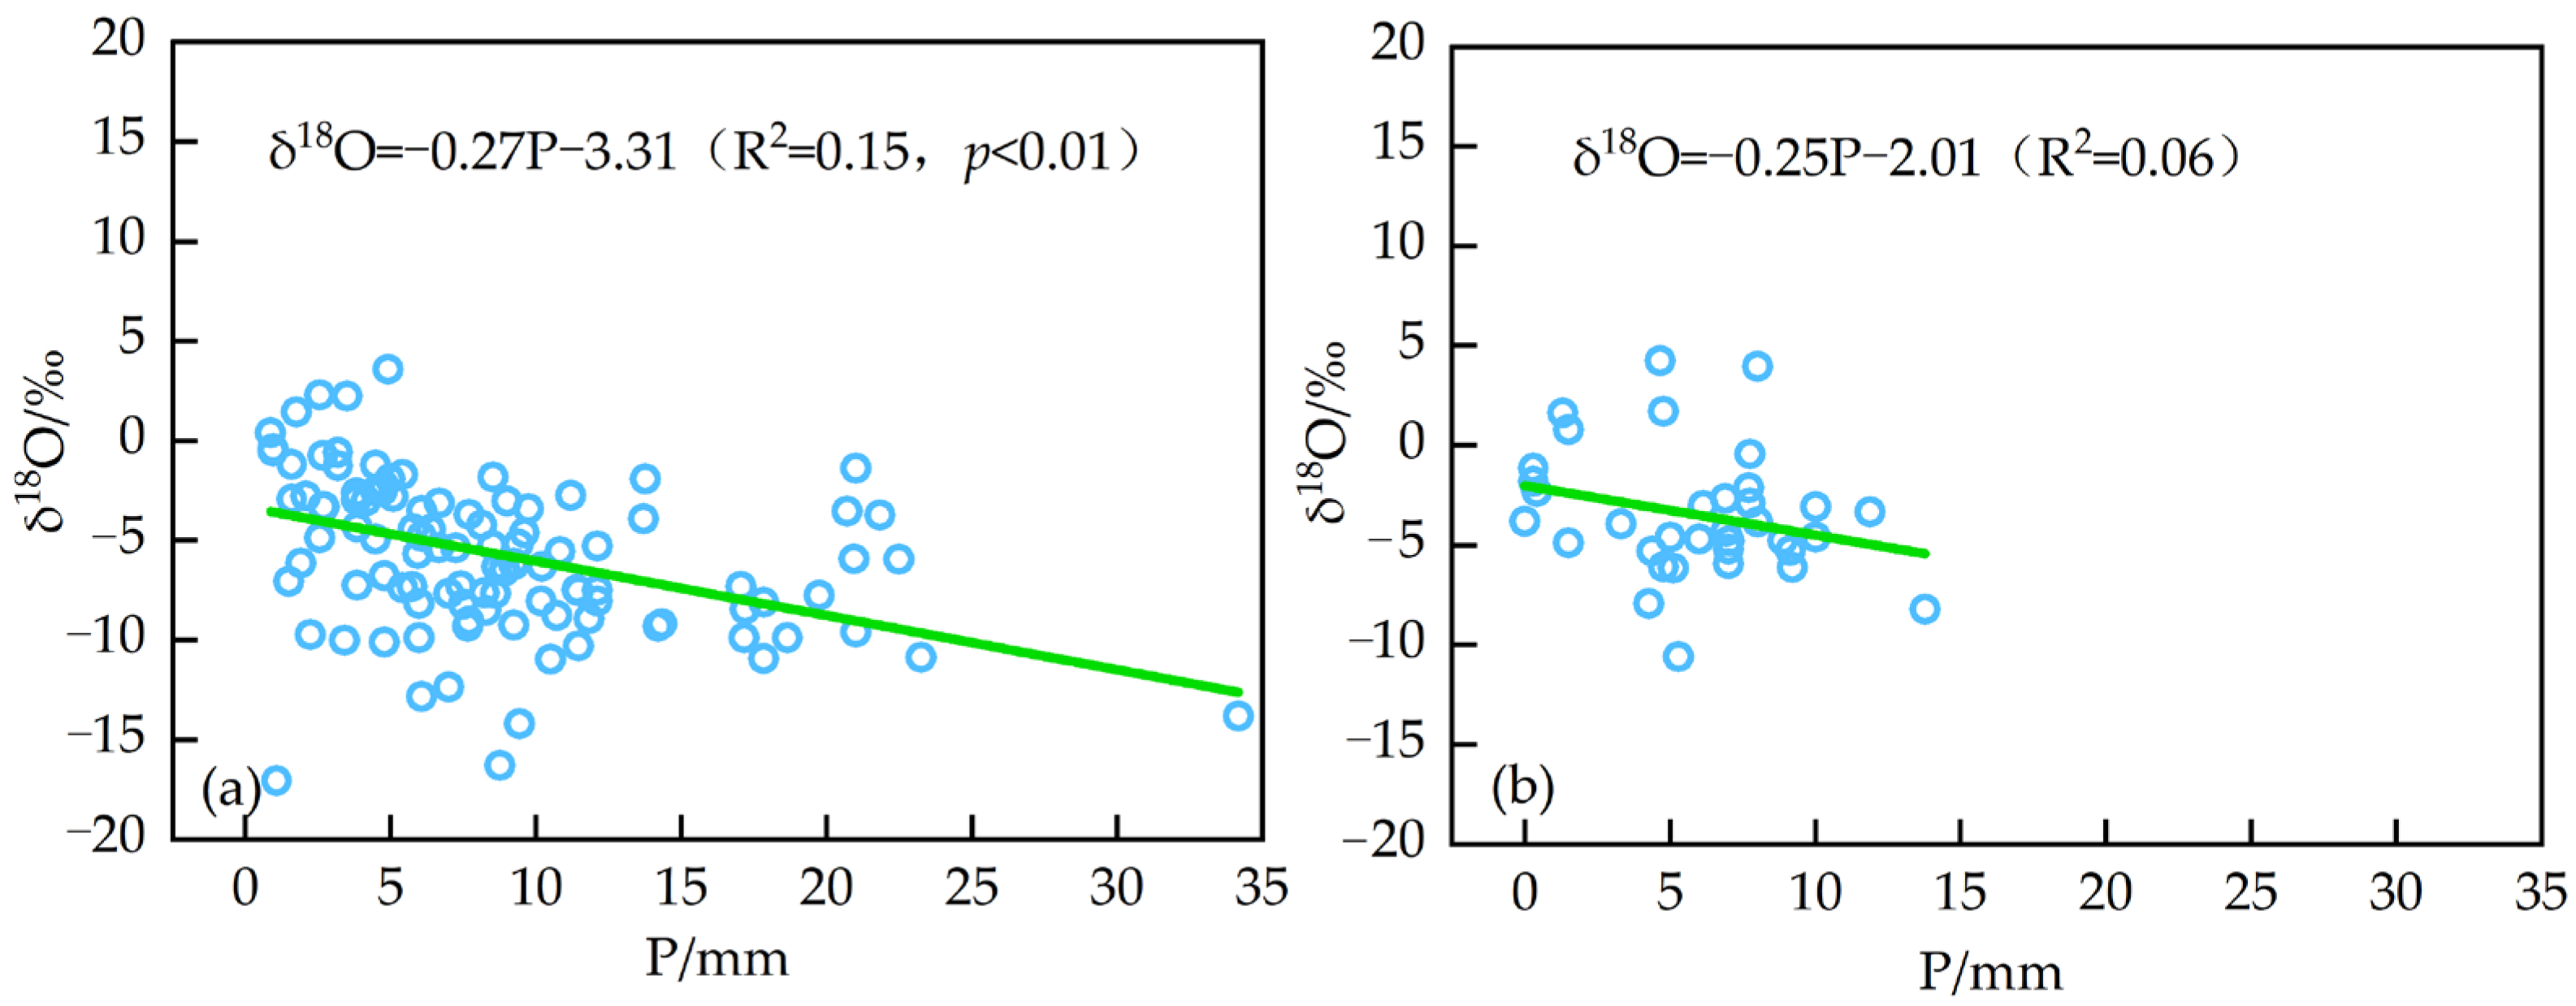
4.2. Relationship between Stable Isotopes in Precipitation and Precipitation Amount

At the daily scale, the linear equations of δ2H, δ18O and d-excess versus precipitation P (mm) were obtained as follows: δ2H = 1.06P − 62.31 (R2 = 0.01, p < 0.01), δ18O = 0.08P − 8.85 (R2 = 0.003), d-excess = 0.42P + 8.47 (R2 = 0.04, p < 0.01). For all precipitation events, δ2H and δ18O showed positive correlations with precipitation, which showed that the stable isotopes of precipitation in the Shiyang River Basin didn’t show the rainfall amount effect on the daily scale. Under the seasonal scale (Table 4), δ2H and δ18O showed a negative correlation with precipitation in summer (passed the 0.01 significance test), indicating that the variation of δ2H and δ18O showed the rainfall amount effect in summer. This was because the precipitation in the study area was mainly concentrated in summer when it was influenced by monsoon moisture [55], thus the rainfall amount effect was stronger. At the daily scale and the seasonal scale (except in winter), the rainfall amount effect between the d-excess with precipitation was stronger, which indicated the variation of d-excess was influenced by that of the precipitation.
The rainfall amount effect varied in different regions. In summer 2019, the rainfall amount effect of δ18O was −0.27‰/mm (r = −0.38) in the upstream area (Figure 9a), and it was −0.25‰/mm (r = −0.26) in the mid-downstream area (Figure 9b). The negative correlation between δ18O and P was greater in the upstream area than in the mid-downstream area, indicating that the rainfall amount effect of δ18O was stronger in the former than in the latter. During the same period, the temperature effect of δ18O was 0.26‰/°C (r = 0.24) in the upstream area, and it was 0.65‰/°C (r = 0.45) in the mid-downstream area, indicating that the temperature effect of δ18O was greater in the latter than in the former. In the mid-downstream area, the raindrops were influenced by stronger sub-cloud secondary evaporation during the descent of the raindrops, which caused the temperature effect to mask the rainfall amount effect. It also has occurred in Southeast Asia [13]. The d-excess showed a significant positive correlation with precipitation, which was consistent with the results in the Tolai River Basin [56]. Under arid climate conditions, local moisture recirculation formed by evaporation and higher relative humidity brought by precipitation amount increases making the d-excess higher [20], which leads to the d-excess showing a positive correlation with precipitation. Additionally, the increased extent of d-excess with precipitation was smaller in summer than in spring and autumn, which was related to the decreasing of d-excess influenced by monsoon moisture [55].
According to precipitation class (Precipitation classes are classified by the amount of precipitation accumulated in 24 h), precipitation can be categorized into three types: light rain (0.1–9.9 mm), moderate rain (10.0–24.9 mm) and heavy rain (25.0–49.9 mm). Since there were only two samples of heavy rain, the discussion was based on light and moderate rain (Table 5). When the rain was 0.1–9.9 mm, the δ18O of the whole basin was positively correlated with P (r = 0.05), indicating there wasn’t a rainfall amount effect between δ18O with P. When the rain increased to 10.0–24.9 mm, the δ18O of the whole basin was negatively correlated with P (r = −0.11), indicating δ18O decreased with precipitation increasing. Changing from light rain to moderate rain, the rainfall amount effect of δ18O became stronger. As the rainfall amount was below 10 mm, the d-excess increased with the rainfall amount increasing. Most of the precipitation less than 10 mm appeared in spring or autumn, when the temperature gradually rose (spring) or was still high (autumn), but the monsoon had not arrived (spring) or had withdrawn (autumn), which caused stable isotopes were more influenced by temperature. Some precipitation of less than 10 mm appeared in summer, the high temperature and strong evaporation made isotope enrichment for below-cloud secondary evaporation [46,47,57,58,59], which caused stable isotopes to be more affected by temperature. When the precipitation was greater than 10 mm, the relative humidity rose with the increase of precipitation, and stable isotopes were caused of depletion influenced by precipitation increasing. A similar phenomenon has been found that stable isotopes in smaller precipitation (1–10 mm) had a stronger temperature effect [60], and the higher relative humidity was prone to isotope dilution effects in precipitation greater than 10 mm [1].

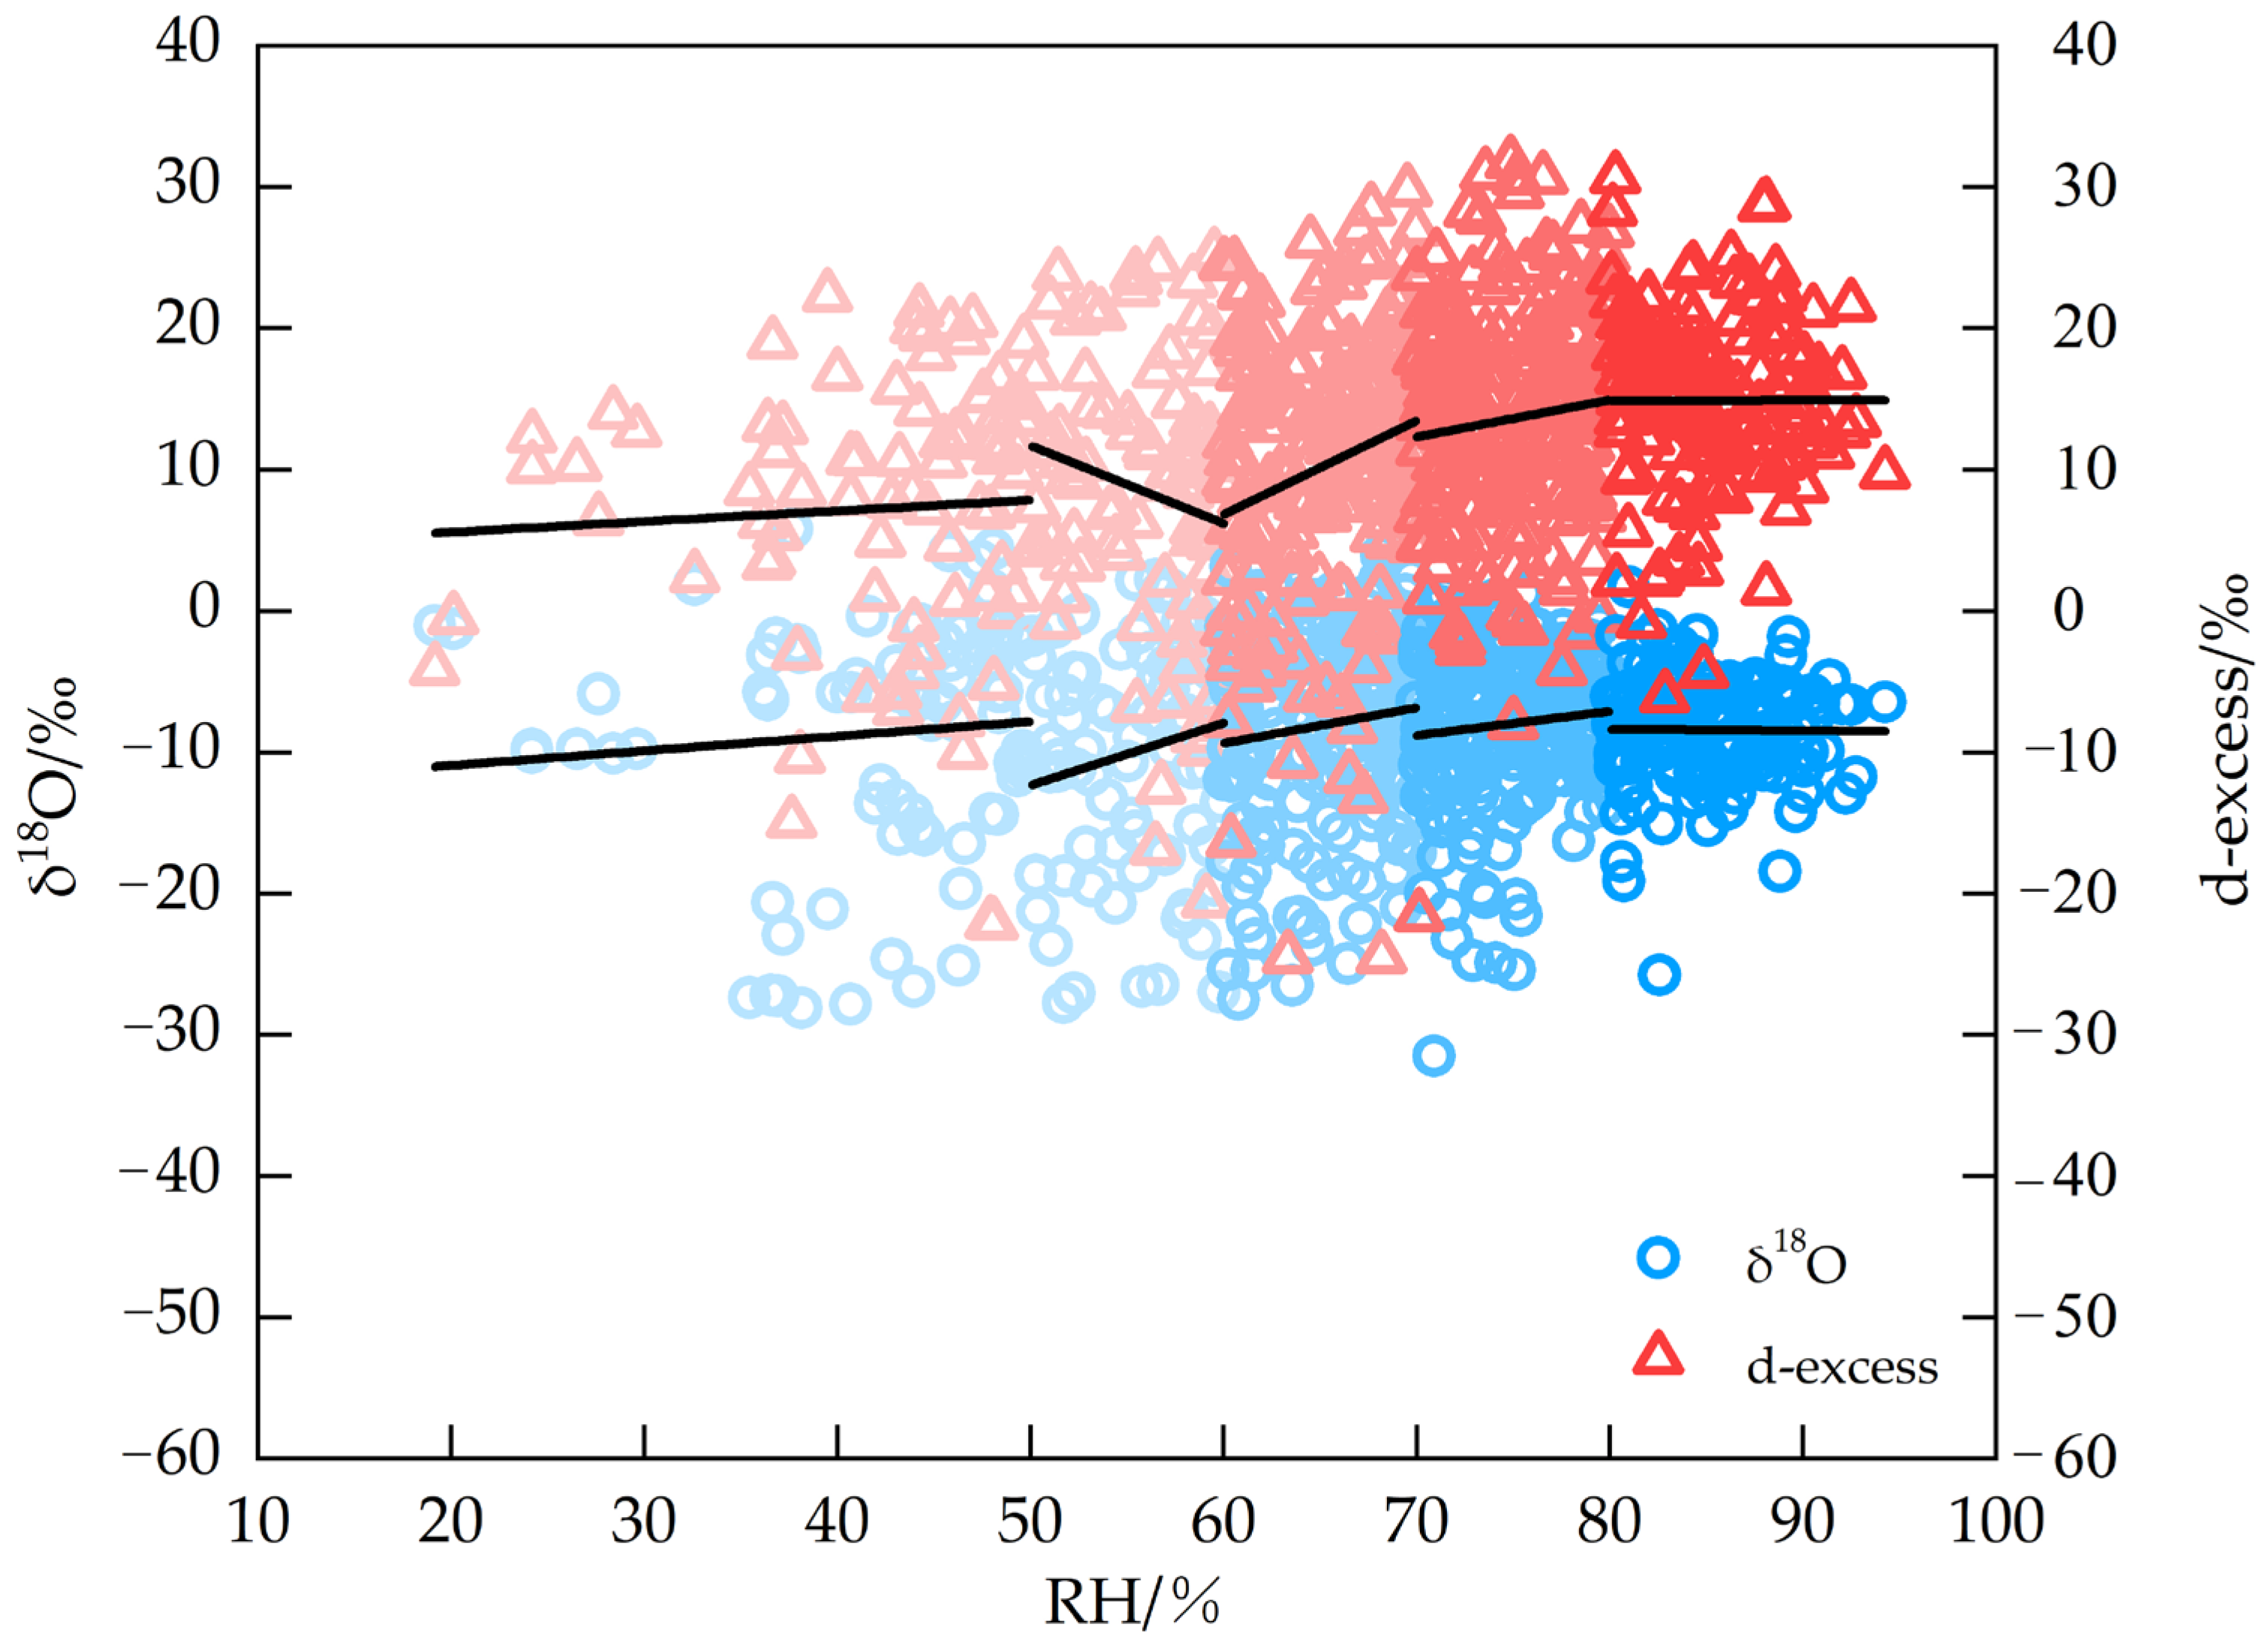
4.3. Relationship between Stable Isotopes in Precipitation and Relative Humidity

The linear equations of δ18O, δ2H and d-excess with the relative humidity RH in the Shiyang River Basin were calculated as: δ18O = 0.03H − 10.39 (R2 = 0.004, n = 673); δ2H = 0.42H − 84.75 (R2 = 0.01, p < 0.01); d-excess = 0.19H − 1.64 (R2 = 0.08, p < 0.01). δ18O, δ2H and d-excess all increased with the RH increasing, but there was a weak positive correlation between δ18O with the RH. To further analyze the effect of RH on stable isotopes, the RH was classified as 0–50%, 50–60%, 60–70%, 70–80%, and 80–100% (Table 6, Figure 10).
Combined with Table 6 and Figure 10, when the RH was below 50%, δ18O increased with the increase of RH, but the correlation coefficient was very small. When the RH changed from 50% to 80%, δ18O increased smaller and smaller with the increase of RH (the correlation coefficient r decreased from 0.17 to 0.09). When the RH was 80–100%, δ18O decreased with the increase of RH and showed a weak negative correlation. Chen et al. [61] found a negative correlation between δ18O and the RH in the northwest China, which was also found in the Tibetan Plateau [62] and Bangladesh [63]. In the range of 0–80%, the RH shows a positive correlation with δ18O, which was mainly influenced by the temperature effect. When the RH changed from 50% to 100%, the slope of δ18O versus RH decreased continuously, indicating that the increase of the RH weakened the temperature effect. This was because the below-cloud secondary evaporation effect gradually decreased with the precipitation amount and the RH increasing [27]. In addition, the isotope dilution effect occurred when the RH was high and the precipitation was formed [1]. As can be seen in Figure 10, the d-excess varied little with the RH below 50%, while the d-excess decreased with the RH increasing at 50–60%. Zhao et al. [58] found that the RH less than 60% could lead to a decrease of d-excess but lead to an increase of d-excess when the RH was greater than 60%. Crawford et al. [64] found a positive correlation between the RH and the d-excess in the western side of the Great Dividing Range, which was also found in the Shule River Basin [45] and the Binggou River Basin [44] in the Qilian Mountains. For the RH in the ranges of 0–50%, 50–60%, 60–70%, 70–80% and 80–100%, the weighted-average values of d-excess were 8.9‰, 8.2‰, 11.9‰, 13.8‰ and 15.4‰ respectively. This indicated that the d-values gradually increased with the RH increasing. The RH is an important indicator to control evaporation. Under low RH conditions, the sub-cloud secondary evaporation would be significantly enhanced [12], which caused the values of d-excess to decrease and those of δ18O to increase, it is vice versa.

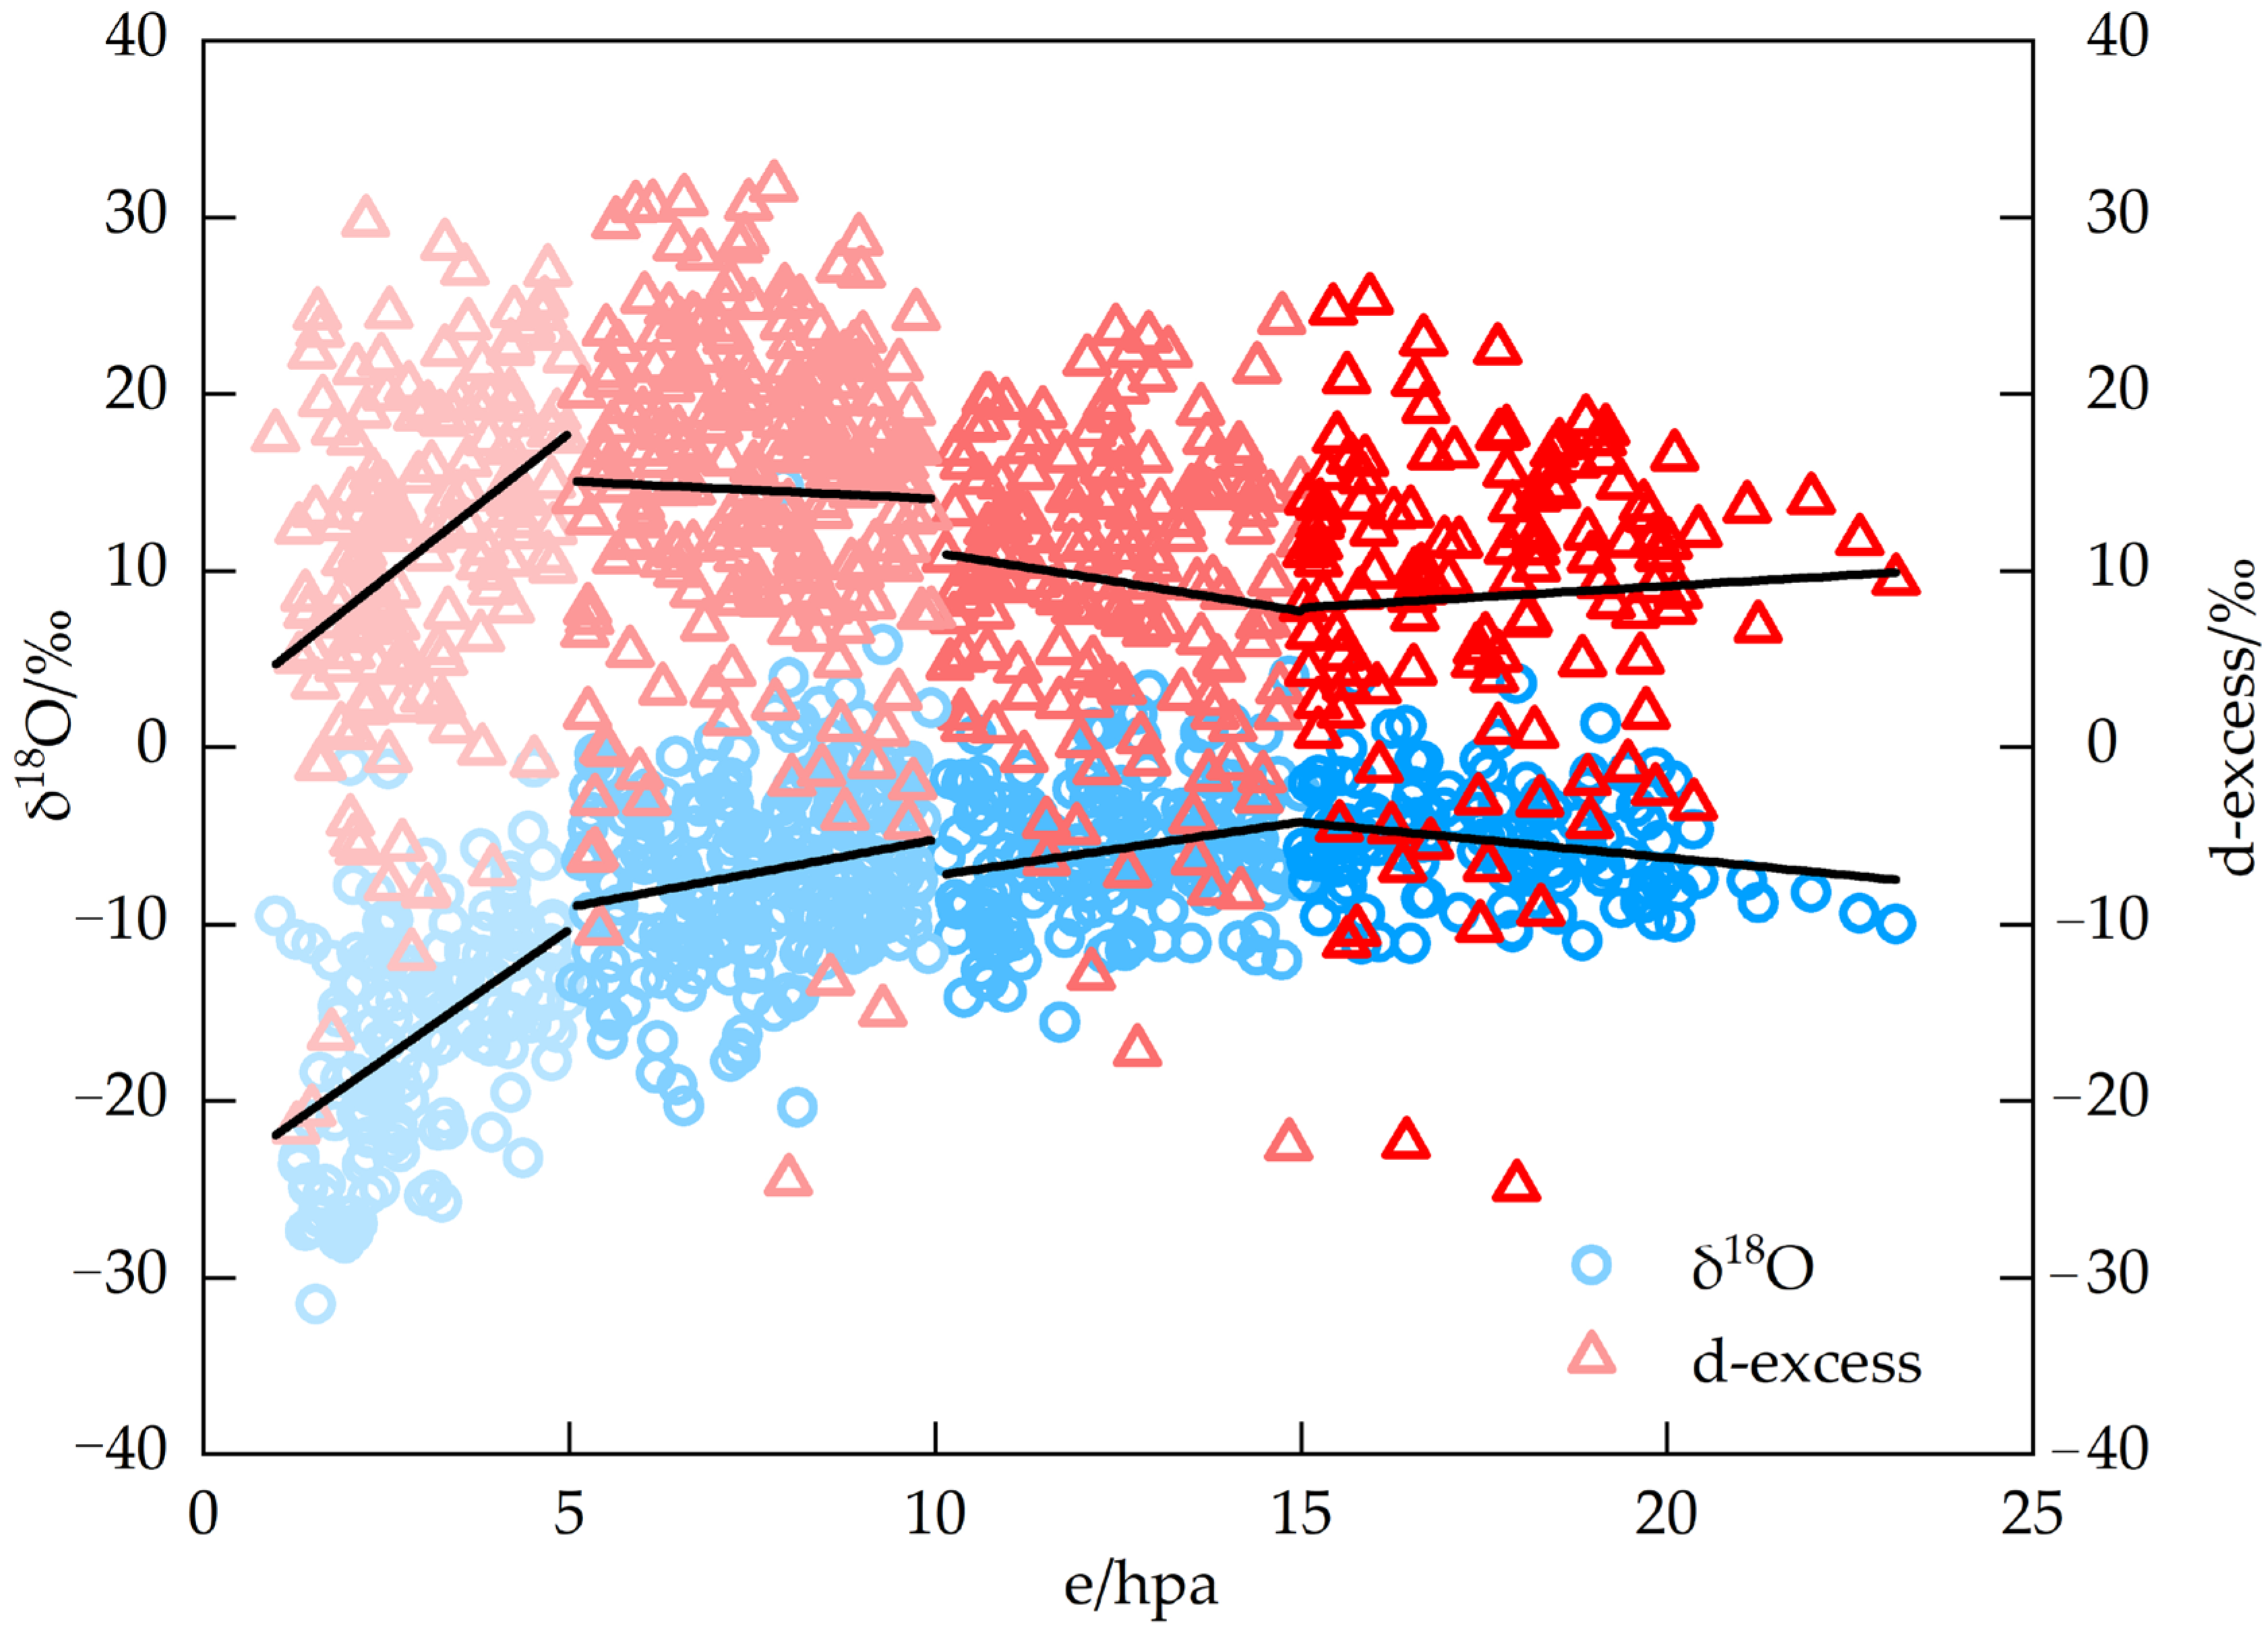
4.4. Relationship between Stable Isotopes in Precipitation and Water Vapor Pressure

The linear equations of δ18O, δ2H and d-excess with water vapor pressure e in Shiyang River Basin were calculated as: δ18O = 0.71e − 15.16 (R2 = 0.33, n = 673, p < 0.01); δ2H = 5.48e − 107.58 (R2 = 0.32, p < 0.01); d-excess = −0.22e + 13.72 (R2 = 0.02, p < 0.01). The δ18O and δ2H with the water vapor pressure showed a significant positive correlation, and this was opposite to d-excess. In the arid region of the northwest China, stable isotopes in precipitation are influenced by the water vapor pressure. For example, there was a positive correlation between δ18O and water vapor pressure in the central part of the Hexi Corridor [65] and in the Tolai River Basin [66], and a negative correlation between d-excess and water vapor pressure, which was consistent with the results of this study.
According to Table 7 and Figure 11, when the water vapor pressure was in the range of 0–5 hpa, δ18O and δ2H had positive correlations with it and the increasing extent of them was the largest, and the d-excess increased with its increasing (r = 0.36). At this time, the effects of sub-cloud secondary evaporation and local moisture recycling were weak because the average T was below 0 °C and the initial d-values were high in dry air masses influenced by the moisture source [66]. When the water vapor pressure changed to 5–10 hPa, the increase extents of δ18O and δ2H decreased rapidly and the d-excess decreased with its increasing (r = −0.03). At this moment, the average T was 8.4 °C, and the RH was 70.31%, which made the d-excess decrease for evaporation. When the water vapor pressure changed to 10–15 hPa, the increased extents of δ18O and δ2H continued to decrease and the d-excess decreased significantly with its increasing (r = −0.11). At this time, the average T was 15.9 °C, and the RH was 70.29%, which caused the evaporation to enhance and the d-excess further to decrease. When the water vapor pressure was greater than 15 hPa, δ18O and δ2H with it changed to negative correlations (r = −0.23), while the d-excess increased with its increasing (r = 0.05). At this moment, the average T and the RH were the highest, and the water vapor pressure tended to saturate and the below-cloud evaporation effect was weak, which made the d-excess increase. It has been shown that the increases of temperature, the water vapor content and the water vapor pressure led to isotope enrichment in arid climates [65,67]. As can be seen in Table 7, the time stage with higher temperature also had higher relative humidity and water vapor pressure as well as more precipitation. Ren et al. [53] found that water vapor gradually saturated with precipitation proceeding, which resulting in the δ18O values decreasing and d-values increasing.

5. Conclusions

Using stable isotope and meteorological record data, the spatial and temporal variation characteristics of stable isotopes in precipitation and their relationships with meteorological factors in the Shiyang River Basin were studied and the main conclusions are as follows.
On the temporal scale, the stable isotopes of precipitation in the Shiyang River Basin showed obvious and periodic seasonal variations, with δ2H and δ18O higher values in summer and autumn and lower values in winter and spring, and d-excess higher values in spring and autumn and lower values in winter and summer. On the spatial scale, δ2H and δ18O values in precipitation decreased with the elevation increasing, and the opposite was true for d-excess values. The slope and intercept of local meteoric water lines gradually increased with the elevation increasing.
δ18O in precipitation shows a significant positive correlation with temperature. From 0 °C to 10 °C, the positive correlation was the largest, and the temperature effect of δ18O was 0.77‰/°C. When the temperature was greater than 0 °C, the temperature effect was greater in the mid-downstream area than in the upstream area. δ18O in precipitation showed a weak negative correlation with precipitation when the precipitation was greater than 10 mm. On the seasonal scale, the rainfall amount effect to δ18O exhibited in summer is influenced by monsoonal moisture.
There are significant differences in stable isotopes of precipitation in the entire watershed of arid inland river basins, the upstream area was more influenced by local moisture recycling but the mid-downstream area was more influenced by sub-cloud secondary evaporation. Our research reveals the process and influencing factors of stable isotope changes in precipitation in the Shiyang River Basin, providing a basis for further research on the evolution mechanism of stable isotope in precipitation in arid inland river areas. At the same time, it helps to understand the hydrological and meteorological processes and provides a certain theoretical basis for the rational development and utilization of water resources in arid areas.

Author Contributions

Data curation, Y.Z.; Funding acquisition, G.Z.; Software, Z.Y. and H.L.; Writing—original draft, X.L.; Writing—review & editing, W.J. All authors reviewed the manuscript. All authors have read and agreed to the published version of the manuscript.

Funding

This research was supported by the Oasis Scientific Research Achievements Breakthrough Action Plan Project of Northwest Normal University (NWNU-LZKX-202303) and the National Natural Science Foundation of China (41971036).

Data Availability Statement

Data available on request from the authors. The data that support the findings of this study are available from the corresponding author upon reasonable request.

Acknowledgments

The authors much thank the colleagues in the Northwest Normal University and Chinese Academy of Sciences (CAREERI, CAS) for their help in fieldwork, laboratory analysis, and data processing.

Conflicts of Interest

No potential conflict of interest was reported by the authors.

References

  1. Yang, Q.; Mu, H.; Guo, J.; Bao, X.; Martín, J.D. Temperature and rainfall amount effects on hydrogen and oxygen stable isotope in precipitation. Quatern. Int. 2019, 519, 25–31. [Google Scholar] [CrossRef]
  2. Juan, G.; Li, Z.; Qi, F.; Ruifeng, Y.; Tingting, N.; Baijuan, Z.; Jian, X.; Wende, G.; Fusen, N.; Weixuan, D.; et al. Environmental effect and spatiotemporal pattern of stable isotopes in precipitation on the transition zone between the Tibetan Plateau and arid region. Sci. Total Environ. 2020, 749, 141559. [Google Scholar] [CrossRef]
  3. Kostrova, S.S.; Meyer, H.; Fernandoy, F.; Werner, M.; Tarasov, P.E. Moisture origin and stable isotope characteristics of precipitation in southeast Siberia. Hydrol. Process. 2020, 34, 51–67. [Google Scholar] [CrossRef]
  4. Shi, Y.; Jin, Z.; Wu, A.; Li, G.; Li, F. Stable isotopic characteristics of precipitation related to the environmental controlling factors in Ningbo, East China. Environ. Sci. Pollut. R. 2021, 28, 10696–10706. [Google Scholar] [CrossRef]
  5. Laonamsai, J.; Ichiyanagi, K.; Kamdee, K.; Putthividhya, A.; Tanoue, M. Spatial and temporal distributions of stable isotopes in precipitation over Thailand. Hydrol. Process. 2021, 35, e13995. [Google Scholar] [CrossRef]
  6. Kumar, U.S.; Kumar, B.; Rai, S.P.; Sharma, S. Stable isotope ratios in precipitation and their relationship with meteorological conditions in the Kumaon Himalayas, India. J. Hydrol. 2010, 391, 1–8. [Google Scholar] [CrossRef]
  7. Kurita, N.; Ichiyanagi, K.; Matsumoto, J.; Yamanaka, M.D.; Ohata, T. The relationship between the isotopic content of precipitation and the precipitation amount in tropical regions. J. Geochem. Explor. 2009, 102, 113–122. [Google Scholar] [CrossRef]
  8. Bowen, G.J. Spatial analysis of the intra-annual variation of precipitation isotope ratios and its climatological corollaries. J. Geophys. Res. Atmos. 2008, 113, D05113. [Google Scholar] [CrossRef]
  9. Pang, Z.; Kong, Y.; Froehlich, K.; Huang, T.; Yuan, L.; Li, Z.; Wang, F. Processes affecting isotopes in precipitation of an arid region. Tellus B 2011, 63, 352–359. [Google Scholar] [CrossRef]
  10. Lachniet, M.S.; Patterson, W.P. Oxygen isotope values of precipitation and surface waters in northern Central America (Belize and Guatemala) are dominated by temperature and amount effects. Earth Planet. Sci. Lett. 2009, 284, 435–446. [Google Scholar] [CrossRef]
  11. Bedaso, Z.; Wu, S.Y. Daily precipitation isotope variation in Midwestern United States: Implication for hydroclimate and moisture source. Sci. Total Environ. 2020, 713, 136631. [Google Scholar] [CrossRef]
  12. Peng, T.R.; Wang, C.H.; Huang, C.C.; Fei, L.Y.; Chen, C.T.A.; Hwong, J.L. Stable isotopic characteristic of Taiwan’s precipitation: A case study of western Pacific monsoon region. Earth Planet. Sci. Lett. 2020, 289, 357–366. [Google Scholar] [CrossRef]
  13. Araguás-Araguás, L.; Froehlich, K.; Rozanski, K. Stable isotope composition of precipitation over southeast Asia. J. Geophys. Res. Atmos. 1998, 103, 28721–28742. [Google Scholar] [CrossRef]
  14. Dansgaard, W. Stable isotopes in precipitation. Tellus 1964, 16, 436–468. [Google Scholar] [CrossRef]
  15. Craig, H. Isotopic variations in meteoric waters. Science 1961, 133, 1702–1703. [Google Scholar] [CrossRef]
  16. Du, K.; Zhang, B. Stable isotope characteristics of precipitation and sources of water vapor in the Pearl River Basin. J. China Hydrol. 2020, 40, 75–82. [Google Scholar]
  17. Xia, Z.; Winnick, M.J. The competing effects of terrestrial evapotranspiration and raindrop re-evaporation on the deuterium excess of continental precipitation. Earth Planet. Sci. Lett. 2021, 572, 117120. [Google Scholar] [CrossRef]
  18. Jeelani, G.; Deshpande, R.D.; Galkowski, M.; Rozanski, K. Isotopic composition of daily precipitation along the southern foothills of the Himalayas: Impact of marine and continental sources of atmospheric moisture. Atmos. Chem. Phy. 2018, 18, 8789–8805. [Google Scholar] [CrossRef]
  19. Wu, J.K.; Ding, Y.; Ye, B.; Yang, Q.; Zhang, X.; Wang, J. Spatio-temporal variation of stable isotopes in precipitation in the Heihe River Basin, Northwestern China. Environ. Earth Sci. 2010, 61, 1123–1134. [Google Scholar] [CrossRef]
  20. Li, Z.; Gui, J.; Wang, X.; Feng, Q.; Zhao, T.; Ouyang, C.; Shi, Y. Water resources in inland regions of central Asia: Evidence from stable isotope tracing. J. Hydrol. 2019, 570, 1–16. [Google Scholar] [CrossRef]
  21. Chen, H.; Chen, Y.; Li, D.; Li, W. Effect of sub-cloud evaporation on precipitation in the Tianshan Mountains (Central Asia) under the influence of global warming. Hydrol. Process. 2020, 34, 5557–5566. [Google Scholar] [CrossRef]
  22. Jia, W.; Xu, X.; Yuan, R.; Ma, X.; Zhu, G.; Li, Z. Variation characteristics of stable isotopes in precipitation and the environmental factors that influence them in the Shiyang River Basin of China. Environ. Earth Sci. 2019, 78, 306. [Google Scholar] [CrossRef]
  23. Ma, J.; Zhang, P.; Zhu, G.; Wang, Y.; Edmunds, W.M.; Ding, Z.Y.; He, J.H. The composition and distribution of chemicals and isotopes in precipitation in the Shiyang River system, northwestern China. J. Hydrol. 2012, 436, 92–101. [Google Scholar] [CrossRef]
  24. Yuan, R.; Jia, W.; Li, Z.; Xu, X.; Zhang, Z.; Shi, Y.; Yang, L.; Xiong, H. Regional differences in stable isotope changes of precipitation in the Shiyang River Basin. China Environ. Sci. 2020, 40, 4945–4956. [Google Scholar] [CrossRef]
  25. Gui, J.; Li, Z.; Feng, Q.; Zhang, D.; Lv, Y.; Yuan, R. Characteristics of runoff components in the Gulang River Basin, Qilian Mountains. J. Glaciol. Geocryol. 2019, 41, 918–925. [Google Scholar]
  26. Zhao, P.; Xu, X.; Qu, J.; Li, Y.; Jiang, S.; Zhang, Y. Hydrogen and oxygen isotope characteristics of atmospheric precipitation and water vapor sources in Qingtu Lake, lower Shiyang River. J. Arid Land Resour. Environ. 2019, 33, 80–85. [Google Scholar] [CrossRef]
  27. Xiong, H.; Jia, W.; Zhu, G.; Ma, X.; Xu, X.; Yuan, R.; Zhang, Z.; Shi, Y.; Yang, L. Influence of below-cloud secondary evaporation on stable isotope composition in precipitation and its relationship with meteorological factors in Shiyang River Basin, Northwest China. Environ. Earth Sci. 2021, 80, 255. [Google Scholar] [CrossRef]
  28. Gao, C.; Zhao, J.; Li, C.; Wei, W.; Wang, J.; Kang, C. Grassland cover and its ecological service function changes in Shiyang River Basin. Pratacultural. Sci. 2019, 36, 27–36. [Google Scholar]
  29. Huang, J.; Zhou, J.; Dou, J.; Ma, D.; Zhao, X.; Wei, W.; Hu, K. Extreme precipitation variability and its influencing factors in the monsoon marginal zone—A case study of Shiyang River Basin. Chin. J. Ecol. 2022, 41, 536–545. [Google Scholar] [CrossRef]
  30. Zhang, W.; Zhu, G.; Qiu, D.; Liu, Y.; Sang, L.; Lin, X.; Ma, H.; Zhao, K.; Xu, Y. Effects of agricultural activities on hydrochemistry in the Shiyang River Basin, China. Environ. Sci. Pollut. Res. 2023, 30, 12269–12282. [Google Scholar] [CrossRef]
  31. Zhou, J.; Huang, J.; Zhao, X.; Lei, L.; Shi, W.; Wang, L.; Wei, W.; Liu, C.; Zhu, G.; Yang, X. Changes of extreme temperature and its influencing factors in Shiyang River Basin, Northwest China. Atmosphere 2020, 11, 1171. [Google Scholar] [CrossRef]
  32. Zhang, X.; Xiao, W.; Wang, Y.; Wang, Y.; Kang, M.; Wang, H.; Huang, Y. Sensitivity analysis of potential evapotranspiration to key climatic factors in the Shiyang River Basin. J. Water Clim. Change 2021, 12, 2875–2884. [Google Scholar] [CrossRef]
  33. Hughes, C.E.; Crawford, J. A new precipitation weighted method for determining the meteoric water line for hydrological applications demonstrated using Australian and global GNIP data. J. Hydrol. 2012, 464–465, 344–351. [Google Scholar] [CrossRef]
  34. Soderberg, K.; Good, S.P.; O’Connor, M.; Wang, L.; Ryan, K.; Caylor, K.K. Using atmospheric trajectories to model the isotopic composition of rainfall in central Kenya. Ecosphere 2013, 4, 1–18. [Google Scholar] [CrossRef]
  35. Zhu, G.; Guo, H.; Qin, D.; Pan, H.; Zhang, Y.; Jia, W.; Ma, X. Contribution of recycled moisture to precipitation in the monsoon marginal zone: Estimate based on stable isotope data. J. Hydrol. 2019, 569, 423–435. [Google Scholar] [CrossRef]
  36. Zhang, M.; Jia, W.; Zhu, G.; Zhang, F.; Xiong, H.; Yang, L.; Zhang, F.; Zhang, Y.; Lan, X. The effect of the seasonality of moisture sources on moisture flux and precipitation stable isotopes in the Shiyang River Basin. Theor. Appl. Climatol. 2023, 151, 767–783. [Google Scholar] [CrossRef]
  37. Gonfiantini, R.; Roche, M.A.; Olivry, J.C.; Fontes, J.C.; Zuppi, G.M. The altitude effect on the isotopic composition of tropical rains. Chem. Geol. 2001, 181, 147–167. [Google Scholar] [CrossRef]
  38. Guo, X.; Gong, X.; Shi, J.; Guo, J.; Domínguez-Villar, D.; Lin, Y.; Wang, H.; Yuan, D. Temporal variations and evaporation control effect of the stable isotope composition of precipitation in the subtropical monsoon climate region, Southwest China. J. Hydrol. 2021, 599, 126278. [Google Scholar] [CrossRef]
  39. Zhang, Y.; Xin, C.; Guo, X.; Zhang, B.; Chen, L.; Shi, Y. Characteristics of stable isotopes in precipitation and its moisture in the inland regions of northwest China. Environ. Sci. 2023, in press. [Google Scholar] [CrossRef]
  40. Kong, Y.; Wang, K.; Li, J.; Pang, Z. Stable isotopes of precipitation in China: A consideration of moisture sources. Water 2019, 11, 1239. [Google Scholar] [CrossRef]
  41. Harvey, F.E.; Welker, J.M. Stable isotopic composition of precipitation in the semi-arid north-central portion of the US Great Plains. J. Hydrol. 2000, 238, 90–109. [Google Scholar] [CrossRef]
  42. Sun, C.; Chen, W.; Chen, Y.; Cai, Z. Stable isotopes of atmospheric precipitation and its environmental drivers in the Eastern Chinese Loess Plateau, China. J. Hydrol. 2020, 581, 124404. [Google Scholar] [CrossRef]
  43. Zeng, D.; Wu, J.; Li, H.; Zhao, Q.; Liu, S.; Qin, J. Progress of hydrogen and oxygen isotope studies in precipitation in the Northwest Arid Zone. Arid Zone Res. 2020, 37, 857–869. [Google Scholar] [CrossRef]
  44. Wang, S.; Wang, Q.; Wu, J.; He, X.; Ding, Y.; Wang, L.; Hu, Z. Stable isotopic characteristics of hydrogen and oxygen in precipitation and sources of water vapor in the Yangtze River source area. Environ. Sci. 2019, 40, 2615–2623. [Google Scholar] [CrossRef]
  45. Zhang, B.; Li, Z.; Wang, Y.; Feng, Q.; Zou, H.; Li, A. Environmental significance of stable isotopes of precipitation in the Dadongshu Mountains of the middle Qilian Mountains. Plateau Meteorol. 2019, 38, 1099–1107. [Google Scholar]
  46. Guo, X.; Feng, Q.; Li, Z.; Guo, R.; Jia, B. Stable isotope characteristics of precipitation and sources of water vapor in the Dunhuang Basin. J. Desert Res. 2015, 35, 715–723. [Google Scholar]
  47. Liu, J.; Zhang, F.; Feng, Q.; Li, Z.; Zhu, Y.; Nie, S.; Li, L. Secondary evaporation effects under clouds of precipitation stable isotopes in Northwest China. Chin. J. Appl. Ecol. 2018, 29, 1479–1488. [Google Scholar] [CrossRef]
  48. Zhang, B.; Li, Z.; Wang, Y.; Li, Y.; Lv, Y.; Yuan, R.; Gui, J. Stable isotope characteristics of precipitation and water vapor source analysis in the middle part of the northern slope of Qilian Mountains. Environ. Sci. 2019, 40, 5272–5285. [Google Scholar] [CrossRef]
  49. Wu, J.; Ding, Y.; Yang, J.; Liu, S.; Chen, J.; Zhou, J.; Qin, X. Spatial variation of stable isotopes in different waters during melt season in the Laohugou Glacial Catchment, Shule River basin. J. Mt. Sci. 2016, 13, 1453–1463. [Google Scholar] [CrossRef]
  50. Zeng, K.; Yang, Y.; Hu, Y.; Feng, X. Analysis of precipitation isotope characteristics and water vapor sources in the Kashgar River Basin. Arid Zone Res. 2021, 38, 1263–1273. [Google Scholar]
  51. Wang, S.; Zhang, M. Spatio-temporal characteristics and influencing factors of stable isotopes in precipitation across the Chinese Tianshan Mountains. Quat. Sci. 2017, 37, 1119–1130. [Google Scholar] [CrossRef]
  52. Wang, S.; Zhang, M.; Che, Y.; Zhu, X.; Liu, X. Influence of below-cloud evaporation on deuterium excess in precipitation of Arid Central Asia and its meteorological controls. J. Hydrometeorol. 2016, 17, 1973–1984. [Google Scholar] [CrossRef]
  53. Ren, W.; Zheng, X.; Wu, X.; Zhou, H.; Ma, J.; Li, Y. Effect of secondary evaporation under clouds on the stable isotopic composition of hydrogen and oxygen during precipitation. Arid. Zone Res. 2017, 34, 1263–1270. [Google Scholar] [CrossRef]
  54. Yu, W.; Yao, T.; Tian, L.; Ma, Y.; Ichiyanagi, K.; Wang, Y.; Sun, W. Relationships between δ18O in precipitation and air temperature and moisture origin on a south-north transect of the Tibetan Plateau. Atmos. Res. 2008, 87, 158–169. [Google Scholar] [CrossRef]
  55. Liu, J.; Song, X.; Yuan, G.; Sun, X.; Liu, X.; Chen, F.; Wang, Z.; Wang, S. Characteristics of δ18O in atmospheric precipitation in Northwest China and water vapor sources. Acta Geogr. Sin. 2008, 63, 12–22. [Google Scholar]
  56. Li, Y.; Li, Z.; Feng, Q.; Xiao, L.; Lv, Y.; Gui, J.; Yuan, R.; Zhang, B. Environmental significance of stable isotopes of precipitation at different elevations in the Tolai River Basin. Environ. Sci. 2018, 39, 2661–2672. [Google Scholar] [CrossRef]
  57. Jin, X.; Zhang, M.; Wang, S.; Zhu, X.; Dong, L.; Ren, Z.; Chen, F. Secondary evaporation effects under clouds on the Loess Plateau based on hydrogen and oxygen stable isotopes. Environ. Sci. 2015, 36, 1241–1248. [Google Scholar] [CrossRef]
  58. Zhao, S.; Pang, S.; Wen, R.; Liu, Z. Cloud bottom secondary evaporation effect of stable isotopes of precipitation in the Haihe River basin. Prog. Geogr. 2015, 34, 1031–1038. [Google Scholar]
  59. Peng, H.; Mayer, B.; Harris, S.; Krouse, H.R. The influence of below-cloud secondary effects on the stable isotope composition of hydrogen and oxygen in precipitation at Calgary, Alberta, Canada. Tellus B 2007, 59, 698–704. [Google Scholar] [CrossRef]
  60. Meng, Y.; Liu, G. Secondary evaporation effects under clouds of stable isotopes of precipitation in the Yangtze River basin. Adv. Water Sci. 2010, 21, 327–334. [Google Scholar] [CrossRef]
  61. Chen, F.; Zhang, M.; Ma, Q.; Wang, S.; Li, X.; Zhu, X. Stable isotopic characteristics of precipitation in Lanzhou City and its surrounding areas, Northwest China. Environ. Earth Sci. 2015, 73, 4671–4680. [Google Scholar] [CrossRef]
  62. Yu, W.; Tian, L.; Ma, Y.; Xu, B.; Qu, D. Simultaneous monitoring of stable oxygen isotope composition in water vapor and precipitation over the central Tibetan Plateau. Atmos. Chem. Phys. 2015, 15, 10251–10262. [Google Scholar] [CrossRef]
  63. Islam, M.R.; Gao, J.; Ahmed, N.; Karim, M.M.; Bhuiyan, A.Q.; Ahsan, A.; Ahmed, S. Controls on spatiotemporal variations of stable isotopes in precipitation across Bangladesh. Atmos. Res. 2021, 247, 105224. [Google Scholar] [CrossRef]
  64. Crawford, J.; Hollins, S.E.; Meredith, K.T.; Hughes, C.E. Precipitation stable isotope variability and sub-cloud evaporation processes in a semi-arid region. Hydrol. Process. 2017, 31, 20–34. [Google Scholar] [CrossRef]
  65. Li, J.; Shi, P.; Zhu, G.; He, Y.; Liu, Y.; Tong, H.; Yang, L. Characteristics of atmospheric precipitation δ18 O variability and water vapor transport in the central Hexi Corridor. Acta Sci. Circumstantiae 2015, 35, 947–955. [Google Scholar] [CrossRef]
  66. Chen, X.; Li, Z.; Cheng, L.; Liu, W.; Wang, R. Hydrogen and oxygen stable isotope characteristics of atmospheric precipitation and water vapor sources in Loess Plateau region. Acta Ecol. Sin. 2016, 36, 98–106. [Google Scholar]
  67. Ma, X.; Jia, W.; Ding, D.; Zhu, G.; Gong, N.; Xu, X.; Yuan, R. Characteristics of δ17O variation in atmospheric precipitation and water vapor transport in the eastern Qilian Mountains. Arid. Land Geogr. 2019, 42, 517–525. [Google Scholar]
Figure 1. Location of Shiyang River Basin and distribution of sampling points. The background (left) is based on Natural Earth (https://www.naturalearthdata.com/ accessed on 8 June 2023).
Water 15 03836 g001
Figure 2. Temporal variation of δ18O values and d-excess values at each sampling site in the Shiyang River Basin (a) Lenglongling, (b) Hulinzhan, (c) Huajianxiang, (d) Xiyingwugou, (e) Xiyingzhen, (f) Yangxiaba, (g) Jiuduntan, (h) Hongqigu, (i) Xuebaizhen, (j) Datanxiang, (k) Qingtuhu, (l) Whole basin.
Water 15 03836 g002
Figure 3. Temporal variation of lifting condensation level (LCL) in Shiyang River Basin.
Water 15 03836 g003
Figure 4. Monthly variation of δ18O, δ2H and d-excess values in Shiyang River Basin (the average values of the box and whisker plots were based on values from June 2018 to May 2020).
Water 15 03836 g004
Figure 5. Monthly variations of δ2H values, δ18O values, d-excess values, temperature and total precipitation in the Shiyang River Basin at Lenglongling, Hulinzhan, Xiyingwugou and Jiuduntan from June 2018 to May 2020.
Water 15 03836 g005
Figure 6. Spatial distribution of δ2H, δ18O and d-excess values in the Shiyang River Basin (a). δ18O in all year, (b). δ18O in warm season, (c). δ18O in cold season, (d). δ2H in all year, (e). δ2H in warm season, (f). δ2H in cold season, (g). d-excess in all year, (h). d-excess in warm season, (i). d-excess in cold season.
Water 15 03836 g006
Figure 7. Relationship between δ18O in precipitation and temperature in the Shiyang River Basin (a). monthly scale, (b). daily scale.
Water 15 03836 g007
Figure 8. Variation of δ18O and d-excess of precipitation with temperature in the Shiyang River Basin.
Water 15 03836 g008
Figure 9. Relationship between δ18O and precipitation amount for summer 2019 in the Shiyang River Basin (a). upstream, (b). mid-downstream.
Water 15 03836 g009
Figure 10. Variation of δ18O and d-excess in precipitation with the relative humidity in the Shiyang River Basin.
Water 15 03836 g010
Figure 11. Variation of precipitation δ18O and d-excess with water vapor pressure in Shiyang River Basin.
Water 15 03836 g011
Table 1. Information of sampling points in the Shiyang River Basin.
Sampling PointsLongitude/ELatitude/NElevation/mNumber of SamplesSampling Period
UpstreamLenglongling101.86°37.56°3653224June 2018~May 2020
Hulinzhan101.89°37.69°272090June 2018~May 2020
Huajianxiang102.01°37.84°2324117June 2018~October 2019
Xiyingwugou102.18°37.89°209669June 2018~May 2020
MidstreamXiyingzhen102.43°37.97°174842June 2018~April 2019
Yangxiaba102.69°38.03°148922June 2018~January 2019
Jiuduntan102.75°38.12°146447June 2018~May 2020
Hongqigu102.85°38.36°142136August 2018~May 2020
DownstreamXuebaizhen103.02°38.55°138713June 2018~October 2018
Datanxiang103.23°38.79°134819June 2018~September 2019
Qingtuhu103.61°39.05°13139May 2019~September 2019
Table 2. Isotope values and local meteoric water line in each sampling point of the Shiyang River Basin.
RegionNumber of SamplesPrecipitation Weighted AverageLMWLR2
δ2H/‰δ18O/‰
Lenglongling224−63.7−10.0δ2H = (8.1 ± 0.1) δ18O + (17.9 ± 1.0)0.97
Hulinzhan90−50.4−8.1δ2H = (7.8 ± 0.2) δ18O + (12.9 ± 1.4)0.97
Huajianxiang117−40.0−6.1δ2H = (7.5 ± 0.1) δ18O + (5.9 ± 1.1)0.97
Xiyingwugou69−70.7−10.4δ2H = (8.0 ± 0.1) δ18O + (11.7 ± 1.5)0.98
Xiyingzhen42−44.3−6.8δ2H = (7.3 ± 0.3) δ18O + (5.6 ± 2.3)0.94
Yangxiaba22−49.7−7.4δ2H = (7.8 ± 0.3) δ18O + (6.2 ± 3.0)0.96
Jiuduntan47−35.3−5.8δ2H = (7.7 ± 0.3) δ18O + (8.0 ± 1.9)0.95
Hongqigu36−28.7−4.8δ2H = (6.7 ± 0.3) δ18O + (2.8 ± 2.4)0.92
Xuebaizhen13−41.1−6.6δ2H = (6.1 ± 0.5) δ18O + (−0.7 ± 3.5)0.94
Datanxiang19−47.5−7.0δ2H = (7.1 ± 0.4) δ18O + (2.4 ± 3.0)0.95
Qingtuhu9−36.8−5.4δ2H = (6.3 ± 0.6) δ18O + (−2.3 ± 3.3)0.88
Upstream500−55.4−8.6δ2H = (7.7 ± 0.1) δ18O + (11.4 ± 0.6)0.97
Mid-downstream188−39.8−6.2δ2H = (7.4 ± 0.1) δ18O + (6.1 ± 1.1)0.95
Whole basin688−51.6−8.0δ2H = (7.6 ± 0.1) δ18O + (9.8 ± 0.5)0.97
Table 3. Relationship between δ18O and d-excess in precipitation with temperature in different ranges in the Shiyang River Basin.
AreaTemperature Effect of δ18O (‰/°C) (R2)Temperature Effect of d-Excess (‰/°C) (R2)
<0 °C0–10 °C>10 °CT<0 °C0–10 °C>10 °CT
Upstream0.53 (0.12) **0.73 (0.19) **−0.06 (0.003)0.55 (0.48) **0.55 (0.05) *−0.34 (0.02)−0.27 (0.01)−0.06 (0.003)
Mid-downstream0.40 (0.02)1.86 (0.42) **0.21 (0.06) **0.43 (0.49) **0.38 (0.02)1.87 (0.14)−0.53 (0.05) **−0.16 (0.02) *
Whole basin0.52 (0.11) **0.77 (0.19) **0.07 (0.01)0.47 (0.48) **0.54 (0.05) *−0.26 (0.01)−0.39 (0.04) **−0.15 (0.02) **
* indicates p < 0.05, ** indicates p < 0.01, the same below.
Table 4. Relationship between stable isotopes of precipitation and precipitation amount in the Shiyang River Basin during different seasons.
SeasonNumber of SamplesThe Amount Effect of δ2H (‰/mm) (R2)The Amount Effect of δ18O (‰/mm) (R2)The Amount Effect of d-Excess (‰/mm) (R2)
Spring1201.64 (0.03)0.14 (0.01)0.55 (0.10) **
Summer335−1.57 (0.07) **−0.25 (0.09) **0.42 (0.05) **
Autumn1791.44 (0.02)0.11 (0.01)0.52 (0.05) **
Winter46−2.68 (0.02)−0.39 (0.02)0.46 (0.02)
All year6801.06 (0.01) **0.08 (0.003)0.42 (0.04) **
** indicates p < 0.01.
Table 5. Relationship between stable isotopes of precipitation and precipitation amount under different rainfall conditions in the Shiyang River basin.
AreaThe Amount Effect of
δ2H (‰/mm) (R2)
The Amount Effect of δ18O (‰/mm) (R2)The Amount Effect of d-Excess (‰/mm) (R2)
0–10 mm10–25 mm0–10 mm10–25 mm0–10 mm10–25 mm
Upstream2.79 (0.01) *−1.15 (0.01)0.26 (0.01)−0.13 (0.01)0.74 (0.03) **−0.12 (0.003)
Mid-downstream0.13 (0.0001)−0.28 (0.001)−0.11 (0.002)−0.12 (0.01)0.99 (0.06) **0.67 (0.03)
Whole basin1.92 (0.01) *−1.20 (0.01)0.14 (0.002)−0.15 (0.01)0.83 (0.04) **0.003 (0.00)
* indicates p < 0.05, ** indicates p < 0.01.
Table 6. Relationship between stable isotopes of precipitation with the relative humidity and mean values of meteorological elements in the Shiyang River Basin.
Relative
Humidity/%
Number
of
Samples
δ2H vs. RH
Slope
(R2)
δ18O vs. RH
Slope
(R2)
d-Excess vs. RH
Slope
(R2)
Average Temperature/°CAverage Precipitation
/mm
Average Water Vapor Pressure
/hPa
<50790.9 (0.010)0.10 (0.008)0.08 (0.003)12.275.457.41
50–60812.97 (0.022)0.44 (0.029)−0.55 (0.030)9.406.008.15
60–701822.68 (0.024) *0.25 (0.013)0.66 (0.038) **9.046.249.20
70–801981.63 (0.012)0.17 (0.009)0.26 (0.009)9.457.4610.07
80–100133−0.07 (−0.008)−0.01 (−0.008)0.003 (−0.008)10.199.3711.15
* indicates p < 0.05, ** indicates p < 0.01.
Table 7. Relationship between stable isotopes of precipitation with water vapor pressure and mean values of meteorological elements in the Shiyang River Basin.
Vapor Pressure/hPaNumber
of
Samples
δ2H vs. Vapor
Pressure Slope
(R2)
δ18O vs. Vapor
Pressure Slope
(R2)
d-Excess vs. Vapor
Pressure Slope
(R2)
Average Temperature
/°C
Average Precipitation
/mm
Average RH
/%
0–515626.46 (0.27) **2.9 (0.22) **3.26 (0.13) **−3.225.1259.93
5–102355.93 (0.05) **0.77 (0.04) **−0.2 (0.001)8.416.6870.31
10–151574.2 (0.04) *0.61 (0.04) **−0.66 (0.01)15.888.6470.29
>15125−2.95 (0.05) **−0.4 (0.04) **0.25 (0.003)21.078.3071.33
* indicates p < 0.05, ** indicates p < 0.01.
Disclaimer/Publisher’s Note: The statements, opinions and data contained in all publications are solely those of the individual author(s) and contributor(s) and not of MDPI and/or the editor(s). MDPI and/or the editor(s) disclaim responsibility for any injury to people or property resulting from any ideas, methods, instructions or products referred to in the content.

