
Total Dissolved Solids Risk Assessment and Optimisation Scheme of Managed Aquifer Recharge Projects in a Karst Area of Northern China
Abstract
:1. Introduction
2. Study Area and Project Design
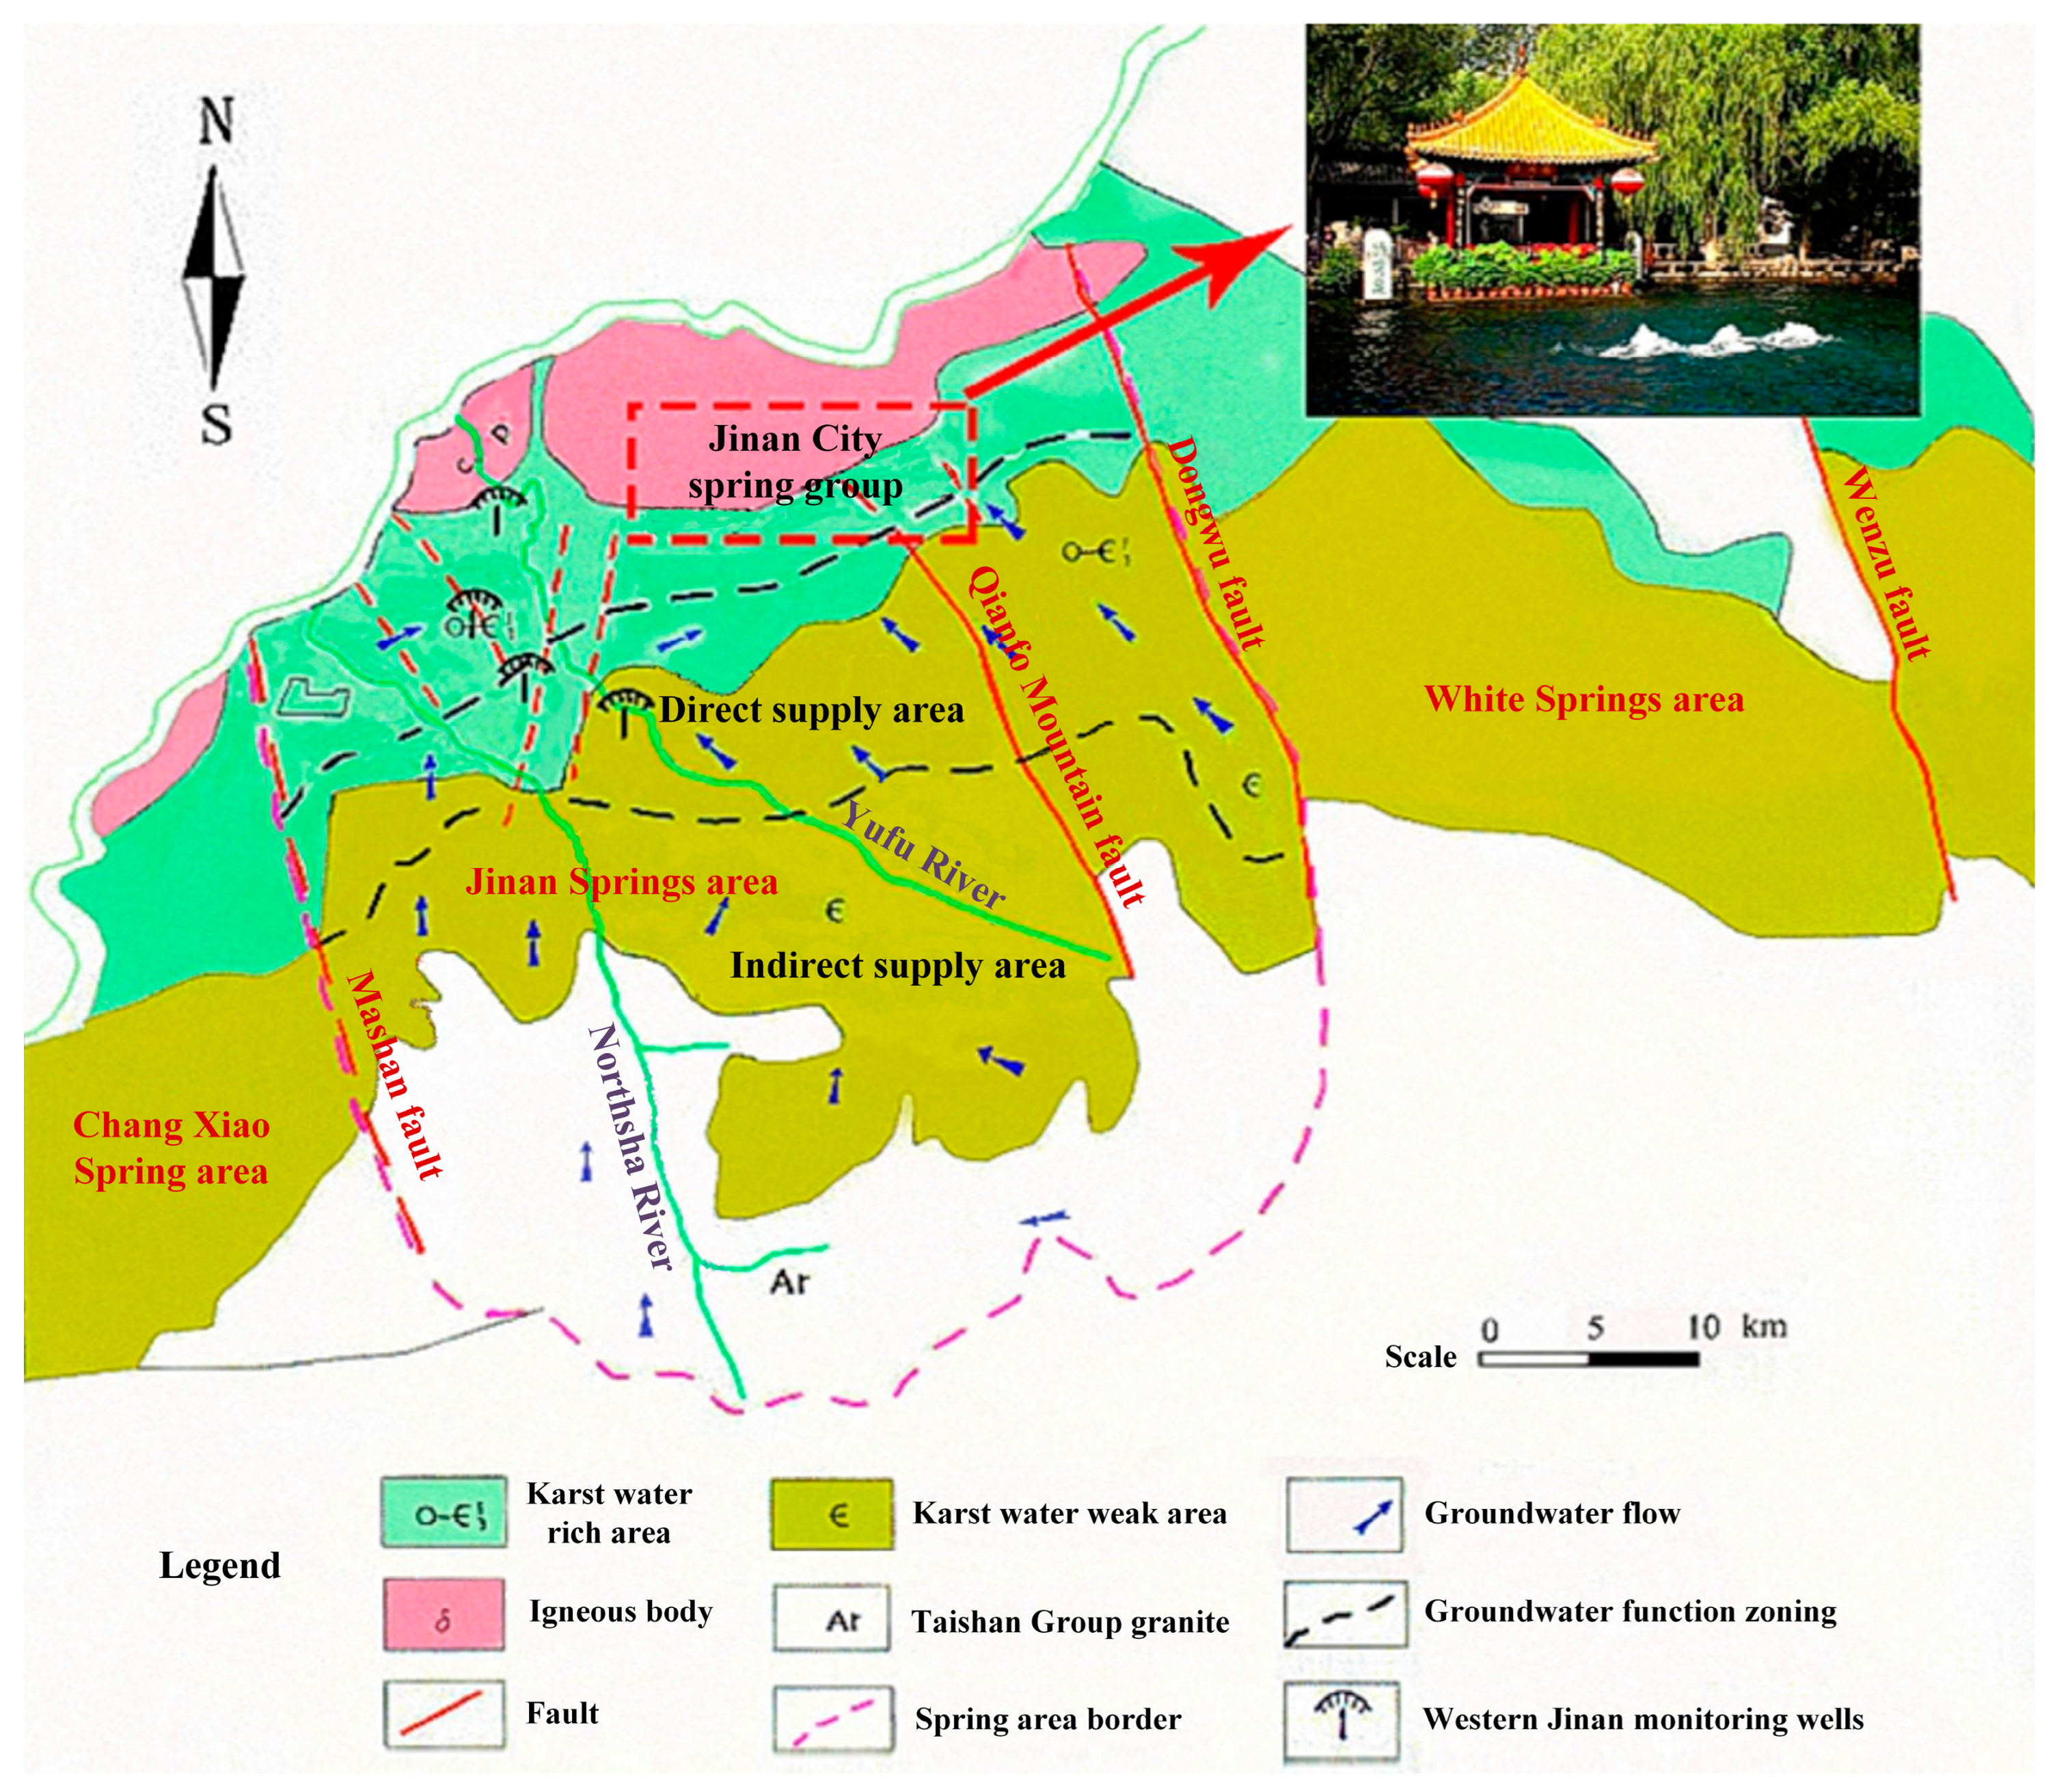
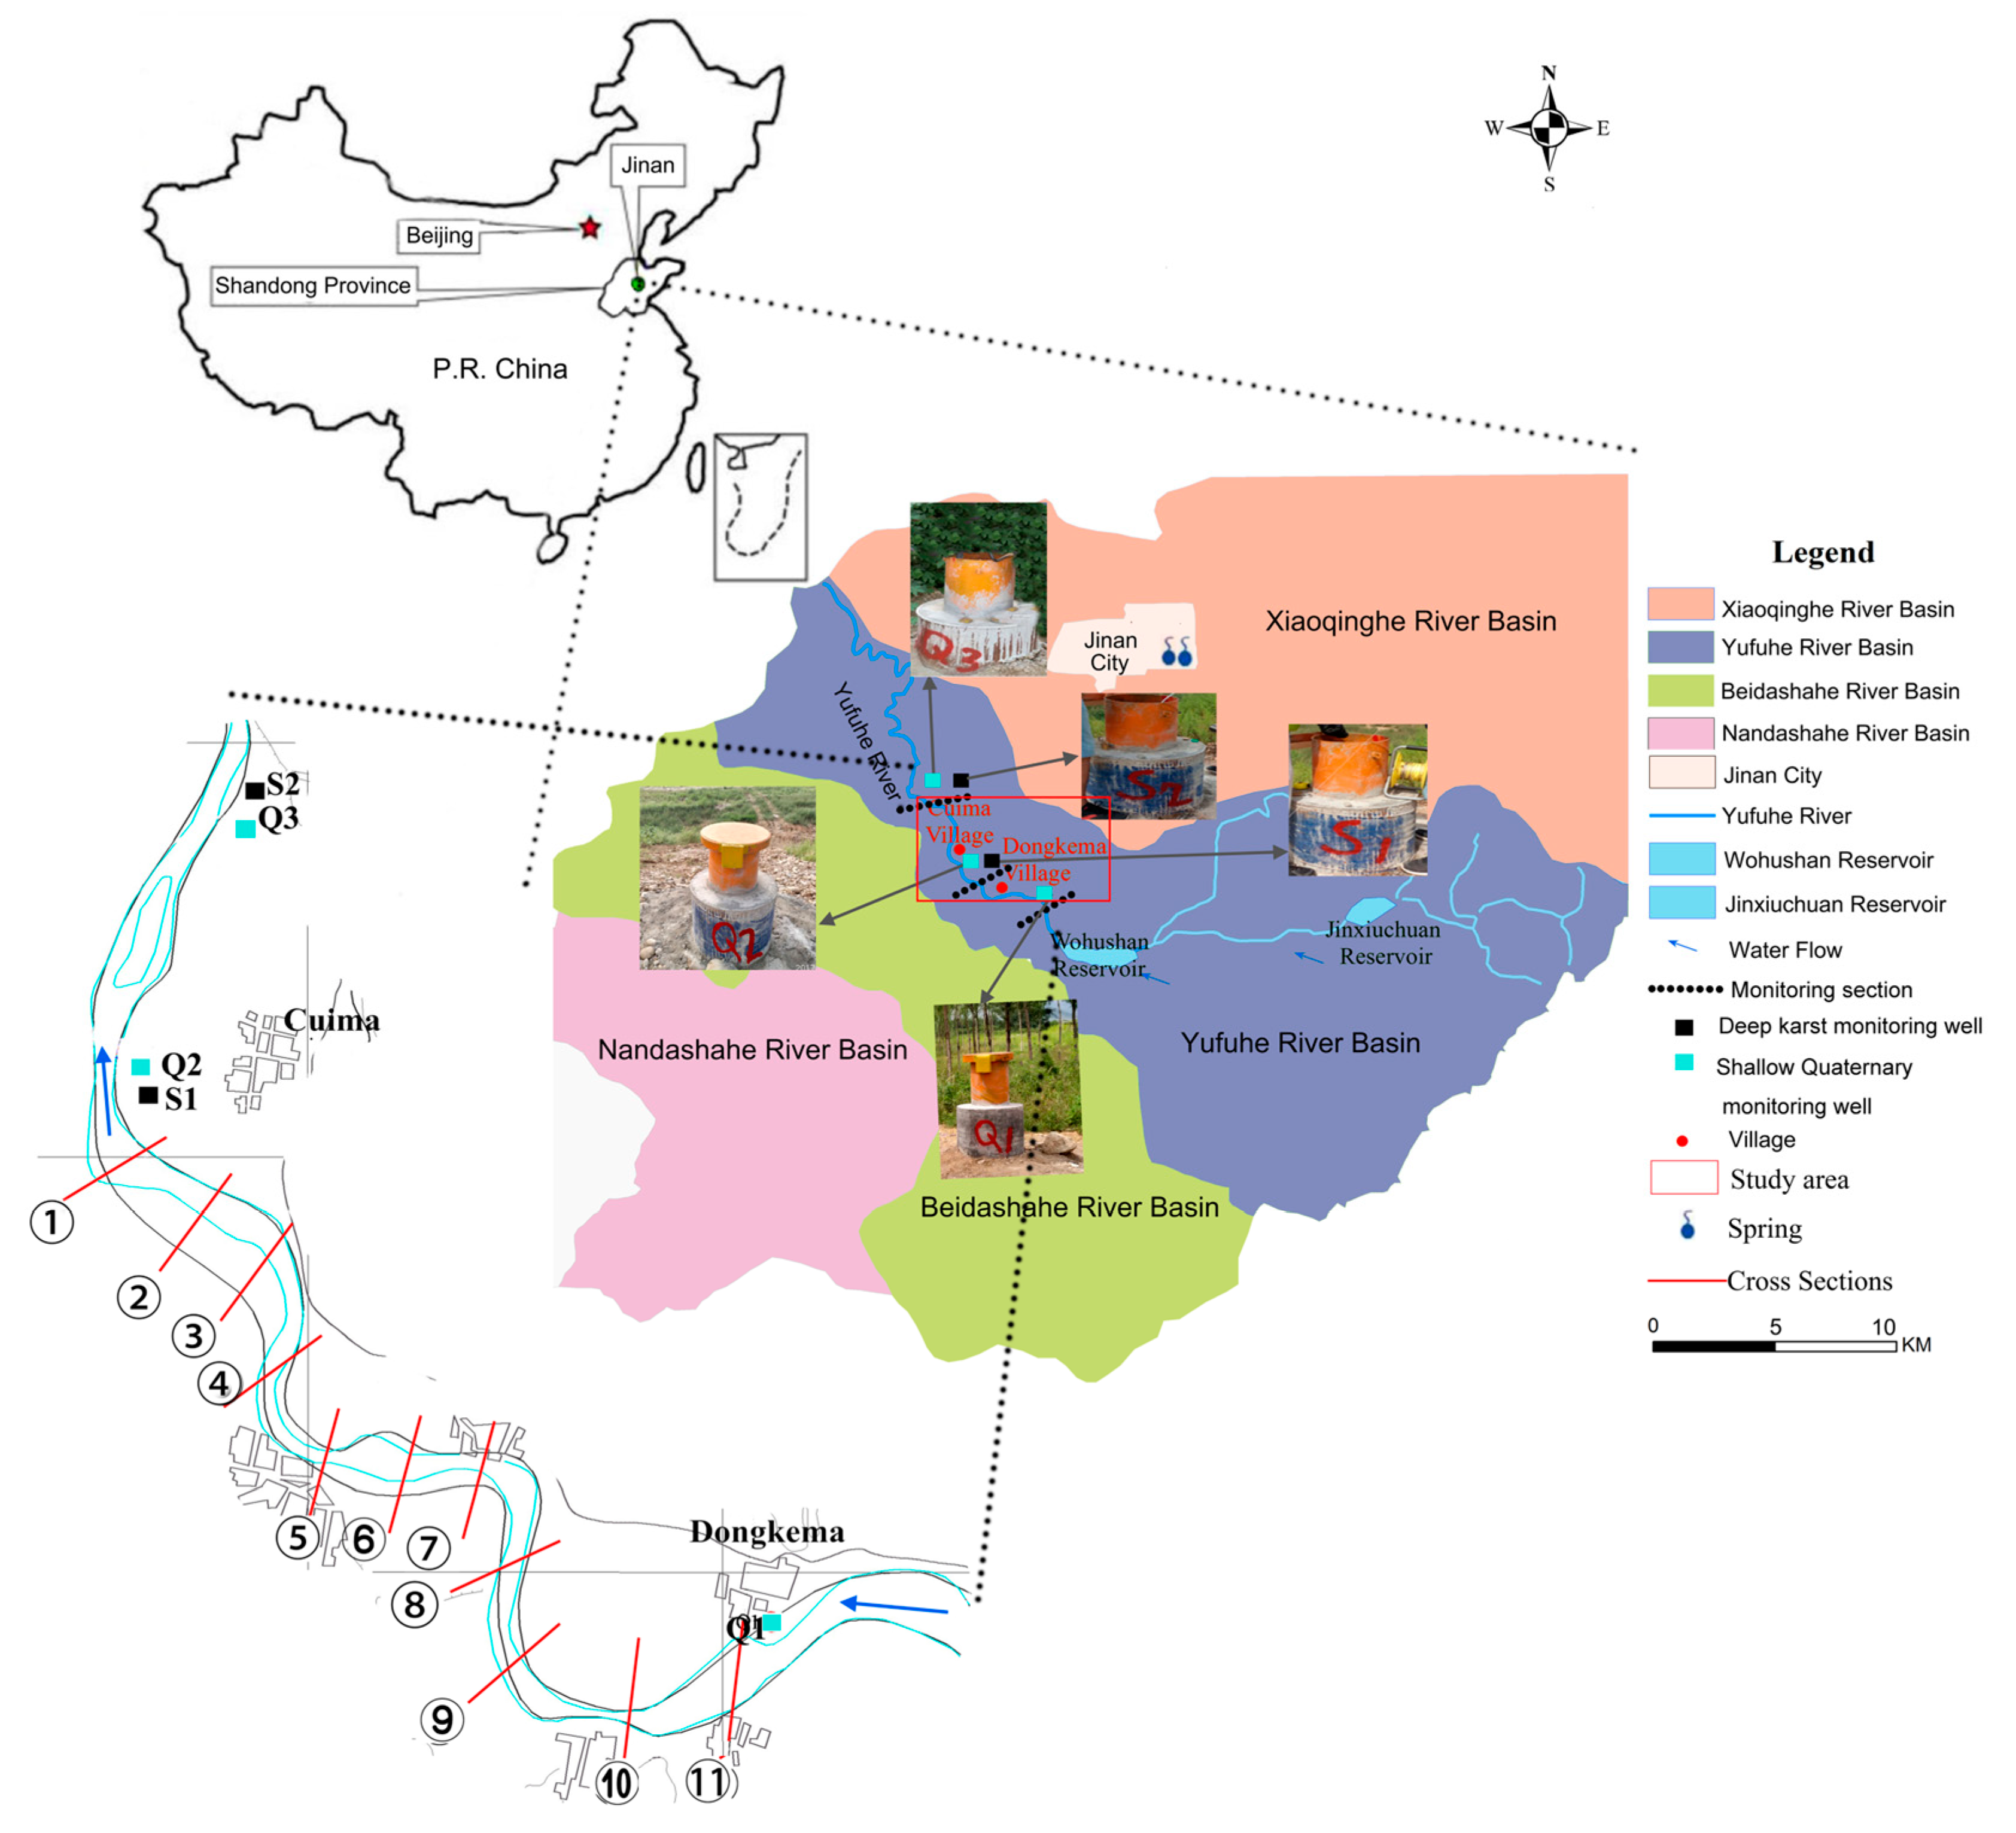
2.1. Geography
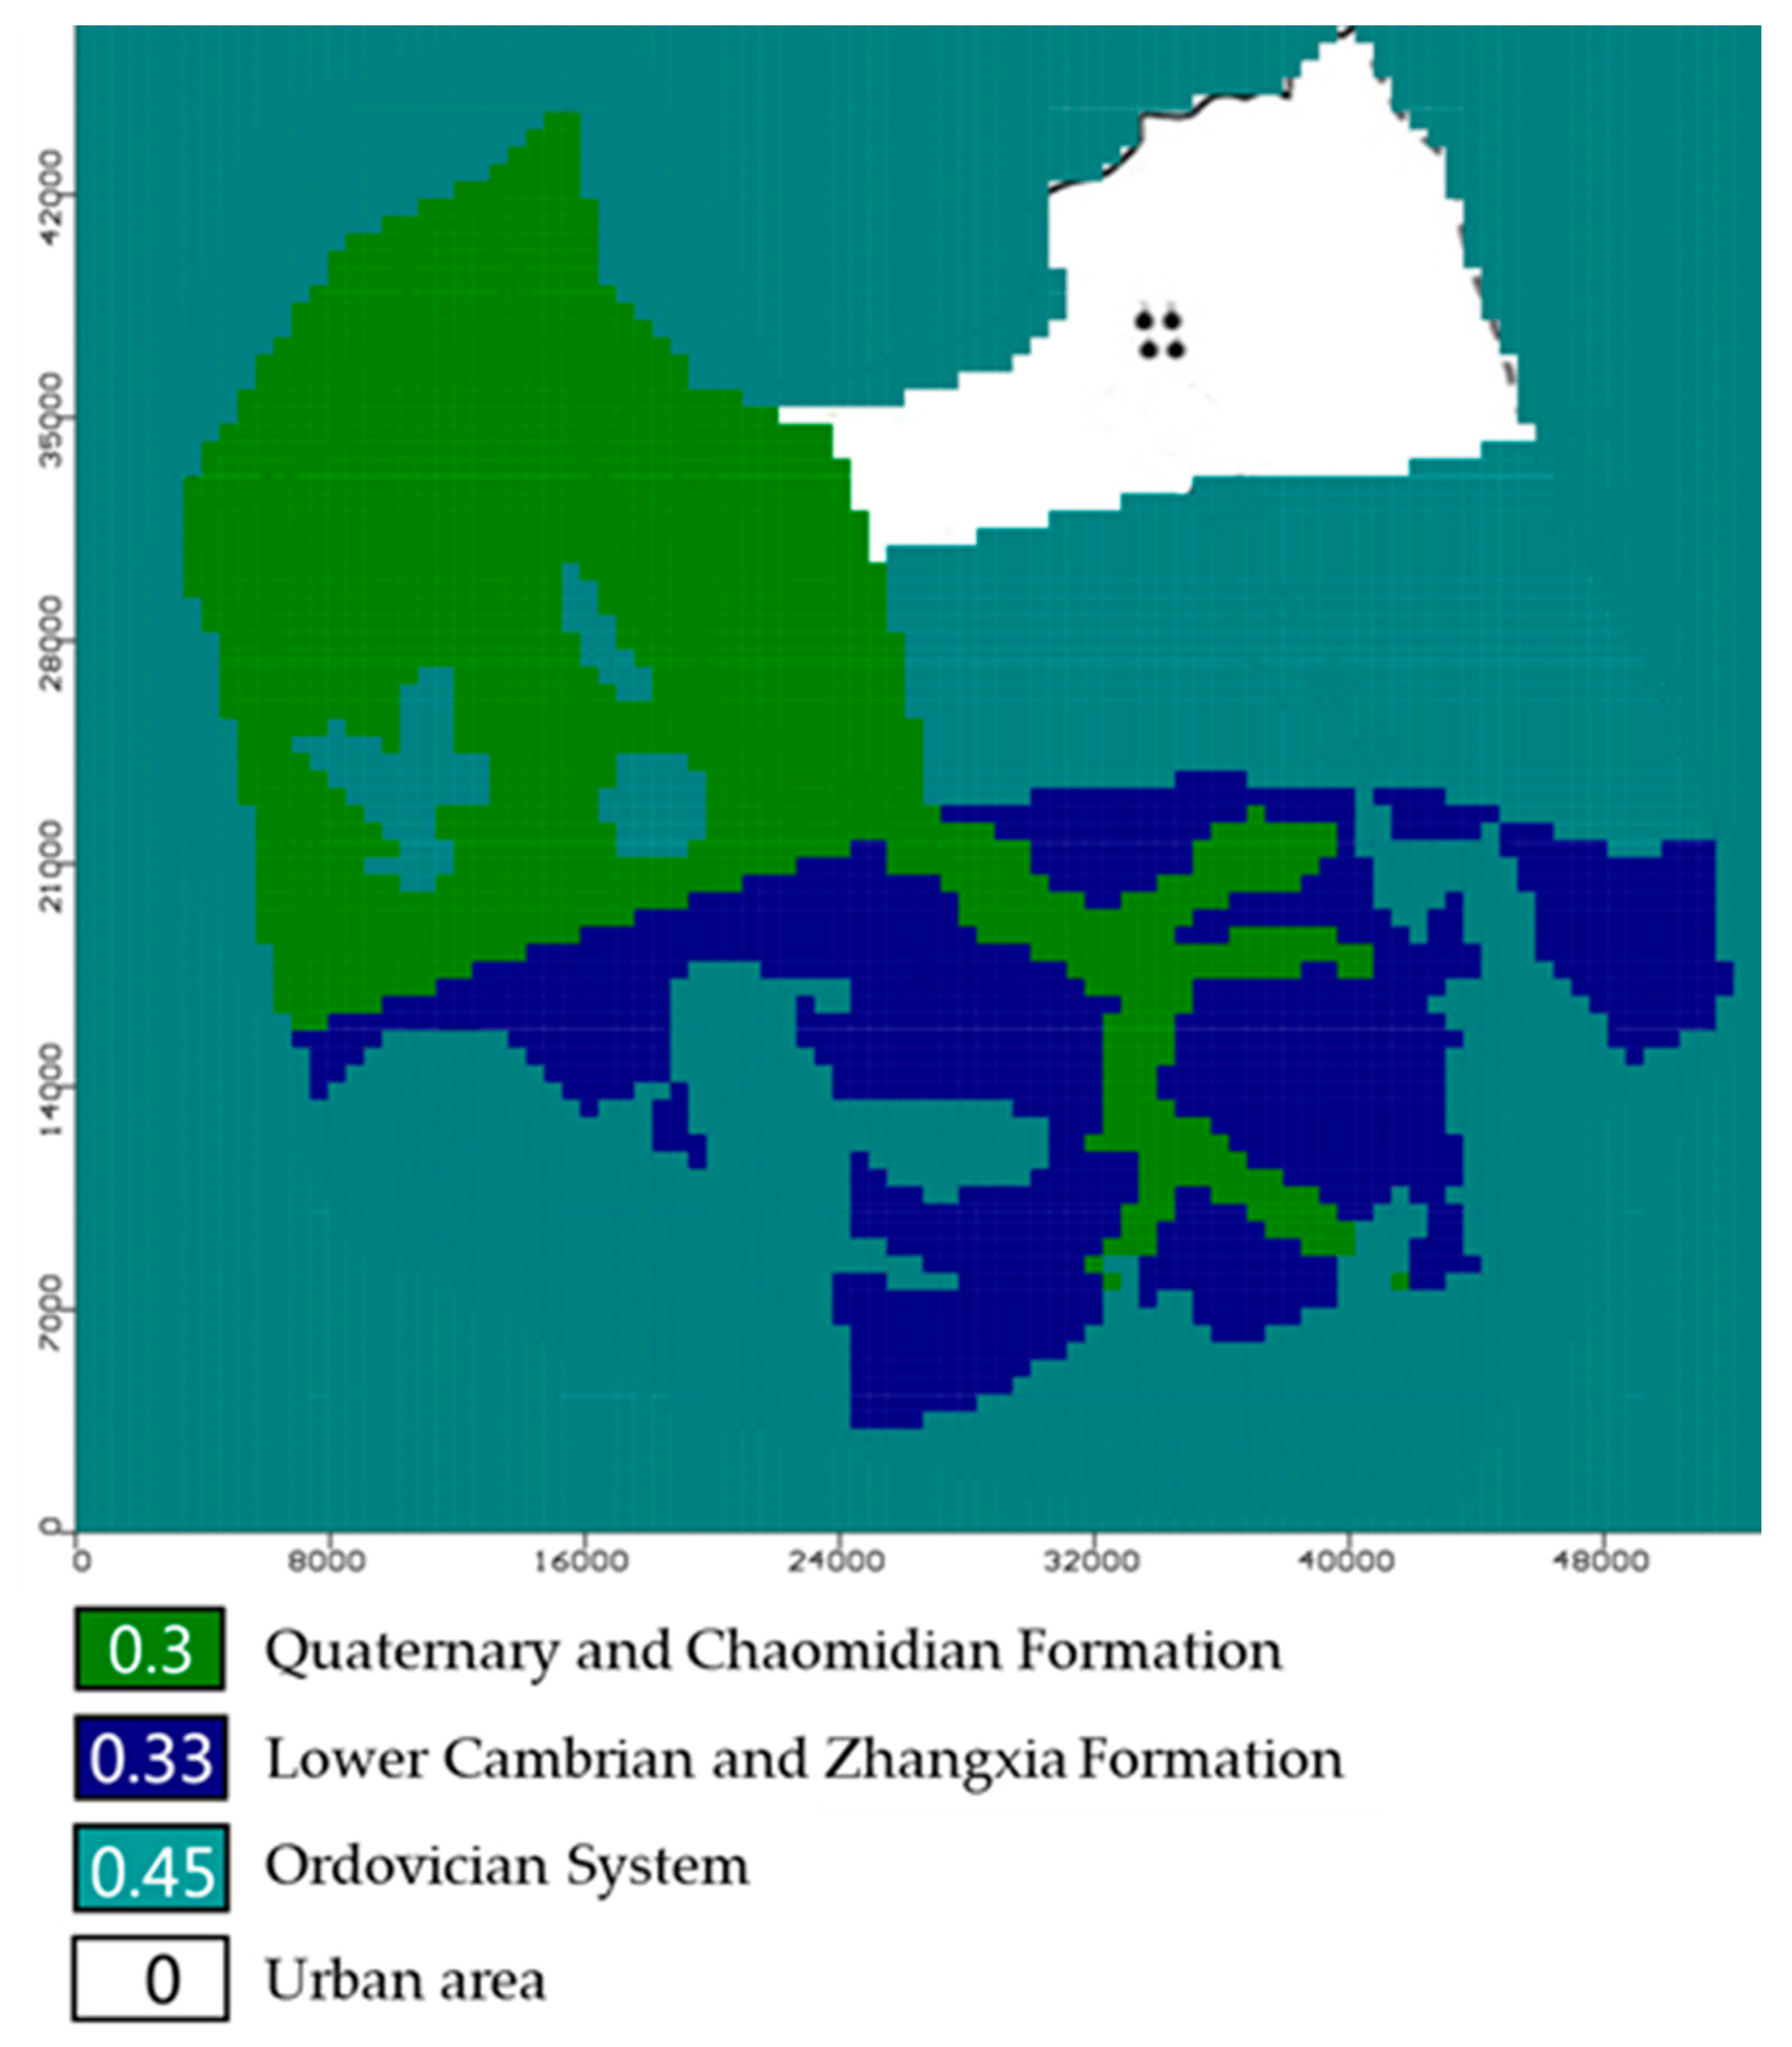
2.2. Geology and Hydrogeology
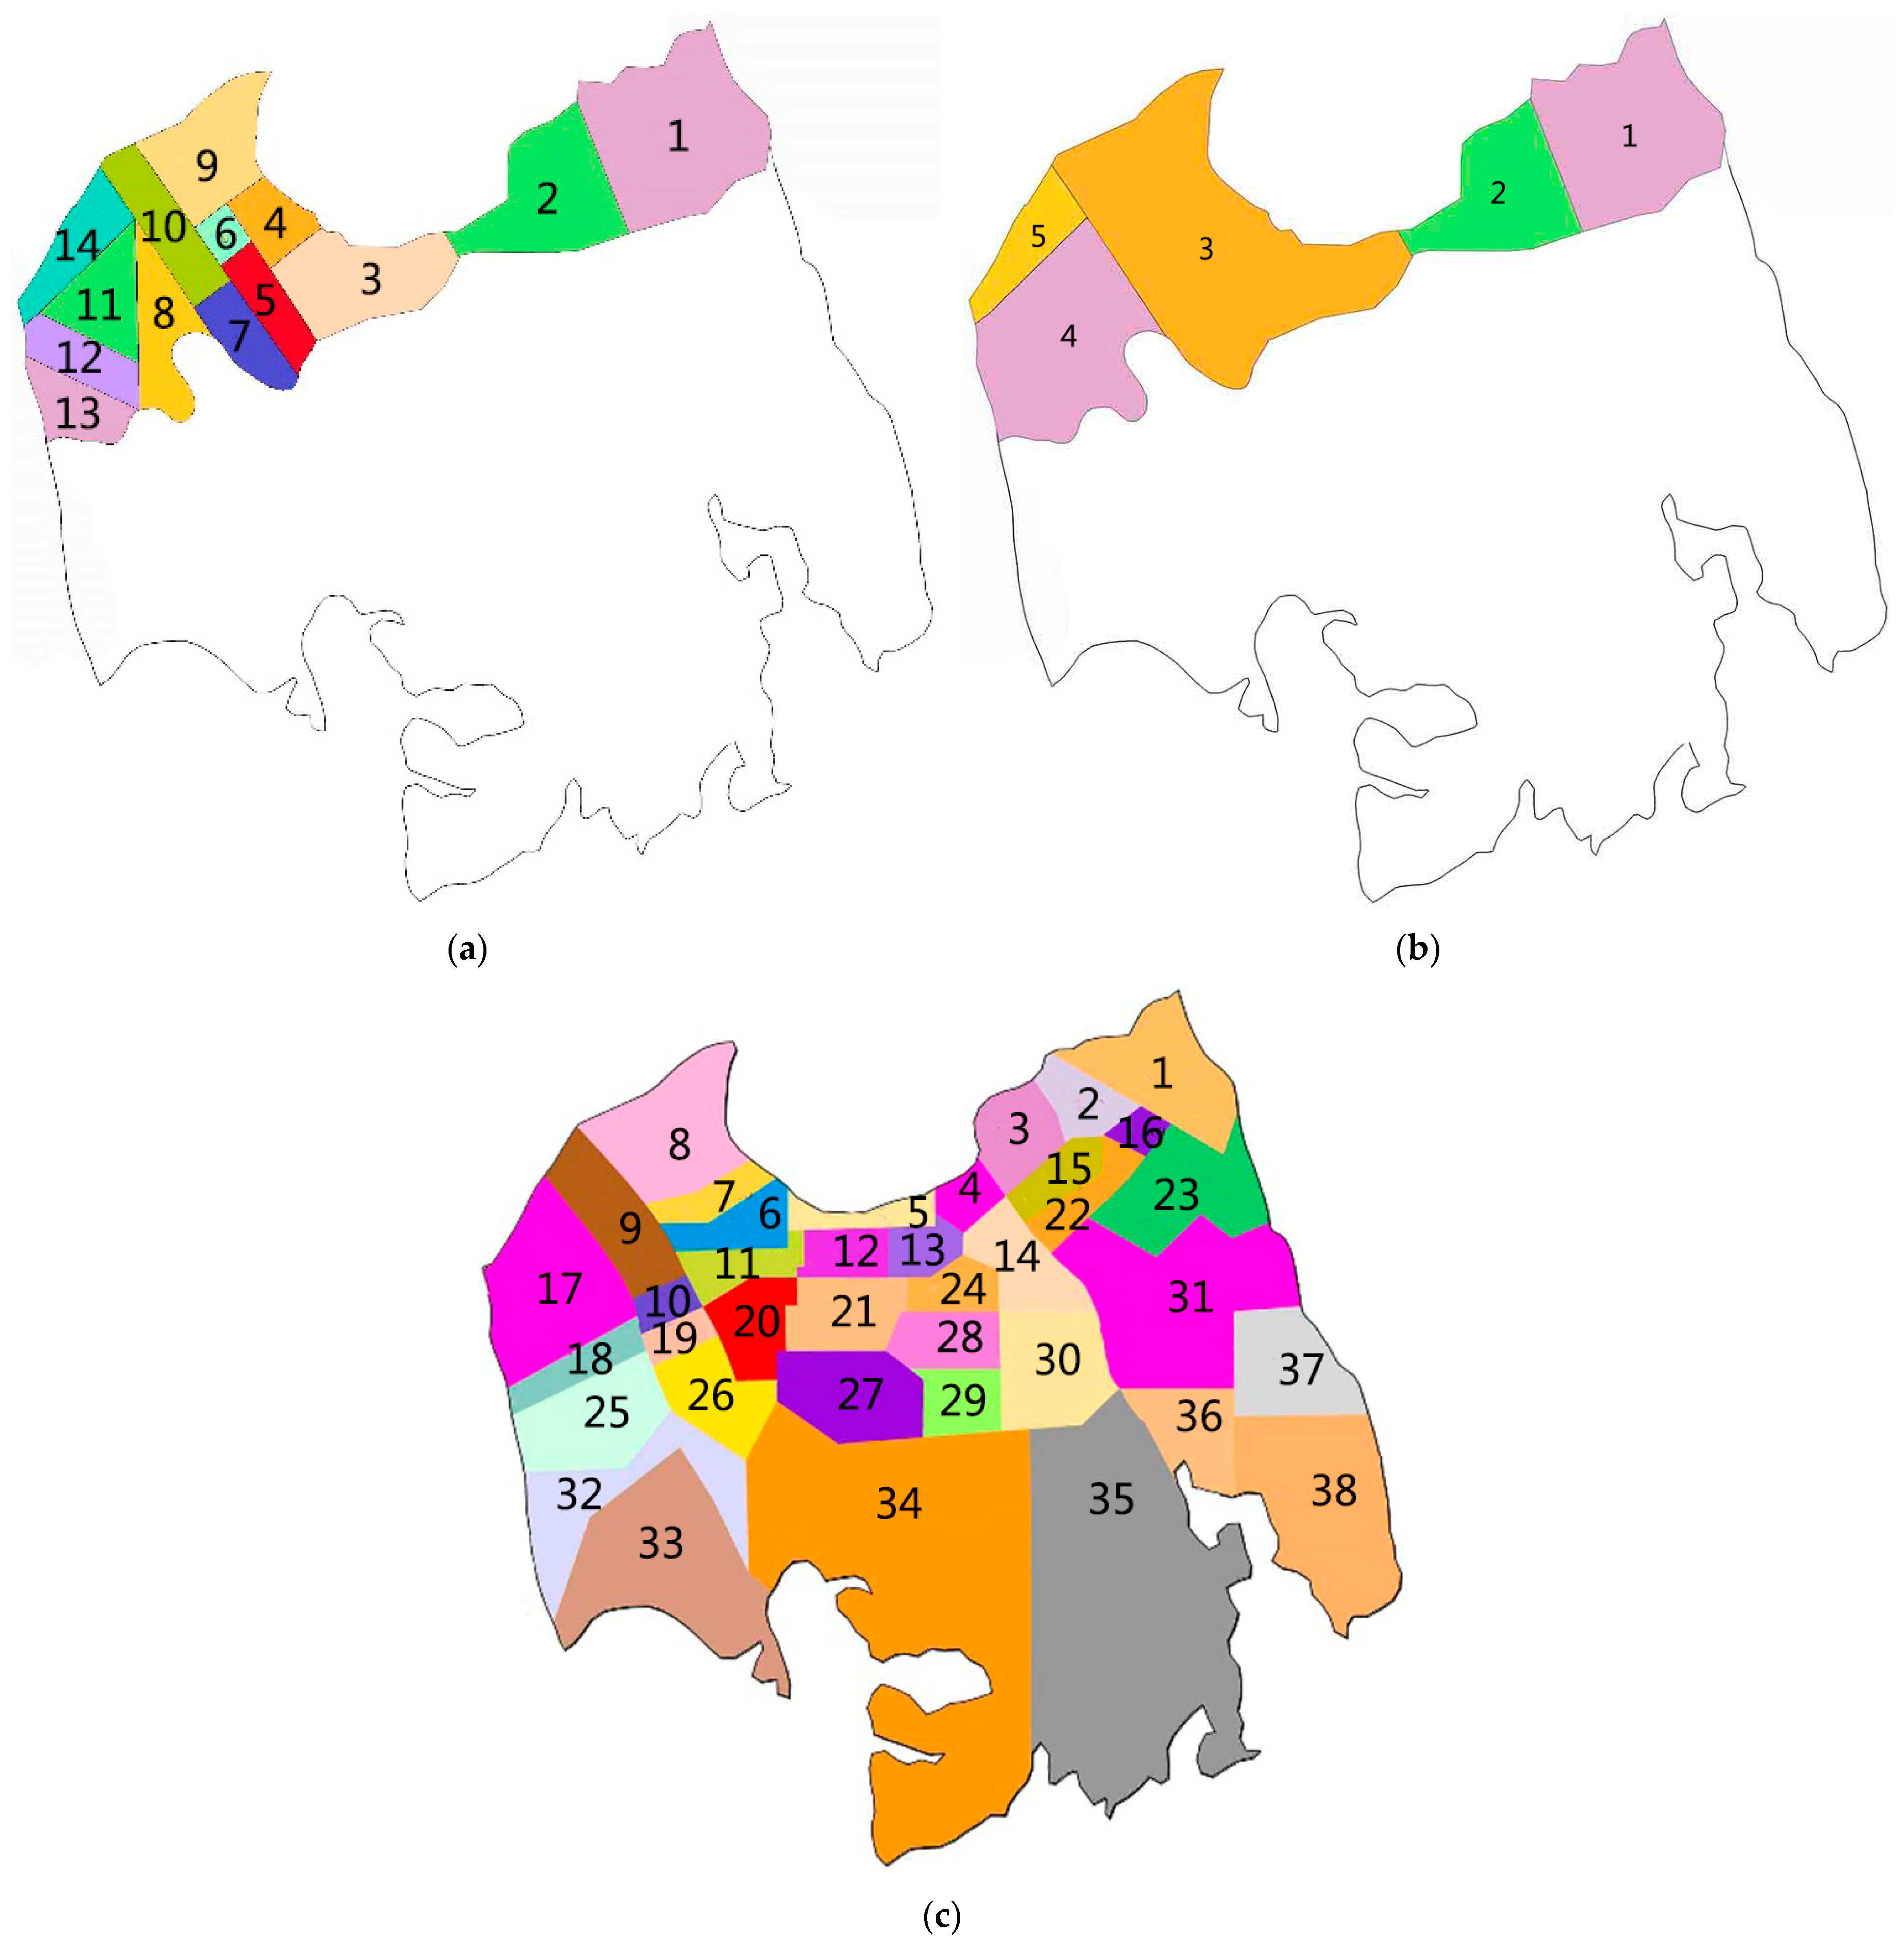
2.3. Structure of the Artificial Recharge Project
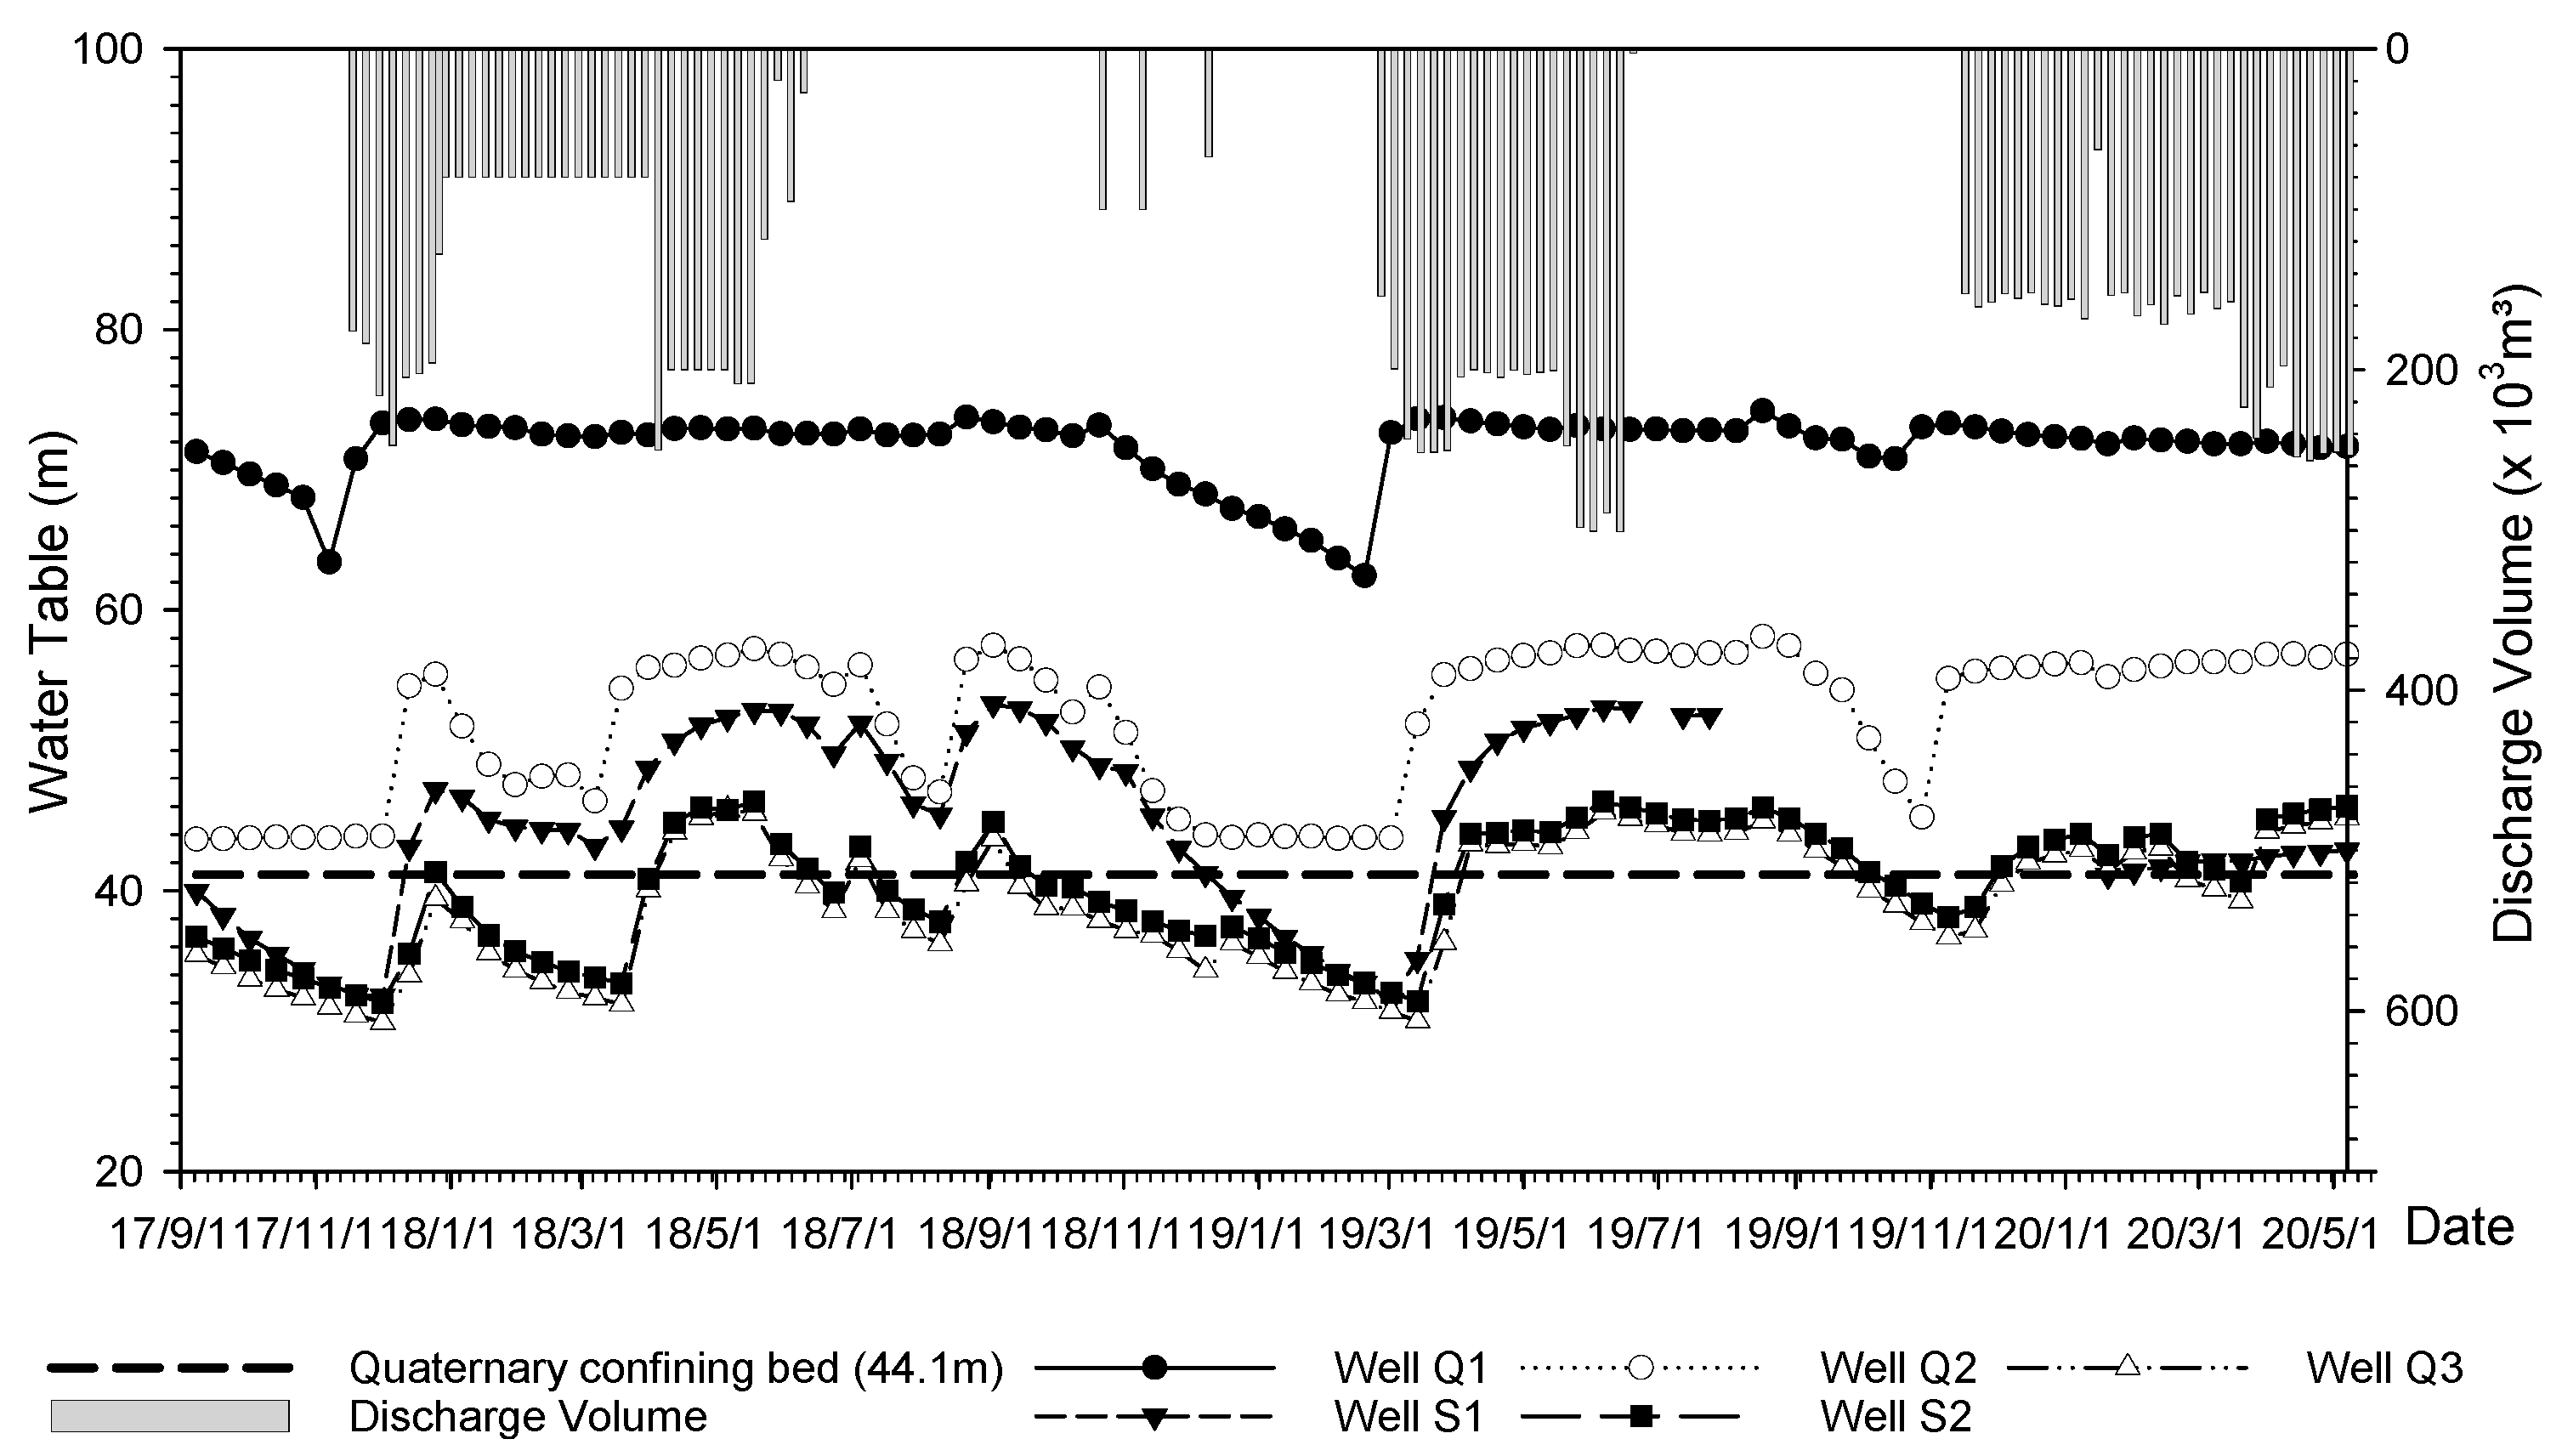
2.4. Surface Water and Groundwater Monitoring Systems
3. Methods
3.1. Overview
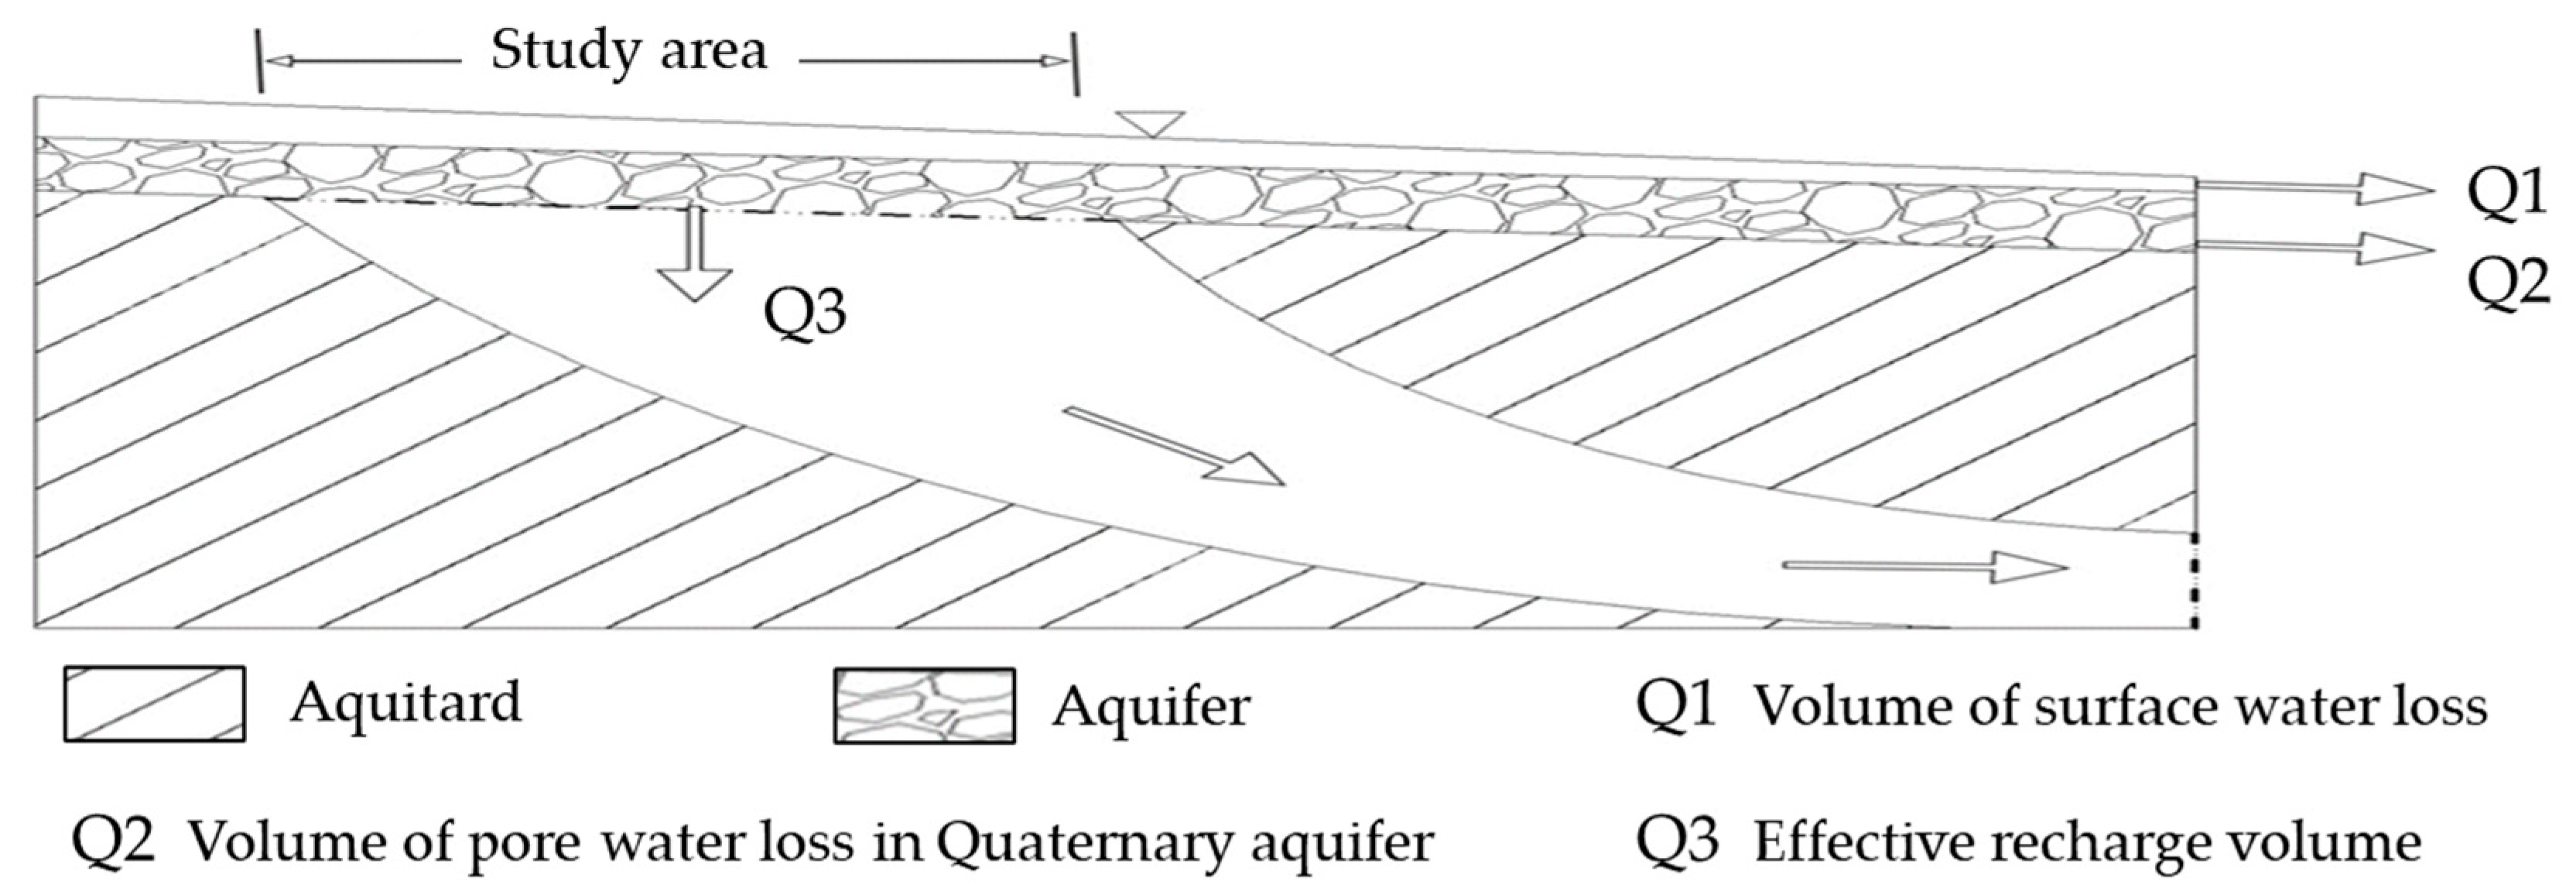
3.2. Conceptual Model of Groundwater Flow System
3.3. Numerical Model
3.3.1. Spatiotemporal Numerical Discretization
3.3.2. Boundary Conditions
3.3.3. Initial Conditions
3.4. Model Calibration and Validation
4. Results and Discussion
4.1. TDS Risk and Optimisation Strategy Analysis
4.2. Impact of Artificial Groundwater Recharge on TDS Concentration
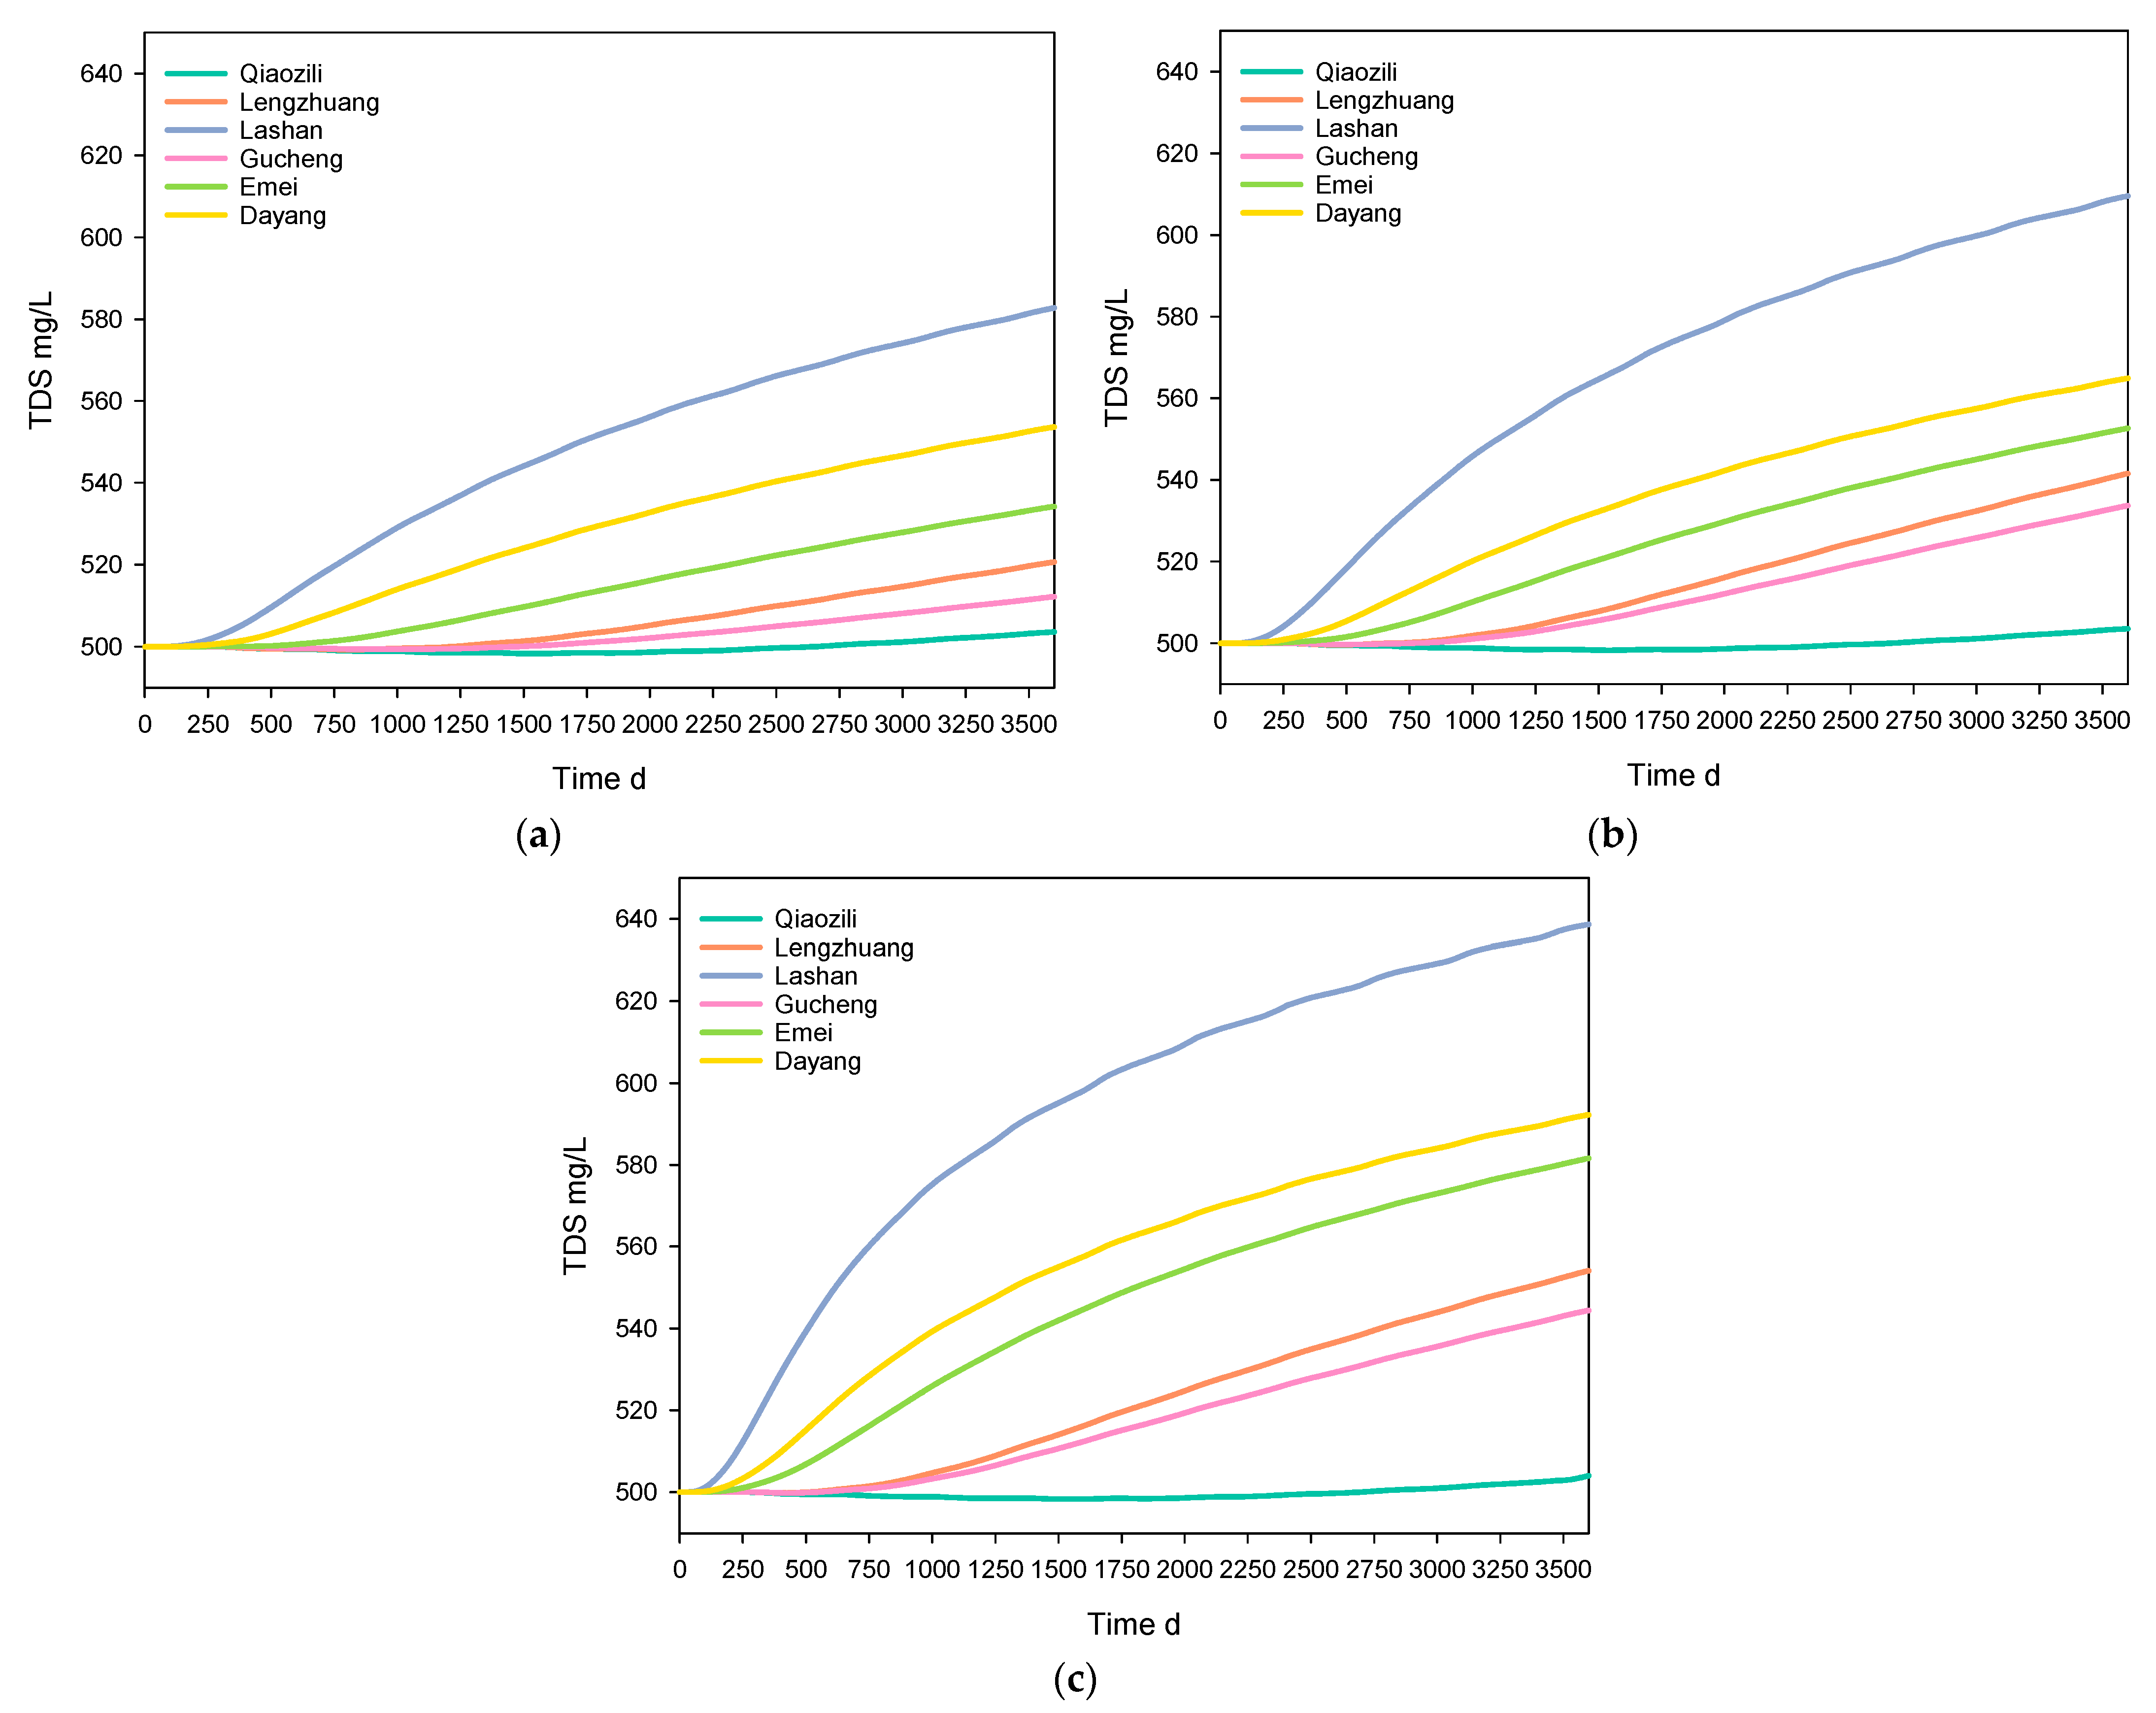
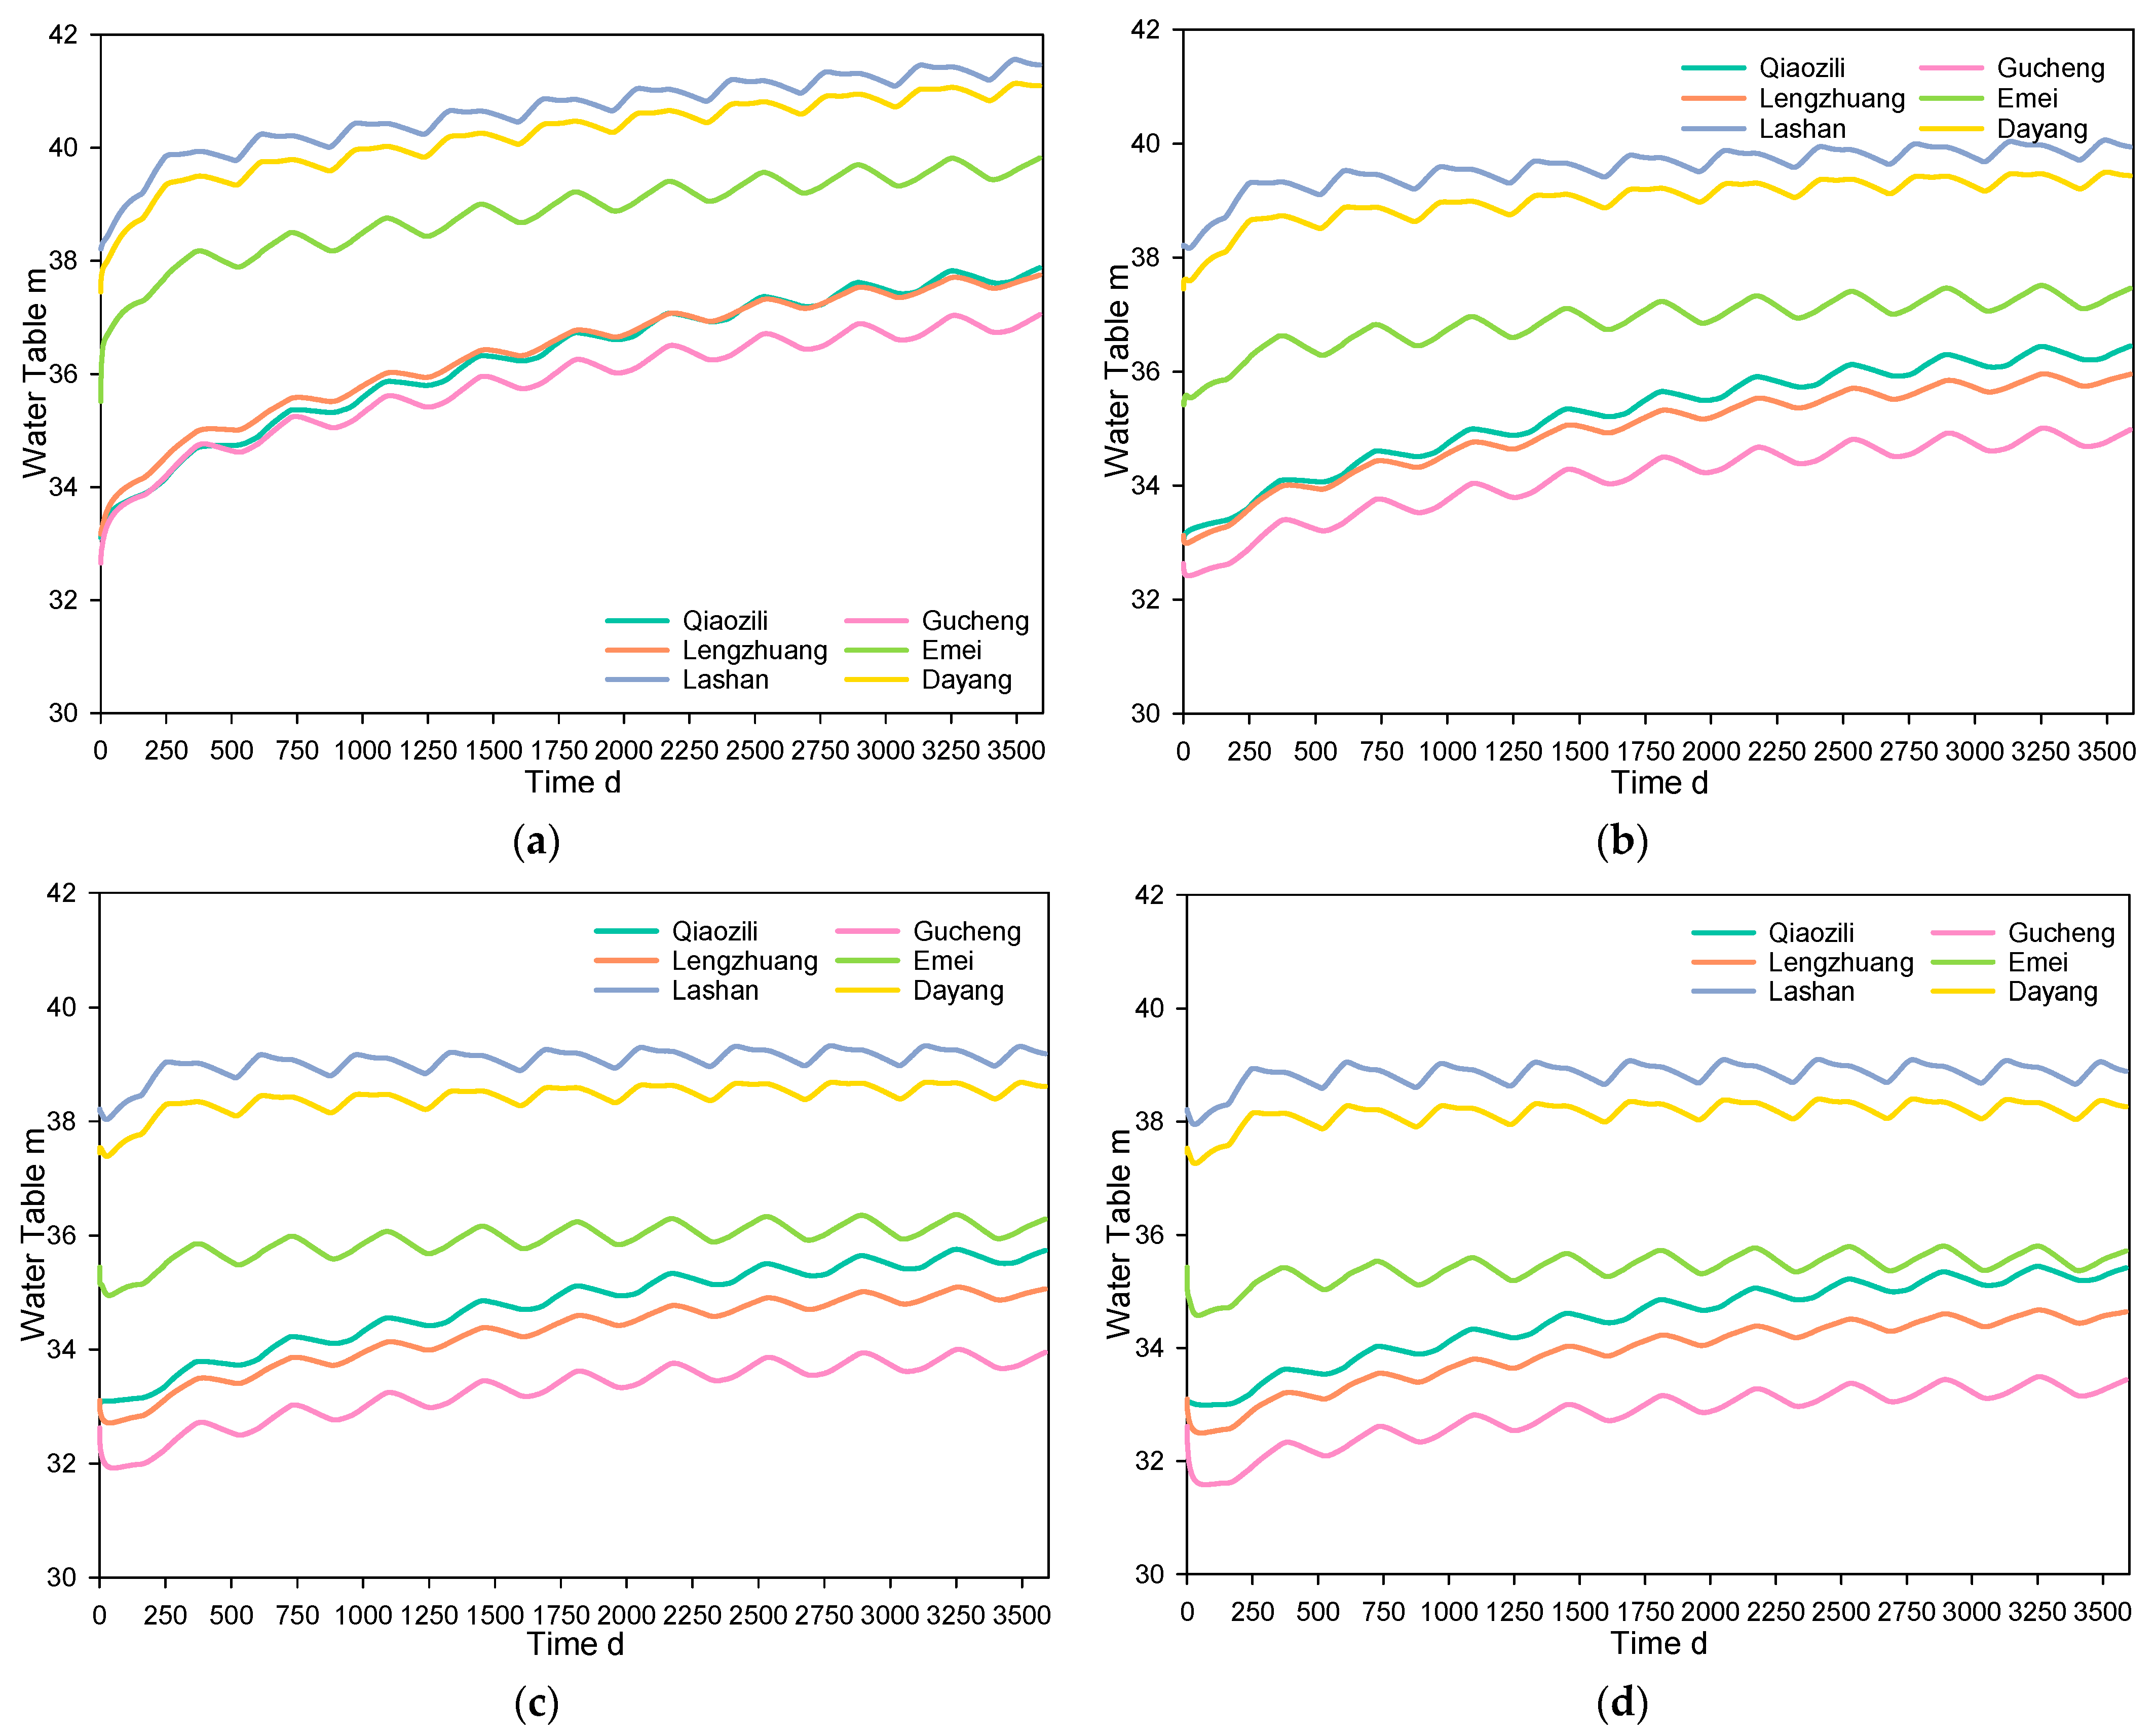
4.3. Pumping Optimisation and Water Quality Scenario Simulation
4.3.1. Water Source Exploitation Plan
4.3.2. Numerical Simulation of Various Pumping Strategies under Recharge Conditions
4.4. Limitations of the Model
5. Conclusions
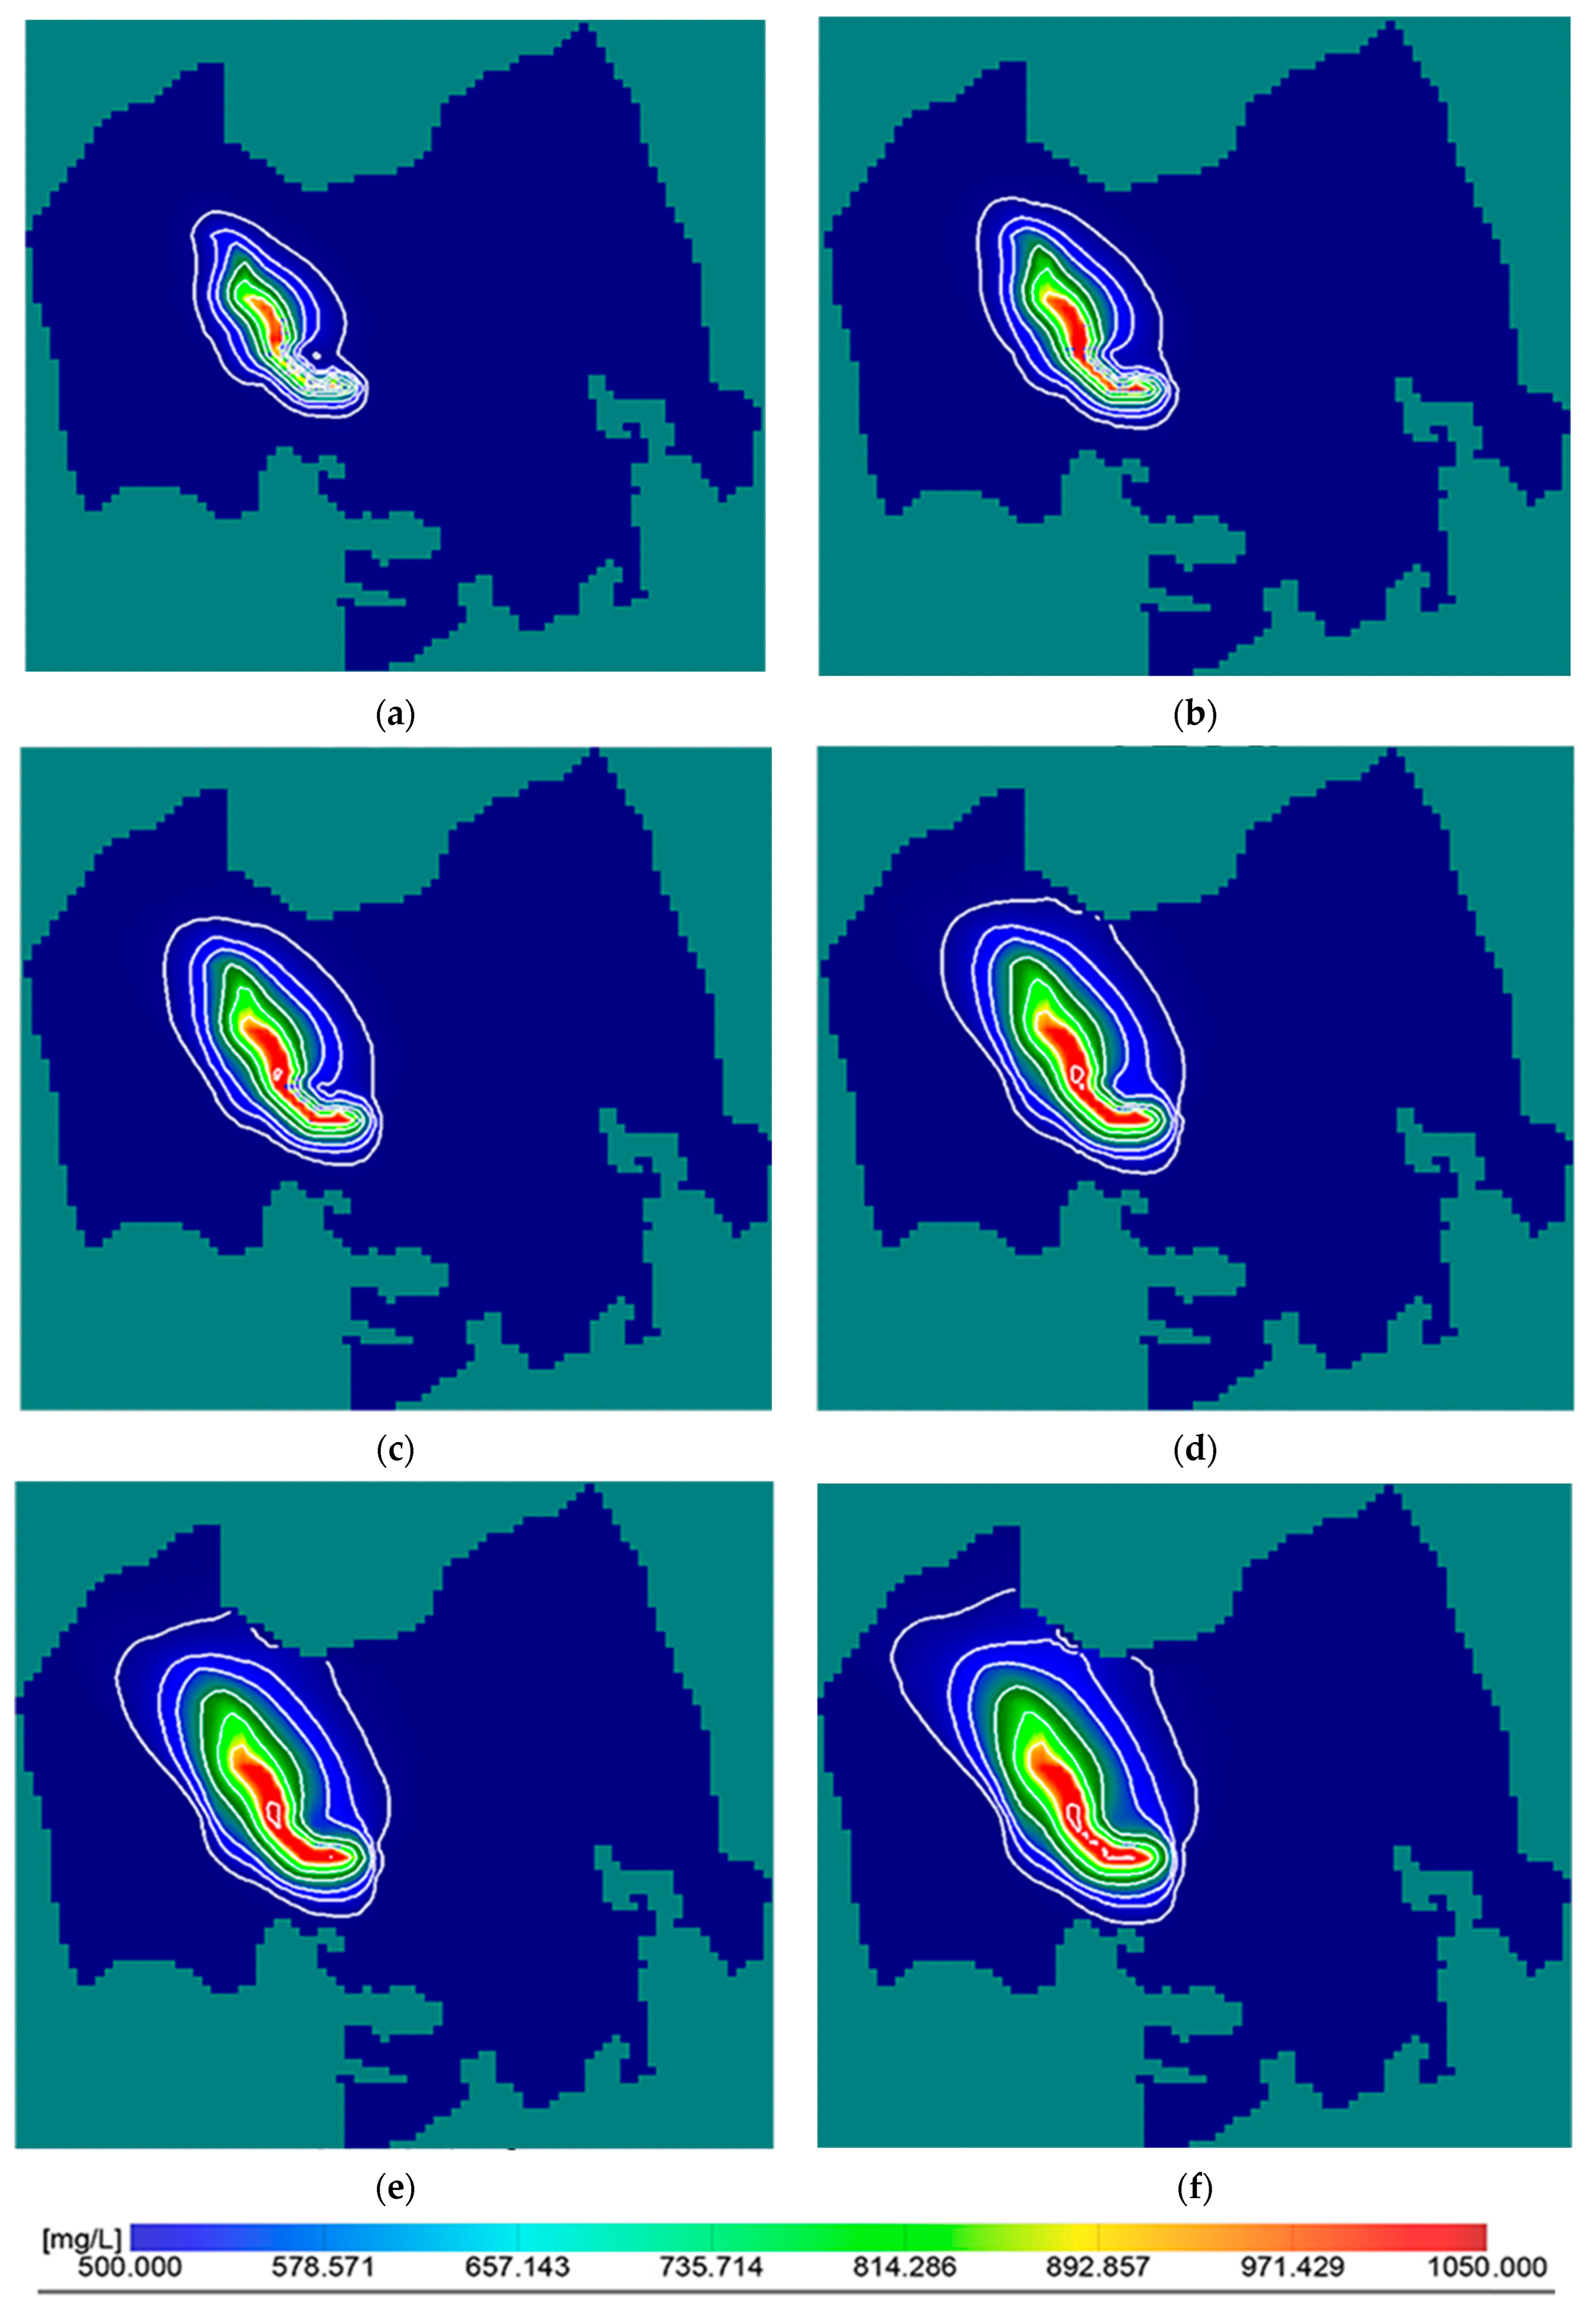
- The recharge strategy without concurrent pumping resulted in TDS water quality risks for the six major water sources downstream. Simulation results revealed an expanding TDS concentration field with the ongoing operation of the recharge project, culminating in an overall increase in the TDS concentration near the water source. By the conclusion of the 10-year simulation period, the area influenced by TDS near the water source encompassed 289.3 km2, while the region where water quality is compromised (TDS > 1000 mg/L) spanned 20.25 km2.
- Water recovery initiatives, apart from ensuring a stable water supply, offer the added advantage of reducing or potentially eliminating the water quality risks associated with recharge. Comparative assessments revealed that under a 90% recovery ratio, the highest efficiency in TDS reduction and the maximum volume of extracted water were attained. Simultaneously, water tables remain stable or even increase slightly, effectively catering to the imperatives of economic and ecological benefits.
Author Contributions
Funding
Data Availability Statement
Conflicts of Interest
References
- Dillon, P.; Page, D.; Pavelic, P.; Toze, S.; Vanderzalm, J.; Levett, K.; Stevens, D. Australian Guidelines for Water Recycling: Managing Health and Environmental Risks (Phase 2)—Managed Aquifer Recharge; Natural Resource Management Ministerial Council: Canberra, Australia; Environment Protection and Heritage Council: Adelaide, Australia; National Health and Medical Research Council: Canberra, Australia, 2009. [Google Scholar]
- Hannappel, S.; Scheibler, F.; Huber, A.; Sprenger, C. Characterization of European Managed Aquifer Recharge (MAR) Sites—Analysis; DEMEAU Research Project: Dübendorf, Switzerland, 2014. [Google Scholar]
- Dillon, P. Future management of aquifer recharge. Hydrogeol. J. 2005, 13, 313–316. [Google Scholar] [CrossRef]
- Massmann, G.; Greskowiak, J.; Dünnbier, U.; Zuehlke, S.; Knappe, A.; Pekdeger, A. The impact of variable temperatures on the redox conditions and the behaviour of pharmaceutical residues during artificial recharge. J. Hydrol. 2006, 328, 141–156. [Google Scholar] [CrossRef]
- Dillon, P.; Pavelic, P.; Page, D.; Beringen, H.; Ward, J. Managed Aquifer Recharge: An Introduction; Waterlines Report Series No. 13; National Water Commisssion: Canberra, Australia, 2009. [Google Scholar]
- Pyne, R.D.G. Aquifer Storage Recovery: A Guide to Groundwater Recharge through Wells, 2nd ed.; Index to Appendices on CD (March 2006); ASR Systems: Gainesville, FL, USA, 2006. [Google Scholar]
- Bouwer, H. Artificial recharge of groundwater: Hydrogeology and engineering. Hydrogeol. J. 2002, 10, 121–142. [Google Scholar] [CrossRef]
- Stuyfzand, P.J.; Juhàsz-Holterman, M.H.A.; Lange, W.J.D. Riverbank Filtration in the Netherlands: Well Fields, Clogging and Geochemical Reactions; Springer: Dordrecht, The Netherlands, 2006. [Google Scholar]
- Page, D.; Dillon, P.; Vanderzalm, J.; Bekele, E.; Barry, K.; Miotlinski, K.; Levett, K. Managed Aquifer Recharge Case Study Risk Assessments; CSIRO: Canberra, Australia, 2011. [Google Scholar]
- Alqahtani, A.; Sale, T.; Ronayne, M.J.; Hemenway, C. Demonstration of Sustainable Development of Groundwater through Aquifer Storage and Recovery (ASR). Water Resour. Manag. 2021, 35, 429–445. [Google Scholar] [CrossRef]
- Jha, M.K.; Kamii, Y.; Chikamori, K. Cost-effective approaches for sustainable groundwater management in alluvial aquifer systems. Water Resour. Manag. 2009, 23, 219–233. [Google Scholar] [CrossRef]
- Zheng, Y.; Ross, A.; Villholth, K.G.; Dillon, P. Managing Aquifer Recharge: A Showcase for Resilience and Sustainability; UNESCO: Paris, France, 2021; Volume 10. [Google Scholar]
- Dillon, P.; Stuyfzand, P.; Grischek, T.; Lluria, M.; Pyne, R.; Jain, R.; Bear, J.; Schwarz, J.; Wang, W.; Fernandez, E. Sixty years of global progress in managed aquifer recharge. Hydrogeol. J. 2019, 27, 1–30. [Google Scholar] [CrossRef]
- Wang, W.; Zhou, Y.; Sun, X.; Wang, W. Development of managed aquifer recharge in China. Bol. Geol. Min. 2014, 125, 227–233. [Google Scholar]
- Olsthoorn, T.; Mosch, M. Fifty years artificial recharge in the Amsterdam dune area. In Management of Aquifer Recharge for Sustainability; CRC Press: Boca Raton, FL, USA, 2020; pp. 29–33. [Google Scholar]
- Dillon, P. Water recycling via managed aquifer recharge in Australia. Bol. Geol. Min. 2009, 120, 121–130. [Google Scholar]
- De los Cobos, G. The aquifer recharge system of Geneva, Switzerland: A 20 year successful experience. In Management of Aquifer Recharge for Sustainability; CRC Press: Boca Raton, FL, USA, 2020; pp. 49–52. [Google Scholar]
- Pyne, R.D.G. Groundwater Recharge and Wells: A Guide to Aquifer Storage Recovery; CRC Press: Boca Raton, FL, USA, 1995. [Google Scholar]
- Winter, T.C. Recent advances in understanding the interaction of groundwater and surface water. Rev. Geophys. 1995, 33, 985–994. [Google Scholar] [CrossRef]
- Vandenbohede, A.; Houtte, E.V.; Lebbe, L. Groundwater flow in the vicinity of two artificial recharge ponds in the Belgian coastal dunes. Hydrogeol. J. 2008, 16, 1669–1681. [Google Scholar] [CrossRef]
- Roy, S.; Sahu, A.S. Effectiveness of basin morphometry, remote sensing, and applied geosciences on groundwater recharge potential mapping: A comparative study within a small watershed. Front. Earth Sci. 2016, 10, 274–291. [Google Scholar] [CrossRef]
- Ringleb, J.; Sallwey, J.; Stefan, C. Assessment of managed aquifer recharge through modeling—A review. Water 2016, 8, 579. [Google Scholar] [CrossRef]
- Jonoski, A.; Zhou, Y.; Nonner, J.; Meijer, S. Model-aided design and optimization of artificial recharge-pumping systems. Int. Assoc. Sci. Hydrol. Bull. 1997, 42, 937–953. [Google Scholar] [CrossRef]
- Chenini, I.; Mammou, A.B. Groundwater recharge study in arid region: An approach using GIS techniques and numerical modeling. Comput. Geosci. 2010, 36, 801–817. [Google Scholar] [CrossRef]
- Hashemi, H.; Berndtsson, R.; Persson, M. Artificial recharge by floodwater spreading estimated by water balances and groundwater modelling in arid Iran. Hydrol. Sci. J. 2015, 60, 336–350. [Google Scholar] [CrossRef]
- Pokhrel, P.; Zhou, Y.; Smits, F.; Kamps, P.; Olsthoorn, T. Numerical simulation of a managed aquifer recharge system designed to supply drinking water to the city of Amsterdam, The Netherlands. Hydrogeol. J. 2023, 31, 1291–1309. [Google Scholar] [CrossRef]
- Kloppmann, W.; Aharoni, A.; Chikurel, H.; Dillon, P.; Gaus, I.; Guttman, J.; Kraitzer, T.; Kremer, S.; Masciopinto, C.; Miotlinski, K. Use of groundwater models for prediction and optimisation of the behaviour of MAR sites. In Water Reclamation Technologies for Safe Managed Aquifer Recharge; IWA Publishing: London, UK, 2012; pp. 311–349. [Google Scholar]
- Valley, S.; Landini, F.; Pranzini, G.; Puppini, U.; Scardazzi, M.; Streetly, M. Transient flow modelling of an overexploited aquifer and simulation of artificial recharge measures. In Recharge Systems for Protecting and Enhancing Groundwater Resources, Proceedings of the 5th International Symposium on Management of Aquifer Recharge, ISMAR5; Berlin, Germany; 11–16 June 2005, United Nations Educational, Scientific and Cultural Organization: Paris, France, 2004; pp. 11–16. [Google Scholar]
- Xu, H.Z.; Duan, X.M.; Gao, Z.D.; Wang, Q.B.; Li, W.P.; Yin, X.L. Hydrochemical study of karst groundwater in the Jinan Spring catchment. Hydrogeol. Eng. Geol. 2007, 34, 5. [Google Scholar]
- Noori, R.; Maghrebi, M.; Jessen, S.; Bateni, S.M.; Heggy, E.; Javadi, S.; Noury, M.; Pistre, S.; Abolfathi, S.; AghaKouchak, A. Decline in Iran’s groundwater recharge. Nat. Commun. 2023, 14, 6674. [Google Scholar] [CrossRef]
- Zhang, Z.; Wang, W.; Xiang, H.; Gai, Y.; Li, F. Relationship between Groundwater in Western Jinan and Jinan Spring Area Based on CorrelationDegree of Water Table Fluctuation. J. Chin. Hydrol. 2018, 38, 7. [Google Scholar]
- Li, W.; Sun, Q.; Wang, W.; Qu, S.; Zhang, Z.; Xu, Q. Effective water quantity of multi-source water recharging aquifers in Yufuhe River based on groundwater and surface water semi-coupled modelling. Water Supply 2019, 19, 2280–2287. [Google Scholar] [CrossRef]
- Zhang, Z.; Wang, W. Managing aquifer recharge with multi-source water to realize sustainable management of groundwater resources in Jinan, China. Environ. Sci. Pollut. Res. 2021, 28, 10872–10888. [Google Scholar] [CrossRef] [PubMed]
- Noori, R.; Dodangeh, M.; Baghvand, A.; Hooshyaripor, F.; Klve, B. PODMT3DMS-Tool: Proper orthogonal decomposition linked to the MT3DMS model for nitrate simulation in aquifers. Hydrogeol. J. 2020, 28, 1125–1142. [Google Scholar] [CrossRef]
- Xing, L.-T.; Zhang, J.-Z.; Zhou, R.; Liu, L. The Groundwater Environment Capacity in Jinan Springs Basin. China Rural. Water Hydropower 2008, 10, 4. [Google Scholar]
- Xu, J.-X.; Xin, L.-T. Numerical Prediction for the Karst Groundwater and Spring Protection in Jinan Karst Spring Region. Geol. Surv. Res. 2008, 31, 5. [Google Scholar]
- Guo, Y.; Qin, D.; Li, L.; Sun, J.; Huang, J. A Complicated Karst Spring System: Identified by Karst Springs Using Water Level, Hydrogeochemical, and Isotopic Data in Jinan, China. Water 2019, 11, 947. [Google Scholar] [CrossRef]
- Guo, Y.; Qin, D.; Sun, J.; Li, L.; Huang, J. Recharge of River Water to Karst Aquifer Determined by Hydrogeochemistry and Stable Isotopes. Water 2019, 11, 479. [Google Scholar] [CrossRef]


| No. | Kh (m/d) | Kv (m/d) | Specific Yield |
|---|---|---|---|
| 1 | 21 | 2.1 | 0.13 |
| 2 | 3 | 0.3 | 0.15 |
| 3 | 18 | 0.6 | 0.03 |
| 4 | 9.3 | 0.31 | 0.12 |
| 5 | 14.6 | 0.49 | 0.03 |
| 6 | 15 | 0.5 | 0.15 |
| 7 | 16.5 | 0.55 | 0.02 |
| 8 | 12.6 | 0.42 | 0.03 |
| 9 | 8 | 0.08 | 0.11 |
| 10 | 13.4 | 0.45 | 0.18 |
| 11 | 15 | 0.5 | 0.03 |
| 12 | 12.6 | 0.42 | 0.13 |
| 13 | 10.5 | 0.35 | 0.04 |
| 14 | 15 | 0.5 | 0.04 |
| No. | Kh (m/d) | Kv (m/d) |
|---|---|---|
| 1 | 1.0 × 10⁻⁴ | 1.0 × 10⁻⁴ |
| 2 | 1.0 × 10⁻³ | 1.0 × 10⁻³ |
| 3 | 1.0 × 10⁻³ | 1.0 × 10⁻³ |
| 4 | 1.0 × 10⁻³ | 1.0 × 10⁻³ |
| 5 | 1.0 × 10⁻⁵ | 1.0 × 10⁻⁵ |
| No. | Kh (m/d) | Kv (m/d) | Storage Coefficient |
|---|---|---|---|
| 1 | 6 | 0.6 | 2.20 × 10⁻⁵ |
| 2 | 1 | 0.1 | 2.00 × 10⁻⁴ |
| 3 | 30 | 3 | 1.00 × 10⁻⁶ |
| 4 | 100 | 10 | 5.00 × 10⁻⁶ |
| 5 | 50 | 5 | 2.00 × 10⁻⁶ |
| 6 | 80 | 8 | 2.00 × 10⁻⁵ |
| 7 | 80 | 8 | 7.00 × 10⁻⁵ |
| 8 | 10 | 1 | 1.30 × 10⁻⁵ |
| 9 | 65 | 6.5 | 5.00 × 10⁻⁵ |
| 10 | 65 | 6.5 | 5.20 × 10⁻⁵ |
| 11 | 50 | 5 | 7.00 × 10⁻⁶ |
| 12 | 60 | 6 | 8.50 × 10⁻⁵ |
| 13 | 5 | 0.5 | 6.30 × 10⁻¹ |
| 14 | 0.8 | 0.08 | 3.80 × 10⁻⁵ |
| 15 | 20 | 2 | 2.00 × 10⁻⁶ |
| 16 | 15 | 1.5 | 1.50 × 10⁻⁴ |
| 17 | 120 | 12 | 8.00 × 10⁻⁶ |
| 18 | 120 | 12 | 1.00 × 10⁻⁵ |
| 19 | 30 | 3 | 5.20 × 10⁻⁵ |
| 20 | 120 | 12 | 4.30 × 10⁻⁵ |
| 21 | 50 | 5 | 2.00 × 10⁻⁵ |
| 22 | 2 | 0.2 | 3.00 × 10⁻⁵ |
| 23 | 1 | 0.1 | 8.00 × 10⁻⁶ |
| 24 | 0.3 | 0.03 | 7.50 × 10⁻⁵ |
| 25 | 1 | 0.1 | 5.50 × 10⁻⁵ |
| 26 | 1 | 0.1 | 5.50 × 10⁻⁵ |
| 27 | 4 | 0.4 | 3.00 × 10⁻⁵ |
| 28 | 0.15 | 0.015 | 7.50 × 10⁻⁵ |
| 29 | 0.05 | 0.005 | 7.00 × 10⁻⁵ |
| 30 | 0.5 | 0.05 | 1.50 × 10⁻⁴ |
| 31 | 1.5 | 0.15 | 1.50 × 10⁻⁵ |
| 32 | 0.5 | 0.05 | 5.30 × 10⁻⁵ |
| 33 | 0.25 | 0.025 | 1.00 × 10⁻⁴ |
| 34 | 0.2 | 0.02 | 7.00 × 10⁻⁵ |
| 35 | 0.1 | 0.01 | 3.00 × 10⁻⁴ |
| 36 | 0.3 | 0.03 | 1.70 × 10⁻⁴ |
| 37 | 0.3 | 0.03 | 1.50 × 10⁻⁴ |
| 38 | 0.3 | 0.03 | 2.00 × 10⁻⁴ |
| Year | 2017 | 2018 | 2019 |
|---|---|---|---|
| Total recharge volume (×103 m3) | 210 | 21 | 1.3 |
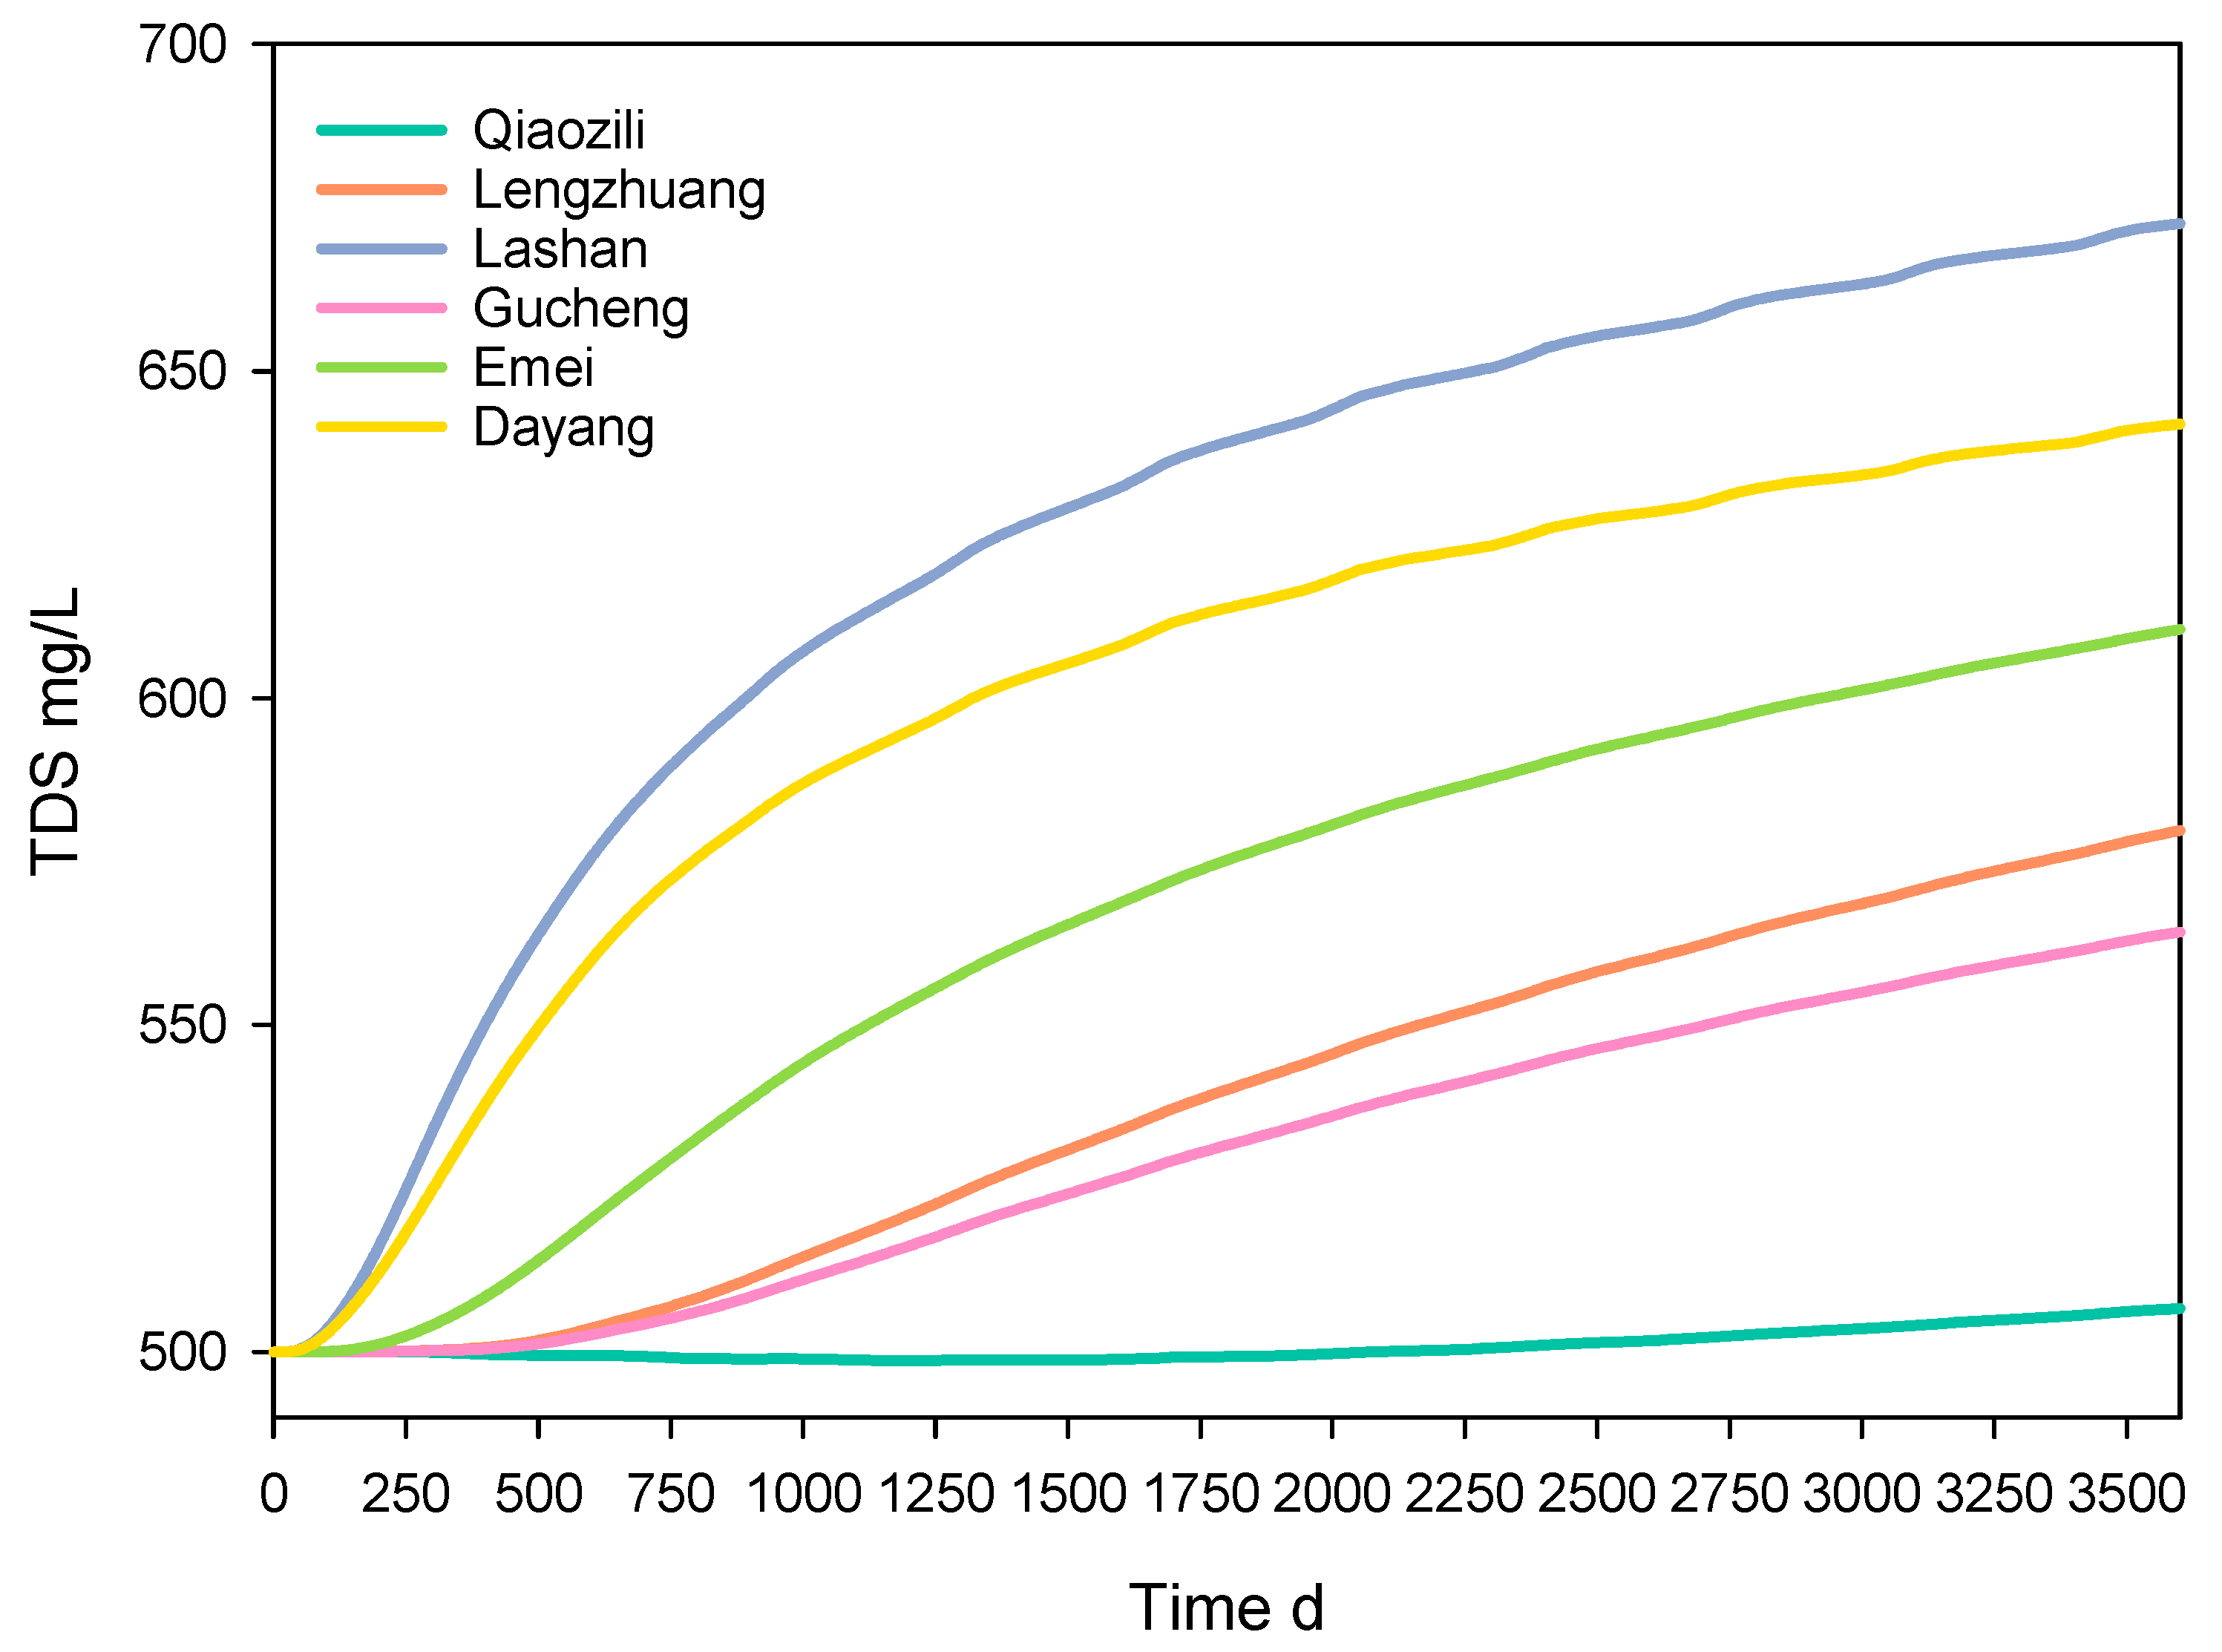
| Name | Qiaozili | Lengzhuang | Gucheng | Emei | Dayang | Lashan |
|---|---|---|---|---|---|---|
| Water supply capacity (×103 m3) | 100 | 38 | 98 | 93 | 93 | 38 |
| Limited pumping volume (×103 m3) | 190 | 60 | 20 | 5 | ||
| Name | 50% (×103 m3) | 75% (×103 m3) | 90% (×103 m3) |
|---|---|---|---|
| Qiaozili | 2.9 | 4.3 | 5.2 |
| Lengzhuang | 4.3 | 6.5 | 7.8 |
| Gucheng | 7.2 | 10.8 | 13.0 |
| Emei | 4.3 | 6.5 | 7.8 |
| Dayang | 1.4 | 2.2 | 2.6 |
| Lashan | 0.4 | 0.5 | 0.7 |
| Total | 20.6 | 30.9 | 37.1 |
| Name | Qiaozili | Lengzhuang | Gucheng | Emei | Dayang | Lashan | Total |
|---|---|---|---|---|---|---|---|
| Initial concentration | 500.00 | 500.00 | 500.00 | 500.00 | 500.00 | 500.00 | 500.00 |
| 0% | 506.61 | 579.70 | 564.19 | 610.50 | 641.94 | 672.60 | 595.92 |
| ΔC0% | 6.61 | 79.70 | 64.19 | 110.50 | 141.94 | 172.60 | 95.92 |
| 50% | 504.01 | 554.11 | 544.40 | 581.62 | 592.24 | 638.62 | 569.17 |
| ΔC50% | 4.01 | 54.11 | 44.40 | 81.62 | 92.24 | 138.62 | 69.17 |
| (ΔC0% − ΔC50%)/ΔC0% | 39.33% | 32.11% | 30.83% | 26.14% | 35.01% | 19.69% | 27.89% |
| 75% | 503.58 | 541.57 | 533.72 | 552.65 | 564.93 | 609.55 | 551.00 |
| ΔC75% | 3.58 | 41.57 | 33.72 | 52.65 | 64.93 | 109.55 | 51.00 |
| (ΔC0% − ΔC75%)/ΔC0% | 45.84% | 47.84% | 47.47% | 52.35% | 54.26% | 36.53% | 46.83% |
| 90% | 503.05 | 520.68 | 512.21 | 534.25 | 553.66 | 582.77 | 534.44 |
| ΔC90% | 3.05 | 20.68 | 12.21 | 34.25 | 53.66 | 82.77 | 34.44 |
| (ΔC0% − ΔC90%)/ΔC0% | 53.86% | 74.05% | 80.98% | 69.00% | 62.20% | 52.05% | 64.10% |
| Name | Initial | 0% | ΔH0% | 50% | ΔH50% | 75% | ΔH75% | 90% | ΔH90% |
|---|---|---|---|---|---|---|---|---|---|
| Qiaozili | 33.12 | 37.90 | 4.79 | 36.47 | 3.35 | 35.76 | 2.64 | 35.44 | 2.32 |
| Lengzhuang | 33.16 | 37.77 | 4.61 | 35.97 | 2.81 | 35.08 | 1.92 | 34.65 | 1.49 |
| Gucheng | 32.66 | 37.08 | 4.43 | 35.01 | 2.35 | 33.98 | 1.32 | 33.46 | 0.80 |
| Emei | 35.51 | 39.85 | 4.34 | 37.49 | 1.98 | 36.31 | 0.80 | 35.74 | 0.23 |
| Dayang | 37.45 | 41.10 | 3.65 | 39.44 | 1.98 | 38.61 | 1.16 | 38.26 | 0.81 |
| Lashan | 38.22 | 41.46 | 3.24 | 39.94 | 1.72 | 39.18 | 0.96 | 38.88 | 0.66 |
| Average | 35.02 | 39.19 | 4.17 | 37.39 | 2.37 | 36.49 | 1.47 | 36.07 | 1.05 |
Disclaimer/Publisher’s Note: The statements, opinions and data contained in all publications are solely those of the individual author(s) and contributor(s) and not of MDPI and/or the editor(s). MDPI and/or the editor(s) disclaim responsibility for any injury to people or property resulting from any ideas, methods, instructions or products referred to in the content. |
© 2023 by the authors. Licensee MDPI, Basel, Switzerland. This article is an open access article distributed under the terms and conditions of the Creative Commons Attribution (CC BY) license (https://creativecommons.org/licenses/by/4.0/).
Share and Cite
Li, J.; Wang, W.; Li, W. Total Dissolved Solids Risk Assessment and Optimisation Scheme of Managed Aquifer Recharge Projects in a Karst Area of Northern China. Water 2023, 15, 3930. https://doi.org/10.3390/w15223930
Li J, Wang W, Li W. Total Dissolved Solids Risk Assessment and Optimisation Scheme of Managed Aquifer Recharge Projects in a Karst Area of Northern China. Water. 2023; 15(22):3930. https://doi.org/10.3390/w15223930
Chicago/Turabian StyleLi, Jinchao, Weiping Wang, and Wenliang Li. 2023. "Total Dissolved Solids Risk Assessment and Optimisation Scheme of Managed Aquifer Recharge Projects in a Karst Area of Northern China" Water 15, no. 22: 3930. https://doi.org/10.3390/w15223930