Article

Prediction Model of Residual Soil Shear Strength under Dry–Wet Cycles and Its Uncertainty

1
Department of Dam Safety and Management, Nanjing Hydraulic Research Institute, No. 223 Guangzhou Road, Nanjing 210098, China
2
College of Civil and Transportation Engineering, Hohai University, No. 1 Xikang Road, Nanjing 210098, China
3
College of Transportation Engineering, Nanjing Tech University, No. 30 Puzhu South Road, Nanjing 211816, China
*
Authors to whom correspondence should be addressed.
Water 2023, 15(22), 3931; https://doi.org/10.3390/w15223931
Submission received: 28 August 2023 / Revised: 30 October 2023 / Accepted: 8 November 2023 / Published: 10 November 2023
(This article belongs to the Special Issue Safety Evaluation of Dam and Geotechnical Engineering, Volume II)

Abstract

:
Granite residual soil is widely distributed in Southeast Fujian. Large-scale engineering construction leads to the exposure of residual soil slopes to the natural environment. Affected by seasonal climate factors, the soil of slopes experiences a dry–wet cycle for a long time. The repeated changes in water content seriously affect the shear strength of soil, and then affect the stability of the slope. In order to explore the influence of the dry–wet cycle on the shear strength of granite residual soil in Fujian, an indoor dry–wet cycle simulation test was carried out for shallow granite residual soil on a slope in Fuzhou, and the relationship between water content, dry–wet cycle times, and the shear strength index, including the cohesion and internal friction angle of the granite residual soil, was discussed. The results show that when the number of dry–wet cycles is constant, the cohesion and internal friction angle of the granite residual soil decrease with an increase in water content. The relationship between the cohesion, internal friction angle, and water content can be described using a power function. Meanwhile, the fitting parameters of the power function are also a function of the number of wet and dry cycles. The prediction formulas of the cohesion and internal friction angle considering the number of dry–wet cycles and water content are established, and then the prediction formula of shear strength is obtained. The ratio of the predicted value of shear strength to the test value shall be within ±15%. An error transfer analysis based on the point estimation method shows that the overall uncertainty of the predicted value of shear strength caused by the combined uncertainty of the predicted value of cohesion and the internal friction angle and the single-variable uncertainty of the predicted value of shear strength caused only by the uncertainty of the predicted value of either the cohesion or internal friction angle increases first and then decreases with an increase in the number of dry–wet cycles. All increase with an increasing water content. The maximum standard deviation of the proposed shear strength prediction model of granite residual soil is less than 9%.

1. Introduction

China is one of the countries most severely affected by landslide disasters in the world. Studying the mechanism of slope instability is of great significance. The factors affecting the stability of slopes can be mainly divided into two categories [1,2]. The first category is the strength of the rock and soil body inside the slope itself, which is also a direct factor affecting the stability of the slope. Liu’s research in coarse-grained models also shows that the curing rate of internal particles has a significant impact on the structure [3,4]. The second category is external factors such as rainfall, human activities, earthquakes, etc., which cause slope instability. The two factors are coupled with each other. Slopes with low strength of the internal rock–soil mass are more prone to instability under the action of rainfall, human activities, and earthquakes. The number and range of slope instabilities caused by rainfall, especially heavy rain, are greater and wider than those affected by human activities and earthquakes [5]. The landscape of the Fujian province is characterized by more mountains and fewer plains. In many engineering constructions, a large amount of rock–soil mass needs to be excavated, forming a large number and wide distribution of high and steep slopes [6]. Granite residual soil slopes in the Fujian region are numerous and the soil layer is thick. Residual soil has strong structural characteristics such as anisotropy and heterogeneity, being easy to collapse when soaked in water and easy to soften [7]. The granite residual soil slopes widely distributed in the Fujian region, on the one hand, are triggered into instability and lead to landslide disasters under the influence of rainfall. On the other hand, due to the long-term wet–dry cycle caused by rainfall and subsequent drying, the shear strength τ of the rock–soil mass of the slopes inevitably weakens [8]. The rock–soil mass inside the slope is subjected to a long-term cycle of wetting and drying. The rock–soil mass within the slope is in a long-term state of dry–wet cycling, causing the rock–soil mass itself to continuously contract and expand. This leads to the formation of cracks and channels for rainwater infiltration within the slope’s rock–soil mass. This process elevates the groundwater level, further resulting in a decrease in the shear strength of the rock–soil mass, thereby increasing the risk of slope instability and failure.
The water content W of soil is an important indicator affecting the shear strength τ. The water content W will change during the dry–wet cycle process [9]. The number of dry–wet cycles N will also have a significant impact on the shear strength of the soil. Therefore, conducting experimental research on the deterioration of soil’s shear strength under different dry–wet cycle times for residual soil with varying water contents is crucial [10,11]. It is a vital step toward ensuring the safety and stability of slopes, especially in regions prone to heavy rainfall and seismic activities.
At present, significant progress has been made in studying the influence of dry–wet cycles on the shear strength τ of slope soil [12,13,14,15,16,17,18,19]. These studies have established predictive models between soil shear strength τ, water content W, and dry–wet cycle times N. However, these models typically establish empirical relationships between the water content W and dry–wet cycles N and soil shear strength separately. The empirical formulas established do not simultaneously consider the combined influence of water content W and dry–wet cycles N on shear strength [12,13,14,15,16,17,18,19]. The related articles mainly focus on research on soils such as silty clay and expansive soil [13,14,15,16,17,18,19]. However, there is less research on the degradation of the shear strength τ of granite residual soil, such as that in Fujian, under the action of dry–wet cycles.
Some researchers [20,21] have conducted scanning electron microscopy experiments to explore the microstructural impacts of various soils subjected to dry–wet cycling conditions. Granite residual soil exhibits significant heterogeneity, reflected in the high variability of various physical and mechanical indicators of the soil body [22,23]. Chen Hongjiang and Cui Guanying [24] tested and statistically analyzed various physical and mechanical indicators of granite residual soil in the Guangdong and Fujian provinces. The results showed that the water content W, internal friction angle φ, and cohesion c of granite residual soil have significant variability. As the water content of the rock mass increases, the weight of the rock mass increases, the matric suction decreases, and the infiltration depth of the rock slope increases. This can cause the safety factor of the slope to decrease [25,26]. Wet–dry cycles can cause the expansion and connection of cracks within the rock mass, thereby reducing the shear strength and elastic modulus of the rock mass [27,28,29]. Similarly, some researchers [30,31,32] found that the initial dry–wet cycles had the most significant impact on the strength of unsaturated sands and compacted clays. The cohesion c of the soil is formed via the chemical bonding between soil particles. After rainfall, the soil gradually enters a dry state, and the water content W gradually decreases. As the water content W decreases, the volume of the soil shrinks, cracks appear inside the soil, and the strength of the structural soil will be destroyed due to the presence of cracks. Under new rainfall, the cracks inside the soil will become channels for rainwater infiltration, causing the bonding material between soil particles to dissolve and be lost due to rainwater erosion, further destroying the structure of the soil and producing more gaps inside the soil as water flow channels. This ultimately leads to a decrease in the soil cohesion c and shear strength τ. The above process is a mutually reinforcing process. The strength of the soil on natural slopes will gradually accumulate with long-term dry–wet cycles over decades. Although some studies have established prediction formulas for shear strength τ with W and N as variables, they have not given the uncertainty law of the prediction formula with changes in W and N. The prediction formulas for cohesion c and internal friction angle φ with W and N as variables both have uncertainties, which will be transmitted to the shear strength τ. Studying the uncertainty of the prediction formula for shear strength under dry–wet cycle conditions can help to deepen our understanding of the advantages and disadvantages of prediction formulas for shear strength with W and N as variables.
The point estimation method is indeed an effective approach for analyzing error propagation [33,34]. Zhu [35,36] uses neural network learning methods to eliminate the errors generated by nonlinear regression. In this study, samples were taken from a granite residual soil slope in Fuzhou city, and indoor simulated dry–wet cycle tests were conducted. The initial water content of the soil was artificially controlled during the test. A relationship was established between the number of dry–wet cycles N, the initial water content W, and the cohesion c and internal friction angle φ of the granite residual soil. A prediction model for the soil shear strength τ considering the influence of N and W was obtained. Using the point estimation method, the uncertainty of the prediction formula for shear strength τ with N and W as variables was analyzed. This analysis aims to provide guidance for a deeper understanding of the deterioration law of the shear strength indicators of granite residual soil in the Fujian province under dry–wet cycle conditions and the uncertainty of shear strength prediction models. This is a significant contribution to the field and will undoubtedly aid in future research and practical applications.

2. Materials and Methods

The ring knife method is typically used to measure the bulk density and other physical properties of soil. The specific procedure involves inserting a ring knife into the ground to obtain a soil core, which is then placed into a sterile plastic bag and sealed for lab drying. The weight of the dried soil is then measured [37,38]. Therefore, we used the ring knife method to sample the shallow soil of a slope in Fuzhou. The physical and mechanical indicators of the soil were measured using indoor geotechnical tests. The initial water content of the test soil samples was artificially controlled to different values. The soil samples were subjected to indoor simulated dry–wet cycle tests. Finally, the shear strength indicators of the soil samples after different dry–wet cycle times were tested using direct shear tests, and the mathematical relationship between soil shear strength indicators, water content W, and dry–wet cycles N was obtained.

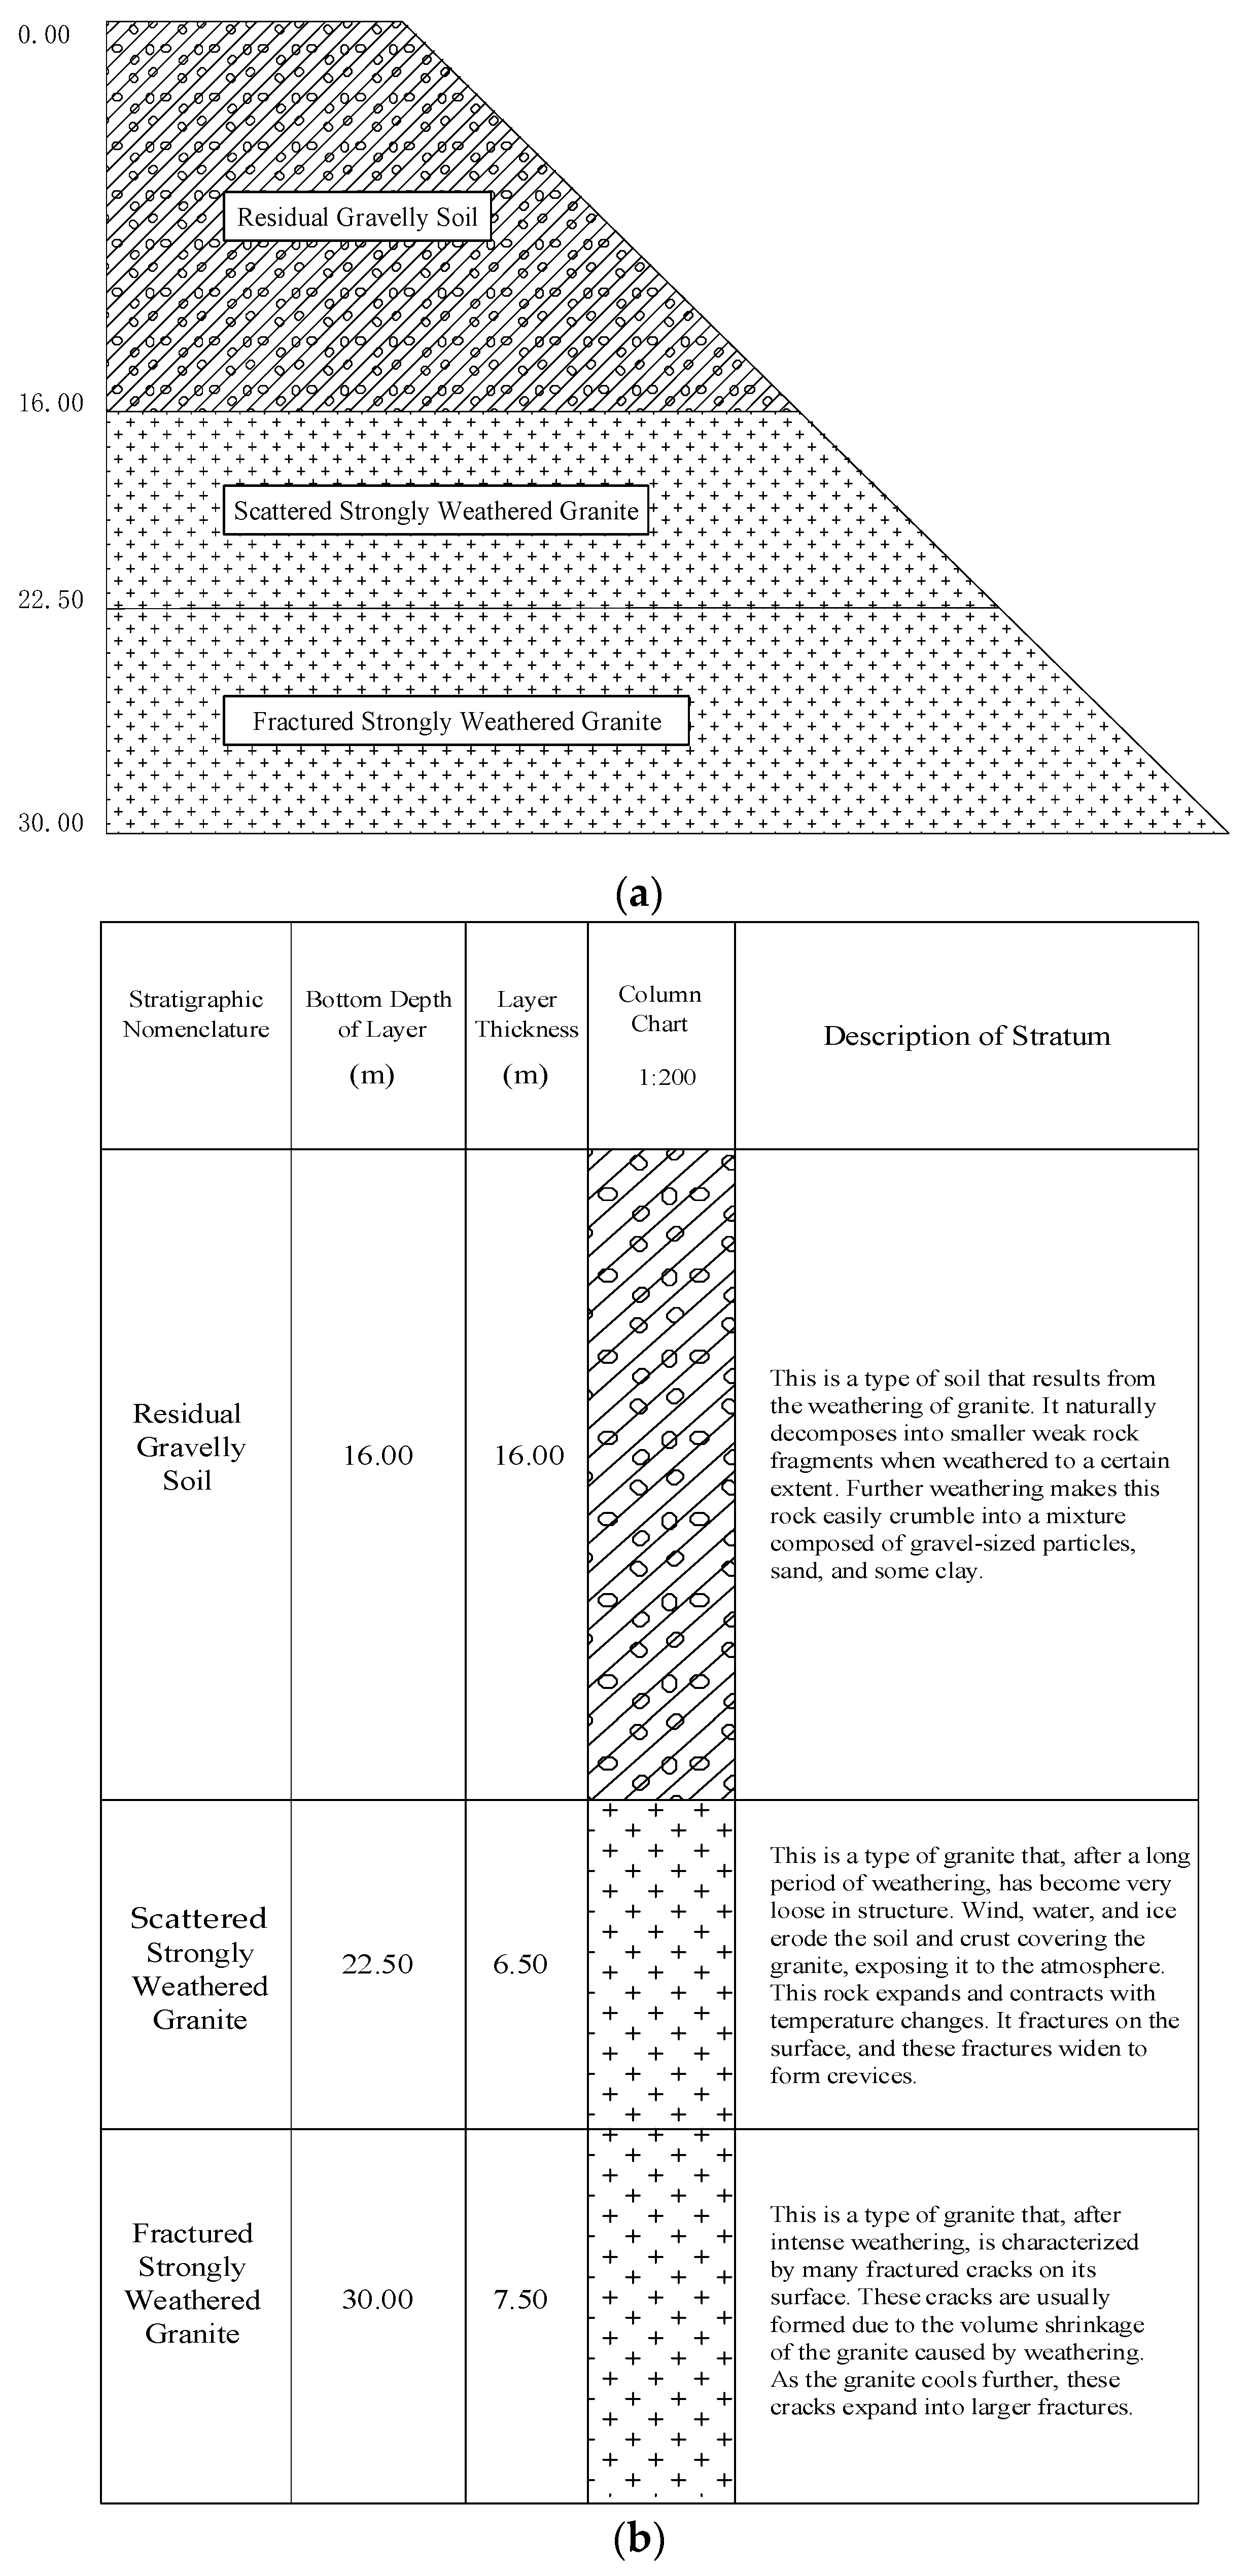
2.1. Overview of Soil Samples

As depicted in Figure 1, the grain distribution curve of granite residual soils reveals a significant fabric characteristic: both fine and coarse particles constitute a high proportion of it, while intermediate-size particles are less prevalent. This means that the grain distribution is mainly in particles above 0.5 mm and below 0.074 mm, and the total amounts of coarse and fine particle groups are relatively similar. However, in the coarse particle group, the content of medium and fine sand and silt is less. This is the most distinctive feature of granite residual soils. This indicates that granite residual soil is mainly composed of coarse particles (gravel, coarse sand, and some medium sand) that form the soil skeleton. The connection between coarse particles is primarily achieved via the encapsulation and filling of free oxides, with some residual connections between the grains of the original rock minerals. However, due to the low content of medium and fine sand and silt filling the coarse grain skeleton, the pores are relatively large, resulting in strong permeability.
Using X-ray diffraction (XRD) analysis, An et al. [39] found that granite residual soil is mainly composed of non-clay minerals (such as quartz and hematite) and clay minerals (such as kaolinite and illite). Due to the incomplete weathering of the parent rock, granite residual soil contains a large amount of coarse grains dominated by quartz. Owing to the cyclical nature of seasonal climate changes, the microstructural characteristics of granite residual soil are susceptible to periodic water infiltration and evaporation. This dynamic process paves the way for water and ionic species to penetrate the soil particles, thereby inducing alterations in its permeability [40,41]. Therefore, due to the effects of multiple dry–wet cycles, the mechanical properties and stability of granite residual soil will gradually decrease, while its permeability will slowly increase [42,43].
Fujian belongs to a subtropical marine monsoon climate with abundant rainfall and sufficient sunshine. The average annual rainfall is 1400–2000 mm, which is one of the provinces with the richest rainfall in China. Equally, 70% of the area in the province has an average annual accumulated temperature above 10 °C. Therefore, the soil samples used in this paper were taken from the slope behind the animation building of Fuzhou Software Park Industrial Base Development Co., Ltd. (Fuzhou City, Fujian Province, China). As shown in Figure 2, the slope is a soil slope, and the upper layer (shallow layer) of the slope is mainly artificial backfill soil and residual soil (the depth is about 0.8 m).
Figure 1. Grain size distribution curve of granite residual soil. The classification of soil refers to the “Standard for Engineering Classification of Soil” [44].
Water 15 03931 g001
According to the “Standard for Geotechnical Tests” (GB/T50123-2019) [38], indoor geotechnical tests were carried out on the soil samples. Because the gravel particle content no less than 2 mm in the soil is greater than 20%, according to Wu Nengsen’s [45] classification method for granite residual soil, the name of the soil body is determined as residual gravelly soil. The basic physical properties of the soil samples are shown in Table 1.

2.2. Experimental Plan

This experiment mainly includes on-site sampling, indoor geotechnical tests, indoor simulated dry–wet cycle tests, and direct shear tests. The ring knife method was used for on-site sampling. Because this study mainly focuses on the shallow soil of the slope, the soil sampling depth was controlled at 0.8 m. The results of the indoor geotechnical tests are shown in Table 1. Next, the steps of the indoor simulated dry–wet cycle tests and direct shear tests are mainly introduced.

2.2.1. Indoor Wet and Dry Cycle Simulation Test

Rainfall infiltration mainly affects the strength of the shallow rock–soil mass of a slope. The water content of the shallow rock–soil mass of a slope usually ranges from 12% to saturation under dry–wet cycle conditions [16]. The initial water content of the soil is set at 20%, 25%, 30%, and 35%, and the number of dry–wet cycles is set at 2, 4, 6, 8, and 10. The experimental operation is as follows:
  • According to the physical properties of the soil samples given in Table 1 and the water content and density of the soil samples, calculate the mass of the soil when the water content reaches 12%, 20%, 25%, 30%, and 35%.
  • Use an electric fan to accelerate the air-drying speed of the soil samples. Measure the quality of the soil samples every hour to detect whether the water content of the soil samples has reached the predetermined value. When the water content reaches 12%, turn off the electric fan, stop air-drying dehydration immediately, wrap the soil with plastic wrap, and seal it for 24 h to ensure that the moisture inside the soil is evenly distributed.
  • Put the soil sample with an initial water content of 12% into a stacked saturation device, and use a vacuum suction device combined with a vacuum suction saturation method to perform suction saturation on the soil sample. After the soil is saturated, use step 2 of the method, using an electric fan to air-dry and dehydrate the saturated soil samples. When the water content of the soil sample reaches 20%, stop air-drying dehydration and wrap it with plastic wrap for sealed curing for 24 h. At this point, a soil sample with a water content of 20% has undergone a complete dry–wet cycle.
  • According to steps 2–3, continue to perform dry–wet cycle tests on soil samples with a water content of 20% 2, 4, 6, 8, and 10 times.
  • According to steps 1–3, perform indoor simulated dry–wet cycle tests on soil samples with a water content of 25%, 30%, and 35%.

2.2.2. Quick Shear Test

After the indoor simulated dry–wet cycle test, it is necessary to immediately measure the strength indicators of the soil to prevent changes in water content due to long placement time. The soil is grouped according to different initial water contents. Each group of soil has 6 test samples, and 4 test samples are randomly selected from the 6 test samples for quick shear tests. After the quick shear test is completed, in order to verify whether the water content of the soil sample remains stable during the test process, the water content of the soil on the shear surface is tested. If the tested water content differs significantly from the predetermined initial water content, the relevant soil sample must be discarded and a backup soil sample must be used to remeasure the strength of the soil.

3. Results

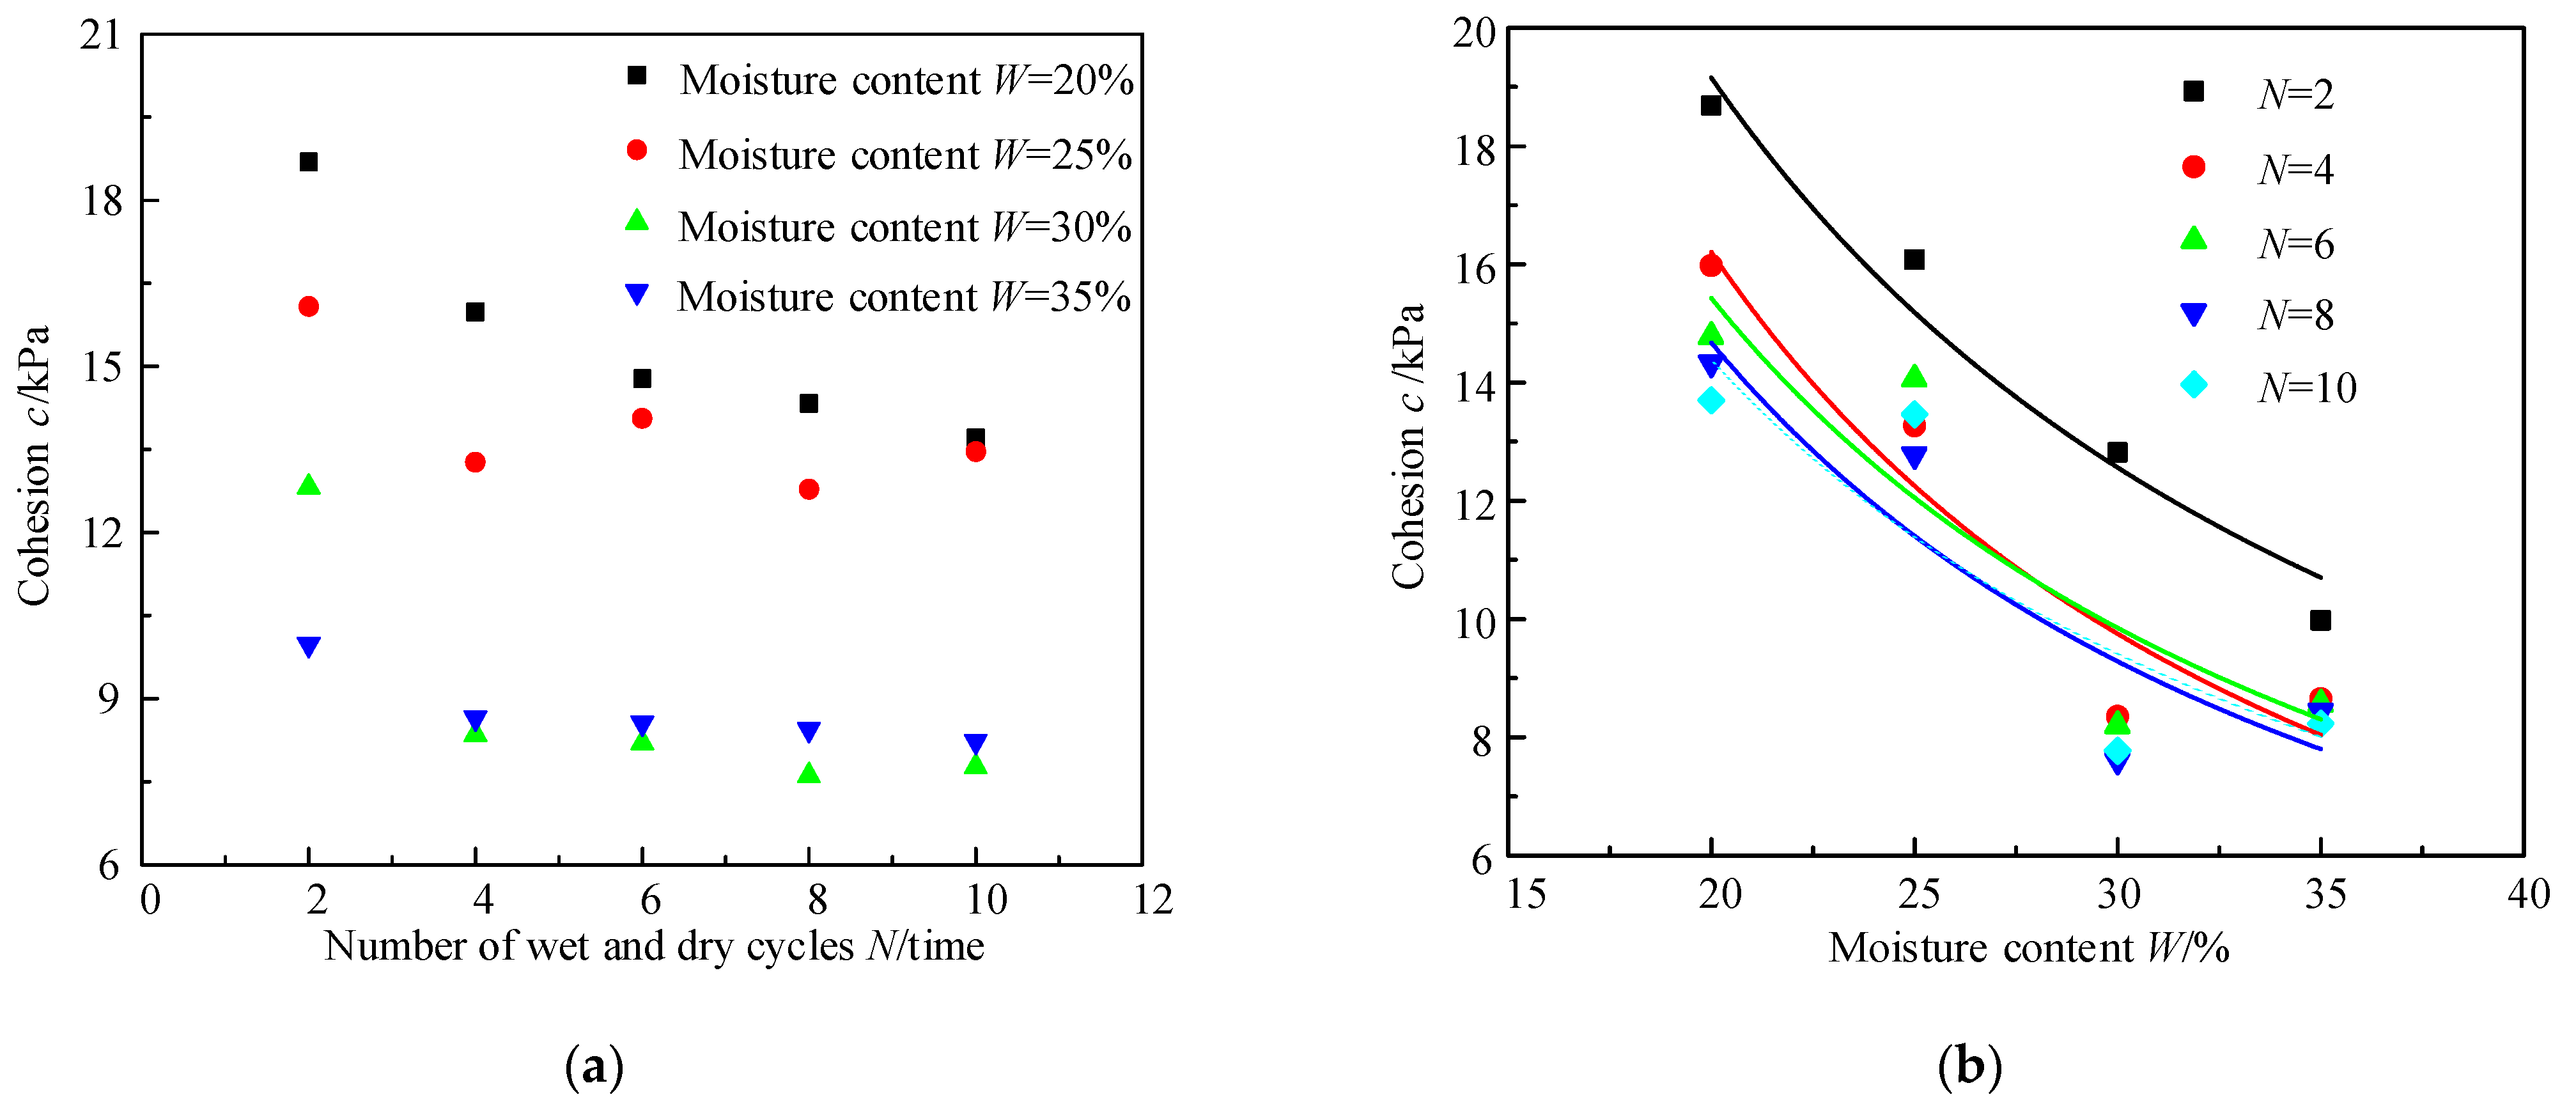
3.1. Relationship among Cohesion, Moisture Content, and Drying and Wetting Cycles of Granite Residual Soil

Figure 3 shows the relationship between cohesion c and water content W and dry–wet cycles N in the shear strength indicators of soil after different dry–wet cycle times N. When the water content of the soil is the same, the cohesion c of the soil decreases with an increase in the number of dry–wet cycles N. When N < 6, the rate of decrease in c with N is higher; when N > 6, the rate of decrease in c with N is lower. As shown in Figure 3b, when the dry–wet cycles N are constant, the cohesion c of the soil decreases with an increase in water content W and the rate of decrease changes slightly. The nonlinear relationship between the two can be described using a power function.
c = AWB,
Among them, A and B are the fitting parameters, and the values of A and B are shown in Table 2. At the same time, Figure 4 shows the relationship between parameters A and B in Formula (1) and dry–wet cycle times N. Both decrease as the number of wet and dry cycles increases, and there is a relationship between parameters A and B and N:
A = a 1 N b 1 ,
B = a 2 N b 2 ,
Among them, a1, b1, a2, and b2 are the fitting parameters, and their values are shown in Table 3.

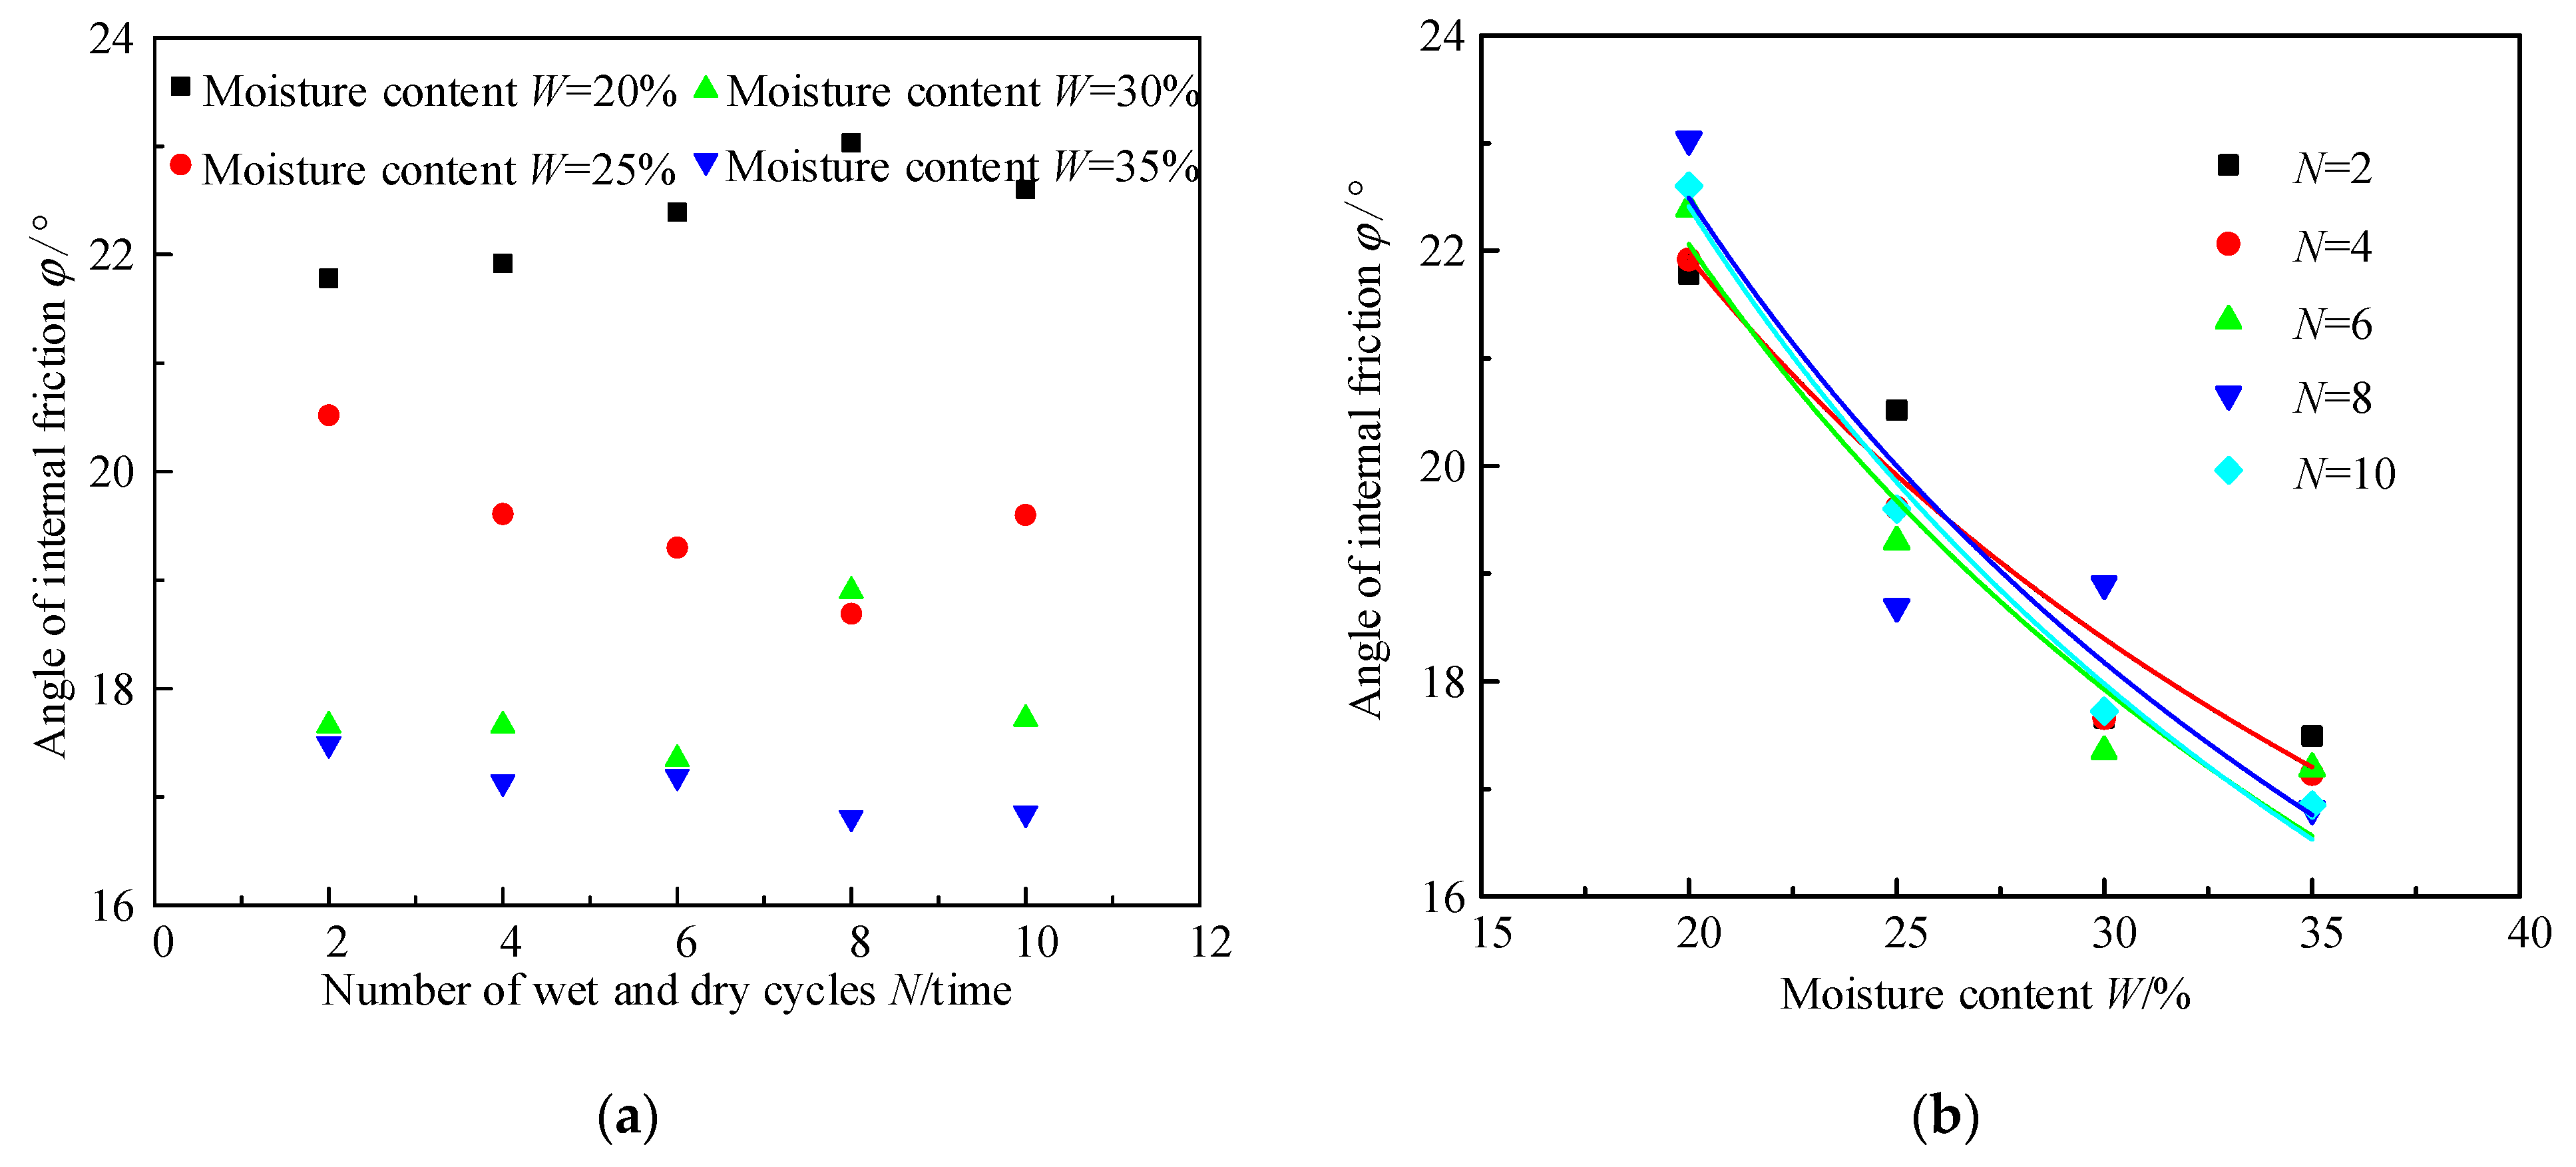
3.2. Relationship among Internal Friction Angle, Moisture Content, and Number of Drying and Wetting Cycles of Granite Residual Soil

Figure 5 shows the relationship between internal friction angle φ and water content W and dry–wet cycles N in the shear strength indicators of soil after different dry–wet cycle times N. Generally, when the water content W of the soil is the same, the internal friction angle φ of the soil decreases with an increase in the number of dry–wet cycles N. Compared with Figure 3a, when the water content W is constant, the influence of the number of dry–wet cycles N on the internal friction angle φ of the soil is smaller than that on cohesion c. When the number of dry–wet cycles N is constant, although the internal friction angle φ of the soil decreases with an increase in the dry–wet cycles N, it decreases slightly. As shown in Figure 5b, when the number of dry wet cycles N remains constant, the internal friction angle of the soil φ As the water content W increases, it decreases, and the relationship between the two is:
φ = CWD,
Among them, C and D are the fitting parameters, and their values are shown in Table 2.
Figure 6 shows the relationship between parameters C and D in Formula (4) and dry–wet cycle times N. Both decrease and increase with an increase in the number of dry–wet cycle times, and the relationship between the two is:
C = a 3 N b 3 ,
D = a 4 N b 4 ,
Among them, a3, b3, a4, and b4 are the fitting parameters, and their values are shown in Table 3.
The standard deviations of the parameters A and B, which measure the cohesion, are 0.06 and 3.07, respectively. The standard deviations of the parameters C and D, which measure the internal friction angle, are 0.03 and 0.8, respectively.

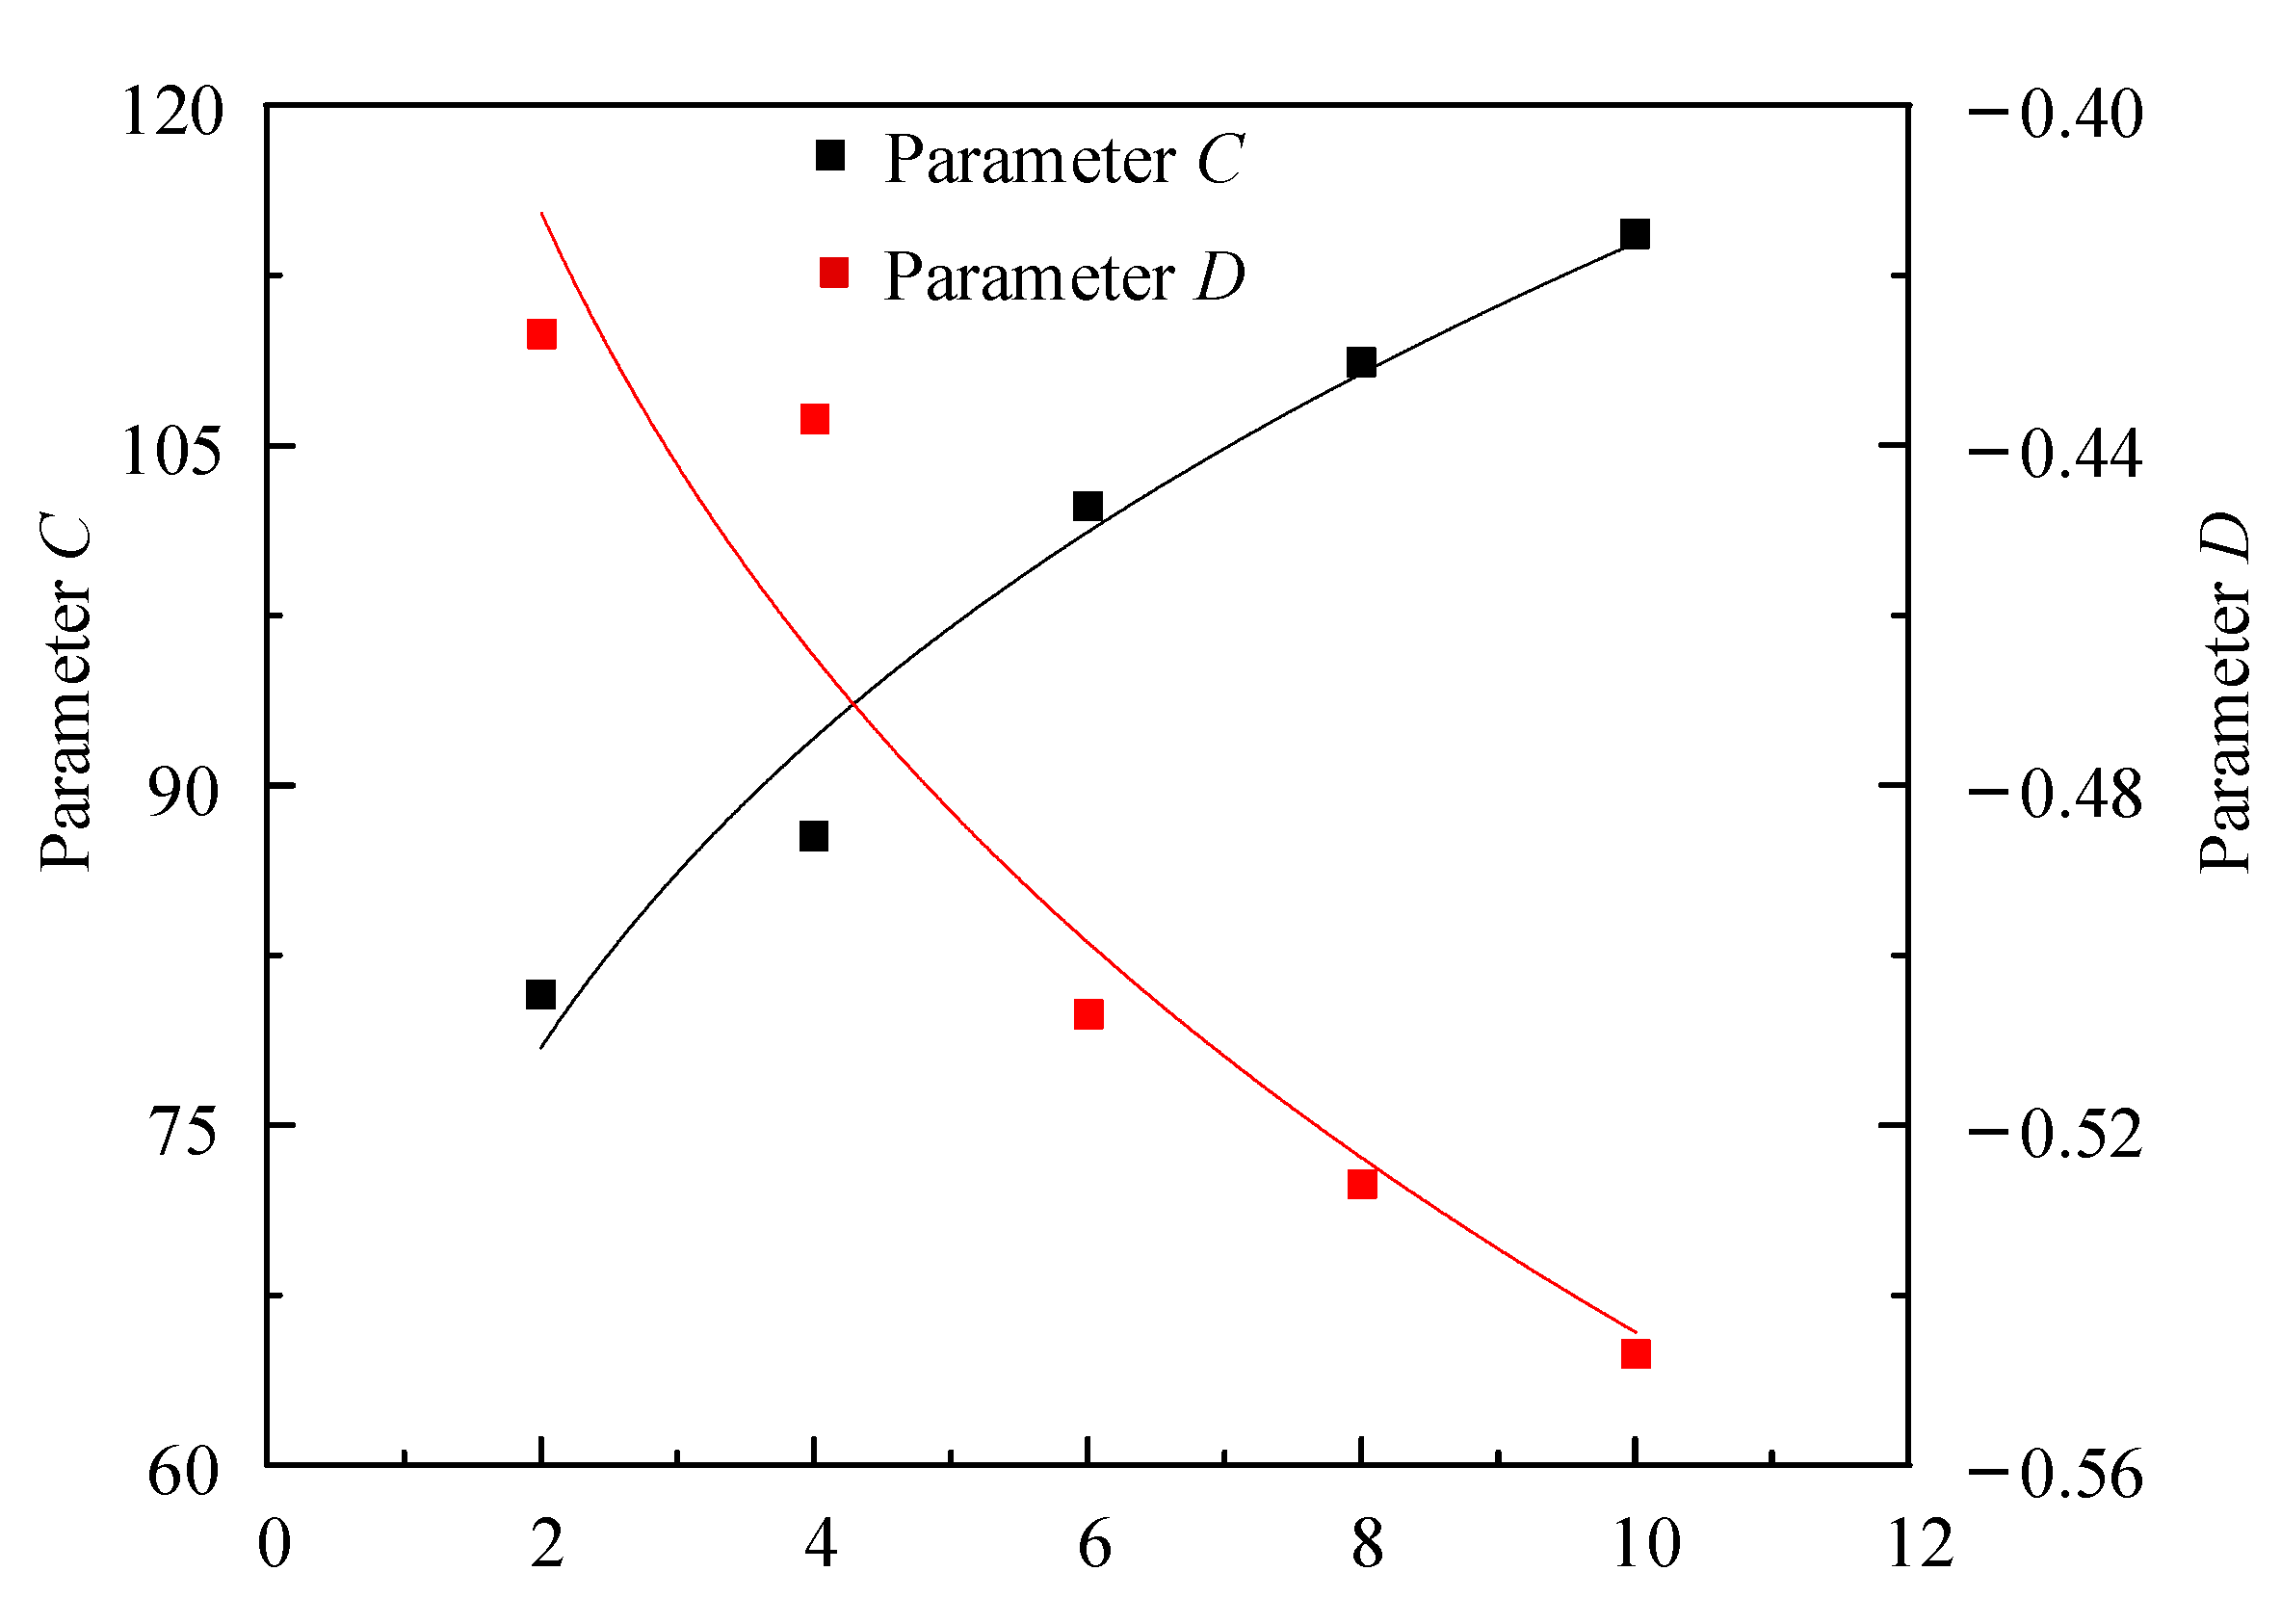
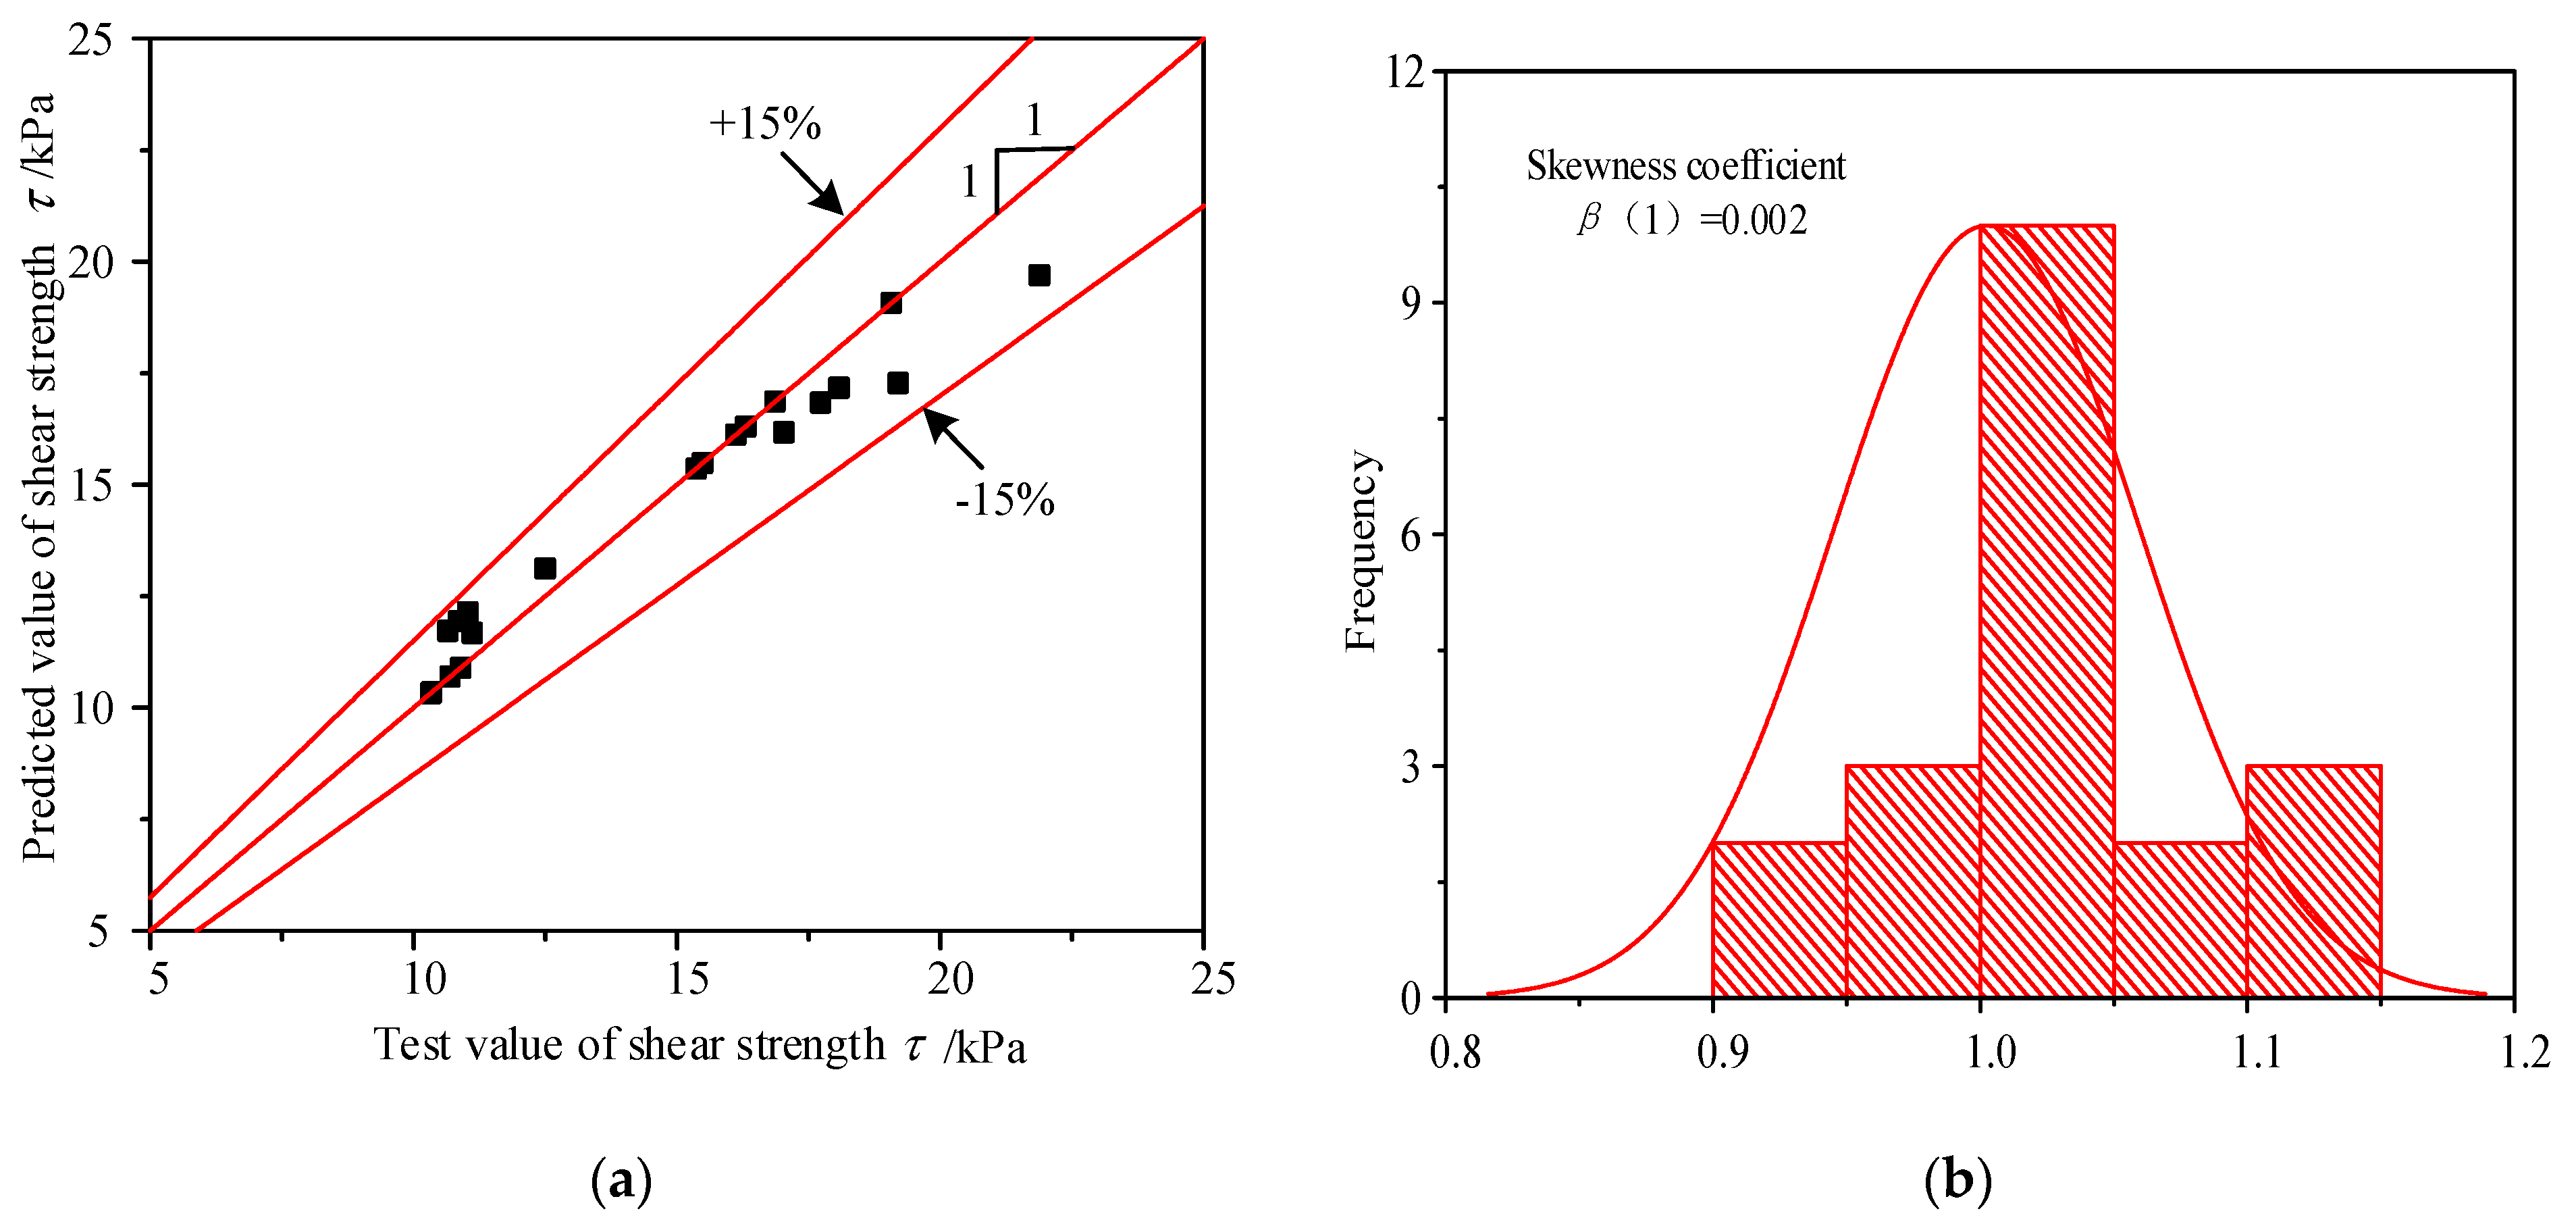
3.3. Establishment of Prediction Model of Soil Shear Strength

The shear strength of the soil can be calculated using the following formula:
τ = c + σ tan φ ,
Combining Formulas (1)–(3), the predicted formula for cohesion c can be obtained:
c = a 1 N b 1 W ( a 2 N b 2 ) ,
Combining Formulas (4)–(6), the predicted formula for internal friction angle φ can be obtained:
φ = a 3 N b 3 W ( a 4 N b 4 ) ,
By substituting Formulas (8) and (9) into Formula (7), a prediction formula for soil shear strength τ considering the influence of the water content W and number of dry–wet cycle N can be established:
τ = a 1 N b 1 W ( a 2 N b 2 ) + σ t a n a 3 N b 3 W ( a 4 N b 4 ) ,
The specific process of predicting shear strength τ is shown in Figure 7.
Figure 8 shows the frequency distribution of the ratio of predicted values and experimental values of granite residual soil shear strength τ. The ratio of predicted values and experimental values of τ is between 0.8 and 1.2 and shows a normal distribution with a skewness coefficient β(1) approximately equal to 0.

4. Uncertainty Analysis of Shear Strength Prediction Model

Formulas (8) and (9) are empirical equations for predicting the cohesion c and internal friction angle φ of granite residual soil. Unlike analytical equations, the predicted values of empirical equations have uncertainties. The predicted cohesion c and internal friction angle φ of granite residual soil obtained from Formulas (8) and (9) have certain errors. The uncertainty of cohesion c and the internal friction angle φ will be transmitted to τ via Formula (10), which will cause uncertainty of the predicted value of shear strength τ. Next, this paper studies the uncertainty of τ caused by the uncertainty of c and φ using a point estimation method with respect to changes in W and N.

4.1. Fundamentals of Point Estimation

The point estimation method was proposed by Rosenblueth [46]. For the probability distribution function P(x), the m-th moment of the random variable x at x = x0 is:
E [ ( x x 0 ) m ] = ( x x 0 ) m P ( x ) d x ,
When x0 = 0 and m = 1 in Formula (11), the average value x ¯ of x can be obtained; when x0 =   x ¯ and m = 2, the variance V[x] of x can be obtained. The square root of V[x] is the standard deviation σ[x] of x. For a bivariate function y = y(x1, x2) containing variables x1 and x2, its m-th order matrix is:
E [ y m ] = p + + y + + m + p + y + m + p + y + m + p y m ,
where y± ± is the value of the bivariate function y considering the uncertainty of variables x1 and x2:
y ± ± = f ( x ¯ 1 ± σ [ x 1 ] , x ¯ 2 ± σ [ x 2 ] ) ,
When the skewness coefficient β(1) = 0, the weight function p± ± is:
p + + = p = 1 + ρ 4 ,
p + = p + = 1 ρ 4 ,
where ρ x 1 , x 2 is the correlation coefficient between x1 and x2:
ρ x 1 , x 2 = C o v ( x 1 , x 2 ) V [ x 1 ] V [ x 2 ] ,
and where Cov(x1, x2) is the covariance between x1 and x2. The standard deviation of function y is:
σ [ y ] = E ( y 2 ) ( E [ y ] ) 2 ,

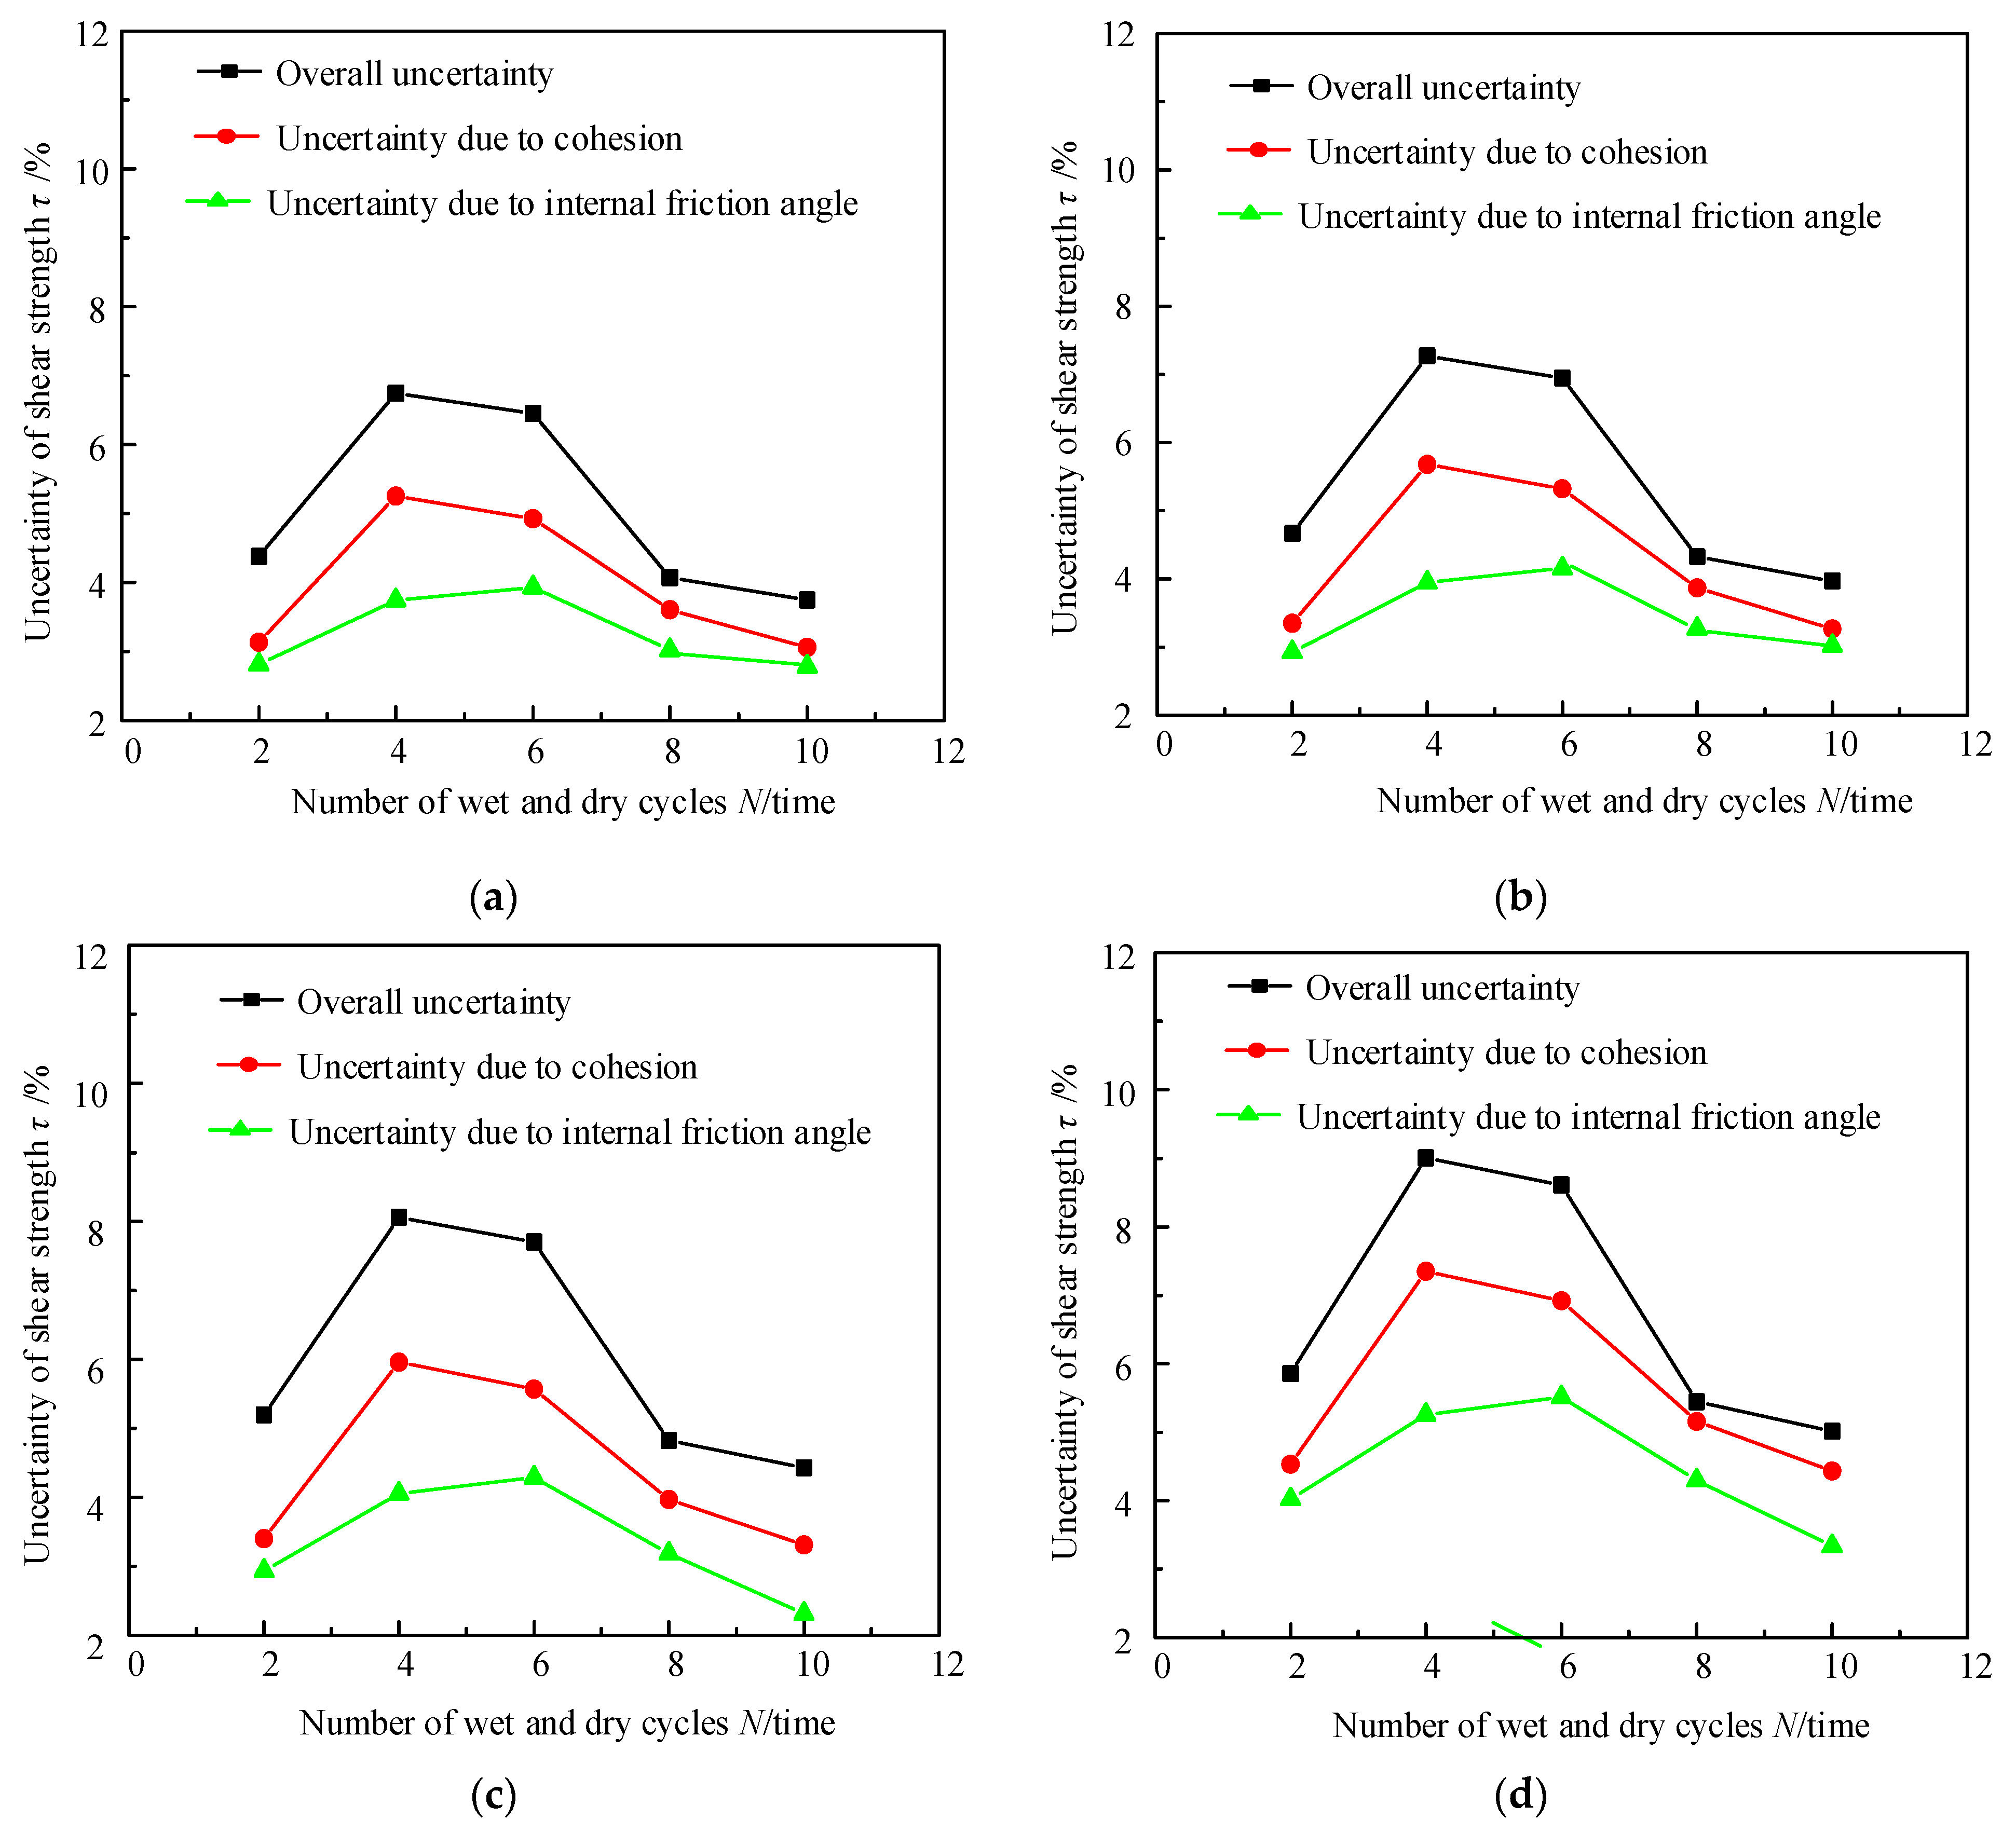
4.2. Uncertainty in Predicting Shear Strength τ

The accuracy of the regression equation can be measured using the root mean square error δ:
δ = 1 N i = 1 N ( x i x ¯ i ) 2 ,
where N is the number of data points, xi is the i-th actual value, and x i ¯ is the corresponding predicted value of xi. The root mean square errors δ[c] and δ[φ] of Formulas (8) and (9) are 1.330 and 0.044, respectively. Combined with Formulas (7) and (13), considering the uncertainty of c and φ, τ can be expressed as:
τ ± ± = ( c ¯ ± δ [ c ] ) + σ tan ( φ ¯ ± δ [ φ ] ) ,
Combined with Formulas (10) and (13), considering the uncertainty of c and φ, τ can be expressed as:
τ ± ± = a 1 N b 1 W ( a 2 N b 2 ) ¯ ± δ a 1 N b 1 W ( a 2 N b 2 ) + σ tan [ a 3 N b 3 W ( a 4 N b 4 ) ¯ ± δ a 3 N b 3 W ( a 4 N b 4 ) ]
The uncertainty of predicted τ can be characterized by the standard deviation of Formula (17).
Figure 9 shows the uncertainty propagation of c and φ.
The calculation process of the uncertainty of the predicted τ is as follows. For a given N and W, when both parameters c and φ have uncertainties, you can substitute the predicted values c ¯ and φ ¯ of c and φ calculated using Formulas (8) and (9) and the root mean square errors δ[c] and δ[φ] of Formulas (8) and (9) into Formula (20) to calculate τ. When only one of c and φ has uncertainty, for example, if c has uncertainty, you can substitute the predicted values c ¯ and φ ¯ and δ[c] into Formula (20) and take δ[φ] = 0 to calculate τ.
Figure 10 shows the total uncertainty of the predicted τ caused by the uncertainty of c and φ of granite residual soil with W = 20%, 25%, 30%, and 35%, and the univariate uncertainty of the predicted τ caused by the uncertainty of a single parameter c or φ with respect to changes in N and W. The total uncertainty and univariate uncertainty of the predicted τ increase first and then decrease with an increase in N. This may be because when the number of dry–wet cycles is small, the structure inside the soil changes greatly, which leads to an increase in the variability of shear strength indicators. When N reaches a certain value, the structure of the soil tends to be stable, and the variability of shear strength indicators also shows a downward trend. The total uncertainty and univariate uncertainty of the predicted τ increase with an increase in W. This may be because the structure of the soil becomes unstable with an increase in water content, which leads to an increase in the variability of cohesion c and the internal friction angle φ. The uncertainty in predicting τ values for different N and W values is mainly caused by the uncertainty of c. The total uncertainty and univariate uncertainty of the predicted τ are largest when N = 4 or 6. Generally, the total uncertainty of the predicted τ based on N and W is less than 9%. Therefore, for stability analysis of granite residual soil slopes, it is reliable to predict τ values for different N and W values using empirical formulas established in this paper considering the influence of N and W.

5. Conclusions

For the shallow granite residual soil of a slope in Fuzhou, indoor simulated dry–wet cycle tests were carried out to investigate the influence of the water content W and number of dry–wet cycles N on the shear strength indicators of granite residual soil. A prediction formula for soil shear strength τ considering the influence of N and W was established. The uncertainty of τ predicted using the formula was analyzed using a point estimation method. The main conclusions are as follows:
(1)
The cohesion c of granite residual soil decreases with an increase in the water content W, and the approximate relationship between the two satisfies the power function. The fitting parameters of the power function also satisfy a power function relationship with the number of dry–wet cycles N. A prediction formula for c considering the influence of N and W was obtained.
(2)
The internal friction angle φ of granite residual soil decreases with an increase in water content W, and the nonlinear relationship between the two can be described using a power function. The fitting parameters of this power function and the number of wet and dry cycles N also satisfy a power function relationship. A prediction formula for φ considering the influence of N and W was obtained.
(3)
A prediction formula for soil shear strength τ considering the influence of N and W was established.
(4)
The uncertainty of τ predicted by the formula jointly caused by the uncertainty of c and φ and the univariate uncertainty of τ predicted by only c or φ increases first and then decreases with an increase in N, and both increase with an increase in water content W.

Author Contributions

Conceptualization, Y.G. and S.W.; data curation, F.P.; formal analysis, J.D.; funding acquisition, Y.G. and S.W.; investigation, F.P.; methodology, J.D.; project administration, Y.G.; resources, J.D.; software, Y.Z.; supervision, S.W.; validation, H.H., F.P. and Y.Z.; visualization, Y.W.; writing—original draft, J.D. and Y.Z.; writing—review and editing, J.D. and H.H. All authors have read and agreed to the published version of the manuscript.

Funding

This research was funded by National Natural Science Foundation of China (51979175), Nanjing Hydraulic Research Institute’s Basic Scientific Research Business Fund Scientific Research and Innovation Team Building Project (Y722003) and Nanjing Hydrological Research Institute’s Basic Scientific Research Business Fee Leading Project (Y723008): Operational Application System Supporting the Four-Prediction Ability for Reservoir Dam Safety.

Institutional Review Board Statement

This study does not involve humans or animals.

Data Availability Statement

No new data were created or analyzed in this study. Data sharing is not applicable to this article.

Conflicts of Interest

The authors declare no conflict of interest.

References

  1. Zhu, X.; Li, G.; Cai, Z. Failure Modes and Slope Stability of Expansive Soil Canal under Wet-Dry Cycles. Trans. Chin. Soc. Agric. Eng. 2020, 36, 159–167. [Google Scholar] [CrossRef]
  2. Zhang, S.; Tan, Y.; Wang, C. Research on Deformation Failure Mechanism and Stability of Slope Rock Mass Containing Multi-Weak Interlayers. Rock Soil Mech. 2014, 35, 1695–1702. [Google Scholar] [CrossRef]
  3. Liu, M.; Ye, J.; Oswald, J. Coarse-grained molecular simulation of the role of curing rates on the structure and strength of polyurea. Comput. Mater. Sci. 2023, 230, 112428. [Google Scholar] [CrossRef]
  4. Liu, M.; Oswald, J. Coarse-grained molecular modeling of the microphase structure of polyurea elastomer. Polymers 2019, 176, 1–10. [Google Scholar] [CrossRef]
  5. Xu, X.T.; Jian, W.B.; Wu, N.S.; Xu, X.; Liu, J. Unsaturated Seepage Characteristics of Slope under Rainfall Infiltration. Earth Sci. 2018, 43, 922–932. [Google Scholar] [CrossRef]
  6. Lan, Y.; Jian, W.; Luo, J. Risk Grade Evaluation of Highway Slope Water Damage Based on Grey Fixed-Weight Cluster Model. J. Fuzhou Univ. 2021, 49, 101–107. [Google Scholar] [CrossRef]
  7. Hu, H.; Wu, X.; Zhang, Y. Failure Mode Analysis of Granite Residual Soil Slope Based on Rainfall Landslide Simulation Test. J. Xiamen Univ. 2021, 60, 1098–1102. [Google Scholar] [CrossRef]
  8. Wu, J.; Yang, S. Experimental Study of Matric Suction Measurement and Its Impact on Shear Strength under Drying-Wetting Cycles for Expansive Soils. Rock Soil Mech. 2017, 38, 678–684. [Google Scholar]
  9. Wang, X.; Liu, N.; Li, Z. Hydro-Mechanical Behaviors of Sludge Stabilized with Magnesium Oxychloride Cement-Based Multi-Cementitious Materials under Influence of Drying-Wetting Cycles. Chin. J. Geotech. Eng. 2023, 45, 2004–2013. [Google Scholar] [CrossRef]
  10. Li, C.; Kong, L.; Shu, R.; An, R.; Zhang, X. Disintegration characteristics in granite residual soil and their relationship with the collapsing gully in South China. Open Geosci. 2020, 12, 1116–1126. [Google Scholar] [CrossRef]
  11. Tao, G.; Chen, Y.; Xiao, H.; Chen, Y.; Peng, W. Comparative analysis of soil-water characteristic curve in fractal and empirical models. Adv. Mater. Sci. Eng. 2020, 2020, 1970314. [Google Scholar] [CrossRef]
  12. Liu, Y.S.; Yang, T.; Zhang, X.; Zhang, Q.; Li, X.; Liu, J.; Deng, Z. Strength Deterioration of Karst Fillings under Dry–Wet Cycles: Testing and Modeling Study. Bull. Eng. Geol. Environ. 2023, 82, 339. [Google Scholar] [CrossRef]
  13. Wu, H.; Shao, S.; Shao, S.; Zhang, S.; Wang, Z. Variations in Dynamic Shear Modulus of Loess Exposed to Dry-Wet Cycles from Xi’an Area, China. Soil Dyn. Earthq. Eng. 2023, 173, 108126. [Google Scholar] [CrossRef]
  14. Wang, J.; Sun, Q.; Xue, S.; Yang, X.; Guo, H.; Geng, J. Study on the Effect of High-Temperature Dry-Wet Cycles on Argillaceous Sandstone. Bull. Eng. Geol. Environ. 2023, 82, 318. [Google Scholar] [CrossRef]
  15. Zheng, J.-C.; Chen, W.; Zheng, K.-R.; Gu, Y.P.; Wang, F.; Huang, Z.; Li, Y. Stability Analysis of Gravity Anchor Foundation of Layered Argillaceous Sandstone under Dry-Wet Cycles. J. Mt. Sci. 2023, 20, 1118–1130. [Google Scholar] [CrossRef]
  16. Goh, S.G.; Rahardjo, H.; Leong, E.C. Shear Strength of Unsaturated Soils under Multiple Drying-Wetting Cycles. J. Geotech. Geoenviron. Eng. 2014, 140, 06013001. [Google Scholar] [CrossRef]
  17. Ma, Q.; Wu, N.Z.; Xiao, H.L.; Li, Z.; Li, W. Effect of Bermuda Grass Root on Mechanical Properties of Soil under Dry-Wet Cycles. Bull. Eng. Geol. Environ. 2021, 80, 7083–7097. [Google Scholar] [CrossRef]
  18. Wu, Q.; Liu, Y.; Tang, H.; Kang, J.; Wang, L.; Li, C.; Wang, D.; Liu, Z. Experimental Study of the Influence of Wetting and Drying Cycles on the Strength of Intact Rock Samples from a Red Stratum in the Three Gorges Reservoir Area. Eng. Geol. 2023, 314, 107013. [Google Scholar] [CrossRef]
  19. Wang, X.; Lian, B.; Feng, W. A Nonlinear Creep Damage Model Considering the Effect of Dry-Wet Cycles of Rocks on Reservoir Bank Slopes. Water 2020, 12, 2396. [Google Scholar] [CrossRef]
  20. Nie, Y.; Ni, W.; Li, X.; Wang, H.; Yuan, K.; Guo, Y.; Tuo, W. The Influence of Drying-Wetting Cycles on the Suction Stress of Compacted Loess and the Associated Microscopic Mechanism. Water 2021, 13, 1809. [Google Scholar] [CrossRef]
  21. Yanli, Q.; Bai, M.Z.; Zhou, H.; Shi, H.; Li, P.; He, B. Study on the Mechanical Properties of Red Clay under Drying-Wetting Cycles. Adv. Mater. Sci. Eng. 2021, 2021, 8665167. [Google Scholar] [CrossRef]
  22. Xu, W.; Li, X.; Zhang, Y.; Zhu, H.; Zhang, W.; Xuan, C. Fine Identification and Characterization of Rock Mass Discontinuities and Its Application Using a Digital Photogrammetry System. Acta Geod. Cartogr. Sin. 2022, 51, 2093–2106. [Google Scholar] [CrossRef]
  23. An, R.; Kong, L.; Zhang, X.; Li, C. Effects of Dry-Wet Cycles on Three-Dimensional Pore Structure and Permeability Characteristics of Granite Residual Soil Using X-ray Micro Computed Tomography. J. Rock Mech. Geotech. Eng. 2022, 14, 851–860. [Google Scholar] [CrossRef]
  24. Chen, H.J.; Cui, G.Y. Probability statistical analysis of physical mechanical parameters of granite eluvial soil. J. Huazhong Univ. Sci. Technol. 2001, 29, 95–97. [Google Scholar] [CrossRef]
  25. Zhang, Z.; Niu, Y.; Shang, X.; Ye, P.; Zhou, R.; Gao, F. Deterioration of Physical and Mechanical Properties of Rocks by Cyclic Drying and Wetting. Geofluids 2021, 2021, 6661107. [Google Scholar] [CrossRef]
  26. Zhang, Q.; Wang, L.; Zhang, H. Rainfall Infiltration Process of a Rock Slope with Considering the Heterogeneity of Saturated Hydraulic Conductivity. Front. Earth Sci. 2022, 9, 804005. [Google Scholar] [CrossRef]
  27. Xu, Y.; Liao, X.; Li, J.; Chen, L.; Li, L. The Effects of Water Content and Dry–Wet Cycles of Weak-Interlayer Soil on Stability of Clastic Rock Slope. Geotech. Geol. Eng. 2021, 39, 3753–3760. [Google Scholar] [CrossRef]
  28. Wang, X.; Zhan, H.; Wang, J.; Li, P. The Stability of Tailings Dams under Dry-Wet Cycles: A Case Study in Luonan, China. Water 2018, 10, 1048. [Google Scholar] [CrossRef]
  29. Wen, T.; Wang, Y.; Tang, H.; Zhang, J.; Hu, M. Damage Evolution and Failure Mechanism of Red-Bed Rock under Drying–Wetting Cycles. Water 2023, 15, 2684. [Google Scholar] [CrossRef]
  30. Albadri, W.M.; Noor, M.J.M.; Alhani, I.J. The Relationship between the Shear Strength and Water Retention Curve of Unsaturated Sand at Different Hydraulic Phases. Acta Geotech. 2021, 16, 2821–2835. [Google Scholar] [CrossRef]
  31. Chen, R.; Xu, T.; Lei, W.; Zhao, Y.; Qiao, J. Impact of Multiple Drying-Wetting Cycles on Shear Behaviour of an Unsaturated Compacted Clay. Environ. Earth Sci. 2018, 77, 683. [Google Scholar] [CrossRef]
  32. Goh, S.G.; Rahardjo, H.; Leong, E.C. Shear Strength Equations for Unsaturated Soil under Drying and Wetting. J. Geotech. Geoenviron. Eng. 2010, 136, 594–606. [Google Scholar] [CrossRef]
  33. Calonico, S.; Cattaneo, M.D.; Farrell, M.H. On the effect of bias estimation on coverage accuracy in nonparametric inference. J. Am. Stat. Assoc. 2018, 113, 767–779. [Google Scholar] [CrossRef]
  34. Grant, E.; Finn, C.; Levine, S.; Darrell, T.; Griffiths, T. Recasting Gradient-Based Meta-Learning as Hierarchical Bayes. arXiv 2018, arXiv:1801.08930. [Google Scholar] [CrossRef]
  35. Zhu, Y.; Xie, M.; Zhang, K.; Li, Z. A Dam Deformation Residual Correction Method for High Arch Dams Using Phase Space Reconstruction and an Optimized Long Short-Term Memory Network. Mathematics 2023, 11, 2010. [Google Scholar] [CrossRef]
  36. Zhu, Y.; Zhang, Z.; Gu, C.; Li, Y.; Zhang, K.; Xie, M. A Coupled Model for Dam Foundation Seepage Behavior Monitoring and Forecasting Based on Variational Mode Decomposition and Improved Temporal Convolutional Network. Struct. Control Health Monit. 2023, 2023, 3879096. [Google Scholar] [CrossRef]
  37. Bi, Y.; Zou, H.; Zhu, C. Dynamic monitoring of soil bulk density and infiltration rate during coal mining in sandy land with different vegetation. Int. J. Coal Sci. Technol. 2014, 1, 198–206. [Google Scholar] [CrossRef]
  38. GB/T 50123-2019; Standard for Geotechnical Testing Method. China Planning Press: Beijing, China, 2019.
  39. An, R.; Zhang, X.W.; Kong, L.W.; Gong, J.W.; Lei, X.W. Artificial ground freezing impact on shear strength and microstructure of granite residual soil under an extremely low temperature. Front. Earth Sci. 2021, 9, 935. [Google Scholar] [CrossRef]
  40. Kim, C.K.; Kim, T.H. Behavior of unsaturated weathered residual granite soil with initial water contents. Eng. Geol. 2010, 113, 1–10. [Google Scholar] [CrossRef]
  41. Zhang, X.W.; Kong, L.W.; Yin, S.; Chen, C. Engineering geology of basaltic residual soil in Leigong, Southern China. Eng. Geol. 2017, 220, 196–207. [Google Scholar] [CrossRef]
  42. Sayem, H.M.; Kong, L.W.; Yin, S. Effect of drying-wetting cycles on saturated shear strength of undisturbed residual soils. Am. J. Civ. Eng. 2016, 4, 159–166. [Google Scholar] [CrossRef]
  43. Kong, L.W.; Sayem, H.M.; Tian, H.H. Influence of drying-wetting cycles on soil-water characteristic curve of undisturbed granite residual soils and microstructure mechanism by nuclear magnetic resonance (NMR) spin-spin relaxation time (T2) relaxometry. Can. Geotech. J. 2018, 55, 208–216. [Google Scholar] [CrossRef]
  44. GB/T 50145-2007; Standard for Engineering Classification of Soil. China Planning Press: Beijing, China, 2007.
  45. Wu, N.S. Study on Classification of Granite Residual Soils. Rock Soil Mech. 2006, 27, 2299–2304. [Google Scholar] [CrossRef]
  46. Rosenblueth, E. Two-Point Estimates in Probabilities. Appl. Math. Model. 1981, 5, 329–335. [Google Scholar] [CrossRef]
Figure 2. Slope soil sample information diagram: (a) Soil layer distribution of the slope; (b) slope soil layer borehole column diagram.
Water 15 03931 g002
Figure 3. Relationship between cohesion and water content under different dry–wet cycles: (a) the relationship between cohesion and the number of dry–wet cycles; (b) the relationship between cohesion and moisture content.
Water 15 03931 g003
Figure 4. Relationship between parameters A and B and the number of dry–wet cycles.
Water 15 03931 g004
Figure 5. Relationship between internal friction angle and water content under different dry–wet cycles: (a) the relationship between the internal friction angle and the number of dry–wet cycles; (b) the relationship between internal friction angle and moisture content.
Water 15 03931 g005
Figure 6. Relationship between parameters C and D and the number of dry–wet cycles.
Water 15 03931 g006
Figure 7. Flow chart for predicting shear strength.
Water 15 03931 g007
Figure 8. Frequency distribution of the ratio between predicted and test value of shear strength: (a) the relationship between the predicted value and the experimental value; (b) frequency distribution of the ratio of predicted and experimental values.
Water 15 03931 g008
Figure 9. Flow chart for determining the uncertainty of the predicted τ caused by the uncertainties of c and φ.
Water 15 03931 g009
Figure 10. Influence of the uncertainties of c and φ on the total uncertainty and single univariate uncertainty of the predicted τ of soil at various W and N: (a) moisture content W = 20%; (b) moisture content W = 25%; (c) moisture content W = 30%; (d) moisture content W = 35%.
Water 15 03931 g010
Table 1. Geotechnical test results of granite residual soil.
Moisture Content
W/%
Dry Density
ρd/(g/m3)
Proportion
Gs
Void Ratio
e
Saturation Level
Sr/%
23.21.562.780.7186.59
Table 2. Values of parameters in cohesion and internal friction angle equation.
Number of CyclesCohesion cCoefficient of Determination R2Internal Friction Angle φCoefficient of Determination R2
ABCD
2463.86−1.050.98180.75−0.430.931
4439.97−1.120.89287.73−0.440.944
6425.99−1.110.902102.31−0.510.905
8410.94−1.130.861108.66−0.530.872
10390.95−1.160.871114.32−0.550.956
Table 3. Values of coefficients of prediction equations for parameters A, B, C, and D.
Prediction EquationCoefficientCoefficient of
Determination R2
aibi
A = a1Nb1500.52−0.0980.972
B = a2Nb2−1.010.050.912
C = a3Nb366.750.230.981
D = a4Nb4−0.370.100.953
Disclaimer/Publisher’s Note: The statements, opinions and data contained in all publications are solely those of the individual author(s) and contributor(s) and not of MDPI and/or the editor(s). MDPI and/or the editor(s) disclaim responsibility for any injury to people or property resulting from any ideas, methods, instructions or products referred to in the content.

