Article

Total Dissolved Solids Risk Assessment and Optimisation Scheme of Managed Aquifer Recharge Projects in a Karst Area of Northern China

1
Technical Centre for Soil, Agriculture and Rural Ecology and Environment, Ministry of Ecology and Environment, Beijing 100012, China
2
School of Water Conservancy and Environment, University of Jinan, Jinan 250022, China
3
Shandong Survey and Design Institute of Water Conservancy Co., Ltd., Jinan 250013, China
*
Author to whom correspondence should be addressed.
Water 2023, 15(22), 3930; https://doi.org/10.3390/w15223930
Submission received: 14 October 2023 / Revised: 6 November 2023 / Accepted: 7 November 2023 / Published: 10 November 2023

Abstract

:
Jinan, China, is famous for its springs. However, societal and economic development over the past decades has detrimentally altered the natural water cycle in the spring area. Managed aquifer recharge (MAR) is an effective measure to ensure the normal gushing of springs. Balancing water resource utilisation, ecological effects, and water quality risks is not always easy to implement. This study focused on the potential effects of MAR projects that divert water from multiple local surface water sites, e.g., the Yellow River and South-to-North Water Diversion (SNWD) Project. A numerical simulation model for the entire spring area was built using MODFLOW and MT3DMS. The SNWD Project diverts water with relatively high total dissolved solids (TDS) to the Yufu River, which consequently recharges groundwater and poses a potential risk to the downstream karst water in the Jinan Spring area. Different simulation scenarios were set, and the results showed that the 90% recovery ratio scheme yields the highest TDS reduction efficiency as well as the largest karst water extraction volume. In addition, the water table remains stable as a whole. The benefits of the designed scheme are multifold, including improving water quality up to Standard III groundwater quality and meeting the water needs of the economy. The study provides a novel method of addressing the groundwater quality risks posed by artificial recharge.

1. Introduction

Managed aquifer recharge (MAR) is defined as the intentional recharge of aquifer water for subsequent recovery or environmental benefits [1]. MAR plays a pivotal role in mitigating the challenges associated with diminishing water resources due to seasonal and cyclical variations [2,3]. A properly designed MAR system can enhance water quality by employing a combination of physical, chemical, and biological measures, thereby contributing to the elimination of viruses, bacteria, organic compounds, and other contaminants [4].
Numerous studies published in the field cover various aspects of MAR, including water recycling [5], recharge and recovery using wells [6], technologies and engineering for artificial recharge [7], riverbank filtration [8], MAR case risk assessment [9], sustainable groundwater management through artificial recharge [10,11], the progression of MAR practices in China, USA, and Europe [12,13,14], and the historical evolution of artificial recharge in the coastal dunes of the Netherlands [15].
Some examples of operational MAR systems include the large-scale infiltration basins in the Burdekin Delta in Queensland, Australia [16], the subsurface infiltration galleries of the aquifer recharge system of Geneva in Switzerland [17], the aquifer storage and recovery system in the Upper Floridian Aquifer System in the USA [18], underground dams in Shandong Peninsula, China [13], and the Amsterdam Water Supply Dunes system in the Netherlands [15].
Various forms of MAR technology engineering typically involve using natural channels or artificial facilities to establish a hydraulic connection between surface water and groundwater [19,20,21]. However, designing and testing an artificial recharge project can be time-consuming and expensive. Therefore, numerical models are widely used in MAR design and impact assessments. Ringleb et al. [22] reviewed model tools for MAR investigations based on a survey of studies published over the past 30 years; the most widely used models include MODFLOW, MT3DMS, and SEAWAT, which are mostly applied in feasibility studies, system optimisation, computing residence time, and simulating temperature variations. Examples of such studies include those by Jonoski et al. [23] on optimising infiltration and pumping systems, Chenini and Mammou [24] on feasibility assessment, Hashemi et al. [25] on estimating the floodwater spreading recharge rate, and Pranisha Pokhrel et al. [26] on the infiltration capacity of ponds and drawdown assessment.
Numerical simulations have emerged as a popular research topic, enabling the analysis and resolution of complex problems related to production volume and water quality after recharge during the design and operation phases. Moreover, numerical modelling has proven to be particularly useful in three distinct groundwater application areas: developing management strategies to optimise identified objectives, understanding assumed hydrogeological conditions, and evaluating forecast scenarios [22,27,28].
China’s implementation of the middle route of the South-to-North Water Diversion (SNWD) Project facilitated large-scale water release and supplementation in the area where the SNWD Project has been implemented within the North China Plain, utilising natural channels such as the Hutuo and Juma Rivers. By 2022, the cumulative water release had reached 9 billion m3. Since 2015, Jinan City’s Yufu River has annually released an average of 25 million m3 of water to Jinan Springs, sourced from the SNWD Project, the Yellow River, and local surface water. China is currently prioritising external water transfers to restore overexploited groundwater environments. However, research regarding optimising the economic benefits of water release, source water recharge, and their impacts on groundwater quality is insufficient.
As elucidated by Hui-zhen et al. [29], the total dissolved solids (TDS) concentration in groundwater within the study area was below 600 mg/L, which can be attributed to the acceleration of groundwater circulation and the subsequent reduction in groundwater residence time owing to extraction and utilisation activities. Accordingly, TDS concentration and water quality risks can be reduced by increasing groundwater extraction, accelerating groundwater circulation, and shortening groundwater residence time.
This study primarily addressed two key aspects: the potential water quality risks associated with long-term SNWD-induced groundwater recharge in the highly permeable zone of the Yufu River and whether source recharge may lead to water quality risks by exploring strategies for risk reduction and elimination while ensuring sustainable water supply without creating extensive drawdown funnels. The overarching goal is to achieve multi-objective outcomes encompassing spring water preservation, water quality enhancement, and improved supply efficiency.

2. Study Area and Project Design

2.1. Geography

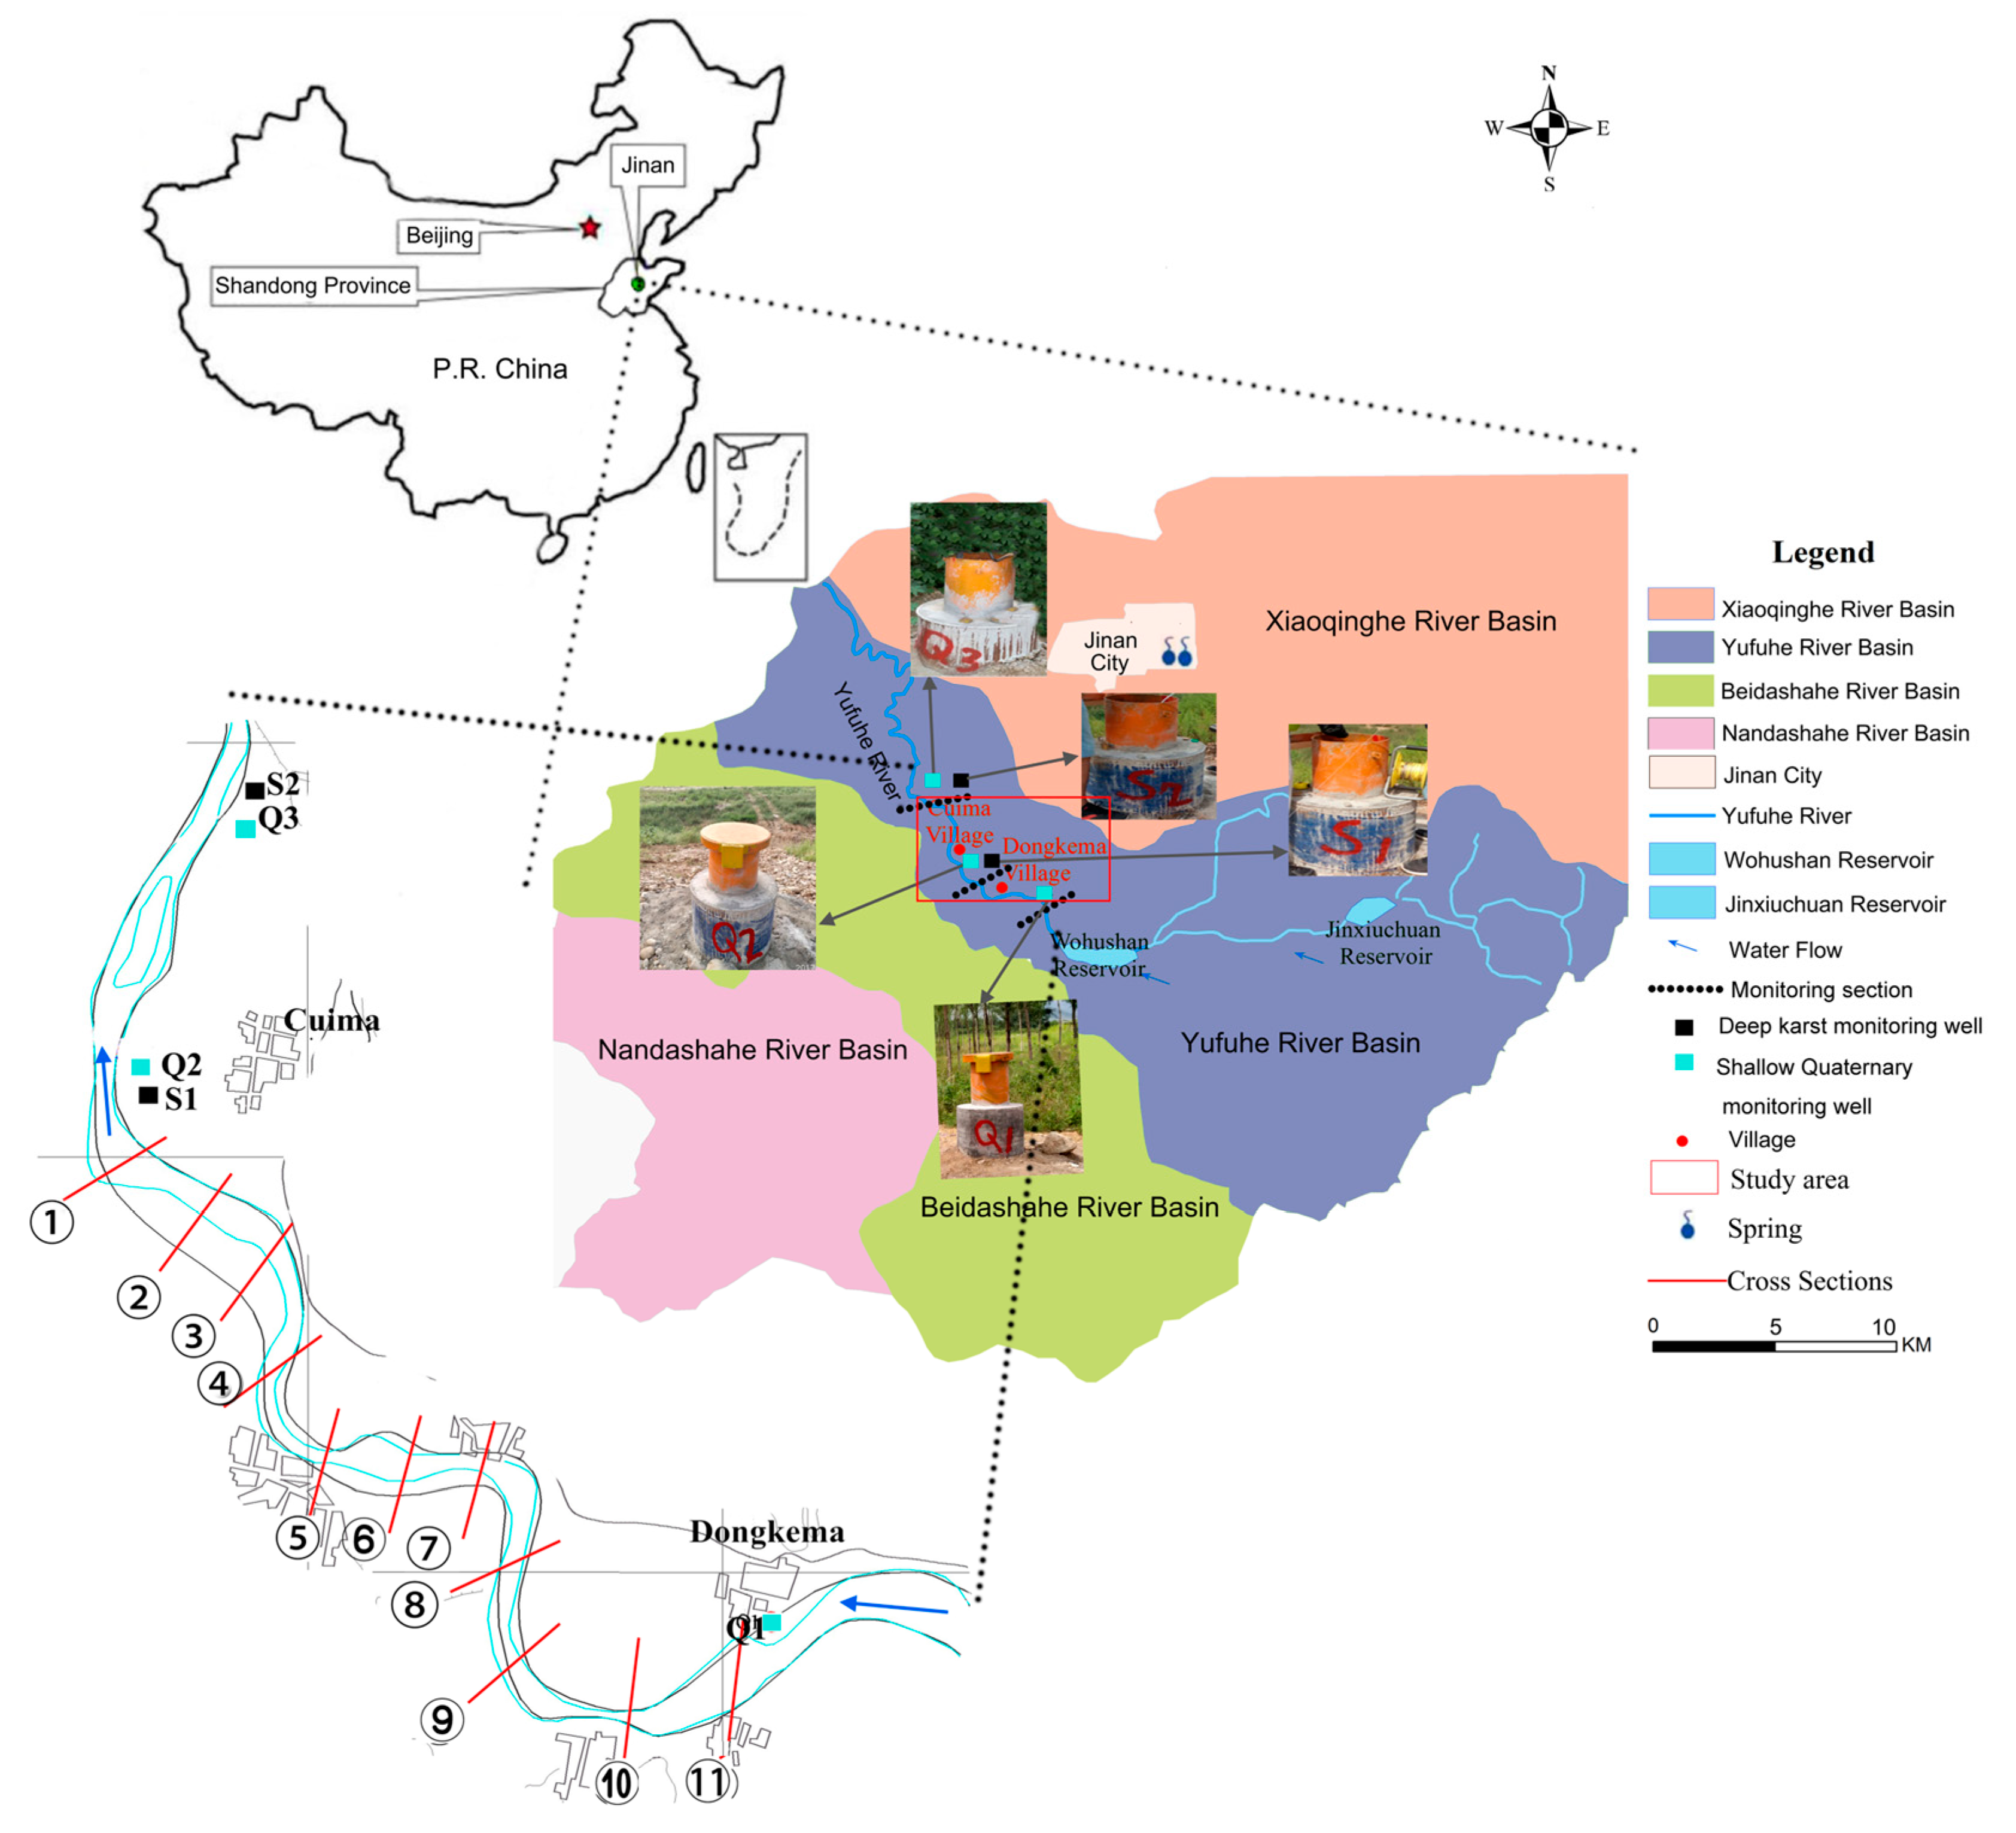
The Jinan Spring area, situated in the central region of Shandong Province, has an average annual precipitation of 647.9 mm and potential evaporation of 2263.0 mm. Most of the precipitation and evapotranspiration occur from June to September. Atmospheric rainfall is typically the primary source of groundwater [30]. Geographically, the study area is delineated by the Mashan Fault to the west, the Dongwu Fault to the east, the lower reaches of the Zhangxia Formation within the Middle Cambrian system to the south, and an igneous rock formation to the north. It encompasses an approximate expanse of 1315 km2. The prevalent phreatic aquifer is predominantly composed of Quaternary Holocene and Upper Pleistocene strata, with its texture characterised by medium-coarse sand and gravel layers and its depths varying between 10 and 40 m. Directly underlying this is the seepage layer, which is a clay layer situated beneath the base of the phreatic aquifer. The third layer encompasses the confined aquifer, primarily composed of the Cambrian Zhangxia Formation, upper segments of the Chaomidian Formation, and Ordovician limestone. Within this region, the major rivers include the Yellow, Xiaoqing, and Yufu Rivers. Originating from the surface runoff of the Jinxiu, Jinyang, and Jinyun Rivers in the mountainous southern area of Jinan, these waters flow into the Wohushan Reservoir, eventually exiting the reservoir’s confines. The locations of the Jinan Spring Catchment and urban spring groups are shown in Figure 1.
Due to the interception of the Yufu River by the reservoir, the natural flow of the Yufu River has been altered, transforming it into a fragmented river system influenced by human intervention. The section of the Yufu River extending from Dongkema Village to Cuima Village falls within a significant seepage zone, where river water infiltrates the ground and recharges the groundwater. This robust seepage zone spans 5560 m in length and 50 m in width. The gradient of the riverbed is 1/500, indicating distinct features of karst landforms. The location of the study area and the section location of the strong seepage zone are shown in Figure 2.

2.2. Geology and Hydrogeology

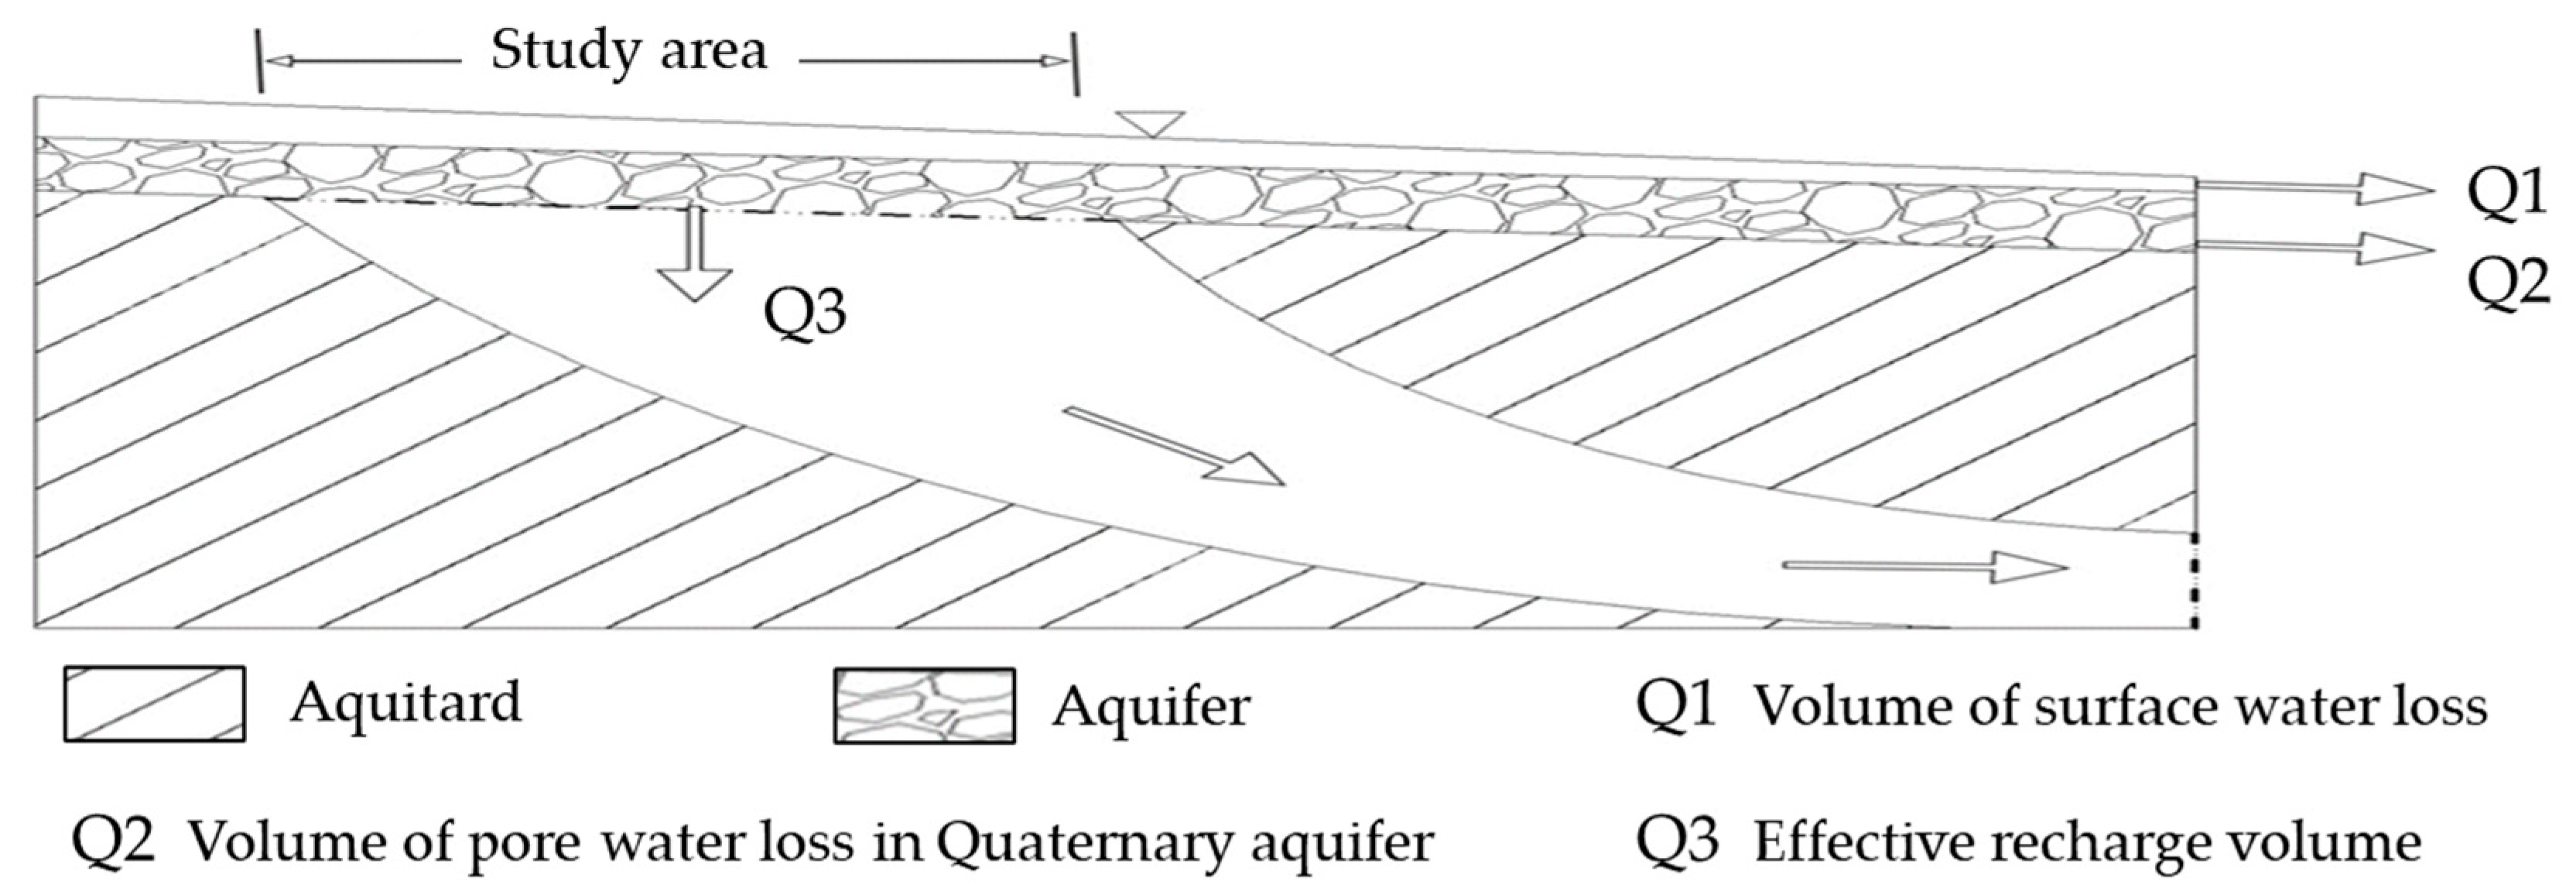
The study area, located at the northern base of Mount Tai, generally exhibits a monoclinal geological structure characterised by Palaeozoic strata that form the primary geological composition. These strata display a gradual northward dip with an inclination angle of approximately 10°. River water, as it flows through the permeable skylight created by the robust seepage zone, supplies the karst aquifer. The vertical extent of the strong seepage zone spans 20–25 m and consists of Quaternary gravel layers. Beyond this lies a layer composed of Cambrian Zhangxia Formation limestone and the Xuzhuang Formation at a depth of 140–180 m, which acts as an aquitard.
The depth of the aquifer progressively increases downstream in alignment with the terrain. The Chaomidian fault in the study area exhibits excellent water conductivity. The Yufu River follows a northern trajectory along the Chaomidian fault zone, originating in Luoerzhuang. Rivers play a pivotal role in providing water to the western region of Jinan. The Cambrian karst water in the study area supplies Ordovician limestone karst water to the Jinan Spring area. This transfer occurs through a water-conducting channel formed by faults, ultimately resulting in the emergence of spring water.
The Wohushan Reservoir has a drainage area of 557 km2, accounting for approximately 67% of the total drainage area. The reservoir has a total designed storage capacity of 118.5 million m3.
The longitudinal geological profile of the Yufu River and a conceptual model of the geological structure are shown in Figure 3 and Figure 4, respectively.
The water table in the study area gradually decreases from south to north, with decreasing values ranging from 3 to 5 m.

2.3. Structure of the Artificial Recharge Project

To ensure an ample recharge water supply, Jinan has undertaken three projects to sustain sufficient water resources during the Yufu River recharge process (Figure 5). Currently, the most prominent initiative is the SNWD Project, which facilitates the provision of Yangtze River water to the Yufu River. This source has an average annual volume of approximately 25 million m3. Additionally, Yellow River water is pumped into the river to recharge the karst aquifer, and the water stored within the reservoir can be released directly into the Yufu River channel through the Wohushan Reservoir. This dual-purpose action not only facilitates flood control before flood events but also serves as a water source for the Yufu River.
The diverse artificial recharge projects collectively form a recharge characteristic model that includes multiple water sources within the Yufu River system. Although these measures ensure sufficient water availability, challenges persist because of the elevated sulphate concentration associated with the SNWD Project. Consequently, artificial recharge efforts for the Yufu River encounter both water management and water quality risks.

2.4. Surface Water and Groundwater Monitoring Systems

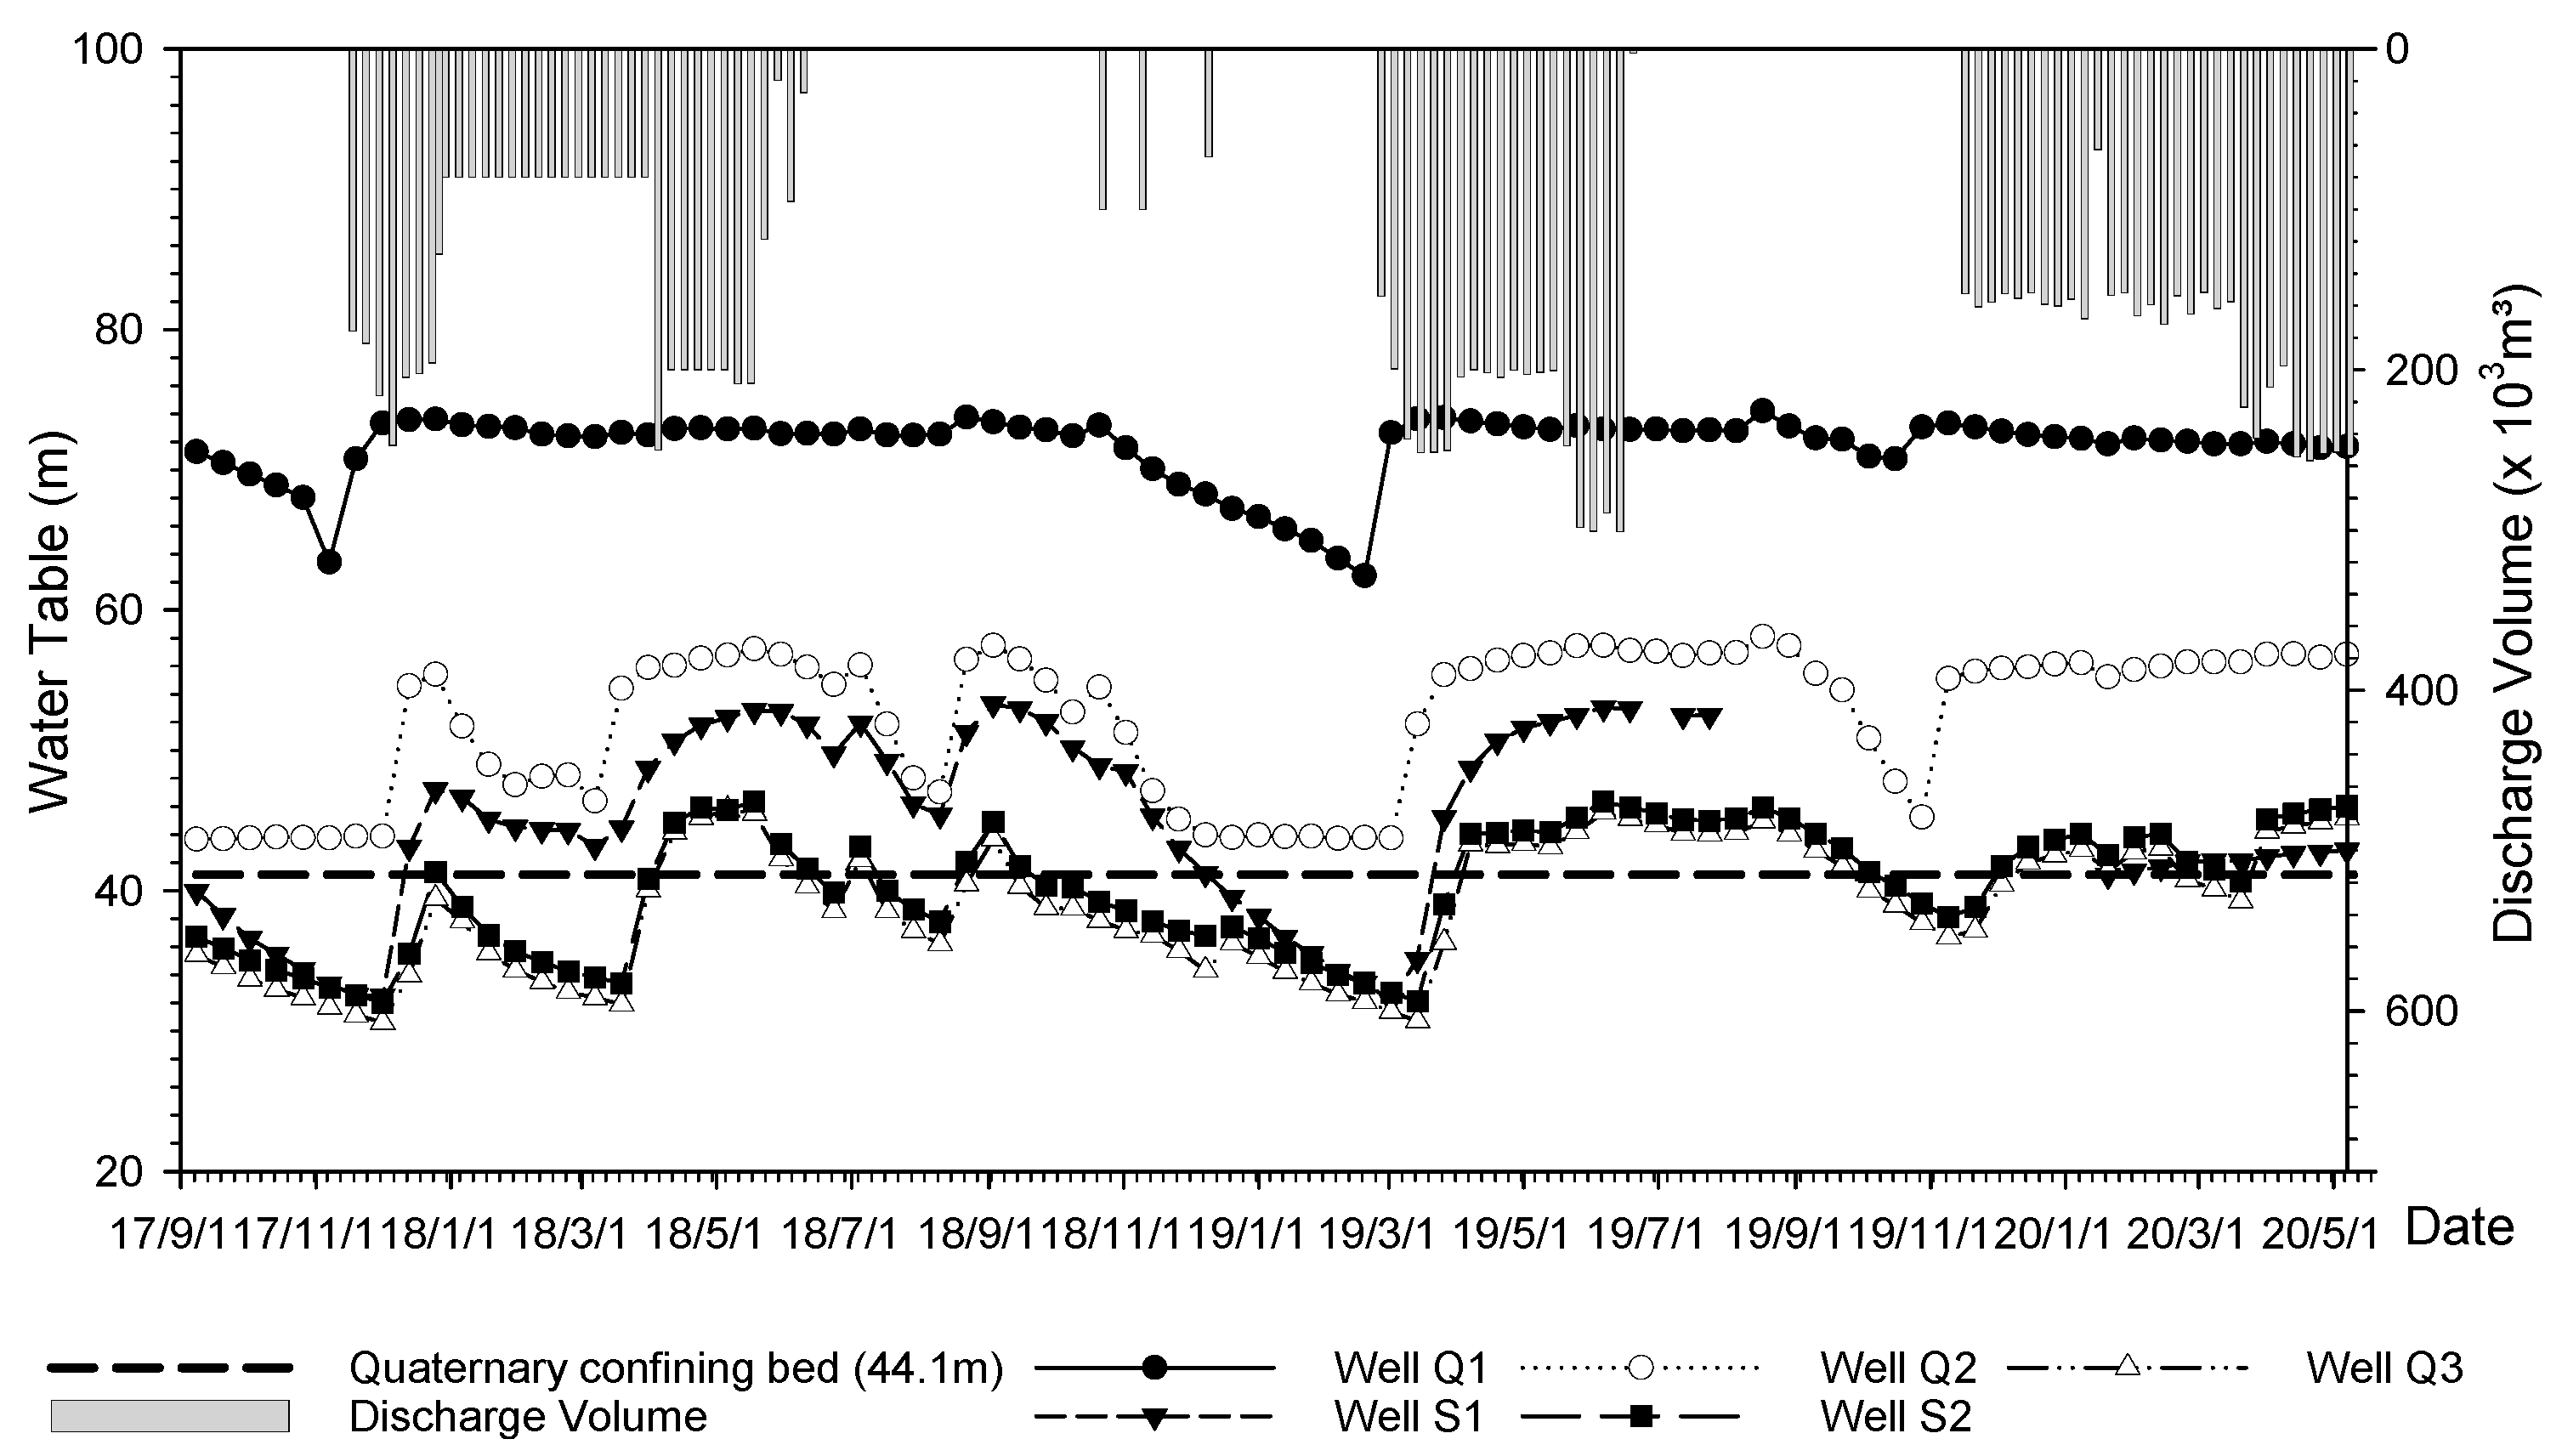
The project incorporates three monitoring sections designated for the surveillance of groundwater recharge (Figure 3). The initial section is similar to that of Dongkema Village. Due to the elevated water table within the Quaternary strata, only one monitoring well (Q1) was established to gauge the Quaternary aquifer. The second section, positioned near the Cuima Bridge, encompasses two monitoring wells: one for the Quaternary pore water (Q2) and the other for the Zhangxia Formation karst water (S1). The third section is situated near the right bank of the Wenshan pumping station and features monitoring wells for Quaternary pore water (Q3) and Ordovician karst water (S2). The project monitored the water table, temperature, and conductivity, facilitated by automated remote monitoring devices. Furthermore, the quantity of water discharged during each reservoir release cycle was documented by either the pumping station or the reservoir management department.
The observation data for the groundwater table is shown in Figure 6.

3. Methods

3.1. Overview

A conceptual model of the regional groundwater flow system was established, followed by the construction of a numerical groundwater flow model. Scenario simulations were conducted to predict the potential pollution risks to the water source. Multiple groundwater extraction schemes have been designed to enhance groundwater circulation and expedite TDS dilution, thereby mitigating water source quality risks. Various schemes have been evaluated with respect to their economic benefits and ecological and environmental risks, which is expected to facilitate the selection of an optimal scheme.
The study framework is shown in Figure 7.

3.2. Conceptual Model of Groundwater Flow System

The aquifer system of the Jinan Spring area comprises two parts: a Quaternary porous media aquifer and a karst fissure aquifer. The top is an unconfined aquifer composed mainly of sandstone and gravel (representing the Quaternary in the northern region). A low-permeability aquifer composed of clay underlies the unconfined aquifer, while the bottom unit consists of Cambrian and Ordovician strata, constituting a confined aquifer. The geographical boundaries are demarcated by the Mashan and Dongwu faults in the west and east, respectively.

3.3. Numerical Model

3.3.1. Spatiotemporal Numerical Discretization

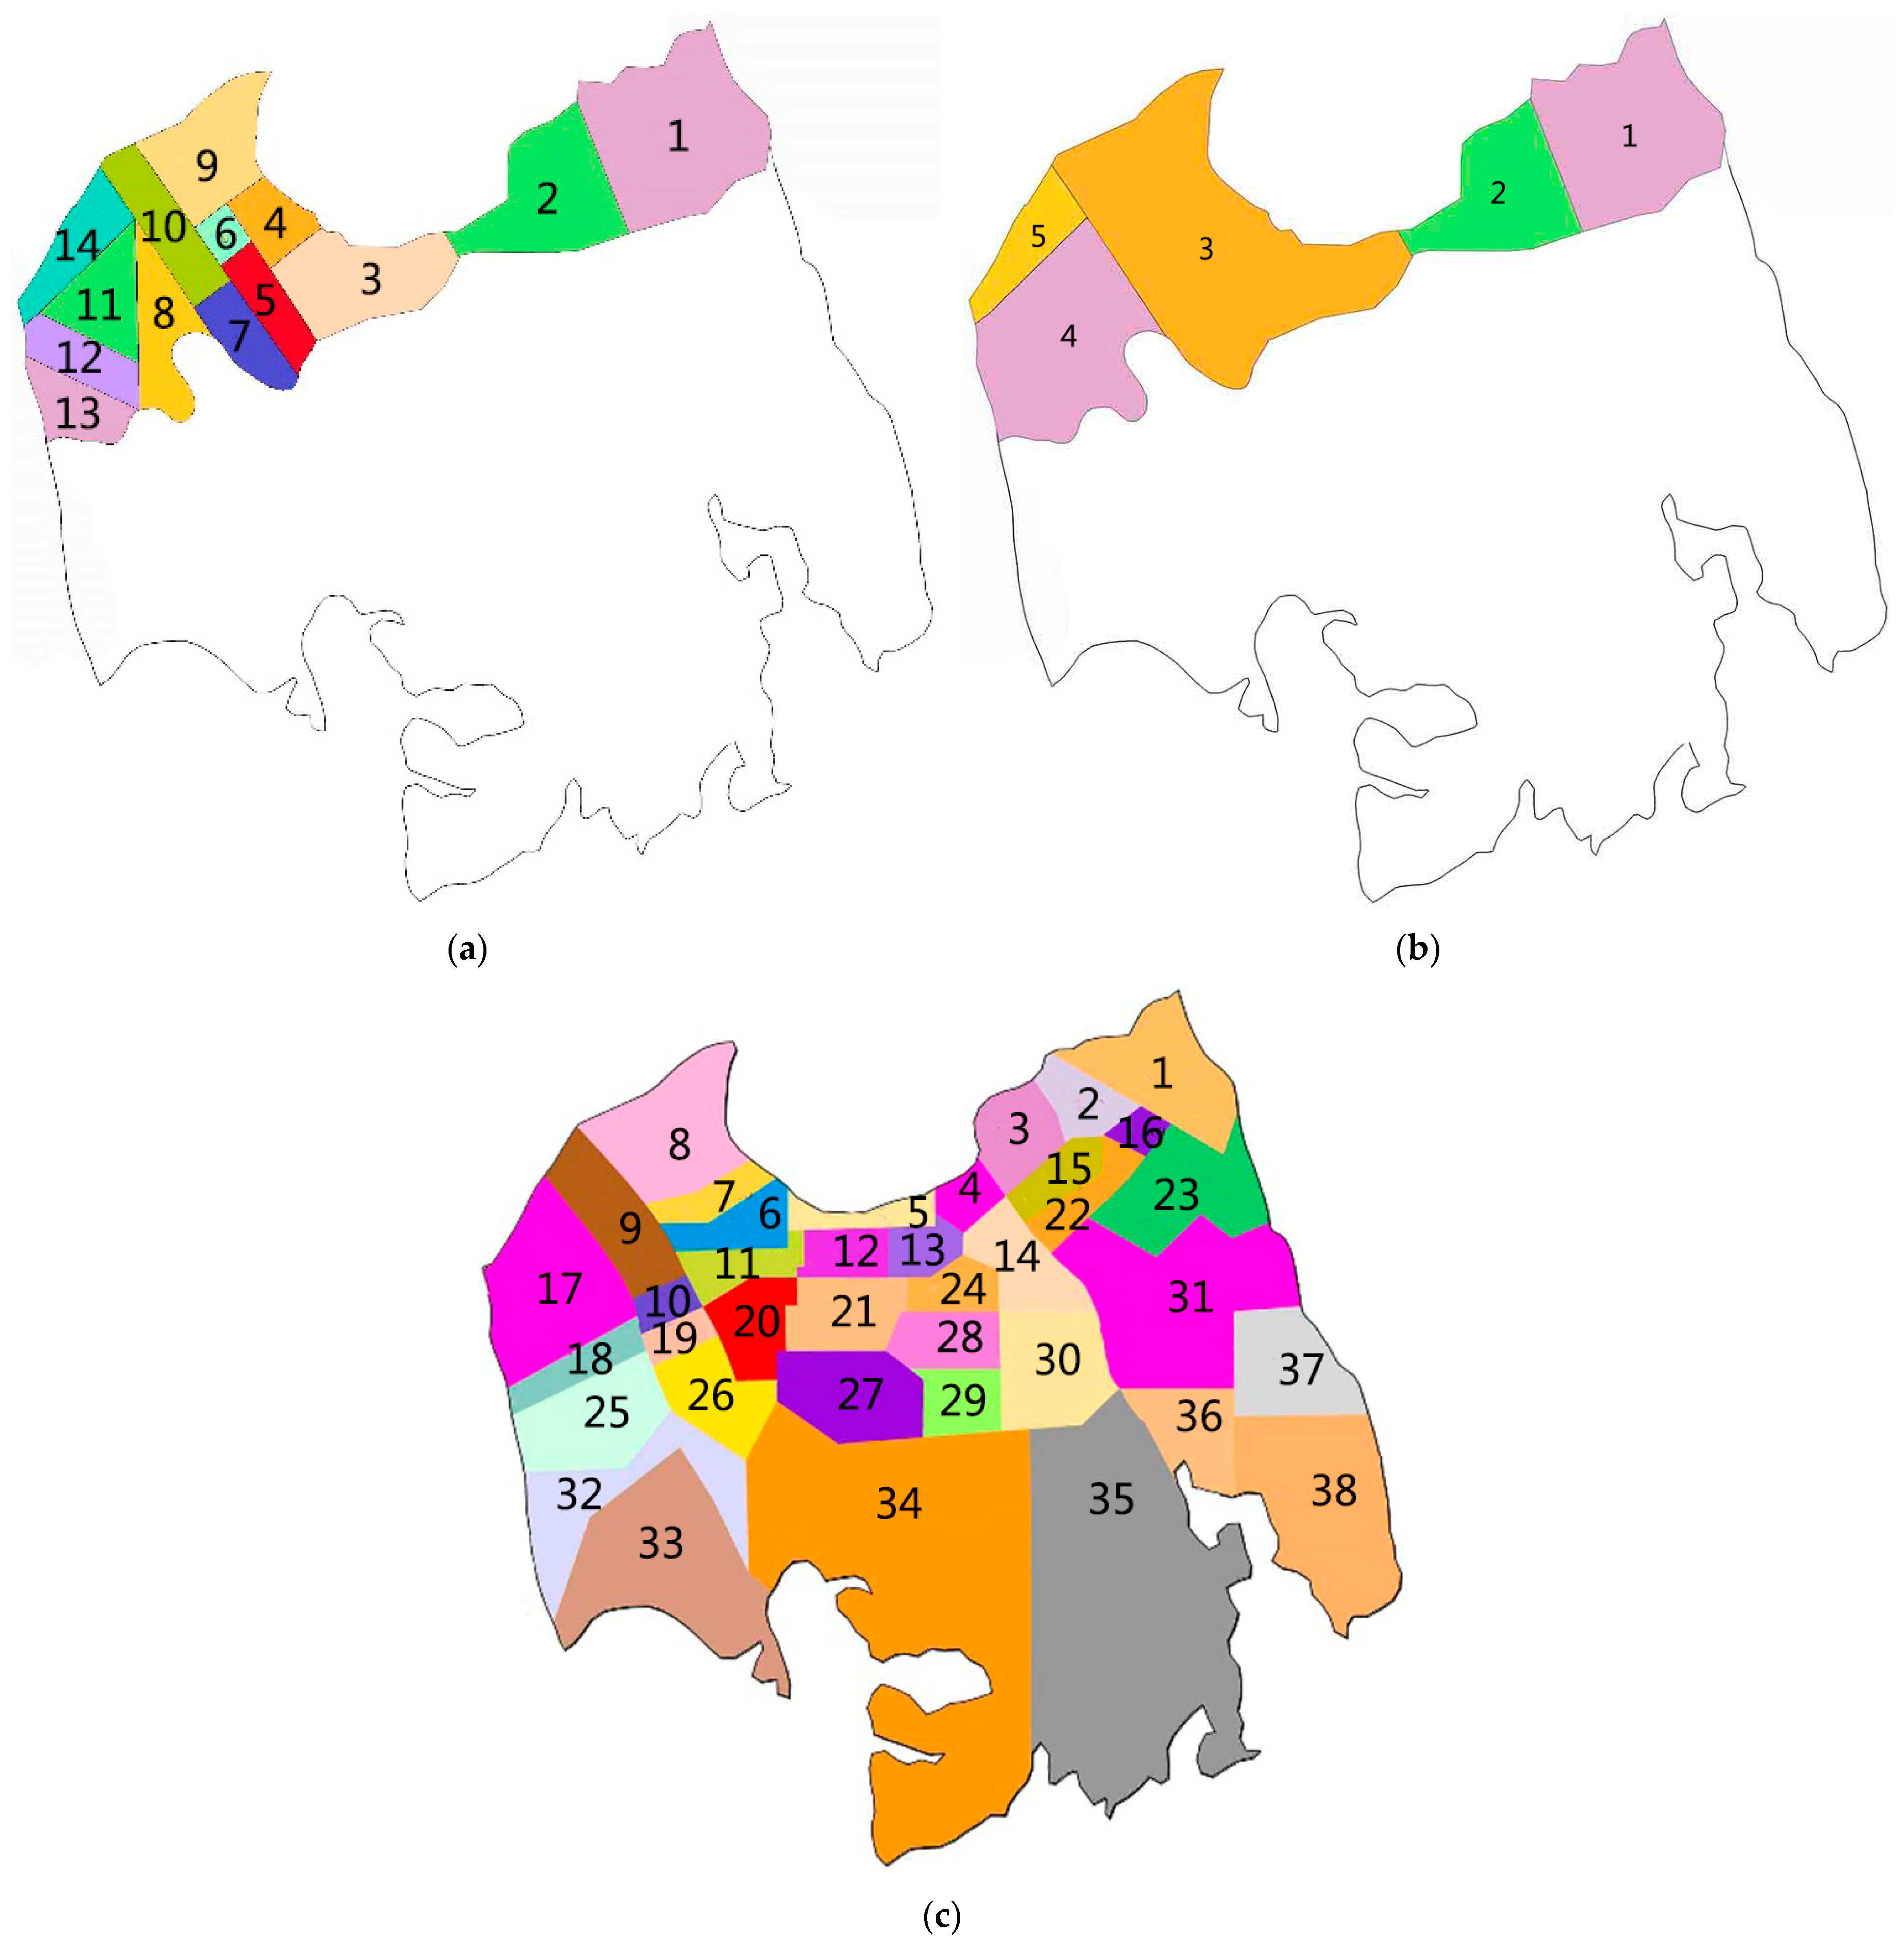
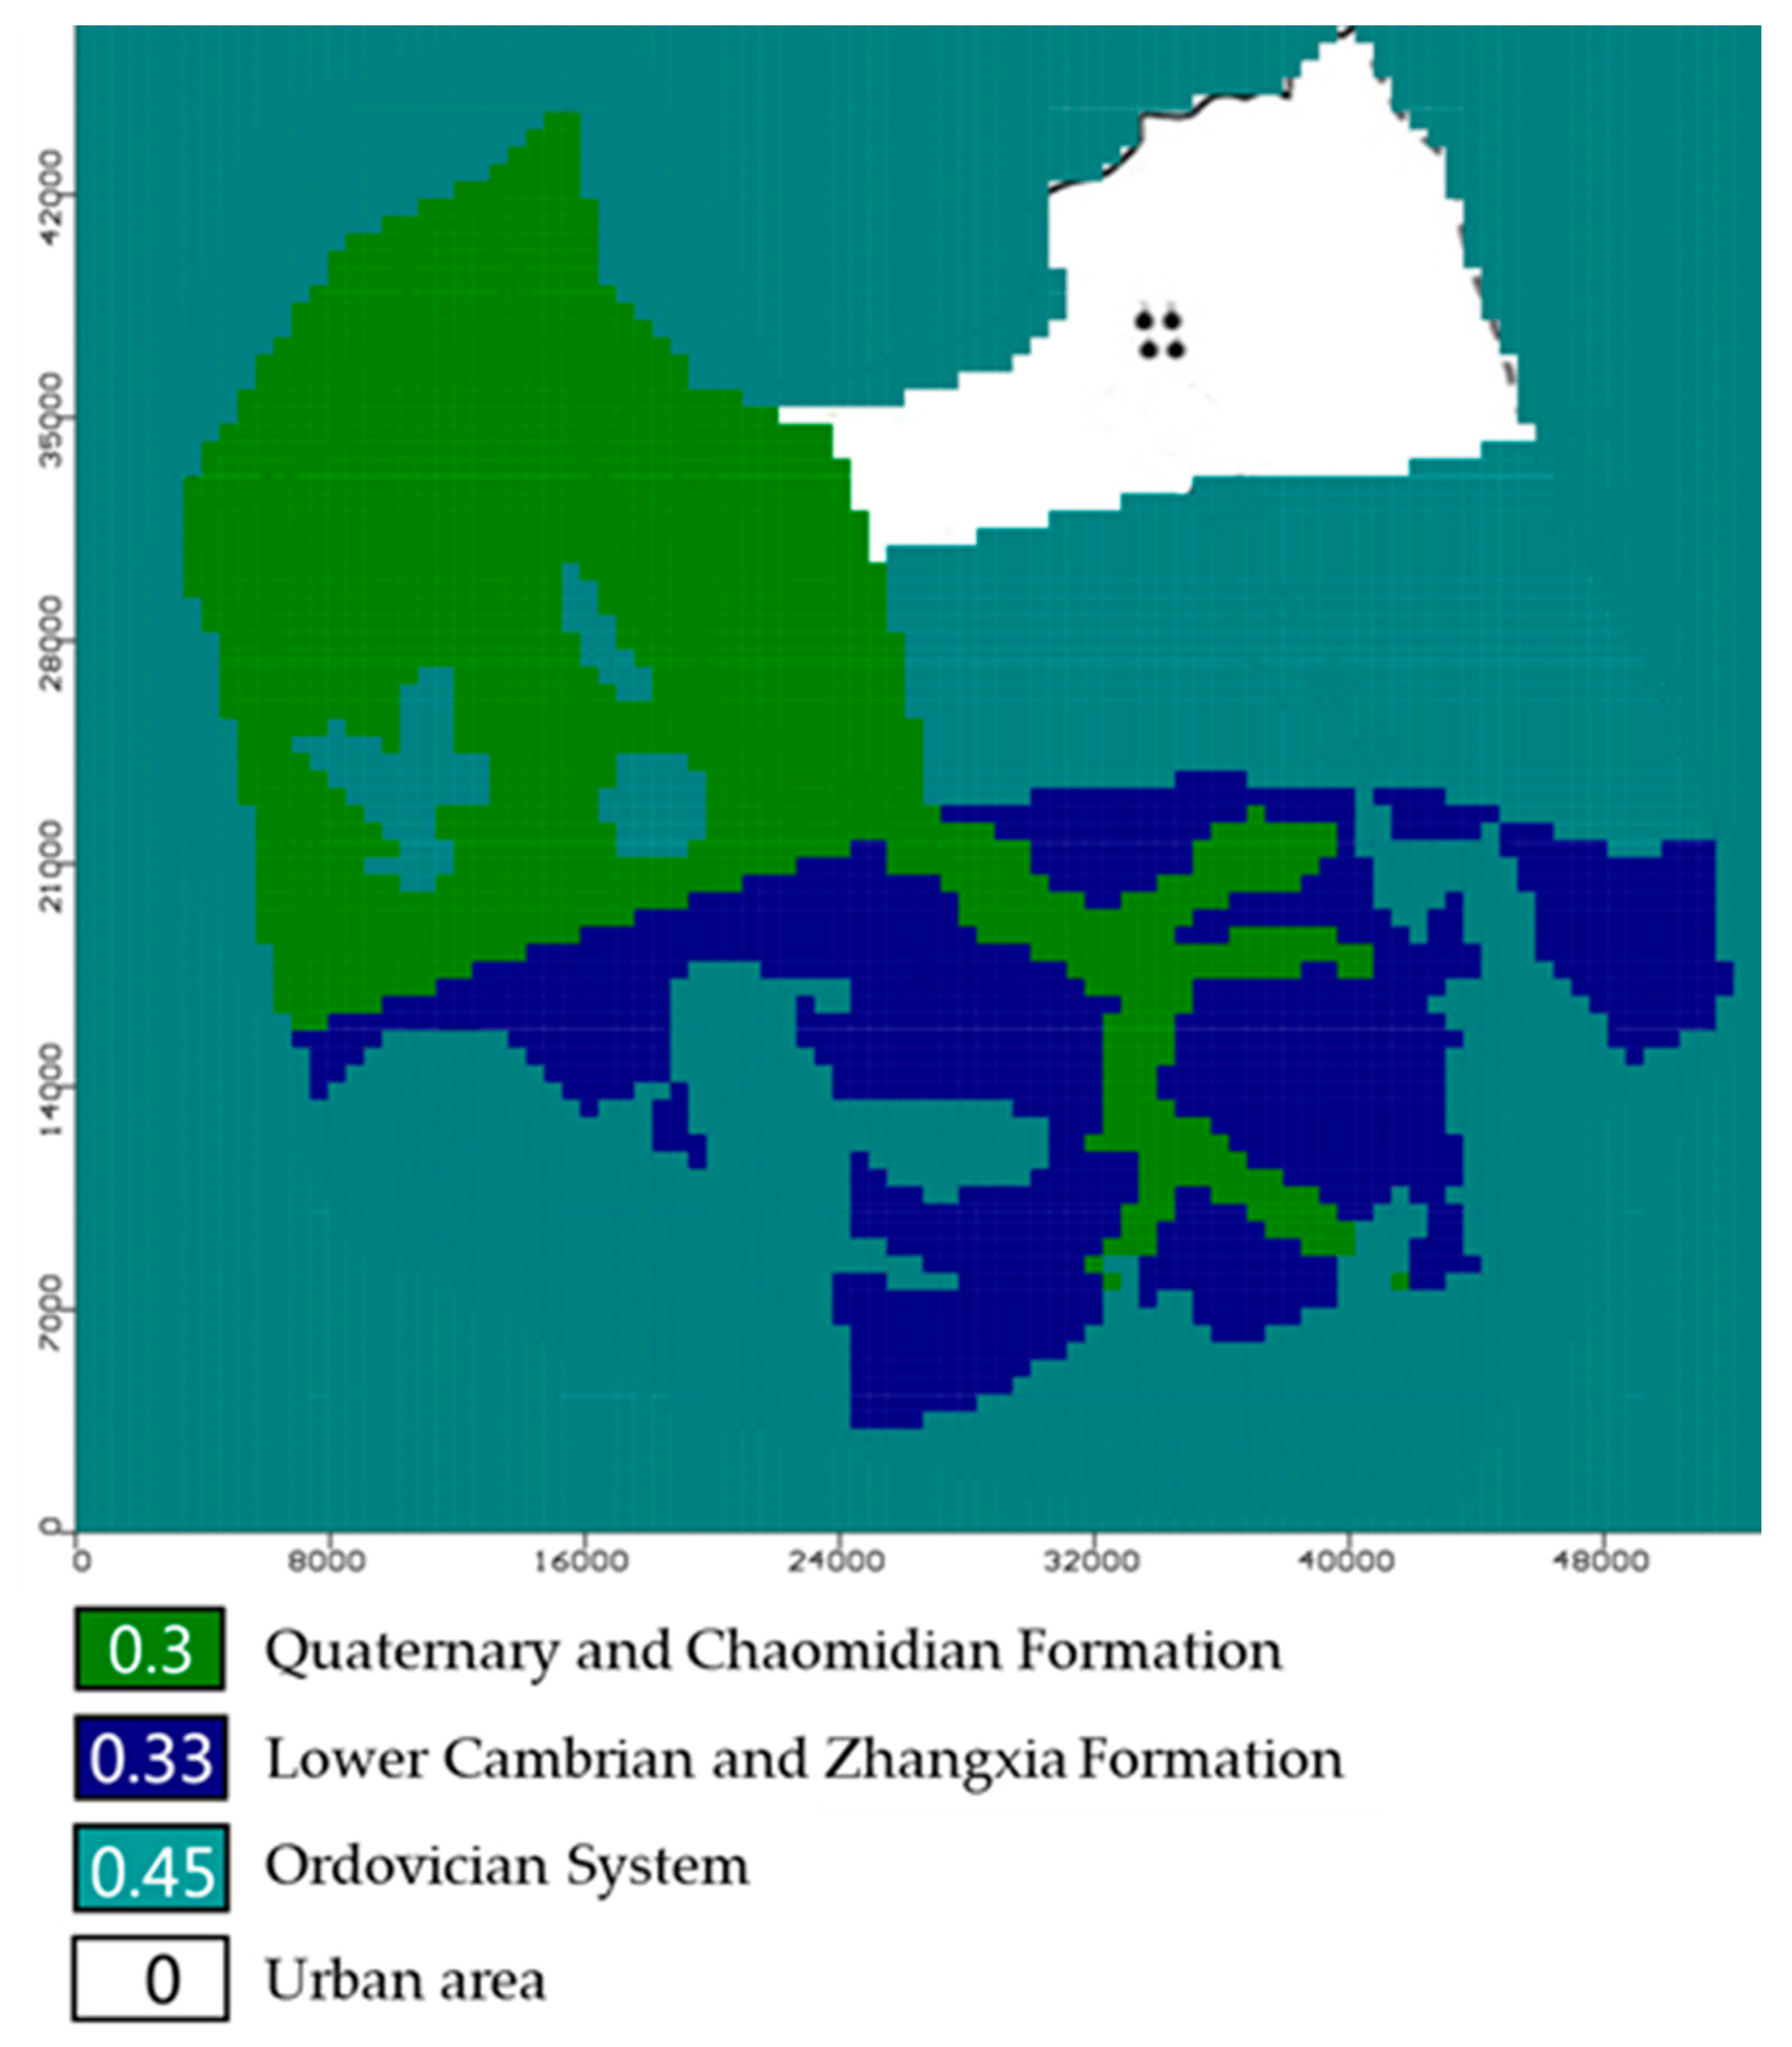
Groundwater, along with its changing quality within the study field, was simulated by linking MODFLOW with MT3DMS or PODMT3DMS [34], respectively. The 1315 km2 area was horizontally discretized into a grid of 100 × 100 cells. Vertically, it was divided into three layers, with elevations ranging from −578 to 763 m a.s.l. The spatial distribution of the thickness of each layer was derived from drilling data, geological maps, and remote sensing data. Hydraulic parameters such as the permeability coefficient (K), specific yield (Sy), and specific storage (Ss) were assigned based on the collected drilling data and pumping test results. The spatial partitioning of the hydraulic parameters of each layer is shown in Figure 8.
The simulation timeframe was divided into three phases. The first phase (1 October 2012 to 30 September 2013) was set for model calibration, involving a comparison of simulated head values with monitored ones. The second phase (1 October 2013–20 September 2014) served for model validation. The third phase (November 2017–November 2027) involved predicting the impact of river water recharge on groundwater under different scenarios.

3.3.2. Boundary Conditions

The faults demarcate the northern, western, and eastern boundaries, which were set as impermeable barriers. The southern boundary was set as an impermeable barrier because the Cambrian metamorphic rocks in the area south of the study area have poor water, and it is difficult to recharge the aquifer of the study area to the south. Surface water and groundwater interconnections allow the assignment of water head boundaries, with the measured river water level data applied. Precipitation infiltration, river seepage, and phreatic evaporation at the top of the surface were considered. The mean precipitation amounts for the two stress periods were incorporated (731 and 497 mm, respectively), and precipitation infiltration was calculated by multiplying the precipitation quantities and infiltration coefficients (Figure 9).

3.3.3. Initial Conditions

The groundwater contour map was imported into the model and combined with the observed water table data from the monitoring wells. The initial groundwater flow field was formed through spatial interpolation as the initial condition for model calculation. The initial flow field data selected for this model were obtained from water table data measured on 1 October 2012.
According to reference literature and water quality data, the initial value of TDS in the model was set to 500 mg/L [35], and the TDS values of Yufu River water and precipitation were set to specific fixed values of 1035 and 31.8 mg/L, respectively.
In this context, the groundwater infiltration and recharge project was assumed to have been conducted for 10 years, and according to the TDS background level (about 1000 mg/L) of SNWD Project water, the TDS concentration of the recharged water was assumed to be 1000 mg/L (Standard III groundwater quality). An assessment of groundwater pollution risk levels ensues.

3.4. Model Calibration and Validation

The calibrated parameters are listed in Table 1, Table 2 and Table 3. The three layers, from top to bottom, were divided into 14, 5, and 38 zones, respectively. In unconfined aquifers characterised by a predominant pebble-gravel sediment layer, the horizontal hydraulic conductivity (Kh) ranges from 3 to 18 m/day, with the vertical hydraulic conductivity (Kv) typically being an order of magnitude lower than Kh. The specific yield (Sy) varies within the range of 0.03 to 0.18 for this setting. Kv is notably lower in aquitards, ranging from three to four orders of magnitude lower than that in unconfined aquifers. In confined aquifers, Kh ranges from 0.15 to 120 m/day.
The calibration period spanned from 1 October 2012 to 30 September 2013, while the validation period was extended from 1 October 2013 to 30 September 2014, encompassing the subsequent hydrological year. The model parameters and boundary conditions were adjusted using a trial-and-error method, and the developed numerical groundwater flow model was progressively refined to better emulate the actual hydrodynamic field. Notably, the lithological parameters of the model were optimised to align more closely with the real hydrogeological conditions. The fitting results for both the calibration and validation periods are shown in Figure 10 and Figure 11, respectively. The commendable agreement between the simulated and measured values confirmed the reliability and precision of the model.

4. Results and Discussion

4.1. TDS Risk and Optimisation Strategy Analysis

Through the analysis of the data in Figure 6, a direct correlation exists between the water table in the monitoring well and the volume of water released. When the discharge volume remained consistently above 200,000 m3 for several consecutive days, the water table in the monitoring well remained elevated. Conversely, as the discharge volume decreased, the water table of the monitoring well dropped.
Analysis of long-term TDS monitoring data, spanning from September 2017 to June 2020, as depicted in Figure 12, revealed significant fluctuations in the values of TDS when the reinjection water interacted with the groundwater within the monitoring well. Notably, TDS peaks in brief timeframes coincided with abrupt increases in water release in November 2017, April 2018, and June 2019. These occurrences suggest marked disparities between the quality of the reinjection water and that of the local groundwater, posing a risk to the overall water quality. Although the TDS values decreased over time, they consistently remained higher than the initial groundwater value post-mixing, signifying altered karst water quality due to recharge water–groundwater interactions.
The TDS value of the source water from the SNWD Project considerably surpasses that of local groundwater, with the average sulphate concentration reaching 317 mg/L, 0.268 times higher than the Class III limit stipulated in the “Standard for Groundwater Quality” (GB/T 14848-2017). This elevated sulphate content is a prominent risk factor affecting health and the environment. While reducing sulphate levels in the SNWD Project water below the limit through pretreatment is challenging, leveraging the lower sulphate content in western Jinan karst water (18–65 mg/L) might be a viable option. This involved controlling the SNWD Project’s released water volume as well as mixing and diluting it with local karst water to achieve sulphate levels below the limit. Coupled with supplementary pumping, this strategy accelerates recharge cycles, ultimately achieving the objectives of safeguarding, utilising, and enhancing water quality.
Furthermore, strict sulphate treatment and discharge control measures in the Nansi Lake Basin associated with coal mine effluents in the Shandong segment of the SNWD Project, along with centralised industrial and domestic wastewater treatment, will collectively ensure that the SNWD Project water adheres to regulatory standards.
The notably elevated TDS values in the SNWD water, primarily attributed to excessive sulphate, underscore the choice of TDS as the solute for numerical simulations. This approach highlighted the influence of water recharge from the SNWD Project, with sulphate as a pivotal risk factor for TDS within the karst groundwater of western Jinan.

4.2. Impact of Artificial Groundwater Recharge on TDS Concentration

The ineffective recharge of Quaternary pores or surface water flow was attributed to the rapid flow velocity within the inclined riverbed situated in the foothills. Notably, these dynamics reduce the efficiency of karst water recharge. The timing of the Yufu River’s water release during the dry season was synchronised with the spring discharge patterns in Jinan.
To anticipate the potential repercussions of the artificial recharge initiative on groundwater quality following 10 years of implementation of the SNWD Project, the forecast interval spanned from November 2017 to November 2027. The recharge volumes are listed in Table 4. The primary source of water was the SNWD Project. Taking a conservative approach, it was assumed that all recharge water originated from the SNWD Project. Under this assumption, the projected annual average water release was 22.4 million m3.
Referring to the findings of Wenliang et al. [32], an optimal pumping strategy was established at 200,000 m3 per day, achieving an impressive effective infiltration rate of 67.2%. Consequently, the calculation for the effective infiltration volume corresponding to this scheme was 15.05 million m3.
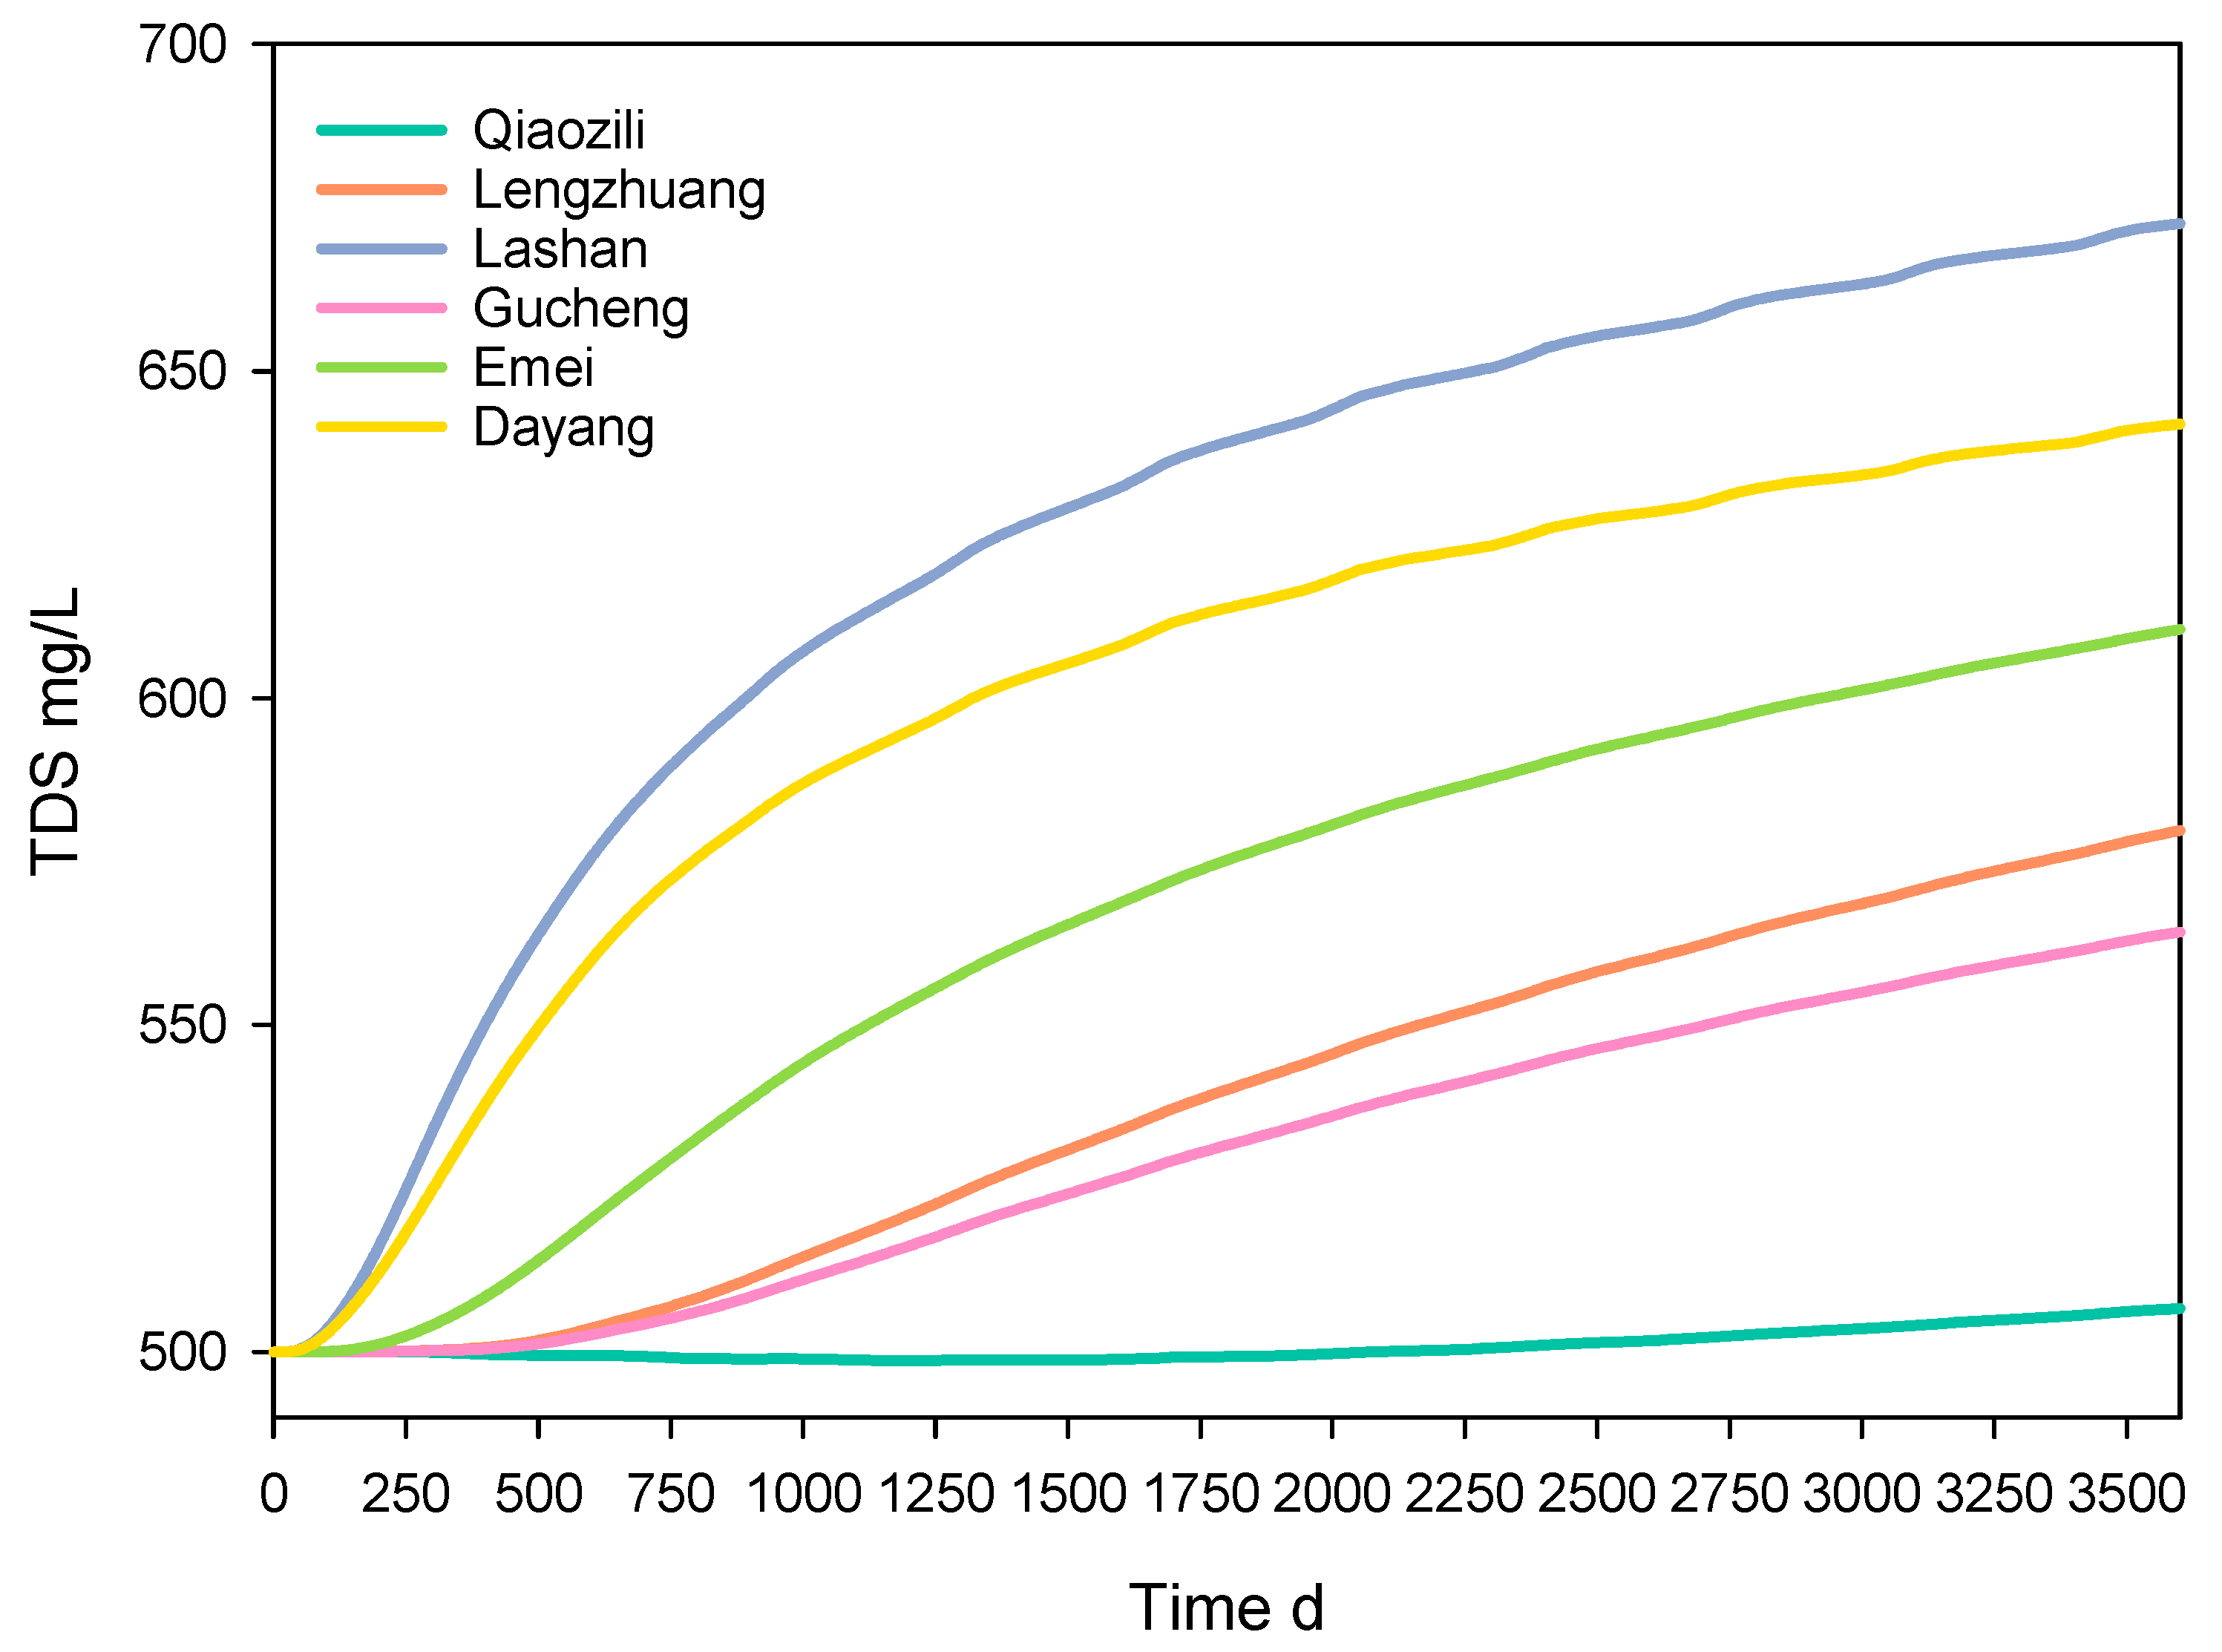
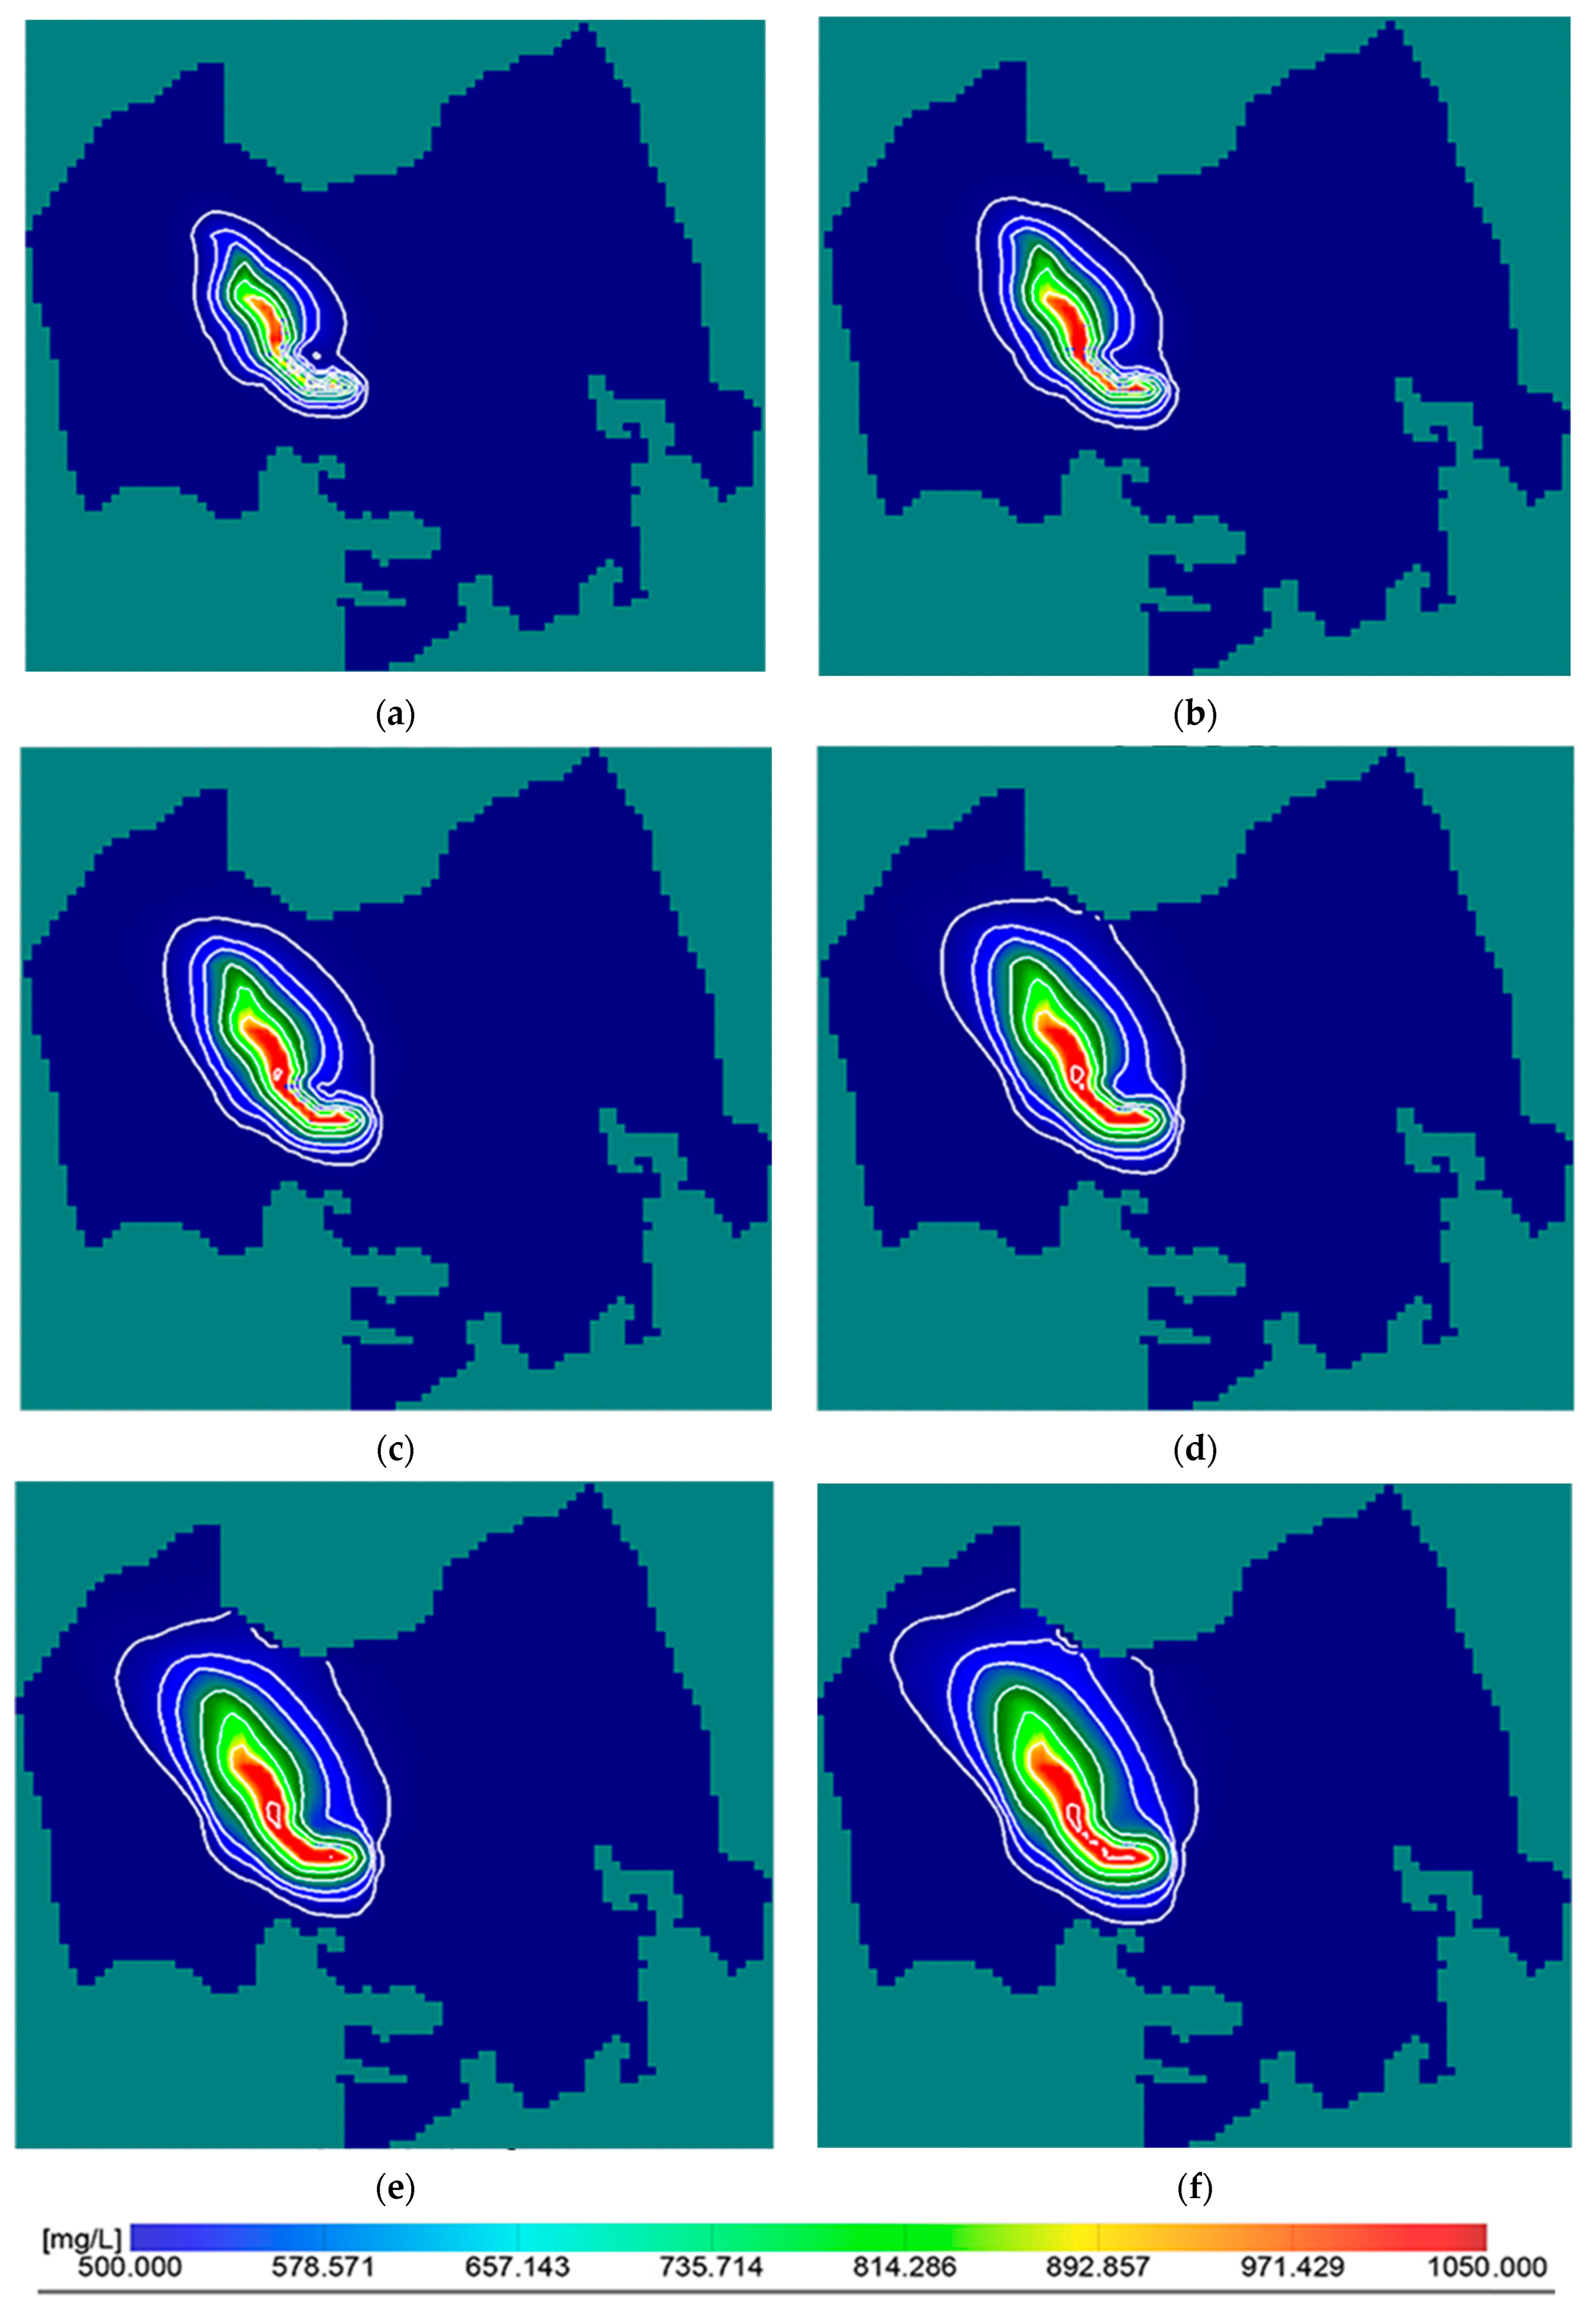
Based on the simulation results (Figure 13 and Figure 14), a discernible trend emerged, in which the TDS concentration field expanded progressively, leading to an eventual increase in the overall TDS concentration near the water source. Notably, the area affected by the 510 mg/L contour line spans approximately 289.3 km2. Conversely, the region delineated by the 1000 mg/L contour line surpassed the water quality standards, occupying an area of 20.25 km2. Consequently, the use of SNWD for karst water recharge, when exclusively recharging without concurrent groundwater pumping, is susceptible to water quality risks.

4.3. Pumping Optimisation and Water Quality Scenario Simulation

4.3.1. Water Source Exploitation Plan

Without significantly increasing the funnel area and affecting the normal gushing of spring water, the pumped volumes of the four water sources, including the western Jinan area (Qiaozili, Lengzhuang, and Gucheng), Emei, Dayang, and Lashan, were set to 190, 60, 20, and 5 thousand m3 per day, respectively [36].
The distributions of the six principal water sources, along with their supply and extraction limitations, are outlined in Table 5.
Within the limitations posed by the water supply capacity and exploitation regulations for the six water sources, three distinct strategies were devised, each predicting varying proportions of exploitation. These strategies were employed to simulate alterations in TDS concentrations and water tables across six water sources under artificial recharge conditions.
Drawing upon the findings of Wenliang et al. [32], the effective recharge volume for the Yufu River artificial recharge initiative is 15.05 million m3. In this context, the designated pumping volumes corresponded to 50, 75, and 90% of the effective infiltration volume. The simulated results of different pumping strategies are presented in Table 6.

4.3.2. Numerical Simulation of Various Pumping Strategies under Recharge Conditions

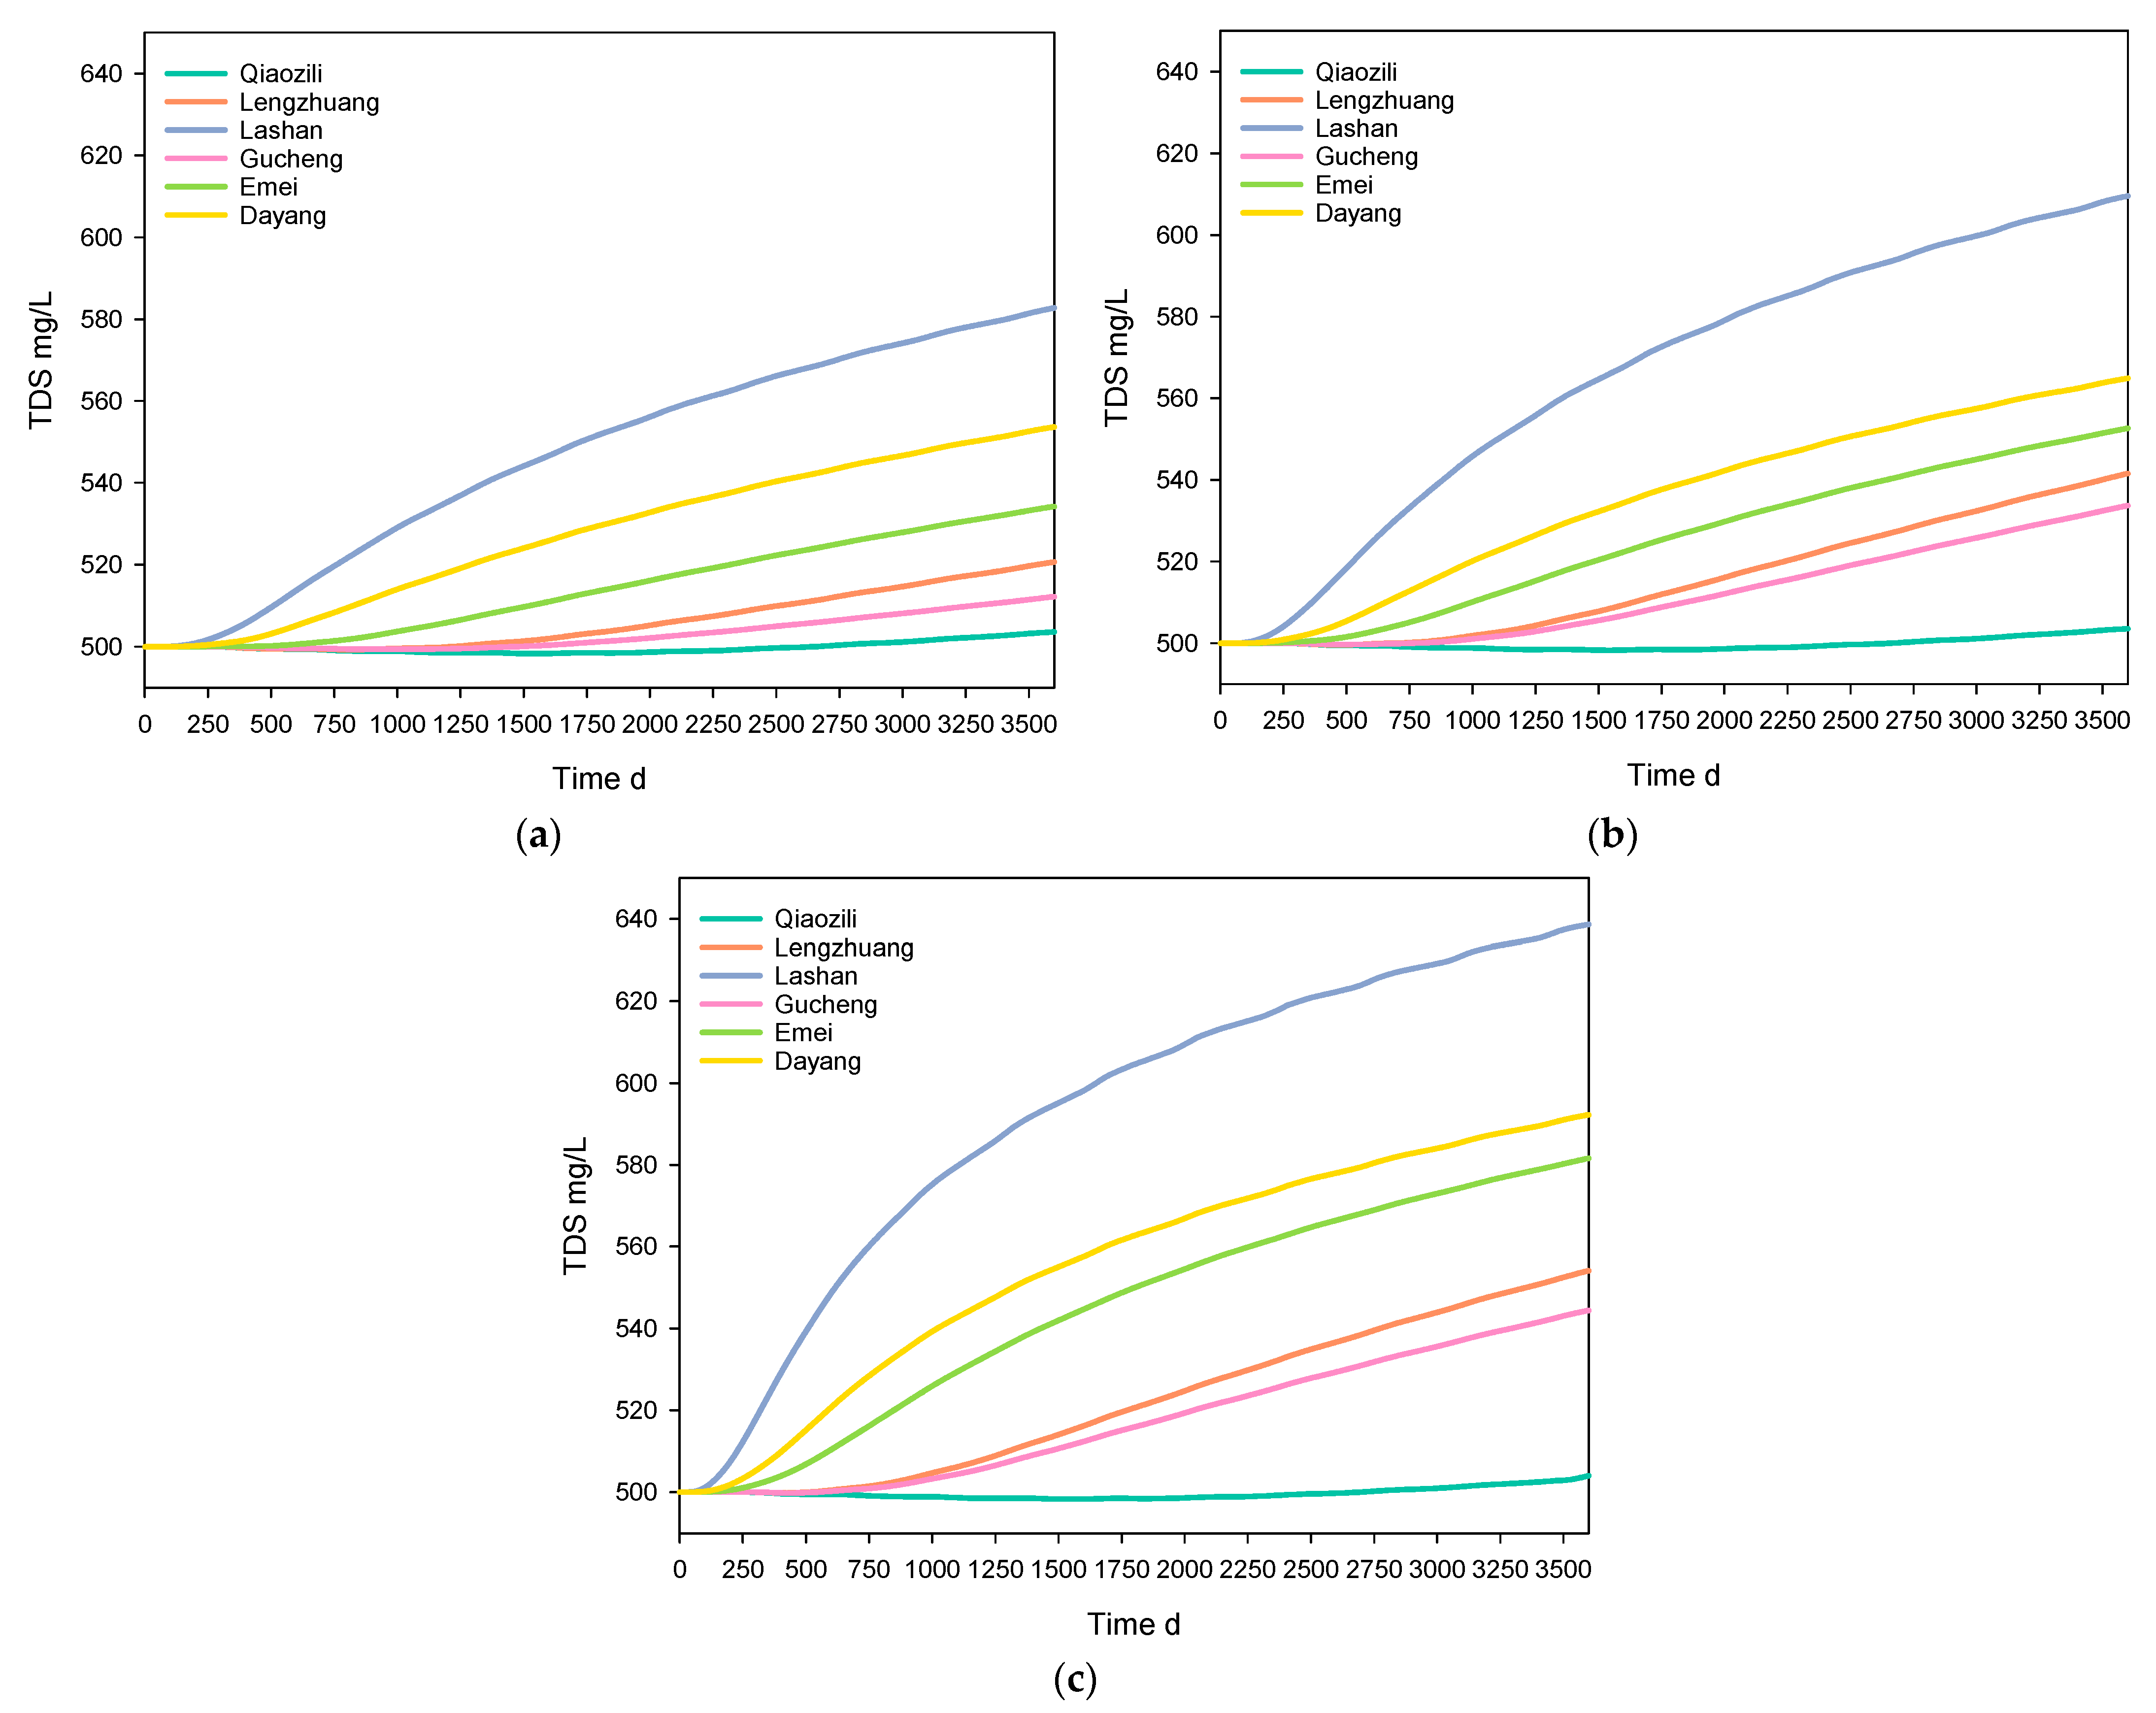
Based on the computational results (Figure 15 and Table 7), the exploitation of water sources emerged as an effective means of reducing water quality risks. Remarkably, the TDS concentration remained relatively stable, even with increased water pumping.
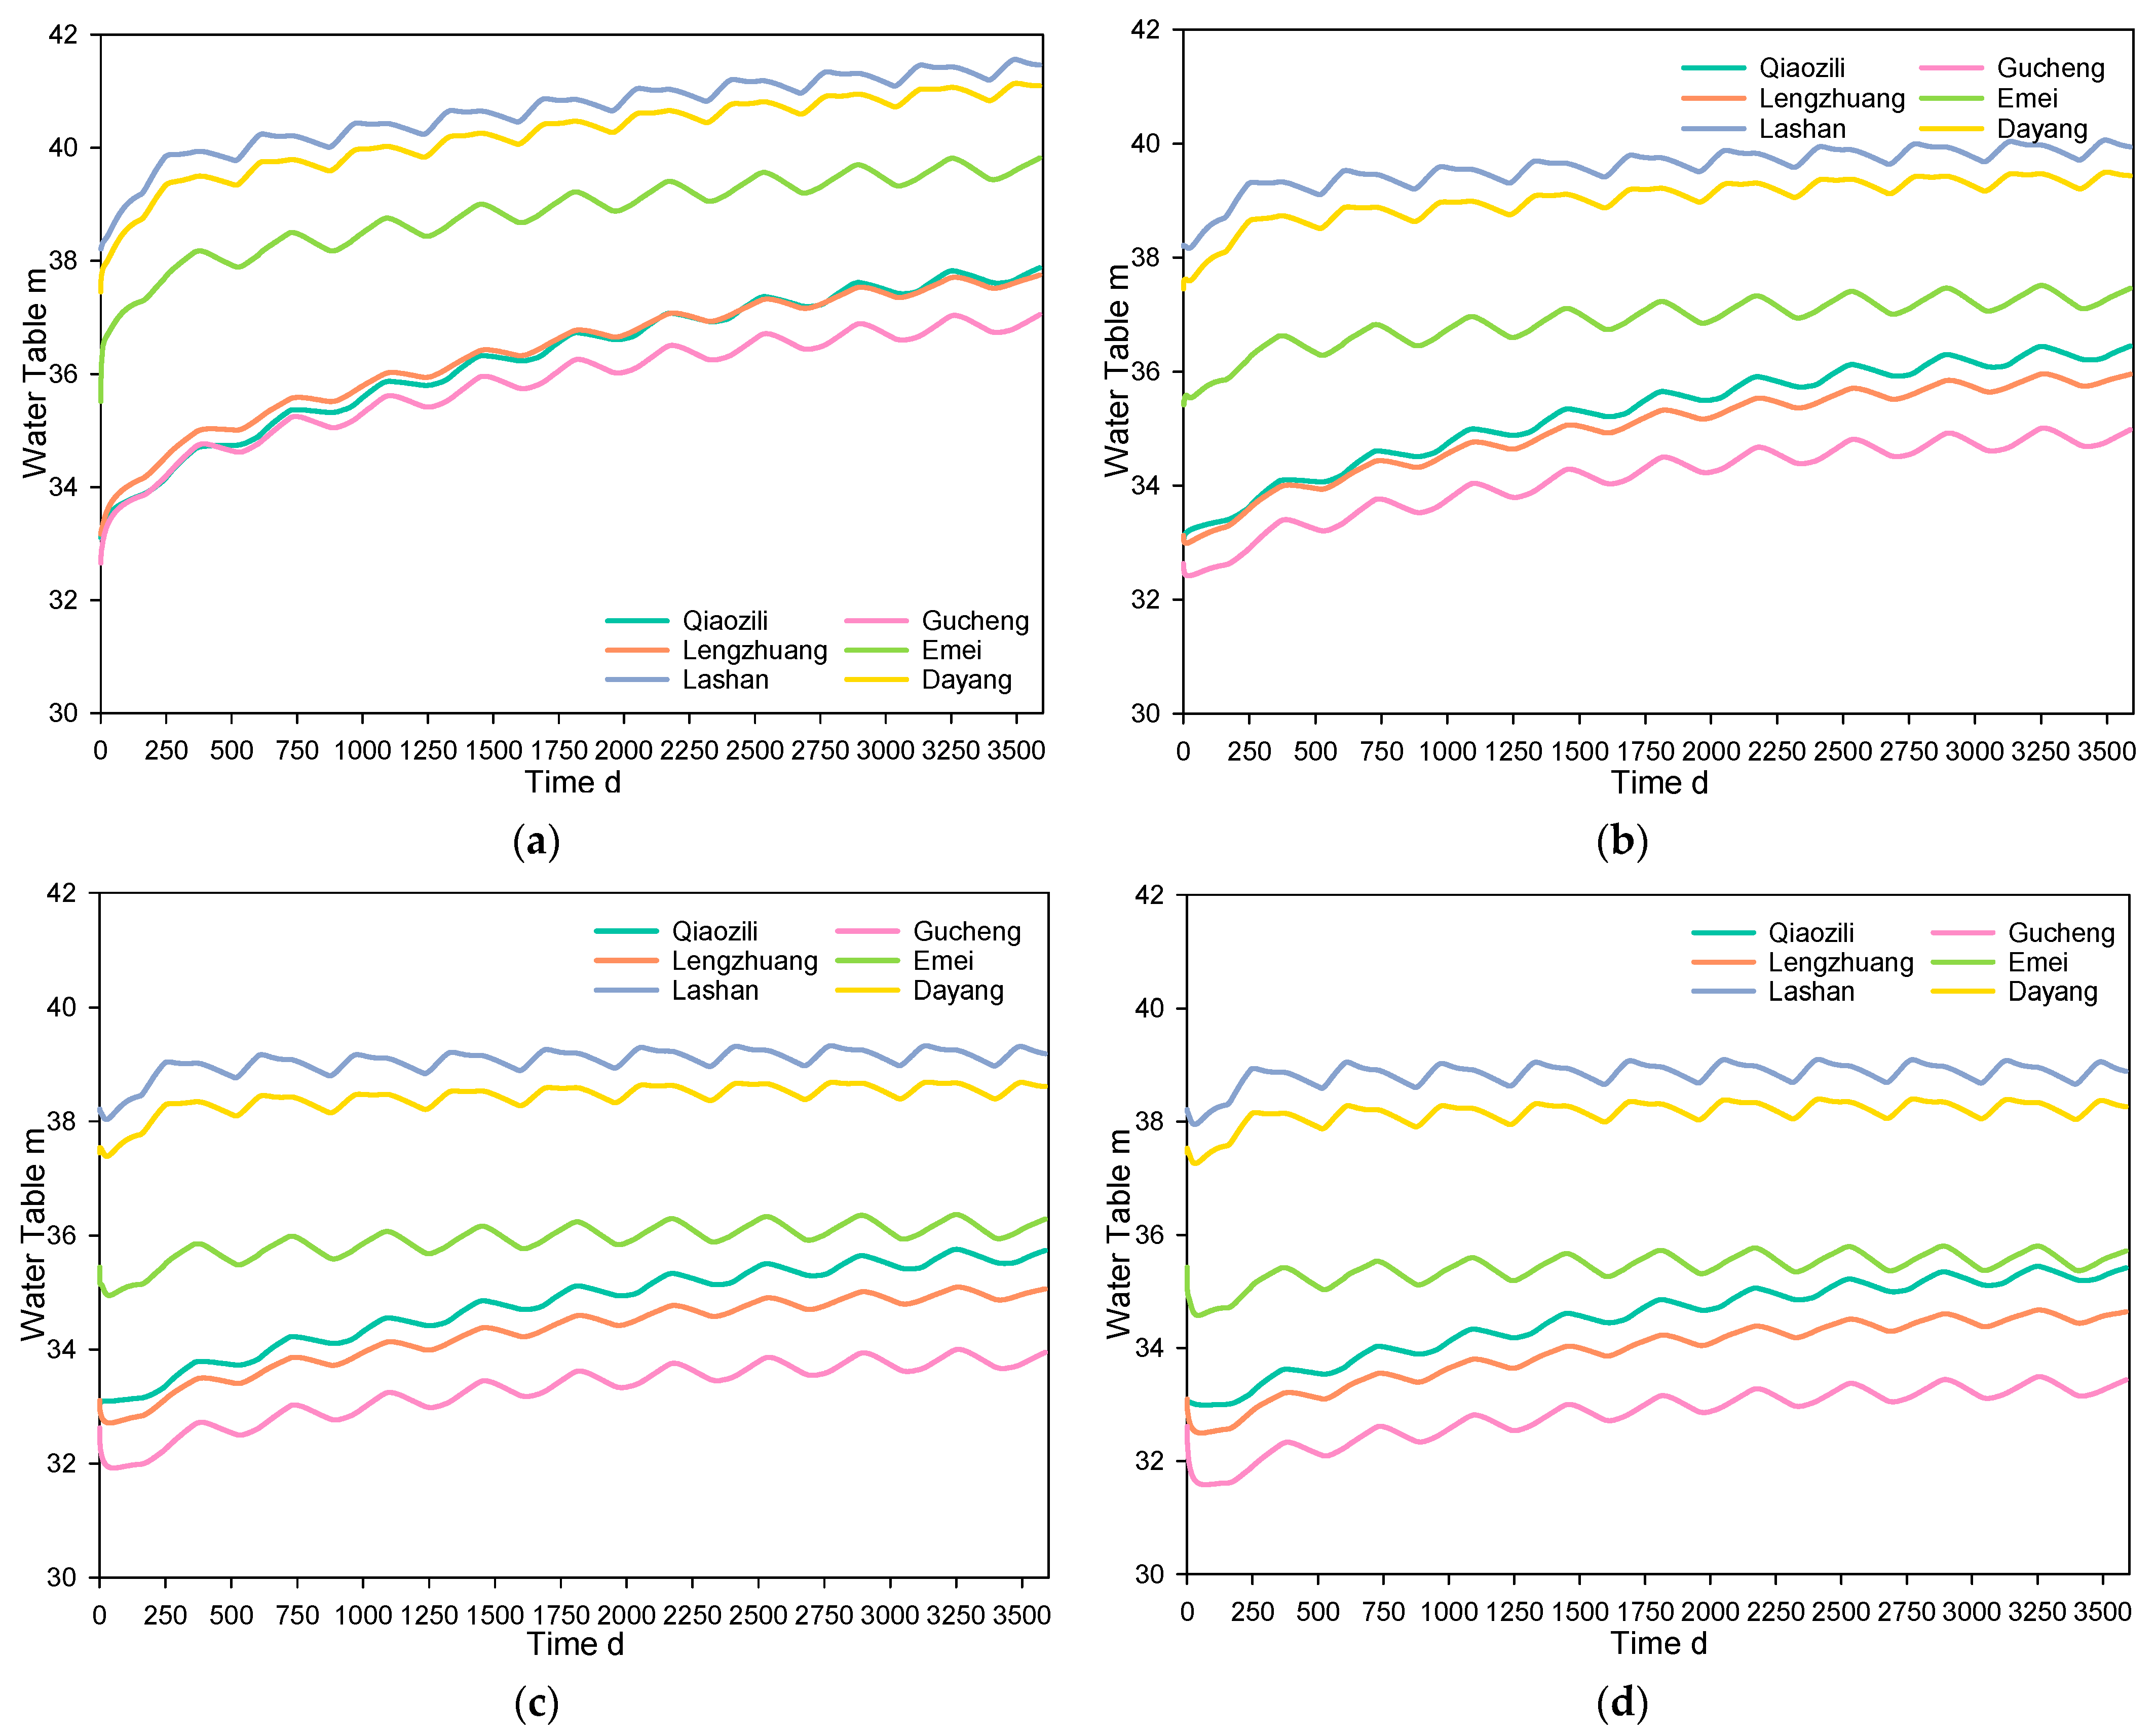
As shown in Figure 16 and Table 8, under the conditions of no exploitation and 50, 75, and 90% exploitation, the water table rose in a wave-like manner without forming a descending funnel, and the water table was 4.17, 2.37, 1.47, and 1.05 m higher than the background value, respectively.
Comparative analysis of the computational results revealed that the TDS concentration experienced the most substantial reduction under the 90% pumping scenario. Simultaneously, the average water table decreased by 1.05 m. Critically, this reduction does not culminate in the formation of a descending funnel, thus adhering to the water table control requisites. Overall, this strategy is recommended.
The predictive outcomes closely aligned with the tracer test findings of previous studies, such as those of Qin et al. [37,38]. Notably, these tracer test results indicate that the principal impact region of the Yufu River source was aligned with the direction of the Chaomidian fault. It is estimated that the proportion of groundwater that is recharged by rivers can reach 48%.

4.4. Limitations of the Model

Numerical models can be used to optimise recharge volume and evaluate recharge performance; however, there are still some limitations. First, the complexities of small-scale geology, such as preferential flow paths, cannot be resolved or described appropriately using large-scale models. For large-scale models, topographically driven flow can be well represented but may not adequately capture localised regional hydraulic responses. Second, the range of springs is relatively large. In addition to centralised water sources, there are limited statistics on the exploitation of groundwater in rural areas for domestic use and irrigation. Therefore, human impacts on groundwater may not be fully represented in the models.

5. Conclusions

In this study, numerical simulations were employed to assess the TDS water quality risk arising from the infiltration of SNWD water into the downstream and spring areas of the Yufu River strong seepage zone in the upper reaches of the Jinan Spring region. Building on this foundation, simulations and comparisons were conducted to gauge the divergent impacts of three distinct pumping combinations in the downstream water source area to mitigate TDS water quality risks. The principal findings are summarised as follows:
  • The recharge strategy without concurrent pumping resulted in TDS water quality risks for the six major water sources downstream. Simulation results revealed an expanding TDS concentration field with the ongoing operation of the recharge project, culminating in an overall increase in the TDS concentration near the water source. By the conclusion of the 10-year simulation period, the area influenced by TDS near the water source encompassed 289.3 km2, while the region where water quality is compromised (TDS > 1000 mg/L) spanned 20.25 km2.
  • Water recovery initiatives, apart from ensuring a stable water supply, offer the added advantage of reducing or potentially eliminating the water quality risks associated with recharge. Comparative assessments revealed that under a 90% recovery ratio, the highest efficiency in TDS reduction and the maximum volume of extracted water were attained. Simultaneously, water tables remain stable or even increase slightly, effectively catering to the imperatives of economic and ecological benefits.
This study provides a novel method for addressing the groundwater quality risks caused by artificial recharge. Furthermore, the results shed light on the benefits provided by managed aquifer recharge projects and hint at their potential to resolve the water crisis from the perspective of water quantity as well as quality.

Author Contributions

Introduction, W.L. and J.L.; Study area and project design, J.L. and W.W.; Methods, J.L. and W.L.; Results, W.L., J.L. and W.W.; Conclusion, J.L. and W.W.; Writing—original draft preparation, J.L.; Writing—review and editing, W.W. and W.L. All authors have read and agreed to the published version of the manuscript.

Funding

This study was supported by the Natural Science Foundation of Shandong Province (No. ZR2021ME069), the Water Ecological Civilisation Pilot Science and Technology Support Plan Project, and the Danish Development Agency (DANIDA) in coordination with the DANIDA Fellowship Centre (Grant No. 17-M08-GEU).

Data Availability Statement

The data presented in this study are available upon request from the corresponding author. The data are not publicly available because of privacy and ethical restrictions.

Conflicts of Interest

Author Wenliang Li was employed by the company Shandong Survey and Design Institute of Water Conservancy Co., Ltd. The remaining authors declare that the research was conducted in the absence of any commercial or financial relationships that could be construed as a potential conflict of interest.

References

  1. Dillon, P.; Page, D.; Pavelic, P.; Toze, S.; Vanderzalm, J.; Levett, K.; Stevens, D. Australian Guidelines for Water Recycling: Managing Health and Environmental Risks (Phase 2)—Managed Aquifer Recharge; Natural Resource Management Ministerial Council: Canberra, Australia; Environment Protection and Heritage Council: Adelaide, Australia; National Health and Medical Research Council: Canberra, Australia, 2009. [Google Scholar]
  2. Hannappel, S.; Scheibler, F.; Huber, A.; Sprenger, C. Characterization of European Managed Aquifer Recharge (MAR) Sites—Analysis; DEMEAU Research Project: Dübendorf, Switzerland, 2014. [Google Scholar]
  3. Dillon, P. Future management of aquifer recharge. Hydrogeol. J. 2005, 13, 313–316. [Google Scholar] [CrossRef]
  4. Massmann, G.; Greskowiak, J.; Dünnbier, U.; Zuehlke, S.; Knappe, A.; Pekdeger, A. The impact of variable temperatures on the redox conditions and the behaviour of pharmaceutical residues during artificial recharge. J. Hydrol. 2006, 328, 141–156. [Google Scholar] [CrossRef]
  5. Dillon, P.; Pavelic, P.; Page, D.; Beringen, H.; Ward, J. Managed Aquifer Recharge: An Introduction; Waterlines Report Series No. 13; National Water Commisssion: Canberra, Australia, 2009. [Google Scholar]
  6. Pyne, R.D.G. Aquifer Storage Recovery: A Guide to Groundwater Recharge through Wells, 2nd ed.; Index to Appendices on CD (March 2006); ASR Systems: Gainesville, FL, USA, 2006. [Google Scholar]
  7. Bouwer, H. Artificial recharge of groundwater: Hydrogeology and engineering. Hydrogeol. J. 2002, 10, 121–142. [Google Scholar] [CrossRef]
  8. Stuyfzand, P.J.; Juhàsz-Holterman, M.H.A.; Lange, W.J.D. Riverbank Filtration in the Netherlands: Well Fields, Clogging and Geochemical Reactions; Springer: Dordrecht, The Netherlands, 2006. [Google Scholar]
  9. Page, D.; Dillon, P.; Vanderzalm, J.; Bekele, E.; Barry, K.; Miotlinski, K.; Levett, K. Managed Aquifer Recharge Case Study Risk Assessments; CSIRO: Canberra, Australia, 2011. [Google Scholar]
  10. Alqahtani, A.; Sale, T.; Ronayne, M.J.; Hemenway, C. Demonstration of Sustainable Development of Groundwater through Aquifer Storage and Recovery (ASR). Water Resour. Manag. 2021, 35, 429–445. [Google Scholar] [CrossRef]
  11. Jha, M.K.; Kamii, Y.; Chikamori, K. Cost-effective approaches for sustainable groundwater management in alluvial aquifer systems. Water Resour. Manag. 2009, 23, 219–233. [Google Scholar] [CrossRef]
  12. Zheng, Y.; Ross, A.; Villholth, K.G.; Dillon, P. Managing Aquifer Recharge: A Showcase for Resilience and Sustainability; UNESCO: Paris, France, 2021; Volume 10. [Google Scholar]
  13. Dillon, P.; Stuyfzand, P.; Grischek, T.; Lluria, M.; Pyne, R.; Jain, R.; Bear, J.; Schwarz, J.; Wang, W.; Fernandez, E. Sixty years of global progress in managed aquifer recharge. Hydrogeol. J. 2019, 27, 1–30. [Google Scholar] [CrossRef]
  14. Wang, W.; Zhou, Y.; Sun, X.; Wang, W. Development of managed aquifer recharge in China. Bol. Geol. Min. 2014, 125, 227–233. [Google Scholar]
  15. Olsthoorn, T.; Mosch, M. Fifty years artificial recharge in the Amsterdam dune area. In Management of Aquifer Recharge for Sustainability; CRC Press: Boca Raton, FL, USA, 2020; pp. 29–33. [Google Scholar]
  16. Dillon, P. Water recycling via managed aquifer recharge in Australia. Bol. Geol. Min. 2009, 120, 121–130. [Google Scholar]
  17. De los Cobos, G. The aquifer recharge system of Geneva, Switzerland: A 20 year successful experience. In Management of Aquifer Recharge for Sustainability; CRC Press: Boca Raton, FL, USA, 2020; pp. 49–52. [Google Scholar]
  18. Pyne, R.D.G. Groundwater Recharge and Wells: A Guide to Aquifer Storage Recovery; CRC Press: Boca Raton, FL, USA, 1995. [Google Scholar]
  19. Winter, T.C. Recent advances in understanding the interaction of groundwater and surface water. Rev. Geophys. 1995, 33, 985–994. [Google Scholar] [CrossRef]
  20. Vandenbohede, A.; Houtte, E.V.; Lebbe, L. Groundwater flow in the vicinity of two artificial recharge ponds in the Belgian coastal dunes. Hydrogeol. J. 2008, 16, 1669–1681. [Google Scholar] [CrossRef]
  21. Roy, S.; Sahu, A.S. Effectiveness of basin morphometry, remote sensing, and applied geosciences on groundwater recharge potential mapping: A comparative study within a small watershed. Front. Earth Sci. 2016, 10, 274–291. [Google Scholar] [CrossRef]
  22. Ringleb, J.; Sallwey, J.; Stefan, C. Assessment of managed aquifer recharge through modeling—A review. Water 2016, 8, 579. [Google Scholar] [CrossRef]
  23. Jonoski, A.; Zhou, Y.; Nonner, J.; Meijer, S. Model-aided design and optimization of artificial recharge-pumping systems. Int. Assoc. Sci. Hydrol. Bull. 1997, 42, 937–953. [Google Scholar] [CrossRef]
  24. Chenini, I.; Mammou, A.B. Groundwater recharge study in arid region: An approach using GIS techniques and numerical modeling. Comput. Geosci. 2010, 36, 801–817. [Google Scholar] [CrossRef]
  25. Hashemi, H.; Berndtsson, R.; Persson, M. Artificial recharge by floodwater spreading estimated by water balances and groundwater modelling in arid Iran. Hydrol. Sci. J. 2015, 60, 336–350. [Google Scholar] [CrossRef]
  26. Pokhrel, P.; Zhou, Y.; Smits, F.; Kamps, P.; Olsthoorn, T. Numerical simulation of a managed aquifer recharge system designed to supply drinking water to the city of Amsterdam, The Netherlands. Hydrogeol. J. 2023, 31, 1291–1309. [Google Scholar] [CrossRef]
  27. Kloppmann, W.; Aharoni, A.; Chikurel, H.; Dillon, P.; Gaus, I.; Guttman, J.; Kraitzer, T.; Kremer, S.; Masciopinto, C.; Miotlinski, K. Use of groundwater models for prediction and optimisation of the behaviour of MAR sites. In Water Reclamation Technologies for Safe Managed Aquifer Recharge; IWA Publishing: London, UK, 2012; pp. 311–349. [Google Scholar]
  28. Valley, S.; Landini, F.; Pranzini, G.; Puppini, U.; Scardazzi, M.; Streetly, M. Transient flow modelling of an overexploited aquifer and simulation of artificial recharge measures. In Recharge Systems for Protecting and Enhancing Groundwater Resources, Proceedings of the 5th International Symposium on Management of Aquifer Recharge, ISMAR5; Berlin, Germany; 11–16 June 2005, United Nations Educational, Scientific and Cultural Organization: Paris, France, 2004; pp. 11–16. [Google Scholar]
  29. Xu, H.Z.; Duan, X.M.; Gao, Z.D.; Wang, Q.B.; Li, W.P.; Yin, X.L. Hydrochemical study of karst groundwater in the Jinan Spring catchment. Hydrogeol. Eng. Geol. 2007, 34, 5. [Google Scholar]
  30. Noori, R.; Maghrebi, M.; Jessen, S.; Bateni, S.M.; Heggy, E.; Javadi, S.; Noury, M.; Pistre, S.; Abolfathi, S.; AghaKouchak, A. Decline in Iran’s groundwater recharge. Nat. Commun. 2023, 14, 6674. [Google Scholar] [CrossRef]
  31. Zhang, Z.; Wang, W.; Xiang, H.; Gai, Y.; Li, F. Relationship between Groundwater in Western Jinan and Jinan Spring Area Based on CorrelationDegree of Water Table Fluctuation. J. Chin. Hydrol. 2018, 38, 7. [Google Scholar]
  32. Li, W.; Sun, Q.; Wang, W.; Qu, S.; Zhang, Z.; Xu, Q. Effective water quantity of multi-source water recharging aquifers in Yufuhe River based on groundwater and surface water semi-coupled modelling. Water Supply 2019, 19, 2280–2287. [Google Scholar] [CrossRef]
  33. Zhang, Z.; Wang, W. Managing aquifer recharge with multi-source water to realize sustainable management of groundwater resources in Jinan, China. Environ. Sci. Pollut. Res. 2021, 28, 10872–10888. [Google Scholar] [CrossRef] [PubMed]
  34. Noori, R.; Dodangeh, M.; Baghvand, A.; Hooshyaripor, F.; Klve, B. PODMT3DMS-Tool: Proper orthogonal decomposition linked to the MT3DMS model for nitrate simulation in aquifers. Hydrogeol. J. 2020, 28, 1125–1142. [Google Scholar] [CrossRef]
  35. Xing, L.-T.; Zhang, J.-Z.; Zhou, R.; Liu, L. The Groundwater Environment Capacity in Jinan Springs Basin. China Rural. Water Hydropower 2008, 10, 4. [Google Scholar]
  36. Xu, J.-X.; Xin, L.-T. Numerical Prediction for the Karst Groundwater and Spring Protection in Jinan Karst Spring Region. Geol. Surv. Res. 2008, 31, 5. [Google Scholar]
  37. Guo, Y.; Qin, D.; Li, L.; Sun, J.; Huang, J. A Complicated Karst Spring System: Identified by Karst Springs Using Water Level, Hydrogeochemical, and Isotopic Data in Jinan, China. Water 2019, 11, 947. [Google Scholar] [CrossRef]
  38. Guo, Y.; Qin, D.; Sun, J.; Li, L.; Huang, J. Recharge of River Water to Karst Aquifer Determined by Hydrogeochemistry and Stable Isotopes. Water 2019, 11, 479. [Google Scholar] [CrossRef]
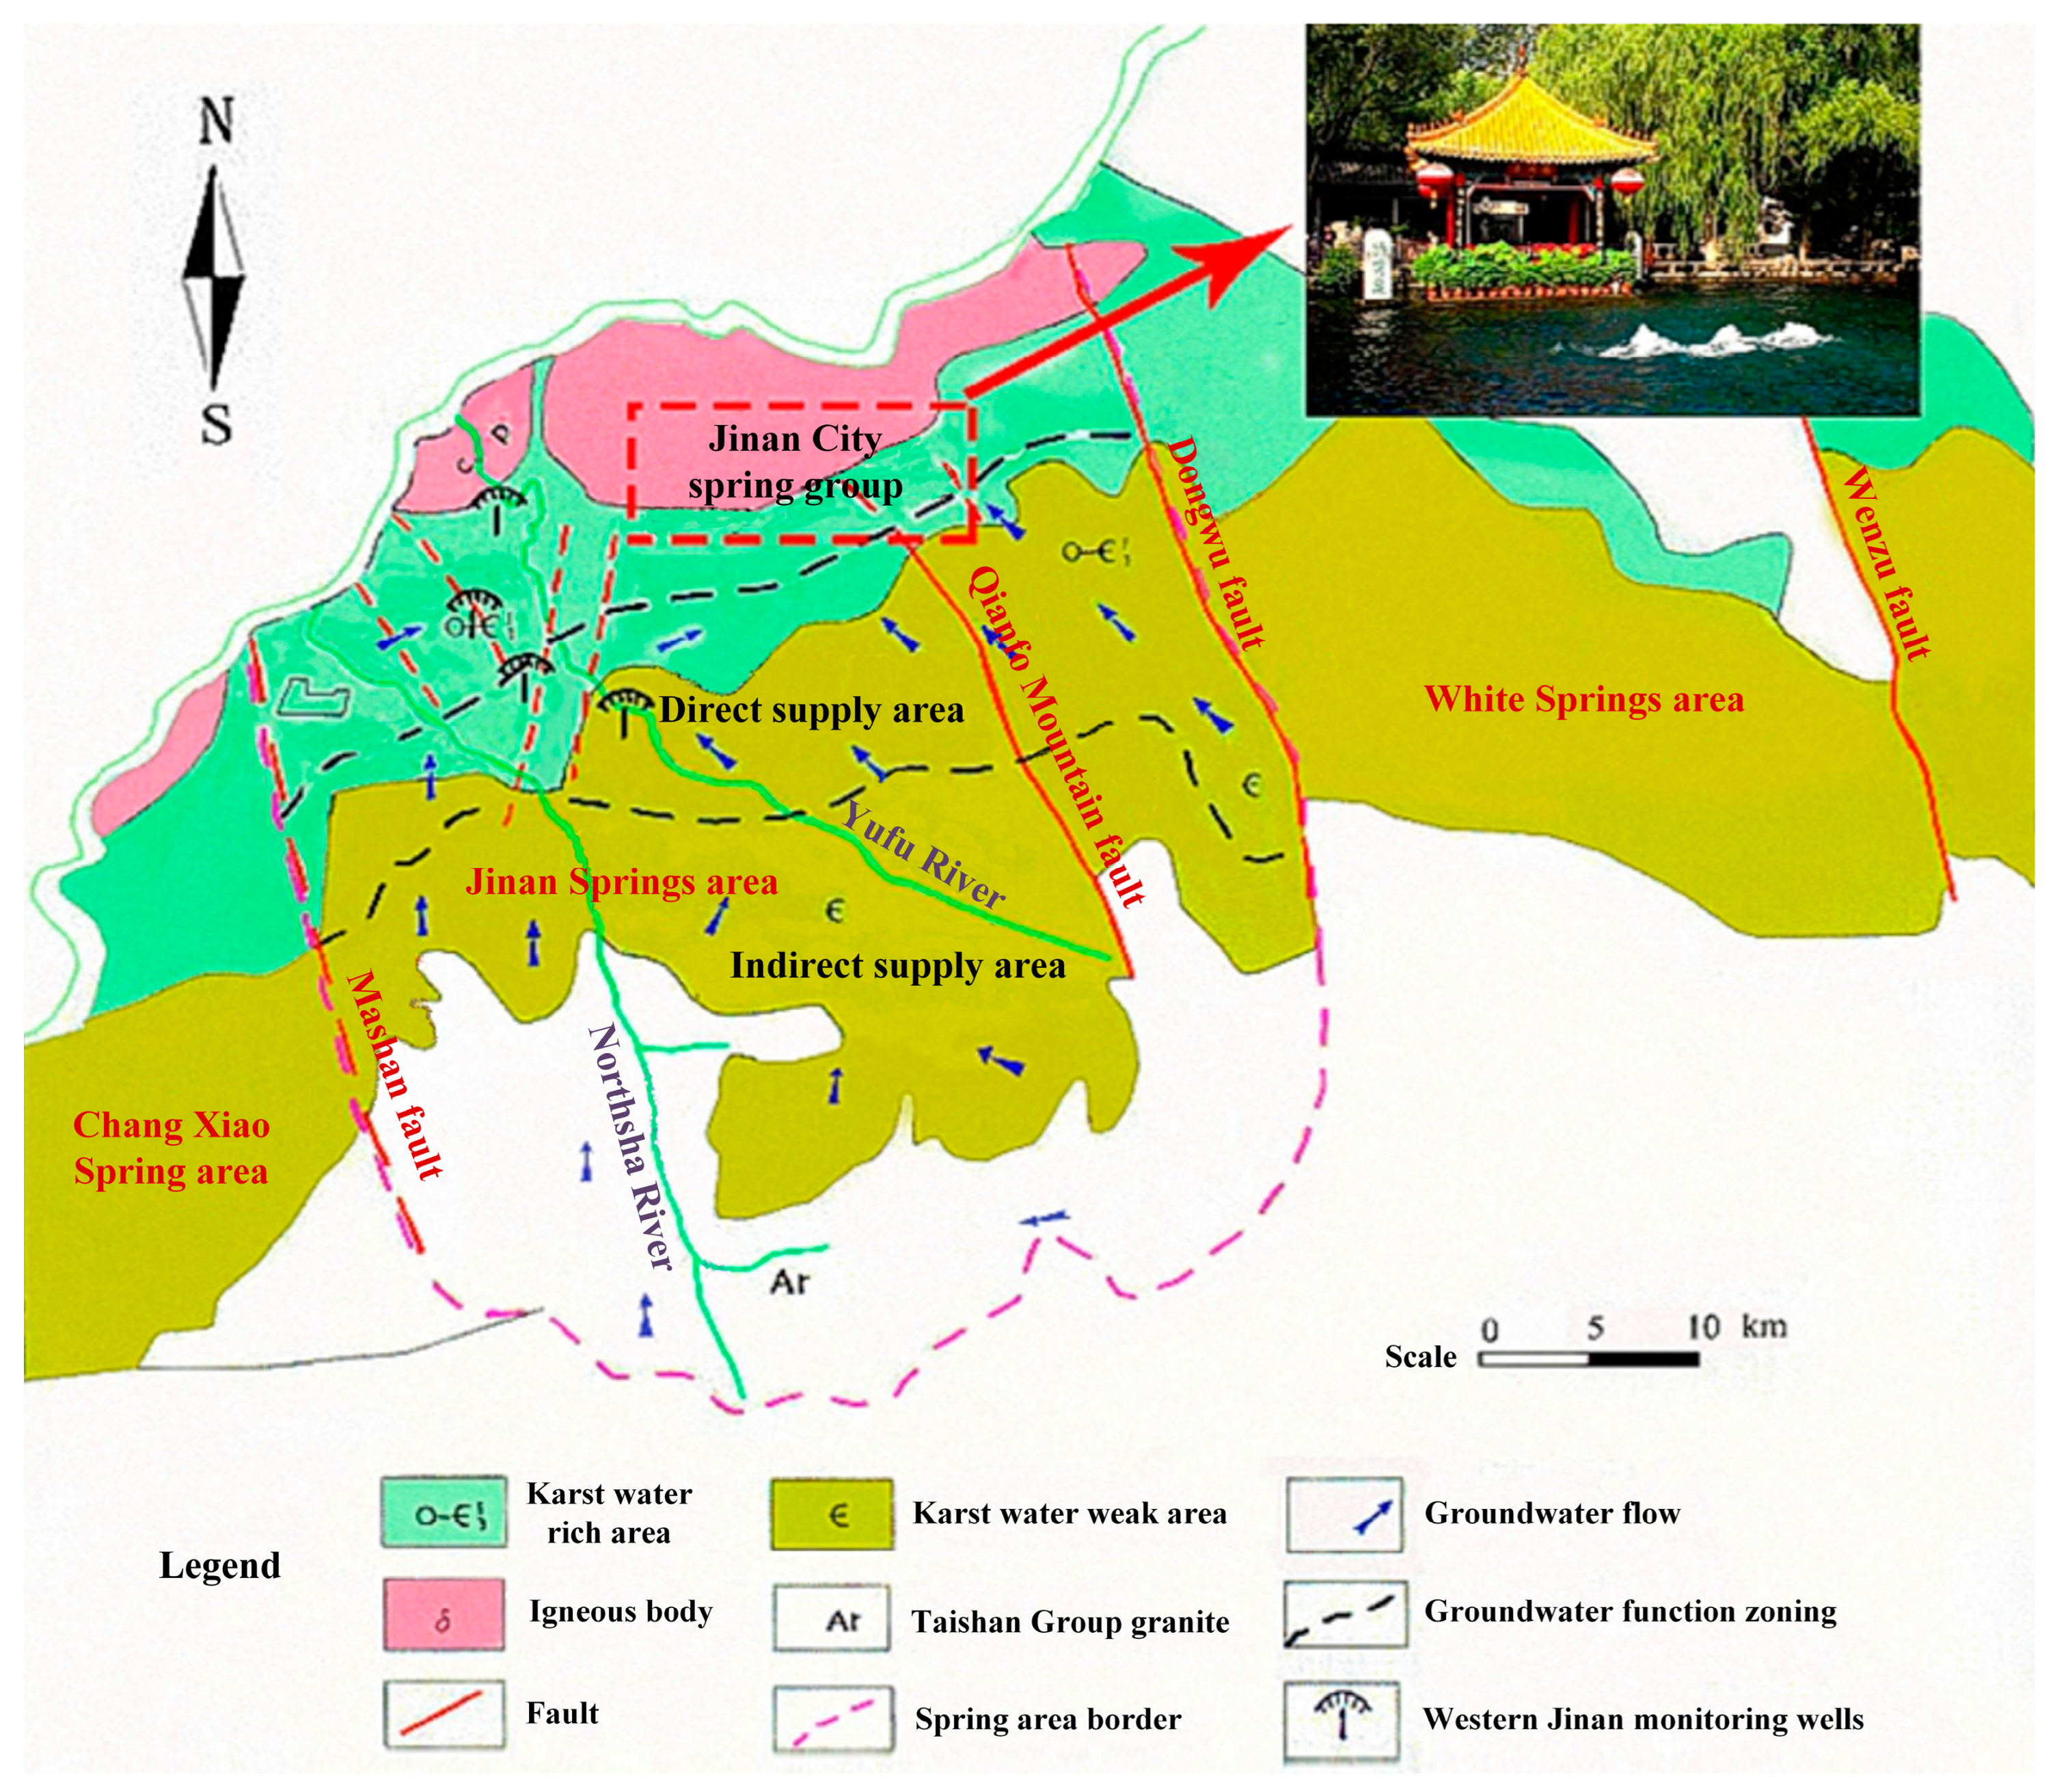
Figure 1. The location of the Jinan Spring catchment and urban spring groups [31].
Water 15 03930 g001
Figure 2. The location of the study area and the section location of the strong seepage zone [32].
Water 15 03930 g002
Figure 3. Longitudinal geological profile of the Yufu River.
Water 15 03930 g003
Figure 4. Conceptual model of special geological structures.
Water 15 03930 g004
Figure 5. Artificial recharge project of the Yufu River [33].
Water 15 03930 g005
Figure 6. Water table monitoring data.
Water 15 03930 g006
Figure 7. Study framework.
Water 15 03930 g007
Figure 8. (a) Spatial distribution of non-confined aquifer hydraulic conductivity. (b) Spatial distribution of aquitard hydraulic conductivity. (c) Spatial distribution of confined aquifer hydraulic conductivity.
Water 15 03930 g008
Figure 9. Spatial distribution of precipitation infiltration coefficient.
Water 15 03930 g009
Figure 10. Comparison between observed and calculated hydraulic head values during the parameter identification period. The following subfigures are presented: (a) hydraulic head at Well 1; (b) hydraulic head at Well 2; (c) hydraulic head at Well 3; (d) hydraulic head at Well 4; (e) hydraulic head at Heihu Spring; (f) hydraulic head at Baotu Spring.
Water 15 03930 g010
Figure 11. Fitting of observed and calculated values of the hydraulic head during the parameter validation period. (a) Hydraulic head at Well 1; (b) hydraulic head at Well 2; (c) hydraulic head at Well 3; (d) hydraulic head at Well 4; (e) hydraulic head at Heihu Spring; (f) hydraulic head at Baotu Spring.
Water 15 03930 g011
Figure 12. Total dissolved solid monitoring data.
Water 15 03930 g012
Figure 13. The time-varying trend of total dissolved solids (TDS) concentrations in six groundwater sources.
Water 15 03930 g013
Figure 14. Simulation results depicting the temporal evolution of spatial total dissolved solids concentration distribution over 10 years during the karst water recharge process through the robust seepage area of the Yufu River. This recharge process uses water sourced from the SNWD Project. The following time intervals are illustrated: after (a) 360 days; (b) 720 days; (c) 1080 days; (d) 1800 days; (e) 2520 days; and (f) 3600 days.
Water 15 03930 g014
Figure 15. Total dissolved solids (TDS) concentration changes in groundwater sources over time under different pumping conditions: (a) Groundwater extracted at a 50% limited extraction volume. (b) Groundwater extracted at a 70% limited extraction volume. (c) Groundwater extracted at a 90% limited extraction volume.
Water 15 03930 g015
Figure 16. Differences in water tables in the six water sources under different schemes: (a) Groundwater extracted at a 100% limited extraction volume. (b) Groundwater extracted at a 50% limited extraction volume. (c) Groundwater extracted at a 70% limited extraction volume. (d) Groundwater extracted at a 90% limited extraction volume.
Water 15 03930 g016
Table 1. Hydraulic parameters of unconfined aquifers.
No.Kh (m/d)Kv (m/d)Specific Yield
1212.10.13
230.30.15
3180.60.03
49.30.310.12
514.60.490.03
6150.50.15
716.50.550.02
812.60.420.03
980.080.11
1013.40.450.18
11150.50.03
1212.60.420.13
1310.50.350.04
14150.50.04
Table 2. Hydraulic parameters of aquitards.
No.Kh (m/d)Kv (m/d)
11.0 × 10−41.0 × 10−4
21.0 × 10−31.0 × 10−3
31.0 × 10−31.0 × 10−3
41.0 × 10−31.0 × 10−3
51.0 × 10−51.0 × 10−5
Table 3. Hydraulic parameters of confined aquifers.
No.Kh (m/d)Kv (m/d)Storage Coefficient
160.62.20 × 10−5
210.12.00 × 10−4
33031.00 × 10−6
4100105.00 × 10−6
55052.00 × 10−6
68082.00 × 10−5
78087.00 × 10−5
81011.30 × 10−5
9656.55.00 × 10−5
10656.55.20 × 10−5
115057.00 × 10−6
126068.50 × 10−5
1350.56.30 × 10−1
140.80.083.80 × 10−5
152022.00 × 10−6
16151.51.50 × 10−4
17120128.00 × 10−6
18120121.00 × 10−5
193035.20 × 10−5
20120124.30 × 10−5
215052.00 × 10−5
2220.23.00 × 10−5
2310.18.00 × 10−6
240.30.037.50 × 10−5
2510.15.50 × 10−5
2610.15.50 × 10−5
2740.43.00 × 10−5
280.150.0157.50 × 10−5
290.050.0057.00 × 10−5
300.50.051.50 × 10−4
311.50.151.50 × 10−5
320.50.055.30 × 10−5
330.250.0251.00 × 10−4
340.20.027.00 × 10−5
350.10.013.00 × 10−4
360.30.031.70 × 10−4
370.30.031.50 × 10−4
380.30.032.00 × 10−4
Table 4. Artificial recharge volume.
Year201720182019
Total recharge volume (×103 m3)210211.3
Table 5. Water supply capacity and limited production of six groundwater sources.
NameQiaoziliLengzhuangGuchengEmeiDayangLashan
Water supply capacity
(×103 m3)
1003898939338
Limited pumping volume (×103 m3)19060205
Table 6. Groundwater sources pumping scheme during recharge period.
Name50%
(×103 m3)
75%
(×103 m3)
90%
(×103 m3)
Qiaozili2.94.35.2
Lengzhuang4.36.57.8
Gucheng7.210.813.0
Emei4.36.57.8
Dayang1.42.22.6
Lashan0.40.50.7
Total20.630.937.1
Table 7. Concentration trend of total dissolved solids under different pumping schemes (mg/L).
NameQiaoziliLengzhuangGuchengEmeiDayangLashanTotal
Initial concentration500.00500.00500.00500.00500.00500.00500.00
0%506.61579.70564.19610.50641.94672.60595.92
ΔC0%6.6179.7064.19110.50141.94172.6095.92
50%504.01554.11544.40581.62592.24638.62569.17
ΔC50%4.0154.1144.4081.6292.24138.6269.17
(ΔC0% − ΔC50%)/ΔC0%39.33%32.11%30.83%26.14%35.01%19.69%27.89%
75%503.58541.57533.72552.65564.93609.55551.00
ΔC75%3.5841.5733.7252.6564.93109.5551.00
(ΔC0% − ΔC75%)/ΔC0%45.84%47.84%47.47%52.35%54.26%36.53%46.83%
90%503.05520.68512.21534.25553.66582.77534.44
ΔC90%3.0520.6812.2134.2553.6682.7734.44
(ΔC0% − ΔC90%)/ΔC0%53.86%74.05%80.98%69.00%62.20%52.05%64.10%
Table 8. Groundwater table values under different scenarios at the end of the simulation period.
NameInitial0%ΔH0%50%ΔH50%75%ΔH75%90%ΔH90%
Qiaozili33.1237.904.7936.473.3535.762.6435.442.32
Lengzhuang33.1637.774.6135.972.8135.081.9234.651.49
Gucheng32.6637.084.4335.012.3533.981.3233.460.80
Emei35.5139.854.3437.491.9836.310.8035.740.23
Dayang37.4541.103.6539.441.9838.611.1638.260.81
Lashan38.2241.463.2439.941.7239.180.9638.880.66
Average35.0239.194.1737.392.3736.491.4736.071.05
Disclaimer/Publisher’s Note: The statements, opinions and data contained in all publications are solely those of the individual author(s) and contributor(s) and not of MDPI and/or the editor(s). MDPI and/or the editor(s) disclaim responsibility for any injury to people or property resulting from any ideas, methods, instructions or products referred to in the content.