Article

Ecology Health Evaluation System Based on Fish Movement Behavior Response

College of Environmental Science and Engineering, Guilin University of Technology, 319 Yanshan Street, Guilin 541006, China
*
Authors to whom correspondence should be addressed.
Water 2023, 15(23), 4066; https://doi.org/10.3390/w15234066
Submission received: 8 October 2023 / Revised: 11 November 2023 / Accepted: 20 November 2023 / Published: 23 November 2023
(This article belongs to the Special Issue Fish Ecology and Responses to Environmental Variation in Streams)

Abstract

:
Using fish as indicator organisms to monitor water quality can accurately reflect the pollution status of aquatic environments in real time. Currently, there are limited quantitative and empirical studies on fish movement behavior. An experimental study on the fish movement behavior response during water quality change was conducted using an aquatic environment model. Advanced acoustic tag monitoring technology was used to qualitatively and quantitatively assess fish movement. Using the temporal and spatial distributions of fish motion behavioral trajectories during water quality change, the fish behavior response indicators were the distance between the fish and the source of pollution, the distance between the fish and the water surface, and fish swimming speed. The fish were sensitive to water quality factors, including dissolved oxygen (DO) content, microcystin aeruginosa toxin (MC-LR), and non-ionic ammonia (NH3). The correlations between indicator pairs were analyzed. A new water ecological health evaluation system based on these indicators was constructed, and aquatic ecological health in the field was evaluated using the new system. The evaluation showed a sub-healthy state in spring and a slightly morbid to morbid state in summer, which was consistent with the results based on water quality indices. The accuracy of the proposed assessment system was verified. This showed that the assessment method and grade division of the assessment system were reasonable and feasible and could reflect the health status of the aquatic ecological environment in real time. This study provides a basis for the assessment of the health and restoration effects of the aquatic ecological environment.

1. Introduction

Research on evaluating aquatic ecological health has focused mainly on index systems and indicator species-based methods [1,2,3,4]. The most commonly used approach, yielding abundant research outcomes, is the index system method. The evaluation indices are selected based on the actual situation in the research water area and exhibit index diversification [5] and index weight diversity. The indicator species method is a quantitative analysis that reflects the health status of an aquatic ecological environment based on the integrity of the biological or plant community structure, and it indirectly assesses the health of aquatic environments by monitoring the responses of indicator species to environmental stress. The index of biological integrity (IBI) is the most widely used method for evaluating aquatic ecological health [6,7].
Fish live in aquatic environments continually and act as a real-time “monitor” of water pollution. Among the many organisms that have been used as water quality monitoring systems, fish is one of the earliest to be applied to water quality monitoring and early warning and water environment quality assessment, and is also by far considered to be the most suitable and popular indicator species. Compared with other aquatic organisms, fish are larger in size, and they are convenient to capture and identify signals; they are more capable of life, and can be continuously monitored for a longer period of time, which is especially suitable for real-time on-line monitoring in the field. They are easy to manage and have low operation and maintenance costs due to low technical difficulties in feeding, and the stability of the monitoring results is relatively good. In many water pollution incidents, the pollution of the water body was initially not discovered by the local Department of Environmental Protection; however, it was discovered by the fishermen living near the waters. These water pollution incidents indicated that, under the conditions of limited monitoring, fish can reflect the actual pollution status of a water body more quickly and truly than environmental monitoring methods. Research on the fish movement behavior response during water quality change, particularly the toxicological behavior of fish [8], mechanism of fish movement behavior response under heavy metal stress [9], water quality evaluation factor model based on fish behavior characteristics [10], effects on fish behavior and death threshold of different pollutant concentrations [7], and others, have provided research basis for water quality monitoring systems based on fish behavior. Based on the fish movement behavior response, the potential impact on fish and the toxicity of water pollutants or toxic substances can be determined directly or indirectly. Compared with the physical and chemical analysis methods, the corresponding evaluation of the health status of aquatic ecological environments has the advantage of being a real-time, objective, and true reflection of their pollution status.
Evaluation of the health status of aquatic ecology through fish swimming behavior, rheotaxis, and selection behavior has been successfully used [11,12,13,14]. Observing fish behavior in response to water pollutants has become an important method for early warning of water pollution in rivers and evaluating aquatic ecological health status. However, relatively few quantitative and empirical studies have focused on the impact of aquatic environmental changes on fish movement. Therefore, this study aimed to use a large amount of experimental data to qualitatively and quantitatively evaluate the fish movement behavior response and to use the fish movement behavior response indices during water quality changes to evaluate the health status of the aquatic ecological environment.

2. Materials and Methods

2.1. Experimental Materials

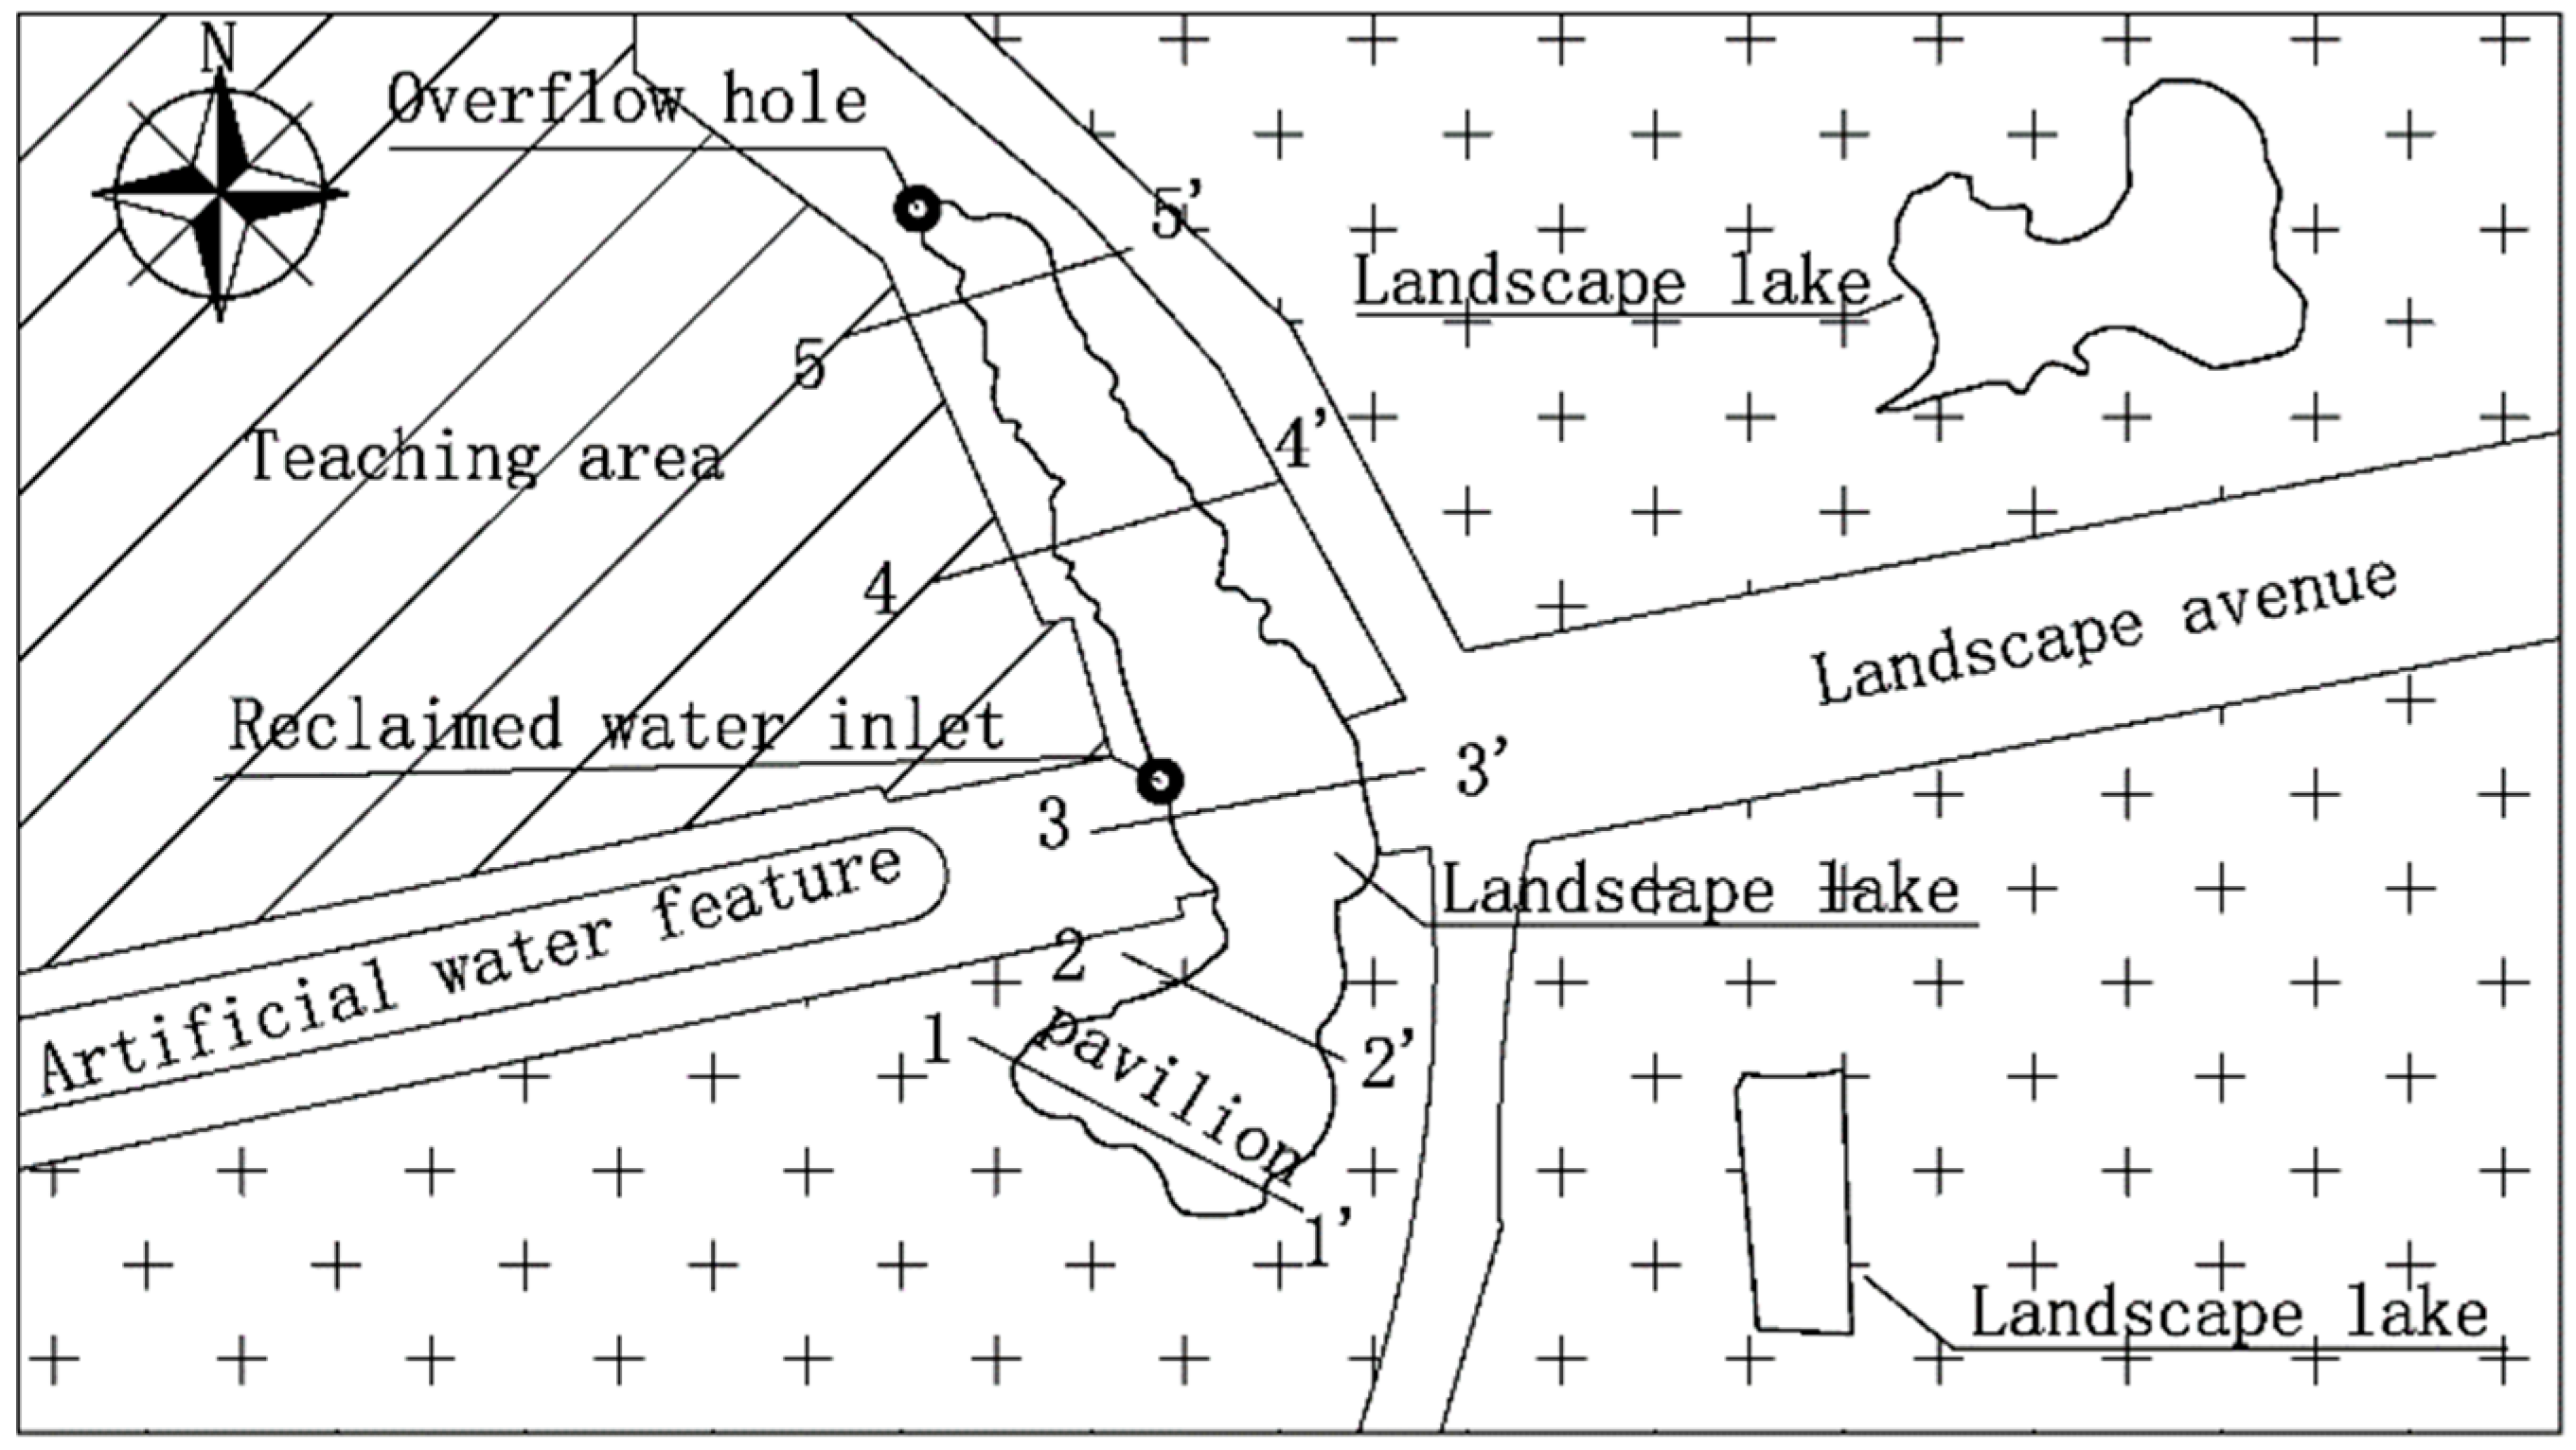
2.1.1. Experimental Device

In this study, the experimental tank was composed of a steel frame (length: 10.0 m, width: 1.0 m, and height: 1.2 m) and an organic tempered glass tank with a water depth of 1.0 m. The experimental tank contained pebbles, sediment, and other materials commonly found in rivers, lakes, and reservoirs. The bottom of the tank was 0.00–0.15 m thick. The aquatic ecological environment system was composed of common species in rivers, lakes, and reservoirs, such as fish, shrimp, crabs, snails, loaches, algae, and aquatic plants (Figure 1). The substrate of the water body is taken from the Li River pebbles, gravels, sediments, water plants, etc. The ecological structure community consists of the common species in the Li River, which constitutes the ecological environment model of the water body.
The nutritional status of water bodies in rivers and lakes is divided into three stages: oligotrophic, mesotrophic, and eutrophic status [15]. In this study, the water environment was changed by simulating nitrogen and phosphorus pollutants in an experimental tank to study the influence of water quality changes in the poor, medium, and eutrophic stages on fish movement behavior. To simulate the evolution of the aquatic ecosystem better, the experimental tank was equipped with diving lights for simulating light, aeration systems, residual chlorine removal equipment, water-level probes, and other devices. The photoperiod (L:D) was 12:12 h, and the illumination time was set from 7:00 to 19:00. The lighting device automatically simulates the natural light intensity at the set time. Every day, at 7:00, the light intensity gradually increased and decreased after 18:00.

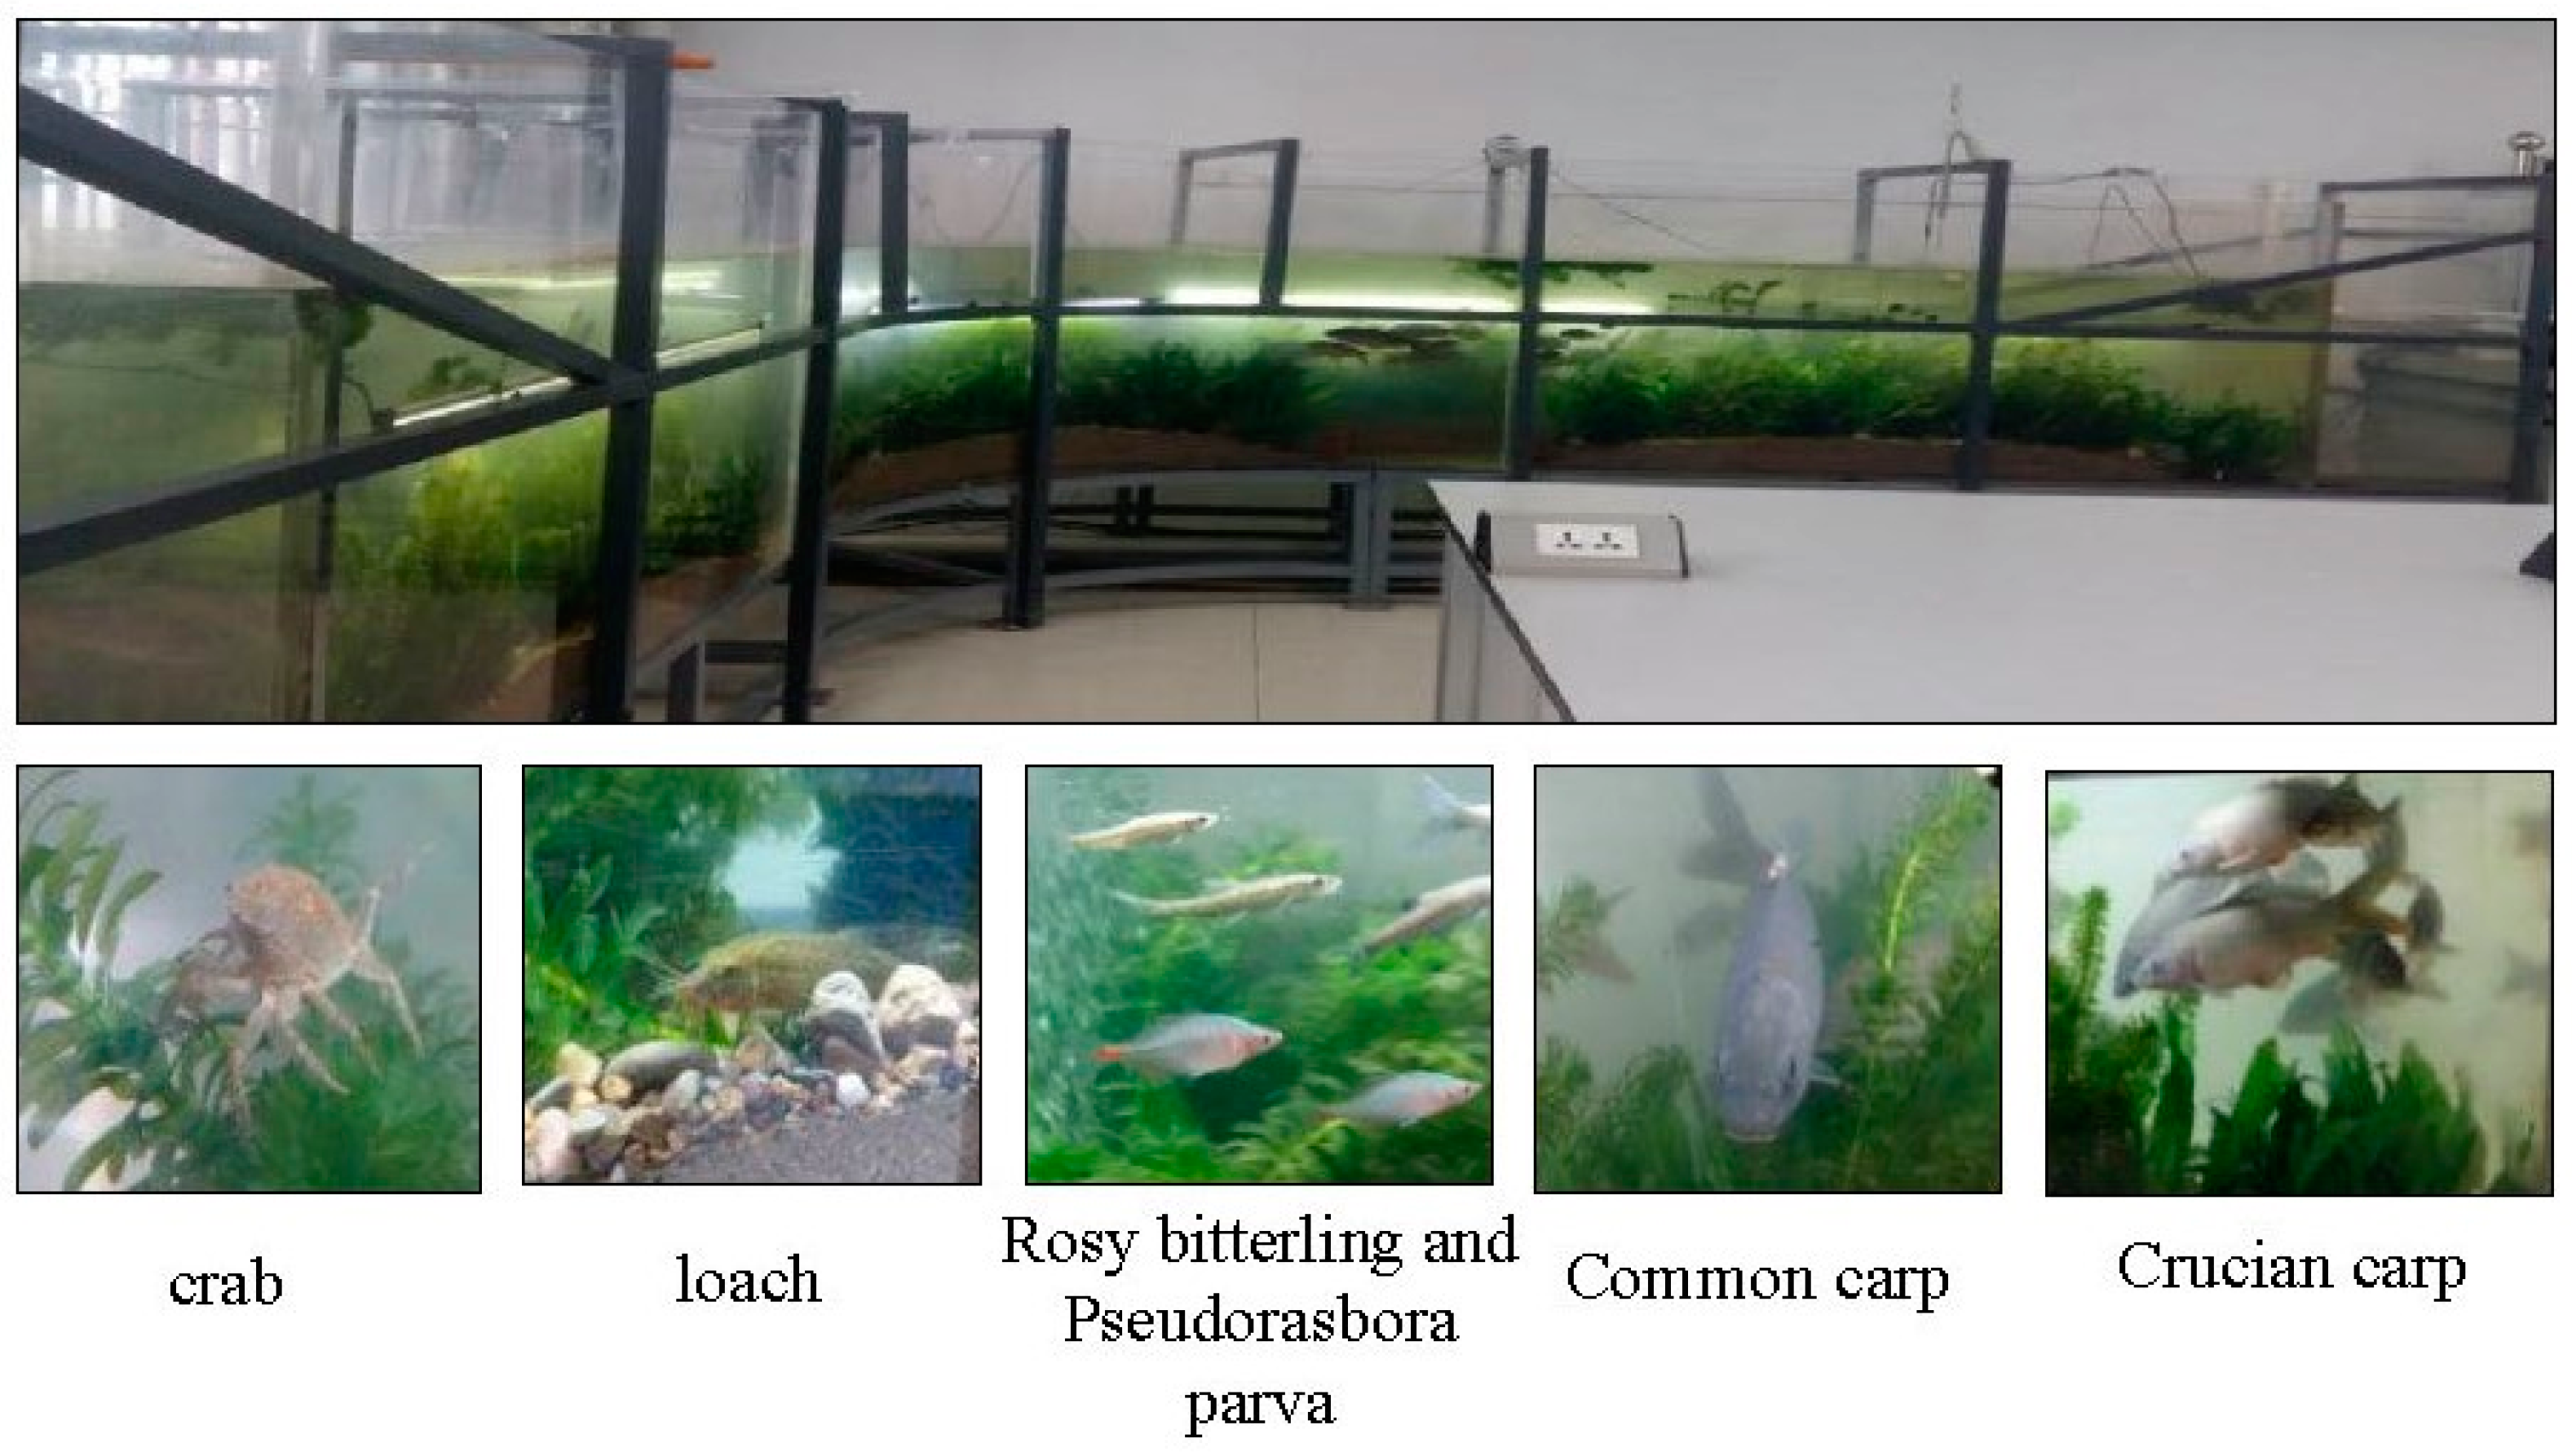
2.1.2. Biological Indicator

The selection of experimental indicator organisms should be based on the following principles: First, the organism is representative of an important aquatic biota. Second, the organism occupies a position in the food chain. Third, the organism is widely distributed, easy to feed, and genetically stable. Fourth, the organism has rich background information. Many studies have used carp as an indicator organism [16,17,18,19,20,21]. Therefore, the fish selected in this study were 10 adult carp with a body length of 20 ± 5 cm and a weight of approximately 1.0 ± 0.50 kg. The carp were marked with acoustic tags with an edited code. The feeding method for the experimental fish was simulated using river flow, and the dechlorinated tap water was used for aquaculture. The simulation experiment started after a 14-day adaptation to the experimental river. At this time, the water body was in an oligotrophic environment, and the experimental period was 1 year. If an experimental fish died unexpectedly during the experiment, the acoustic tag was allocated to another experimental fish in the tank for continued monitoring to ensure continuity of the experimental data. The experiment was approved by the Animal Care and Use Ethics Committee of Guilin University of Technology.

2.2. Monitoring Technology and Methods

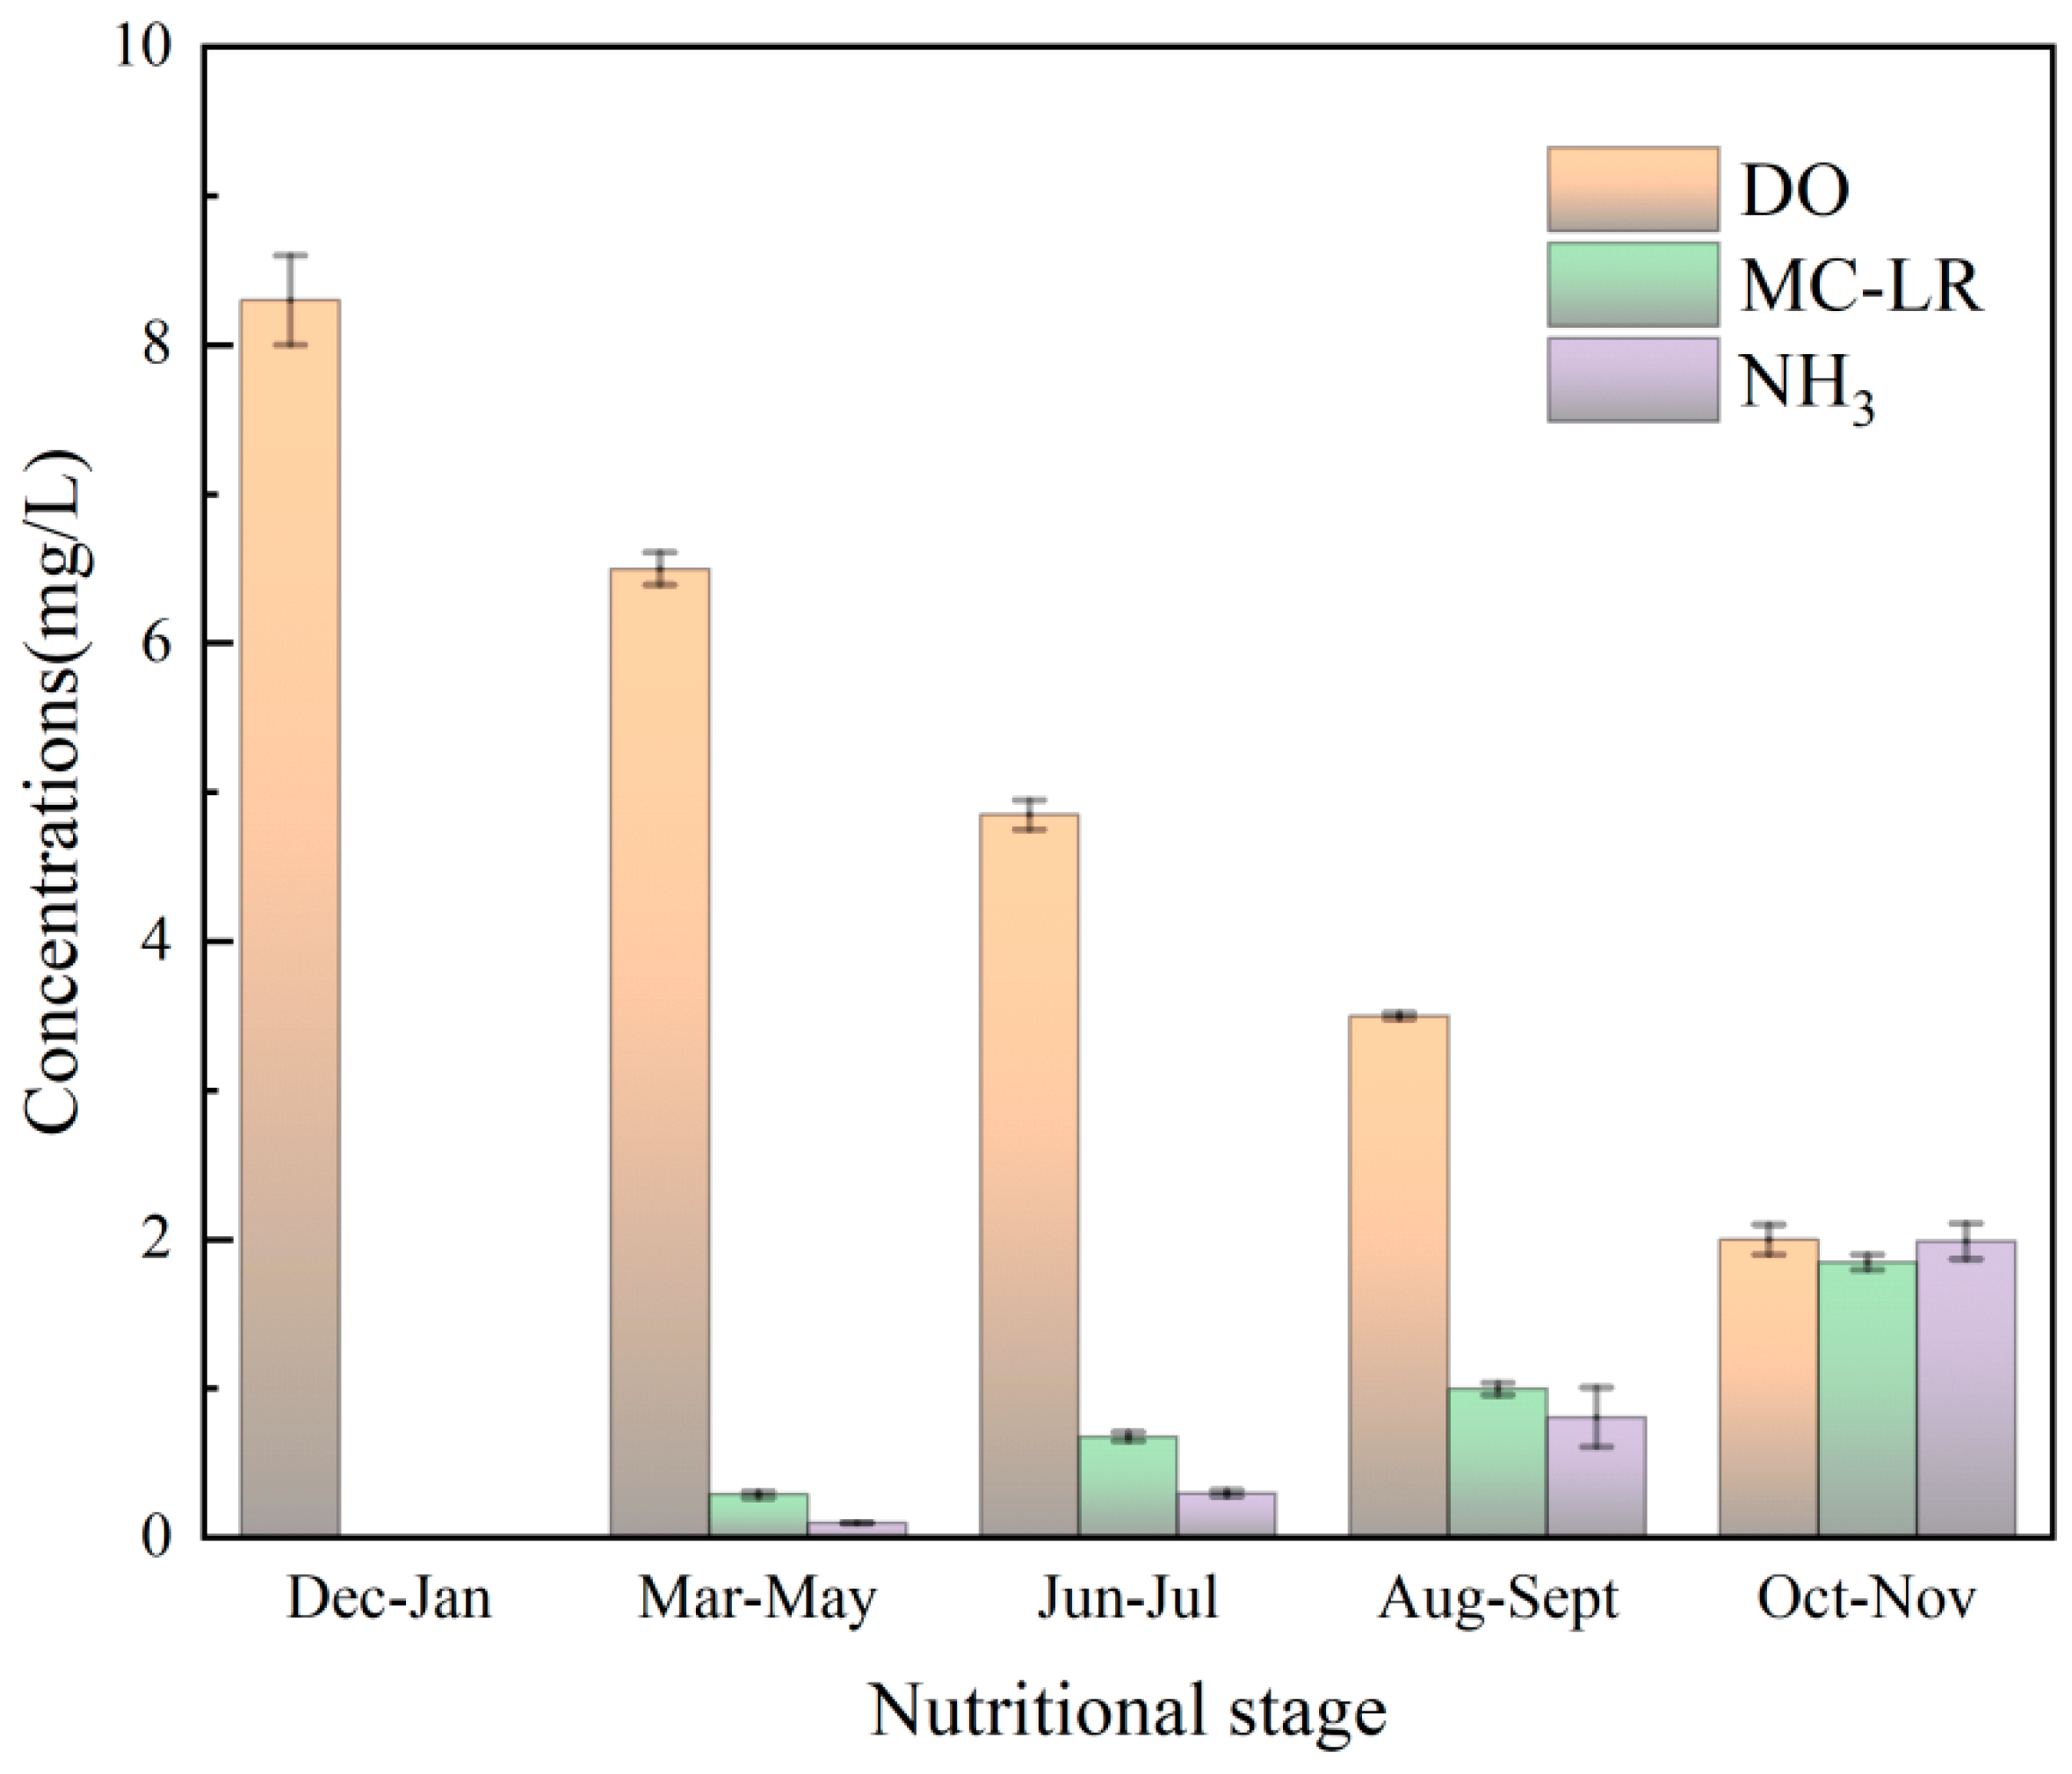
2.2.1. Water Quality Monitoring Methods

Water quality monitoring indices included five evaluation indices of water eutrophication (total phosphorus (TP), total nitrogen (TN), chlorophyll (Chl-a), permanganate index (CODMn), and transparency (SD)), dissolved oxygen (DO), microcystin-LR (MC-LR), and non-ionic ammonia NH3 (converted by measuring ammonia nitrogen NH3-N), obtained using online monitoring and sampling analytic methods. Online monitoring was performed using a multiparameter water quality analyzer (Multi 3430, WTW, Weilheim, Germany) for monitoring water temperature, pH value, and DO, a portable turbidimeter (2100Q, Hach, Loveland, CO, USA), an ammonia nitrogen online monitor (TresCon Uno A111, WTW, Munich, Germany), and an algae detector (ALGAE-Wader, CTG, London, UK). Other parameters, such as TP, TN, CODMn, and MC-LR, were analyzed and tested indoors according to Chinese standard post-sampling methods. The non-ionic ammonia NH3 content in water was determined based on the formula for non-ionic ammonia NH3 (Non-ion Ammonia Conversion Method for Surface Water Environmental Quality Standards, China Environmental Monitoring Station, 1995, China). The formula is as follows:
C N H 3 = 1.216 × C N H 3 - N × f / 100
where C N H 3 is the concentration of non-ionic ammonia NH3 in the water sample at the given temperature and pH value (mg·L−1), C N H 3 - N is the concentration of ammonia nitrogen NH3-N in the water sample (mg·L−1), and f is the mole percentage value of non-ionic ammonia NH3 (Non-ion Ammonia Conversion Method for Surface Water Environmental Quality Standards, China Environmental Monitoring Station, 1995, China).
The degree of eutrophication of the water body was controlled by placing different ratios of potassium nitrate KNO3 as the nitrogen source and potassium dihydrogen phosphate K2HPO4 as the phosphorus source, which were dissolved in distilled water to form nitrogen nutrient solution and phosphorus nutrient solution, respectively.

2.2.2. Fish Trajectory Monitoring Technology

An acoustic tag system is a passive acoustic method of sound wave monitoring that offers the advantages of simple and fast data processing, high accuracy, and good continuity [22]. Therefore, in this study, an acoustic tag system was used to monitor the trajectory of fish movement. The working principle is to use four hydrophones (H1, H2, H3, and H4) to obtain sound waves emitted by acoustic tags transplanted or tied to the fish (Figure 2). The signal was transmitted to the signal terminal processor through the data line for signal processing. After computer denoising, the three-dimensional movement trajectory coordinates of the fish were obtained. The frequency of the acoustic wave signal set by the acoustic tag was 3001–3020 Hz. One signal was obtained every 3 s; one signal represented one track point, and one set of data were obtained every 1 h. One set of data had 1200 track points, and the number of track points monitored in one year was approximately 1051.2 × 104.

2.3. Fish Swimming Speed

The average swimming speed of each fish was calculated based on the distance between two consecutive track points and the signal emission frequency, as follows:
v = i = 1 n d i t n
where di is the distance between two consecutive track points (m) and t is the time required for the fish to move from one track point to another (s) according to the set tag signal transmission frequency. The transmission time interval between two consecutive signals was 3 s, and n is the number of fish swimming speed values.

2.4. Evaluation of the Water Area

The assessed water area was a college landscape lake with an area of 5.3 × 10³ m2 and a depth of 1.6–2.5 m. The main sources of water supply for the lake were natural precipitation and replenishment from the sewage treatment plant at the college. Common fish species in the lake include common carp and crucian carp. The landscape lake is a closed water area with poor self-purification ability. Long-term accumulation of nitrogen and phosphorus in water leads to eutrophication of the water body. Particularly in summer, high temperatures can easily lead to the deterioration of water quality, seriously affecting the ecological functions and landscape effects of the lake.
According to the actual situation of the landscape lake, five sampling sections were set up (Figure 3), and five water quality monitoring points were selected in each section to ensure the representativeness of the sampling points. Due to the relatively large changes in the aquatic ecological environment in spring and summer, the movement trajectories of fish in spring and summer were monitored to obtain fish movement behavior response indicators y d , y z , and y v , and water quality indicators that the fish are sensitive to (DO, MC-LR, and NH3) were analyzed and evaluated.

2.5. Data Processing Methods

In data monitoring, abnormal data must first be denoised and cleaned, converted into concise and efficient three-dimensional fish trajectory data, and loaded into the fish trajectory database. Data query language was used for data processing to obtain valuable data from the large number of experimental data. The data query language frequency function counted the numerical frequency of each interval segment and was structured as frequency (data array and bins array), where the data array was used to evaluate the array or data area and the bins array was a segmentation point for the output data.
Considering the indices of fish movement behavior response as dependent variables and the water quality indices that fish are sensitive to (DO, MC-LR, and NH3) as independent variables, SPSS software (version 22.0, Armonk, NY, USA) was used to analyze the correlation between the two. The correlation coefficient was calculated using Pearson’s correlation coefficient significance test [23], as follows:
r = x y x y N x 2 ( x 2 ) N y 2 ( y 2 ) N
where r is the correlation coefficient, x is the impact factor (independent variable), y is the predicted object (dependent variable), and N is the sample size.

3. Results and Discussion

3.1. Changes in Fish Movement Trajectories on the Time Scale

Based on the distribution of fish movement trajectories on the time scale (Figure 4), in the oligotrophic stage, fish swam in a large range and were less affected by pollutants; in the mesotrophic stage, the fish movement trajectories showed a gradual movement away from the source of pollution and preference for a certain area for activities. The behavior and response were relatively slow based on the fish’s swimming speed. In the eutrophic stage, due to the lack of oxygen in the water and fish poisoning, the swimming speed was slow, the response to external disturbances was low, and fish mainly gathered away from the pollution source. This indicates that the trajectory of adult carp changed gradually during water eutrophication. Therefore, on a time scale, the fish movement behavior response index was the distance y d between the fish and the pollution source. As the pollutant concentration increased, y d increased.

3.2. Changes in Fish Movement Trajectories on the Spatial Scale

During the change from oligotrophication to mesotrophication, the fish trajectories were distributed throughout the depth direction (Figure 4), and the range of change was large. In the mesotrophic to eutrophic stage, the trajectory distribution range of fish in the water depth direction was from 0.2 to 0.7 m to 0.2 to 0.4 m water depth, indicating that the trajectory point distribution of fish in the water depth direction migrated from the bottom to the surface layer. Particularly in the moderate-to-severe eutrophication stage, this phenomenon was more pronounced, mainly because of the rapid decrease in DO content along the vertical direction and the rapid increase in MC-LR and NH3 content. The distribution law of MC-LR and NH3 along the vertical direction was as follows: low layer > middle layer > surface layer, whereas that of dissolved oxygen showed the opposite trend. Therefore, on a spatial scale, the index of fish movement behavior response was the distance y z of the fish from the water surface.

3.3. Changes in Fish Swimming Speed

Swimming speed is an important index for assessing the activity of fish. The concentration of pollutants in the water directly affects the swimming ability of fish. Fish swimming speeds were divided into average and instantaneous speeds. The average speed refers to the normal swimming speed of fish, which is related to the current velocity, and the instantaneous speed of fish refers to the sudden change in swimming speed caused by external interference.
The distance between two consecutive track points reflects the swimming speed of the fish (Figure 5). A large distance indicates that the fish swim fast, and vice versa. In the process of water eutrophication, changes in the concentrations of DO and derived pollutants lead to changes in fish trajectories, which is the main reason for changes in fish swimming speed.
The trajectories of fish during the eutrophication process of the water body showed minor changes in the swimming speed during the oligotrophic and mesotrophic stages of the water body, with an average swimming speed of 0.40–0.56 m/s, which was more sensitive to external interference and was readily altered, shown in Table 1.
The average swimming speed of adult carp in the light-to-moderate eutrophication stage was 0.25–0.40 m/s, and it gradually slowed down in response to external interference. In the severe eutrophication stage, the adult carp movement speed slowed, and the average swimming speed was <0.25 m/s. Considering the changes in the swimming speed of adult carp at different nutritional stages, the swimming speed of fish gradually decreased with an increase in pollutant concentration in the water.
In Figure 5, the size of the distance between two consecutive trajectory points of a fish reflects how fast the fish swims. A large distance indicates that the fish swims fast and vice versa. In other words, the distance of the trajectory is used to indicate the swimming speed of the fish.
Based on the above results, the main indices of fish movement behavior responses during water quality changes were the distance between the fish and the pollution source y d , the distance between the fish and the water surface y z , and the swimming speed of the fish y v .

3.4. Determination of Water Quality Index Using Fish Sensitivity

When water DO content increased from 3.85 mg·L−1 to 6.56 mg·L−1, MC-LR decreased from 0.85 mg·L−1 to 0.70 mg·L−1 and non-ionic ammonia NH3 decreased from 0.25 mg·L−1 to 0.20 mg·L−1. Except for a slight change in the permanganate index, the five water quality indices remained unchanged. The main reason for this is that the increase in water DO content reduced the consumption of permanganate by organic and inorganic reducing substances. The distribution range of similar motion track points gradually increased. At this time, the distribution range of the fish movement track points gradually increased. Therefore, these five water quality indices had little effect on fish trajectories.
In the oligotrophic to moderate eutrophication stage, the main reason for the changes in fish trajectory was the change in DO. In contrast, in the severe eutrophication stage, the main reasons for the changes in fish trajectory were DO, MC-LR, and NH3, caused by rapid changes in their content (Figure 6). Meanwhile, cyanobacterial cells divide and grow rapidly, consuming a large amount of nutrients and oxygen in the water and interrupting the aquatic ecosystem’s food chain. Additionally, it is difficult for cyanobacteria to complete normal metabolic processes and begin to enter the process of microbial decomposition and decay. Water DO content drops rapidly, resulting in the rapid diffusion of such pollutants into the water, causing deterioration of water quality and fish deaths. This showed that the changes in the contents of DO, MC-LR, and NH3 in the water were the main reasons for the changes in the trajectory of fish, which were mainly manifested in two aspects: on the one hand, the low water DO content caused the fish to suffocate and die, and on the other hand, algae died, and the MC-LR and NH3 released after decomposition had a compound toxic effect on the fish and even led to death by poisoning. Therefore, the main water quality indices that affected fish movement behavior were DO, MC-LR, and NH3.

3.5. Correlation Analysis

During water quality changes, the indices of fish movement behavior response, namely y d , y z , and y v , changed with changes in DO, MC-LR, and NH3, indicating that the two are correlated. Based on the results, the Pearson correlation coefficients of y d , y z , and y v , DO, MC-LR, and NH3 content were −0.897, 0.873, 9.586; −0.952, 0.945, 0.687; 0.985, −0.986 and −0.931. This indicates that the index of fish movement behavior response and the water quality indices the fish are sensitive to had an extremely strong correlation—an extremely strong negative correlation, a strong correlation, or a strong negative correlation—and they were significantly correlated at the 0.01 level (two-sided test). From the Pearson correlation degree of the two variables, it can be seen that the intensity of the influence of the fish-sensitive water quality indicators DO, MC-LR, and NH3 on y d is NH3 > DO > MC-LR and the intensity of the influence on y z is DO > MC-LR > NH3, which had a strong influence on y v .

3.6. Prediction Model of the Indices of Fish Movement Behavior Response

The statistical results of the model (Table 2) show that the correlation coefficients, the determination coefficient R2, and the adjusted determination coefficient of the fish movement behavior response indices y d , y z , and y v of the prediction model were all > 0.9, indicating that the sample regression had a good fit. The standard errors S of the regression estimates were all < 0.1, indicating that the fitted regression equation was highly representative. A linear regression relationship was observed between the independent variable water quality indicators that the fish are sensitive to (DO, MC-LR, and NH3) and the dependent variable fish movement behavior response indices y d , y z , and y v . Based on the regression coefficient analysis results, the associated p-values were all <0.01, indicating that the regression coefficients were significantly different and that the regression equation was meaningful. Therefore, the ternary linear regression equations of the dependent variable fish movement response indices y d , y z , and y v , with the independent variable water quality indices DO, MC-LR, and NH3 were established as follows:
y d = 80.769 9.286 x D O 0.406 x M C L R + 94.892 x N H 3
y z = 0.406 0.027 x D O + 0.003 x M C L R 0.059 x N H 3
y v = 0.808 0.028 x D O 0.004 x M C L R 0.072 x N H 3
where y d is the dependent variable, namely the distance between the fish and the pollution source (m); y v is the dependent variable, namely the distance between the fish and the water surface (m/s); x D O is the independent variable, the DO content in the water (mg·L−1); x M C - L R is the independent variable, the content of MC-LR in the water (mg·L−1); and x N H 3 is the independent variable, the concentration of non-ionic ammonia NH3 in the water (mg·L−1).
By testing the goodness of fit of the above regression equation, the significance of the regression equation (F-test), and the significance of the regression coefficient (t-test), the established regression equation was observed to have a good fit. Moreover, it can be used as a predictive model of fish behavior response indices when the dependent variables of water quality indices DO, MC-LR, and NH3 change and can be used to infer the water quality index content based on the indices of fish movement behavior response.

3.7. Construction of the Water Ecological Health Evaluation System

3.7.1. Construction of the Evaluation Index System

From the perspective of fish movement behavior response to water quality changes and the aquatic ecological environment factors that affect fish movement behavior, three response indices, y d , y z , and y v and three parameters affecting fish movement behavior were selected. The water quality indices DO, MC-LR, and NH3 had two levels and six evaluation indices to construct an aquatic ecological health evaluation system (Table 3).

3.7.2. Classification of Evaluation Index Levels

Based on the five levels of eutrophication evaluation of water bodies, namely eutrophication, moderate eutrophication, mild eutrophication, moderate eutrophication, and severe eutrophication, the aquatic ecological health evaluation system was divided into five levels: Class I health, Class II sub-health, Class III mild disease, Class IV disease, and Class V severe disease, and the indices were qualitatively and quantitatively evaluated (Table 4).

3.8. Application of the Aquatic Ecological Health Evaluation System

3.8.1. Analysis of Monitoring Results

Based on the monitoring results, the temporal and spatial distribution of fish movement trajectories in the assessed waters were as follows (Figure 7): the distance y d of the fish from the pollution source was >15 m and 35 m in spring and summer, respectively, and the variation range of the distance y z of the fish from the water surface in spring and summer was 2.0–2.2 m and 0.5–1.2 m, respectively; the swimming speed y v of the fish in spring and summer was 0.45–0.50 m/s and 0.33–0.40 m/s, respectively. According to the newly developed aquatic ecological health evaluation method, the evaluation results of the aquatic ecological health status of the landscape lake were sub-healthy in spring and mild-to-severe in summer.

3.8.2. Evaluation Result Verification

To verify the accuracy of the evaluation system, the TP, TN, CODMn, Chl-a, and SD of the water eutrophication evaluation indices in the five selected sections were monitored. The eutrophication status of the lake was evaluated according to China’s Technical Regulations for Surface Water Resource Quality Evaluation. The evaluation results were as follows: moderate eutrophication in spring, that is, sub-healthy, and mild to moderate or mild eutrophication in summer. In the ill-morbid state, the evaluation results were consistent with the evaluation results of the evaluation system. This shows that the evaluation method and classification of the evaluation system were accurate and could quickly reflect the health status of the aquatic ecological environment in real time.

4. Conclusions

Restoration of aquatic ecological environments is a long-term and dynamic process. Research on theoretical techniques and methods that can reflect the aquatic ecological environment’s health and the real-time restoration effects has become a developmental direction for aquatic ecological environmental health evaluation. The purpose of health assessment and early warning still has certain limitations, such as indicator fish selection and acclimatization, indicator fish sensitivity index screening, index collection technology, and analysis methods. The aquatic ecological environment is a dynamic system, and water quality factors will change with changes in the aquatic environment. Therefore, in addition to combining modern information technology with traditional physical and chemical analysis techniques, it is necessary to fully master the assessment of fish movement behavior, physiology, and ecology to conduct more comprehensive and accurate monitoring and assessment of aquatic ecological health. With a full grasp of the disciplines of fish locomotor behavior, physiology, and ecology, and a high degree of combination of modern information technology and traditional physical and chemical analysis techniques, we can carry out a more comprehensive and accurate monitoring and assessment of aquatic ecological health, and reflect the health of aquatic ecosystems in a more scientific, accurate, and real-time manner, so as to put forward and formulate effective restoration programs.

Author Contributions

Conceptualization, Y.H. and K.D.; methodology, Y.H.; formal analysis, R.P. and K.D.; investigation, K.D., R.P., Z.Y. and X.L.; resources, K.D.; data curation, W.L. and K.D.; writing—original draft, X.L. and D.W.; writing—review and editing, K.D. and W.L.; visualization, R.P. and K.D.; supervision, X.L.; project administration, D.W.; funding acquisition, K.D. All authors have read and agreed to the published version of the manuscript.

Funding

This research was funded by the National Natural Science Foundation of China (grant number 52260023), Director Project of National Natural Science Foundation of China (U20A2087), Key Research and Development Program of Guangxi (GuikeAB22035050), Guangxi Key Laboratory Research Fund (2101Z013), and Research Start-up Fund of Guilin University of Technology (GUQDJJ2001012).

Institutional Review Board Statement

Not applicable.

Informed Consent Statement

Not applicable.

Data Availability Statement

Data are contained within the article.

Conflicts of Interest

The authors declare no conflict of interest.

References

  1. Besch, W.K.; Kemball, A.; Meyer-Waarden, K.; Scharf, B. A Biological Monitoring System Employing Rheotaxis of Fish; ASTM Special Technical Publication: West Conshohocken, PA, USA, 1976. [Google Scholar]
  2. Williams, K.; Goddard, P.; Wilborn, R.; Bryan, D.; Rooper, C. Fish behavior in response to an approaching underwater camera. Fish. Res. 2023, 268, 106823. [Google Scholar] [CrossRef]
  3. Liu, H.; Lin, J.Q.; Wang, D.S.; Huang, J.; Jiang, H.; Zhang, D.; Peng, Q.D.; Yang, J. Experimental study of the behavioral response of fish to changes in hydrodynamic indicators in A near-natural environment. Ecol. Indic. 2023, 154, 110813. [Google Scholar] [CrossRef]
  4. Burnett, M.J.; Süssle, V.; Saayman, T.; Jewitt, G.; O’Brien, G.C.; Downs, C.T. Detecting changes in fish behaviour in real time to alert managers to thresholds of potential concern. River Res. Appl. 2023, 1–19. [Google Scholar] [CrossRef]
  5. Du, J.J. Experimental Study on Behavior and Toxicological Effects of Phenol on Zebrafish. Ph.D. Thesis, Shandong Jianzhu University, Jinan, China, 2016. [Google Scholar]
  6. Georgieva, E.; Yancheva, V.; Velcheva, L.; Lliev, L.; Stoyanova, S. Histological and biochemical changes in liver of common carp (Cyprinus carpio L.) under metal exposure. North-West J. Zool. 2016, 12, 261–270. [Google Scholar]
  7. Hao, L.X.; Sun, R.H.; Chen, L.D. Health Assessment of River Ecosystem in Haihe River Basin, China. Environ. Sci. 2014, 1, 3692–3701. [Google Scholar]
  8. Huang, K.; Yao, Y.; Wang, X.N.; Zhang, Y.; Qian, C.; Ding, S. The Ecosystem Health Assessment based on the Fish Index of Biological Integrity in the Luanhe River Basin. Res. Environ. Sci. 2018, 31, 901–910. [Google Scholar]
  9. Huang, Y.Q.; Cai, D.S.; Li, M.Q.; Wu, T.H.; Li, L. Influence of changes in dissolved oxygen content on fish behavioral trajectories during water eutrophication. Appl. Ecol. Environ. Res. 2018, 17, 653–666. [Google Scholar] [CrossRef]
  10. Liang, H.; Liu, Y.; Rao, K.F.; Ma, M.; Xu, W.; Tang, L.; Ma, S.; Pan, X.F.; Chen, H.M. The Behavioral Responses of the Medaka under the Stress of Heavy Metal Copper in Water Environment. Asian J. Ecotoxicol. 2016, 11, 345–352. [Google Scholar]
  11. Li, L.H. Anomaly Water Quality Monitoring Based on Fish Movement. Ph.D. Thesis, Yanshan University, Qinhuangdao, China, 2017. [Google Scholar]
  12. Liu, S.; Fu, S.J. Effects of food availability on metabolism, behaviour, growth and their relationships in a triploid carp. J. Exp. Biol. 2017, 220, 4711–4719. [Google Scholar] [CrossRef] [PubMed]
  13. Li, W.; Lun, F.; Yang, Z.G. Study on Acute Toxicity of Trichlorfon to Yellow River Carp and Its Safety Evaluation. Heilongjiang Anim. Sci. Vet. Med. 2018, 2, 184–186. [Google Scholar]
  14. Lv, Y.F.; Zhao, X.; Wang, J.F. Acute Toxicity and Response of Antioxidant Enzymes of Phenanthrene Stress on Carp. J. Donghua Univ. 2018, 44, 309–316. [Google Scholar]
  15. Ma, H.; Tsai, T.F.; Liu, C.C. Real-time monitoring of water quality using temporal trajectory of live fish. Expert Syst. Appl. 2010, 37, 5158–5171. [Google Scholar] [CrossRef]
  16. Morgan, W.S. Fish locomotor behavior patterns as a monitoring tool. Water Pollut. Control Fed. 1979, 51, 580–589. [Google Scholar]
  17. Newbold, L.R.; Kemp, P.S. Influence of corrugated boundary hydrodynamics on the swimming performance and behavior of juvenile common carp (Cyprinus carpio). Ecol. Eng. 2015, 82, 112–120. [Google Scholar] [CrossRef]
  18. Wang, L.T.; Ge, C.X.; Wang, J.C.; Dai, J.; Zhang, P.J.; Li, Y.H. Effects of different combinations of Bacillus on immunity and antioxidant activities in common carp. Aquac. Int. 2017, 25, 2091–2099. [Google Scholar] [CrossRef]
  19. Xu, Z.X.; Jiang, Y.P. Lake Eutrophication Assessment: Comprehensive Water Quality Identification Index. J. Tong Ji Univ. 2009, 37, 1044–1048. [Google Scholar]
  20. Yu, J.; Zhao, M.; Hu, Q.W.; Chen, P.M. Ecosystem health assessment of Egong Bay fisheries area in Shenzhen based on index of biological integrity of fish. J. South. Agric. 2017, 48, 524–531. [Google Scholar]
  21. Zhang, J.S.; Huang, Y.; Han, X.B.; Huang, Y.L. Application of changes of the fish behavior in the water quality monitoring. Water Wastewater Eng. 2013, 7, 166–170. [Google Scholar]
  22. Stanton, T. 30 years of advances in active bioacoustics: A personal perspective. Methods Oceanogr. 2012, 1–2, 49–77. [Google Scholar] [CrossRef]
  23. Song, C.; Yan, R.X.; Jiang, M.W.; Peng, R.B.; Han, Q.X. Testing the applicability of marine biotic indices for ecological quality in the northern East China Sea. J. Sea Res. 2023, 195, 102441. [Google Scholar] [CrossRef]
  24. GB11913-89; Water Quality—Determination of Dissolved Oxygen—Electrochemical Probe Method. Ministry of Ecology and Environment of People’s Republic of China: Beijing, China, 1989.
  25. GB/T 20466-2006; Determination of Microcystins in Water. Ministry of Ecology and Environment of People’s Republic of China: Beijing, China, 2006.
  26. GB7481-87; Water Quality―Determination of Ammonia Nitrogen―Salicylic Acid Spectrophotometry. Ministry of Ecology and Environment of People’s Republic of China: Beijing, China, 1987.
Figure 1. Model of the aquatic ecological community structure.
Water 15 04066 g001
Figure 2. Principle of fish trajectory positioning.
Water 15 04066 g002
Figure 3. Sampling section layout of the survey area.
Water 15 04066 g003
Figure 4. Distribution of fish trajectories in space and time (it is mesotrophic in spring, eutrophic in summer and autumn, and oligotrophication in winter). (a) Oligotrophic status; (b) mesotrophic status; (c) eutrophic status.
Water 15 04066 g004
Figure 5. Swimming speed of fish during different stages of water quality change: (a) oligotrophic status, (b) mesotrophic status, and (c) eutrophic status.
Water 15 04066 g005
Figure 6. Histogram of DO, MC-LR, and NH3 in the process of water eutrophication.
Water 15 04066 g006
Figure 7. Distribution of fish trajectories in space and time. (a) Distribution of individual behavioral trajectories of fish in winter and spring; (b) distribution of individual behavioral trajectories of fish in summer and autumn; (c) distribution of individual behavioral trajectories of fish in the direction of water depth in winter and spring; (d) distribution of individual behavioral trajectories of fish in the direction of water depth in winter and spring.
Water 15 04066 g007
Table 1. Definition of each status for nutrient level.
Nutrient Levelρ (Chl-a)/
(mg/m3)
ρ (TP)/
(mg/L)
ρ (TN)/
(mg/L)
ρ (COD)/
(mg/L)
ρ (Transparency)/
(mg/m3)
Oligotrophication≤1.0≤0.004≤0.05≤0.40≥5.0
Mesotrophic≤26.0≤0.050≤0.50≤4.00≥1.0
Eutrophic≤160.0≤0.800≤6.00≤25.00≥0.3
Table 2. Model summary.
ModelCorrelation Coefficient (R)Coefficient of Determination ( R 2 ¯ )Adjusted Coefficient of Determination (R2)Standard Estimate Error (S)
10.997 a0.9940.9940.099846
10.962 a0.9260.9250.045911
10.998 a0.9960.9960.010239
a Predictor variables: (constant), water quality indices fish are sensitive to (DO, MC-LR, NH3).
Table 3. Index system of aquatic ecological health assessment.
Consideration LevelEvaluation IndexUnitIndex DescriptionMeasurement and Calculation Method
Fish movement behavior response y d mDistance of fish from pollution source.
Distance of fish from the water surface.
Fish swimming speed.
Acoustic tracking and positioning system or prediction model
y z m
y v m·s−1
Water quality indices based on fish sensitivityDOmg·L−1An important index that reflects the state of water pollution and its self-purification ability and the main index that affects the movement of fish.Electrochemical probe method [24]
MC-LRmg·L−1A freshwater cyanotoxin with the strongest toxicity and the most serious damage to fish among all microcystins, a strong liver tumor promoter with the widest distribution.High-performance liquid chromatography (HPLC) method for the determination of microcystins in water [25]
NH3mg·L−1Nitrogen in the form of non-ionic ammonia NH3 is an important indicator of water pollution, and its toxicity to fish can reach tens or even hundreds of times that of ionic ammonia.Ammonia nitrogen NH3-N conversion algorithm
Spectrophotometric method [26]
Table 4. Classification of indicators for water ecological health assessment.
Serial NumberIndexSymbolUnitHealth LevelNote
HealthSub-HealthMild DiseaseDiseaseSevere Disease
1Dissolved oxygenDOmg·L−18.306.505.003.502.00
2Microcystin-LRMC-LRmg·L−100.300.681.001.85
3Non-ionic ammoniaNH3mg·L−100.100.300.852.00
4Distance of fish from pollution source y d mUnlimited153070200
5Distance of fish from the water surface y z mUnlimitedUnlimited0.4 h0.3 h0.2 hh is the water depth
6Fish swimming speed y v m·s−10.550.450.350.300.25
Disclaimer/Publisher’s Note: The statements, opinions and data contained in all publications are solely those of the individual author(s) and contributor(s) and not of MDPI and/or the editor(s). MDPI and/or the editor(s) disclaim responsibility for any injury to people or property resulting from any ideas, methods, instructions or products referred to in the content.

