Article

Study on the Impact of Emulsion on Mine Water Quality and Health Risk Assessment

1
State Key Laboratory of Water Resource Protection and Utilization in Coal Mining, National Institute of Clean and Low Carbon Energy, Beijing 102211, China
2
School of Chemical Safety, North China Institute of Science and Technology, Langfang 065201, China
3
College of Environmental Science and Engineering, North China Electric Power University, Beijing 102206, China
4
National Energy Shendong Coal Group Co., Ltd., Yulin 719315, China
5
China Institute of Water Resources and Hydropower Research, Beijing 100038, China
*
Author to whom correspondence should be addressed.
Water 2023, 15(23), 4086; https://doi.org/10.3390/w15234086
Submission received: 29 October 2023 / Revised: 16 November 2023 / Accepted: 21 November 2023 / Published: 24 November 2023

Abstract

:
The composition of emulsion is complex. In the process of coal mining, the emulsion required by the hydraulic equipment can enter the mine water through a variety of channels, thereby affecting the water quality of the mine. In this study, the mine water of a super large coal mine, Daliuta Coal Mine, was collected, and static and dynamic simulation tests were designed to analyze the changes in various water quality indicators of mine water containing different concentrations of emulsions over time. Furthermore, the health risk assessment model was applied to evaluate the health risks of hexavalent chromium (Cr6+) and chloride in mine water containing emulsions on different populations. The results indicate that the alkaline substances such as sodium castor oil in the emulsion can increase the pH value of mine water, but it is more obvious when the emulsion concentration is high. The mine water itself contains chloride and sulfate exceeding 300 and 400 mg/L, respectively, and the addition of emulsion under static conditions has little effect on them, while the amount of emulsion added under dynamic conditions reaches 20 mL/L, which has a significant impact. The emulsion contains a certain amount of Cr6+ and can affect the total dissolved solid content, total hardness, and other indicators of mine water through mechanisms such as adsorption, solubilization, and chemical precipitation. The calculation results of the health risk assessment model indicate that the excessive chloride in the mine water in the area poses a potential non-carcinogenic risk to all populations exposed to their environment. The health risk index of Cr6+ increases with the increase in emulsion content in mine water, and the potential non-carcinogenic risk is higher for children. Overall, emulsions can significantly deteriorate the quality of mine water. This research can provide a scientific theoretical basis for subsequent study of mine water pollutant treatment, water quality monitoring and management, and health risk assessment, thereby contributing to reducing the health risks it brings and protecting the safety of local groundwater quality.

1. Introduction

An emulsion is a mixture of water, base oil, surfactants, additives, etc., in a certain proportion [1,2]. Due to the characteristics of cooling, lubrication, and pressure transfer, emulsions are widely used in the cutting and grinding processes of machine parts in mechanical manufacturing and metal processing industries [3,4]. In recent years, with the continuous improvement of the mechanization level of coal mining equipment [5,6], emulsion, as a means of maintaining the normal operation of underground hydraulic supports, has also been widely used [7]. During processes such as emulsion replacement or equipment leakage, some of the emulsion will enter the mine water along with wastewater generated from coal mining. When mine water containing emulsion enters the external environment, the emulsified oil and dissolved oil will hinder the migration of oxygen from the air to the water, affecting the respiration of aquatic organisms. The self-purification capacity of water will gradually weaken, and the water quality will also gradually deteriorate, thereby affecting the ecological balance of the water environment. When emulsified mine water enters the soil environment, harmful substances can be absorbed by plants, transmitted through the food chain, and enriched, ultimately into the human body, posing a threat to human health [8,9].
At present, relevant research mainly focuses on the hazards of emulsion waste liquid and its treatment [10], the impact of mine water quality on emulsion properties, and the improvement of emulsion waste liquid treatment technology [11,12,13,14,15]. However, the impact of emulsions on the quality of mine water and the evaluation of the human health risks of mine water containing emulsions have not been reported yet. During the coal mining process, water pollution caused by the leakage of emulsion is a common phenomenon and poses certain risks to human health. Therefore, the changes in water quality (the content of a variety of pollutants) over time after different concentrations of emulsions enter the mine water are studied, and the human health risk evaluation is conducted. This study has important guiding significance for understanding the pollution risk of mine water containing emulsion to the environment. It also has important practical significance, which can provide data and theoretical support for targeted treatment of pollutants in mine water before it is discharged into the environment. By adopting corresponding governance measures, it can reduce the harm to the environment and human beings.
The mine water used in this study was collected from the Daliuta Coal Mine in Shenmu County, Shaanxi Province of China. As a super large modern mine with an annual production capacity of over 20 million tons, a large amount of emulsion is required to maintain the operation of the underground hydraulic support. Therefore, the impact of emulsion on the water quality of the mine water and the potential pollution risk to the external environment must be considered. The process of groundwater inflow or infiltration into mines and then discharge, transforming it into surface water, can affect the quality of water resources. In some areas, only the sewage discharged from mines can be used for irrigation, which seriously affects the quality of agricultural products.
A study was conducted to investigate the impact of emulsion on the quality of mine water and the potential health risks of mine water containing emulsion to human beings. The main experimental design and research contents included: (i) to fully simulate the possible transformation process of an emulsion into mine water, static and dynamic simulation conditions were established; (ii) the changes in various water quality indicators over time after various physical and chemical reactions in mine water with different concentrations of emulsions were compared and analyzed; and (iii) the health risk assessment model was used to quantitatively assess the potential impact of chloride and hexavalent chromium (Cr6+) in the mine water containing different concentrations of emulsions on the health of different populations. The water quality indicators studied in this article include pH value, total dissolved solids (TDS), chloride, sulfate, Cr6+, and total hardness.

2. Experiments and Health Impact Assessment

2.1. Experimental Device

The mine water used in the experiment was collected from Daliuta Coal Mine in Shenmu County, Shaanxi Province. The location of the coal mine is shown in Figure 1. The static experiment used five beakers containing 2 L of mine water, and emulsions were added to each beaker at a ratio of 0 mL/L, 1 mL/L, 5 mL/L, 10 mL/L, and 20 mL/L. These 5 beakers were shaded and sealed, and samples were taken for testing on the 1st, 5th, 10th, 20th, and 30th days after 24 h of static storage.
In the process of coal mining, when a large number of goaf collapses, and surface cracks occur, surface water will seep into the underground or mining pits to form mine water. During the process of mining and discharging mine water, groundwater may flow into the mines. This study set up a dynamic experimental device to simulate the dynamic change process of mine water in reality. In order to form a comparison with the changes in the composition of mine water in static experiments, the concentrations of emulsion in mine water of 5 dynamic experimental equipment were consistent with that in static experiments, and the equipment had also been sealed and shaded. By adding materials such as coal, sand, and stone as media layers to the infiltration column, the adsorption and transformation of various components of emulsion in mine water by relevant substances in dynamic water bodies were simulated. By detecting and analyzing the corresponding components in mine water, the changing trends of various water quality indicators were identified, and their influencing factors were analyzed.

2.2. Experimental Steps

2.2.1. Characteristics of Water Quality Indicators

The pH value, as a scale of hydrogen ion activity, describes the degree of acidity and alkalinity of the solution and is an important indicator of water quality [16]. This study investigates the impact and mechanism of emulsions on the pH of mine water by detecting changes in pH in water samples. Total dissolved solids (TDS) refer to the total content of all inorganic and organic solutes in water, measured in milligrams per liter (mg/L) [17,18]. Both chloride ions and sulfate are important indicators that affect water quality [19,20]. Chloride ion is widely present in nature and has a corrosive effect on metals. Sulfate mainly comes from geological minerals, mostly in the form of calcium sulfate and magnesium sulfate. It has a corrosive and destructive effect on metals and building materials and can pose a threat to the health of animals and plants. Drinking water with excessive sulfate content can cause diarrhea, dehydration, and gastrointestinal disorders in the human body. Therefore, this experiment also takes chloride ions and sulfate in mine water as detection objects.
Total hardness refers to the total concentration of metal ions such as calcium and magnesium ions in water [21,22,23]. Excessive total hardness content in water can have a certain impact on people’s production and life, agricultural irrigation, ecological environment, etc. Therefore, it is necessary to detect the total hardness of mine water. Hexavalent chromium (Cr6+), as a common pollutant, is highly toxic and difficult to decompose and remove in water. It can accumulate and diffuse in the environment, causing serious pollution to water quality [24,25]. Cr6+ can affect the metabolism of aquatic organisms and further affect the ecosystem balance of water bodies. If wastewater containing Cr6+ is used for irrigation of farmland, the Cr6+ will accumulate in the soil, inhibit crop growth and development, and accumulate in the human body through the food chain, leading to serious consequences such as organ damage and cancer [26,27]. Therefore, this study explores the extent and mechanism of the impact of emulsions on Cr6+ in mine water, which can provide data support for the local treatment of mine water containing emulsions.

2.2.2. Measurement of Water Quality Indicators

(1)
Determination of pH value.
Firstly, calibrate the pH meter in a standard buffer solution with pH = 4.00, pH = 6.86, and pH = 9.18. Then, place 20 mL of the solution to be tested into a beaker and measure the pH value using the calibrated pH meter.
(2)
Determination of total dissolved solids (TDS) content.
Place 20 mL of the water sample to be tested into a beaker and measure it using a TDS detection pen.
(3)
Determination of the content of chloride and sulfate.
The ion chromatography analysis method is used to determine the concentration of chloride ions and sulfate ions. Firstly, pre-treatment is carried out: the filtered solution to be tested is placed in an adsorption resin and cation exchange resin column to remove insoluble substances, dissolved organic matter, and heavy metal ions from the water sample to be tested. Secondly, prepare eluent of 0.0018 mol/L Na2CO3 and 0.0017 mol/L NaHCO3, as well as standard solution series for the tested anions. Then, filter the standard solutions of the tested anions through a 0.45 μm microporous filter membrane and inject them into the chromatograph, record the peak area, and draw the standard curve. Finally, filter 50 mL of the pre-treated sample and eluent through a 0.45 μm microporous filter membrane and then inject it into the chromatograph to obtain the peak plot of the corresponding ion, and the concentration of chloride or sulfate can be calculated based on the standard curve.
(4)
Determination of the content of hexavalent chromium (Cr6+).
Draw standard curves: add 0, 0.20, 0.50, 1.00, 2.00, 4.00, 6.00, 8.00, and 10.00 mL of Cr6+ standard solution to 9 colorimetric tubes with a capacity of 50 mL, dilute with water to the mark, and then add 0.5 mL of 1 + 1 sulfuric acid, 0.5 mL of 1 + 1 phosphoric acid and 2 mL of chromogenic agent separately, and shake evenly. After 5 to 10 min, measure the absorption value using a 1 cm colorimetric dish at a wavelength of 540 nm. Then, use deionized water as a reference for blank correction and draw a standard curve with absorbance as the vertical axis and the corresponding concentration of Cr6+ as the horizontal axis.
Sample measurement: firstly, filter the mine water sample to avoid the impact of suspended particles on the analysis results and damage to the instrument. Then, take 30 mL of filtered water sample, put it into a 50 mL colorimetric tube, and dilute it with water to the standard line. After blank correction, the content of Cr6+ can be obtained from the standard curve based on the measured absorbance.
(5)
Total hardness measurement.
Place 50 mL of the water sample to be tested and add 5 mL of ammonia ammonium chloride buffer and 4 drops of chrome black T indicator. Titrate with 0.01 mol/L EDTA standard solution until the color changes from wine red to pure blue. Then, calculate the total hardness based on the consumption and concentration of EDTA standard solution:
X = ( V × M × 100 . 08 ) / V w   × 1000
where X represents the total hardness content in the water sample (mg/L); V is the volume consumed by EDTA standard solution during titration (mL); M is the concentration of EDTA standard solution (mol/L); Vw is the volume of water sample (mL); and 100.08 is the molar mass of CaCO3 (g/mol).
To ensure the accuracy and precision of the analysis results, three replicate tests on all indicators were conducted, and the final results were averaged to reduce experimental error. The correlation coefficients of standard curves for Cr6+, chloride, and sulfate are all greater than 0.999 (Figure S1).

2.3. Health Risk Assessment

The water quality index (WQI) is an effective tool for accurately evaluating the impact of various pollutants on water quality [28,29]. In order to assess the potential impact of various pollutants on human health, the U.S. Environmental Protection Agency’s (EPA) (Washington, DC, USA) health risk assessment model is applied to estimate the risk level of Cr6+ and chloride in mine water to human health. The health risk index (hazard quotient, HQ) can be expressed as:
H Q = D i / R f D
where Di is the sum of the human exposure (mg/kg·d) caused by exposure routes such as oral intake and skin contact and RfD is the reference dose for non-carcinogenic exposure pathways (mg/kg·d). When HQ > 1, it indicates that the pollutant may pose a potential non-carcinogenic risk; when HQ < 1, it can be considered that there is no chronic non-carcinogenic risk [30].
According to the comprehensive risk information system database of the United States Environmental Protection Agency, the reference dose RfD of Cr6+ through drinking water is 0.003 mg/kg·d; the reference dose RfD of chloride through drinking water is 0.1 mg/kg·d. The Di can be expressed as:
D i = E D / B W
E D = C   ×   I R
where ED is the daily intake of corresponding indicators (mg/d); BW is the weight of the body (kg); IR is the daily water intake (L/d); and C is the concentration of the analyzed indicator (mg/L).
Considering the significant differences in health risks among different age groups, the population is now divided into 5 groups: infants (0 to 0.5 years old), children (0.5 to 10 years old), youth (10 to 18 years old), adult men (18 to 70 years old males), and adult women (18–70 years old females). The reference parameters of IR and BW are shown in Table 1 [31,32].

3. Results Analysis

3.1. Analysis of the Influence of Emulsion on Mine Water Quality

Six indicators of mine water containing different concentrations of emulsion under static and dynamic conditions were measured and analyzed on the 1st, 5th, 10th, 20th, and 30th days after adding the emulsion for 24 h (allowing it to be fully mixed). The statistical summary of six indicators under static and dynamic conditions is shown in Table 2.

3.1.1. pH Value

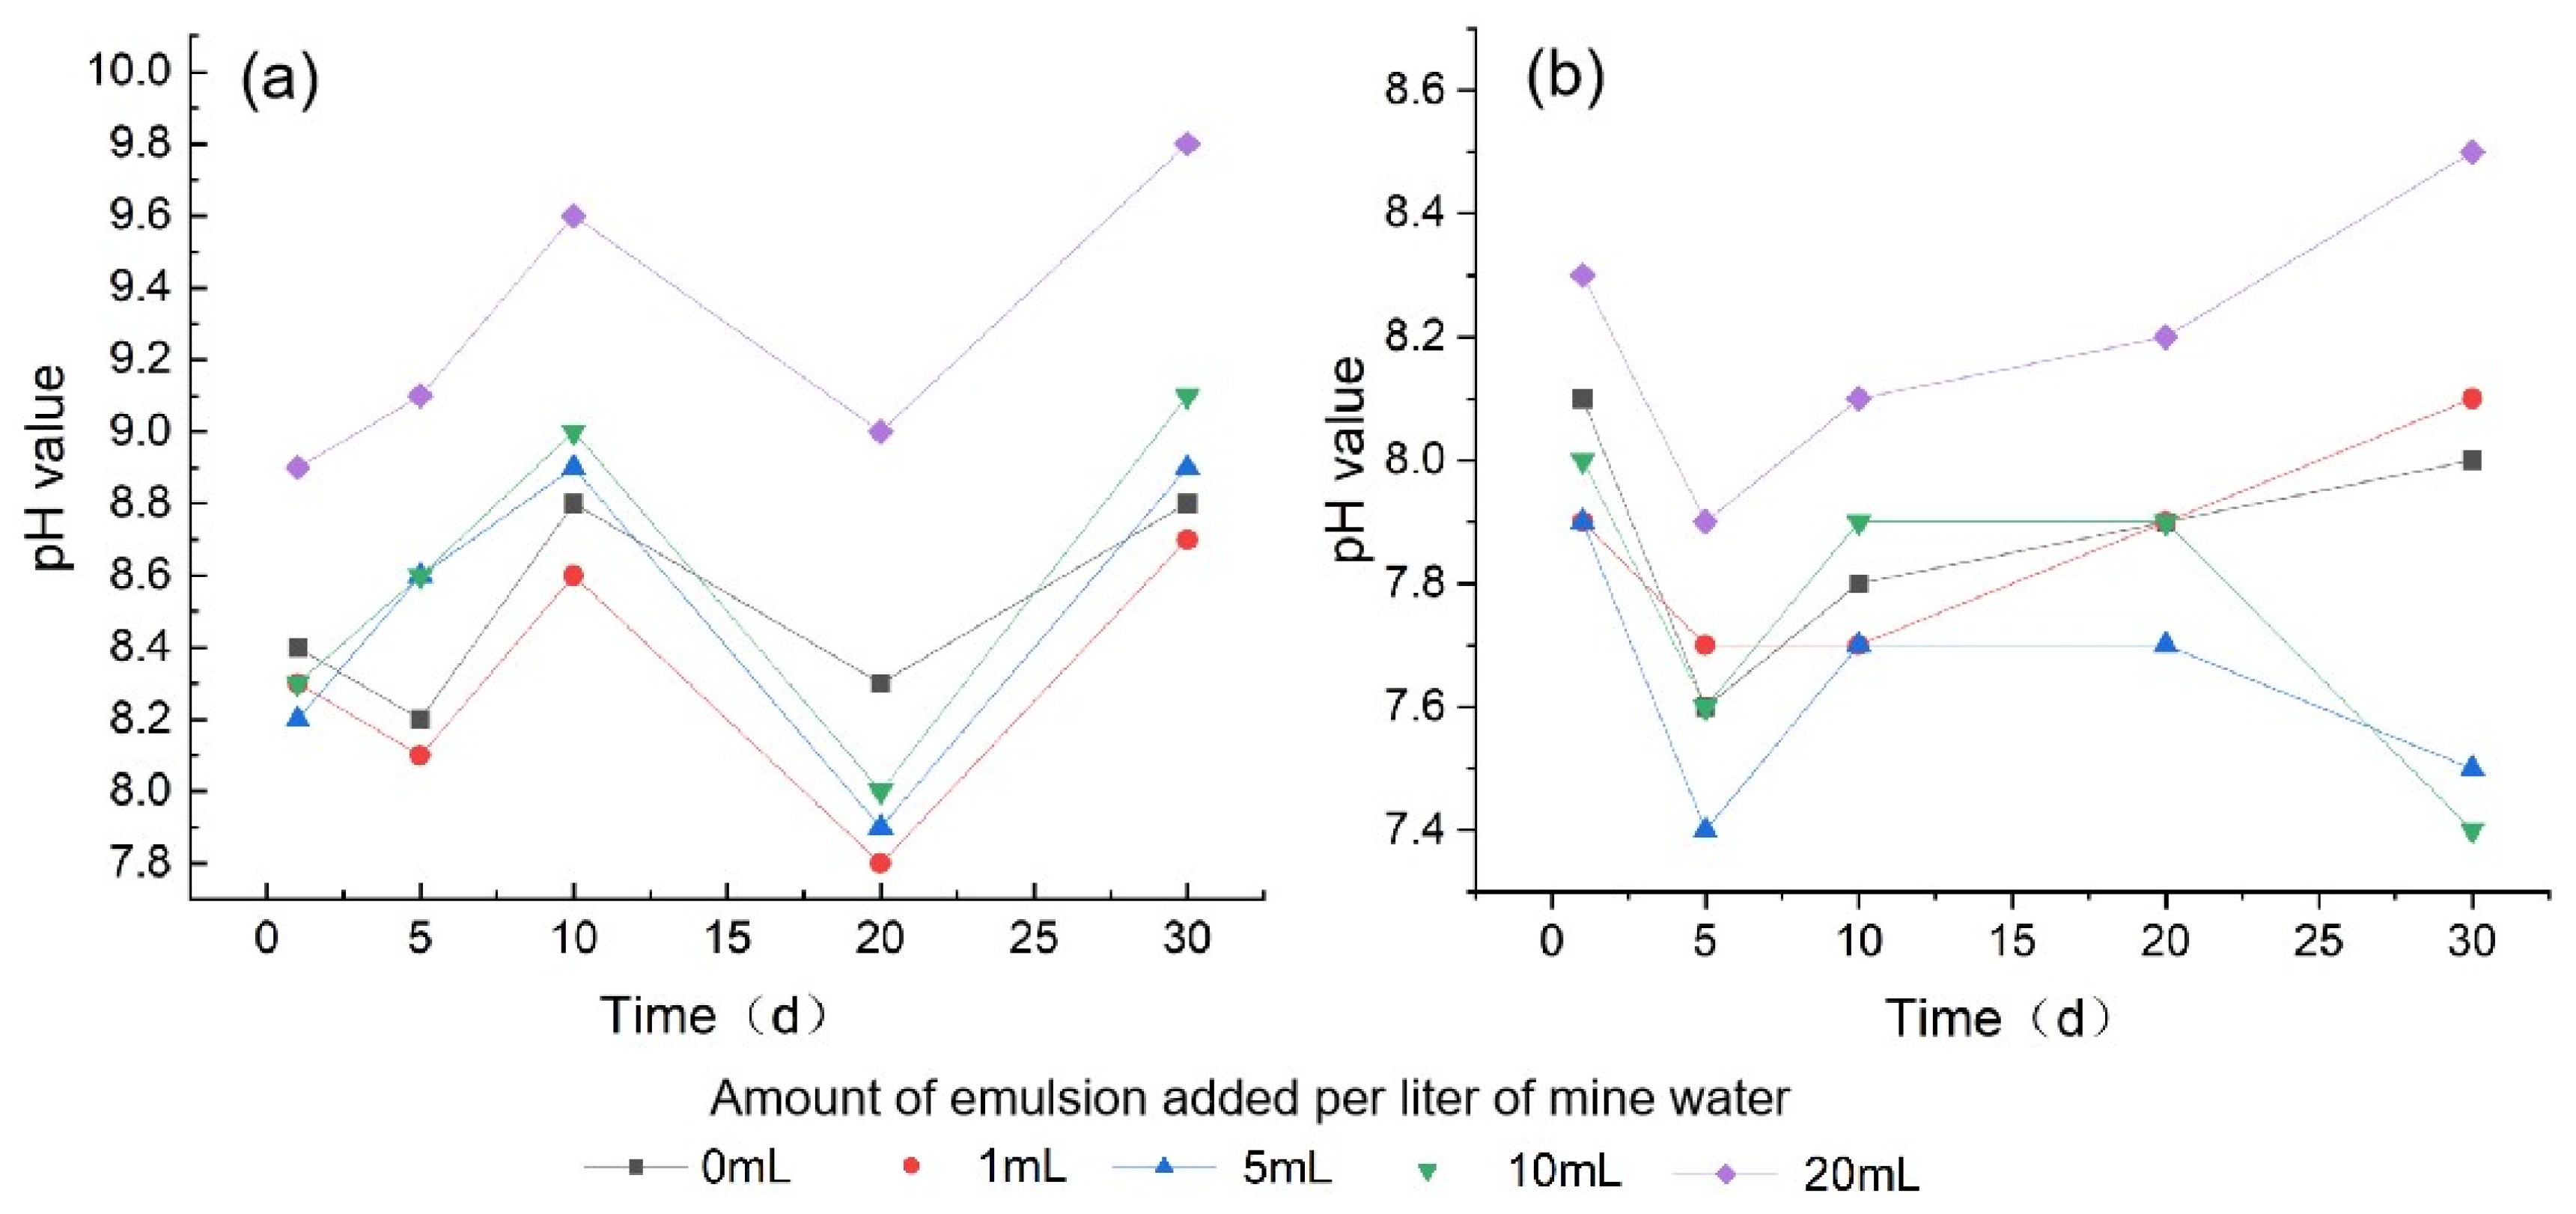
The changes in the pH value of mine water containing different concentrations of emulsion under dynamic and static test conditions within 30 days are shown in Figure 2. Under static conditions, the pH values of mine water containing different concentrations of emulsions exhibit consistent fluctuations over time and reach their maximum values by the 30th day. The pH values of each solution are shown in Table 3 at this time, and the pH value of mine water containing 1, 5, and 10 mL/L emulsions show little change compared to mine water without emulsions (with a maximum of only 0.3).
When the addition of emulsion reached 20 mL/L, the pH value of mine water remained significantly higher than the pH values of other solutions, and on the 30th day, it rose to the maximum value of 9.84, which is 0.98 higher than the pH value of the mine water without emulsion added. This is because the alkaline substances such as sodium castor oleate contained in the emulsion can consume hydrogen ions in the mine water, causing an increase in the pH value of the mine water. The mine water contains NaHCO3 and Na2CO3, which have a buffering effect on the pH value. The impact on the pH of the mine water only becomes prominent when the alkaline substance in the emulsion exceeds a certain content.
Similar to static conditions, the pH value of mine water with the maximum content of emulsion added under dynamic conditions remained significantly higher than the pH values of other solutions. However, overall, the pH values of mine water under dynamic tests are significantly lower than those under static conditions. This is because the water-bearing medium layer of the filtration column in dynamic experiments can adsorb alkaline substances in the mine water. In addition, soluble salts in mine water have a corrosive effect on the aquifer medium, which consumes OH in the solution. As the dissolution process progresses, the mineralization degree of the solution gradually increases, and the dissolution effect gradually weakens. Some alkaline substances, such as sodium castor oleate adsorbed on the medium layer, are re-released into the solvent. The pH fluctuates with the progress of the adsorption and analysis processes.

3.1.2. Total Dissolved Solids (TDS)

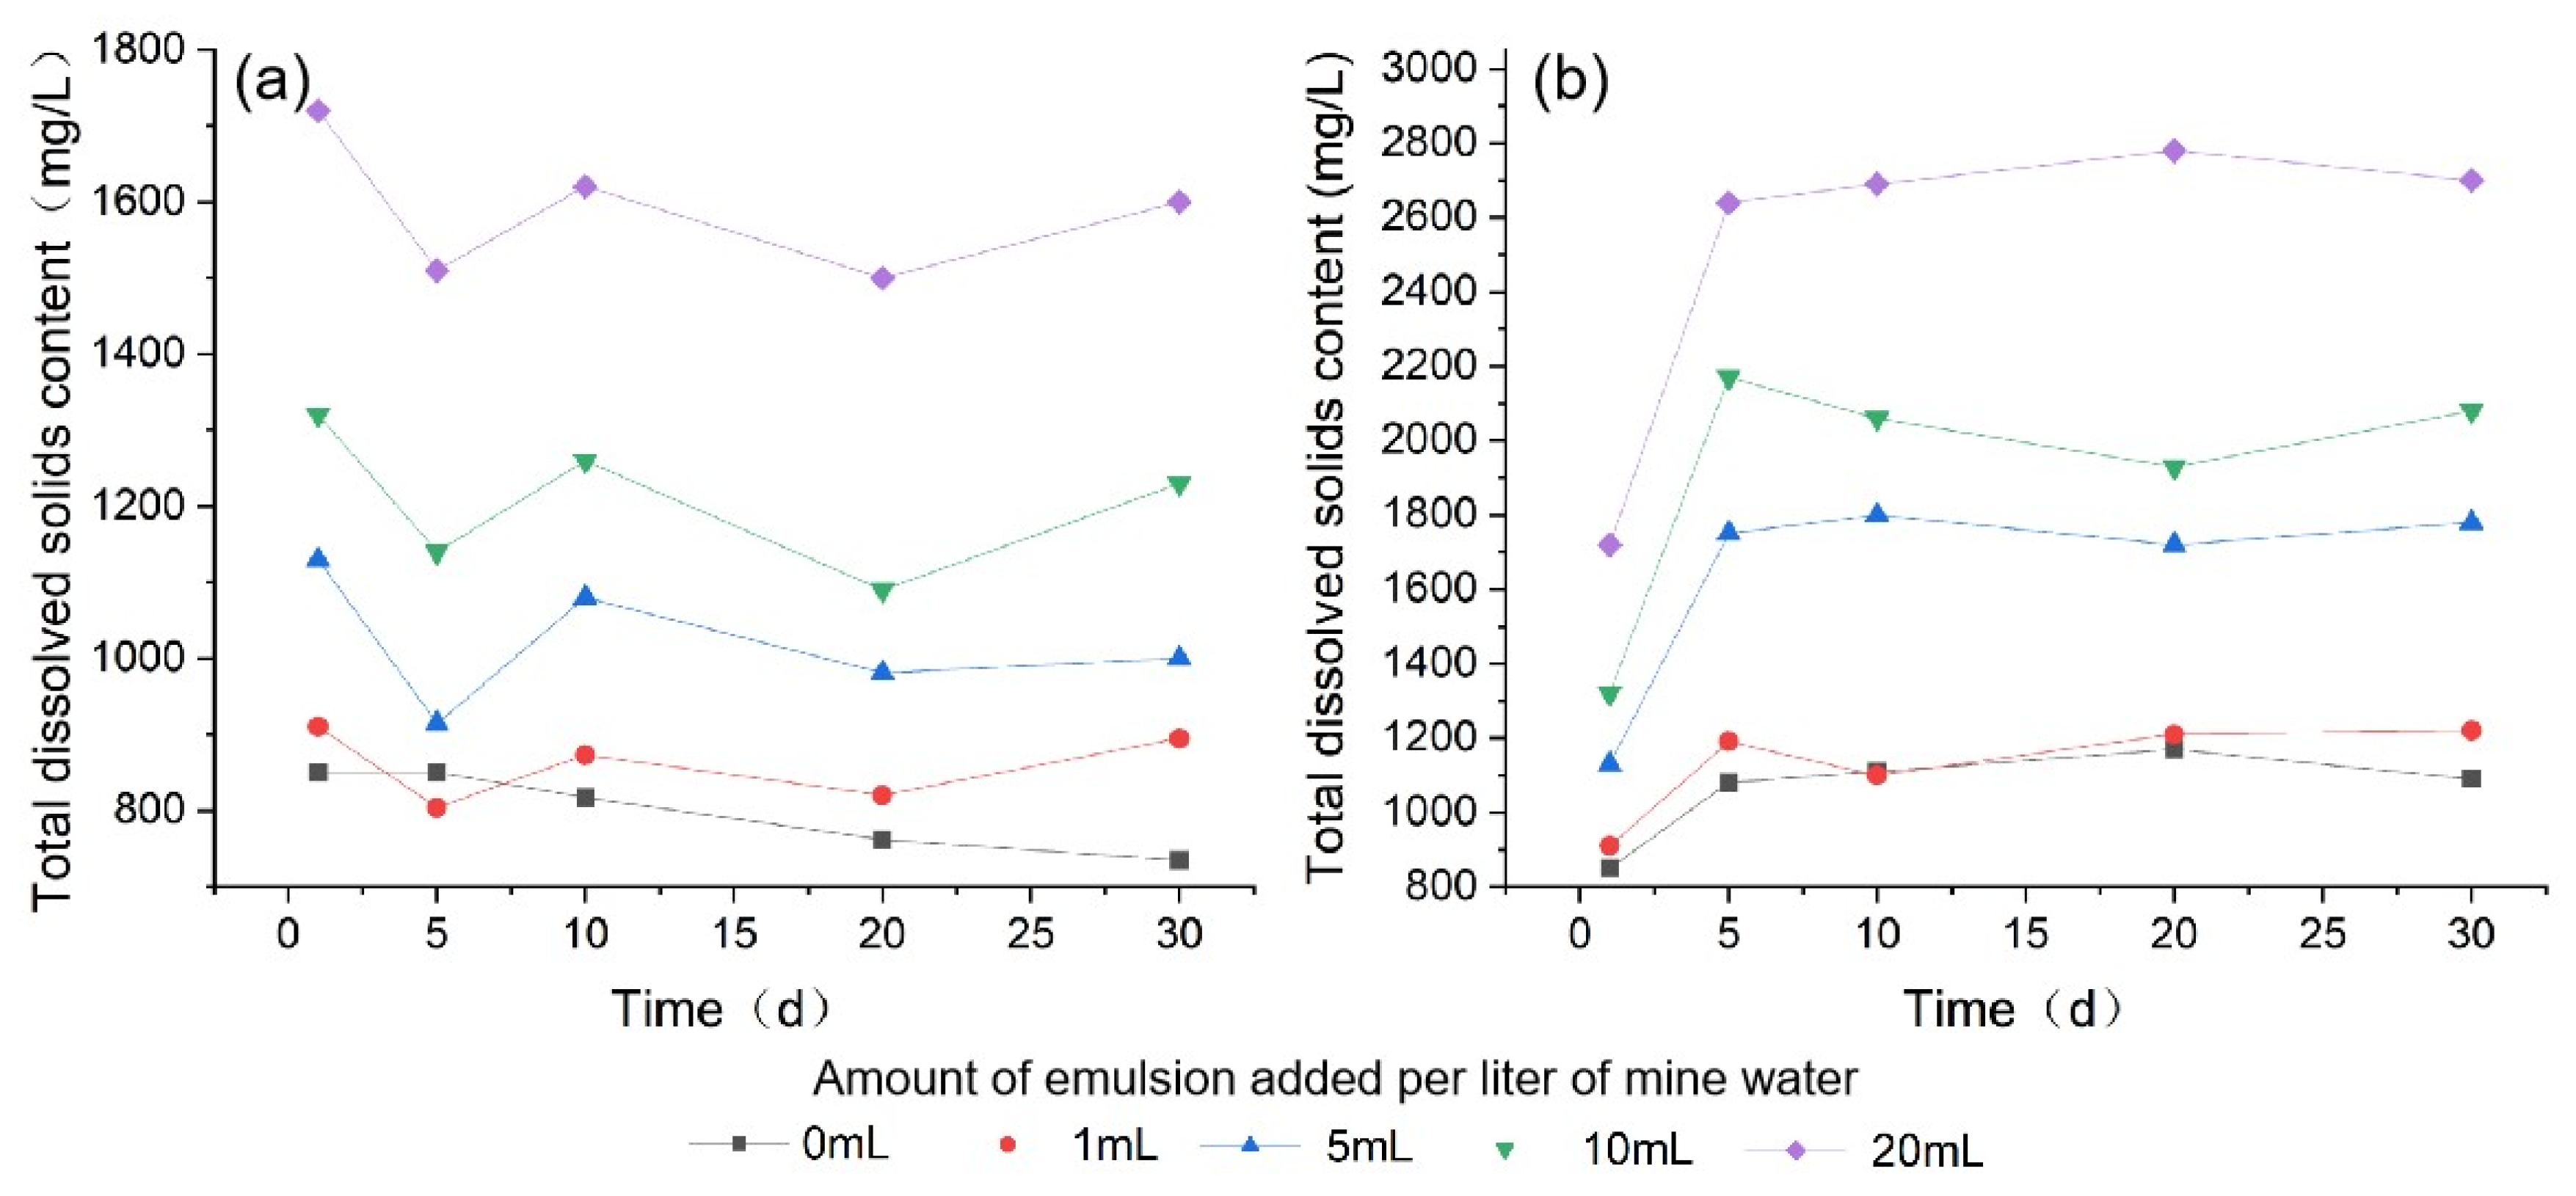
The content of TDS in mine water containing different concentrations of emulsions at different periods under dynamic and static test conditions is shown in Figure 3. It can be seen that the initial content of TDS in mine water under static conditions is consistent with that under dynamic conditions and increases with the increase in emulsion content. Compared to mine water without emulsion, mine water containing emulsion of 1, 5, 10, and 20 mL/L can increase the initial TDS content by approximately 60, 56, 47, and 43 mg/L per milliliter of emulsion, respectively. The increase in TDS brought by per unit volume of emulsion decreases with the increase in emulsion. This is because, in mine water, the adsorption of particulate matter on the dissolved solids contained in the emulsion is much greater than the compatibilization effect of the surfactant on the insoluble organic particles in the mine water, resulting in measured values lower than the sum of the TDS content of the mine water and emulsion.
Under static conditions, the TDS content in mine water without emulsion gradually decreases over time until reaching the minimum value of 735 mg/L on the 30th day. The TDS content in mine water with emulsion has a consistent trend over time, starting from 910, 1130, 1320, and 1720 mg/L on the 1st day and increasing and decreasing in the same direction during the 2–5th measurement (Table 4), reaching 895, 1000, 1230, and 1600 mg/L on the 30th day, respectively, and the fluctuation amplitude gradually narrows and tends to stabilize. After adding the emulsion, the total dissolved solids in the mine water will decrease and then fluctuate up and down within a certain range of fluctuations. This is because the particulate matter in the mine water adsorbs the total dissolved solids contained in the emulsion, and the process of adsorption and desorption gradually stabilizes over time.
Under dynamic conditions, the TDS content in the mine water with 0, 1, 5, 10, and 20 mL/L of emulsion gradually increased from 850, 910, 1130, 1320, and 1720 mg/L on the first day and reached the stage maximum values of 1085, 1190, 1775, 2170, and 2630 mg/L on the fifth day, respectively, and then tended to stabilize. After the 10th day, the absolute values of the difference in change amplitude were only 1.4%, 10.9%, 0.9%, 1.5%, and 0.4%, respectively. The TDS content in the mine water with various dosages of emulsion added in the dynamic experiment increased significantly on the 5th day, far exceeding the measured values in the static experiment. This is because the dissolved solid adsorbed by particles in the mine water is released into the solution with the disturbance of water flow, which is significantly stronger than the solubilization effect of surfactants in emulsions. At the same time, soluble salts in mine water have a corrosive effect on the medium filled in the filtration columns. The TDS in some solutions slightly decreased after 5 days, which is caused by the adsorption of small amounts of dissolved solids by substances such as sand, stone, and coal in the medium layer.

3.1.3. Chloride

Figure 4 shows the changes in the chloride content of mine water containing different concentrations of emulsions under static and dynamic test conditions within 30 days. Under static conditions, the chloride content in mine water shows irregular changes over time after adding different concentrations of emulsions. As the content of emulsion increases, the chloride content in mine water increases slightly in the initial stage, indicating that a small amount of chloride in the emulsion has little impact on the chloride content in the mine water. On the 30th day, the maximum chloride content was measured in the mine water containing 1 mL/L of emulsion. Adding an emulsion content lower or higher than 1 mL/L to mine water can lead to a decrease in chloride concentration. The chloride content in the sample with 20 mL/L of emulsion is close to that of the sample without emulsion on the 30th day. This is because under static conditions, after a long period of standing, particles in mine water mainly adsorb chloride through the van der Waals force. When a small amount of emulsion (1 mL/L) is added, the competitive adsorption of particles on the substances in the emulsion leads to a significant decrease in the adsorption capacity of chloride. As the amount of emulsion added increases, the amount of hydroxyl and methoxy organic matter attached to the particles in the mine water gradually increases, and the adsorption capacity of chloride gradually increases through chelation and chemical bonding mechanisms.
Under dynamic conditions, the chloride content of mine water with different concentrations of emulsions fluctuated within the range of 300 to 325 mg/L in the first 5 days, consistent with static conditions. However, after the 5th day, the chloride content in the mine water added with 20 mL and 5 mL emulsions showed a significant increase trend, and after the 10th day, the chloride content in other mine water containing different emulsions also showed a significant increase trend. This is because the chloride contained in the medium layer is released, indicating that the release rate of chloride underwater flow disturbance is not proportional to the amount of emulsion. The release is faster under 20 mL and 5 mL conditions, but as time increases, the amount of chloride dissolved in the medium layer is proportional to the concentration of the emulsion. By the 30th day, the chloride content in the mine water reached 341.1, 308.1, 309.8, 414.4, and 466.2 mg/L, respectively, corresponding to the concentration of the emulsion from 0 to 20 mL/L.

3.1.4. Sulfate

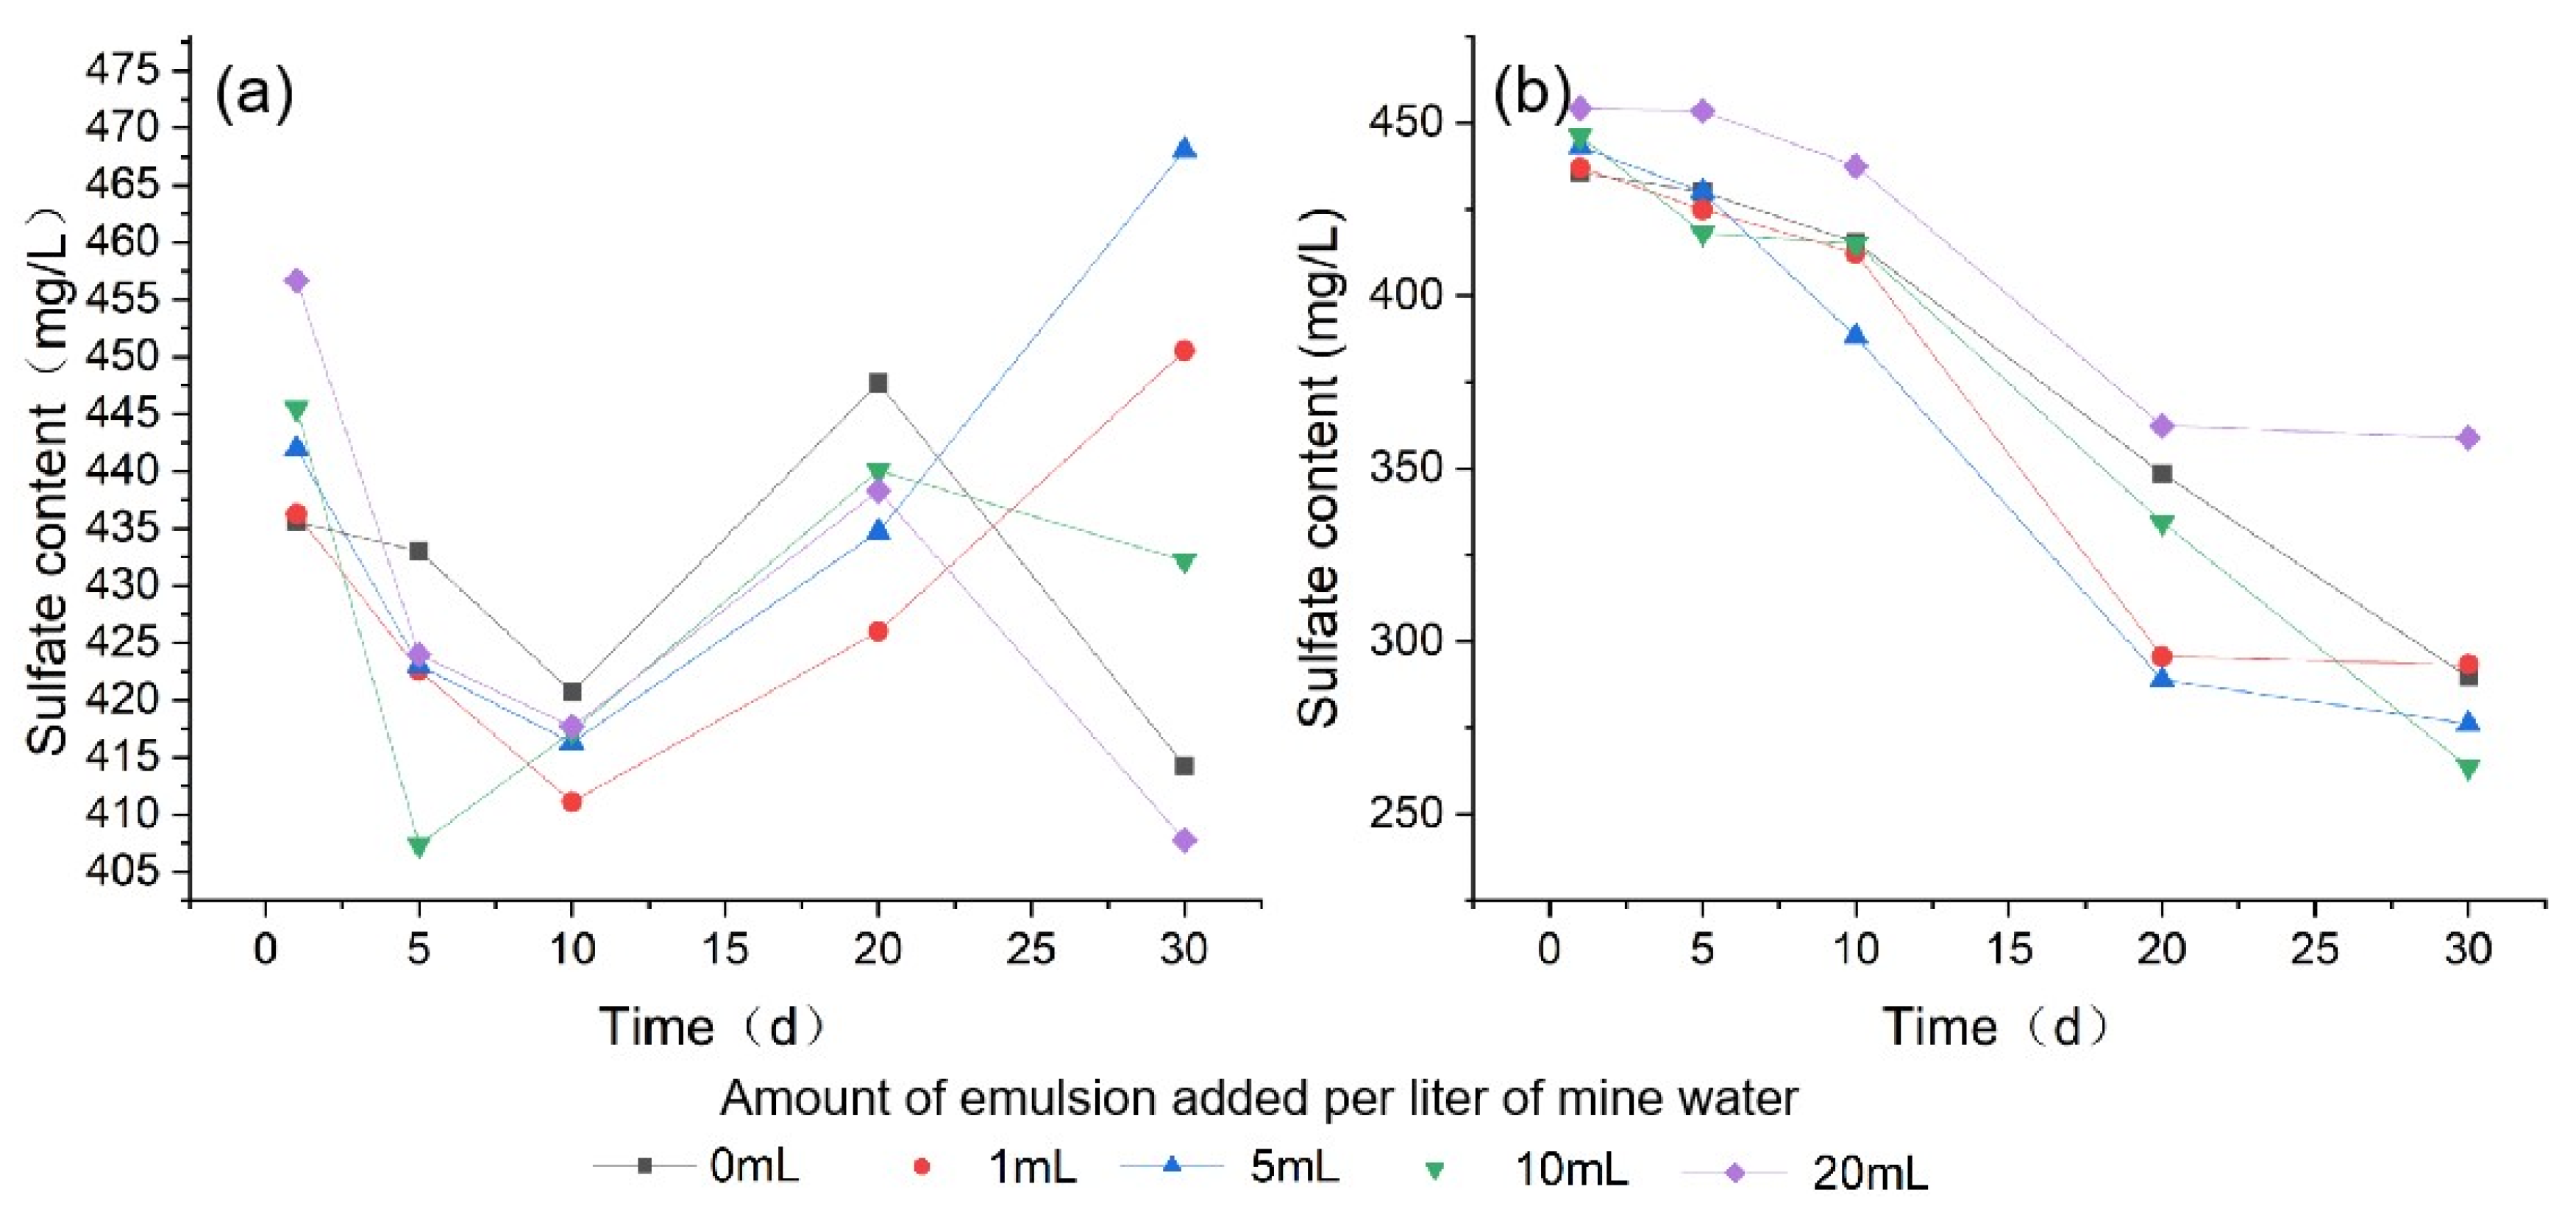
The sulfate content of mine water with different concentrations of emulsions at different time periods is shown in Figure 5. Under static conditions, the sulfate content in mine water is close to that under dynamic conditions in the initial stage and increases with the addition of emulsion. On the first day, the sulfate content is 435.6, 436.3, 442.0, 445.5, and 456.7 mg/L, respectively. This indicates that the emulsion only contains a small amount of sulfate, which has little impact on the sulfate content of mine water. On the 30th day, the maximum sulfate content was measured in the sample containing 5 mL of emulsion, while the sulfate content in the sample containing 20 mL of emulsion was close to that of the sample without emulsion. This is similar to the change in chloride under static conditions in Figure 4, which is also caused by the decrease and then increase in the adsorption of sulfate by solid particles contained in the mine water as the amount of emulsion added increases.
Under dynamic test conditions, the sulfate content in the mine water of the emulsion is 435.6, 437.1, 443.1, 446.2, and 454.3 mg/L on the first day. However, the sulfate content in the mine water continued to decrease over time under dynamic conditions until reaching the minimum values of 289.7, 293.3, 276.1, 263.7, and 358.9 mg/L on the 30th day. This is because the sand, stone, and coal media in the infiltration column have good filtration, adsorption, and fixation capabilities for pollutants. When the mine water flows through the water-bearing medium layer, the sulfate will be adsorbed and fixed. At the same time, as various substances adsorbed in the medium layer gradually accumulate, calcium, magnesium, and other substances in it will promote the aggregation and fixation of sulfate in the mine water towards the particle surface, thereby purifying the sulfate in the mine water and reducing the sulfate content.

3.1.5. Hexavalent Chromium (Cr6+)

The variation in Cr6+ in mine water with different concentrations of emulsions within 30 days is shown in Figure 6. Under static conditions, no Cr6+ was detected in the mine water without emulsion, indicating that the mine water itself does not contain Cr6+. The maximum content of Cr6+ measured multiple times in mine water with no more than 5 mL of emulsion does not exceed 0.1 mg/L. The Cr6+ content in mine water with 10 and 20 mL/L of emulsion added significantly increased on the 5th day compared to the first day, reaching the maximum values of 0.73 mg/L and 1.82 mg/L within 30 days, respectively. This indicates that the emulsion contains a certain amount of Cr3+, and in the early stage, after the emulsion was added to mine water, some Cr3+ was oxidized to Cr6+, and in an alkaline environment, some Cr3+ would form precipitates. After adding 10 mL/L and 20 mL/L emulsions to the mine water, the Cr6+ content significantly decreased between 20 and 30 days. This is because during this period, the pH of the mine water increased significantly, and more Cr3+ reacted with OH- to form precipitates, breaking the chemical equilibrium relationship between Cr3+ and Cr6+, and some Cr6+ was converted into Cr3+. The range of changes in Cr6+ content in mine water with 10 mL/L and 20 mL/L emulsions within 30 days is 0.264 mg and 0.515 mg/L, respectively.
Under dynamic conditions, Cr6+ has also not been detected in the mine water without emulsion, indicating that there is no leaching of Cr6+ in the medium layer. In the mine water with no more than 5 mL/L of emulsion added, the maximum content of Cr6+ measured multiple times does not exceed 0.1 mg/L. The Cr6+ content in mine water with 10 mL/L and 20 mL/L emulsions was close to the static conditions during the first measurement but decreased significantly and then stabilized after the 5th and 10th days, reaching 0.198 and 0.754 mg/L by the 30th day, respectively. In the early stage, the rate at which Cr3+ in the emulsion is oxidized to Cr6+ is significantly lower than the rate at which Cr6+ is solidified by the medium layer of the filtration column. However, the adsorption and solidification effect weakens over time, and the conversion of Cr3+ to Cr6+, as well as the adsorption and desorption process of Cr6+, gradually approaches equilibrium.

3.1.6. Total Hardness

Figure 7 shows the total hardness of mine water containing different concentrations of emulsions at different time periods. Under static conditions, the total hardness of mine water containing 10 mL/L and 20 mL/L of emulsions fluctuates smoothly in the range of 98 to 123 mg/L, while other mine water containing different emulsion contents has significantly higher total hardness, with a large fluctuation range (132 to 207 mg/L) and a relatively consistent fluctuation direction. There is a significant negative correlation between the total hardness of mine water and the amount of emulsion added, and the more emulsion content there is, the smaller the change in the total hardness of mine water. This is because the surfactant in the emulsion can combine with calcium and magnesium ions to form colloidal particles or precipitates. With the increase in emulsion content in mine water, the reaction between surfactants and calcium and magnesium ions in mine water is faster and more complete, resulting in a lower total hardness of mine water. The reason why the total hardness fluctuation amplitude of mine water containing 10 and 20 mL/L emulsions is very small is that the hardness ions in the mine water have basically reacted with surfactants before the first measurement.
Under dynamic conditions, the total hardness of mine water with different concentrations of emulsions showed a significant increase trend in the first 10 days, reaching the maximum values of 222.2, 238.1, 252.2, 266.1, and 304.3 mg/L on the 10th day, respectively. Compared with the first measurement, the total hardness increased by 24.7%, 26.6%, 48.2%, 58.2%, and 73.6%, respectively, and the total hardness value and growth amplitude were both proportional to the emulsion content, which is completely opposite to the static conditions. The reason for this phenomenon is that when the mine water passes through the medium layer of the infiltration column, then it will carry away the hardness ions on the surface of the medium, gradually increasing the total hardness of the mine water. The higher the concentration of the emulsion, the more hard ions can be dissolved. However, over time, the combination of surfactants in the emulsion with calcium and magnesium ions to form colloidal particles or precipitates becomes the dominant factor, resulting in a gradual decrease in the total hardness of the mine water, reaching 206.1, 190.1, 218.3, 212.2, and 204.2 mg/L on the 30th day, respectively.

3.2. Health Risk Assessment

3.2.1. Reference Concentration

Set the risk index HQ to 1 to obtain the reference concentrations at which Cr6+ and chloride can pose potential non-carcinogenic risks to different populations (see Table 5). There is a significant negative correlation between the ratio of daily water intake to the weight of the body (IR/BW) and non-carcinogenic risk among different age groups. The upper limit of the concentration that children can tolerate for Cr6+ and chloride is lower than that of other population groups. When the concentration of Cr6+ in drinking water reaches 0.04 mg/L, it poses a non-carcinogenic risk to children. The value is slightly lower than the threshold value of 0.05 mg/L in the “Drinking Water Quality Standards” (GB5749-2022), which is officially implemented in China.

3.2.2. Health Risk Assessment Results and Analysis

The initial content of Cr6+ and chloride in mine water containing different concentrations of emulsions under static conditions is similar to that under dynamic conditions. The health risks of Cr6+ and chloride in the water sample on the first day under a dynamic environment for different populations are evaluated.
From Table 6, it can be seen that the mine water containing untreated Cr6+ has different health risks for different populations. Mine water containing more than 1 mL/L emulsion has a potential non-carcinogenic risk for children, while mine water containing more than 5 mL/L emulsion has a potential non-carcinogenic risk for infants, children, and adult men. When the emulsion content is greater than 10 mL/L, Cr6+ has a potential non-carcinogenic risk for all age groups. Overall, the various risk indices for young people are lower compared to other populations, while the various risk indices for children are higher compared to other populations. This is because the daily water intake to body weight ratio (IR/BW) of young people is the lowest at 0.031, while the daily water intake to body weight ratio of children is the highest at 0.075, resulting in a significant difference in the burden of intake of Cr6+.
The presence of chlorides in mine water poses a high health risk to different populations, with HQ values far greater than 1. The emulsion content has a relatively small impact on the HQ values of various age groups. Therefore, before purifying mine water into drinking water, chlorides are a key pollutant that needs to be removed.

4. Discussions and Conclusions

The variation characteristics of 6 pollution indicators in mine water containing different concentrations of emulsion under dynamic and static conditions were quantitatively studied. The EPA health risk assessment model is applied to evaluate the potential health effects of chlorides and hexavalent chromium in emulsion-containing mine water on different populations. The mine water itself contains high concentrations of chloride and sulfate, and the addition of emulsion under static conditions has little effect on it. Under dynamic conditions, the concentration of chloride was significantly higher than that under static conditions after 10 days of emulsion addition, while the sulfate content showed the opposite behavior. There is a significant positive correlation between the emulsion content and indicators such as Cr6+ and total dissolved solid content under both dynamic and static conditions. Under static conditions, the emulsion content and total hardness in mine water are inversely proportional, while in dynamic tests, there is a short-term positive correlation between the total hardness and emulsion content measured on the 10th day, followed by a rapid decrease in total hardness.
Under both static and dynamic test conditions, emulsions can significantly deteriorate the quality of mine water. It is particularly important to pay attention to the impact of emulsions on pollutant indicators such as Cr6+, TDS, and chloride under static conditions. The calculation results of the health risk assessment model indicate that the chloride levels in the mine water in the region are severely exceeded, and coupled with the impact of emulsions, there is a potential non-carcinogenic risk for all populations exposed to their environment. Cr6+ in mine water with an emulsion greater than 1 mL/L poses a potential non-carcinogenic risk to children.
This article can provide a scientific theoretical basis for studying the treatment of pollutants in mine water, water quality monitoring and management, and health risk assessment. The mine water in this study comes from the super large Daliuta Coal Mine, which has important reference significance for studying the impact of emulsion on mine water in mines of other major coal-producing countries such as the United States, Australia, and India. It is worth noting that the initial concentration of the emulsion set up in this study includes an extreme situation of 20 mL/L, which is difficult to occur in the actual production process of coal mines. This has significant reference value for studying serious emulsion leakage accidents and the impact of emulsions used in different industries (such as mechanical processing) on water bodies after leakage to the environment. In addition, the potential impact of emulsion-containing mine water on human health was studied in this study, while WQI can be further used to comprehensively analyze the impact of emulsion on mine water quality in future studies.

Supplementary Materials

The following supporting information can be downloaded at https://www.mdpi.com/article/10.3390/w15234086/s1, Figure S1: The standard curves with correlation coefficients for Chloride, Sulfate, and hexavalent chromium (Cr6+); Table S1: Organic matter content in mine water; Table S2: The content of TDS, chlorides, sulphates and Cr6+ in the initial emulsion.

Author Contributions

Validation, X.F.; Formal analysis, R.H.; Investigation, M.W. and J.L.; Data curation, Y.L.; Writing—review & editing, Y.Q.; Supervision, C.H. and C.S. All authors have read and agreed to the published version of the manuscript.

Funding

This work was supported by the Open Fund of State Key Laboratory of Water Resource Protection and Utilization in Coal Mining (WPUKFJJ2019-14), the Research Funds for the Central Universities (3142020009), the Langfang Key Technology Research and Development Program of China (2020013037).

Data Availability Statement

Data are contained within the article (can be obtained from the tables or captured from the figures) or Supplementary Material. The data presented in this study are also available on request from the corresponding author.

Conflicts of Interest

Author Jie Li and Ruimin He were employed by the company National Energy Shendong Coal Group Co., Ltd. The remaining authors declare that the research was conducted in the absence of any commercial or financial relationships that could be construed as a potential conflict of interest.

References

  1. Jiang, D.; Gao, C.; Liu, L.; Tingting Yu, T.; Yihua Li, Y.H.; Wang, H.B. Customized copper/cobalt-rich ferrite spinel-based construction ceramic membrane incorporating gold tailings for enhanced treatment of industrial oily emulsion wastewater. Sep. Purif. Technol. 2023, 320, 124131. [Google Scholar] [CrossRef]
  2. Wei, L.H.; Li, M.; Gao, F.; Zhang, Y.B.; Li, C.W.; Zhang, Q. A novel integrated sequential air flotation in cold-rolling emulsion wastewater (CREW) treatment: Satisfying oil droplets growth laws at various stages. J. Water Process Eng. 2022, 48, 102852. [Google Scholar] [CrossRef]
  3. Sun, D.W.; Wang, Y.J.; Gao, J.; Liu, S.J.; Liu, X.L. Insights into the relation of crude oil components and surfactants to the stability of oily wastewater emulsions: Influence of asphaltenes, colloids, and nonionic surfactants. Sep. Purif. Technol. 2023, 307, 122804. [Google Scholar] [CrossRef]
  4. Garcia-Costa, A.L.; Luengo, A.; Zazo, J.A.; Casas, J.A. Cutting oil-water emulsion wastewater treatment by microwave assisted catalytic wet peroxide oxidation. Sep. Purif. Technol. 2021, 257, 117940. [Google Scholar] [CrossRef]
  5. Soloveva, O.; Solovev, S.; Ilyin, V.; Talipova, A.; Sagdieva, T. Study of the influence of porous structure on the efficiency of emulsion separation in wastewater purification on transport. Transp. Res. Procedia 2022, 61, 402–409. [Google Scholar] [CrossRef]
  6. Ma, W.J.; Cao, W.X.; Lu, T.; Xiong, R.H.; Huang, C.B. Multifunctional nanofibrous membrane fabrication by a sacrifice template strategy for efficient emulsion oily wastewater separation and water purification. J. Environ. Chem. Eng. 2022, 10, 108908. [Google Scholar] [CrossRef]
  7. Zhang, Y.; Jia, B.; Li, B.; Shi, K.; Liu, B.; Zhang, S. Dual-functional superwetting CuCo2O4 coated stainless steel mesh for wastewater treatment: Highly efficient oil/water emulsion separation and photocatalytic degradation. Colloids Surf. A Physicochem. Eng. Asp. 2023, 659, 130730. [Google Scholar] [CrossRef]
  8. Zhang, W.; Xiao, P.; Wang, D.S. Central treatment of different emulsion wastewaters by an integrated process of physicochemically enhanced ultrafiltration and anaerobic–aerobic biofilm reactor. Bioresour. Technol. 2014, 159, 150–156. [Google Scholar] [CrossRef]
  9. Qu, R.; Zhao, S.; Liu, N.; Li, X.; Zhai, H.; Liu, Y.; Wei, Y.; Feng, L. 3D inner-outer asymmetric sponge for enormous-volume emulsion wastewater treatment based on a new “demulsification-transport” mechanism. Green Energy Environ. 2023, 8, 1398–1408. [Google Scholar] [CrossRef]
  10. Huang, Y.; Liu, H.; Wang, Y.; Song, G.; Zhang, L. Industrial application of ceramic ultrafiltration membrane in cold-rolling emulsion wastewater treatment. Sep. Purif. Technol. 2022, 289, 120724. [Google Scholar] [CrossRef]
  11. Zhang, C.; Yang, X.; Dai, J.; Liu, W.; Yang, H.; Bai, Z. Efficient extraction of phenol from wastewater by ionic micro-emulsion method: Anionic and cationic. Chin. J. Chem. Eng. 2023, 58, 137–145. [Google Scholar] [CrossRef]
  12. Wang, Z.; Guo, P.; Heng, L.; Jiang, L. Nano/submicrometer-emulsion oily wastewater treatment inspired by plant transpiration. Matter 2021, 4, 1274–1286. [Google Scholar] [CrossRef]
  13. Wang, X.; Sun, K.; Zhang, G.; Yang, F.; Lin, S.; Dong, Y. Robust zirconia ceramic membrane with exceptional performance for purifying nano-emulsion oily wastewater. Water Res. 2022, 208, 117859. [Google Scholar] [CrossRef]
  14. Zhang, Y.; Gan, F.; Li, M.; Li, J.; Li, S.Q.; Wu, S.H. New integrated processes for treating cold-rolling mill emulsion wastewater. J. Iron Steel Res. Int. 2010, 17, 32–35. [Google Scholar] [CrossRef]
  15. Zhong, L.X.; Sun, C.Y.; Yang, F.L.; Dong, Y.C. Superhydrophilic spinel ceramic membranes for oily emulsion wastewater treatment. J. Water Process Eng. 2021, 42, 102161. [Google Scholar] [CrossRef]
  16. Zeng, Z.; Lan, M.; Zhang, Q.; Wang, Z.; Lei, X.; Deng, X.; Gao, R.; Cai, W.; Chen, G.; Fu, C.; et al. Effect of pH value on multiferroic properties of barium ferrite ceramics prepared by sol–gel method. J. Magn. Magn. Mater. 2022, 563, 169904. [Google Scholar] [CrossRef]
  17. Banadkooki, F.B.; Ehteram, M.; Panahi, F.; Sammen, S.S.; El-Shafie, A. Estimation of total dissolved solids (TDS) using new hybrid machine learning models. J. Hydrol. 2020, 587, 124989. [Google Scholar] [CrossRef]
  18. Castillo-Meza, L.E.; Cravotta, C.A.; Tasker, T.L.; Warner, N.R.; Burgos, W.D. Batch extraction method to estimate total dissolved solids (TDS) release from coal refuse and overburden. Appl. Geochem. 2020, 115, 104540. [Google Scholar] [CrossRef]
  19. Burgos-Castillo, R.C.; Sirés, I.; Sillanpää, M.; Brillas, E. Application of electrochemical advanced oxidation to bisphenol A degradation in water. Effect of sulfate and chloride ions. Chemosphere 2018, 194, 812–820. [Google Scholar] [CrossRef] [PubMed]
  20. Yu, X.; Li, S.; Zheng, J.; Chang, X.; Liao, Y.; Chen, D. Degradation process of reinforced concrete under chloride and sulfate attack with and without electric field. J. Build. Eng. 2023, 78, 107588. [Google Scholar] [CrossRef]
  21. Saurina, J.; Ester López-Aviles, E.; Le Moal, A.; Hernández-Cassou, S. Determination of calcium and total hardness in natural waters using a potentiometric sensor array. Anal. Chim. Acta 2002, 464, 89–98. [Google Scholar] [CrossRef]
  22. Roberts, S.D.; Powell, M.D. Reduced total hardness of fresh water enhances the efficacy of bathing as a treatment for amoebic gill disease in Atlantic salmon, Salmo salar L. J. Fish Dis. 2010, 26, 591–599. [Google Scholar] [CrossRef] [PubMed]
  23. Divahar, R.; Raj, P.S.A.; Sangeetha, S.P.; Mohanakavitha, T.; Meenambal, T. Dataset on the assessment of water quality of ground water in Kalingarayan Canal, Erode district, Tamil Nadu, India. Data Brief 2020, 32, 106112. [Google Scholar] [CrossRef] [PubMed]
  24. Simi, R.; Subin, M.P. Hexavalent chromium (CrVI) uptake induced physiological effects and growth in Amaranthus dubius Mart. ex Thell. Appl. Ecol. Environ. Sci. 2022, 10, 1–10. [Google Scholar]
  25. Chen, L.; Wu, Y.; Shen, Q.; Zheng, X.; Chen, Y. Enhancement of hexavalent chromium reduction by Shewanella oneidensis MR-1 in presence of copper nanoparticles via stimulating bacterial extracellular electron transfer and environmental adaptability. Bioresour. Technol. 2022, 361, 127686. [Google Scholar] [CrossRef] [PubMed]
  26. Jobby, R.; Jha, P.; Yadav, A.K.; Desai, N. Biosorption and biotransformation of hexavalent chromium Cr(VI): A comprehensive review. Chemosphere 2018, 207, 255–266. [Google Scholar] [CrossRef] [PubMed]
  27. Khoshakhlagh, A.; Mohammadzadeh, M.; Manafi, S.; Yousefian, F.; Gruszecka-Kosowska, A. Inhalational exposure to formaldehyde, carcinogenic, and non-carcinogenic risk assessment: A systematic review. Environ. Pollut. 2023, 331, 121854. [Google Scholar] [CrossRef]
  28. Jaiswal, M.; Hussain, J.; Gupta, S.K.; Nasr, M.; Nema, A.K. Comprehensive evaluation of water quality status for entire stretch of Yamuna River, India. Environ. Monit. Assess. 2019, 191, 208. [Google Scholar] [CrossRef]
  29. Jaiswal, M.; Gupta, S.K.; Chabukdhara, M.; Nasr, M.; Nema, A.K.; Hussain, J.; Malik, T. Heavy metal contamination in the complete stretch of Yamuna river: A fuzzy logic approach for comprehensive health risk assessment. PLoS ONE 2022, 17, e0272562. [Google Scholar] [CrossRef]
  30. Oni, A.A.; Babalola, S.O.; Adeleye, A.D.; Olagunju, T.E.; Amama, I.A.; Omole, E.O.; Adegboye, E.A.; Ohore, O.G. Non-carcinogenic and carcinogenic health risks associated with heavy metals and polycyclic aromatic hydrocarbons in well-water samples from an automobile junk market in Ibadan, SW-Nigeria. Heliyon 2022, 8, e10688. [Google Scholar] [CrossRef]
  31. Dehbandi, R.; Moore, F.; Keshavarzi, B. Geochemical sources, hydrogeochemical behavior, and health risk assessment of fluoride in an endemic fluorosis area, central Iran. Chemosphere 2018, 193, 763–776. [Google Scholar] [CrossRef] [PubMed]
  32. Aghapour, S.; Bina, B.; Tarrahi, M.J.; Amiri, F.; Ebrahimi, A. Distribution and health risk assessment of natural fluoride of drinking groundwater resources of Isfahan, Iran, using GIS. Environ. Monit. Assess. 2018, 190, 137. [Google Scholar] [CrossRef] [PubMed]
Figure 1. The location of Daliuta Coal Mine.
Water 15 04086 g001
Figure 2. pH values of mine water containing different concentrations of emulsions at different periods: (a) static test and (b) dynamic test.
Water 15 04086 g002
Figure 3. Total dissolved solids content of mine water containing different concentrations of emulsions at different time periods: (a) static test and (b) dynamic test.
Water 15 04086 g003
Figure 4. Chloride content of mine water containing different concentrations of emulsions at different time periods: (a) static test and (b) dynamic test.
Water 15 04086 g004
Figure 5. Sulfate content of mine water containing different concentrations of emulsions at different time periods: (a) static test and (b) dynamic test.
Water 15 04086 g005
Figure 6. Hexavalent chromium content of mine water containing different concentrations of emulsions at different time periods: (a) static test and (b) dynamic test.
Water 15 04086 g006
Figure 7. Total hardness of mine water containing different concentrations of emulsions at different time periods: (a) static test and (b) dynamic test.
Water 15 04086 g007
Table 1. Parameter reference values.
ParameterInfantsChildrenYouthMamWoman
IR (L/d)0.251.501.703.002.30
BW (kg)620547569
Table 2. Statistics of six indicators under static and dynamic conditions.
IndexStatisticsEmulsion Added (mL/L, Static Test) Emulsion Added (mL/L, Dynamic Test)
01510200151020
pHMinimum8.197.777.928.038.867.617.717.427.427.92
Maximum8.818.688.899.089.848.128.127.898.028.53
Mean8.508.308.518.609.257.897.877.667.768.20
SD0.290.380.430.450.430.200.170.190.250.23
TDSMinimum73580491410901500850910113013201720
Maximum85091011301320172011701220180021702780
Mean80386010211208159010601126163619122506
SD5246859390122130284342442
ChlorideMinimum295.6304.9306.8304.6292.2307.3308.1309.8306.3311.0
Maximum315.7321.5318.2325.7321.9341.1398.1409.2414.4488.0
Mean307.8310.9311.7313.4306.7319.0334.5356.4332.9405.6
SD8.07.04.28.811.113.539.546.445.884.7
SulfateMinimum414.3411.1416.3407.4407.8289.7293.3276.1263.7358.9
Maximum447.7450.5468.1445.5456.7435.6437.1443.1446.2454.3
Mean430.3429.3436.8428.5428.9383.9372.6365.3375.5413.3
SD13.114.920.115.919.163.171.978.475.148.5
Cr6+Minimum0.000.010.060.471.300.000.010.030.120.60
Maximum0.000.030.100.731.820.000.020.090.471.51
Mean0.000.020.080.611.600.000.020.060.250.93
SD0.000.010.020.120.200.000.010.020.130.38
Total hardnessMinimum142.1150.1130.1112.198.2178.1188.2170.1168.3175.2
Maximum206.2188.2180.1122.1105.3222.2238.2252.2266.2304.2
Mean165.3171.3151.3117.3101.0201.8208.6221.8219.2230.4
SD26.718.022.74.92.616.520.832.835.648.2
Table 3. Change amplitude of the pH value.
Amount of Emulsion (mL) Added to 1 L Mine WaterMaximum ValueMinimum ValueAbsolute Value of Difference in Amplitude of Change
08.808.190.61
18.687.770.91
58.897.920.97
109.088.031.05
209.848.860.98
Table 4. Change amplitude of total dissolved solids content under static conditions.
Amount of
Emulsion (mL)
Added to 1 L Mine
Water
Initial Value
Measured on
Day l
Fluctuation Amplitude (Compared to Last Measurement)
Day 5Day 10Day 20Day 30
08500−33−55−27
1910−10669−5375
51130−216166−9919
101320−180120−170140
201720−210110−120100
Table 5. Non-carcinogenic risk threshold concentrations of Cr6+ and chlorides.
IndexNon-Carcinogenic Risk Threshold Concentrations
InfantsChildrenYouthMamWoman
Cr6+0.0720.0400.0950.0750.090
Chloride content (mg/L)2.401.333.182.503.00
Table 6. Risk index of HQ.
IndexAmount of Emulsion Added (mL)Risk Index of HQ
InfantsChildrenYouthMamWoman
Cr6+00.000.000.000.000.00
10.571.020.430.550.46
51.061.900.801.010.84
106.5111.724.926.255.21
2020.9637.7215.8420.1216.77
Chloride content0128.54231.3897.12123.40102.83
1131.54236.7899.39126.28105.23
5127.16228.8896.08122.07101.73
10130.86235.5698.87125.63104.69
20123.15221.6793.04118.2298.52
Disclaimer/Publisher’s Note: The statements, opinions and data contained in all publications are solely those of the individual author(s) and contributor(s) and not of MDPI and/or the editor(s). MDPI and/or the editor(s) disclaim responsibility for any injury to people or property resulting from any ideas, methods, instructions or products referred to in the content.