Abstract
The escalating production of shale gas and oil, witnessed prominently in developed nations over the past decade, has sparked interest in prospective development, even in developing countries like Algeria. However, this growth is accompanied by significant opposition, particularly concerning the method of extraction: hydraulic fracturing, or ‘fracking’. Concerns regarding its environmental impact, water contamination, greenhouse gas emissions, and potential health effects have sparked widespread debate. This study thoroughly examines these concerns, employing an innovative approach to assess the risks associated with hydraulic fracturing operations in shale gas reservoirs. Through the integration of diverse data sources, including quantitative and qualitative data, observational records, expert judgments, and global sensitivity analysis using the Sobol method, a comprehensive risk assessment model, was developed. This model carefully considered multiple condition indicators and extreme working conditions, such as pressures exceeding 110 MPa and temperatures surpassing 180° F. The integration of these varied data streams enabled the development of a robust Bayesian belief network. This network served as a powerful tool for the accurate identification of process vulnerabilities and the formulation of optimal development strategies. Remarkably, this study’s results showed that this approach led to a notable 12% reduction in operational costs, demonstrating its practical efficacy. Moreover, this study subjected its model to rigorous uncertainty and sensitivity analyses, pinpointing the most severe risks and outlining optimal measures for their reduction. By empowering decision-makers to make informed choices, this methodology not only enhances environmental sustainability and safety standards but also ensures prolonged well longevity while maximizing productivity in hydraulic fracturing operations.
1. Introduction
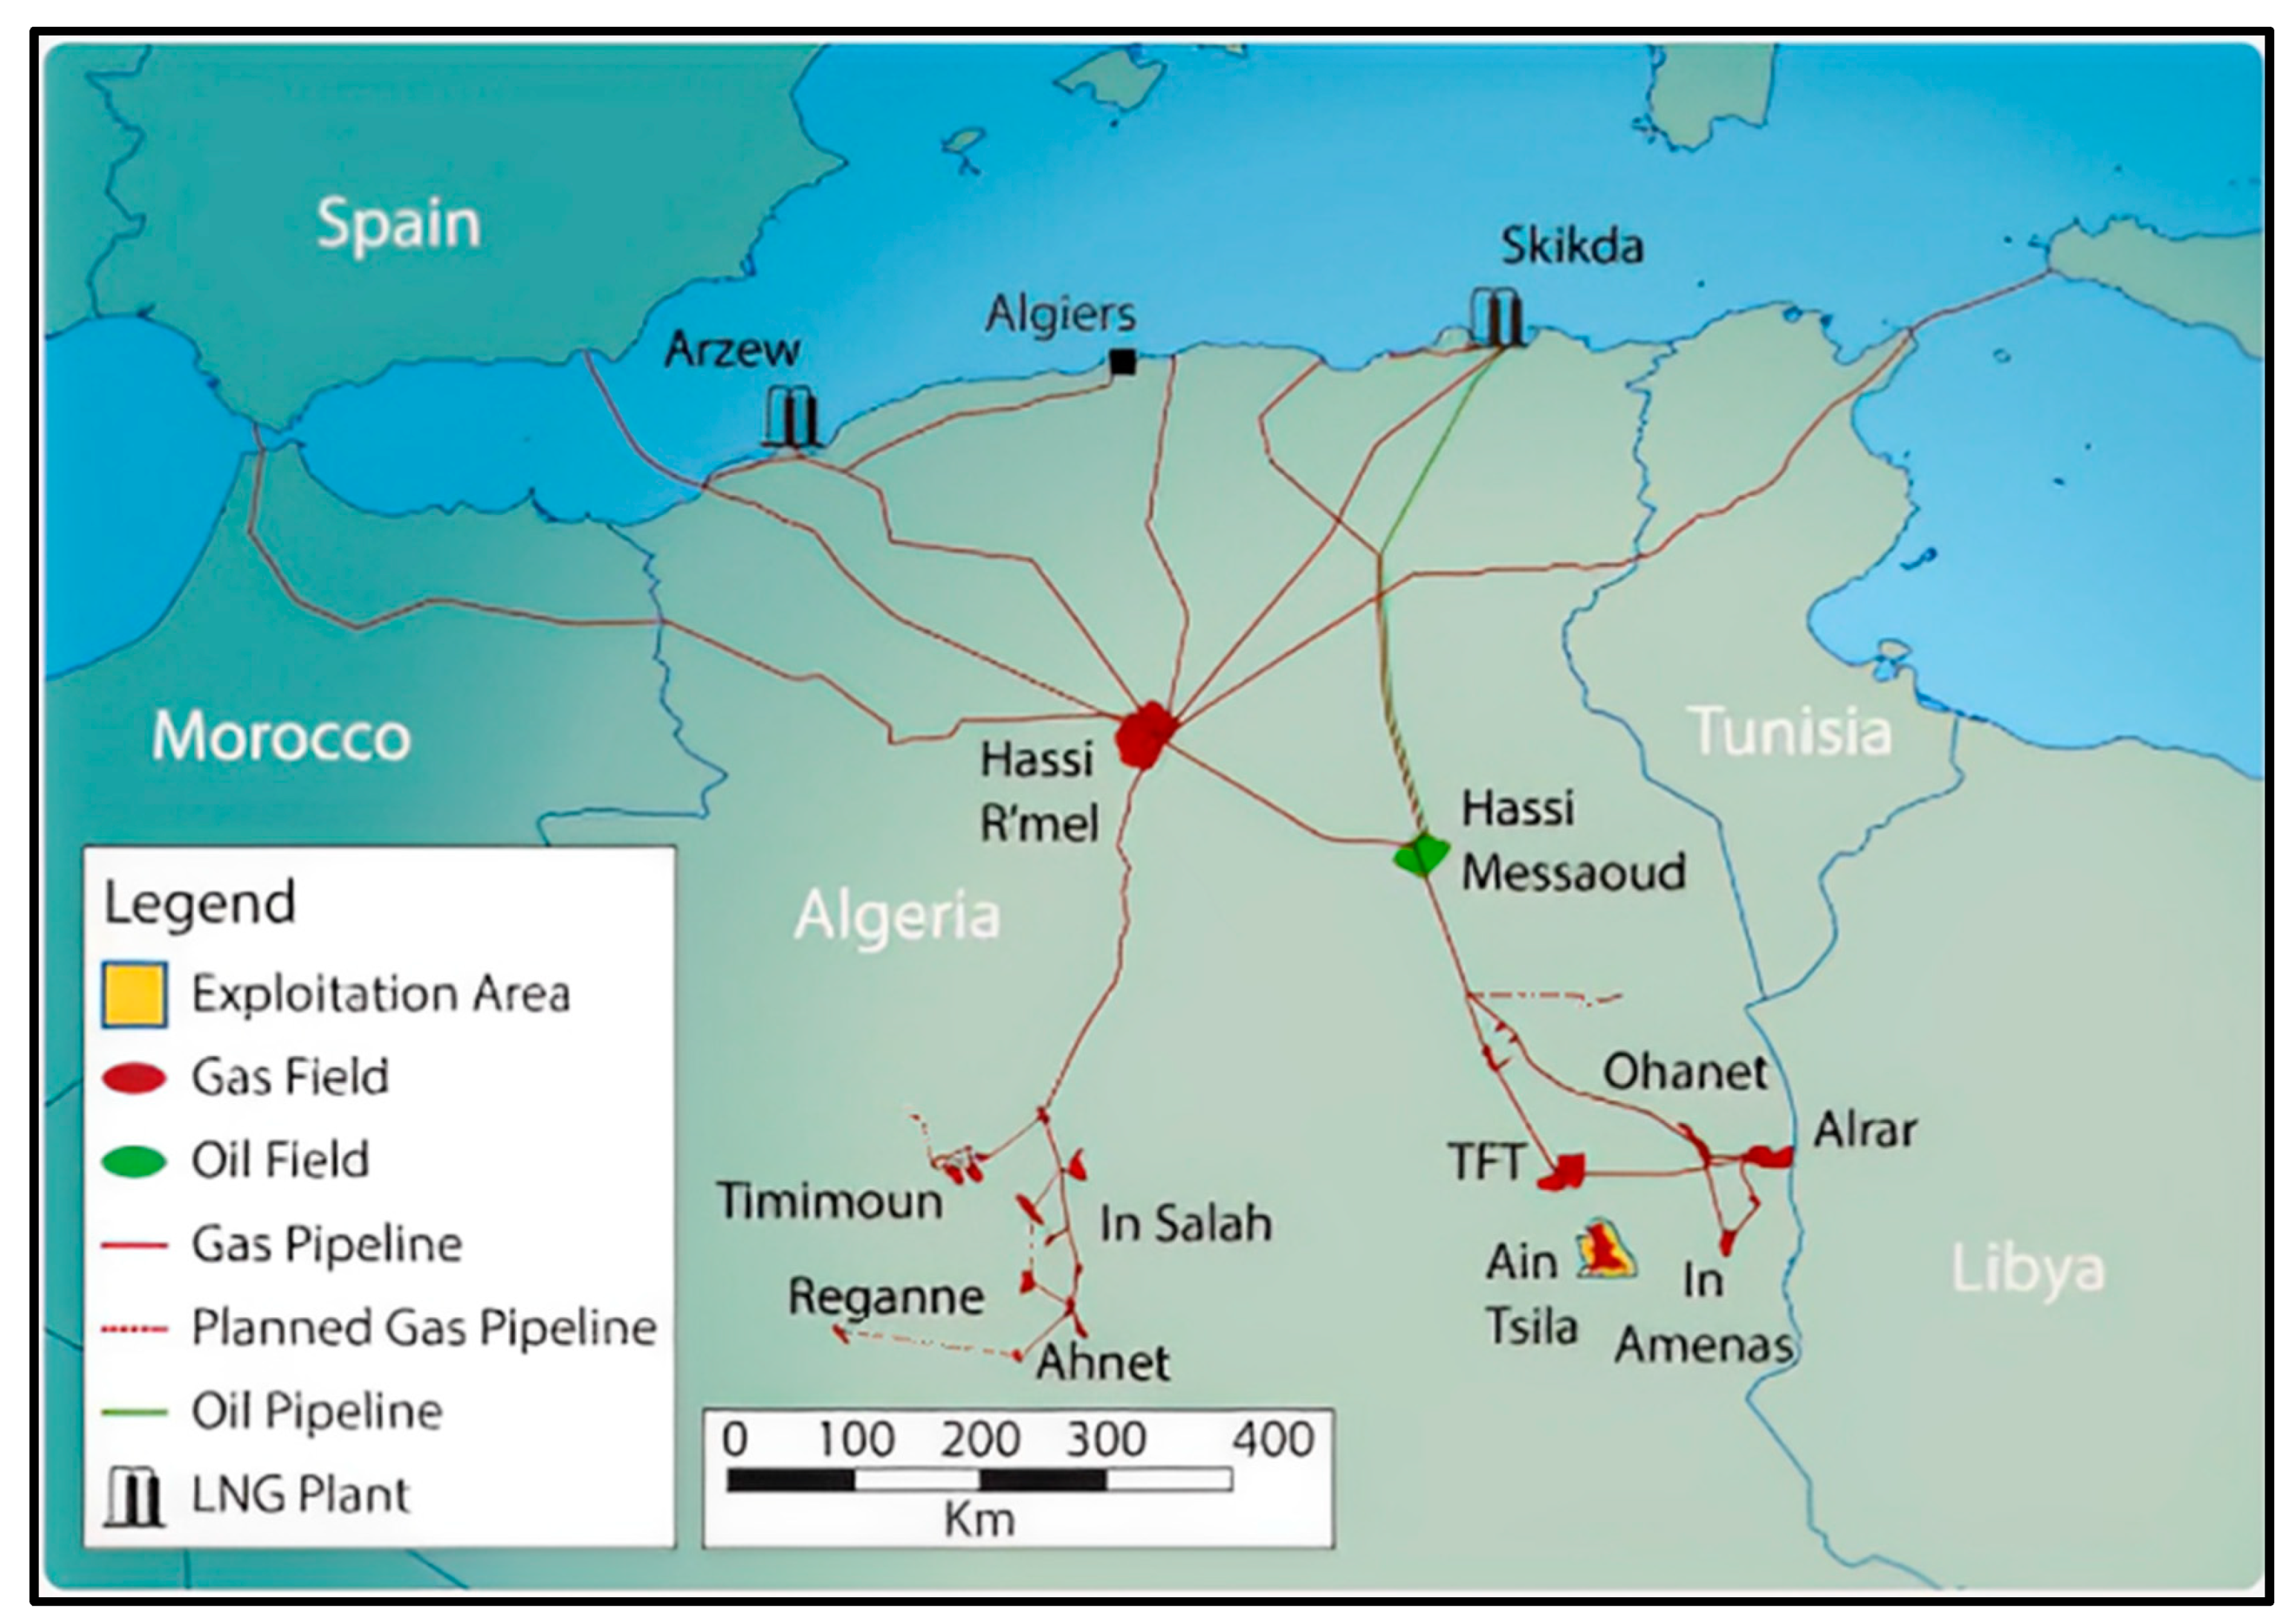
Commercial production of shale gas dates back to the 1970s in the United States and Canada, and more recently, in 2016, it began in the United Kingdom. The estimated technically recoverable shale gas resources in the UK stand at approximately 0.57 trillion cubic meters. Other countries, including China, Argentina, and Algeria, possess substantial technically recoverable shale gas reserves, with estimated volumes of 31, 22, and 11 trillion cubic meters, respectively, positioning them as potential future contributors to global shale gas production. However, the comprehensive impacts of widespread shale gas utilization remain contentious, sparking intense debates among stakeholders. Opponents contend that potential environmental repercussions, such as drinking water contamination, and challenges in wastewater management could outweigh the perceived benefits, especially in areas that suffer from water scarcity. It is especially in the realm of water-related concerns that special attention is warranted. Extensive research on shale gas exploration has been conducted in various developed and developing countries, shedding light on shared challenges and deficiencies. These studies span diverse geographical regions, consistently highlighting environmental risks, regulatory insufficiencies, and social consequences associated with shale gas operations. Over the past five years, global research efforts have intensified, leading to advancements in best practices and innovative technologies for shale gas extraction. Turning our attention to Algeria, an emerging player in the shale gas arena, offers valuable insights into this nation’s unique context and potential within the dynamic shale gas sector (Figure 1) [1,2,3,4,5,6].
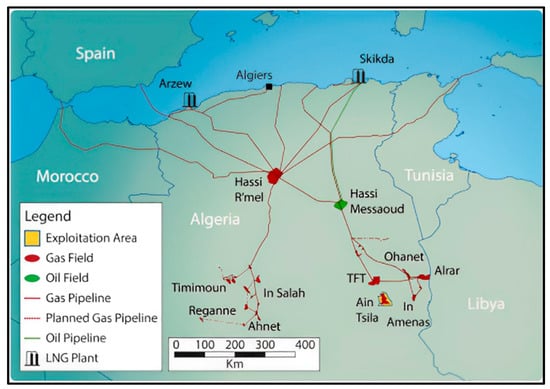
Figure 1.
Algeria’s oil and gas resources [7].
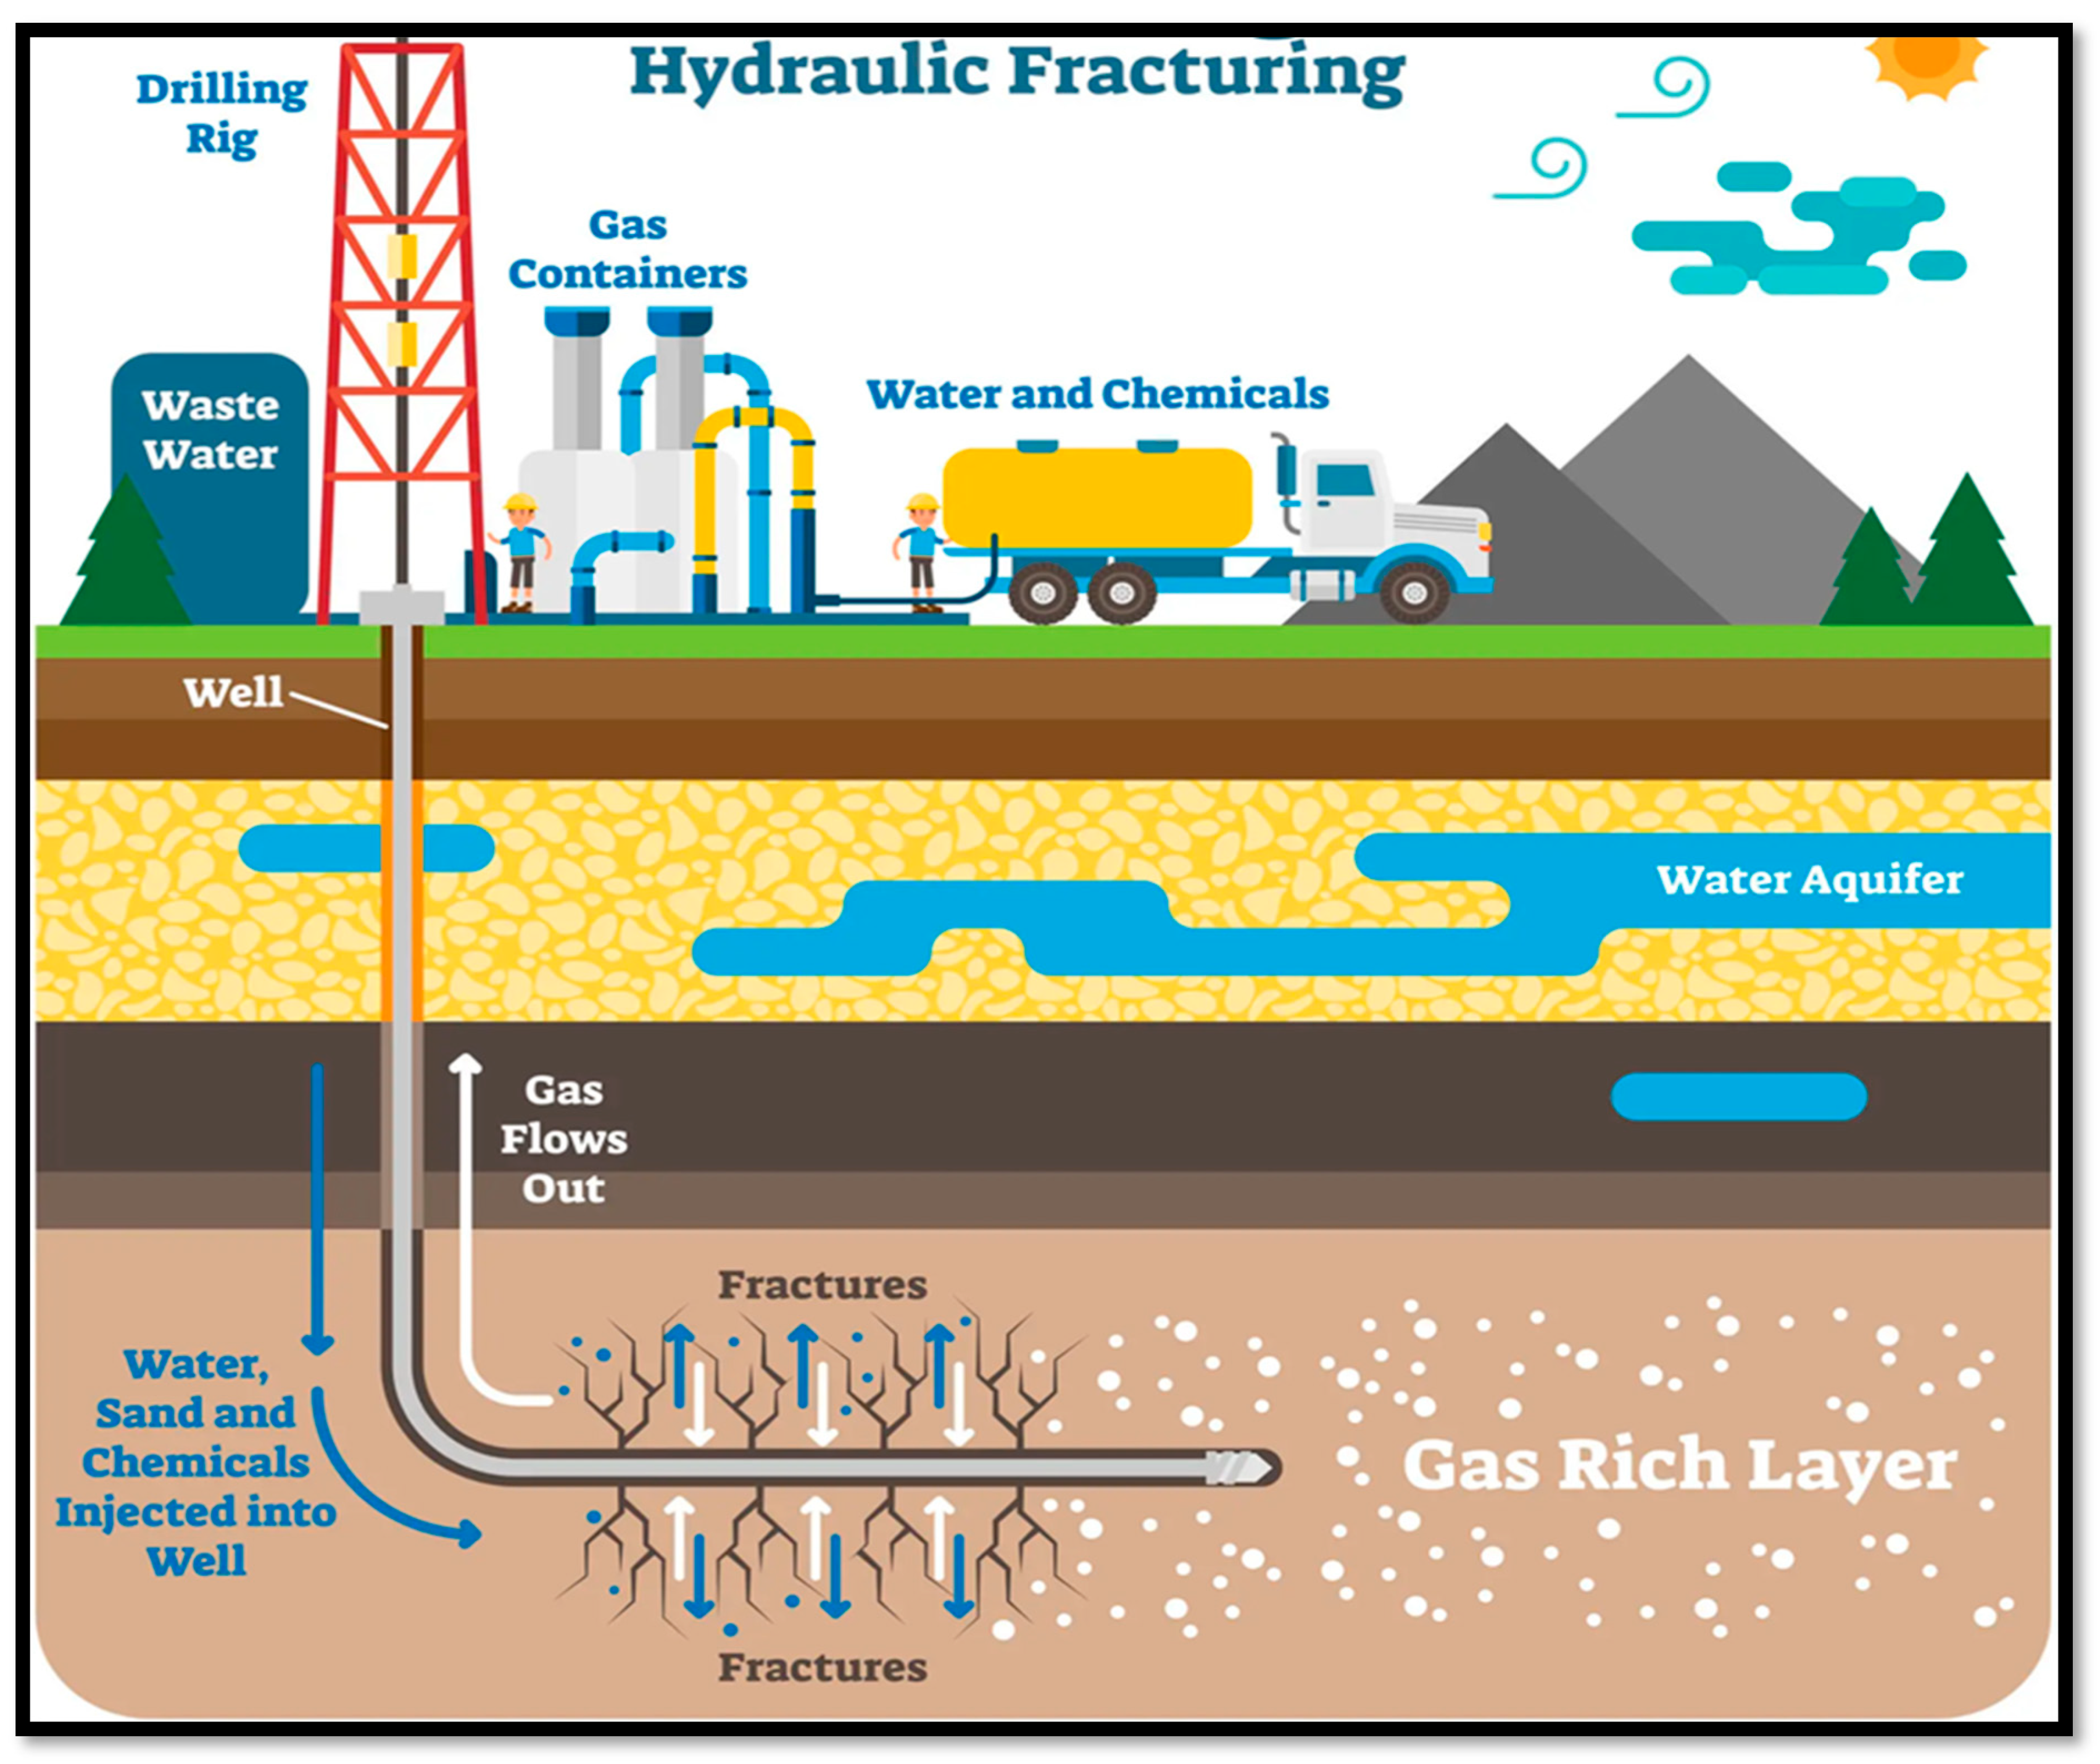
This research work involves attending field operations and conducting quantitative analyses through various tools used in the oil and gas field. Starting from hazard identification using HAZOP analysis, a fault tree analysis (FTA) is created, and initial results are analyzed to determine the level of risks through an event tree (ET). This approach allows for linking the causes and consequences of the operation, including failure or destruction of the well and reservoir. BBN models have been proposed as an approach to analyze risks associated with hydraulic fracturing system accidents. BBN facilitates the modeling of complex and dynamic behavior of real-world systems by structuring the integrated simulation based on input nodes and resultant nodes. One useful approach for providing input data to BBN models is the use of matrices generating Conditional Probability Tables (CPT). The results obtained from a BBN model enable the creation of CPTs, which can be used to evaluate the model and calculate sensitivity through large-scale analyses of uncertainty to attain more accurate results. The primary goals of hydraulic fracturing operations include increasing oil and gas flow, eliminating formation damage near the borehole wall, and interconnecting high-permeability zones. Success in hydraulic fracturing depends on selecting the appropriate hydraulic penetration technology, creating complex gel-fracture volumes with higher flow conductivity, and deploying fracture volumes rationally along the hole section. The process includes preflight, gel injection, and over flush stages. Overall, viscous slick water is used in the perforation stage; meanwhile, pads and gels are injected in different stages to propagate and etch fractures. Over flush is used to enhance gels’ penetration distance. Figure 2 illustrates the intricate process of hydraulic fracturing operations. In this detailed visual representation, key elements of the fracturing process come to life. In recent years, the rapid expansion of hydraulic fracturing, or ‘fracking’, for shale gas and oil extraction has sparked global interest and debate. While developed nations have embraced this technology, concerns regarding its environmental impact, water contamination, and potential health risks have raised significant opposition. Moreover, there is a lack of comprehensive studies that address these concerns using innovative and integrative approaches, especially in the context of developing countries like Algeria. Recognizing these gaps, this study aims to bridge the existing knowledge deficit by conducting a thorough examination of the risks associated with hydraulic fracturing operations in shale gas reservoirs. By integrating diverse data sources, employing advanced analytical methods, and conducting rigorous sensitivity analyses, this research endeavors to provide a nuanced understanding of the challenges posed by hydraulic fracturing [3,4,5,8].
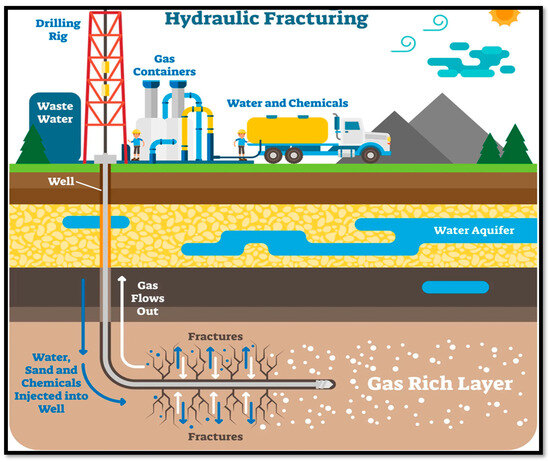
Figure 2.
Hydraulic fracturing operation [8].
In contrast to conventional techniques such as manual calibration and heuristic approaches, Bayesian networks offer a superior methodology for evaluating hydraulic fracturing risks. Manual methods, often lacking precision and time efficiency, are eclipsed by Bayesian networks’ structured and automated approach. With the advent of artificial intelligence technologies, leveraging extensive data processing capacities, reliance on sensors for real-time data transmission and Bayesian network processing has become integral. This establishes Bayesian networks as a preferred choice for assessing potential risks in hydraulic fracturing, particularly in challenging shale gas reservoir conditions. This shift towards automated and sophisticated approaches ensures more accurate and efficient decision-making, ultimately contributing to the sustainable and effective exploitation of shale gas resources [8,9].
This paper focuses on assessing the potential risks associated with hydraulic fracturing in a shale reservoir located in Algeria, which is an area grappling with water scarcity. The reservoir’s unique characteristics, including low permeability and narrow dimensions, present challenges typical of such formations. Employing a Bayesian network, the study explores various scenarios and uncertainties that could lead to operational failures or increased environmental risks. The goal is to enhance the management of the hydraulic fracturing process, mitigating these risks while optimizing costs. By doing so, the paper aims to contribute to the sustainability and effectiveness of shale gas exploitation in this region. Through rigorous analysis and innovative techniques, this research endeavors to pave the way for more efficient and responsible practices in the realm of hydraulic fracturing [4,10,11,12,13].
This paper is organized into six sections. Section 1 and Section 2 set out the introduction and methodology of the work, which formulates hazard identification and development of an event tree (ET) and determines the quantitative assessment of potential risks using BBN. Section 3 demonstrates the results and main findings of the hydraulic fracturing process with the elicitation of the BBN model, an evaluation of sensitivity analyses and validation of the BBN model. Section 4, provides a discussion of the analyses and Finally, Section 5 delineates summary of paper, limitation, and future recommendations.
2. Methodology
2.1. Case Study
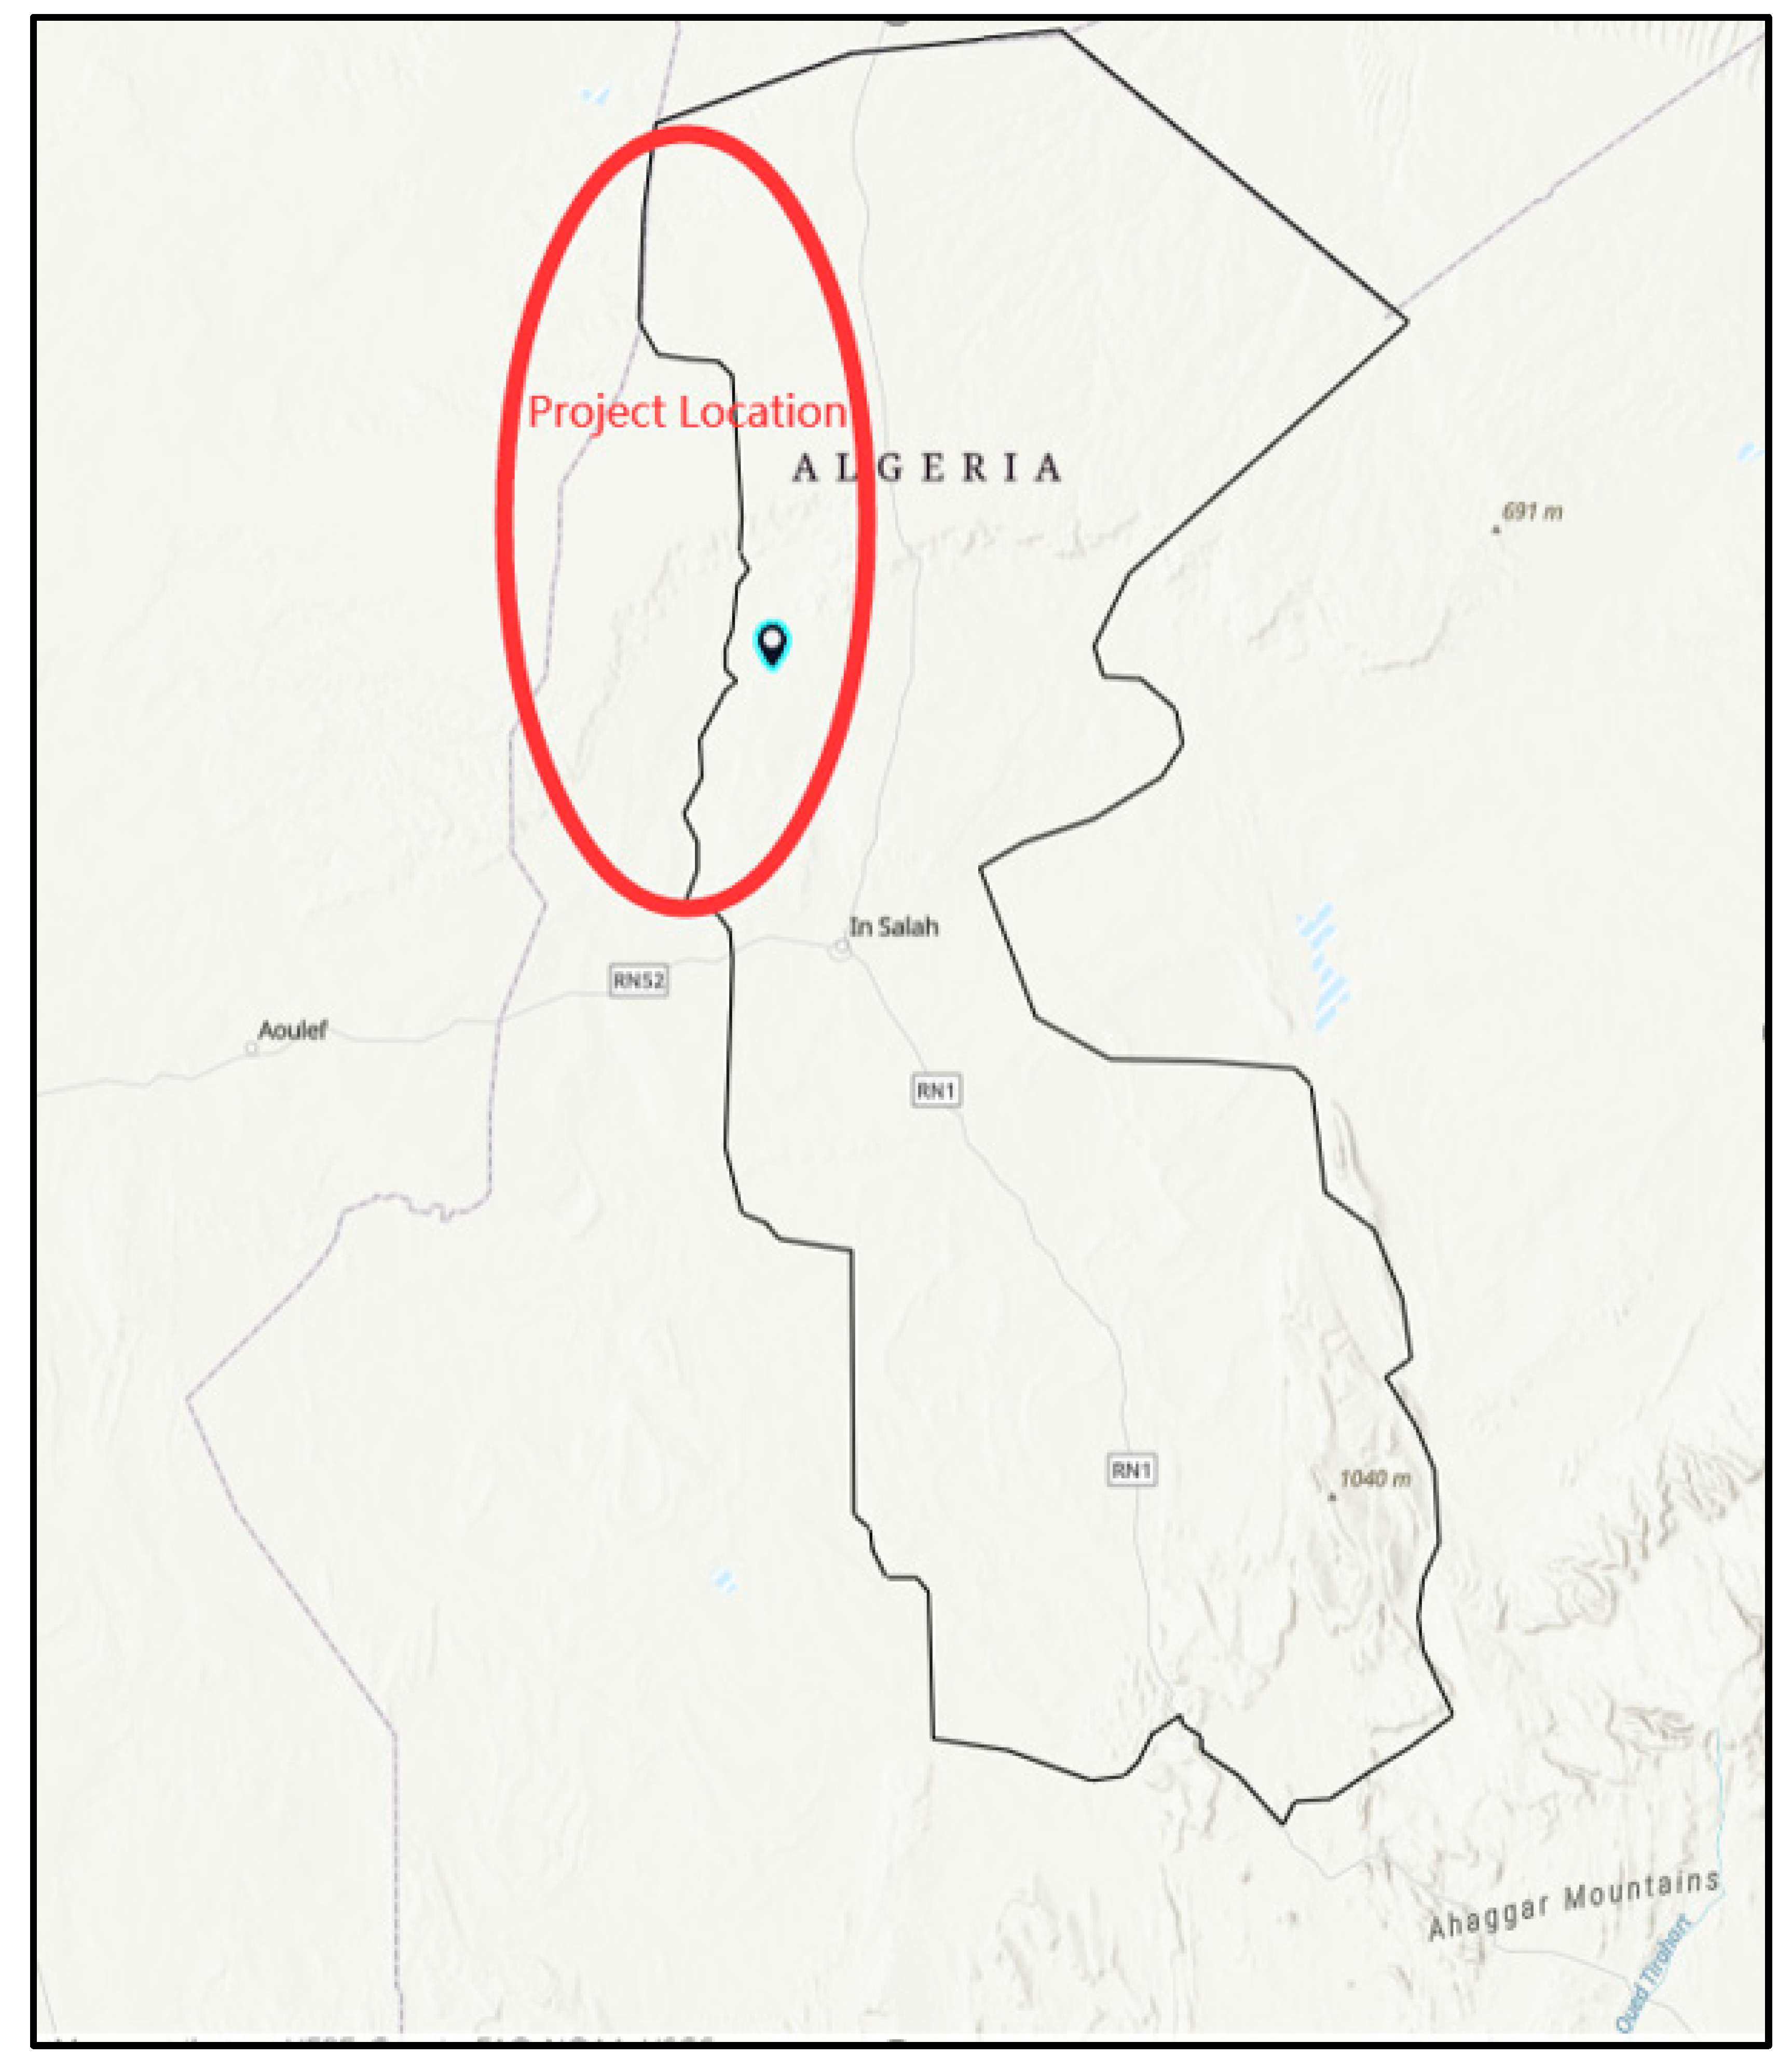
This study delves into the intricacies of hydraulic fracturing in different shale gas wells located in the In Salah region of Algeria. The reservoir at a depth of 3600 m is characterized by its heterogeneous clayey nature. Geographical details of this location are depicted in Figure 3. This paper systematically explores various catastrophic scenarios inherent in the hydraulic fracturing process, meticulously analyzing results to mitigate risks and enhance professional implementation [7,9,14]
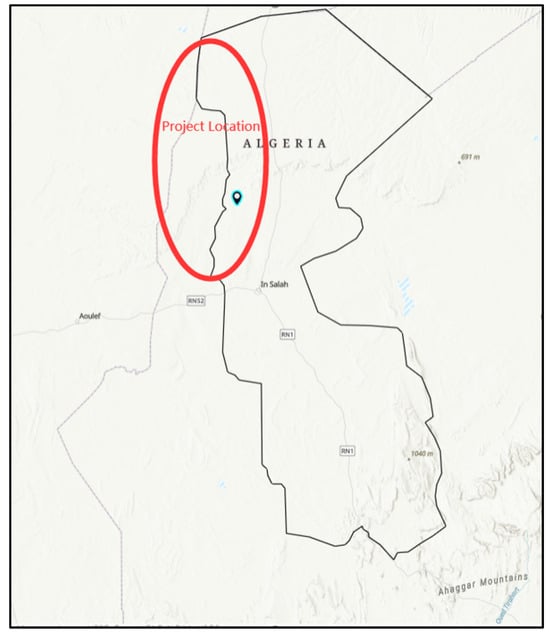
Figure 3.
The upstream hydrocarbon in the In Salah region of Algeria.
2.2. Formulation, Hazard Identification, and Development of an Fault Tree
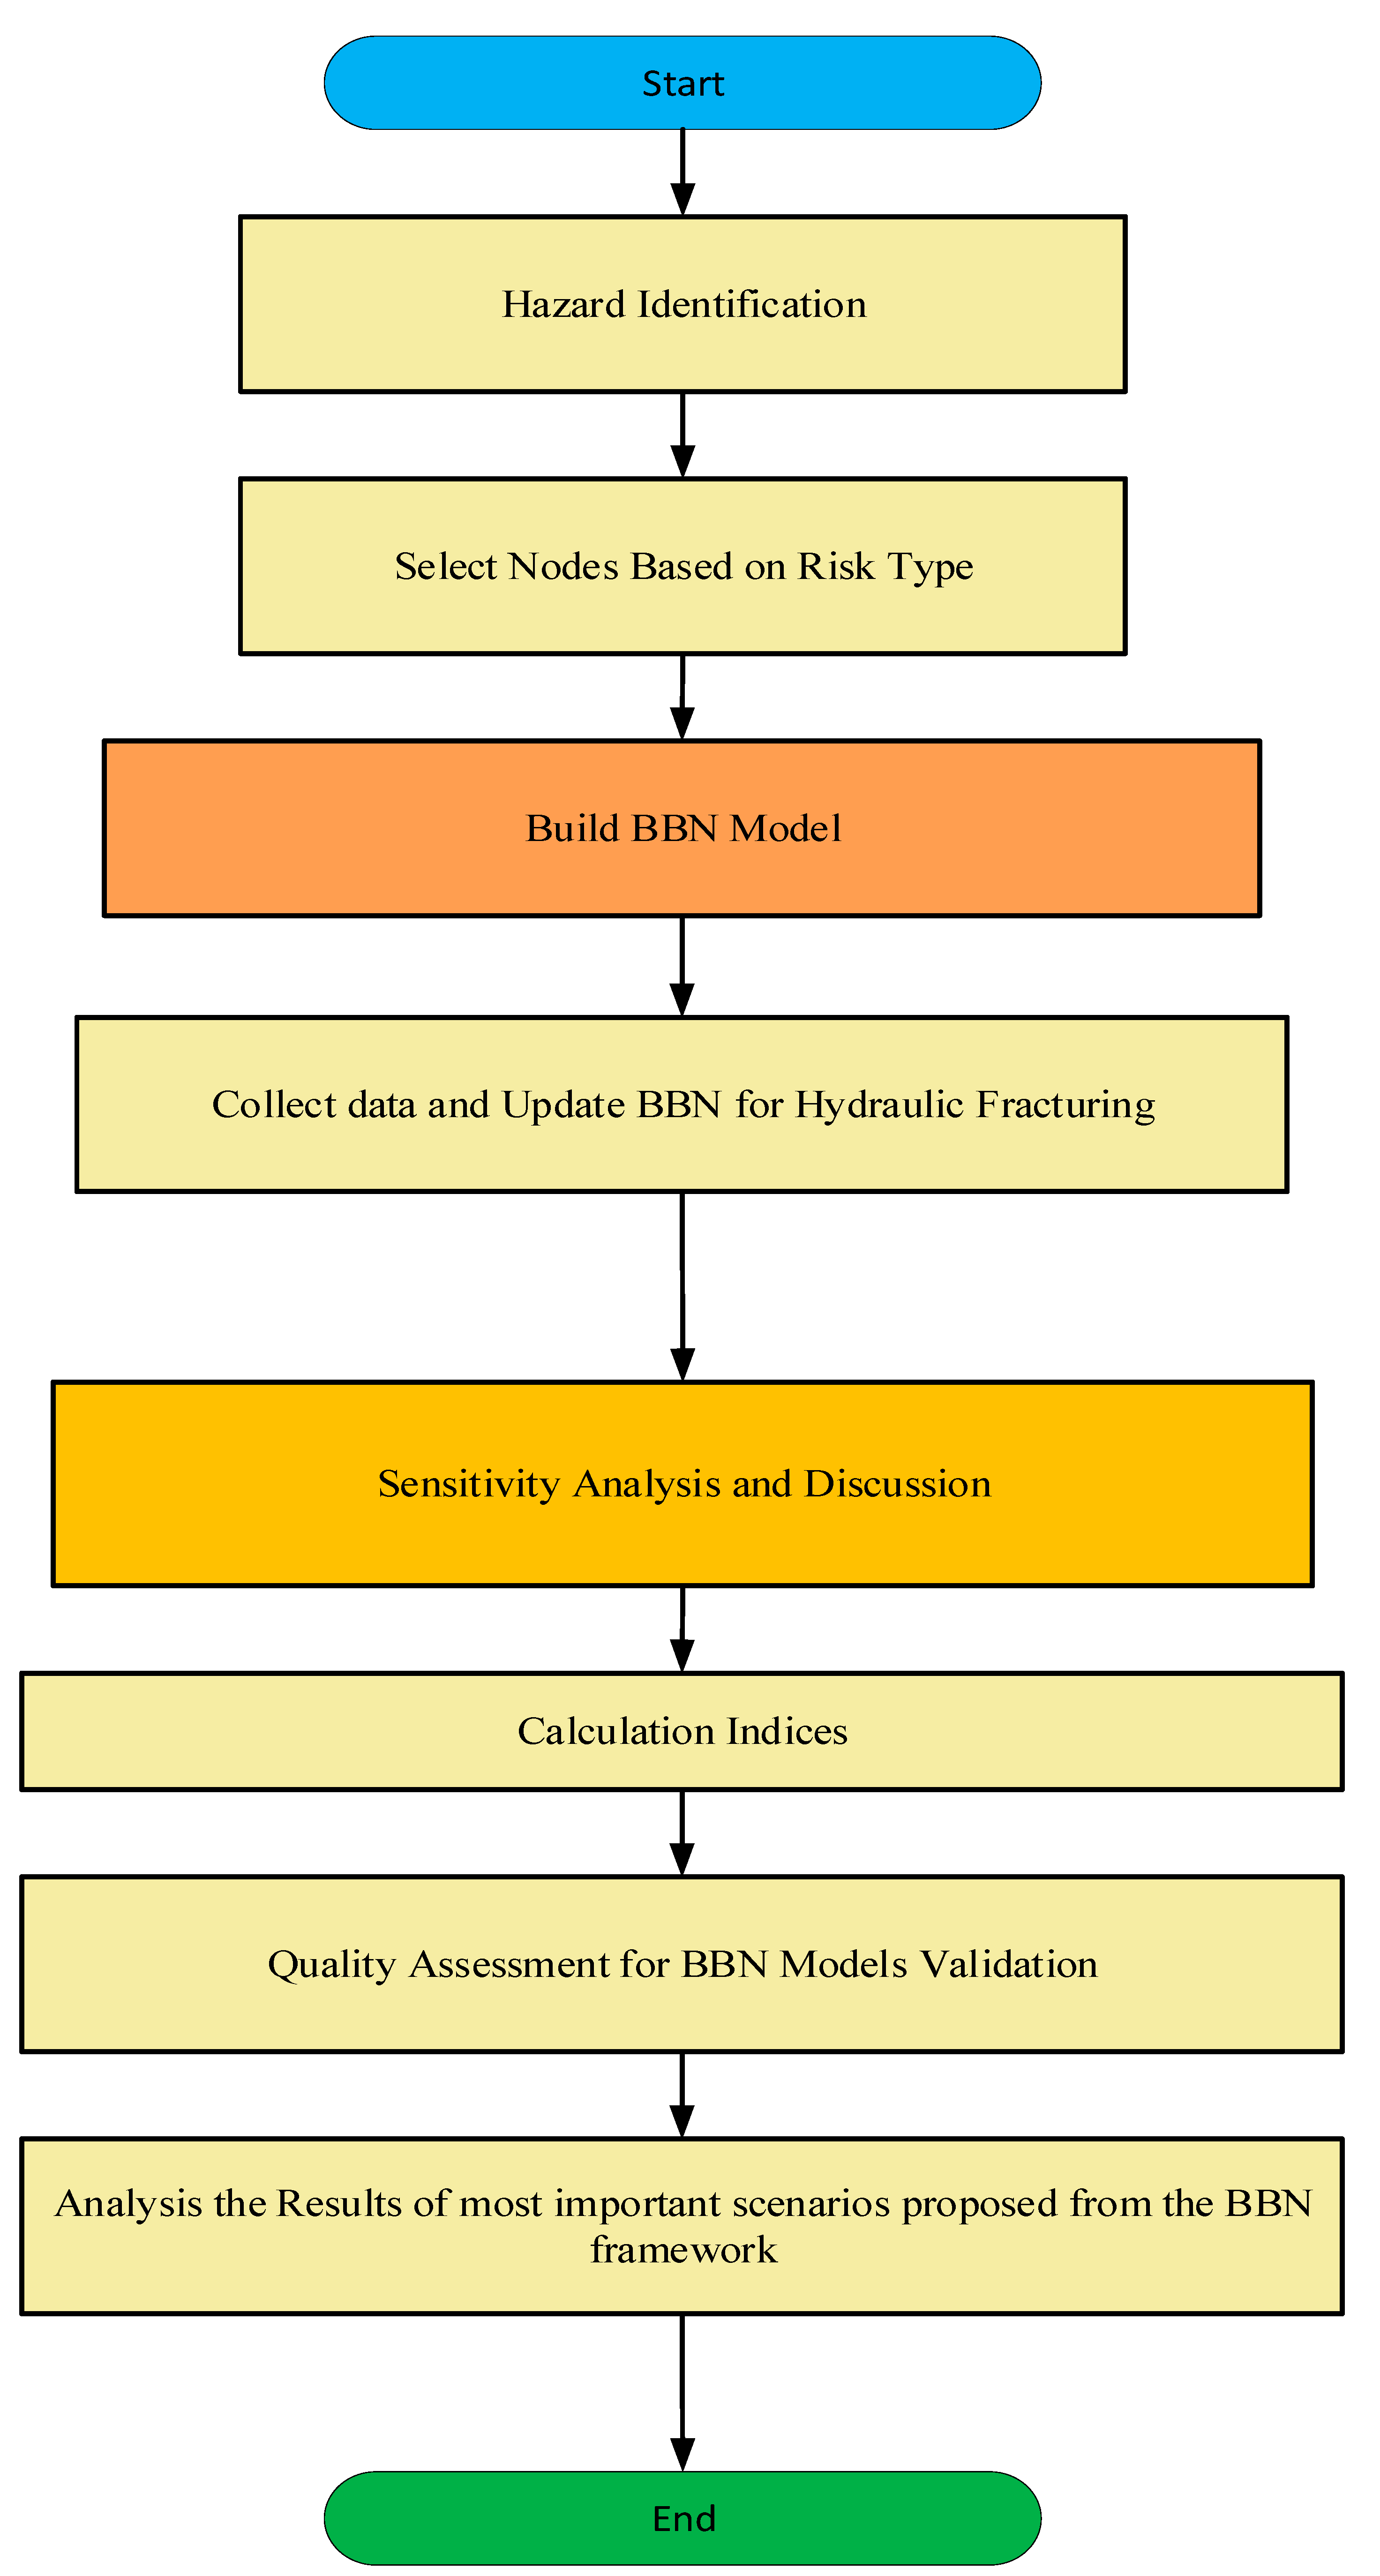
In this study, a fault tree (FT) model is employed for system safety analysis within hydraulic fracturing operations, integrating hazard identification and an event tree setup based on field data. The methodology enables a comprehensive assessment of qualitative risks by utilizing the combined fault tree and event tree to represent various scenarios. Figure 4 illustrates the actual hydraulic fracturing process and the equipment used at the surface level for this operation. The necessary field data, crucial for this study, were obtained from different shale gas wells related to this process. Expert opinions in the field were collected, translated, and analyzed through the error tree, with the assistance of the Top Event FTA program. The methodology allows for a comprehensive assessment of qualitative risks, using the combined fault tree and event tree to represent multiple scenarios. The risk assessments rely on the Bayesian belief network (see Figure 5) [15,16,17,18].
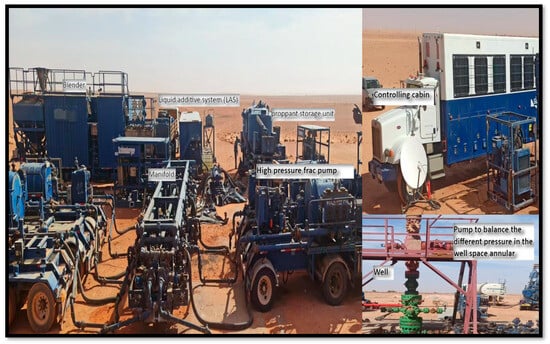
Figure 4.
Real equipment employed in a hydraulic fracturing operation for study modeling.
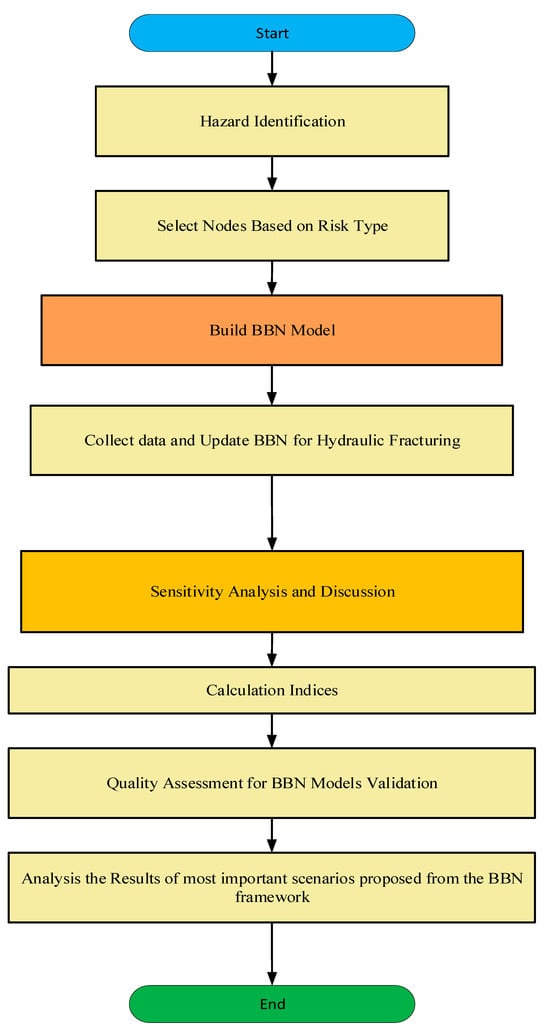
Figure 5.
Flowchart of the study model.
The process involves two key steps: hazard identification, which evaluates risk factors and potential hazards that could cause harm, and fault tree development, which is a systematic quantitative analysis that is conducted through the development of a fault tree (Figure 6). The proposed framework integrates results from both fault tree and event tree analyses, establishing links between causes and results for scenario analysis during the hydraulic fracturing process. This integrated approach forms the foundation for Bayesian belief network (BBN) modeling, as demonstrated in Table 1, which serves as the basis for linkage in this study [9,10,19,20].
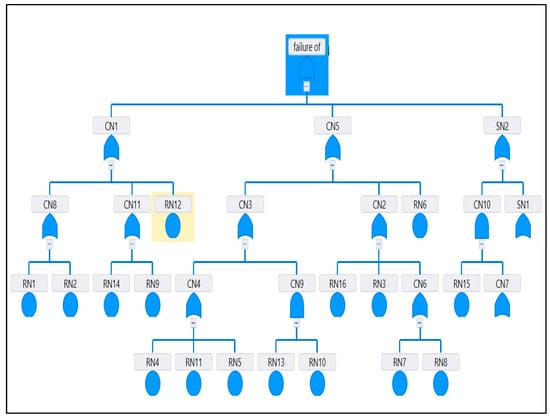
Figure 6.
Hydraulic fracturing fault tree diagram by using TopEvent FTA Express Fault Tree Analysis Software Version 1.2.3 Copyright 2019 Reliotech S.A.S de C.V.

Table 1.
Integrating results from fault tree and event tree analyses.
2.3. Building a BBN Model
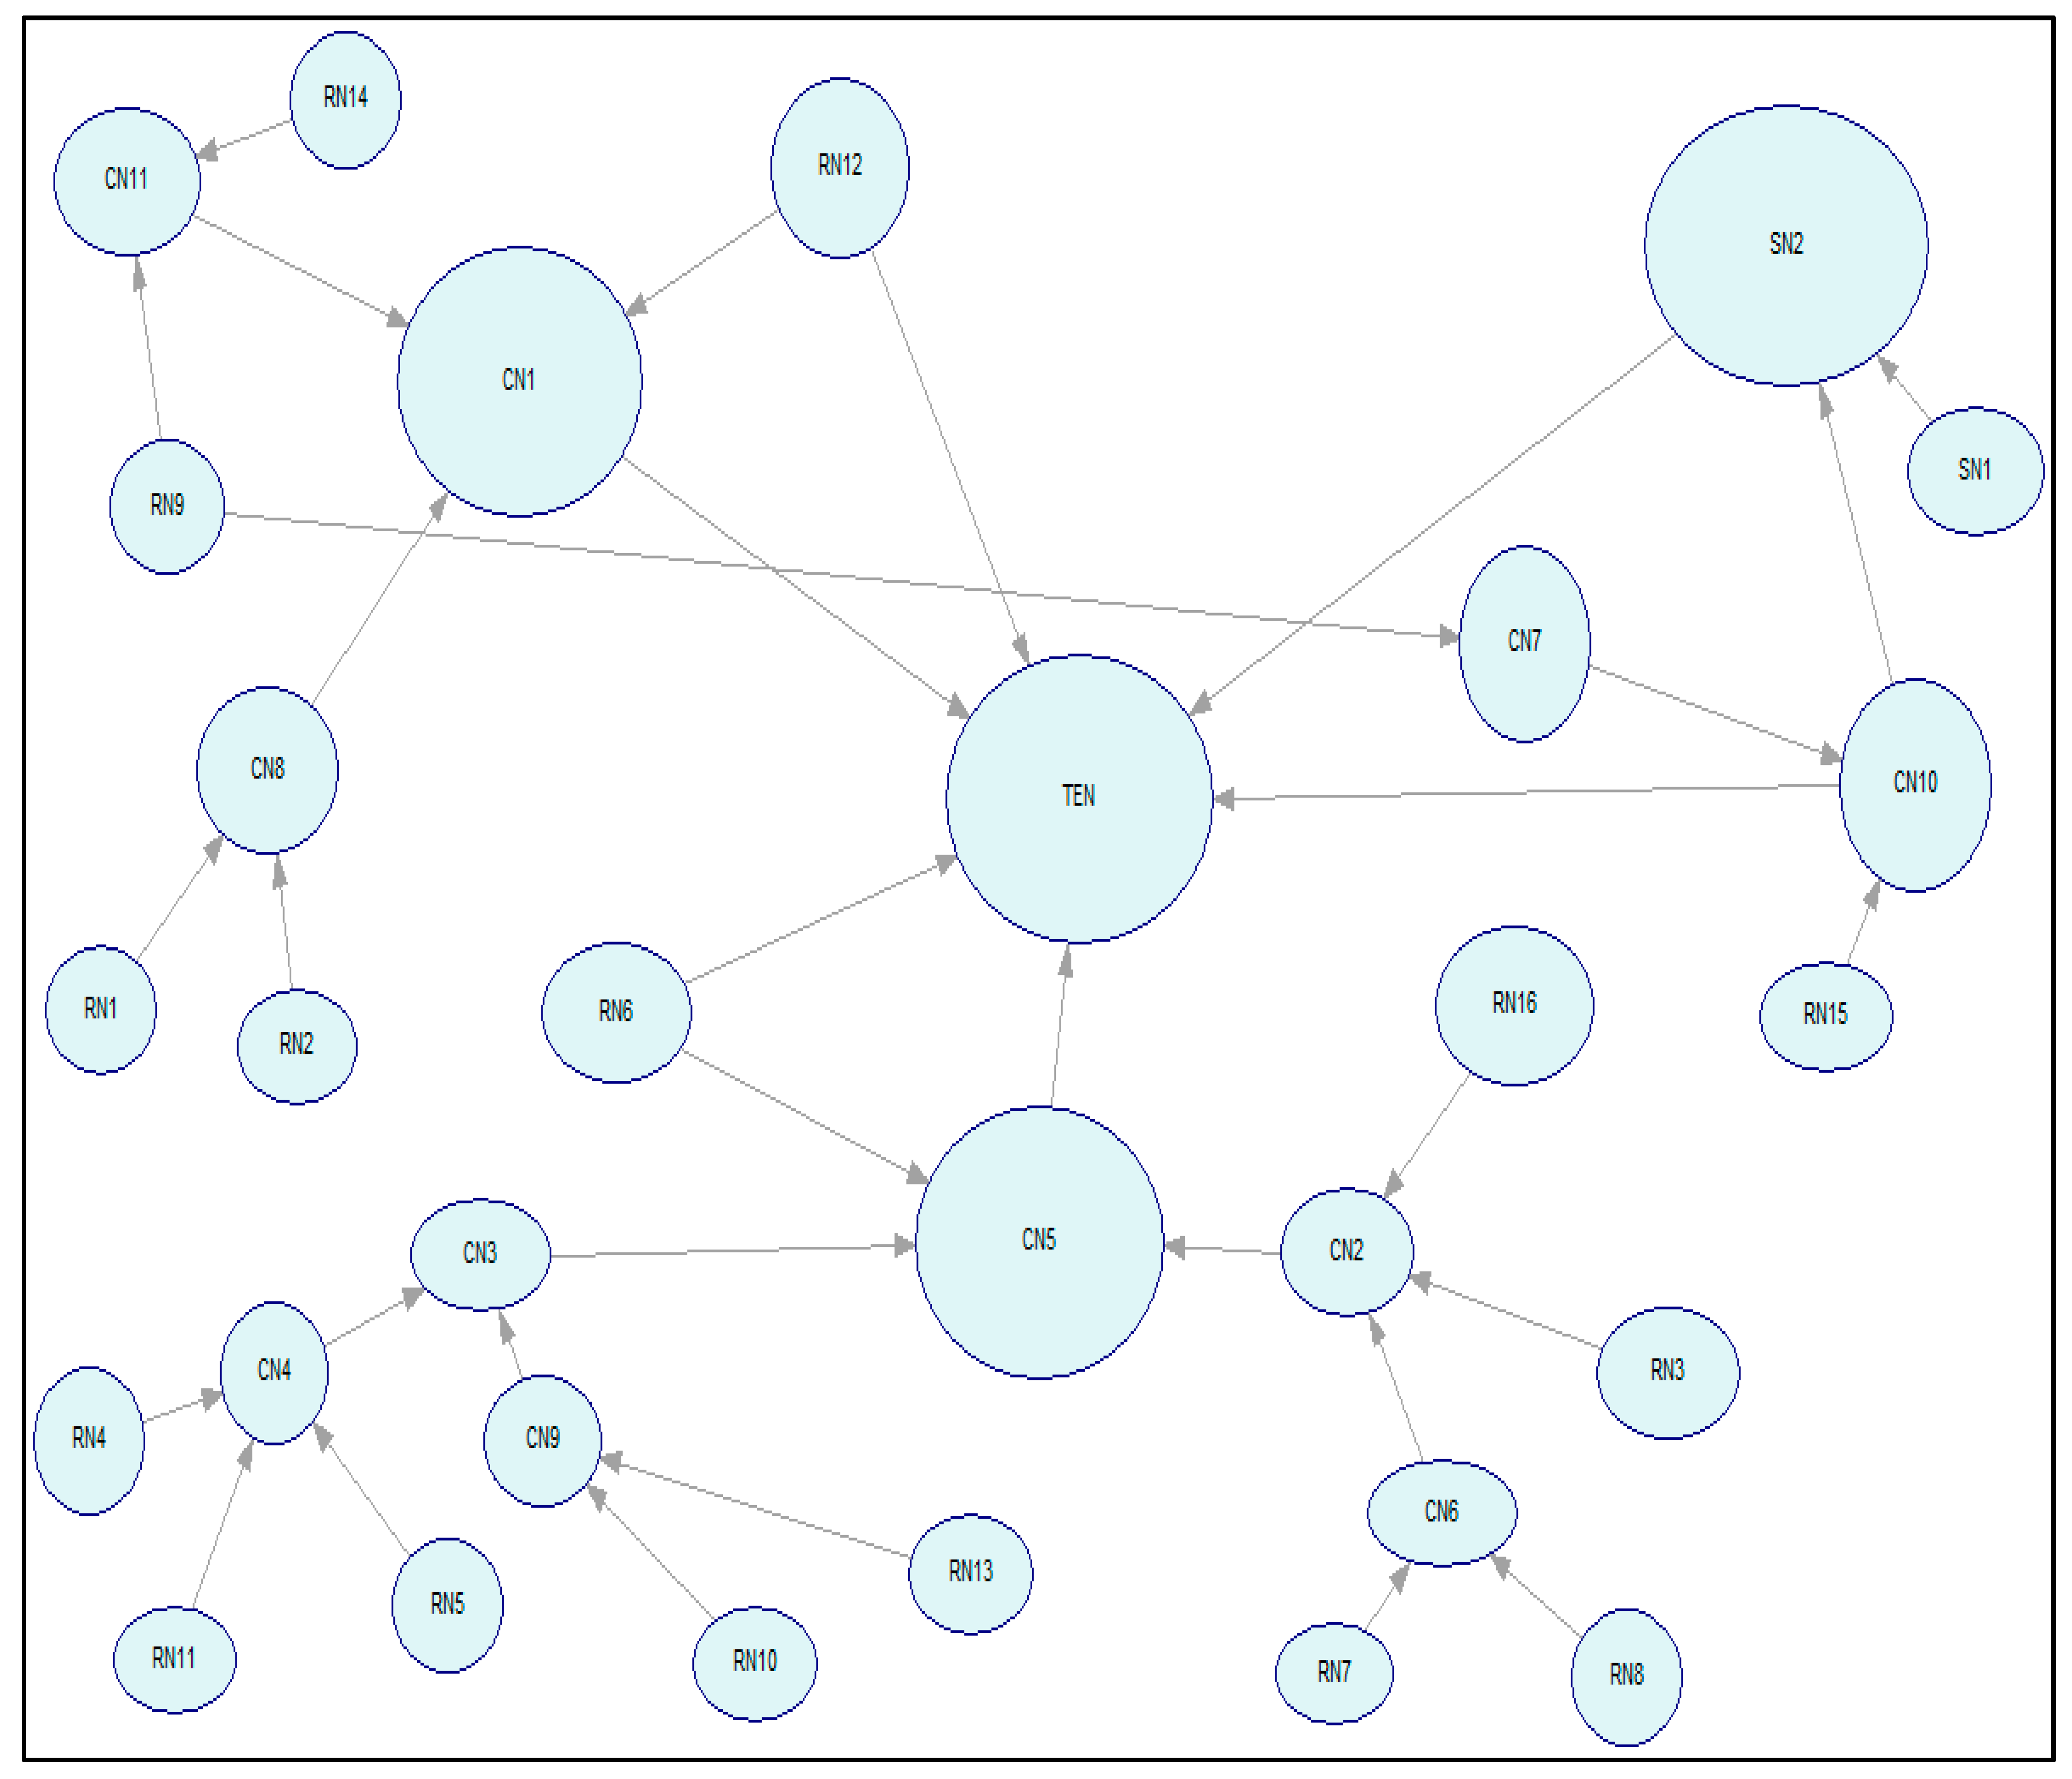
A Bayesian belief network (BBN) emerges as a potent diagnostic tool for identifying system faults in the context of hydraulic fracturing. Utilizing hierarchical graphs, the BBN adeptly captures probabilistic causal relationships among uncertain variables, which are crucial when confronted with limited data. This dynamic model learns continuously from both historical and real-time data, adapting its understanding during hydraulic fracturing processes based on observed changes [6,12,21]. The categorization of nodes into root nodes (RN), consequence nodes (CN), and safety nodes (SN) enhances the system’s fault identification capabilities. Links in the BBN symbolize associations, reflecting variable states and conditional probabilities for consequence nodes. When safety or consequence nodes lack root nodes, probabilities are considered unconditional. A fault tree, visually represented in Figure 6, encapsulates this hierarchical structure, aiding in the comprehension of fault scenarios. This adaptive model, tailored for hydraulic fracturing intricacies, ensures continual learning and updates, contributing to effective fault identification and, consequently, heightened system safety and performance. In essence, the BBN model provides a comprehensive framework that amalgamates historical and real-time data, categorizes nodes meaningfully, and utilizes conditional probabilities to evaluate fault scenarios, ultimately enhancing system resilience in hydraulic fracturing [12,14,22].
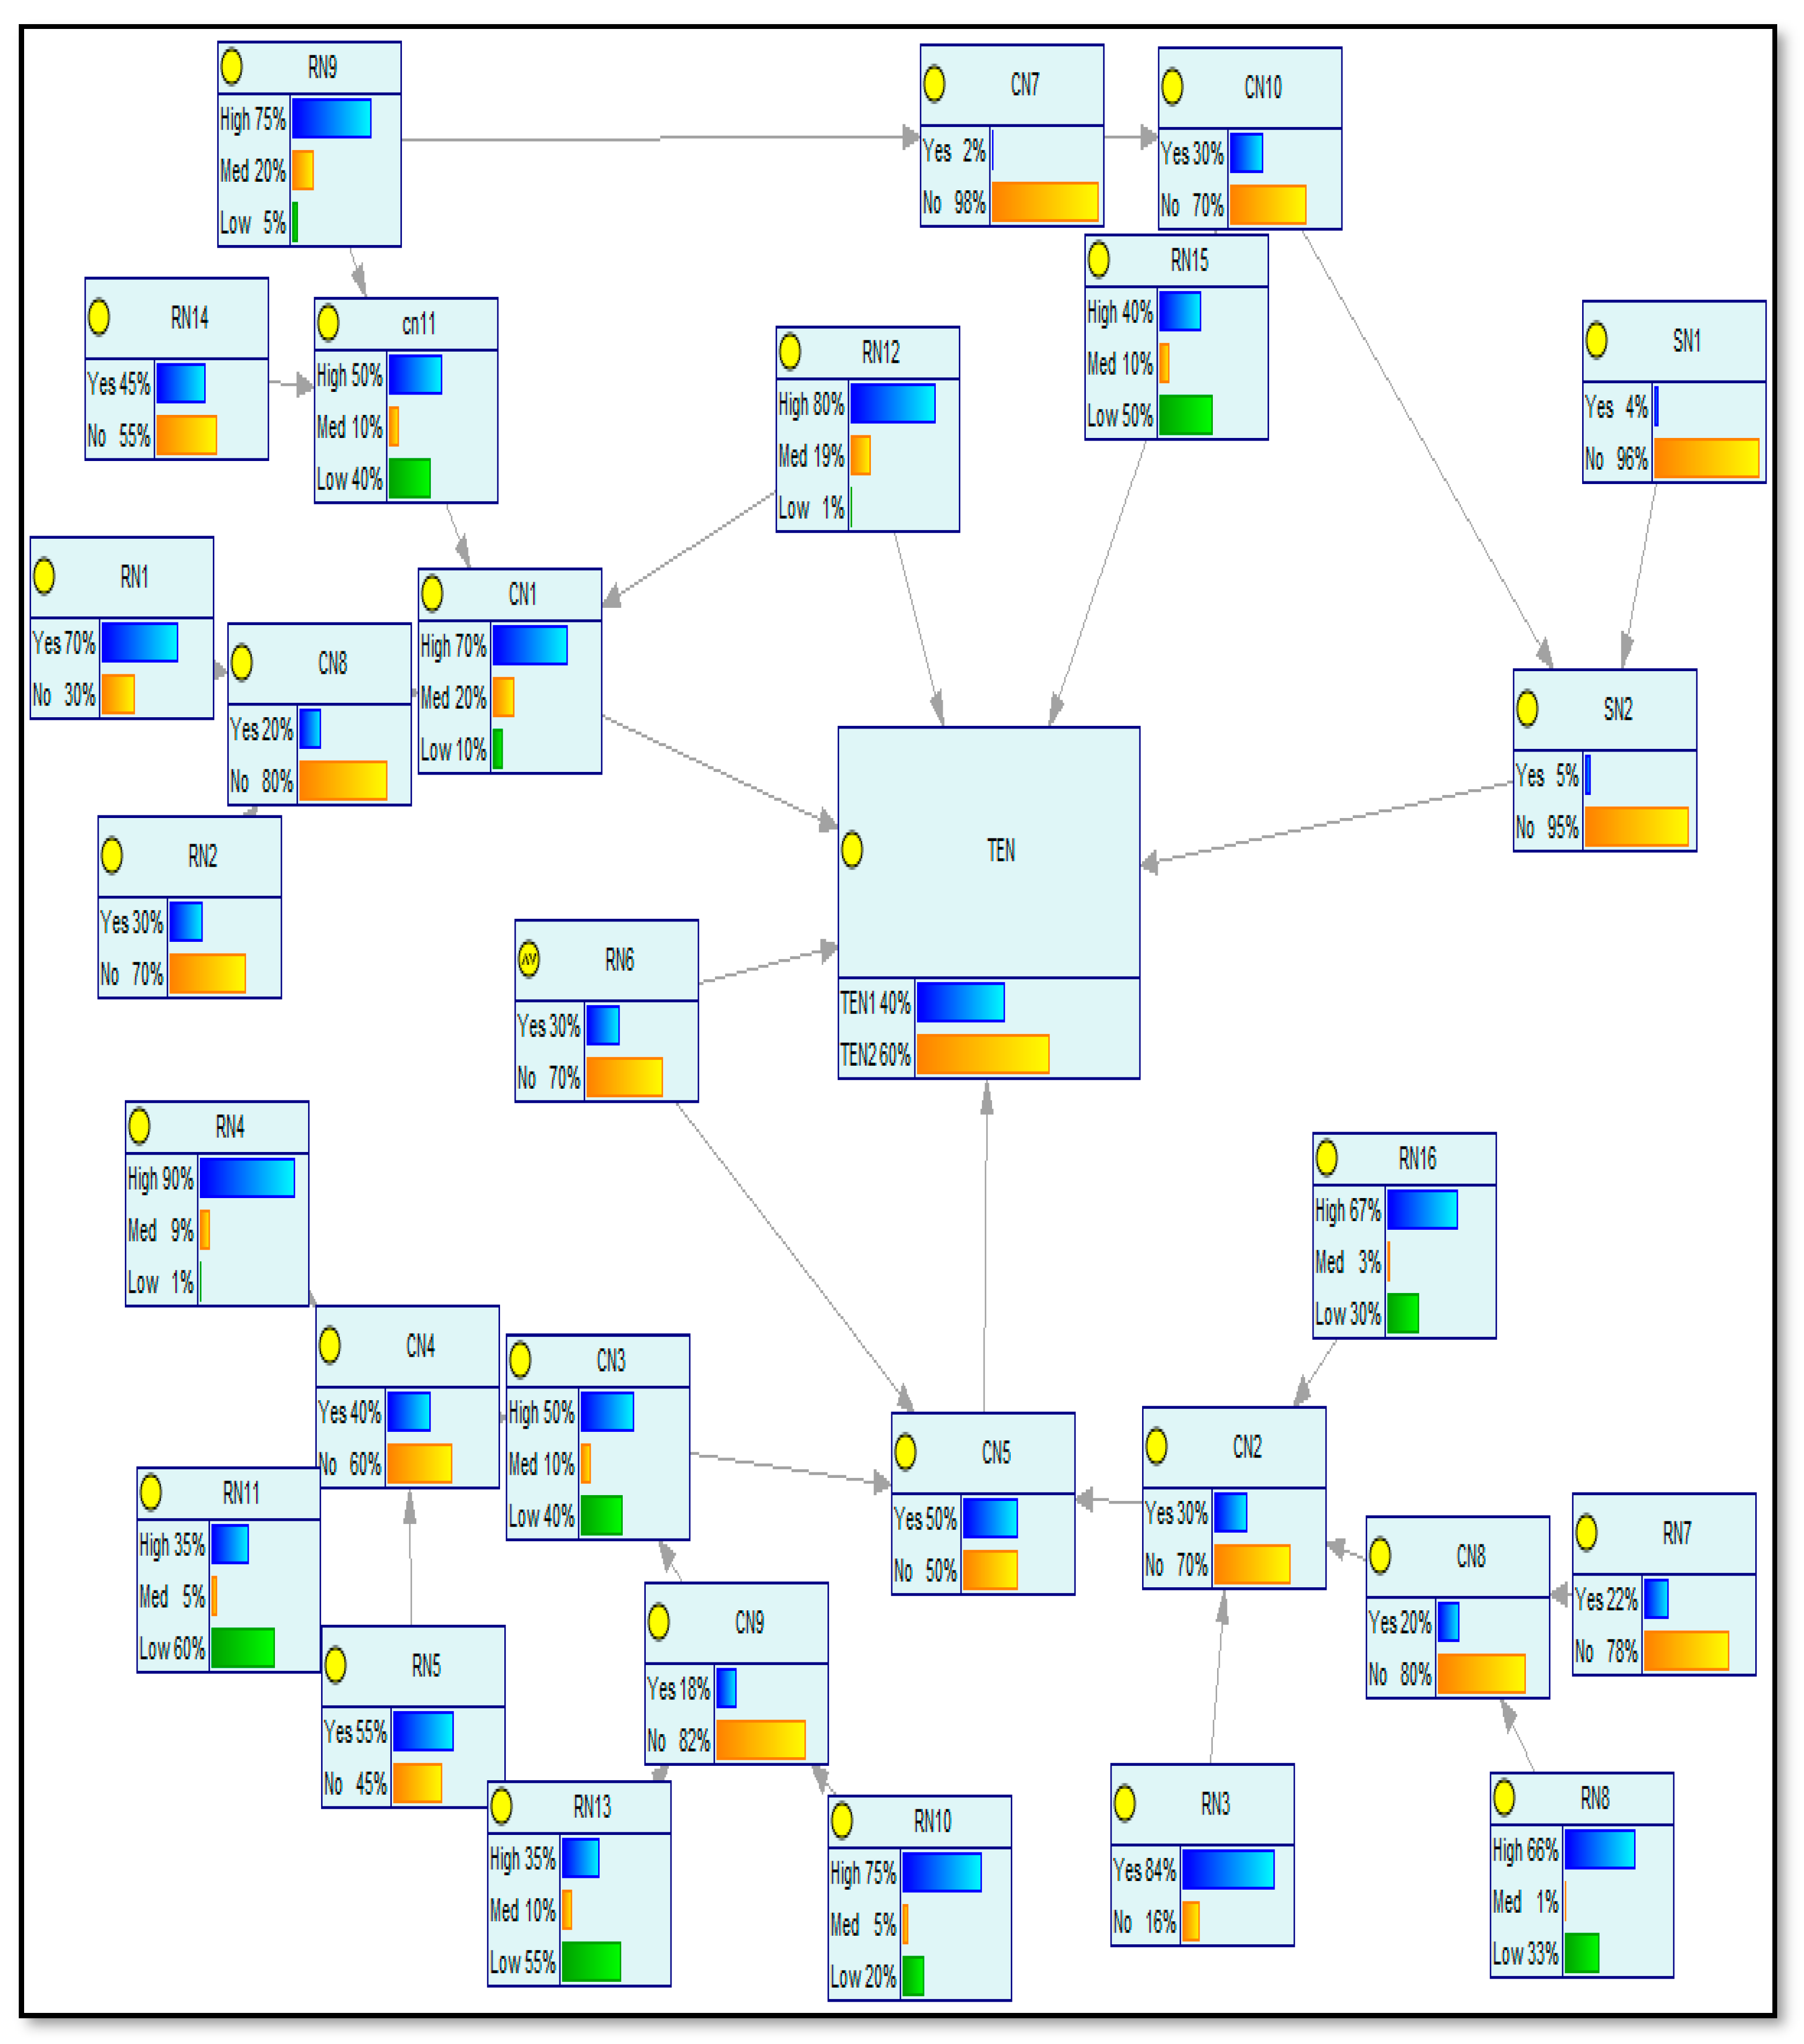
In Figure 7, the initiation of modeling and probabilistic programming is demonstrated using Software GeNIe Academic Version 4.0.1922.0, which is specifically tailored for Bayesian belief networks (BBN) in the context of real-time hydraulic fracturing process data. The model’s beliefs align with fault tree analysis and event tree, while the links signify causal connections between them. Notably, the model encapsulates intricate relationships, such as the consequence node linking strata with high in situ stress in shale gas reservoirs to high permeability zones and near-wellbore friction. This representation, as depicted in Figure 8, provides a visual roadmap for understanding the interplay of variables, facilitating effective fault analysis and enhancing the system’s adaptive learning in hydraulic fracturing scenarios [6,13,15,23]. In addition, Figure 7 illustrates a Bayesian network model through groups defined as G = RN, SN, CN, which correspond to FTA and ET. It can be simplified into variables and expressed in the results as G = V, A, where V refers to node groups of different variables and the group of their related A, giving V = {1,.....n) and . Meanwhile, the output result node i relates to the value of the variable and root nodes. The equation R(i) represents the root nodes for each of the consequence nodes, and the safety node is represented as i.

Figure 7.
Selecting node types and building a BBN model.
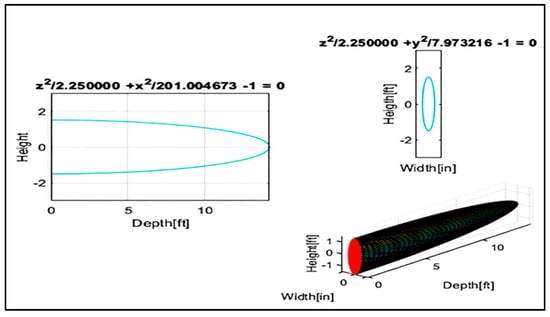
Figure 8.
The likelihood probability of high permeability zones and near-wellbore friction estimation for a BBN model using MATLAB software Version information for MathWorks R2022b.
A path is a link vector for each state of for each variable that has the same probability distribution:
This is given if the probability of the variable is without a root and the negligible probabilities are .
Equation (2) expresses the state of variables with the root of each variable through conditional probabilities
where represents the situation group of root nodes of i.
2.4. A BBN for Hydraulic Fracturing
The Bayesian belief network (BBN) model for hydraulic fracturing intricately connects nodes through probability distributions, articulating the maximum likelihood of various scenarios. Non-root nodes are characterized by continuous probability distributions, while conditional probabilities govern other nodes. Given the specificity and complexity of shale gas exploitation, extensive research and fieldwork are undertaken, as are collaborations with experts to collect and analyze data. This comprehensive approach, integrating artificial intelligence, focuses on developing a Bayesian belief network (BBN) capable of modeling and real-time prediction. Particularly, the model focuses on the propagation of Pressure Wave Peaks (PWPs) within coal rock fissures during hydraulic fracturing, as illustrated in Figure 8. The utilization of MATLAB software for modeling estimates the likelihood probability of high permeability zones and near-wellbore friction, showcasing the BBN model’s predictive capabilities in this intricate process [24,25,26].
These pressure waves are pivotal in assessing the effectiveness of the fracturing process [27]. To model PWP propagation, we utilize the following equations:
Equation (1)—original pressure wave equation:
where
represents the transient pressure loaded on the coal in kPa;
is the PWP peak in kPa;
is the PWP frequency in Hz;
is the velocity of the wave in m/s;
is the position in m; and
is the transient time in s.
Equation (2)—corrected pressure wave equation:
represents the average of the PWP that did not change during the PWP propagation period. Equation (1) represents the initial pressure wave equation, while Equation (2) corrects it by accounting for a constant offset represented as [18]. Additionally, we examine the synthesized wave resulting from incident and reflected waves using Equation (3)—Synthesized Wave Equation:
where
is the PWP peak of the synthesized wave;
and are the amplitudes of the incident and reflected waves, respectively; and
is the phase difference between the incident and reflected waves.
This equation helps us understand how incident and reflected waves interact constructively, providing insights into the PWP peak at the fissure end [19].
In the context of the Bayesian belief network (BBN) model for hydraulic fracturing, nodes are interconnected using probability distributions to express the scenario likelihood. Continuous probability distributions are used for non-root nodes, while conditional probabilities are applied to other nodes. Since the model often deals with qualitative data, expert elicitation is preferred when no quantitative data is available [20,27,28].
Hazard identification, fault analysis, and expert opinions contribute to constructing the Conditional Probability Table (CPT), ensuring the model’s credibility and realism [21]. Integrating these mathematical equations into our BBN model enhances our ability to predict and effectively manage the hydraulic fracturing process.
Furthermore, the relative weight values of each node play a vital role. Root formations are compatible with each state of nodes, such as reservoir contamination, fluid efficiency, exceeding equipment loading capacity, error in the hydraulic system, near-wellbore friction, damage in the reservoir, and shortening the well’s life. The relative weight of the node varies between one and zero, expressing the value of the weight in the node and the mutual effects between the root node and the consequence node [22,28,29].
To develop the hybrid Bayesian network (HBN), we utilize the fault tree model from the second section. The CPT is defined according to the location and function of nodes and their influence on the states of consequence nodes. In the BBN, nodes are categorized into pivot nodes with respect to sample sizes of root nodes, safety nodes, and consequence nodes [22,27,30].
Table 2 summarizes the scenario analysis for hydraulic fracturing failure using three methods: likelihood, EBBN, and Weighted Sum Algorithm. These methods calculate the likelihood of failure scenarios related to the propagation of Pressure Wave Peaks (PWPs), providing valuable insights for risk management and decision-making [19,20,21,22]. These methods are essential for risk assessment in hydraulic fracturing.
Table 2.
Scenario analysis of the BBN obtained from the three-method framework.
3. The Main Results of Bayesian Belief Networks
The primary outcomes of Bayesian belief networks (BBNs) hinge on a judicious assignment of a priori probabilities, expert input, and the application of artificial intelligence algorithms, particularly in scenarios with limited data. Sensitivity analysis becomes crucial in contexts of restricted data to pinpoint influential input parameters that significantly affect the output results. The BBN model relies heavily on nodes, shaping its structure through conditional probabilities in both inputs and outputs. The strategic setting of probabilities serves the dual purpose of exploring sensitivity and facilitating analysis-assisted optimization through model calibration. To enhance the integrity of the BBN model, which deals with both discrete and continuous values of input parameters, a variance reduction method is employed. This method allows for an in-depth assessment of the BBN model’s sensitivity to variations in specific input parameters, contributing to the model’s overall optimization [6,8,22,24,31].
3.1. Finding Sensitivity Parameters
The Sobol indices are utilized for global sensitivity analysis, providing a robust method to assess the relative significance of input parameters on model outputs. This analysis reveals the extent to which interactions between specific inputs influence the overall output. For instance, it might indicate that 90% of the output is due to the interaction between two inputs, with one contributing 8% of the variance and the other 2% (see Figure 9). This approach is applied to characterize the dynamic system of the environment impacted by hydraulic fracturing, incorporating changes and developments expressed within the BBN model for shale gas reservoir hydraulic fracturing [21,25,26].

Figure 9.
Diagnostic BBN for hydraulic fracturing using GeNIe academic software version 4.0.1922.0.
The variance-based Sobol sensitivity method explores the multidimensional space of the unknown input parameters X with a certain number of Monte Carlo samples. The sensitivity indices, both first order and the higher interactions between the unknown input parameters, are generated by a decomposition of the BBN model function in a d-dimensional factor space into summands of increasing dimensionality [30,32,33]:
where the constant fi is a function of Xi and fij is a function etc. A condition of this decomposition is the total number of summands in Equation (2).
Functional elements are expressed by conditional probability values,
We develop the function to become of the second degree so that the function can be defined by the terms ij and the main variables and . This assumes that the factorization results from the integral of the function are squared as follows:
The following properties hold for variance expression indices:
where
Based on the total conditions of variance, the outputs are explained through the analysis of variance according to the condition of each input. stands for variables excluding the value of , which is the main sensitivity indicator.
is an indicator of sensitivity called the first order of sensitivity and is given as follows:
It is considered that the main outputs of the variables express the state of variable alone in order to calculate the mean value of the various inputs through the total variance, which in turn enables the formation of additional indicators, and . Depending on , the outputs are expressed as follows:
Since the model contains a large number of variables, the indicators are computationally expensive, so the total order index that is used to measure all the variance outputs for is not given here.
3.2. Calculation of Indices
In examining the statistical dependencies and their implications for the performance of the Bayesian belief network (BBN) in hydraulic fracturing, we employ Monte Carlo integrations and Sobol’s estimation. This methodology unveils crucial parameters within the BBN framework, facilitating a comprehensive assessment of system behavior. By integrating Sobol’s variance-based method with Monte Carlo simulations, primary order and total sensitivity indices are evaluated. Utilizing the BN Toolbox© in Matlab®, these analyses reinforce the robustness of the model for risk assessment in hydraulic fracturing processes, contributing to improved risk diagnosis [20,22,34].
Table 3 illustrates the results of a simulation with over 5000 iterations using Matlab, displaying calculated sensitivity indicators for the BBN model. These outcomes underscore the model’s reliability and its potential to optimize decision-making in hydraulic fracturing scenarios, aligning with the objective of ensuring safer and more efficient operations. To quantitatively compare the prediction accuracy of the order index, two evaluation indexes—root mean square error (RMSE), mean absolute error (MAE), and coefficient of determination (R2)—are introduced. RMSE and MAE reflect the predictive error, with lower values indicating better algorithm performance. R2, assessing goodness of fit, ranges from 0 to 1, with a score closer to 1 indicating a superior model fit [35,36,37].
Table 3.
The sensitivity analysis results for the BBN by Sobol’s estimation based on Monte Carlo integrations.
Root mean square error (RMSE):
Mean absolute error (MAE):
Goodness of fit (R2):
4. Discussion
4.1. Analysis of the Most Important Scenarios Proposed from the BBN Framework
During the well hydraulic fracturing, Bayesian network-driven intelligent artificial analysis explores scenarios, identifying components causing process failure or undesired outcomes. Utilizing a purpose function measures the risk score (RS), enabling precise risk assessment. The function is combined with Bayesian network probabilities to evaluate failure consequences through a sorting probability calculation, as depicted in the Equation below [37,38,39].
where
is the scenario exclusion;
is the probability of scenario Se;
is the expected disutility where ;
is the function of combinations of parent states of the value for 1, which belongs to components that fail in the system, and 0, which presents them otherwise;
is the risk share; and
is the conditional expected disutility function for scenario .
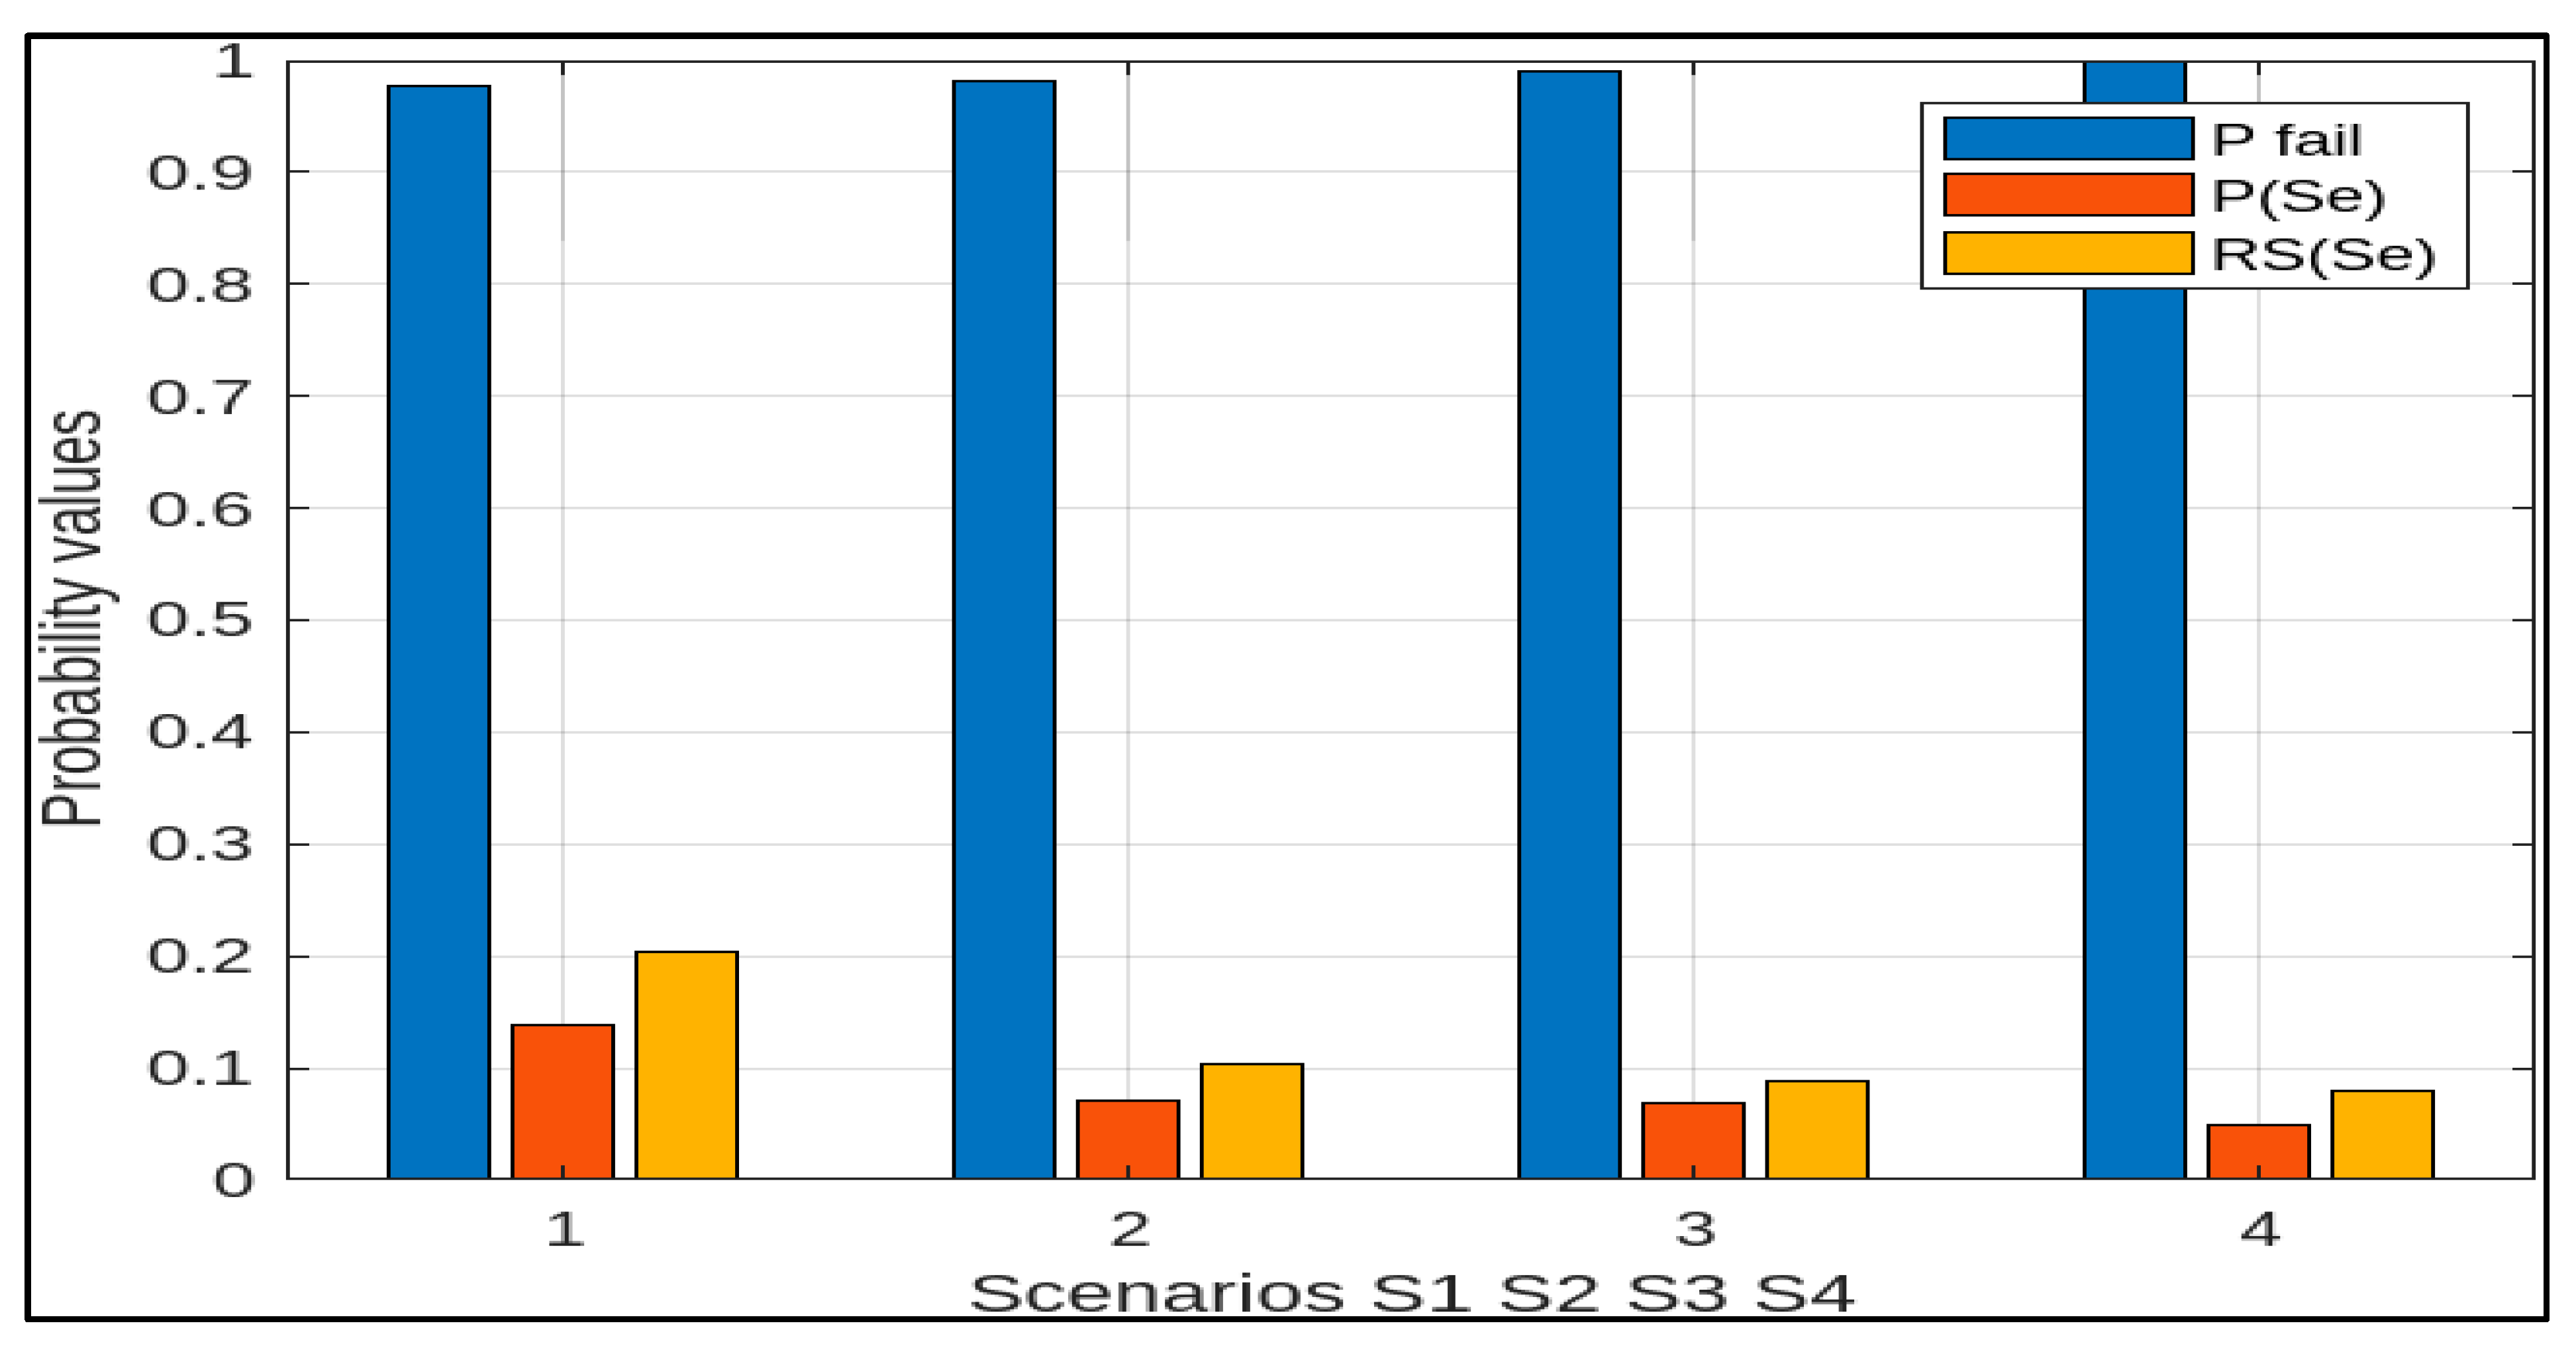
Table 4 outlines the outcomes of the sensitivity analysis, emphasizing the most critical scenarios in hydraulic fracturing that pose a potential risk of process failure. Significantly higher probability rates are observed for CN1, CN10, and RN8, signaling heightened risks to the well and reservoir. In contrast, lower rates are attributed to RN12. These results underscore the substantial influence of specific crucial variables, especially inherent factors that are challenging to control. Effectively addressing factors like rock–gel friction in diverse reservoirs becomes essential for enhancing fracture conductivity and projecting fracture pressure to achieve desired operational results [19,26,40].
Table 4.
The four riskiest scenarios based on the consequence framework.
The findings reveal substantial variations between scenarios, notably indicating a heightened failure rate in the fourth scenario. This emphasizes the critical need to prevent non-homogeneous tank pressure surges as they can significantly jeopardize well performance and overall results. Industry experts in oil and gas, particularly those focused on engineering and production, are urged to reassess the most perilous scenarios, particularly involving CN1, RN8, and factors influencing the RN12 node, such as temperature and unfavorable physical properties [29,40,41].
4.2. The Results of Sensitivity Analysis and Partial Validation
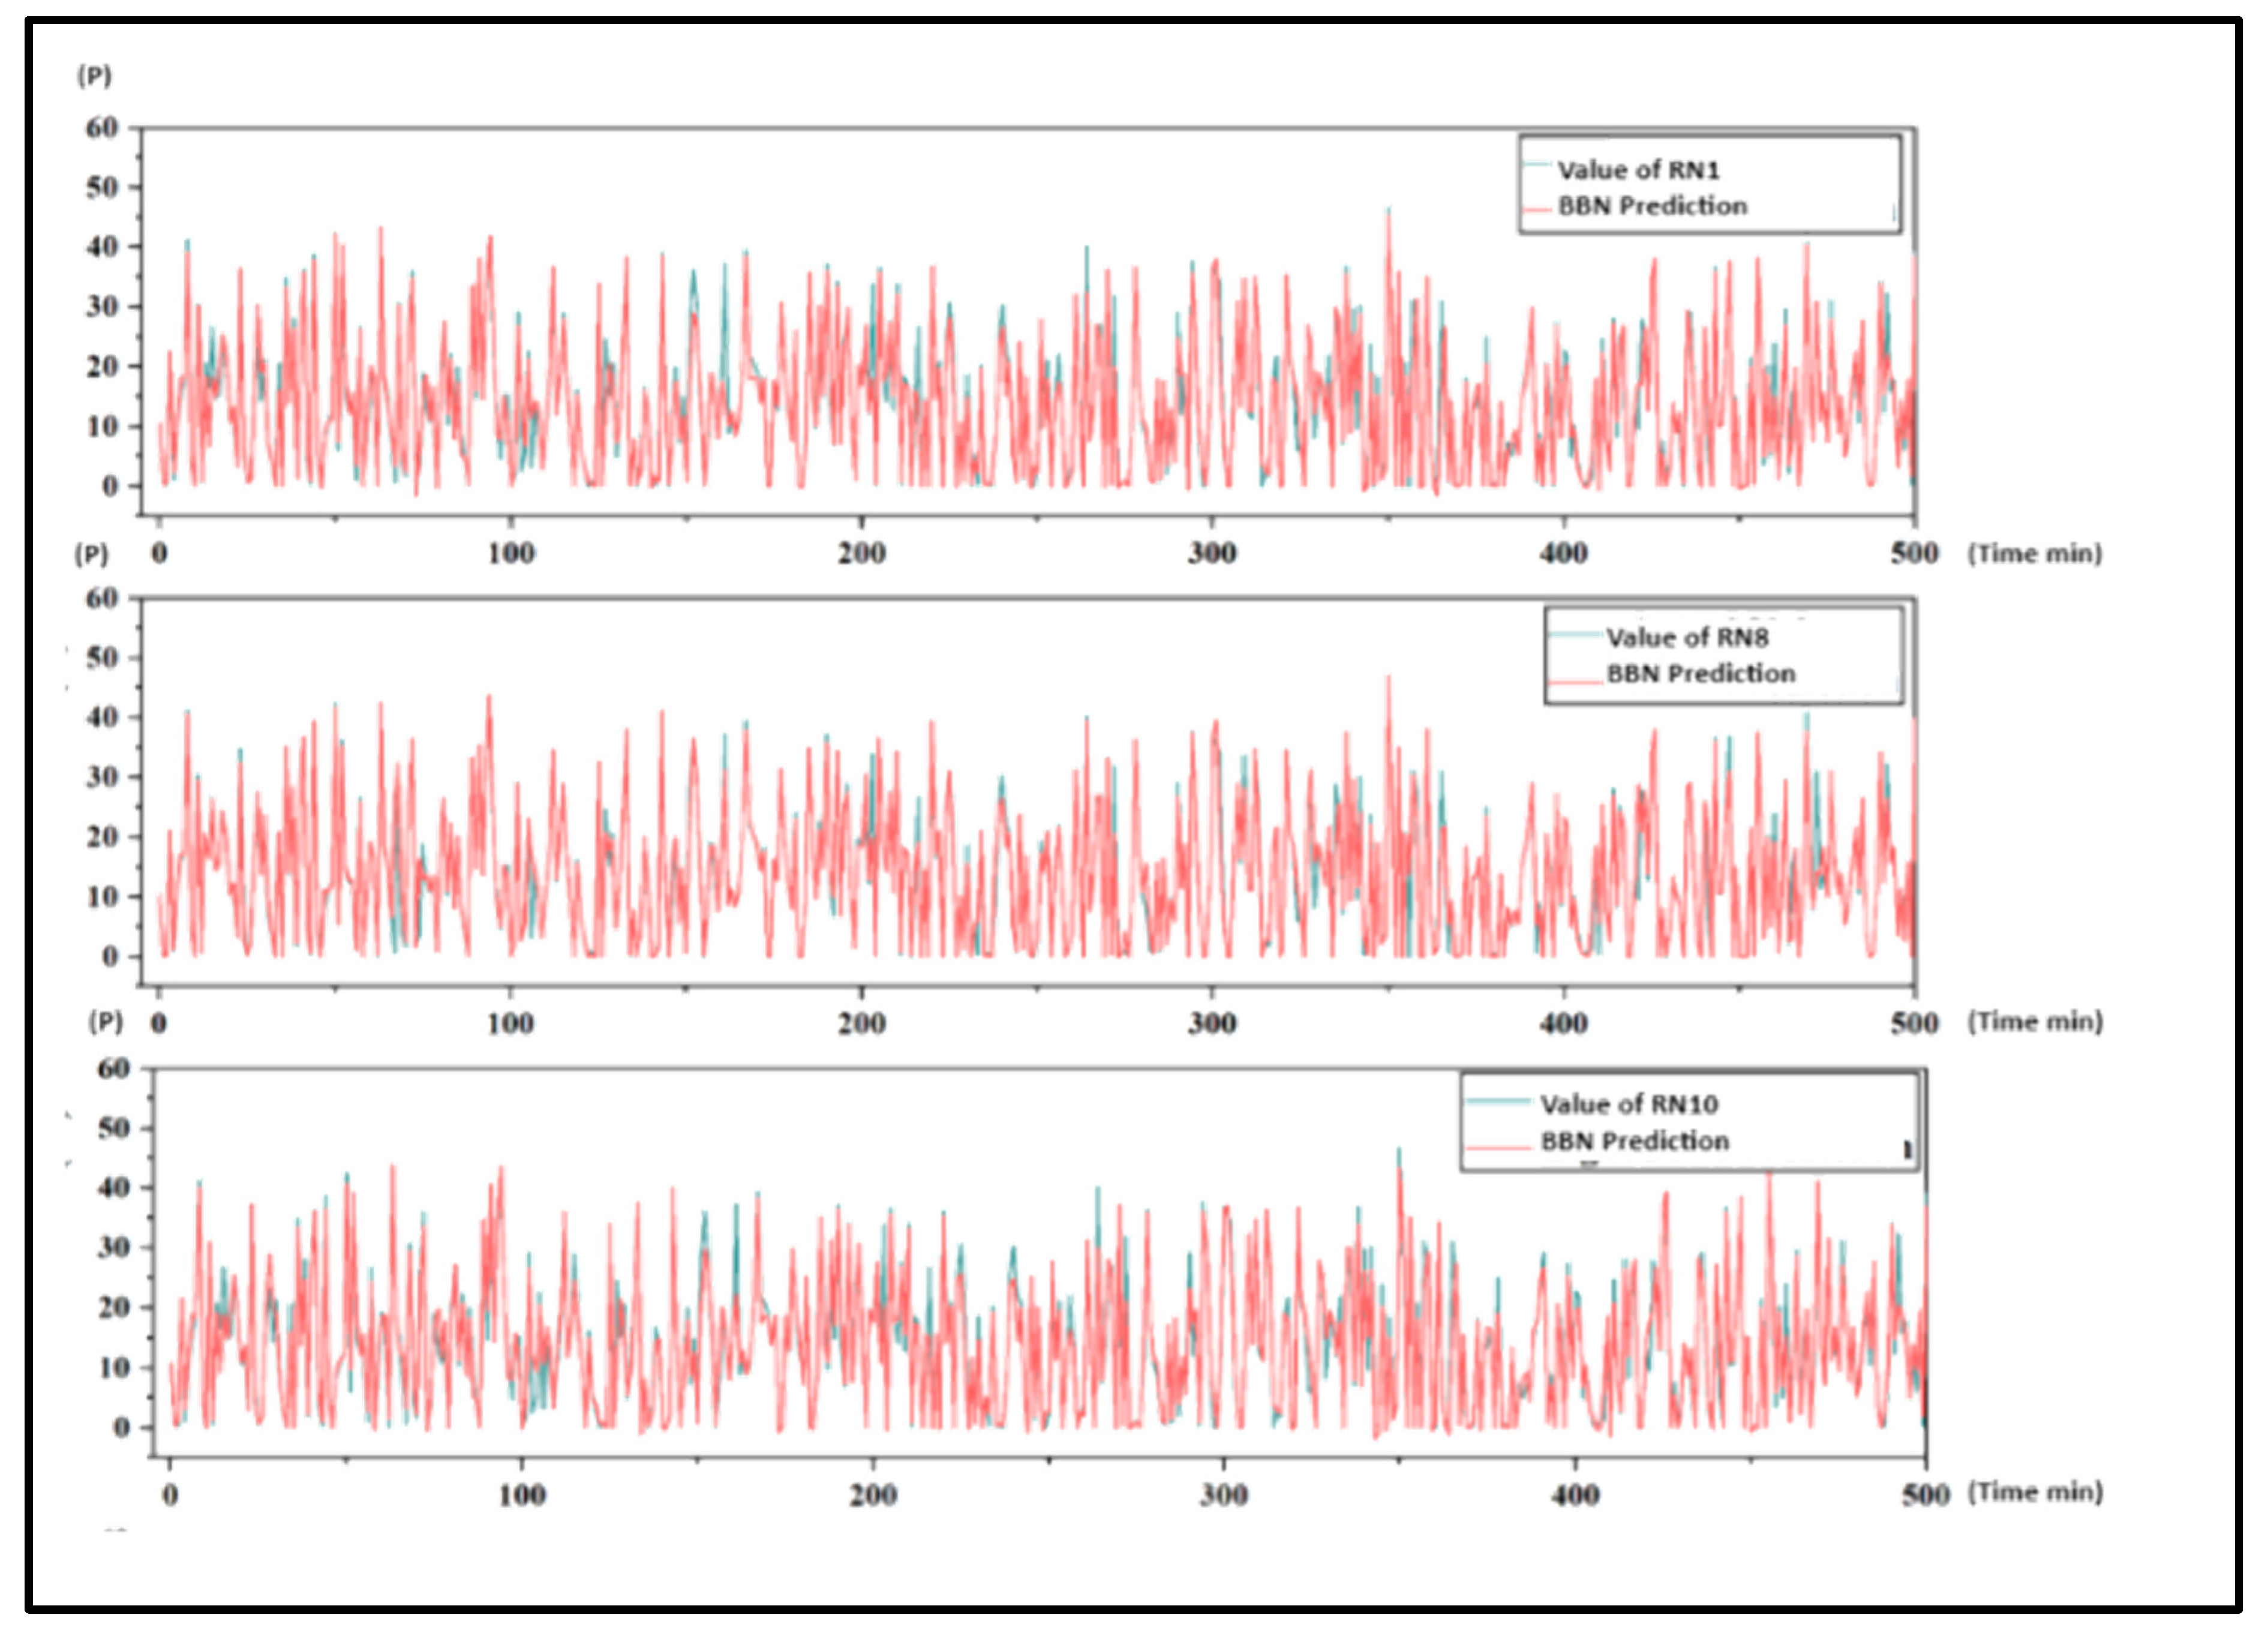
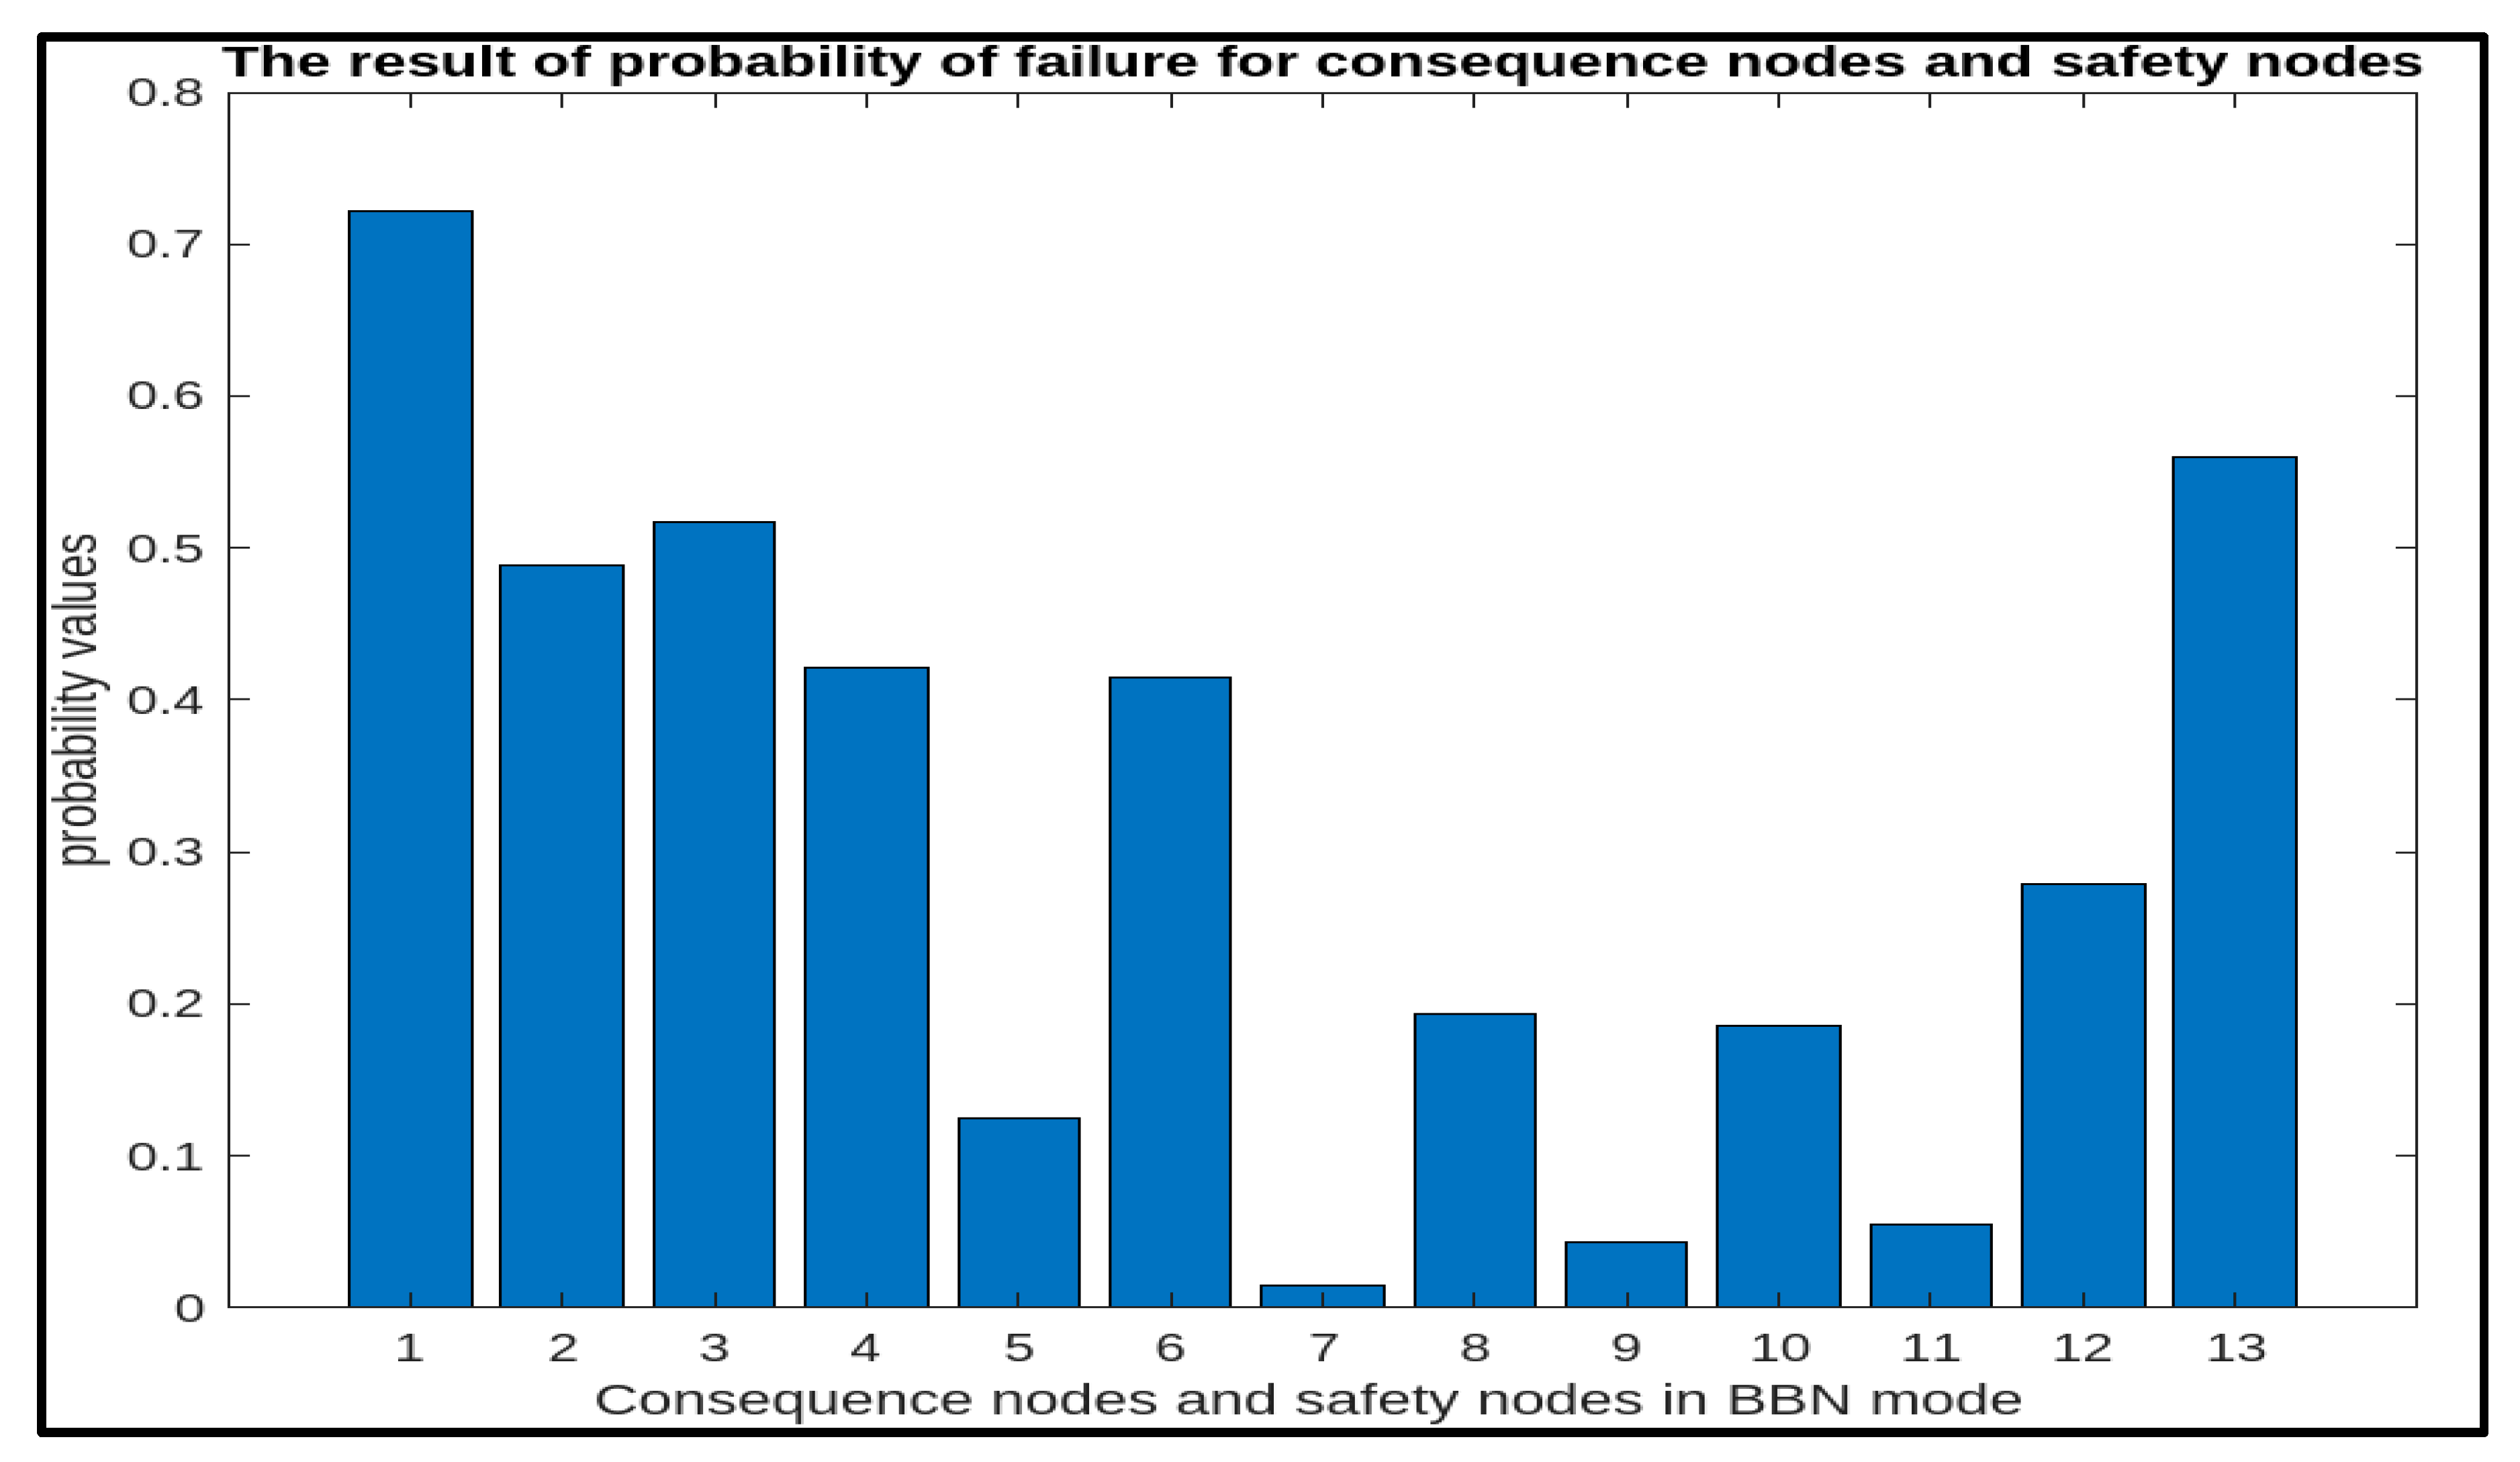
This section consolidates previous efforts and outcomes in constructing an integrated model aimed at averting failures in hydraulic fracturing processes within non-conventional reservoirs. Failures in such processes can result in diminished production, shortened well lifespan, and increased financial and environmental losses. The fault tree was initially developed, followed by the creation of the Bayesian belief network (BBN) model (Figure 10). The MATLAB simulations in Figure 11 provide a real-time, quantitative comparison of prediction accuracy within the BBN modeling framework. This crucial analysis focuses on three specific scenarios: RN1, RN8, and RN10. Two evaluation indices—root mean square error (RMSE), mean absolute error (MAE), and coefficient of determination (R2)—were employed to quantitatively compare predictive accuracy. These results, validated through expert consultation, offer insights into mitigating the most perilous scenarios and conducting simulations to minimize failure risks based on artificial intelligence technology [18,30,35]. The network, depicted in Figure 12 and Figure 13, calculates probabilities based on expert opinions from the shale gas industry, integrating the predictive capabilities of artificial intelligence technology [18,35].

Figure 10.
The most dangerous scenarios obtained through the BBN mode.

Figure 11.
Real-time quantitative comparison of prediction accuracy for scenarios RN1, RN8, and RN10 using Matlab in Bayesian belief network modeling.
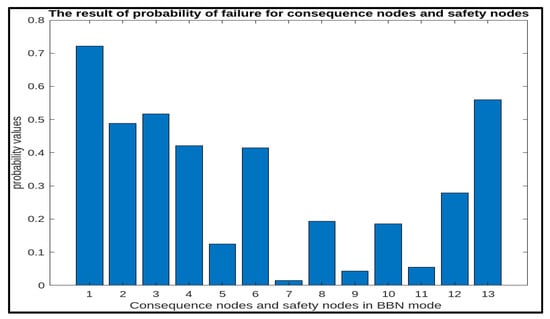
Figure 12.
The probability parameters for consequence nodes.
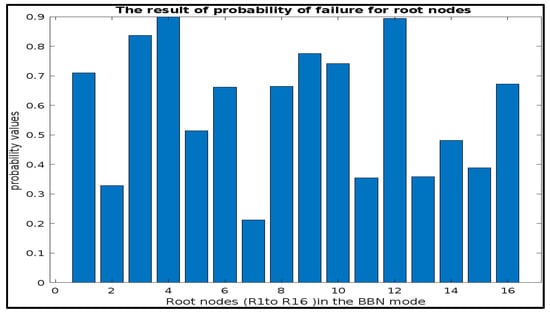
Figure 13.
The probability parameters for root nodes.
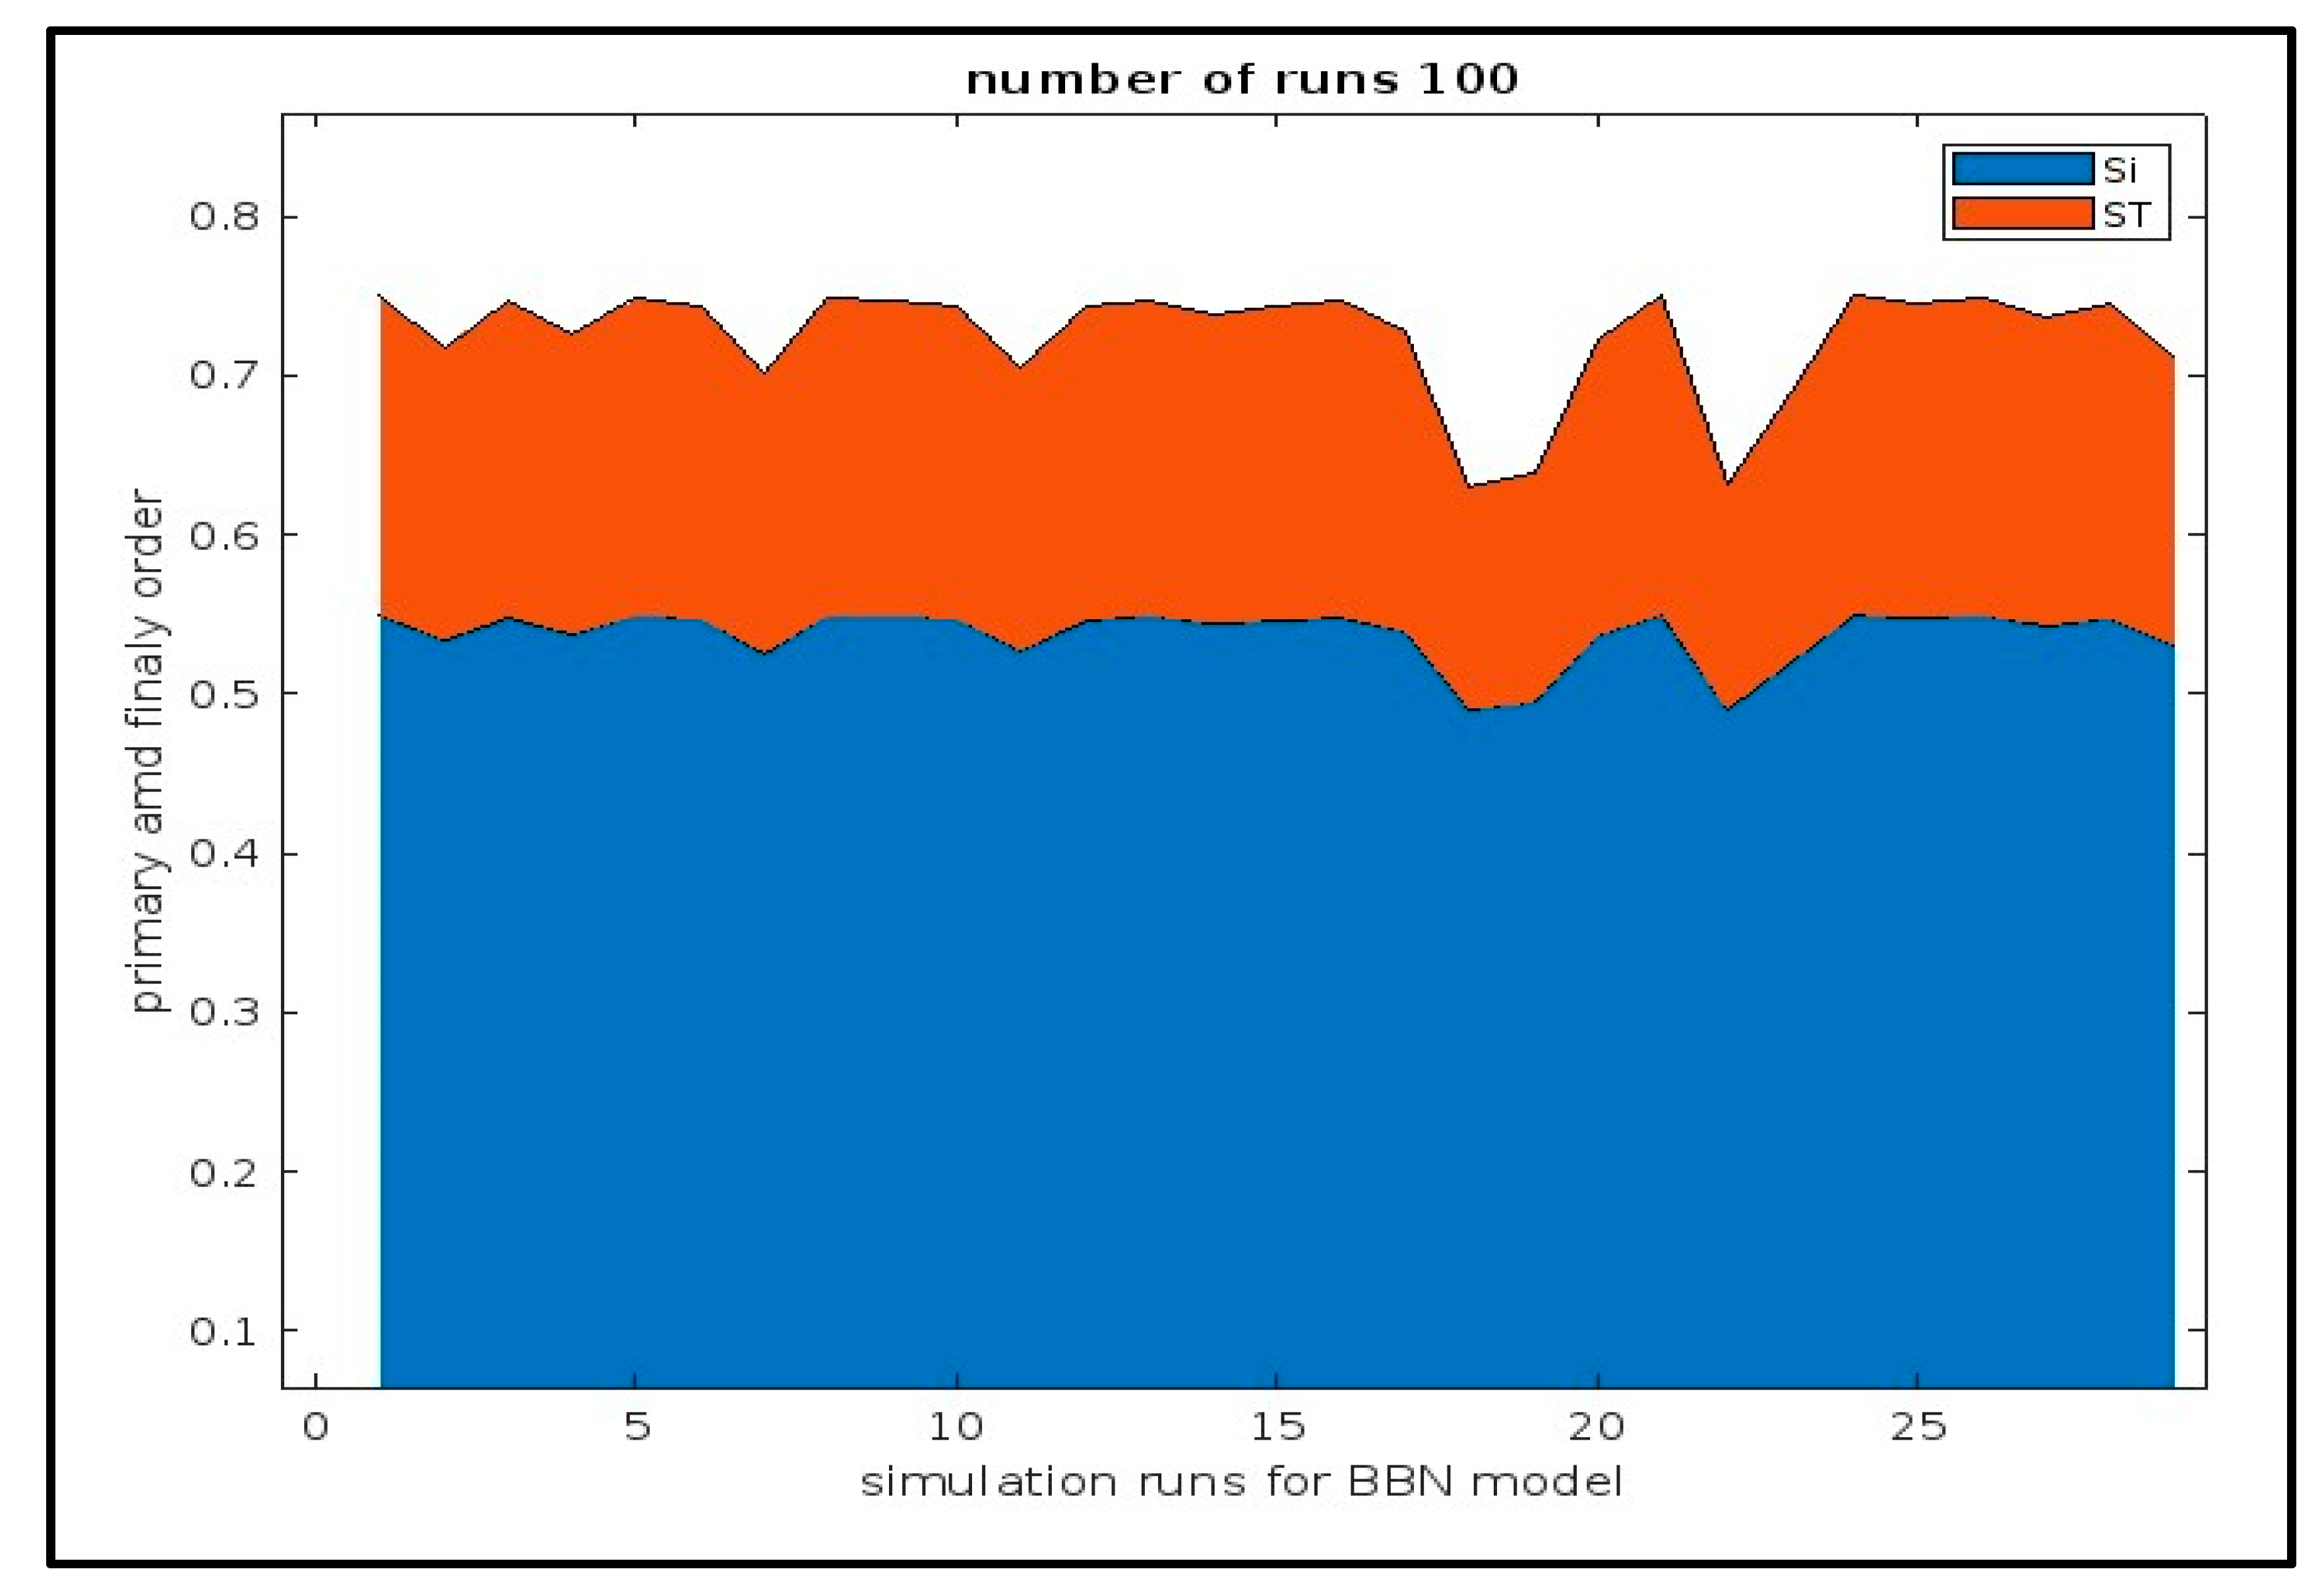
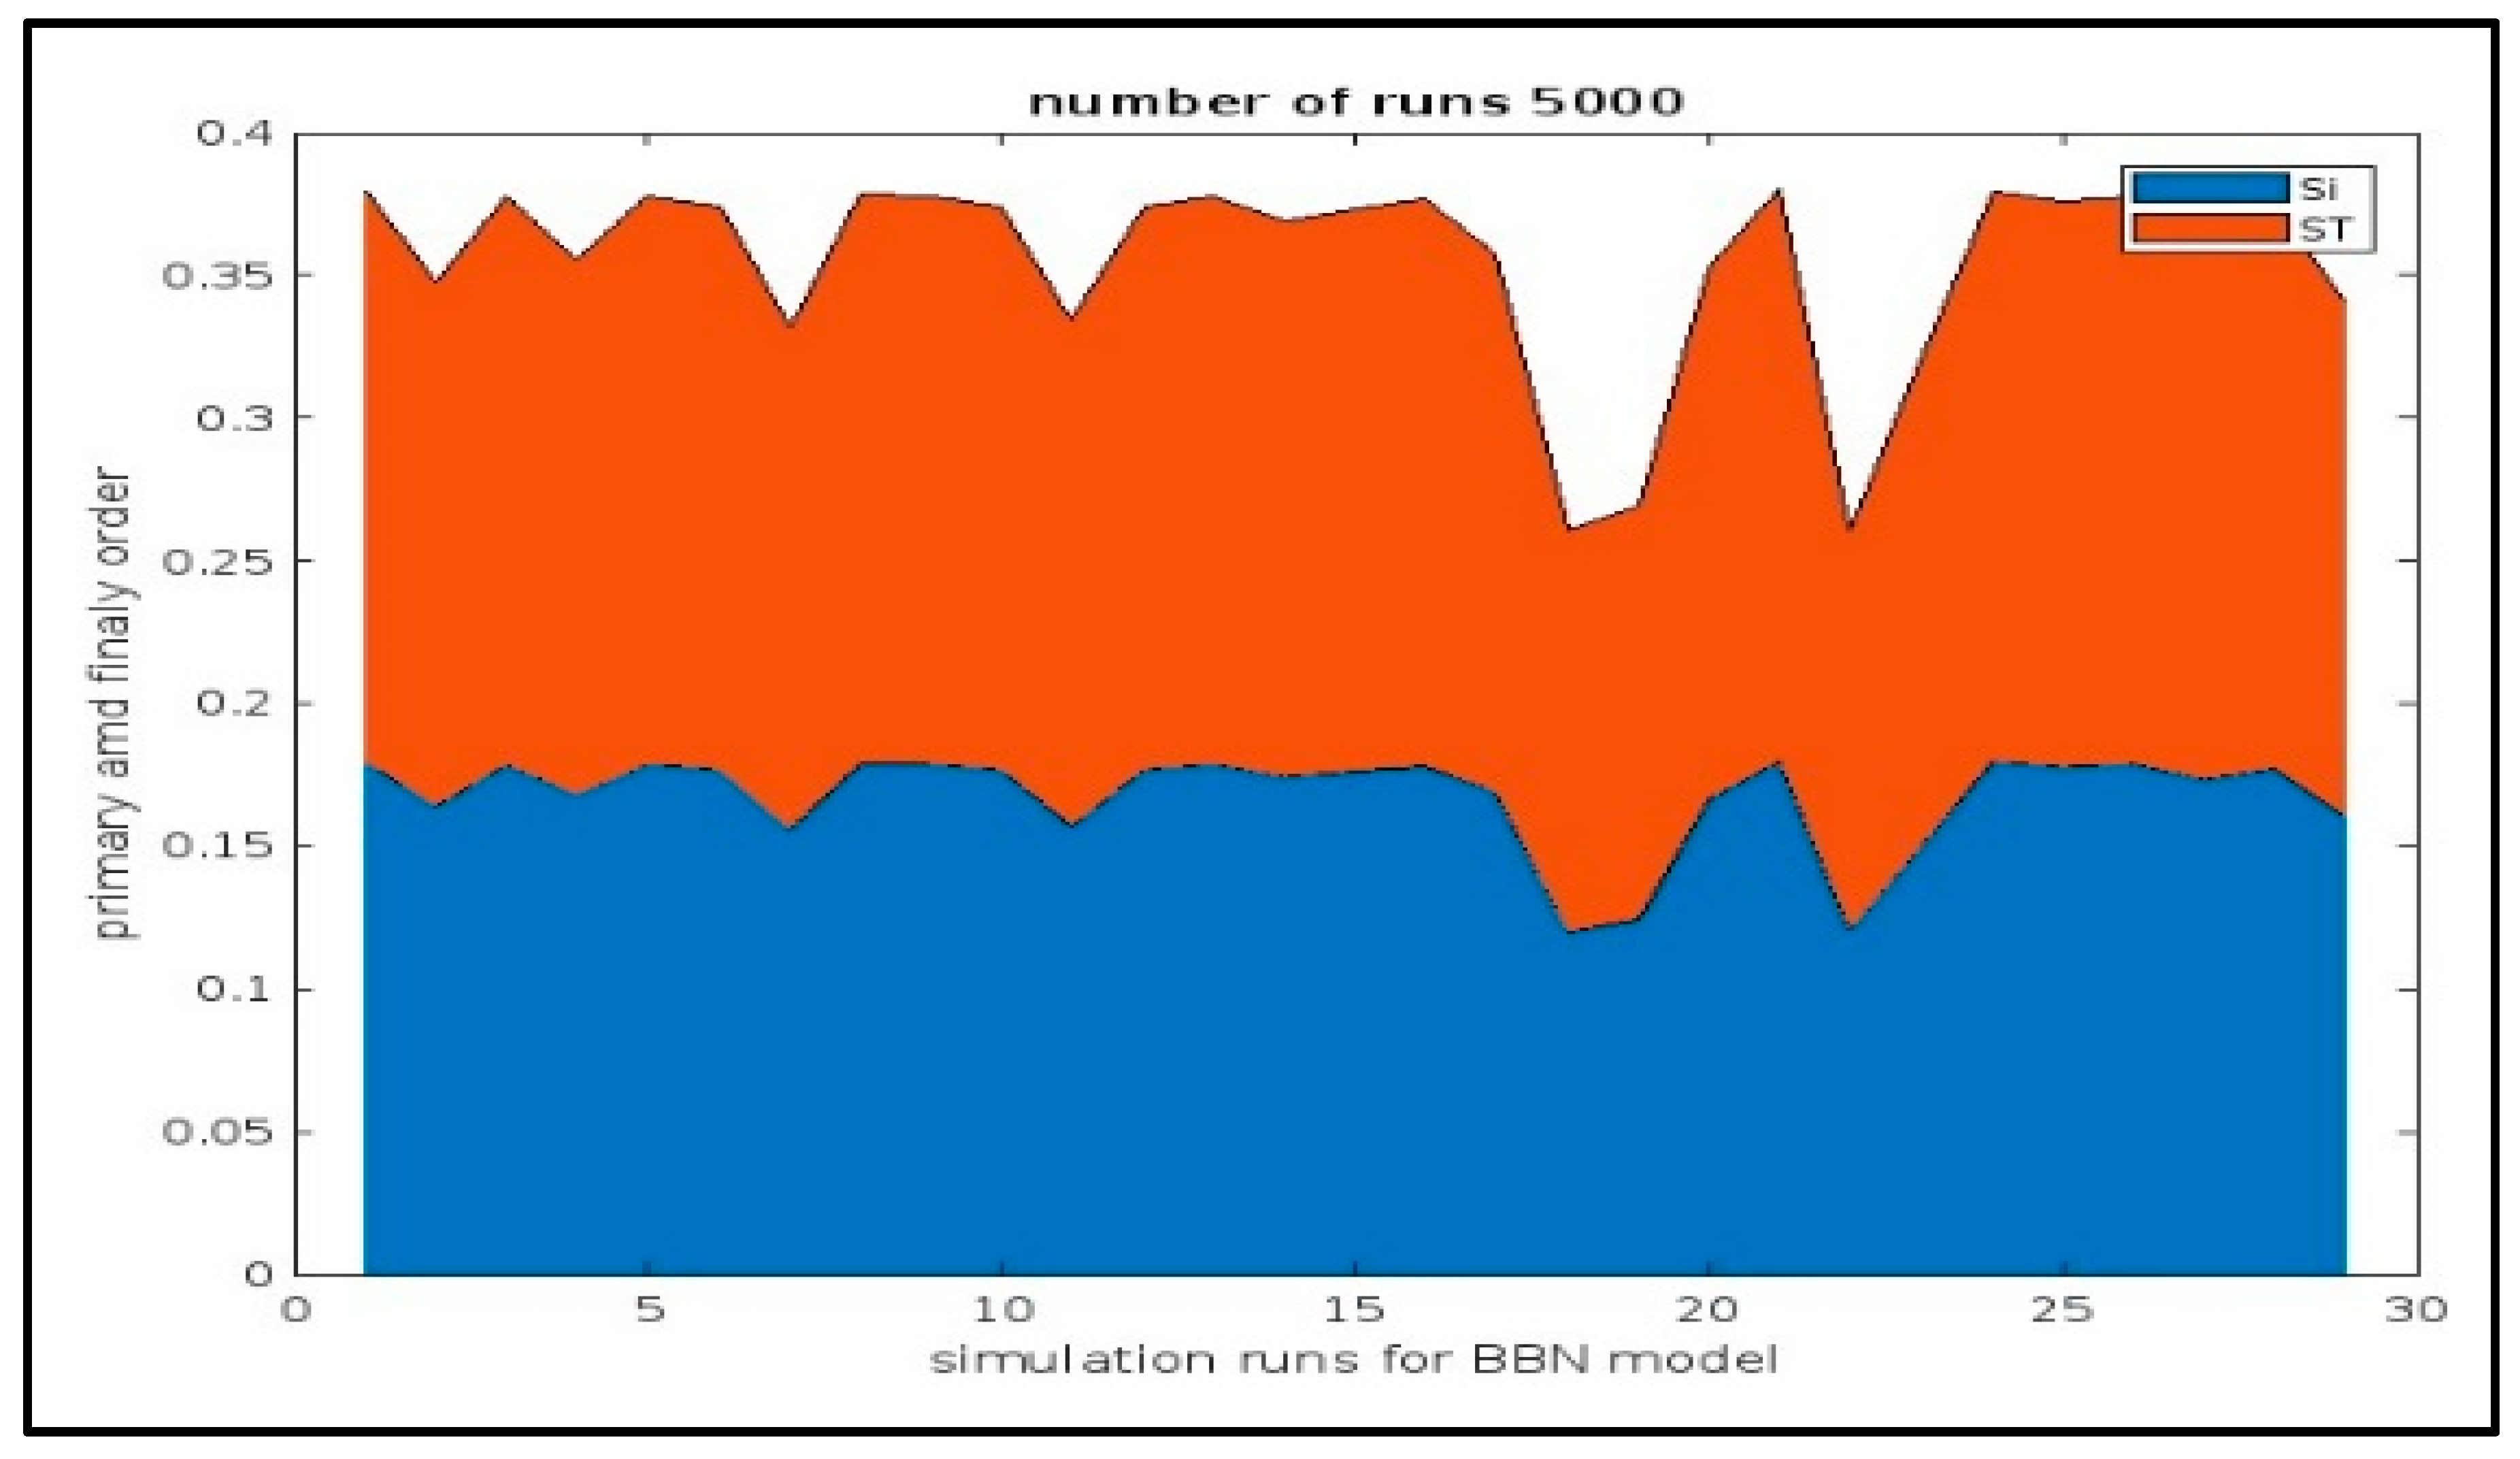
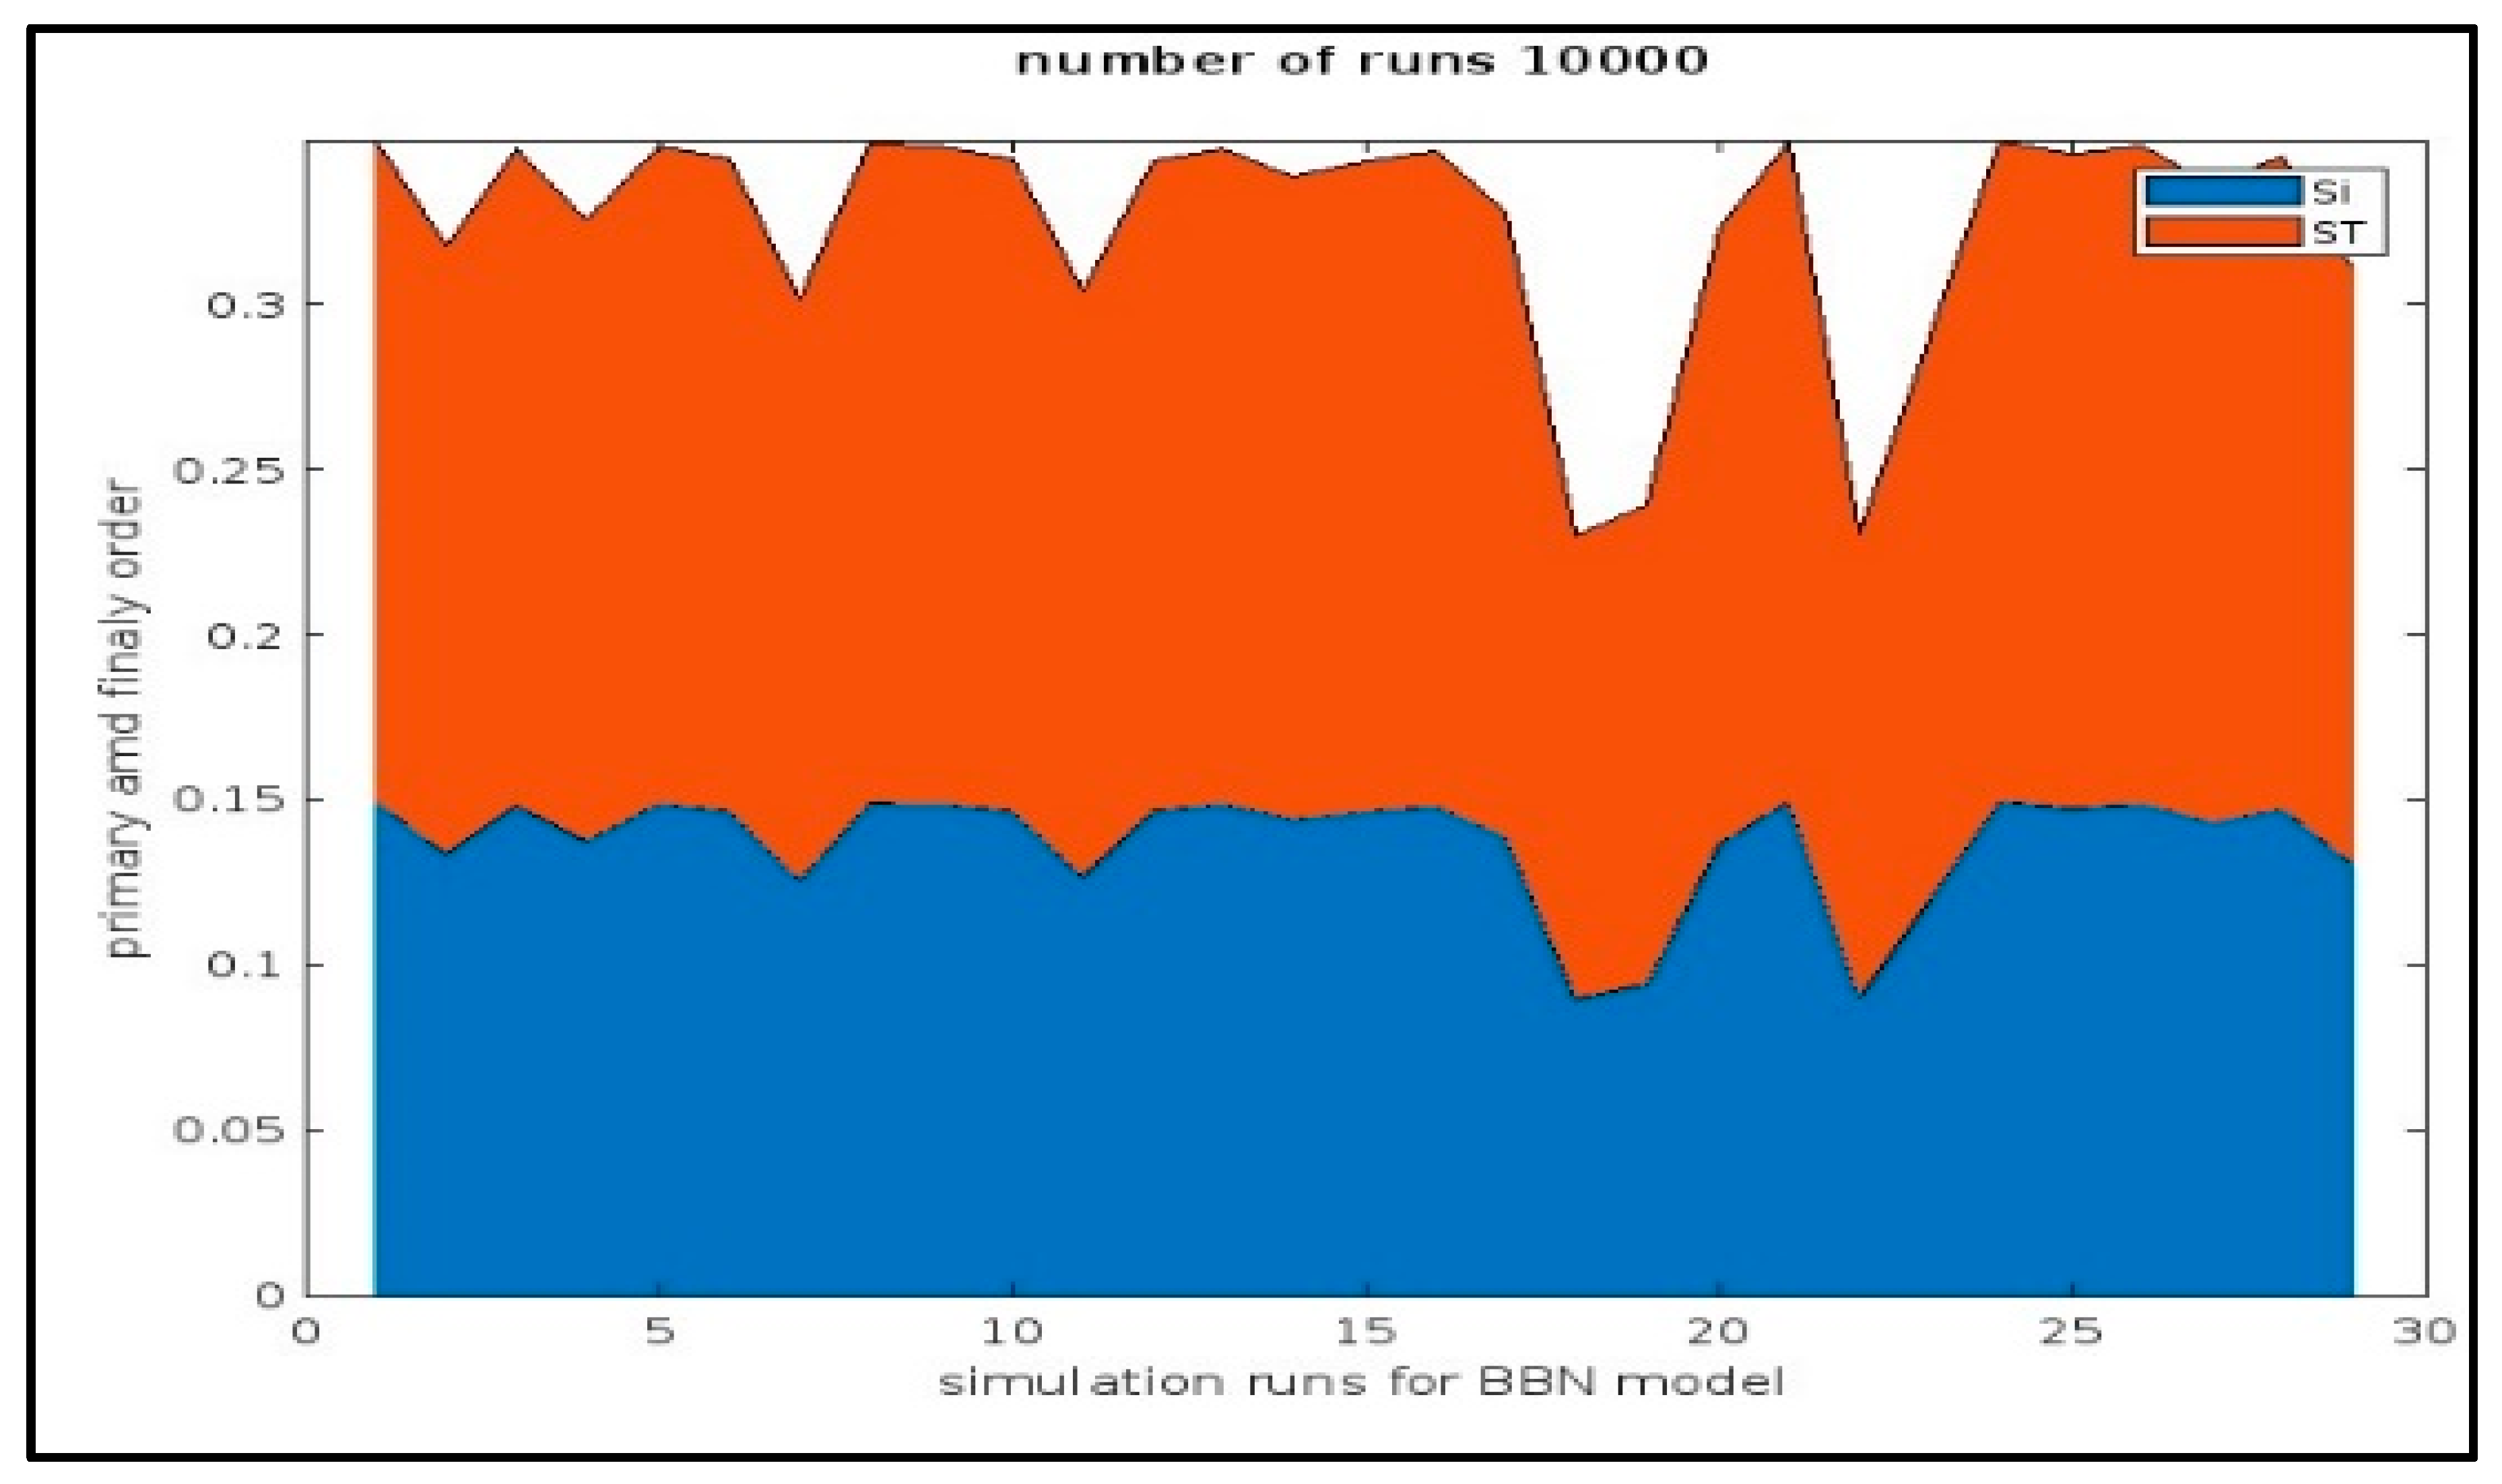
This study contributes to a realistic model, leveraging Bayesian belief network (BBN) and intelligent artificial technology as shown in Figure 14 and Figure 15. The figures illustrate the calculation of sensitivity indices using MATLAB software Version information for MathWorks R2022b with a number of runs between 5000 and 10,000, ensuring the accuracy and robustness of the model. This is crucial for preventing failures in real-time hydraulic fracturing processes in heterogeneous reservoirs with poor permeability. Through sensitivity analysis repetitions and Sobol method utilization, in coordination with expert insights, the approach ensures effective results, aiding in identifying critical failure scenarios and developing control models for operators and engineers to avert failures and achieve desired outcomes [8,30,42].
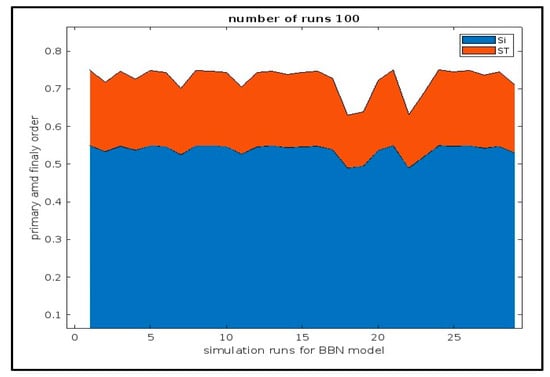
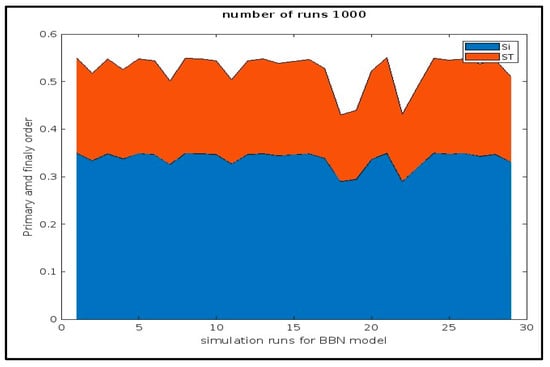
Figure 14.
Simulation of calculating sensitivity indices using MATLAB software with a number of runs between 100 and 1000.


Figure 15.
Simulation of calculating sensitivity indices using MATLAB software with a number of runs between 5000 and 10,000.
4.3. The Cost–Benefit Analysis
To assess the economic feasibility of the proposed risk management approach using the BBN model, a cost–benefit analysis was conducted [7,10,31,33]. This study has presented a comprehensive analysis of the hydraulic fracturing process in hydrocarbon reservoirs, specifically focusing on identifying potential failure scenarios and the factors contributing to these failures. This study adopted a Bayesian belief network (BBN) model to effectively predict risks and enable informed decision-making to avoid failures in advance. It also involved experts to help identify the most influential scenarios and calculate the probability of failure using sensitivity analysis techniques. A critical aspect of the present study was the cost–benefit analysis, which allowed the evaluation of the effectiveness of various mitigation plans in reducing the probability of failure and their associated costs. This analysis aimed to provide a comprehensive understanding of the balance between the costs of implementing mitigation measures and the benefits of reduced failure probabilities [7,8]. The cost–benefit analysis, based on the mitigation plans and associated costs of the hydraulic fracturing process, is outlined in Table 5 and can be summarized as follows.
Table 5.
Mitigation plans (based on nodes), associated costs, and reduction of probability of failure in the hydraulic fracturing process.
The total cost of implementing all the proposed mitigation plans is USD 175,000.
Implementing these mitigation plans can significantly reduce the risks associated with hydraulic fracturing operations by leading to more efficient and reliable processes, increased production, and extended lifespan of the wells. The cost–benefit analysis highlights the importance of investing in mitigation measures to minimize the risks of failure in hydraulic fracturing processes, which can ultimately result in significant economic and environmental benefits.
5. Conclusions
The hydraulic fracturing process plays a pivotal role in enhancing production and prolonging well life in shale gas reservoirs. Adopting a dynamic Bayesian belief network (BBN) model becomes imperative to comprehend the multifaceted factors influencing well cracking processes and reservoir dynamics. This model facilitates risk prediction and informed decision-making, steering clear of potential failures. Field studies and expert insights contribute to scenario identification, and a resulting event tree model transforms into a BBN model, depicting causal relationships between factors.
Conducting sensitivity analysis techniques on this dynamic BBN model achieves an impressive 85% accuracy in predicting failure scenarios. Beyond cost savings, the model’s risk management capabilities potentially extend well life by up to 20%, translating into substantial yearly revenue. The BBN model emerges as a financial boon while significantly enhancing operational sustainability and longevity. Its precision in predictions and risk mitigation strategies serves as a linchpin for the success and economic viability of hydraulic fracturing operations.
To enhance the BBN model’s effectiveness in mitigating hydraulic fracturing failures, crucial strategic measures are imperative. Collaboration with industry stakeholders is essential for comprehensive data collection, reinforcing the model’s accuracy with precise datasets. Advanced machine learning and additional data refinement can ensure high accuracy, even in scenarios with limited information like S1 and S4, preventing the risk prevalence probability rate from exceeding 0.01 after model adoption. This strategic enhancement has the potential to elevate prediction accuracy beyond 96%, transforming decision-making. Regular assessment of mitigation plans prioritizes cost-effectiveness, minimizing operational costs while maintaining safety and fostering environmental and financial sustainability in the shale gas sector. This comprehensive approach underscores the pivotal role of the BBN model in revolutionizing hydraulic fracturing operations, providing a pathway to economic success, safety, and environmental responsibility.
Author Contributions
M.A.B.: conceptualization, formal analysis, investigation, methodology, resources, software, project administration, validation, visualization, writing, original draft, and writing, reviewing, and editing. H.Z.: supervision, funding acquisition, project administration, and resources. C.Z.: supervision and investigation. M.S.: writing, reviewing, and editing and visualization. All authors have read and agreed to the published version of the manuscript.
Funding
This research received no external funding.
Data Availability Statement
Data is contained within the article.
Acknowledgments
The authors wish to convey their heartfelt thanks to Wuhan University of Technology for granting the valuable opportunity to undertake and present this research study. Furthermore, the authors express gratitude to their fellow researchers who contributed to the preparation of this manuscript. Special appreciation is extended to Sonatrach Company’s IAP (Algerian Petroleum Institute), Sonatrach CRD (Center for Research and Development), and Sonatrach DP (production division) for furnishing the essential data needed to finalize this research. The generous support and collaborative efforts of these entities have played a crucial role in the accomplishment of this investigation.
Conflicts of Interest
The authors declare no conflict of interest.
Glossary
| Acronym | Term |
| BBN | Bayesian belief networks |
| CN | Consequence nodes |
| CPT | Conditional Probability Tables |
| E | The conditional expected disutility function for scenario Se |
| EBBN | Establish Bayesian belief networks |
| ET | Event tree |
| FTA | Fault tree analysis |
| FT | Fault tree |
| HAZOP | Hazard and Operability Analysis |
| HBN | Hybrid belief network |
| N, r | Matrices using the Monte Carlo approach |
| P(Se) | Probability of scenario Se |
| RN | Root nodes |
| RS(Se) | Risk Share |
| Si | Indicator of sensitivity |
| Sij | Number of summands |
| S(Ti) | Indicator of sensitivity |
| Se | Scenario exclusion |
| SN | Safety nodes |
| WSA | Weighted Sum Algorithm |
| X | Input parameter |
| X_u(S_I(u)) | The function of combinations of parent states of the value for 1, which belongs to components that fail in the system, and 0, which presents them otherwise |
| Y | Model function |
| RMSE | Root mean square error |
| MAE | Mean absolute error |
| R2 | Coefficient of determination |
References
- Forster, D.; Perks, J. Climate Impact of Potential Shale Gas Production in the EU; CE Delft: Delft, The Netherlands, 2012. [Google Scholar]
- Wang, Q.; Chen, X.; Jha, A.N.; Rogers, H. Natural gas from shale formation–the evolution, evidences and challenges of shale gas revolution in United States. Renew. Sustain. Energy Rev. 2014, 30, 1–28. [Google Scholar] [CrossRef]
- Wang, C.; Wang, F.; Du, H.; Zhang, X. Is China really ready for shale gas revolution—Re-evaluating shale gas challenges. Environ. Sci. Policy 2014, 39, 49–55. [Google Scholar] [CrossRef]
- Zhang, X.; Zhang, L.; Hu, J. Real-time risk assessment of a fracturing manifold system used for shale-gas well hydraulic fracturing activity based on a hybrid Bayesian network. J. Nat. Gas Sci. Eng. 2019, 62, 79–91. [Google Scholar] [CrossRef]
- Wang, J.; Zhou, F.; Xue, Y.; Yao, E.; Zhang, L.; Fan, F.; Wang, R. The adsorption properties of a novel ether nanofluid for gas wetting of tight sandstone reservoir. Pet. Sci. Technol. 2019, 37, 1436–1454. [Google Scholar] [CrossRef]
- Brahim, I.B.; Addouche, S.A.; El Mhamedi, A.; Boujelbene, Y. Cluster-based WSA method to elicit expert knowledge for Bayesian reasoning—Case of parcel delivery with drone. Expert Syst. Appl. 2022, 191, 116160. [Google Scholar] [CrossRef]
- The Society of Petroleum Engineers (SPE) a 501 Petrofac Scores EPC Contract in Algeria Oil and Gas Facilities, March 13, 2019. Available online: https://jpt.spe.org/petrofac-scores-epc-contract-algeria (accessed on 10 October 2023).
- Oilman Magazine, “10 Best Performing Tips for Successful Hydraulic Fracturing”, Oilman Magazine, 27 December 2018. [Online]. Available online: https://oilmanmagazine.com/10-best-performing-tips-for-successful-hydraulic-fracturing/ (accessed on 10 October 2023).
- Gao, C.H. Scientific research and field applications of polymer flooding in heavy oil recovery. J. Pet. Explor. Prod. Technol. 2011, 1, 65–70. [Google Scholar] [CrossRef]
- Belgacem, T. Les ressources de l’Algérie. Outre-Terre, 2016; 47, 152–164. [Google Scholar]
- Zio, E.; Mustafayeva, M.; Montanaro, A. A Bayesian belief network model for the risk assessment and management of premature screen-out during hydraulic fracturing. Reliab. Eng. Syst. Saf. 2022, 218, 1080914. [Google Scholar] [CrossRef]
- Martin, C.; Gonzalez-Prida, V.; Pérès, F. Reliability assessment of a multi-redundant repairable mechatronic system. In Numerical Methods for Reliability and Safety Assessment: Multiscale and Multiphysics Systems; Springer: Cham, Switzerland, 2015; pp. 407–423. [Google Scholar]
- Wan, F.L.; Li, Z.; Zeng, P.Y. Unconventional Casing Program for Complex-Deep Well D1. In Proceedings of the International Field Exploration and Development Conference 2019; Springer: Singapore, 2020; pp. 2463–2468. [Google Scholar]
- Oduoza, C.F. Framework for sustainable risk management in the manufacturing sector. Procedia Manuf. 2020, 51, 1290–1297. [Google Scholar] [CrossRef]
- Sui, Y.; Cao, G.; Guo, T.; Zhang, Z.; Bai, Y.; Wu, J.; Yao, L. Evaluation of deep penetration of high-temperature sustained-release acid based on the reaction kinetics and conductivity of acid-etched fractures. Case Stud. Therm. Eng. 2022, 38, 102336. [Google Scholar] [CrossRef]
- Guo, T.; Chen, M. Special Issue “Petroleum Engineering: Reservoir Fracturing Technology and Numerical Simulation”. Processes 2023, 11, 233. [Google Scholar] [CrossRef]
- Du, Z.; Liang, X.; Chen, S.; Li, P.; Zhu, X.; Chen, K.; Jin, X. Domain adaptation deep learning and its TS diagnosis networks for the cross-control and cross-condition scenarios in data center HVAC systems. Energy 2023, 280, 128084. [Google Scholar] [CrossRef]
- Vairo, T.; Pettinato, M.; Reverberi, A.P.; Milazzo, M.F.; Fabiano, B. An approach towards the implementation of a reliable resilience model based on machine learning. Process Saf. Environ. Prot. 2023, 172, 632–641. [Google Scholar] [CrossRef]
- Fazelipour, W. Innovative reservoir modeling and simulation of unconventional shale gas reservoirs powered by microseismic Data. In SPE Middle East Unconventional Resources Conference and Exhibition; SPE: Kuala Lumpur, Malaysia, 2011; p. SPE-141877. [Google Scholar]
- Alqahtani, N.J.; Chung, T.; Wang, Y.D.; Armstrong, R.T.; Swietojanski, P.; Mostaghimi, P. Flow-based characterization of digital rock images using deep learning. SPE J. 2021, 26, 1800–1811. [Google Scholar] [CrossRef]
- Li, T.; Zhou, Y.; Zhao, Y.; Zhang, C.; Zhang, X. A hierarchical object oriented Bayesian network-based fault diagnosis method for building energy systems. Appl. Energy 2022, 306, 118088. [Google Scholar] [CrossRef]
- Kang, N.; Kim, J.J.; On, B.W.; Lee, I. A node resistance-based probability model for resolving duplicate named entities. Scientometrics 2020, 124, 1721–1743. [Google Scholar] [CrossRef]
- Badjadi, M.A.; Zhu, H.; Zhang, C.; Naseem, M.H. Enhancing Water Management in Shale Gas Extraction through Rectangular Pulse Hydraulic Fracturing. Sustainability 2023, 15, 10795. [Google Scholar] [CrossRef]
- Laitila, P.; Virtanen, K. Portraying probabilistic relationships of continuous nodes in Bayesian networks with ranked nodes method. Decis. Support Syst. 2022, 154, 113709. [Google Scholar] [CrossRef]
- Ren, H.J.; Wang, X.C.; Guo, Q.L.; Guo, X.X.; Zhang, R. Spatial prediction of oil and gas distribution using tree augmented Bayesian network. Comput. Geosci. 2020, 142, 104518. [Google Scholar] [CrossRef]
- Luo, Z.; Zhang, N.; Zhao, L.; Liu, H.; Luo, P.; Liu, J. Innovative encapsulating acid with release dually controlled by the concentration of hydrogen ions and temperature. Energy Fuels 2019, 33, 4976–4985. [Google Scholar] [CrossRef]
- Liu, Z.; Ma, Q.; Cai, B.; Liu, Y.; Zheng, C. Risk assessment on deepwater drilling well control based on dynamic Bayesian network. Process Saf. Environ. Prot. 2021, 149, 643–654. [Google Scholar] [CrossRef]
- Johnstone, R.L.; Hansen, A.M. Introduction to the Arctic Oil and Gas Research Centre. Arct. Rev. Law Politics 2016, 7, 107–108. [Google Scholar] [CrossRef]
- Quaglietta, E.; Punzo, V. Supporting the design of railway systems by means of a Sobol variance-based sensitivity analysis. Transp. Res. Part C Emerg. Technol. 2013, 34, 38–54. [Google Scholar] [CrossRef]
- Glen, G.; Isaacs, K. Estimating Sobol sensitivity indices using correlations. Environ. Model. Softw. 2012, 37, 157–166. [Google Scholar] [CrossRef]
- Shouche, S.; Wysk, R.A.; King, R.E.; Harrysson, O.L. Supply chain operations reference model for US based powder bed metal additive manufacturing processes. In Proceedings of the 2016 Winter Simulation Conference (WSC), Washington, DC, USA, 11–14 December 2016; IEEE: Piscataway, NJ, USA, 2016; pp. 1158–1169. [Google Scholar]
- Sibiya, Z. Developing the Shale Gas Industry in South Africa: An Analysis of the Environmental Legal Framework. Doctoral Dissertation, University of Pretoria, Pretoria, South Africa, 2014. [Google Scholar]
- Sattari, F.; Macciotta, R.; Kurian, D.; Lefsrud, L. Application of Bayesian network and artificial intelligence to reduce accident/incident rates in oil & gas companies. Saf. Sci. 2021, 133, 104981. [Google Scholar]
- Zhou, Y.; Lu, Z.; Cheng, K.; Yun, W. A Bayesian Monte Carlo-based method for efficient computation of global sensitivity indices. Mech. Syst. Signal Process. 2019, 117, 498–516. [Google Scholar] [CrossRef]
- Malozyomov, B.V.; Martyushev, N.V.; Kukartsev, V.V.; Tynchenko, V.S.; Bukhtoyarov, V.V.; Wu, X.; Tyncheko, Y.A.; Kukartsev, V.A. Overview of Methods for Enhanced Oil Recovery from Conventional and Unconventional Reservoirs. Energies 2023, 16, 4907. [Google Scholar] [CrossRef]
- Wang, B.; Fan, S.D.; Jiang, P.; Zhu, H.H.; Xiong, T.; Wei, W.; Fang, Z.L. A novel method with stacking learning of data-driven soft sensors for mud concentration in a cutter suction dredger. Sensors 2020, 20, 6075. [Google Scholar] [CrossRef] [PubMed]
- Zhao, Y.; Wang, L.; Ma, K.; Zhang, F. Numerical Simulation of Hydraulic Fracturing and Penetration Law in Continental Shale Reservoirs. Processes 2022, 10, 2364. [Google Scholar] [CrossRef]
- Zhao, S.; Soares, C.G.; Zhu, H. A Bayesian network modelling and risk analysis on LNG carrier anchoring system. In Proceedings of the 2015 International Conference on Transportation Information and Safety (ICTIS), Wuhan, China, 25–28 June 2015; IEEE: Piscataway, NJ, USA, 2015; pp. 432–436. [Google Scholar]
- Sakib, N.; Hossain, N.U.I. Disasters cases in oil industry and probability assessment by Bayesian network model. In Crises in Oil, Gas and Petrochemical Industries; Elsevier: Amsterdam, The Netherlands, 2023; pp. 325–348. [Google Scholar]
- Guo, Q.; Ren, H.; Yu, J.; Wang, J.; Liu, J.; Chen, N. A method of predicting oil and gas resource spatial distribution based on Bayesian network and its application. J. Pet. Sci. Eng. 2022, 208, 109267. [Google Scholar] [CrossRef]
- Iaiani, M.; Tugnoli, A.; Cozzani, V.; Reniers, G.; Yang, M. A Bayesian-network approach for assessing the probability of success of physical security attacks to offshore Oil&Gas facilities. Ocean Eng. 2023, 273, 114010. [Google Scholar]
- Dimaio, F.; Scapinello, O.; Zio, E.; Ciarapica, C.; Cincotta, S.; Crivellari, A.; Decarli, L.; Larosa, L. Accounting for safety barriers degradation in the risk assessment of oil and gas systems by multistate Bayesian networks. Reliab. Eng. Syst. Saf. 2021, 216, 107943. [Google Scholar] [CrossRef]


Disclaimer/Publisher’s Note: The statements, opinions and data contained in all publications are solely those of the individual author(s) and contributor(s) and not of MDPI and/or the editor(s). MDPI and/or the editor(s) disclaim responsibility for any injury to people or property resulting from any ideas, methods, instructions or products referred to in the content. |
© 2023 by the authors. Licensee MDPI, Basel, Switzerland. This article is an open access article distributed under the terms and conditions of the Creative Commons Attribution (CC BY) license (https://creativecommons.org/licenses/by/4.0/).