Article

Sub-Shrub Components Change the Soil Water Storage Response to Daily Precipitation and Air Temperature in the Loess Plateau

1
Tianjin Key Laboratory of Water Resources and Environment, Tianjin Normal University, Tianjin 300387, China
2
Fujian Academy of Forestry Sciences, Fuzhou 350012, China
3
State Key Laboratory of Urban and Regional Ecology, Research Center for Eco-Environmental Sciences, Chinese Academy of Sciences, Beijing 100085, China
4
National Observation and Research Station of Earth Critical Zone on the Loess Plateau in Shaanxi, Xi’an 710061, China
5
Key Research Institute of Yellow Civilization and Sustainable Development & Collaborative Innovation Center of Henan Province, Henan University, Kaifeng 475001, China
*
Authors to whom correspondence should be addressed.
Water 2023, 15(23), 4157; https://doi.org/10.3390/w15234157
Submission received: 20 October 2023 / Revised: 22 November 2023 / Accepted: 29 November 2023 / Published: 30 November 2023

Abstract

:
Soil water shortage has become a severe issue in ecological restoration and sustainable development in the Loess Plateau, facing the challenges of climate change and vegetation restoration. This study monitored the soil water content in surface soil (0–40 cm) with different sub-shrub component treatments, including the natural condition (NC), the canopy plus the roots (CR) and only the roots (OR), to analyze the change in soil water storage (∆W) and its response to precipitation (P) and air temperature (Ta) on a daily scale. P was the main factor controlling the daily ∆W, contributing 49–52% to the variation in the daily ∆W, and Ta only explained 6–21% of the variation. Minimum P amounts of 0.74–1.12 mm and maximum Ta of 29.09–32.00 °C were the thresholds required to increase soil water storage (W). Sub-shrub components showed significant influences on soil water conservation. We found that the ∆W hierarchy for each sub-shrub treatment was NC (1.73 mm) > CR (0.71 mm) > OR (0.56 mm) on rainy days and NC (−0.53 mm) < CR (−0.36 mm) < OR (−0.06 mm) on no-rain days. Additionally, the hierarchy of the rainwater retention rate was NC (26.43%) > OR (13.71%) > CR (4.58%). Thus, a canopy could increase infiltration and hugely consume soil water at the same time, while litter could weaken or offset the canopy’s effects and the roots promote infiltration with little evaporation loss.

1. Introduction

Soil water shortage has become a key constraint for ecological restoration and sustainable development in the Loess Plateau, China [1,2]. Climate change and vegetation restoration aggravated the soil water shortage phenomenon, resulting in the severe challenge of the occurrence and increase in the soil dry layer [3]. In the context of global warming, climate change in the Loess Plateau shows frequent extreme rainfall events, more concentrated rainfall and increased drought frequency, which can disturb traditional hydrological processes [4]. Meanwhile, the large-scale implementation of the Grain-for-Green Project in 1999 significantly improved the coverage rate of vegetation, but it also further increased soil water consumption [5,6]. Thus, soil water storage (W) and its change (∆W) were paid an increasing amount of attention to analyze their influencing factors and evolution mechanisms.
Various empirical soil moisture models have been developed to evaluate soil moisture under different conditions. The Kirchhoff theory, including the Kirchhoff approximation, analytical Kirchhoff solution and numerical Kirchhoff approach, was widely used for soil moisture retrievals considering surface roughness [7]. A small perturbation model was proposed to retrieve the root-zone soil moisture based on a scattering electromagnetic wave induced by the dielectric structures of a multi-layer rough surface [8]; the small slope approximation method was also applied [9]. The Dubois model is a semi-empirical model used to retrieve surface soil moisture with vegetation cover [10], and Dave et al. [11] modified the Dubois model to estimate soil moisture for a winter wheat crop, finding a better estimation in the early and mature stages of crop growth. Gharechelou et al. [12] compared the Dubois model and Oh model with observational soil moisture data and found that the Oh model showed more accurate results in a dry environment, which is more suitable for a wider range of surface roughness and shorter wavelengths, while the Dubois model overestimated the values. However, these models were traditionally applied in remote sensing applications for soil moisture retrieval, lacking observational data analyses.
Precipitation (P) and air temperature (Ta) are the main factors reflecting climate change which significantly control soil hydrological processes such as runoff, infiltration, evaporation and transpiration [13,14,15]. Li et al. [14] found that interception and transpiration under grass and forest land will significantly decrease when the climate becomes warmer and more arid in the future, and a grassland would conserve more soil water in the Loess Plateau. However, the response of soil hydrological processes to climate change and human activities is still an unsolved problem and one of the future research priorities in the Loess Plateau [16]. The relationship between P and soil water has always been a critical issue in soil hydrology. For example, Ge et al. [17] and Jin et al. [18] studied the soil water response to rainfall under different types of land cover in the Loess Plateau and determined the rainfall amount threshold to trigger surface (0–10 cm) soil water infiltration. Dai and Wang [19] pointed out that evaporation, canopy interception and other losses accounted for about 7 mm of the amount of rainfall, and a larger rainfall was required to cause the depth of infiltration to reach 10 cm. Chen et al. [20] analyzed the response of soil water content and movement at different depths to rainfall intensity and found that a 0–40 cm depth mainly caused a response. Similarly, other studies also supported that the maximum rainfall infiltration was 40 cm for a single event or on the daily scale [18,21,22]. Ta was highly related to evapotranspiration (ET) processes and indirectly controlled soil water consumption [23,24]. The linkage between Ta and soil water is interlocked with hydrological and energy cycles [25], but research conclusions are lacking. Long-term heat accumulation brought hot weather conditions with increased evaporative demand, affecting W [24,25]. However, few have studied the effects of P and Ta on W at the same time, and the influencing mechanism of vegetation components is also unclear.
The canopy, litter and roots comprise the vegetation components which are deeply involved in soil hydrological processes. Rainfall is firstly redistributed via interception, throughfall and stemflow by the canopy [26]. Secondly, the rainfall trapped in the canopy will evaporate or drop onto surface soil; thus, combined with transpiration, the canopy has two different functions in increasing infiltration or depleting soil water [27,28]. The litter shows similar functions to the canopy, such as secondary interception, evaporation, storing runoff and increasing or preventing infiltration [29,30,31,32]. Cui et al. [29] found that the litter hindered the exchange of heat and water, and increasing the litter mass caused a nonlinear increase in W in the Loess Plateau. Roots are widely known to improve soil water infiltration [33,34,35]. Song et al. [36] proved that roots contributed to improving soil water storage capacity, and approximately 67–89% of the root biomass existed in the first 0–20 cm of the surface soil. However, the contributions of the canopy, litter and roots to soil water storage processes (e.g., infiltration, loss and retention), as well as their effects on the response of soil water to P and Ta, are not clear in the Loess Plateau.
In this study, we investigate the dynamics of the soil water content, P and Ta to understand the soil water response to climate change and different sub-shrub components. The aims of this study were to analyze the response of the surface (0–40 cm) ∆W to P and Ta on a daily scale, compare the differences of the ∆W response to different sub-shrub components between rainy days and no-rain days and quantify the influence of different components on soil water storage processes.

2. Materials and Methods

2.1. Study Area

The Yangjuangou catchment (36°42′ N, 109°31′ E) is a typical hilly and gully catchment which is located in the center of the Loess Plateau, China (Figure 1). The elevation ranges from 1050 to 1298 m with a total area of 2.02 km2. The average annual P is 536 mm, ranging from 330 to 959 mm from 1951 to 2016, and the average annual Ta is 9.4 °C. Rainfall is mainly concentrated between June and September, accounting for more than 70% of the total annual P, and more than 80% of the daily rainfall amount is less than 10 mm. Calcaric Cambisol is the main soil type, the maximum depth of which is approximately 200 m [37]. Initially, all the slopes in the area were farmland used for grain cultivation, which led to a significant amount of soil erosion and land degradation. Therefore, the Chinese government implemented the Grain-for-Green project in 1999, transforming all the slope farmland into different types of vegetation cover: grassland, shrubs and woodland. Thus, the vegetation is dominated by artificial restoration and secondary vegetation cover. Plant species include Robinia pseudoacacia, Prunus armeniaca, Artemisia sacrorum, Stipa bungeana and Artemisia scoparia. Artemisia sacrorum is the predominant sub-shrub species and is widely distributed on the slope surface in the Loess Plateau.

2.2. Field Experiments

This study selected the typical sub-shrub species (Artemisia sacrorum) to monitor the soil water response. We conducted three treatments in sub-shrub land (Figure 1): (1) an NC treatment, the natural condition, including the canopy, litter and roots; (2) a CR treatment, the canopy + roots, namely removing the litter; and (3) a OR treatment, only the roots, with the canopy and litter removed at the same time. The canopy can redistribute the rainfall, delaying or reducing runoff generation, and then provide more opportunities for rainwater infiltration; additionally, it consumes more soil water due to transpiration and growth processes. The litter is beneficial as it shelters the soil to reduce soil evaporation and reduces soil water loss from solar radiation; meanwhile, it also improves soil properties to increase infiltration and reduce runoff. The roots provide channels for water infiltration [38,39]. Consequently, different components have different functions in soil water infiltration or loss. In order to avoid the effects of surrounding surface runoff and subsurface flow, microplots were established with a boundary (50 cm depth). The size was 0.8 m × 0.8 m, and each treatment had three repeats with similar slope gradients and slope aspects.
In the soil layers at 5, 10, 20, and 40 cm depths, automatic soil moisture measurement sensors (EC-5, U30 Onset) were installed in three plots for each treatment type. Precipitation (P, mm) and air temperature (Ta, °C) were also measured using automatic measurement equipment. The observation period was from June to September in 2015; because Ta data were lost after 10 September, the total period was 10 June to 10 September. In the rainy season of this year, we observed less than 150 mm in total, so this year is an extremely dry year, which is very special and useful for studying the response of soil hydrological processes to weather condition changes, helping us understand the drought adaptation of hydrological processes.

2.3. Data Analysis

The soil water storage (W, mm) was calculated as [40] follows:
W = SWC i × h i × 10
where W is the surface (0–40 cm) soil water storage (mm), SWCi is the soil water content at the i-th depth (m3/m3) and hi is the ith soil layer thickness (cm), which is calculated using the differences between the depths of the soil moisture measurement sensors (at 5, 10, 20 and 40 cm), here, hi = 5, 5, 10 and 20 cm, respectively.
The change of soil water storage for each day (∆W, mm) was calculated as:
W j = W j W j 1
where Wj is the j-th day’s soil water storage.
The infiltration rate (%) was the ratio of the total infiltration of each day to the total P during the observation period:
I n f i l t r a t i o n r a t e = W j total   P × 100 W j > 0
The loss rate (%) of soil water was the percentage of the cumulative amount of negative ∆W to the total infiltration, indicating the soil water output amount accounting for the input amount on a daily scale.
The rainwater retention rate (%) was the ratio of the cumulative ∆W amount to the total P amount, indicating the total amount of soil water from rainfall events during the observation period.

2.4. Statistical Analysis

Data availability was first tested using a normality test and a homogeneity of variance test, and a one-way ANOVA (p < 0.05) was then conducted to compare the significance of differences between treatments. Post hoc comparisons were used to determine the specific differences between the different treatments based on the Least Significant Difference (LSD) or Tambane’s T2 for different conditions. Linear regression was used to fit the relationship between ∆W with P and Ta under different treatments, which also could provide equations to calculate the thresholds of P and Ta.

3. Results

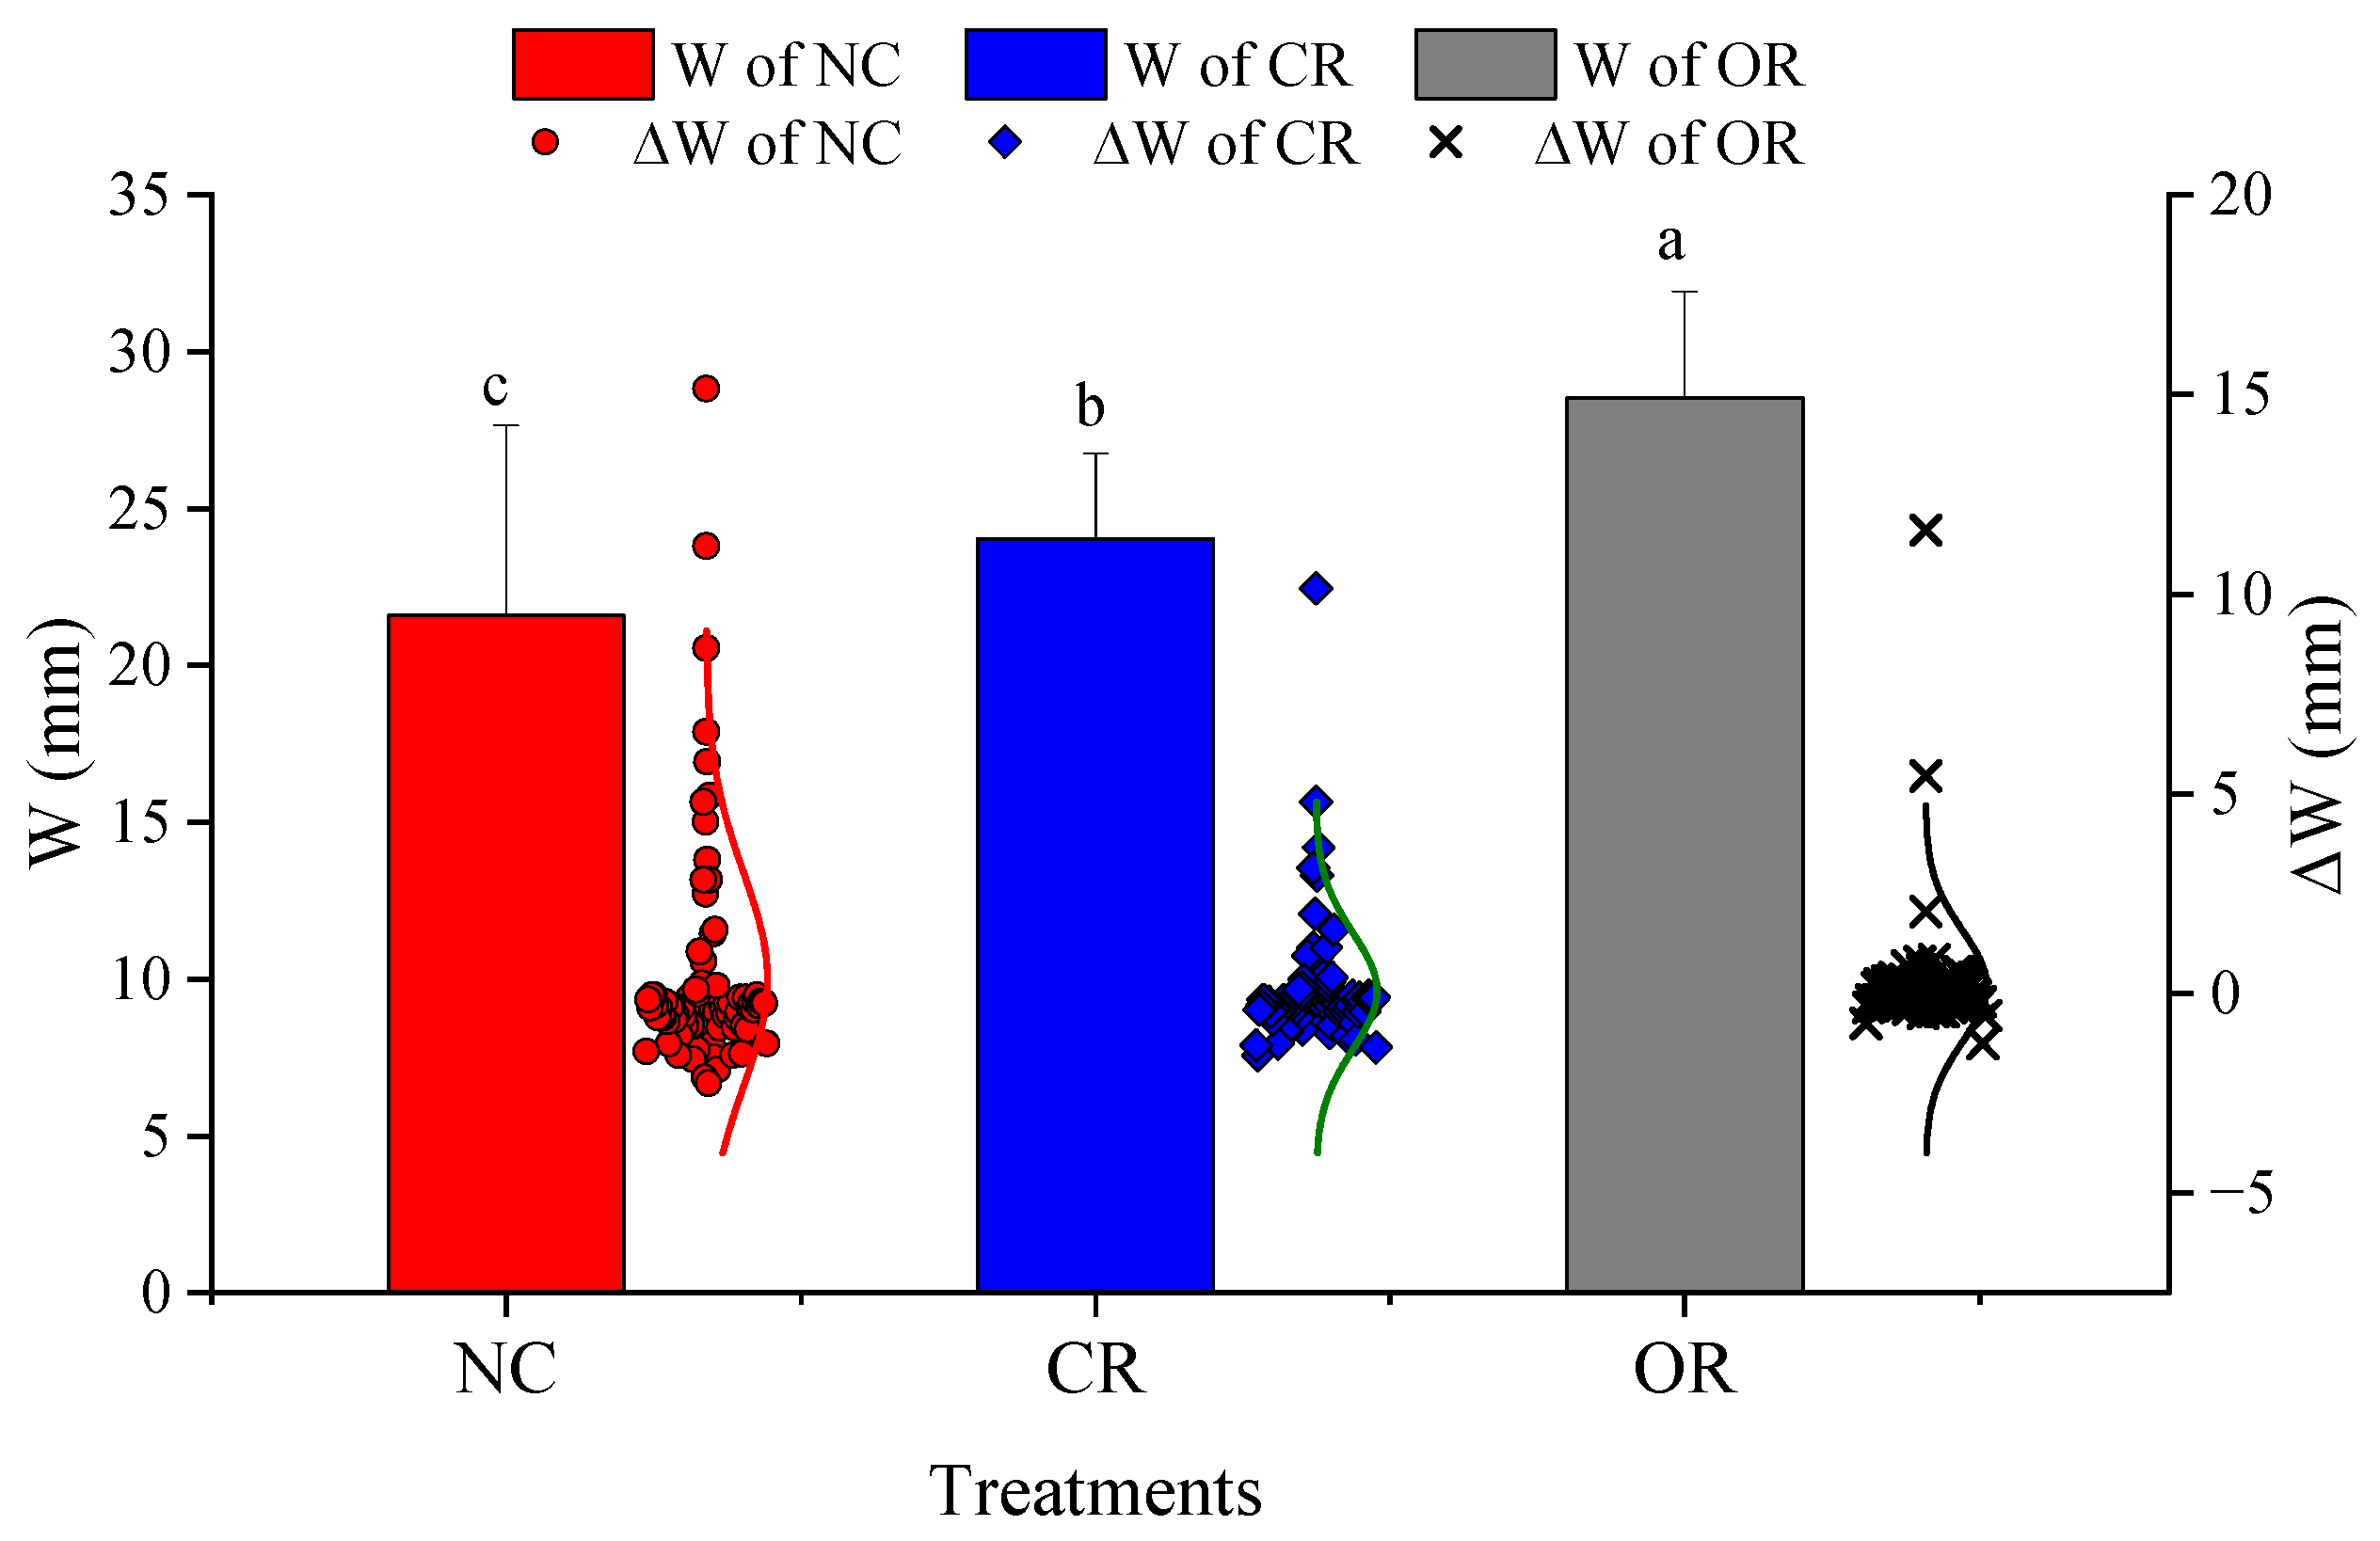
3.1. The Mean Daily W and the Distribution of ∆W for Different Treatments

Figure 2 shows the mean daily W (histogram) and the distribution of ∆W of every day (points and normal curves) under the three treatments during the observation period. The mean daily W had an order of NC < CR < OR with significant differences (p < 0.05), indicating 21.60 mm, 24.03 mm and 28.53 mm for the NC, CR and OR treatments, respectively. In addition, ∆W was displayed using a normal scatter plot, with one data point per day, to reflect its distribution under different treatments. The NC treatment had the largest variation in the range of ∆W, with the highest value of 15.15 mm and the lowest value of −2.25 mm. The CR and OR treatments showed smaller ranges for ∆W and more standard normal curves. The median values of ∆W were −0.30 mm, −0.25 mm and −0.05 mm in the NC, CR and OR treatments, respectively, indicating that sub-shrub canopy increased the variation in soil water on most days.

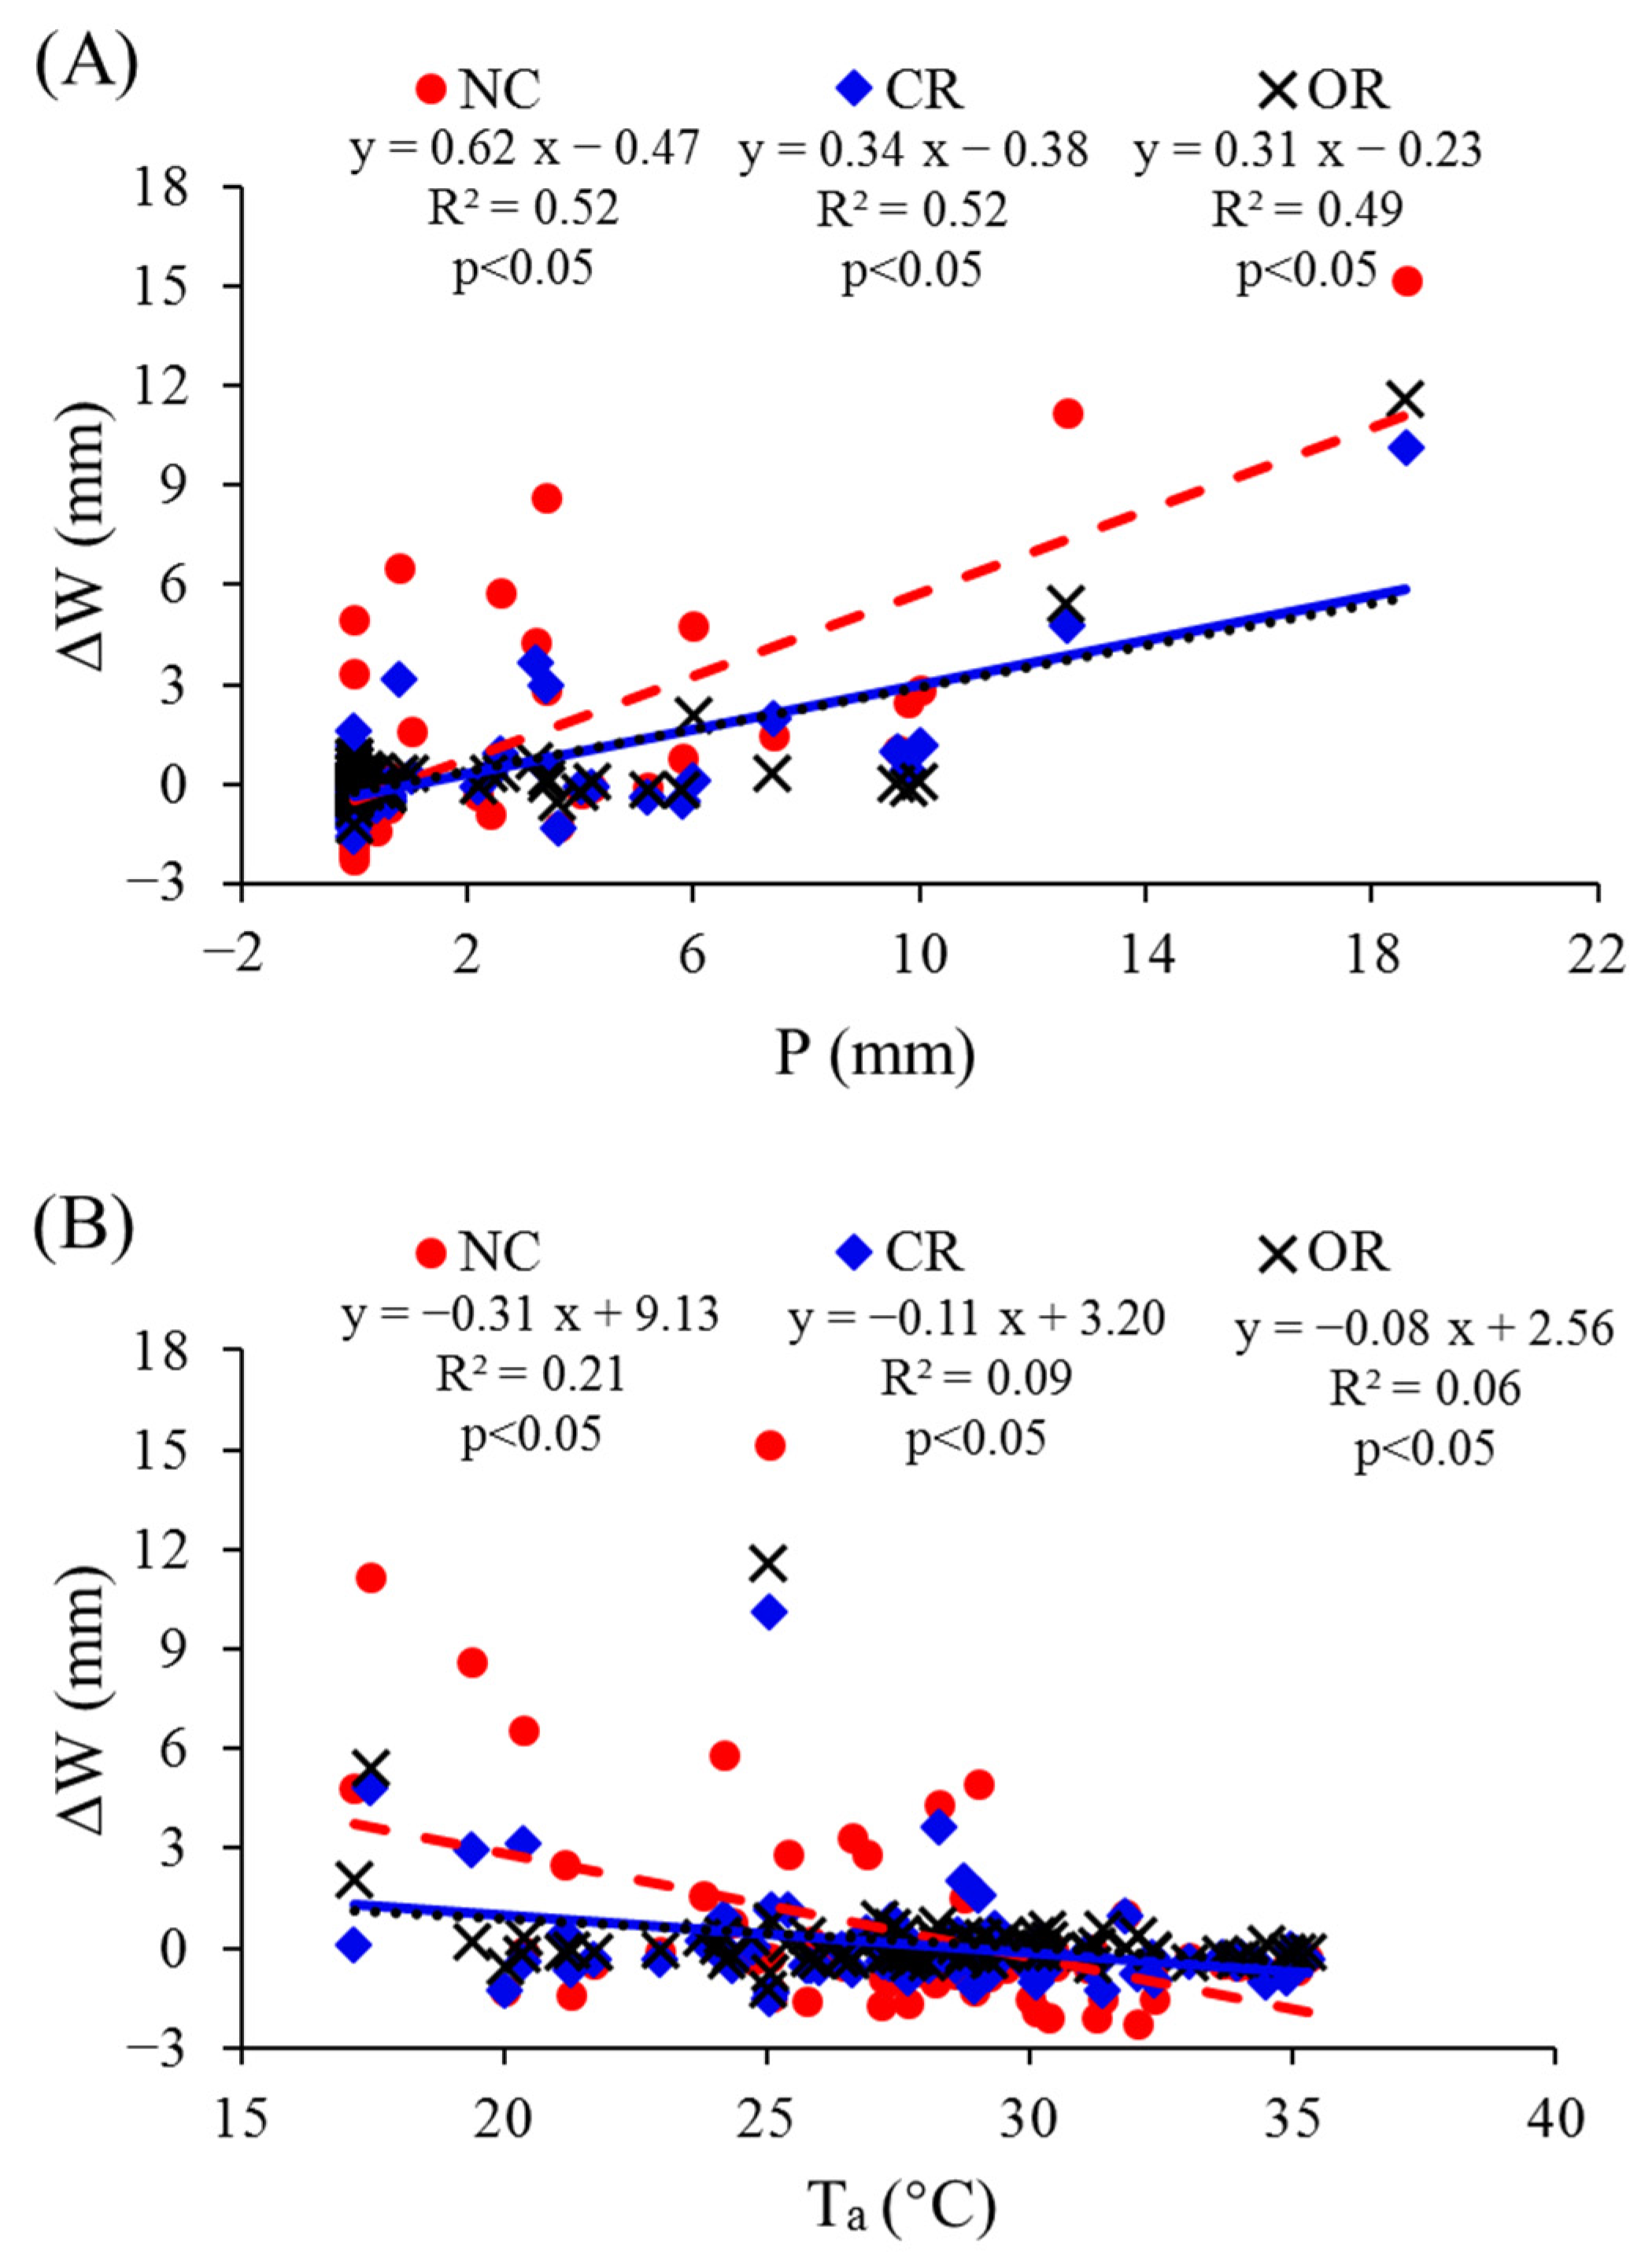
3.2. Responses of ∆W to P and Ta for Each Day

The relationships between ∆W and P and Ta for each day during the observation period are analyzed in Figure 3. Firstly, we found that ∆W was positively related to the daily P and negatively related to the daily Ta, respectively, without considering different treatments. The daily P could explain about 49–52% of the variation in the daily ∆W, while the daily Ta only contributed 6–21% of the explanatory power to the daily ∆W variation. Thus, P played a more important role in ∆W than Ta on the daily scale. However, the change rate of ∆W with daily P and Ta was influenced by different treatments. Based on the slopes of the curves, ∆W increased by 0.62 mm, 0.34 mm and 0.31 mm when the daily P increased by 1.0 mm and decreased by 0.31 mm, 0.11 mm and 0.08 mm when the daily Ta increased by 1.0 °C for the NC, CR and OR treatments, respectively. This indicates that ∆W was more sensitive to daily P and Ta changes in the NC treatment, and the response was less sensitive in the OR treatment.
According to the fitting equations in Figure 3, the thresholds of the lowest P and the highest Ta to the increase in soil water were calculated and are shown in Table 1. The lowest P amount to increase soil water on the daily scale showed a hierarchy of CR (1.12 mm) > NC (0.76 mm) > OR (0.74 mm), indicating that canopy increased the difficulty of rainwater infiltration (comparing the CR to the OR), and litter might weaken this negative effect (comparing the NC to CR); only the roots made rainwater infiltration easier. However, the highest Ta threshold had the opposite order of CR (29.09 °C) < NC (29.45 °C) < OR (32.00 °C), indicating that the canopy caused soil water loss more easily, needing only 29.09 °C (comparing the CR to the OR), and the litter hindered the water loss, raising the required Ta to 29.45 °C (comparing the NC to the CR); only the roots required the highest Ta for water loss.

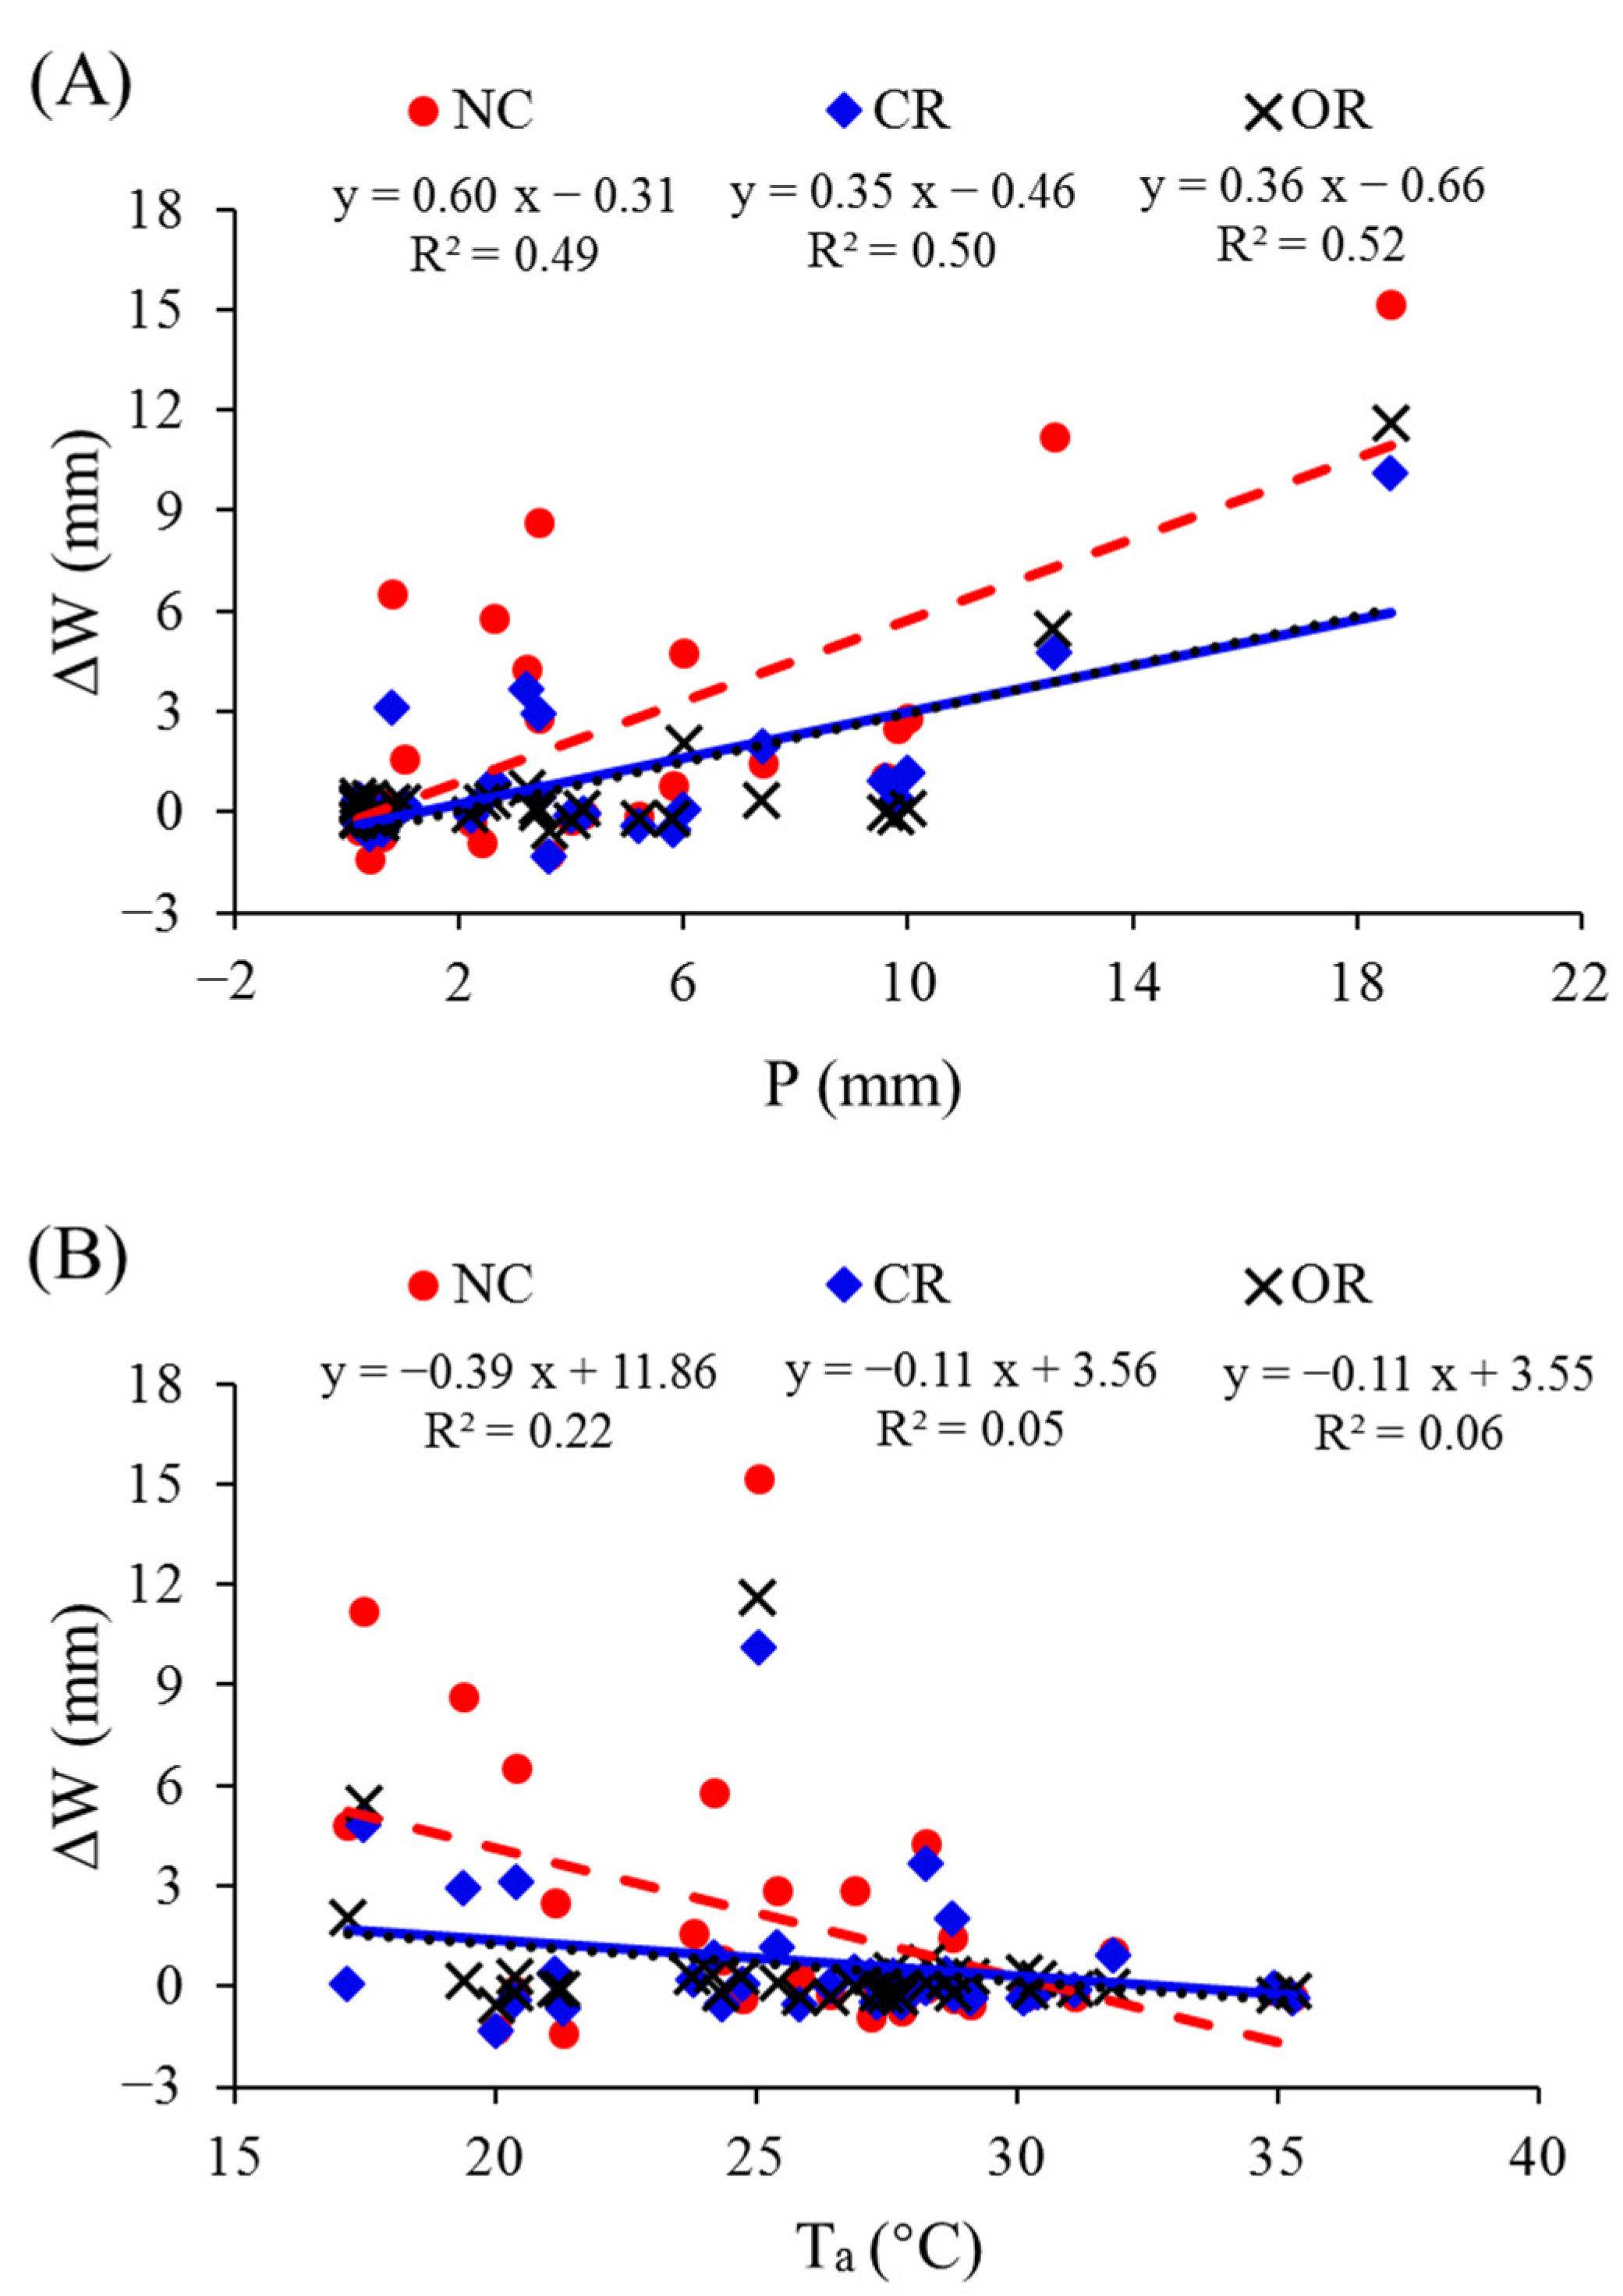
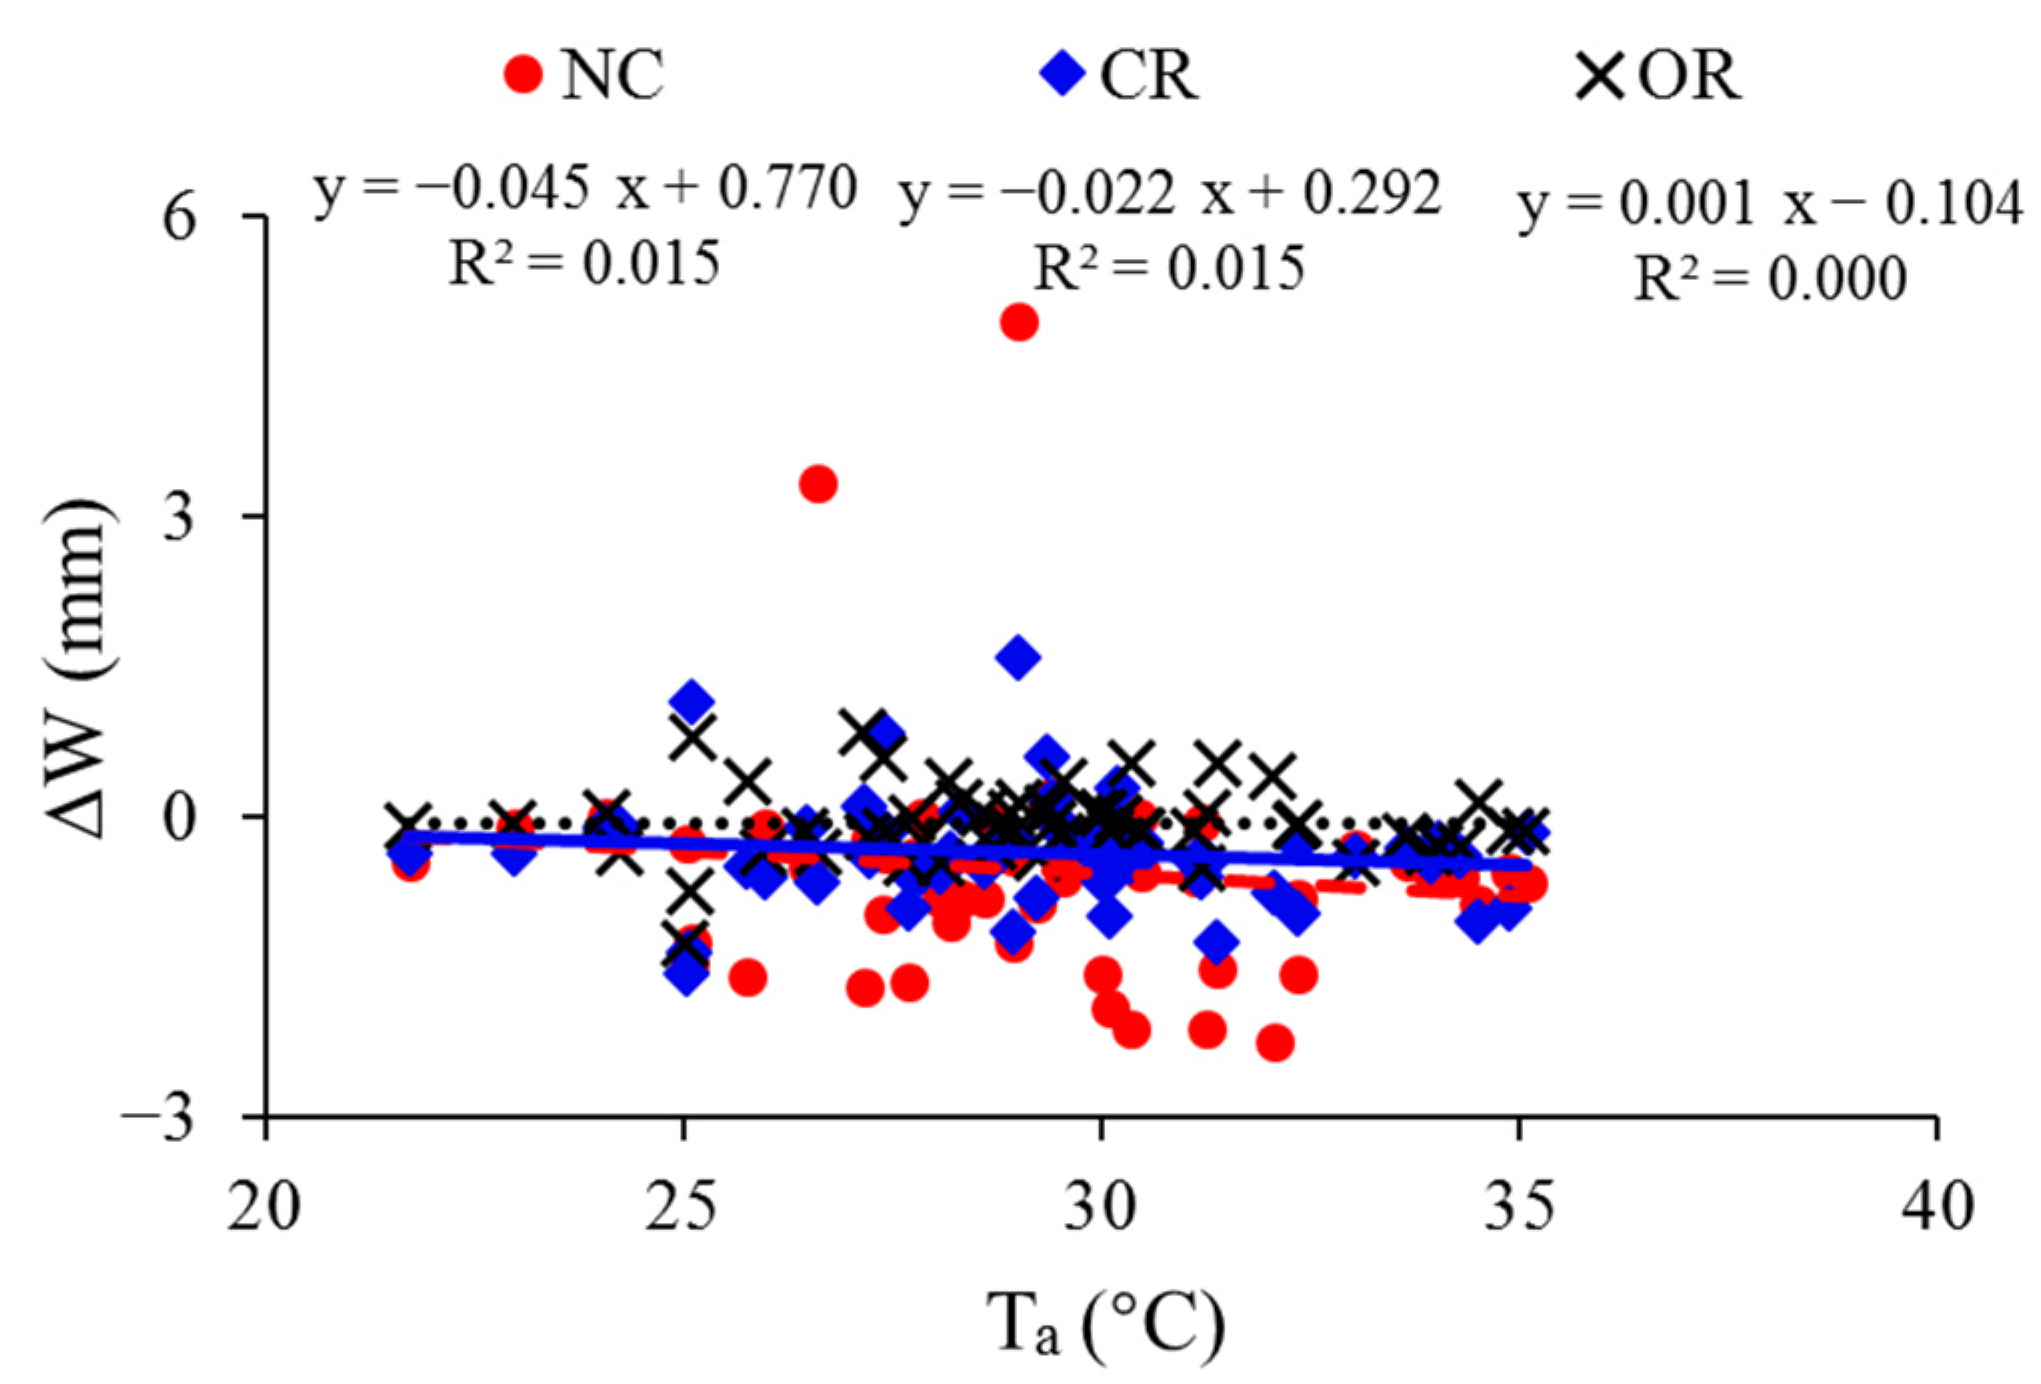
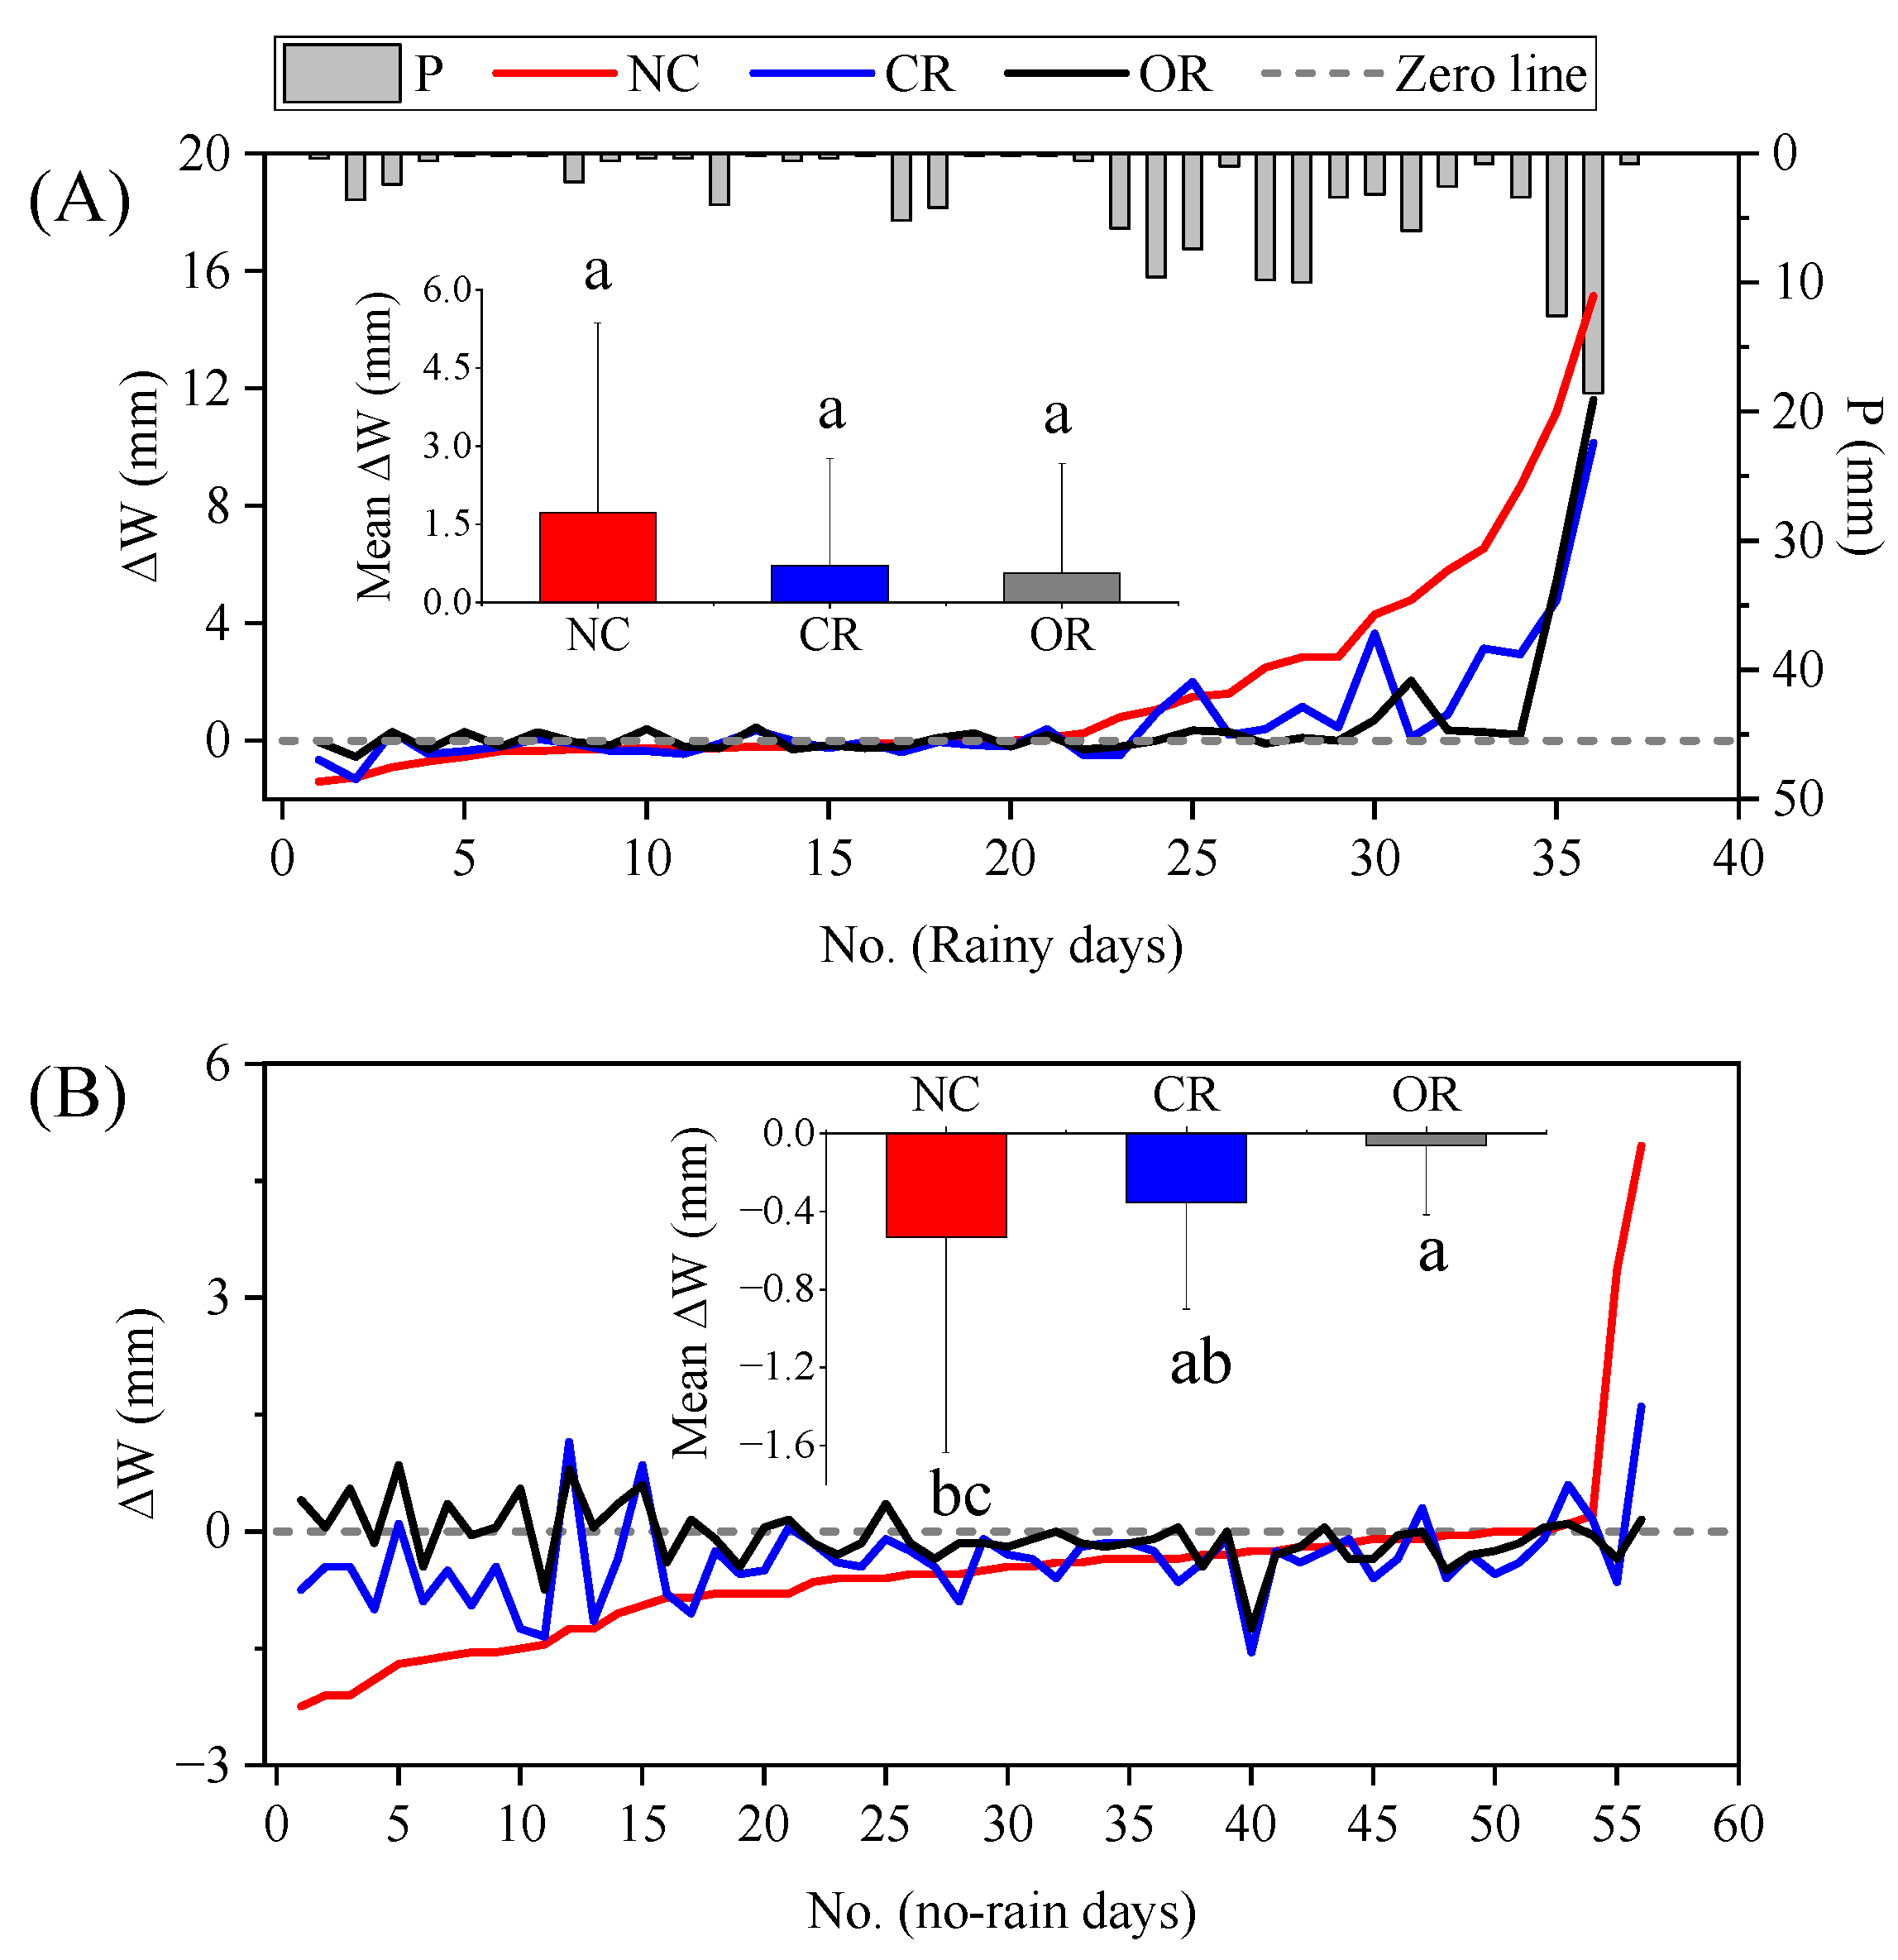
3.3. Different Responses on Rainy Days or No-Rain Days

Figure 4 displays the relationships between ∆W and P and Ta for just rainy days. On rainy days, the daily P and Ta were still positively and negatively related to ∆W, respectively. Even though the daily P also explained about 49–52% of the variation in ∆W, it had a different order of OR > CR > NC on rainy days. The slopes of the fitting curves between P and ∆W on rainy days were similar to those on each day. Meanwhile, the explanatory power of Ta for the ∆W variation was 5–22% on rainy days, and the slopes ranged from −0.39 to −0.11. Figure 5 analyzes the relationship between Ta and ∆W on no-rain days, which shows that the daily Ta explained just 0–1.5% of the variation in ∆W, indicating their weak relation. In addition, the lower slopes (−0.045 to 0.001) also indicate the feeble response of ∆W to Ta on no-rain days.

3.4. Effects of Different Treatments on ∆W Changes

The differences in ∆W between different treatments are compared on both rainy days and no-rain days in Figure 6. Based on the one-way ANOVA analysis, the mean ∆W on rainy days showed an order of NC (1.73 mm) > CR (0.71 mm) > OR (0.56 mm) with insignificant differences (p > 0.05), and it showed NC (−0.53 mm) < CR (−0.36 mm) < OR (−0.06 mm) with significant differences (p < 0.05) on no-rain days. In order to clearly compare the three treatments, the values of ∆W for the NC treatment were selected as a reference to sort the No. of days. On rainy days, the daily ∆W in the NC treatment was lower than the CR and OR treatments at the beginning before day No. 23, which had lower daily P amount (most < 1.0 mm); however, the change trend reversed after day No. 23, which had a higher daily P amount (most > 1.0 mm), indicating that the litter had a regulating function in the soil water response to rainfall. However, on no-rain days, the daily ∆W in the NC treatment was generally lower than the others in most cases. On both rainy or no-rain days, the CR and OR treatments had similar change trends of ∆W which were more stable than those of the NC treatment.

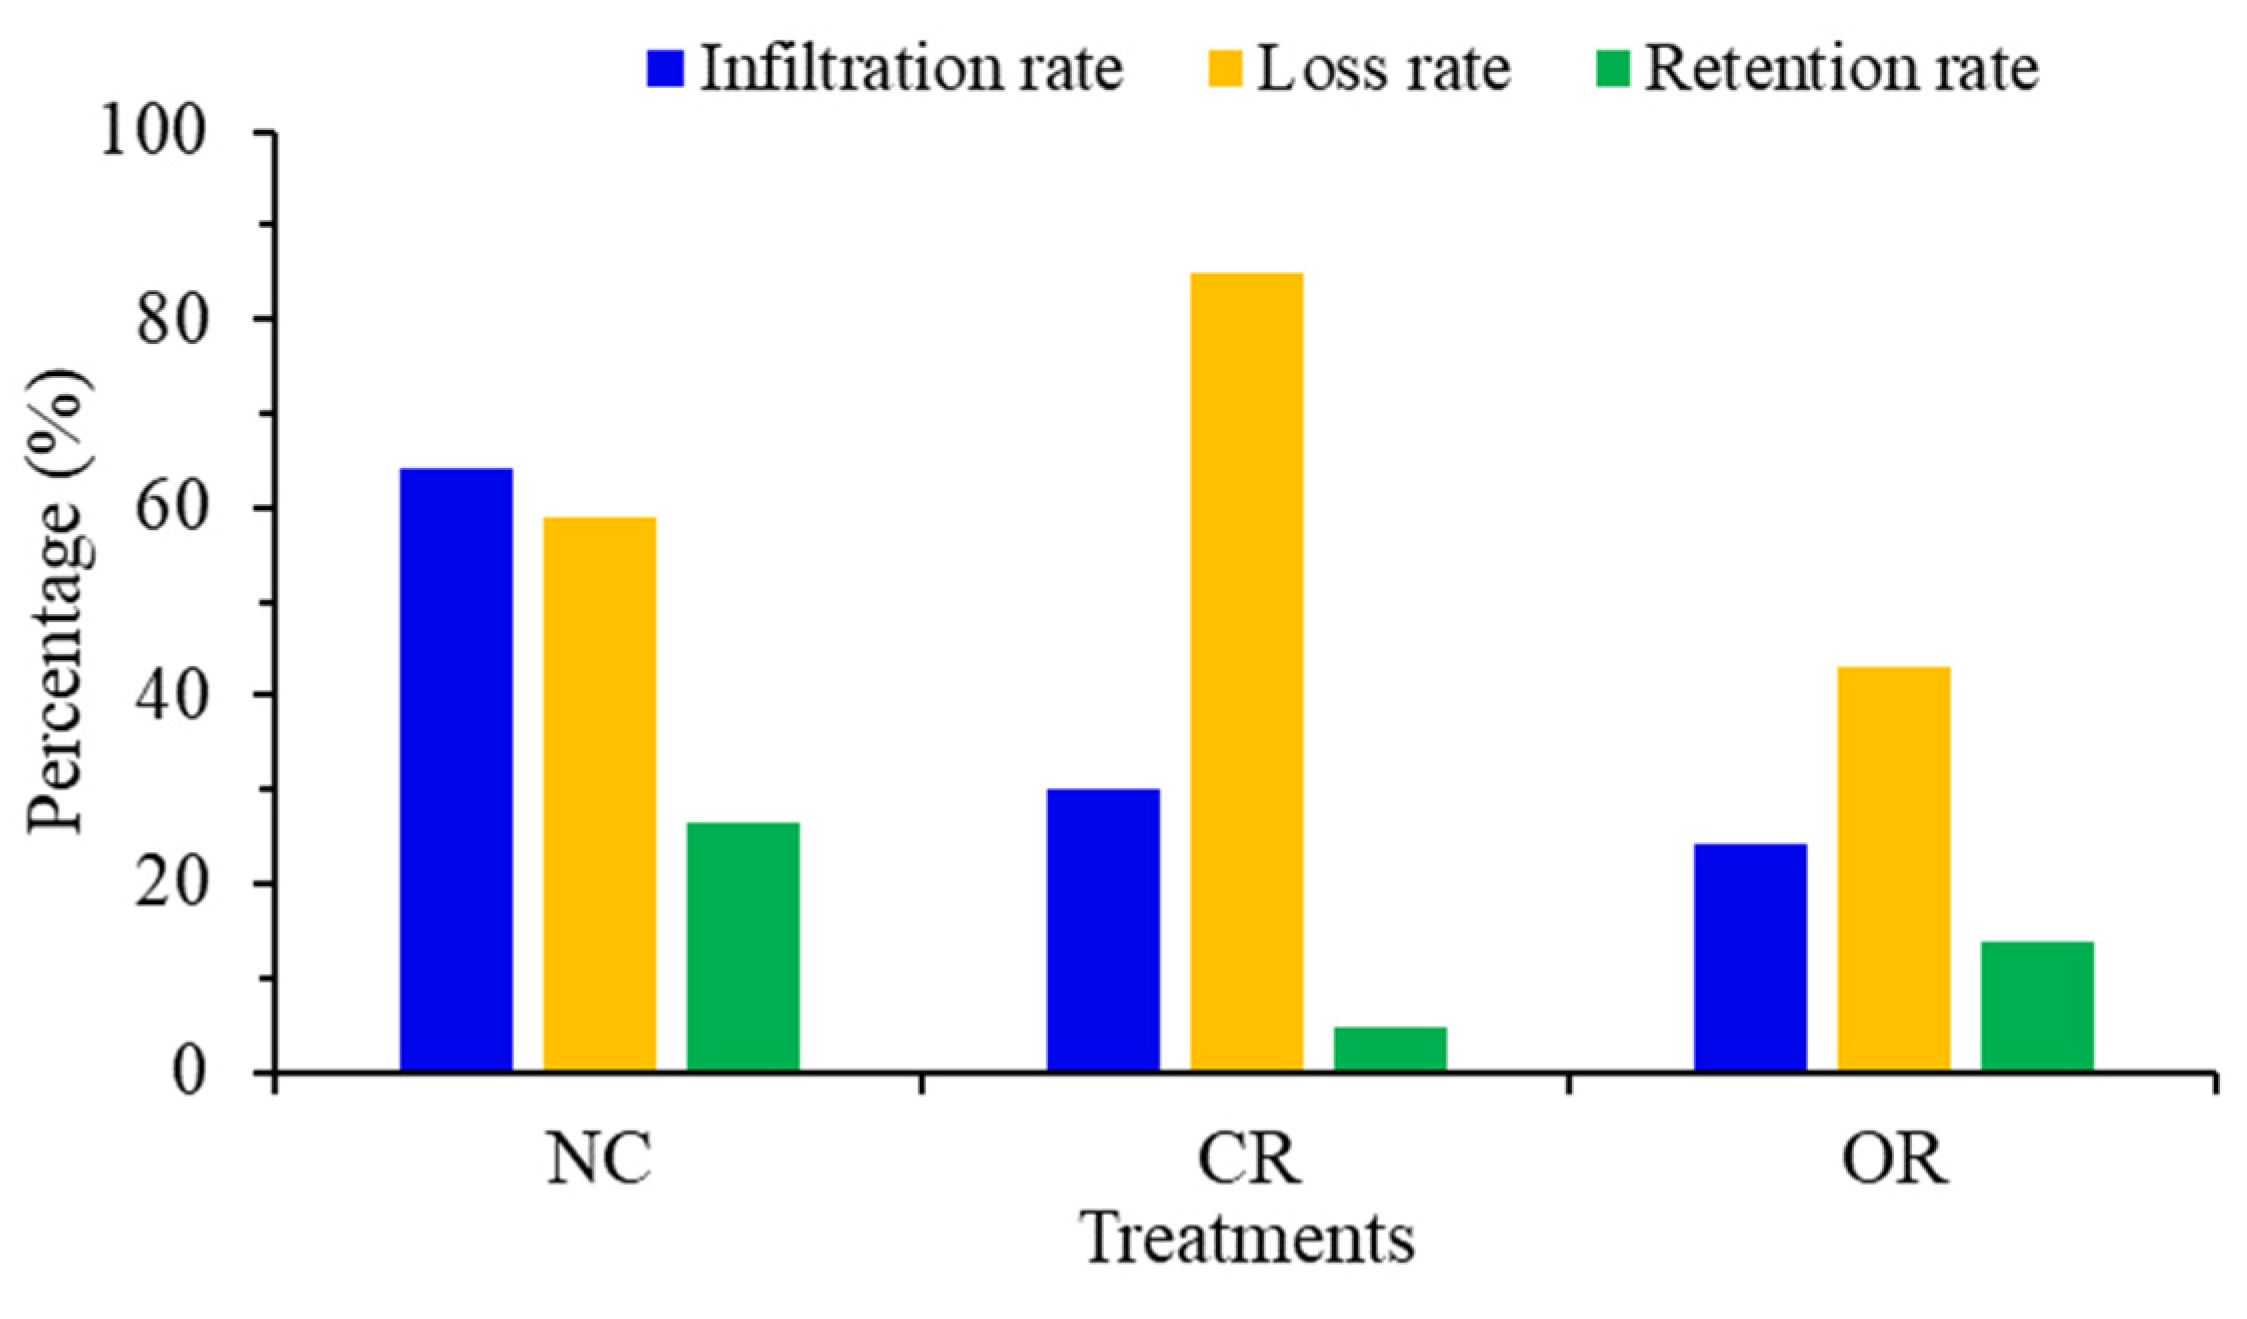
3.5. Effects of Different Treatments on Soil Water Infiltration, Loss and Retention

Conclusions regarding the processes (infiltration, loss and retention) of soil water storage for different treatments during the whole observation period are provided in Figure 7. The total infiltration rate displayed a hierarchy of NC (64.28%) > CR (30.07%) > OR (24.06%), indicating that the canopy and litter were both helpful to the hydrologic conversion process from rainfall to infiltration. However, the total water loss rate showed a pattern of CR (84.76%) > NC (58.88%) > OR (43.03%), indicating that the canopy mainly consumed the infiltrated water, and the litter could offset a part of this consumption. As a result, the CR treatment had the lowest rainfall retention rate of 4.58% due to the huge consumption by the canopy, the NC treatment had the highest retention rate of 26.43% due to strengthened infiltration and weakened depletion from the litter and the OR treatment had a medium retention rate of 13.71%.

4. Discussion

4.1. Effect of P and Ta on Soil Water on a Daily Scale

P and Ta are often used to evaluate the level of climate change, both of which have significant effects on hydrological processes [14,22,37]. In this study, we investigated the influence of P and Ta on soil water on a daily scale. The results showed that the daily P had more contribution than the daily Ta to the variation in ∆W; these contributions were 49–52% and 6–21%, respectively (Figure 3). So, the amount of soil water input from rainfall was the main limiting factor causing the daily ∆W variation, but the output loss amount induced by ET processes was not, which differs from others’ results [15,18,41,42]. In addition, the contributions of P (49–52%) and Ta (5–22%) to soil water on rainy days were similar to those on every day (Figure 4), and the contribution (<1.5%) of Ta on no-rain days was almost negligible (Figure 5), both of which also prove that rainy days controlled the total variation in ∆W during the observation period. It also indicates that increasing soil water replenishment on rainy days would strengthen the relationship between the daily Ta and ∆W. The value R2 = 0.00 and the daily ∆W always near and around zero for the OR treatment in Figure 5 illustrate that water loss from only soil evaporation had little effect on the daily ∆W. Previous studies also found that Ta affected soil water greatly over a long term but not a short term, expressing a significant long-term accumulation effect [15,23,24].
Threshold effects of P and Ta on ∆W were found at a daily scale in this study, where a daily P amount >0.74–1.12 mm and a daily Ta <29.09–32.00 °C were required to provide conditions for increasing soil water; otherwise, ∆W would be a negative value. Ge et al. [17] compared the rainfall threshold at the event scale for different vegetation types and found that the shrub type had the lowest P amount of 5.0 mm to trigger a soil water response at a 10 cm depth, and the grass and forest types needed about 6.0 mm; these values were up to 7 mm according to Dai and Wang [19] and 9–14 mm according to Jin et al. [18]. In addition, different soil depths required different rainfall amounts to trigger rainwater infiltration, such as at the soil depths of 20, 30, 40 and 50 cm with P thresholds of 7–15, 15–29, 29–36 and 36–55 mm events, respectively [19]. However, few have studied the Ta threshold required to trigger a soil water response or the direct relationship between Ta and soil water, and most have simply analyzed the indirect effects of Ta on soil water through ET processes [15,23,24]. We found that the relevance of the daily Ta to ∆W was indeed weak, but the sub-shrub canopy and litter strengthen the sensitivity of ∆W to the daily Ta. As a result, climate change significantly affects soil water storage in the past and future [14,16], Mao et al. [43] found that the overall sensitivity of soil moisture to both P and Ta was declining in the Loess Plateau. In addition, based on the simulation of climate change scenarios in the Loess Plateau, climate change contributed to 92.8–99.6% of the water yield changes, which is far more than the contribution of 0.4–7.2% from land use changes [44]. However, climate change will increase the incidence of extreme events, producing more uncertainties in soil hydrological processes, resulting in more challenges with respect to soil water scarcity and spatiotemporal distribution in the future [16].

4.2. Response of Soil Water Storage Processes to Sub-Shrub Components

The canopy, litter and roots play different and important roles in hydrological processes. In this study, we compared the influences of different components in soil water on rainy or no-rain days. It was found that the mean ∆W exhibited the hierarchy NC (1.73 mm) > CR (0.71 mm) > OR (0.56 mm) on rainy days but NC (−0.53 mm) < CR (−0.36 mm) < OR (−0.06 mm) on no-rain days (Figure 6). Both indicate that the canopy and litter components are helpful in conserving soil water through rainwater replenishment but also consume more soil water. In particular, when the daily P amount was most <1.0 mm, the NC treatment with the lowest ∆W indicated that the litter enhanced rainfall interception by the canopy [45]; when the daily P amount was most >1.0 mm, the litter enhanced rainfall storage and infiltration [29,30], resulting in the highest ∆W in the NC treatment. Therefore, the litter had a regulating function in the soil water response to rainfall. The lower and negative ∆W in the NC and CR treatments on no-rain days illustrate that the litter did not reduce soil evaporation and may have also strengthened canopy transpiration, which is different from others’ conclusions [29,31,39].
Through an analysis of the processes (infiltration, loss and retention) of soil water storage, we found that the final order of the rainwater retention rate was NC (26.43%) > OR (13.71%) > CR (4.58%) in sub-shrub land, which differs from that in grassland [38]. The roots were useful for soil water conservation during the whole growing season, the canopy showed a negative effect on conserving soil water since it depleted the increased amount of infiltration derived from the roots, and the litter generally improved soil water by offsetting the water depletion of the canopy. However, each component of the sub-shrub had a different function in increasing or decreasing soil water storage. Cui et al. (2022) [29] verified this opinion that the litter hindered infiltration at the beginning of the rainy season but increased soil water storage with deeper infiltration in the long term. In this study, the results of the infiltration rate (NC > CR > OR) support the idea that more components promoted infiltration. The loss rate of infiltration water (CR > NC > OR) indicates that a very low loss from soil evaporation loss (only the roots), a very high loss from canopy transpiration and a relatively high loss from the ET processes influenced by the litter. Consequently, the effects of vegetation components on surface soil water storage should be explained from different aspects and different time scales, and the varied conclusions will be conducive to understand the response mechanism and abnormal phenomena.

5. Conclusions

This study analyzed the response of surface soil water to P and Ta on a daily scale and considered the effects of different sub-shrub components (canopy, litter and roots) at the same time. The mean W significantly differed from different treatments: NC (21.60 mm) < CR (24.03 mm) < OR (28.53 mm). On a daily scale, P made a greater contribution and had a greater effect on ∆W than Ta; they contributed 49–52% and 6–21% to the variation in ∆W, respectively. Both P and Ta showed threshold phenomena (0.74–1.12 mm and 29.09–32.00 °C, respectively) in controlling soil water which were influenced by vegetation components. The sub-shrub canopy was helpful in increasing the P threshold and decreasing the Ta threshold by increasing the difficulty of rainwater infiltration and easily depleting the soil water, and these effects of the canopy were weakened and offset by the litter because the litter decreased the P threshold by making infiltration easier and increasing the Ta threshold by sheltering the soil to reduce evaporation. The sub-shrub components also changed the trends in ∆W on rainy days and no-rain days with NC (1.73 mm) > CR (0.71 mm) > OR (0.56 mm) and NC (−0.53 mm) < CR (−0.36 mm) < OR (−0.06 mm), respectively. The canopy strengthened the variation in ∆W, and the litter also exhibited a regulating function. As a result, the CR treatment had the lowest rainfall retention rate of 4.58% due to the huge consumption of the canopy, the NC treatment had the highest retention rate of 26.43% due to the strengthened infiltration and weakened depletion from the litter and the OR treatment had a medium retention rate of 13.71%. These findings support the idea that sub-shrub components significantly affect soil water conservation and change the W response to climate change, which is beneficial to understanding the drought adaptation of hydrological processes in extremely dry years.

Author Contributions

Conceptualization, J.L. and W.F.; methodology, J.L.; investigation, J.L. and W.C.; data curation, J.L. and W.F.; writing—original draft preparation, J.L.; writing—review and editing, J.L. and B.Z.; funding acquisition, J.L., W.C., W.F. and B.Z. All authors have read and agreed to the published version of the manuscript.

Funding

This research was supported by the National Natural Science Foundation of China (grant Nos. 42201126, 41971037, 42201103 and 42001020), the Open Foundation of the State Key Laboratory of Urban and Regional Ecology of China (No. SKLURE2020-2-3) and the Scientific Research Plan Project of Tianjin Municipal Education Commission (No. 2019KJ091).

Data Availability Statement

Data will be made available upon request.

Conflicts of Interest

The authors declare no conflict of interest.

References

  1. Yu, Y.; Hua, T.; Chen, L.; Zhang, Z.; Pereira, P. Divergent Changes in Vegetation Greenness, Productivity, and Rainfall Use Efficiency Are Characteristic of Ecological Restoration Towards High-Quality Development in the Yellow River Basin, China. Engineering 2023. [Google Scholar] [CrossRef]
  2. Wang, S.; Fu, B.J.; Chen, H.B.; Liu, Y. Regional development boundary of China’s Loess Plateau: Water limit and land shortage. Land Use Policy 2018, 74, 130–136. [Google Scholar] [CrossRef]
  3. Wang, Y.Q.; Shao, M.A.; Zhu, Y.J.; Liu, Z.P. Impacts of land use and plant characteristics on dried soil layers in different climatic regions on the Loess Plateau of China. Agric. For. Meteorol. 2011, 151, 437–448. [Google Scholar] [CrossRef]
  4. Sun, W.Y.; Mu, X.M.; Song, X.Y.; Wu, D.; Cheng, A.F.; Qiu, B. Changes in extreme temperature and precipitation events in the Loess Plateau (China) during 1960–2013 under global warming. Atmos. Res. 2016, 168, 33–48. [Google Scholar] [CrossRef]
  5. Fu, B.J.; Wang, S.; Liu, Y.; Liu, J.B.; Liang, W.; Miao, C.Y. Hydrogeomorphic Ecosystem Responses to Natural and Anthropogenic Changes in the Loess Plateau of China. Annu. Rev. Earth Planet. Sci. 2017, 45, 223–243. [Google Scholar] [CrossRef]
  6. Yu, Y.; Zhao, W.W.; Martinez-Murillo, J.F.; Pereira, P. Loess Plateau: From degradation to restoration. Sci. Total Environ. 2020, 738, 140206. [Google Scholar] [CrossRef]
  7. Tsang, L.; Liao, T.H.; Gao, R.X.; Xu, H.K.; Gu, W.H.; Zhu, J.Y. Theory of Microwave Remote Sensing of Vegetation Effects, SoOp and Rough Soil Surface Backscattering. Remote Sens. 2022, 14, 3640. [Google Scholar] [CrossRef]
  8. Etminan, A.; Tabatabaeenejad, A.; Moghaddam, M. Retrieving Root-Zone Soil Moisture Profile From P-Band Radar via Hybrid Global and Local Optimization. IEEE Trans. Geosci. Remote Sens. 2020, 58, 5400–5408. [Google Scholar] [CrossRef]
  9. Zribi, M.; Sahnoun, M.; Dusséaux, R.; Afifi, S.; Baghdadi, N.; Ben Hamida, A. Analysis of P band radar signal potential to retrieve soil moisture profile. In Proceedings of the 2016 2nd International Conference on Advanced Technologies for Signal and Image Processing (ATSIP), Monastir, Tunisia, 21–23 March 2016. [Google Scholar]
  10. Neusch, T.; Sties, M. Application of the Dubois-model using experimental synthetic aperture radar data for the determination of soil moisture and surface roughness. Isprs J. Photogramm. Remote Sens. 1999, 54, 273–278. [Google Scholar] [CrossRef]
  11. Dave, R.; Kumar, G.; Pandey, D.K.; Khan, A.; Bhattacharya, B. Evaluation of modified Dubois model for estimating surface soil moisture using dual polarization RISAT-1 C-band SAR data. Geocarto Int. 2021, 36, 1459–1469. [Google Scholar] [CrossRef]
  12. Gharechelou, S.; Tateishi, R.; Sumantyo, J.T.S.; Johnson, B.A. Soil Moisture Retrieval Using Polarimetric SAR Data and Experimental Observations in an Arid Environment. Isprs. Int. J. Geo.-Inf. 2021, 10, 711. [Google Scholar] [CrossRef]
  13. Yu, Y.; Zhu, R.P.; Ma, D.M.; Liu, D.J.; Liu, Y.; Gao, Z.Q.; Yin, M.Q.; Bandala, E.R.; Rodrigo-Comino, J. Multiple surface runoff and soil loss responses by sandstone morphologies to land-use and precipitation regimes changes in the Loess Plateau, China. Catena 2022, 217, 106477. [Google Scholar] [CrossRef]
  14. Li, L.J.; Song, X.Y.; Zhao, X.K.; Meng, P.F.; Feng, D.; Fu, C.; Wang, L.; Jiao, R.Y.; Wei, W.Y.; Li, H.Y. Modeling the impact of climate change and vegetation conversion on water budget: A case study in the Loess Plateau of China. J. Hydrol. Reg. Stud. 2022, 40, 101040. [Google Scholar] [CrossRef]
  15. Longobardi, A.; Khaertdinova, E. Relating soil moisture and air temperature to evapotranspiration fluxes during inter-storm periods at a Mediterranean experimental site. J. Arid Land 2015, 7, 27–36. [Google Scholar] [CrossRef]
  16. Huang, L.M.; Shao, M.A. Advances and perspectives on soil water research in China’s Loess Plateau. Earth Sci. Rev. 2019, 199, 102962. [Google Scholar] [CrossRef]
  17. Ge, F.C.; Xu, M.X.; Gong, C.; Zhang, Z.Y.; Tan, Q.Y.; Pan, X.H. Land cover changes the soil moisture response to rainfall on the Loess Plateau. Hydrol. Process 2022, 36, 14714. [Google Scholar] [CrossRef]
  18. Jin, Z.; Guo, L.; Lin, H.; Wang, Y.Q.; Yu, Y.L.; Chu, G.C.; Zhang, J. Soil moisture response to rainfall on the Chinese Loess Plateau after a long-term vegetation rehabilitation. Hydrol. Process 2018, 32, 1738–1754. [Google Scholar] [CrossRef]
  19. Dai, H.; Wang, H. Influence of rainfall events on soil moisture in a typical steppe of Xilingol. Phys. Chem. Earth 2021, 121, 102964. [Google Scholar] [CrossRef]
  20. Chen, L.; Zhang, K.L.; Zhang, Z.D.; Cao, Z.H.; Ke, Q.H. Response of soil water movement to rainfall under different land uses in karst regions. Environ. Earth Sci. 2023, 82, 50. [Google Scholar] [CrossRef]
  21. Wang, S.; Fu, B.; Gao, G.; Liu, Y.; Zhou, J. Responses of soil moisture in different land cover types to rainfall events in a re-vegetation catchment area of the Loess Plateau, China. Catena 2013, 101, 122–128. [Google Scholar] [CrossRef]
  22. Du, H.; Jiao, F.; Yao, J.; Li, D.; Fang, Z. Effects of Precipitation Changes on Soil Moisture Characteristics of Returning Farmland in Loess Hilly Region. Res. Soil Water Conserv. 2019, 26, 81–88. (In Chinese) [Google Scholar]
  23. Ramos, M.C.; Jones, G.V.; Martinez-Casasnovas, J.A. Structure and trends in climate parameters affecting winegrape production in northeast Spain. Clim. Res. 2008, 38, 1–15. [Google Scholar] [CrossRef]
  24. Liu, X.M.; Zhang, D. Trend analysis of reference evapotranspiration in Northwest China: The roles of changing wind speed and surface air temperature. Hydrol. Process 2013, 27, 3941–3948. [Google Scholar] [CrossRef]
  25. Materia, S.; Ardilouze, C.; Prodhomme, C.; Donat, M.G.; Benassi, M.; Doblas-Reyes, F.J.; Peano, D.; Caron, L.P.; Ruggieri, P.; Gualdi, S. Summer temperature response to extreme soil water conditions in the Mediterranean transitional climate regime. Clim. Dyn. 2022, 58, 1943–1963. [Google Scholar] [CrossRef]
  26. Niu, X.T.; Fan, J.; Du, M.G.; Dai, Z.J.; Luo, R.H.; Yuan, H.Y.; Zhang, S.G. Changes of Rainfall Partitioning and Canopy Interception Modeling after Progressive Thinning in Two Shrub Plantations on the Chinese Loess Plateau. J. Hydrol. 2023, 619, 129299. [Google Scholar] [CrossRef]
  27. Lunka, P.; Patil, S.D. Impact of tree planting configuration and grazing restriction on canopy interception and soil hydrological properties: Implications for flood mitigation in silvopastoral systems. Hydrol. Process 2016, 30, 945–958. [Google Scholar] [CrossRef]
  28. Wang, D.; Wang, L.; Zhang, R. Measurement and modeling of canopy interception losses by two differently aged apple orchards in a subhumid region of the Yellow River Basin. Agric. Water Manag. 2022, 269, 107667. [Google Scholar] [CrossRef]
  29. Cui, Y.S.; Pan, C.Z.; Zhang, G.; Sun, Z.W.; Wang, F.X. Effects of litter mass on throughfall partitioning in a Pinus tabulaeformis plantation on the Loess Plateau, China. Agric. For. Meteorol. 2022, 318, 108908. [Google Scholar] [CrossRef]
  30. Cui, Z.; Huang, Z.; Luo, J.; Qiu, K.Y.; Lopez-Vicente, M.; Wu, G.L. Litter cover breaks soil water repellency of biocrusts, enhancing initial soil water infiltration and content in a semi-arid sandy land. Agric. Water Manag. 2021, 255, 107009. [Google Scholar] [CrossRef]
  31. Villegas, J.C.; Breshears, D.D.; Zou, C.B.; Law, D.J. Ecohydrological controls of soil evaporation in deciduous drylands: How the hierarchical effects of litter, patch and vegetation mosaic cover interact with phenology and season. J. Arid. Env. 2010, 74, 595–602. [Google Scholar] [CrossRef]
  32. Zhao, L.S.; Meng, P.; Zhang, J.S.; Zhang, J.X.; Sun, S.J.; He, C.X. Effect of slopes on rainfall interception by leaf litter under simulated rainfall conditions. Hydrol. Process 2022, 36, e14659. [Google Scholar] [CrossRef]
  33. Cui, Z.; Wu, G.L.; Huang, Z.; Liu, Y. Fine roots determine soil infiltration potential than soil water content in semi-arid grassland soils. J. Hydrol. 2019, 578, 124023. [Google Scholar] [CrossRef]
  34. Wang, H.F.; Zhu, X.A.; Zakari, S.; Chen, C.F.; Liu, W.J.; Jiang, X.J. Assessing the Effects of Plant Roots on Soil Water Infiltration Using Dyes and Hydrus-1D. Forests 2022, 13, 1095. [Google Scholar] [CrossRef]
  35. Wu, G.L.; Liu, Y.; Yang, Z.; Cui, Z.; Deng, L.; Chang, X.F.; Shi, Z.H. Root channels to indicate the increase in soil matrix water infiltration capacity of arid reclaimed mine soils. J. Hydrol. 2017, 546, 133–139. [Google Scholar] [CrossRef]
  36. Song, T.J.; An, Y.; Wen, B.L.; Tong, S.Z.; Jiang, L. Very fine roots contribute to improved soil water storage capacity in semi-arid wetlands in Northeast China. Catena 2022, 211, 105966. [Google Scholar] [CrossRef]
  37. Liu, J.B.; Liang, Y.; Gao, G.Y.; Dunkerley, D.; Fu, B.J. Quantifying the effects of rainfall intensity fluctuation on runoff and soil loss: From indicators to models. J. Hydrol. 2022, 607, 127494. [Google Scholar] [CrossRef]
  38. Liu, J.B.; Gao, G.Y.; Chen, W.L.; Fang, W.W.; Su, C.H.; Zhang, B. Effect of grass components on the temporal response of surface soil water to precipitation and air temperature in the Loess Plateau. Air Soil Water Res. 2023, 16. [Google Scholar] [CrossRef]
  39. Liu, J.B.; Gao, G.Y.; Wang, S.; Jiao, L.; Wu, X.; Fu, B.J. The effects of vegetation on runoff and soil loss: Multidimensional structure analysis and scale characteristics. J. Geogr. Sci. 2018, 28, 59–78. [Google Scholar] [CrossRef]
  40. He, Z.M.; Jia, G.D.; Liu, Z.Q.; Zhang, Z.Y.; Yu, X.X.; Hao, P.Q. Field studies on the influence of rainfall intensity, vegetation cover and slope length on soil moisture infiltration on typical watersheds of the Loess Plateau, China. Hydrol. Process 2020, 34, 4904–4919. [Google Scholar] [CrossRef]
  41. Ramos, M.C.; Martinez-Casasnovas, J.A. Effects of precipitation patterns and temperature trends on soil water available for vineyards in a Mediterranean climate area. Agric. Water Manag. 2010, 97, 1495–1505. [Google Scholar] [CrossRef]
  42. Ni, J.J.; Cheng, Y.F.; Wang, Q.H.; Ng, C.W.W.; Garg, A. Effects of vegetation on soil temperature and water content: Field monitoring and numerical modelling. J. Hydrol. 2019, 571, 494–502. [Google Scholar] [CrossRef]
  43. Mao, R.; Tang, B.; Xu, W.; Kong, F.; Sun, H.; Lei, Y. Vegetation variation regulates soil moisture sensitivity to climate change on the Loess Plateau. J. Hydrol. 2023, 617, 128763. [Google Scholar] [CrossRef]
  44. Hu, Y.F.; Gao, M.; Batunacun. Evaluations of water yield and soil erosion in the Shaanxi -Gansu Loess Plateau under different land use and climate change scenarios. Environ. Dev. 2020, 34, 100488. [Google Scholar] [CrossRef]
  45. Li, X.; Niu, J.Z.; Xie, B.Y. Study on Hydrological Functions of Litter Layers in North China. PLoS ONE 2013, 8, e70328. [Google Scholar] [CrossRef]
Figure 1. Study area and observational experiments. NC: the natural condition; CR: canopy + roots with the litter removed; OR: roots only, with both the canopy and litter removed.
Water 15 04157 g001
Figure 2. The mean W and the distribution of ∆W for every day for the three treatments during the observation period. W: soil water storage; ∆W: the change in soil water storage; P: precipitation; Ta: air temperature; NC: natural condition treatment; CR: canopy + roots treatment; OR: only roots treatment. Different small letter refers to significant differences between different treatments (p < 0.05). Error bars refer to the standard deviation.
Water 15 04157 g002
Figure 3. Relationships between ∆W with P (A) and Ta (B) for every day during the observation period.
Water 15 04157 g003
Figure 4. Relationships between ∆W and P (A) and Ta (B) on rainy days.
Water 15 04157 g004
Figure 5. Relationships between ∆W and Ta on no-rain days.
Water 15 04157 g005
Figure 6. Differences in ∆W under the three treatments for rainy days (A) and no-rain days (B). In order to make the change trends clearer, we sorted the data of P and ∆W based on the daily ∆W in the NC treatment. Curves with different colors indicate the daily ∆W under different treatments, and the inverted gray column is the daily P on rainy days. Histograms with different colors display the mean daily ∆W under different treatments. Different small letters refer to significant differences between different treatments (p < 0.05). Error bars refer to the standard deviation.
Water 15 04157 g006
Figure 7. The different responses of soil water to different treatments. The infiltration rate was the percentage of the cumulative amount of positive ∆W to the total P amount. The total loss rate was the percentage of the cumulative amount of negative ∆W to the total infiltration. The rainwater retention rate was the ratio of the cumulative ∆W amount to the total P amount.
Water 15 04157 g007
Table 1. The thresholds of the lowest P and the highest Ta required to increase soil water (∆W > 0).
ThresholdNCCROR
P (mm)0.761.120.74
Ta (°C)29.4529.0932.00
Disclaimer/Publisher’s Note: The statements, opinions and data contained in all publications are solely those of the individual author(s) and contributor(s) and not of MDPI and/or the editor(s). MDPI and/or the editor(s) disclaim responsibility for any injury to people or property resulting from any ideas, methods, instructions or products referred to in the content.

