2.2. Formulation, Hazard Identification, and Development of an Fault Tree
In this study, a fault tree (FT) model is employed for system safety analysis within hydraulic fracturing operations, integrating hazard identification and an event tree setup based on field data. The methodology enables a comprehensive assessment of qualitative risks by utilizing the combined fault tree and event tree to represent various scenarios.
Figure 4 illustrates the actual hydraulic fracturing process and the equipment used at the surface level for this operation. The necessary field data, crucial for this study, were obtained from different shale gas wells related to this process. Expert opinions in the field were collected, translated, and analyzed through the error tree, with the assistance of the Top Event FTA program. The methodology allows for a comprehensive assessment of qualitative risks, using the combined fault tree and event tree to represent multiple scenarios. The risk assessments rely on the Bayesian belief network (see
Figure 5) [
15,
16,
17,
18].
The process involves two key steps: hazard identification, which evaluates risk factors and potential hazards that could cause harm, and fault tree development, which is a systematic quantitative analysis that is conducted through the development of a fault tree (
Figure 6). The proposed framework integrates results from both fault tree and event tree analyses, establishing links between causes and results for scenario analysis during the hydraulic fracturing process. This integrated approach forms the foundation for Bayesian belief network (BBN) modeling, as demonstrated in
Table 1, which serves as the basis for linkage in this study [
9,
10,
19,
20].
2.3. Building a BBN Model
A Bayesian belief network (BBN) emerges as a potent diagnostic tool for identifying system faults in the context of hydraulic fracturing. Utilizing hierarchical graphs, the BBN adeptly captures probabilistic causal relationships among uncertain variables, which are crucial when confronted with limited data. This dynamic model learns continuously from both historical and real-time data, adapting its understanding during hydraulic fracturing processes based on observed changes [
6,
12,
21]. The categorization of nodes into root nodes (RN), consequence nodes (CN), and safety nodes (SN) enhances the system’s fault identification capabilities. Links in the BBN symbolize associations, reflecting variable states and conditional probabilities for consequence nodes. When safety or consequence nodes lack root nodes, probabilities are considered unconditional. A fault tree, visually represented in
Figure 6, encapsulates this hierarchical structure, aiding in the comprehension of fault scenarios. This adaptive model, tailored for hydraulic fracturing intricacies, ensures continual learning and updates, contributing to effective fault identification and, consequently, heightened system safety and performance. In essence, the BBN model provides a comprehensive framework that amalgamates historical and real-time data, categorizes nodes meaningfully, and utilizes conditional probabilities to evaluate fault scenarios, ultimately enhancing system resilience in hydraulic fracturing [
12,
14,
22].
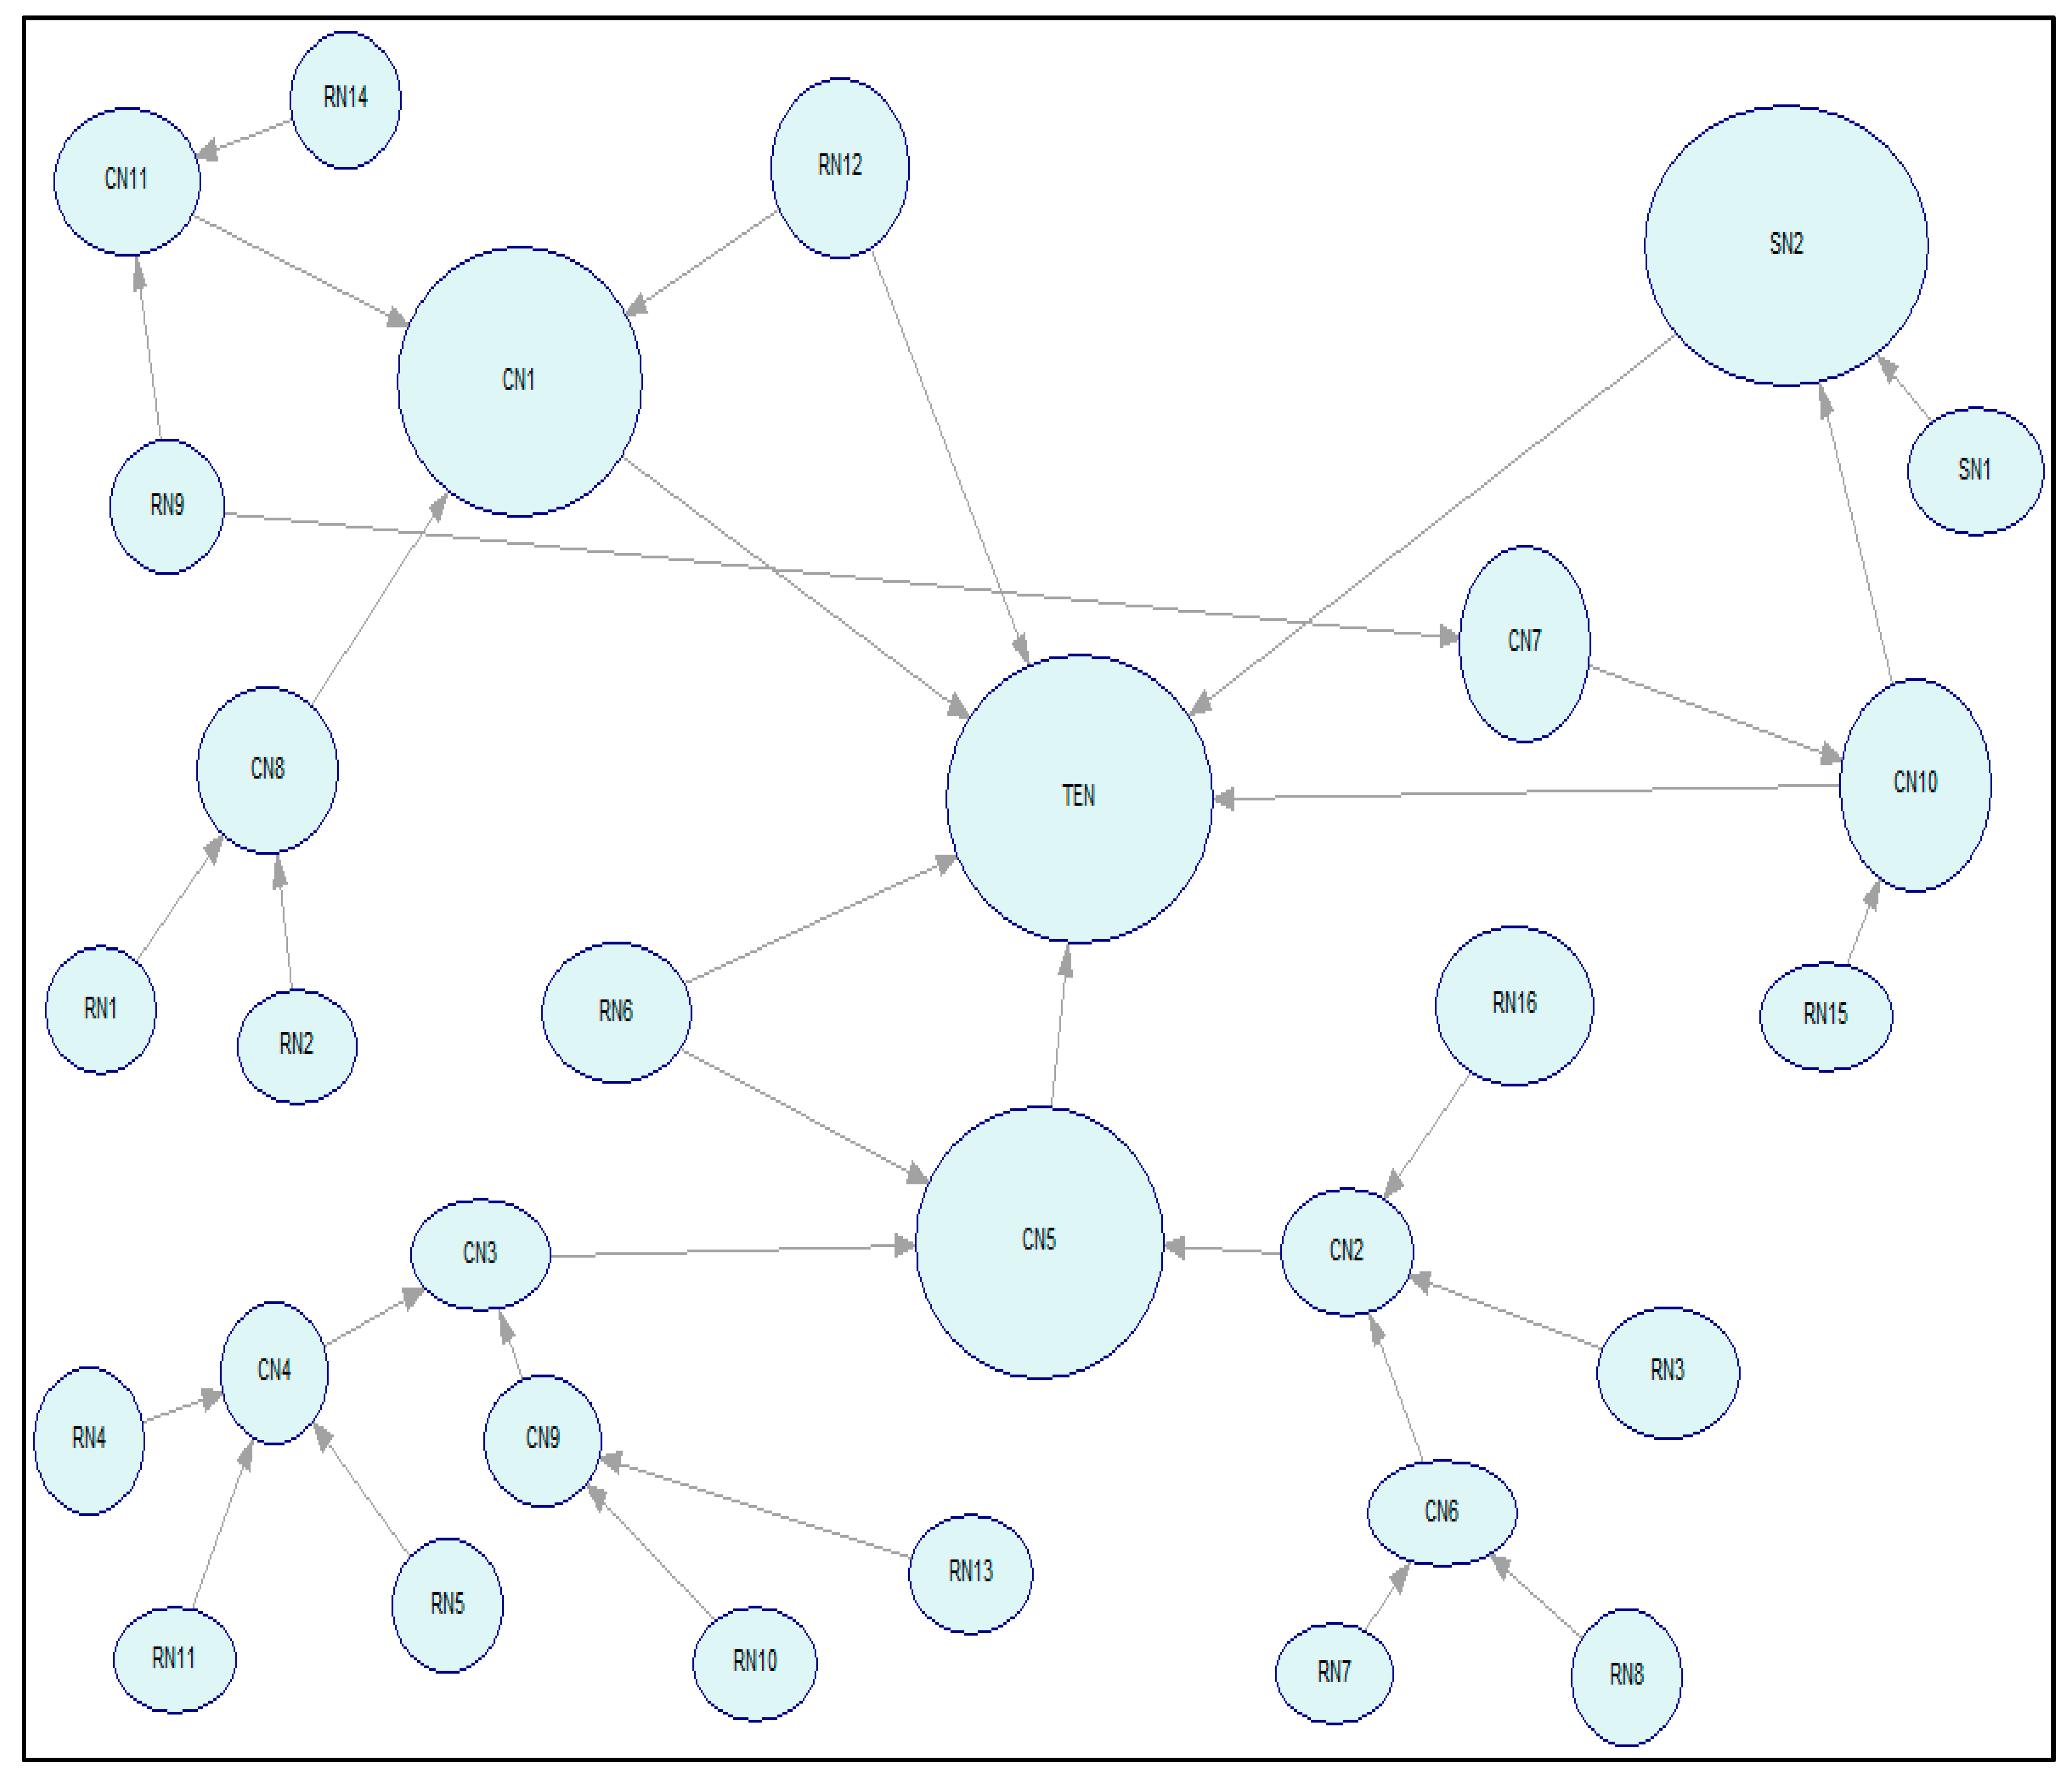
In
Figure 7, the initiation of modeling and probabilistic programming is demonstrated using Software GeNIe Academic Version 4.0.1922.0, which is specifically tailored for Bayesian belief networks (BBN) in the context of real-time hydraulic fracturing process data. The model’s beliefs align with fault tree analysis and event tree, while the links signify causal connections between them. Notably, the model encapsulates intricate relationships, such as the consequence node linking strata with high in situ stress in shale gas reservoirs to high permeability zones and near-wellbore friction. This representation, as depicted in
Figure 8, provides a visual roadmap for understanding the interplay of variables, facilitating effective fault analysis and enhancing the system’s adaptive learning in hydraulic fracturing scenarios [
6,
13,
15,
23]. In addition,
Figure 7 illustrates a Bayesian network model through groups defined as G = RN, SN, CN, which correspond to FTA and ET. It can be simplified into variables and expressed in the results as G = V, A, where V refers to node groups of different variables and the group of their related A, giving V = {1,.....
n) and
. Meanwhile, the output result node i relates to the value of the variable and root nodes. The equation
R(
i) represents the root nodes for each of the consequence nodes, and the safety node is represented as
i.
A path
is a link vector for each state of
for each variable
that has the same probability distribution:
This is given if the probability of the variable is without a root and the negligible probabilities are .
Equation (2) expresses the state of variables with the root of each variable through conditional probabilities
where
represents the situation group of root nodes of
i.
2.4. A BBN for Hydraulic Fracturing
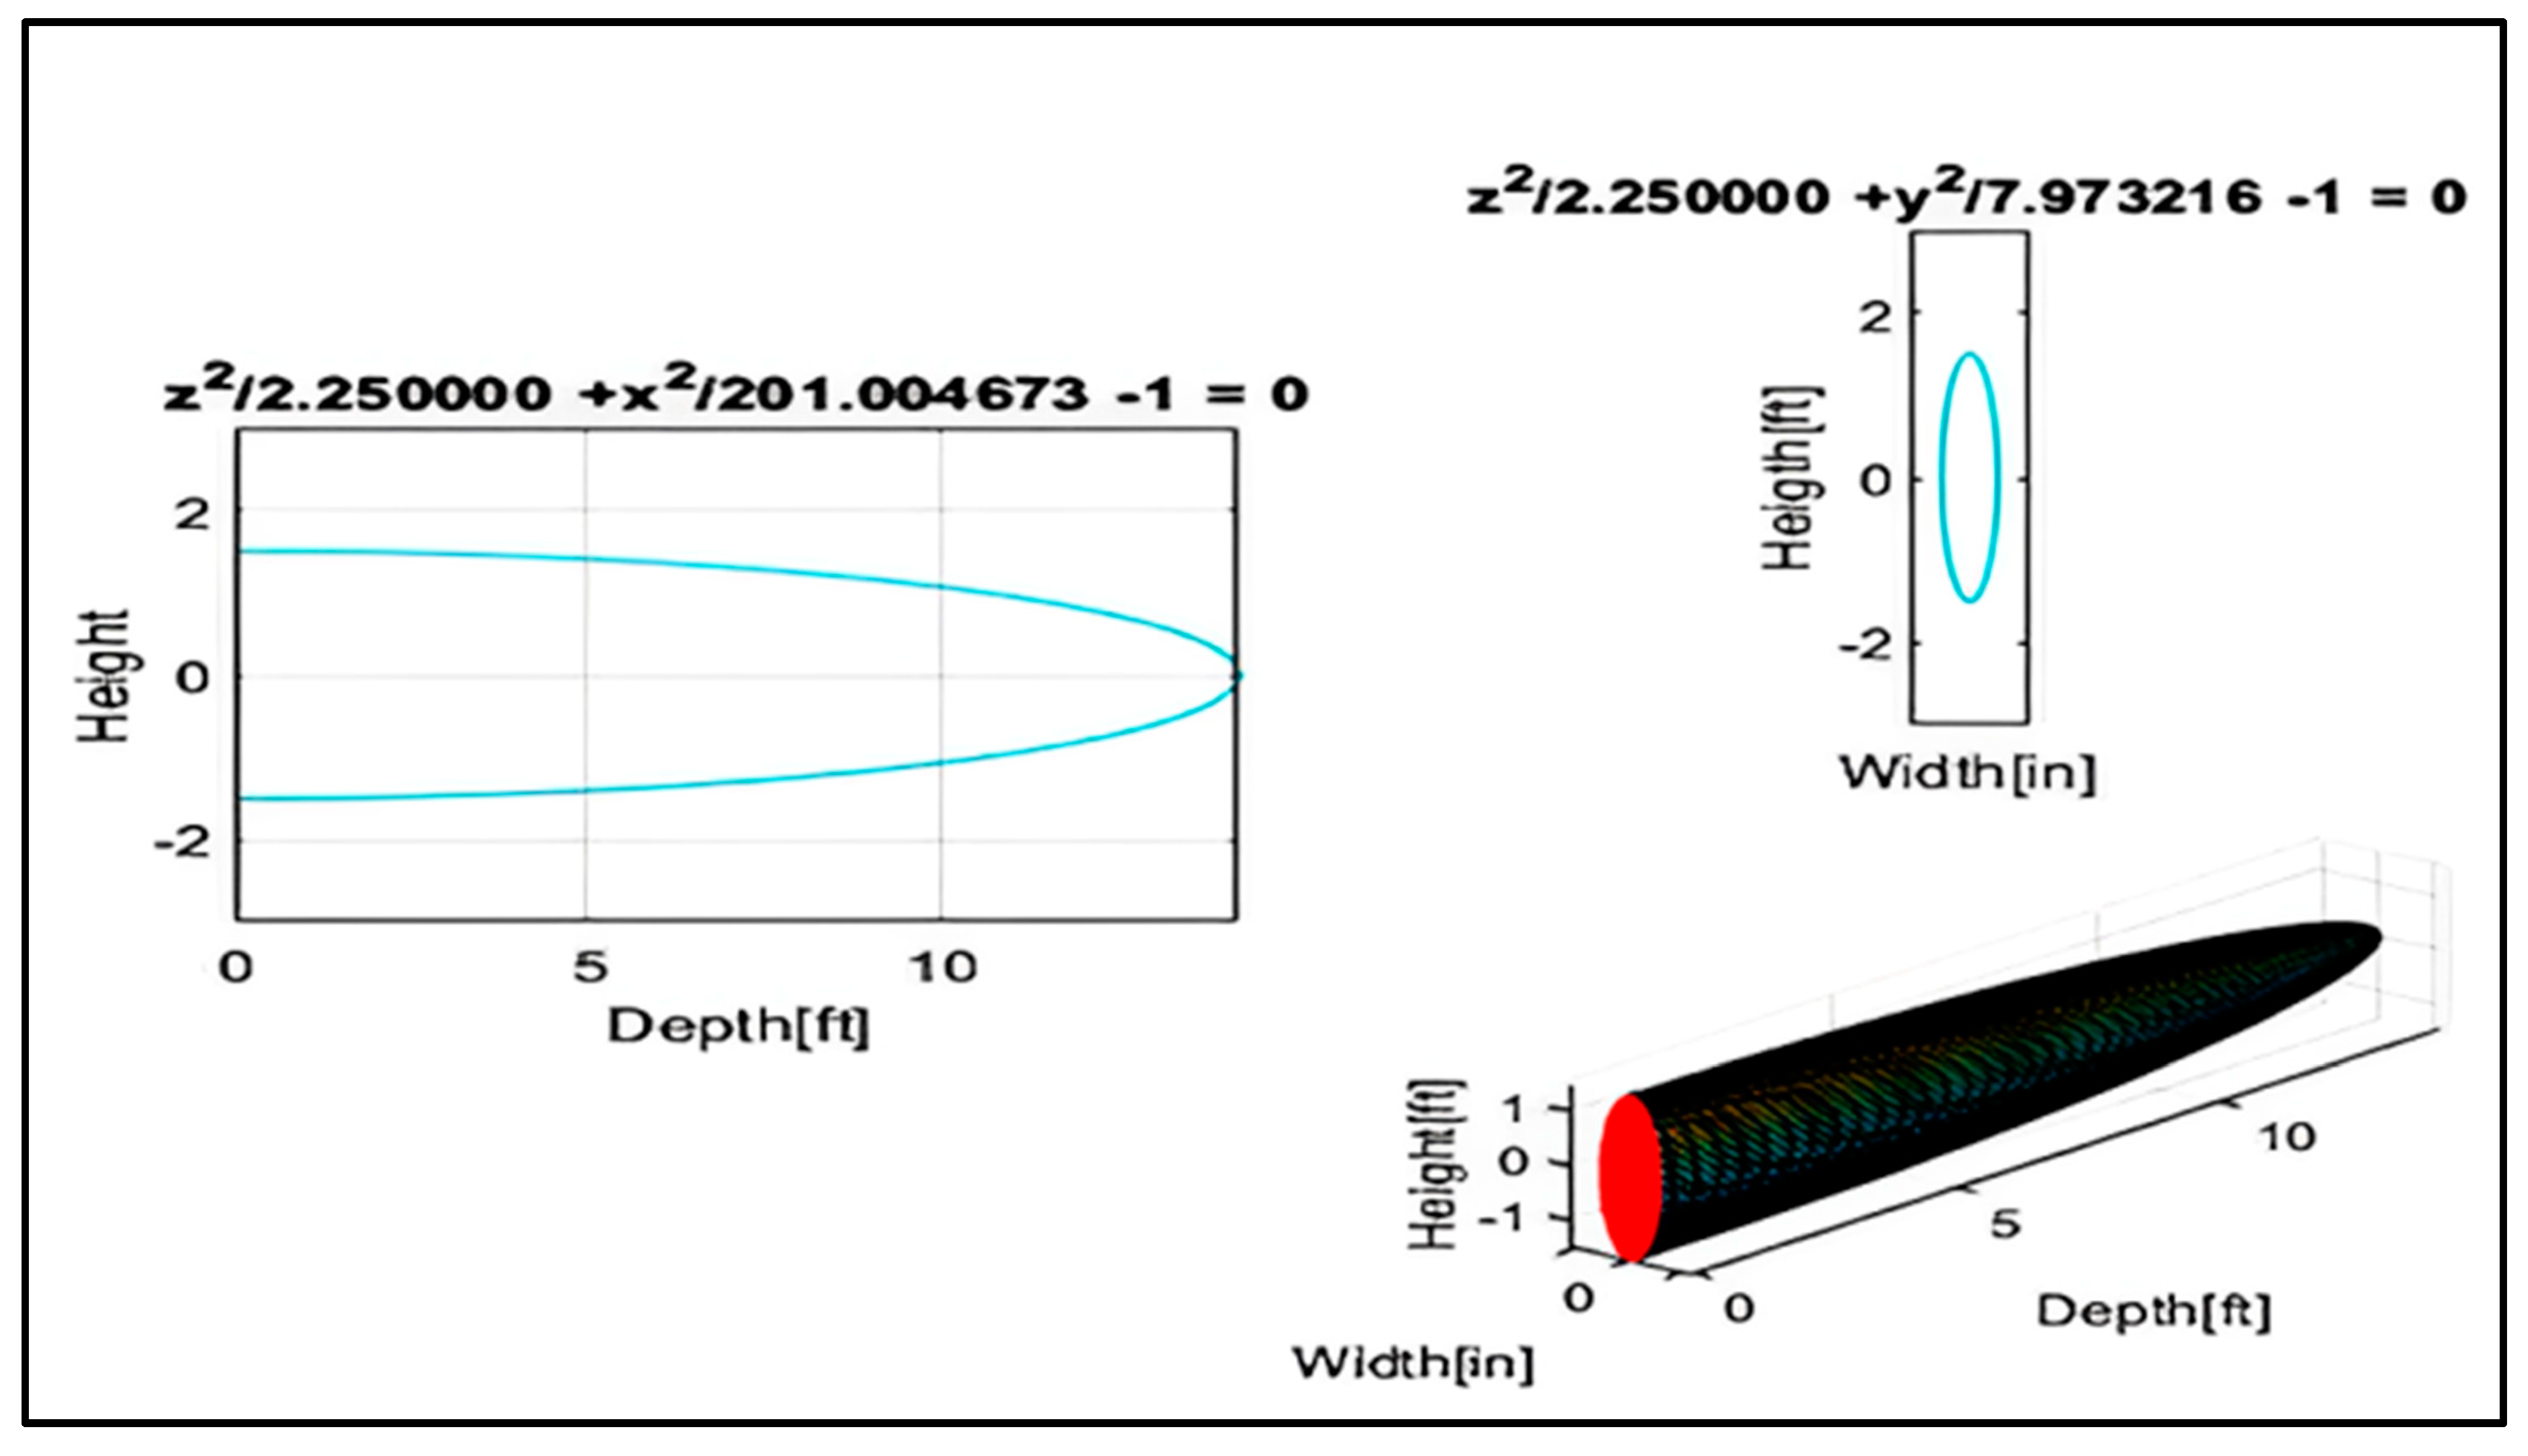
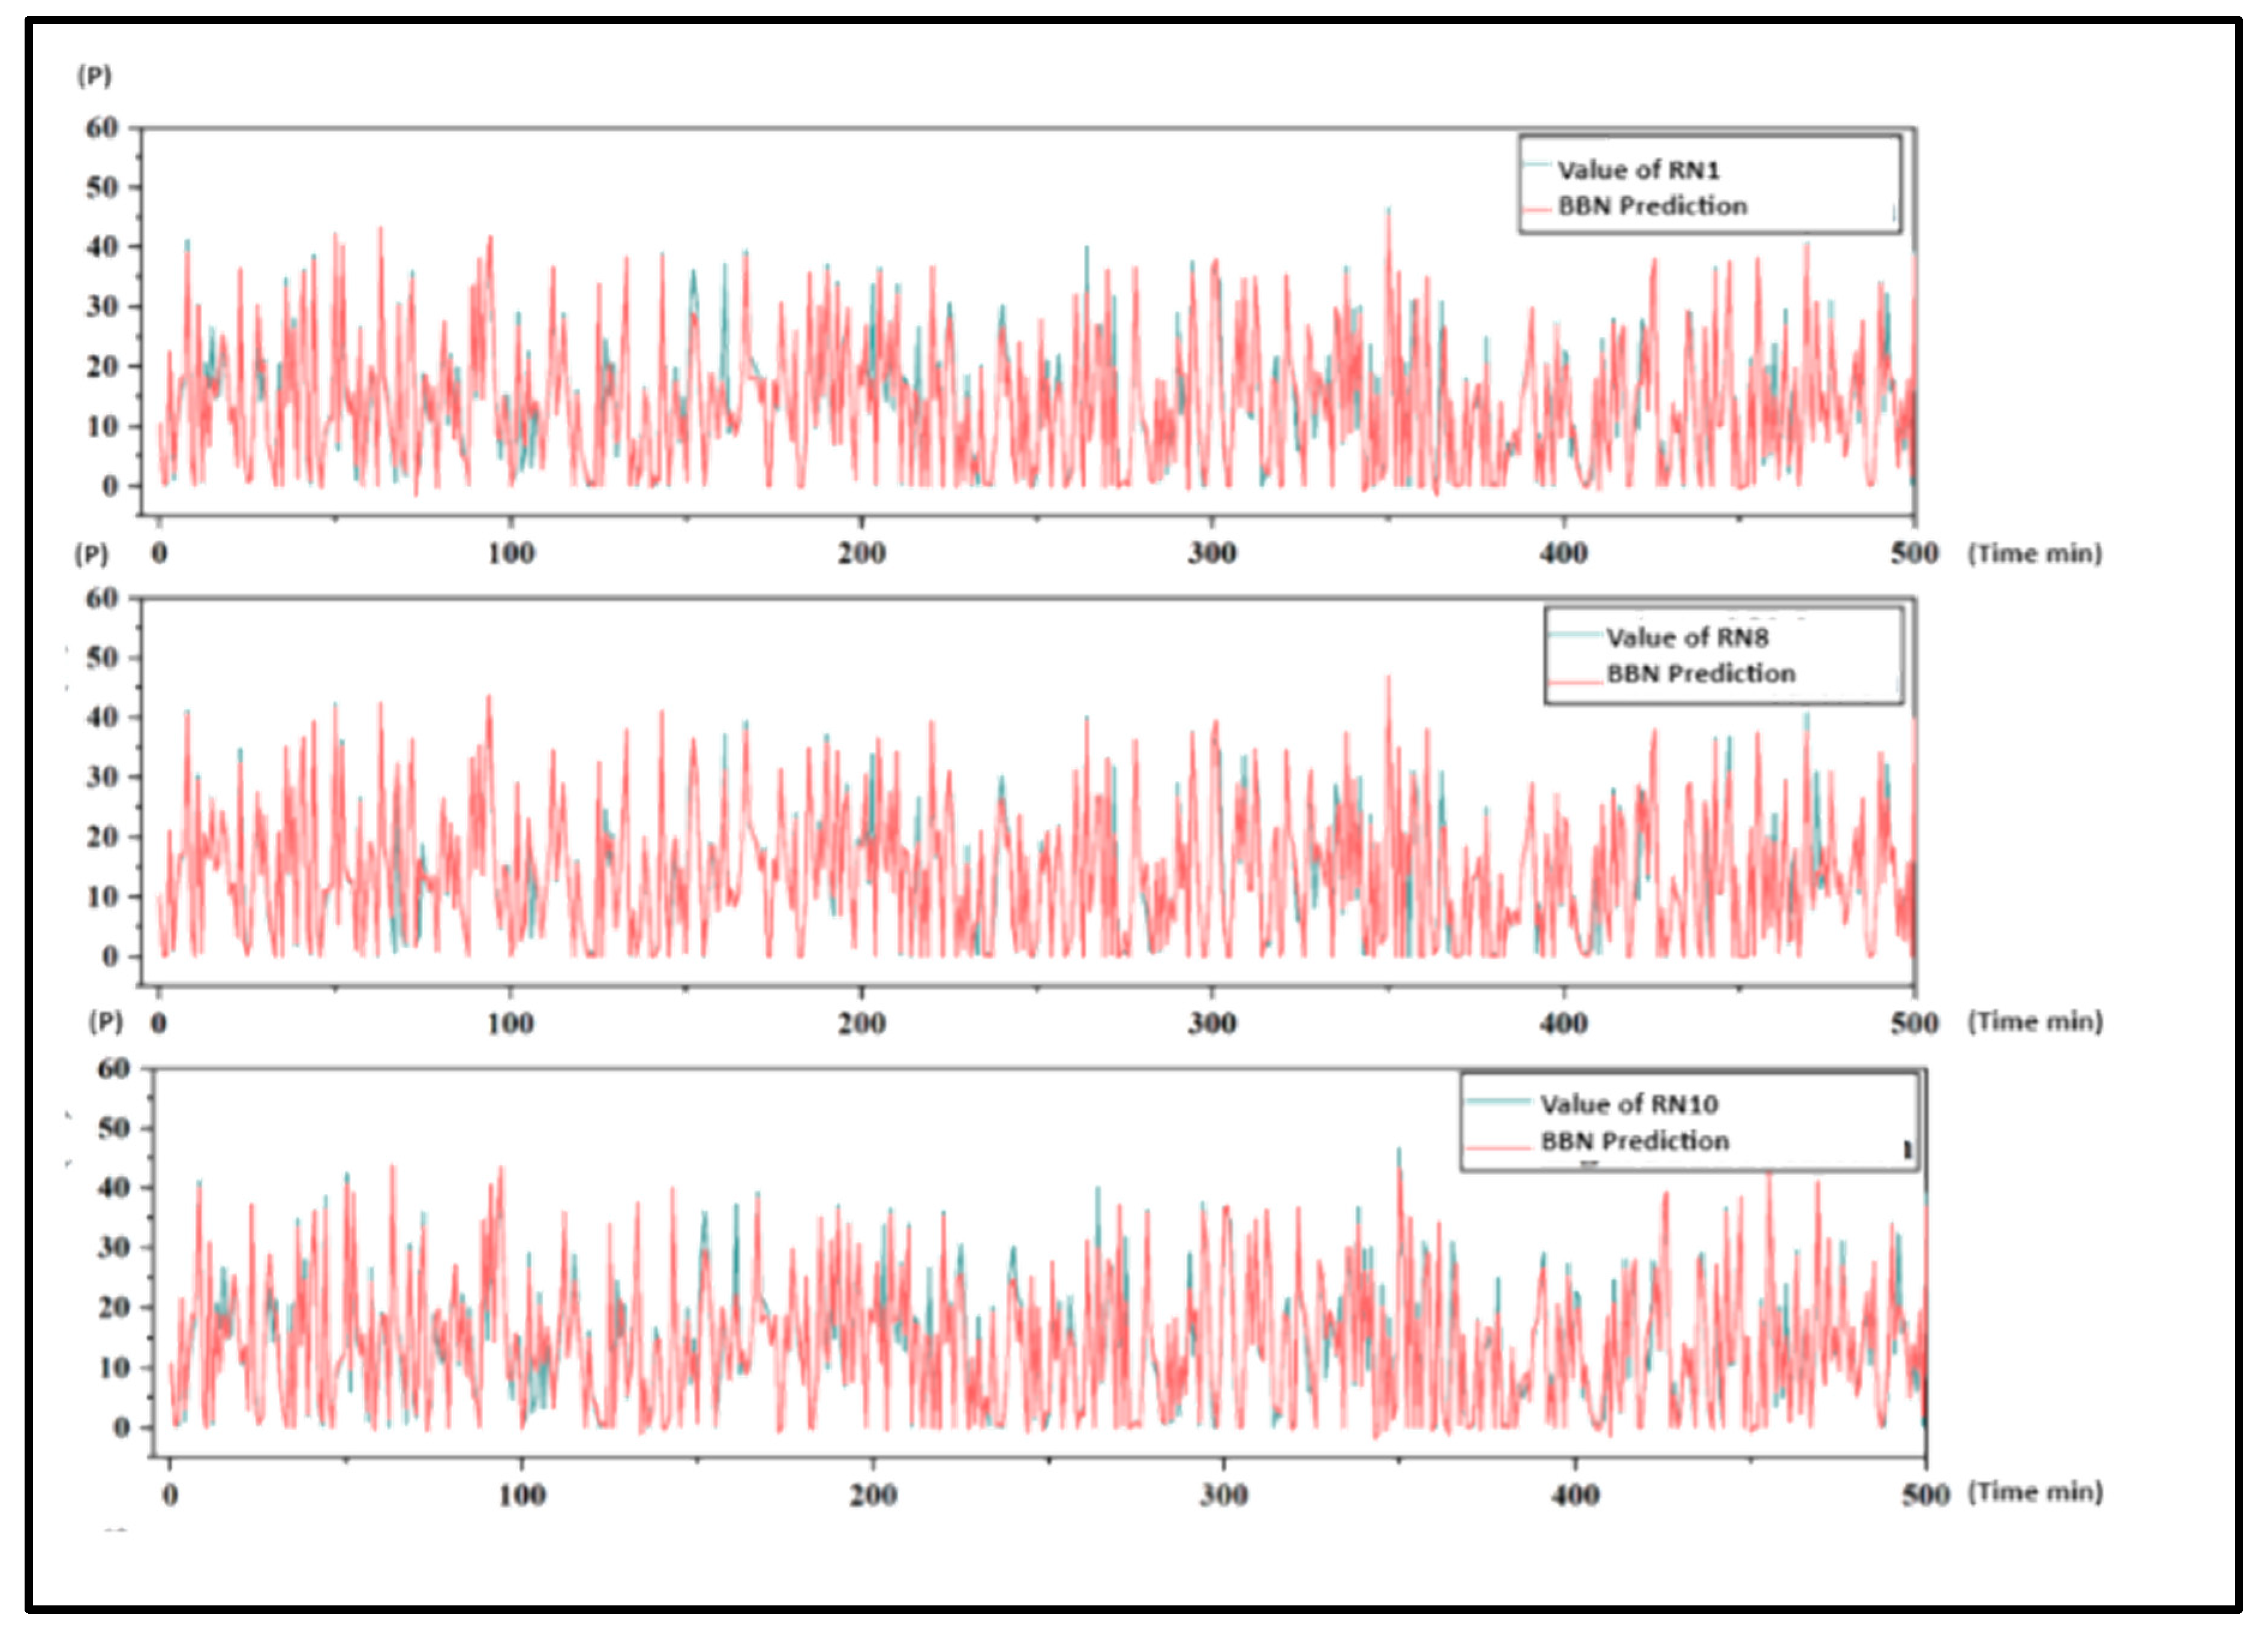
The Bayesian belief network (BBN) model for hydraulic fracturing intricately connects nodes through probability distributions, articulating the maximum likelihood of various scenarios. Non-root nodes are characterized by continuous probability distributions, while conditional probabilities govern other nodes. Given the specificity and complexity of shale gas exploitation, extensive research and fieldwork are undertaken, as are collaborations with experts to collect and analyze data. This comprehensive approach, integrating artificial intelligence, focuses on developing a Bayesian belief network (BBN) capable of modeling and real-time prediction. Particularly, the model focuses on the propagation of Pressure Wave Peaks (PWPs) within coal rock fissures during hydraulic fracturing, as illustrated in
Figure 8. The utilization of MATLAB software for modeling estimates the likelihood probability of high permeability zones and near-wellbore friction, showcasing the BBN model’s predictive capabilities in this intricate process [
24,
25,
26].
These pressure waves are pivotal in assessing the effectiveness of the fracturing process [
27]. To model PWP propagation, we utilize the following equations:
Equation (1)—original pressure wave equation:
where
represents the transient pressure loaded on the coal in kPa;
is the PWP peak in kPa;
is the PWP frequency in Hz;
is the velocity of the wave in m/s;
is the position in m; and
is the transient time in s.
Equation (2)—corrected pressure wave equation:
represents the average of the PWP that did not change during the PWP propagation period. Equation (1) represents the initial pressure wave equation, while Equation (2) corrects it by accounting for a constant offset represented as
[
18]. Additionally, we examine the synthesized wave resulting from incident and reflected waves using Equation (3)—Synthesized Wave Equation:
where
is the PWP peak of the synthesized wave;
and are the amplitudes of the incident and reflected waves, respectively; and
is the phase difference between the incident and reflected waves.
This equation helps us understand how incident and reflected waves interact constructively, providing insights into the PWP peak at the fissure end [
19].
In the context of the Bayesian belief network (BBN) model for hydraulic fracturing, nodes are interconnected using probability distributions to express the scenario likelihood. Continuous probability distributions are used for non-root nodes, while conditional probabilities are applied to other nodes. Since the model often deals with qualitative data, expert elicitation is preferred when no quantitative data is available [
20,
27,
28].
Hazard identification, fault analysis, and expert opinions contribute to constructing the Conditional Probability Table (CPT), ensuring the model’s credibility and realism [
21]. Integrating these mathematical equations into our BBN model enhances our ability to predict and effectively manage the hydraulic fracturing process.
Furthermore, the relative weight values of each node play a vital role. Root formations are compatible with each state of nodes, such as reservoir contamination, fluid efficiency, exceeding equipment loading capacity, error in the hydraulic system, near-wellbore friction, damage in the reservoir, and shortening the well’s life. The relative weight of the node varies between one and zero, expressing the value of the weight in the node and the mutual effects between the root node and the consequence node [
22,
28,
29].
To develop the hybrid Bayesian network (HBN), we utilize the fault tree model from the second section. The CPT is defined according to the location and function of nodes and their influence on the states of consequence nodes. In the BBN, nodes are categorized into pivot nodes with respect to sample sizes of root nodes, safety nodes, and consequence nodes [
22,
27,
30].
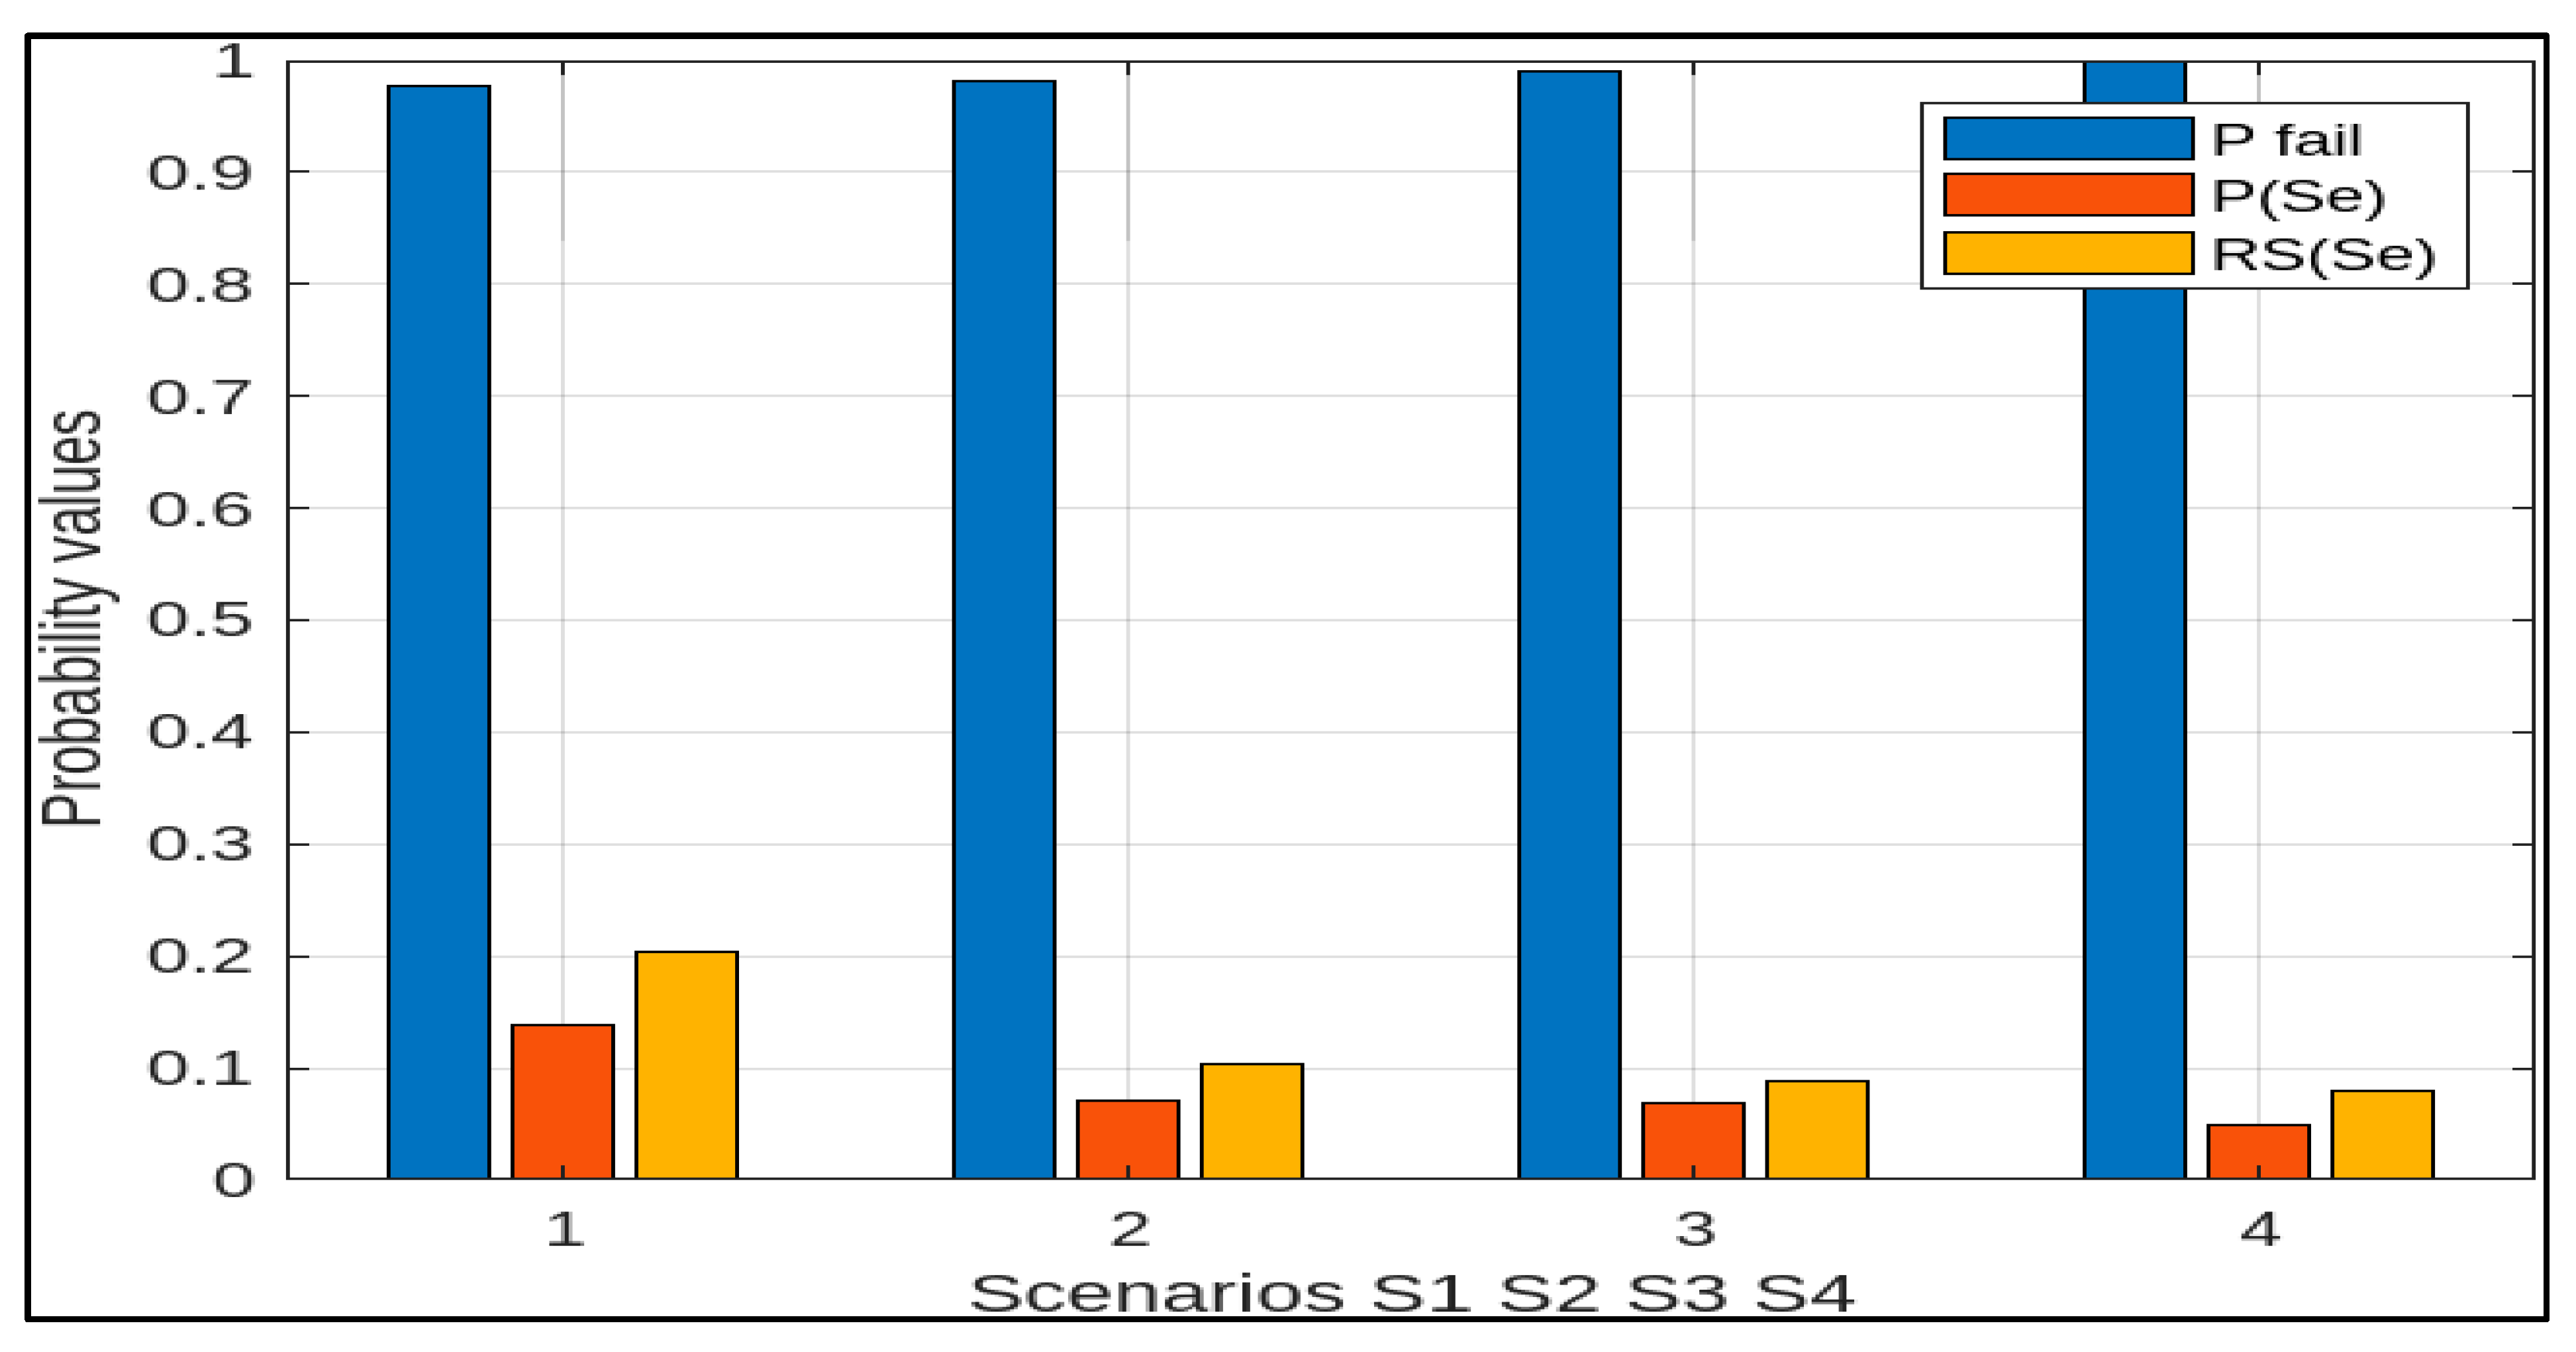
Table 2 summarizes the scenario analysis for hydraulic fracturing failure using three methods: likelihood, EBBN, and Weighted Sum Algorithm. These methods calculate the likelihood of failure scenarios related to the propagation of Pressure Wave Peaks (PWPs), providing valuable insights for risk management and decision-making [
19,
20,
21,
22]. These methods are essential for risk assessment in hydraulic fracturing.


