Abstract
In this study, the surface water salinity of Mentor Marsh, located in Northern Ohio, USA, was monitored for 3 years by establishing 10 monitoring stations, whereas sporadic surface water salinity data were recorded at more than 30 locations in the marsh for 5 years. In addition, eight additional monitoring stations were established for recording the soil salinity at various temporal scales, whereas spatially distributed soil salinity was measured across the marsh in more than 500 locations to develop the salinity mapping in the soil using the Kriging-Gaussian method. Our analysis suggested that the water salinity in the winter was generally higher than in the summer. While the majority of the sites reported higher soil salinity characterized by high variability during the winter season, some sites reported a higher soil salinity in summer with less variability. The analysis revealed that the salt used on the road for the deicing purpose during the snowfall period was the primary reason for the increase in the salinity concentration in water in the western basin of Mentor Marsh, whereas the salt fill sites and brine well were primarily responsible for the higher salinity concentration in the eastern basin. Also, the drainage from the Morton Salt Company was a contributing factor to the sudden spike in some of the stations of the eastern basin. Both the surface water and soil salinity were relatively higher in the eastern basin than in the western basin. Apparently, salinity from the brine well field and salt fill sites seem to be more considerable than the road salt.
1. Introduction
Wetland salinity has been one of the key environmental concerns across the world [1] as it has various detrimental effects on the ecosystem including habitat losses, poor water quality, and invasive plant growth, etc. [2]. The salinity has a significant impact on the water quality of water bodies such as rivers, wetlands, and the sea [3,4]. Wetland salinity is primarily caused due to sea-level rise [5,6,7], vegetation clearance [8,9], groundwater salinization [10,11,12], channelization [13], hydrologic alteration [14,15], and road salt accumulation [16,17,18,19]. In addition, there are reported cases of increased surface water salinity due to the intrusion of elevated saline water [20], water management, groundwater pumping, and drought [21]. Readers can refer to the article by [22], who have summarized the various causes of the increased water salinity thoroughly.
The increase in water salinity has a direct linkage to soil salinity. For example, when the long-term stagnant water evaporates from the marsh, the surplus salts eventually contribute to soil salinity. Similarly, soil salinization may occur when soluble salts, which are not flushed easily, are retained on the surface leading to excessive salts. The increase in soil salinity and its distribution depends upon various factors including rainfall, runoff mechanism, and the frequency and the method of irrigation [23]. In general, salinity leaching depends on many factors including a water table, sodium content, high clay content, etc. [24]. When the leaching of the salinity is limited, salts can move upward via capillary action. There could be several causes of increased soil salinity. For example, weathering of the rock, saline irrigation water [25], groundwater [1], windborne salts, use of lime and gypsum in the soil, use of sewage sludge/treated sewage effluents from wastewater treatment plants [26], and abandoning of industrial brine onto the soil [27] are some of the causes of increased salinity in the soil. Some other reasons for increased soil salinity are the overuse of fertilizers [28], industrial plants [29], and the subsurface injection of mining operations, etc.
Soil salinization is expected to impact approximately 50% of all arable land by 2050 [30] bringing various adverse consequences. For example, it will cause significant degradation in erosion, hydrological [31], and biological processes [32]. Moreover, high salinity levels in the soil can cause the loss of agricultural production [33], and environmental health [34] leading to social, ecological, and economic impacts [35].
Researchers have also reported the toxicity due to deicing salt on aquatic invertebrates [36] including the lethal impact on different types of macroinvertebrates [36]. Moreover, road salt can increase groundwater salinization [37], which might seriously inhibit its domestic, agricultural, and industrial uses. Past research indicates that more than 21 million tons of road salts are regularly applied during the winter season on the roads of Northern America for deicing purposes in order to provide safe roadways [38]. As the road salt infiltrates into the marshland, it might bring long-term effects on marsh chemistry and alter vegetation characteristics [39].
Salinity limits the biological uptake of water and nutrients impeding the necessary physiological functions related to plant growth and development [40]. For example, due to excessive soluble salts, the osmotic phenomenon in the root zone [41] and plants’ physiological processes and metabolic processes will be altered. Consequently, the native plants can be replaced by more salt-tolerant invasive species such as Phragmites australis. Such growth of Phragmites australis due to increased salinity has been widely documented in Mentor Marsh in eastern Ohio, USA. The indigenous plants including the swamp forest slowly started dying and a hydrophilic perennial plant such as Phragmites australis started growing in saline conditions [42,43]. This study will examine the salinity in the eastern and western basins of the marsh as both basins have a varying degree of the growth of Phragmites australis. Recognizing the sources of salinity and investigating its variation both in terms of soil and water salinity is crucial for the restoration of the marsh. Therefore, in this study, we recorded water and soil salinity for a few years across the marsh and explored the interrelationship of the water and soil salinity variation.
We believe this is one of the limited studies which presents the rigorously recorded surface water salinity as well as soil salinity data to investigate the salinity variability and the possible cause of increased salinity in two basins. While the vast majority of the existing salinity research in Northern America has focused on the salinity of the coastal marshes due to the tidal influence, in this research, we have presented a case study of the wetland marsh primarily due to road salt and the salt fill sites.
2. Methodology
2.1. Study Area
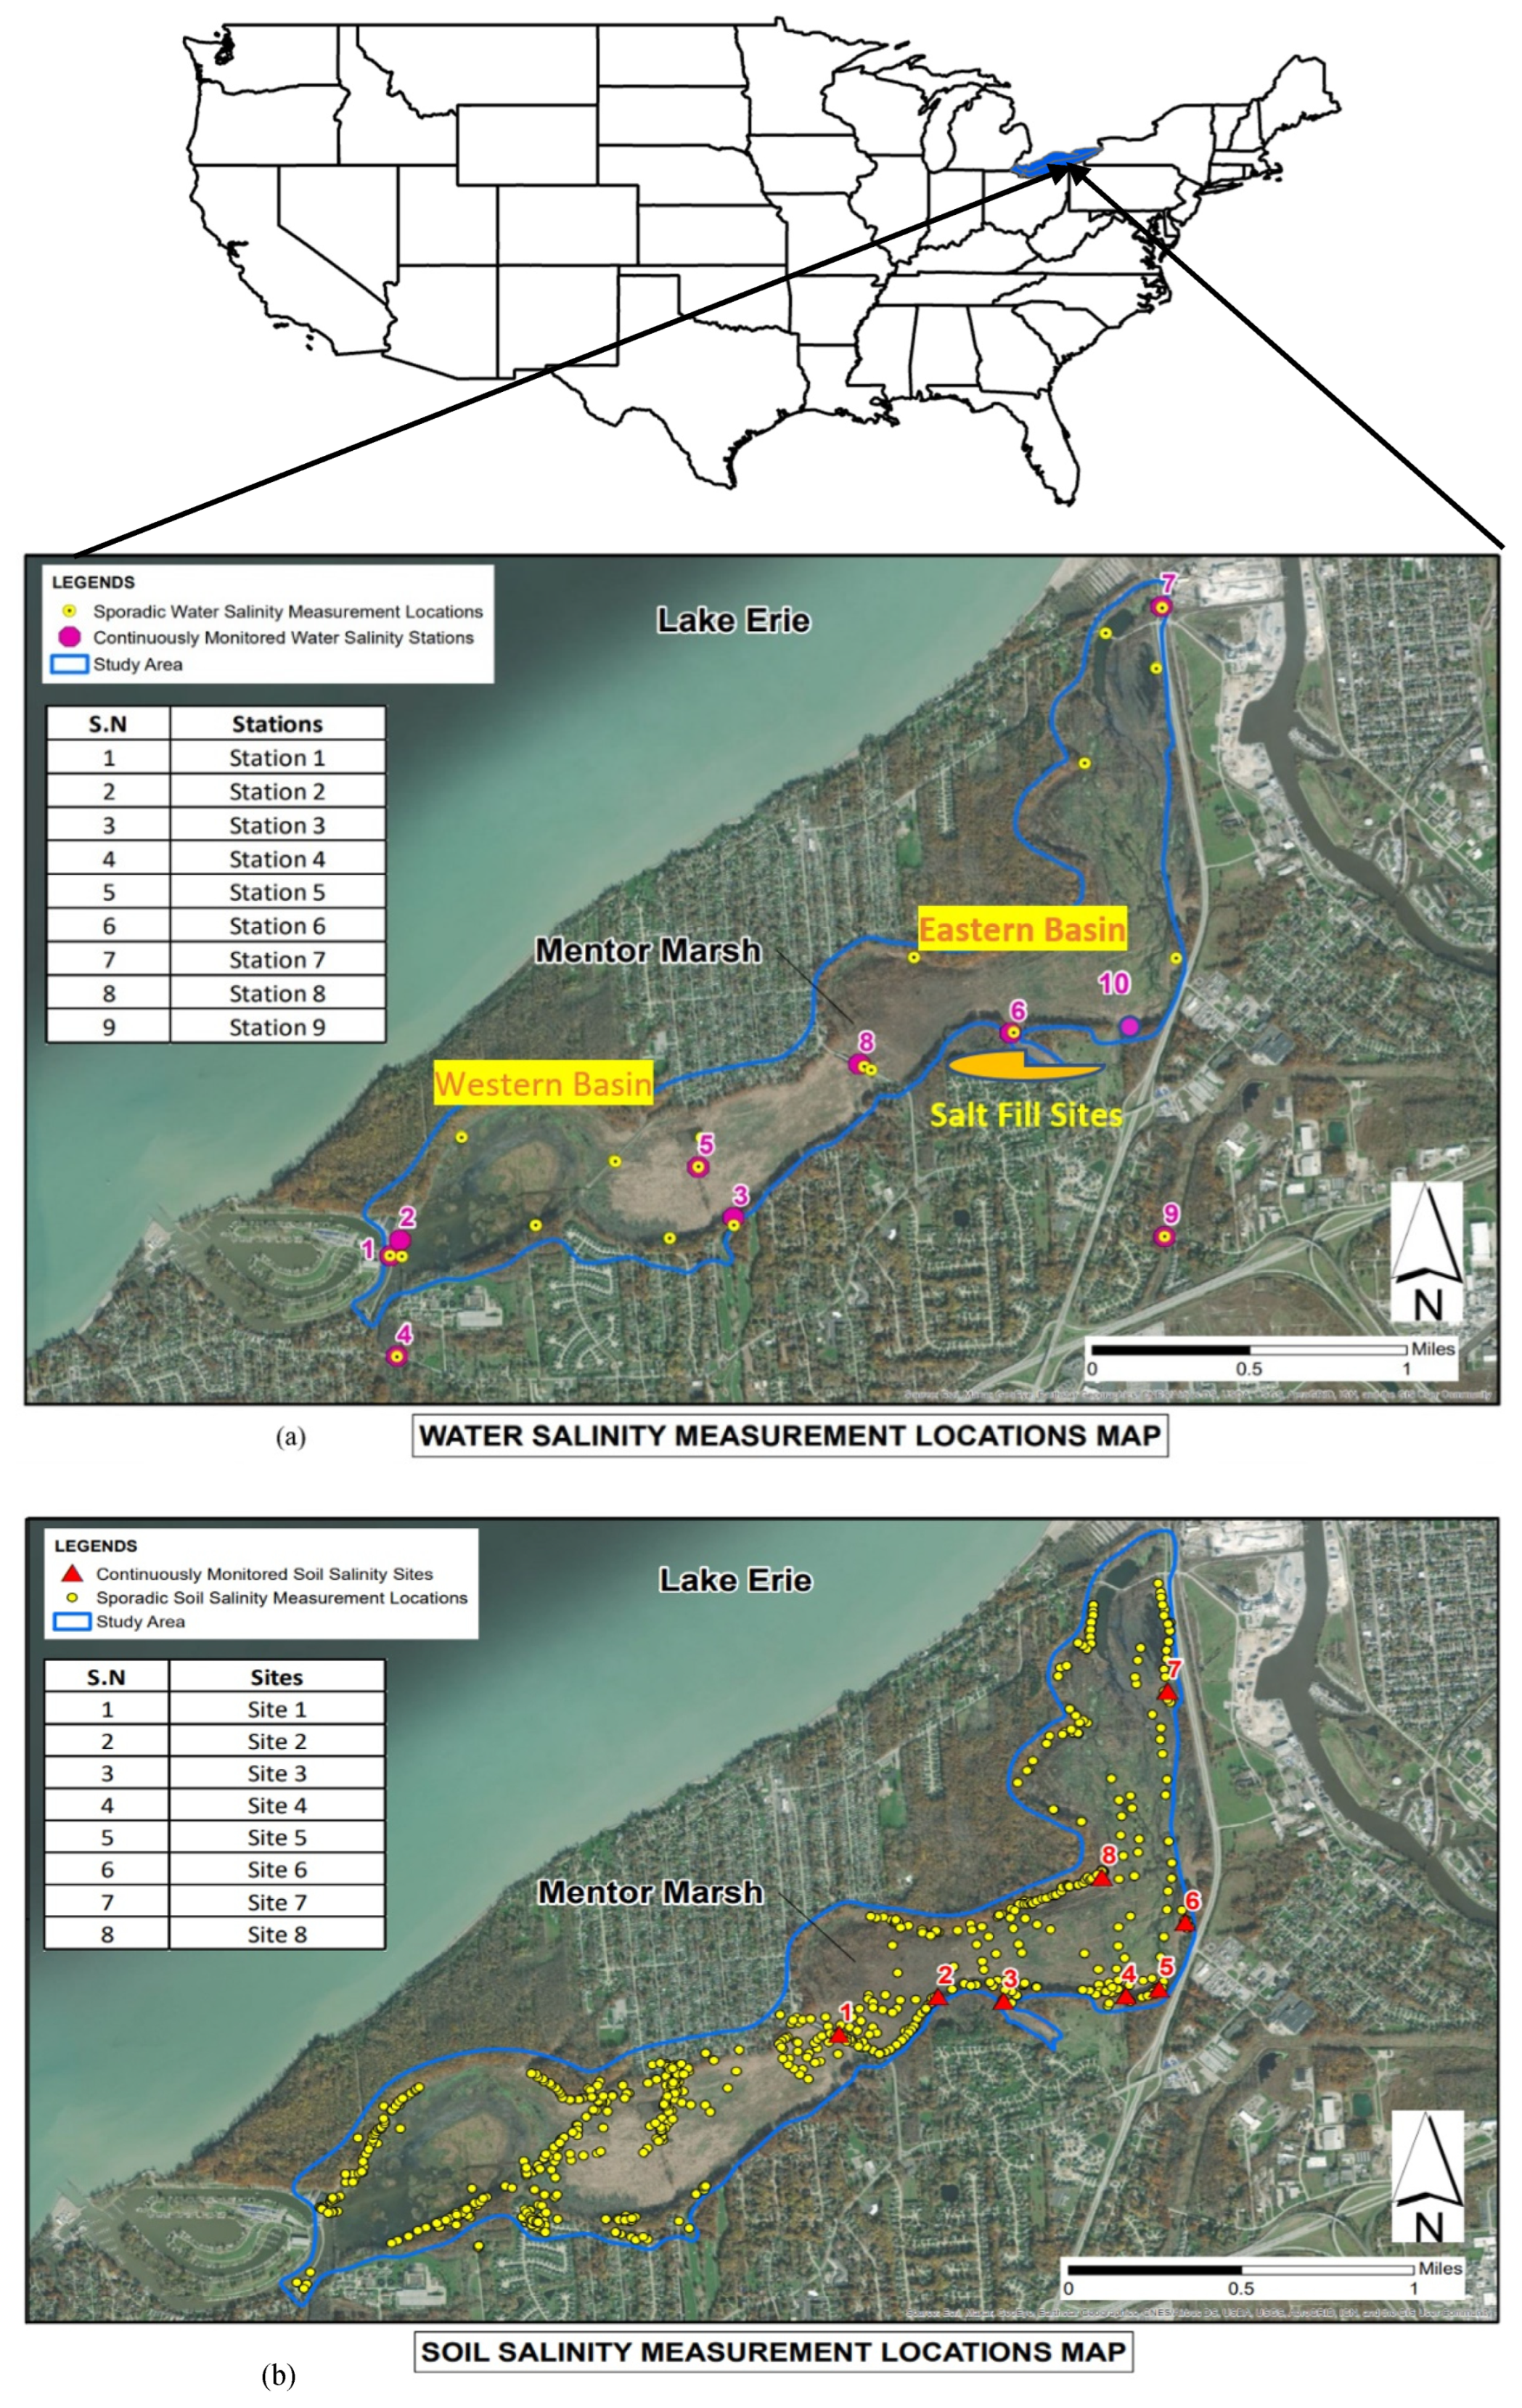
The study area is located within the Mentor Marsh watershed area, in Lake County, Ohio, near the southern shore of Lake Erie and extending between latitudes 41°43′55″ N to 41°45′15″ N and longitudes 81°18′34″ W to 81°17′22″ W (Figure 1). Likewise, the elevation of the watershed varies from 52.42 m to 125.27 m above mean sea level. This region experiences an annual average temperature of 10.5 °C with an annual average precipitation of 990 mm. The average annual snowfall during the winter is 91.44 cm. The Mentor Marsh watershed is mainly divided into eastern and western basins.
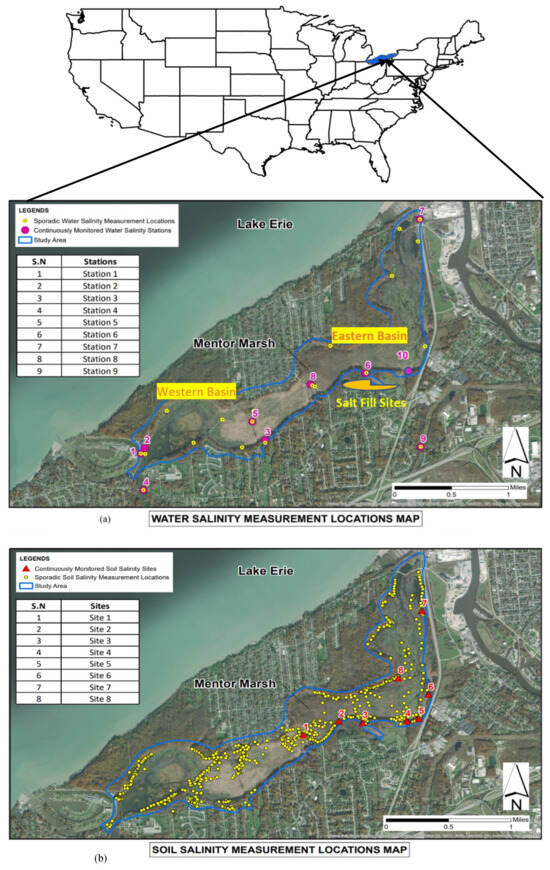
Figure 1.
Study area map showing (a) locations for continuously monitored water salinity (pink circle) and sporadic water salinity data collection (yellow circle), (b) location for continuously monitored stations (red triangle) and sporadic soil salinity recording location (yellow circle).
The eastern basin of the marsh receives the flow and salinity from Blackbrook Creek and finally drains to the Grand River, whereas the western basin of the marsh receives the flow and salinity from Marsh Creek and flows towards Lake Erie. The soil in this area is Carlisle Muck (Cg), a type of hydric soil covering an area of 800 acres, which is very poorly drained organic soil. As the water table becomes high for this type of soil, the surface is generally ponded for a long period. It is the largest marsh in northeast Ohio, which was considered to be the first National Natural Landmark in 1966 and became the first state nature preserve on the Great Lakes’ shoreline in 1971 [44].
Before 1959, the marsh attracted tourists for sightseeing and bird watching, contributing to the economy. However, the unprecedented increase in salinity intrusion occurred at the beginning of the 1960s due to various anthropogenic activities including brine well construction, salt fill deposition, etc., leading to the severe decline of the native wetland vegetation. As a result, it opened the conducive environment for the growth of Phragmites australis leading to the significant outbursts of wildfires. Thirteen fire events were reported in Mentor Marsh since 1979 with the main fire event in 2003 [39]. Therefore, it has been a serious concern for the stakeholders to restore Mentor Marsh to an acceptable level of environmental conditions that can highly contribute to future economic growth via eco-tourism related to bird watching, hiking, and travel [45].
The major cause of salinity in Mentor Marsh was due to salt fill sites located near Blackbrook, which were constructed on private property in order to dump the poor-grade salt residue produced by the Fairport Harbor salt mine. A significant increase in the salinity concentration was detected, especially when the runoff passes through the salt fill sites. The runoff passing over the salt fill sites continued to carry the salinity in Mentor Marsh for several years resulting in catastrophic disturbances in the marsh ecosystem [46], which was rerouted later after serious concern from the public. In addition, windblown salt was noticed for the first time in early 1959 resulting in the death of the plants [47]. This was further explored and assumed that the Morton Salt Company was one of the sources of salinity due to windblown salt [39].
Later, several scientists conducted a study [46,47] and reported a higher concentration of chloride. Another cause of salt pollution on the marsh was considered to be from Diamond Shamrock’s Alkali facility. The facility constructed its brine well fields within and beyond Mentor Marsh. While they carried on the mining process, the company decided to dump the brine near the facility due to its weak strength and poor industrial value. Consequently, it entered the marsh through Blackbrook Creek.
Regardless, the earlier studies reported that salt fill sites, which were developed due to the dumping of the salt residue from the Morton Salt Company, were one of the significant sources of salinity in Mentor Marsh.
2.2. Monitoring Sites for Water Salinity
The water salinity was measured both in the eastern as well as western basins of Mentor Marsh (Figure 1a). For this study, salinity is reported as a measure of electrical conductivity (µs/cm), which is converted into mg/L. Several monitoring stations were established both in the eastern and western basins (Figure 1). For this study, data from ten stations including five stations in the eastern and another five stations in the western basin (Figure 1) were analyzed for 3 years (March 2018 to July 2021). Even though more than 12 stations were established in Mentor Marsh, only 10 stations were selected for the analysis as these stations had continuous sets of data records, and the stations were distributed to reveal the salinity variation across the marsh. The other two stations were established later to further investigate the salinity and did not have enough data for the analysis. Also, the stations were selected based on the consultation with the local stakeholders working for the restoration of the marsh.
In this study, the LTC Levelogger Junior was utilized to record the stage and conductivity, whereas the Barologger was used for barometric correction of the Levelogger readings of water depth.
The water salinity was recorded in two ways, (i) by recording the salinity in a sporadic location which was taken randomly multiple times over the study period of three years; and (ii) by measuring the salinity by establishing 10 monitoring stations.
Since monitoring stations were within 10 miles of proximity, the Barologger device was installed only at one station (Station 9). These sites represent the marsh to a great extent for exploring the variability of water salinity. The stations were established in the marsh based on the convenience of the site accessibility for monitoring the stations and data download. In this study, four monitoring stations (Station 1 to Station 5) were established and monitored to analyze the salinity within the western side of Marsh Creek subwatersheds, whereas Station 6 to Station 10 were established and monitored in the eastern basin to quantify the salinity loading in the eastern basin.
The spatial locations of all these stations are shown in Figure 1. Additionally, one-time water salinity was measured across the various stations both in the eastern and western basins to develop a contour of water salinity (Figure 1). The salinity in practical salinity units (PSU) was computed using a Technical Paper [48], which was later converted into parts per thousand (ppt) by multiplying the PSU by a factor of 1.004715.
2.3. Monitoring Sites for Soil Salinity
In order to identify the critical locations for measuring high soil salinity in the marsh basin, a preliminary survey was conducted in late 2018 by a team of faculty and experts from various stakeholders including the City of Mentor, Lake County Soil and Water Conservation District, etc., to establish monitoring sites. Several factors that are responsible for salinity intrusion in the marsh basin, including possible spillage of salinity by brine wells, the proximity of the Morton Salt Company and salt fill site, and anthropogenic activities, etc., were considered for the installation of the soil sensor equipment at the sites. Altogether, nine monitoring locations were identified as the most suitable sites for the installation of soil sensors. The study area and soil sensor probe locations are presented in Figure 1b.
Soil salinity was also measured in two ways. First, we established nine monitoring stations in the eastern basin to record both the temporal and spatial variability of the soil salinity. Secondly, we measured soil salinity approximately at (1.5 ft depth) across the entire marsh using a hydra probe to see the spatial variability of the soil salinity both in the eastern and western basins. The continuous variability of the soil salinity was observed in the eastern basin by establishing nine monitoring stations.
The monitoring sites to detect temporal variability in soil salinity were only established in the eastern basin partly because we did not anticipate significant soil salinity in the western section as the phragmites growth was very insignificant in the western section, and mainly because the salt fill sites were located in the eastern section.
The spectrum technology SMEC-300 soil sensor was used to measure the EC as it is strongly correlated to the salinity of the soil solution. In addition to electrical conductivity, the sensor can measure volumetric water content (VWC) and temperature with reasonable accuracy.
Since we wanted to record the average soil salinity across the marsh, the HydraGo probe was frequently used to collect a large number of sporadic data for soil electrical conductivity, soil moisture, and dielectric permittivity. As this probe connects with a smartphone via Bluetooth, all the soil measurement data along with the date and GPS locations were saved and transferred electronically. Finally, the data retrieved from the probe and loggers were analyzed using various statistical tools including the Kriging-Gaussian method. The Kriging-Gaussian process is an interpolation method based on prior covariances suggested by a scientist named Krige [49,50]. First, the kriging distances were used to determine the correlation among the points. In the next step, the covariances or semi-variances were computed among the sample points and between the sample points. Finally, the covariances were used to calculate the weight, which was accomplished using ArcGIS.
3. Results and Discussions
3.1. Water Salinity
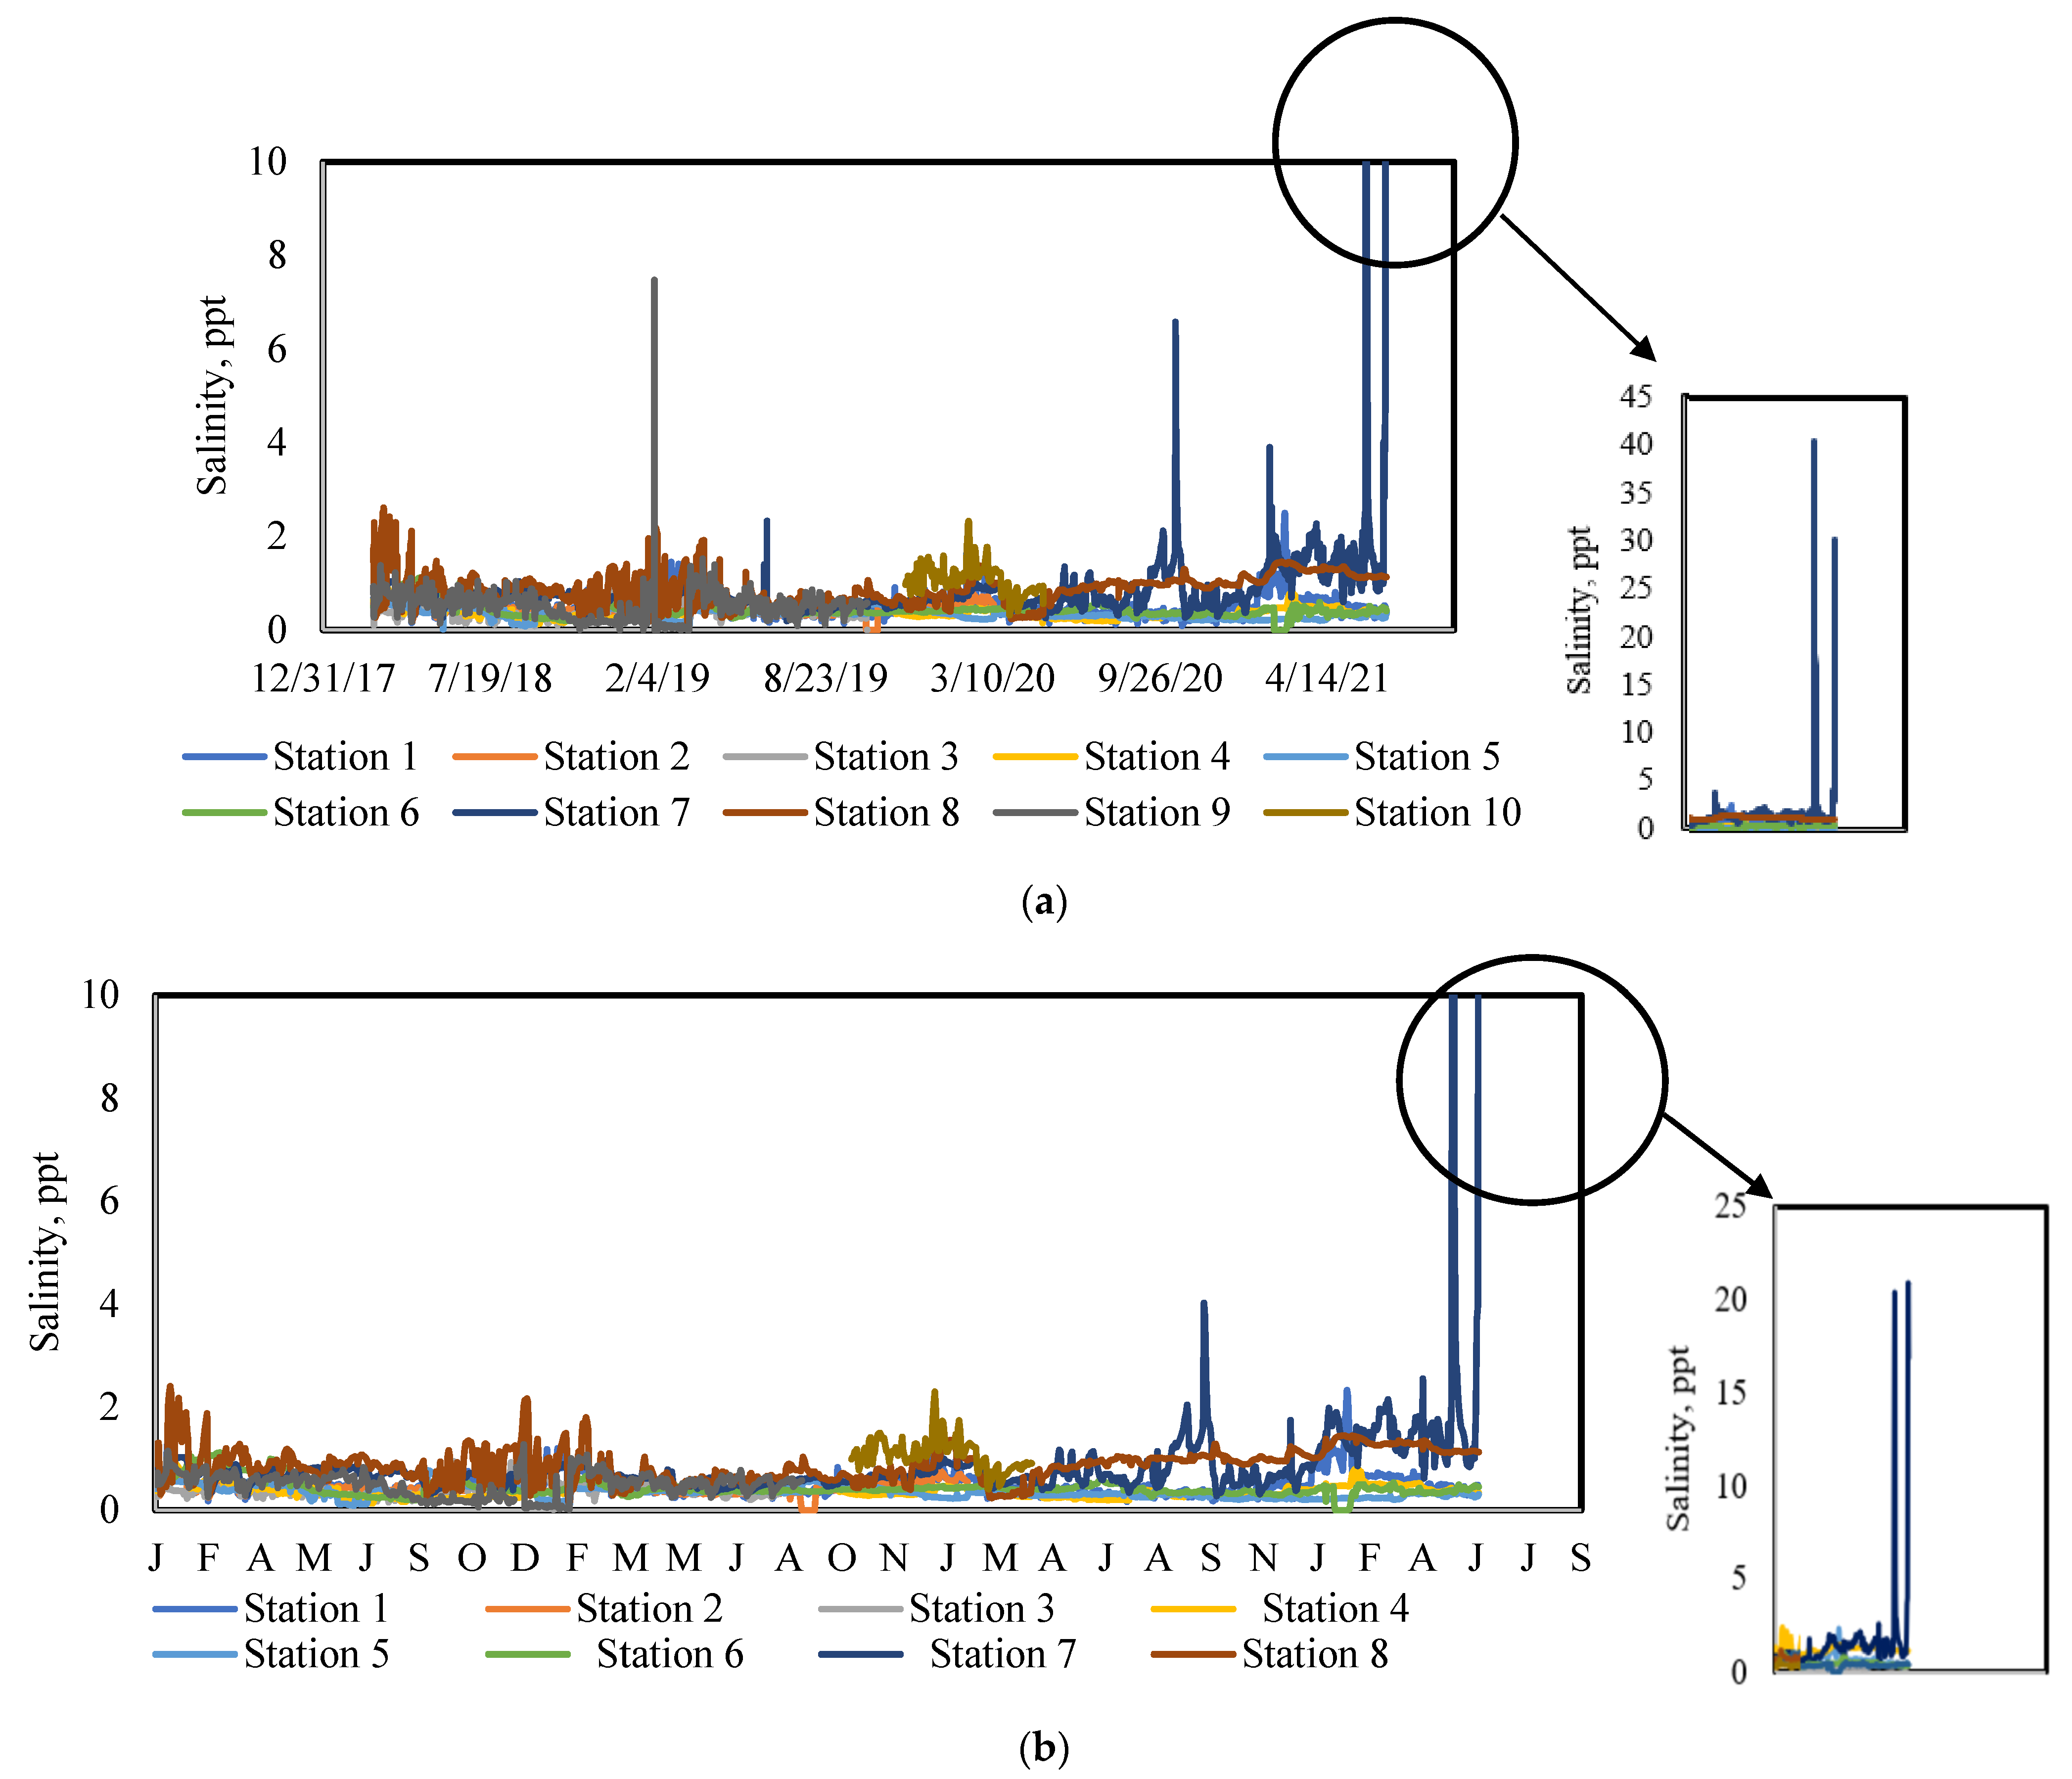
The western basin comprises Station 1 to Station 5. The salinity at all these stations in the western basin has been reported in an hourly time series (Figure 2a). As expected, the salinity level at all these stations varied significantly on the hourly scale, varying from 0.02 ppt (Station 5) to 2.5 ppt (Station 1). The significant variations in the salinity could be due to various reasons including the variation in the water level, windblown salt [39,47], etc. Moreover, the salinity variation was examined on a daily and monthly scale. The time series plotting of the salinity variation on a daily scale across the western basin is illustrated in Figure 2b. Presumably, the salinity variability on the daily scale is less than that of the hourly scale, which is not surprising as the salinity at a high temporal resolution is expected to vary significantly.
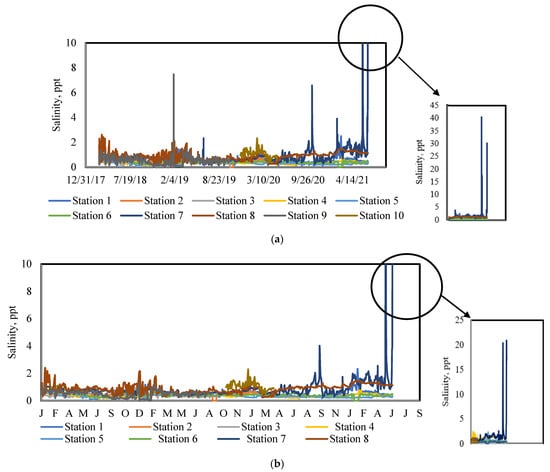
Figure 2.
Time-series plot of observed salinity at four monitoring sites on an hourly (a) and daily scale (b). The stations from 1 to 5 are in the western basin, and the stations from 6 to 10 are in the eastern basin. The letter “J” refers January, “F” refers February and so on.
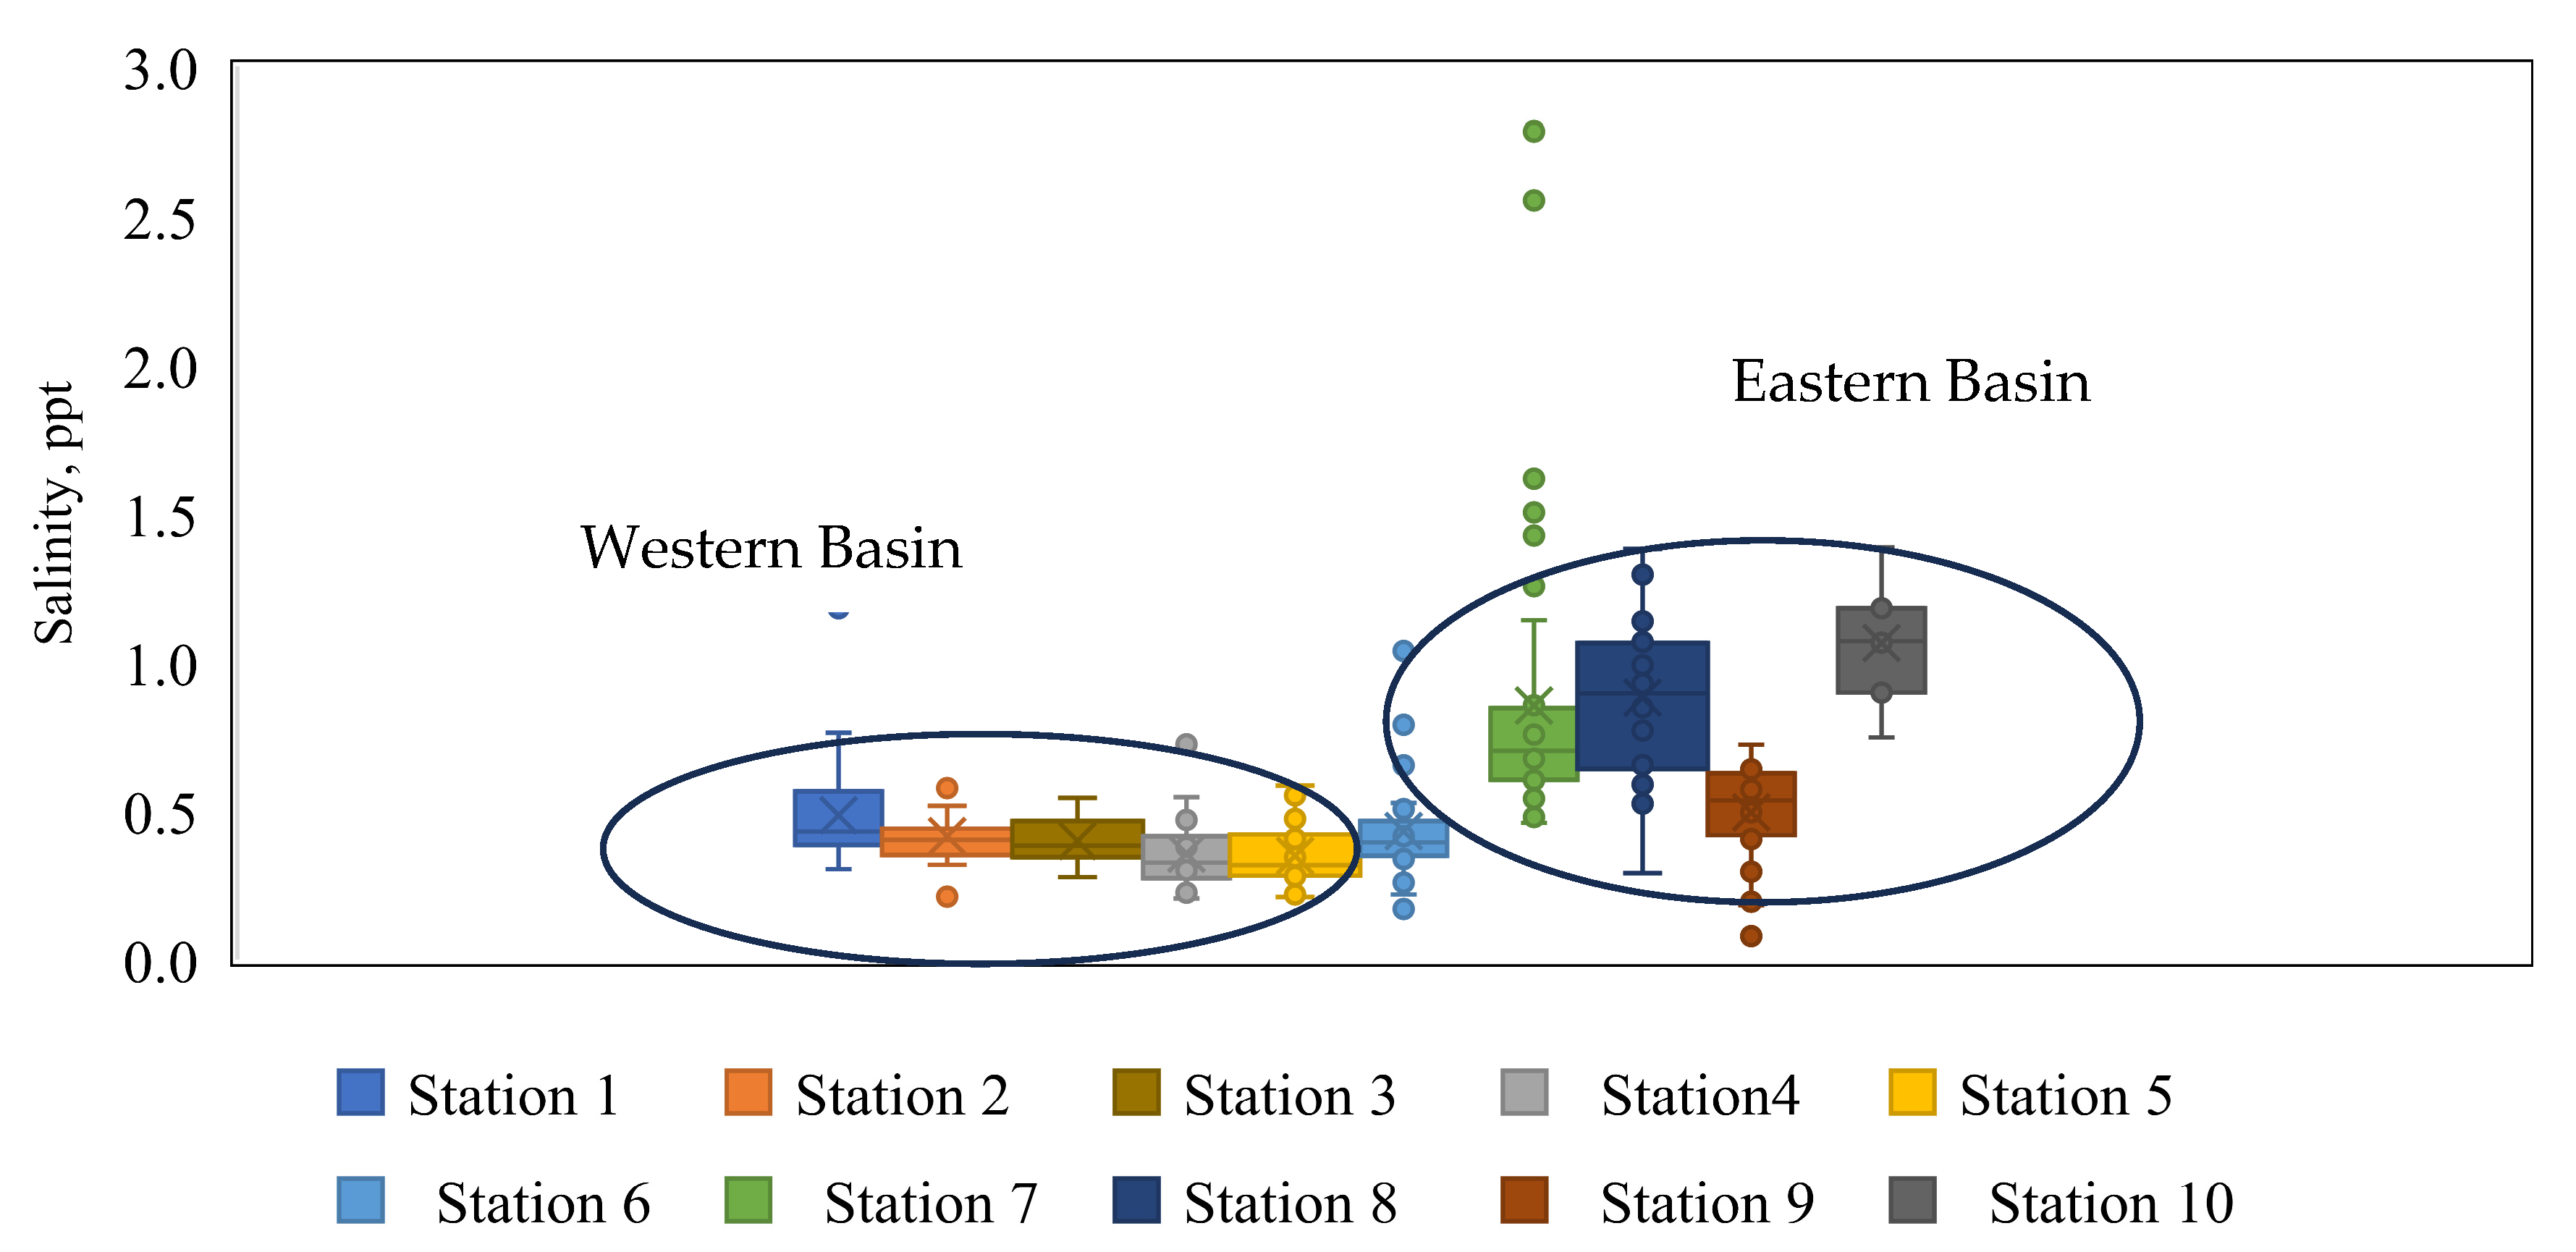
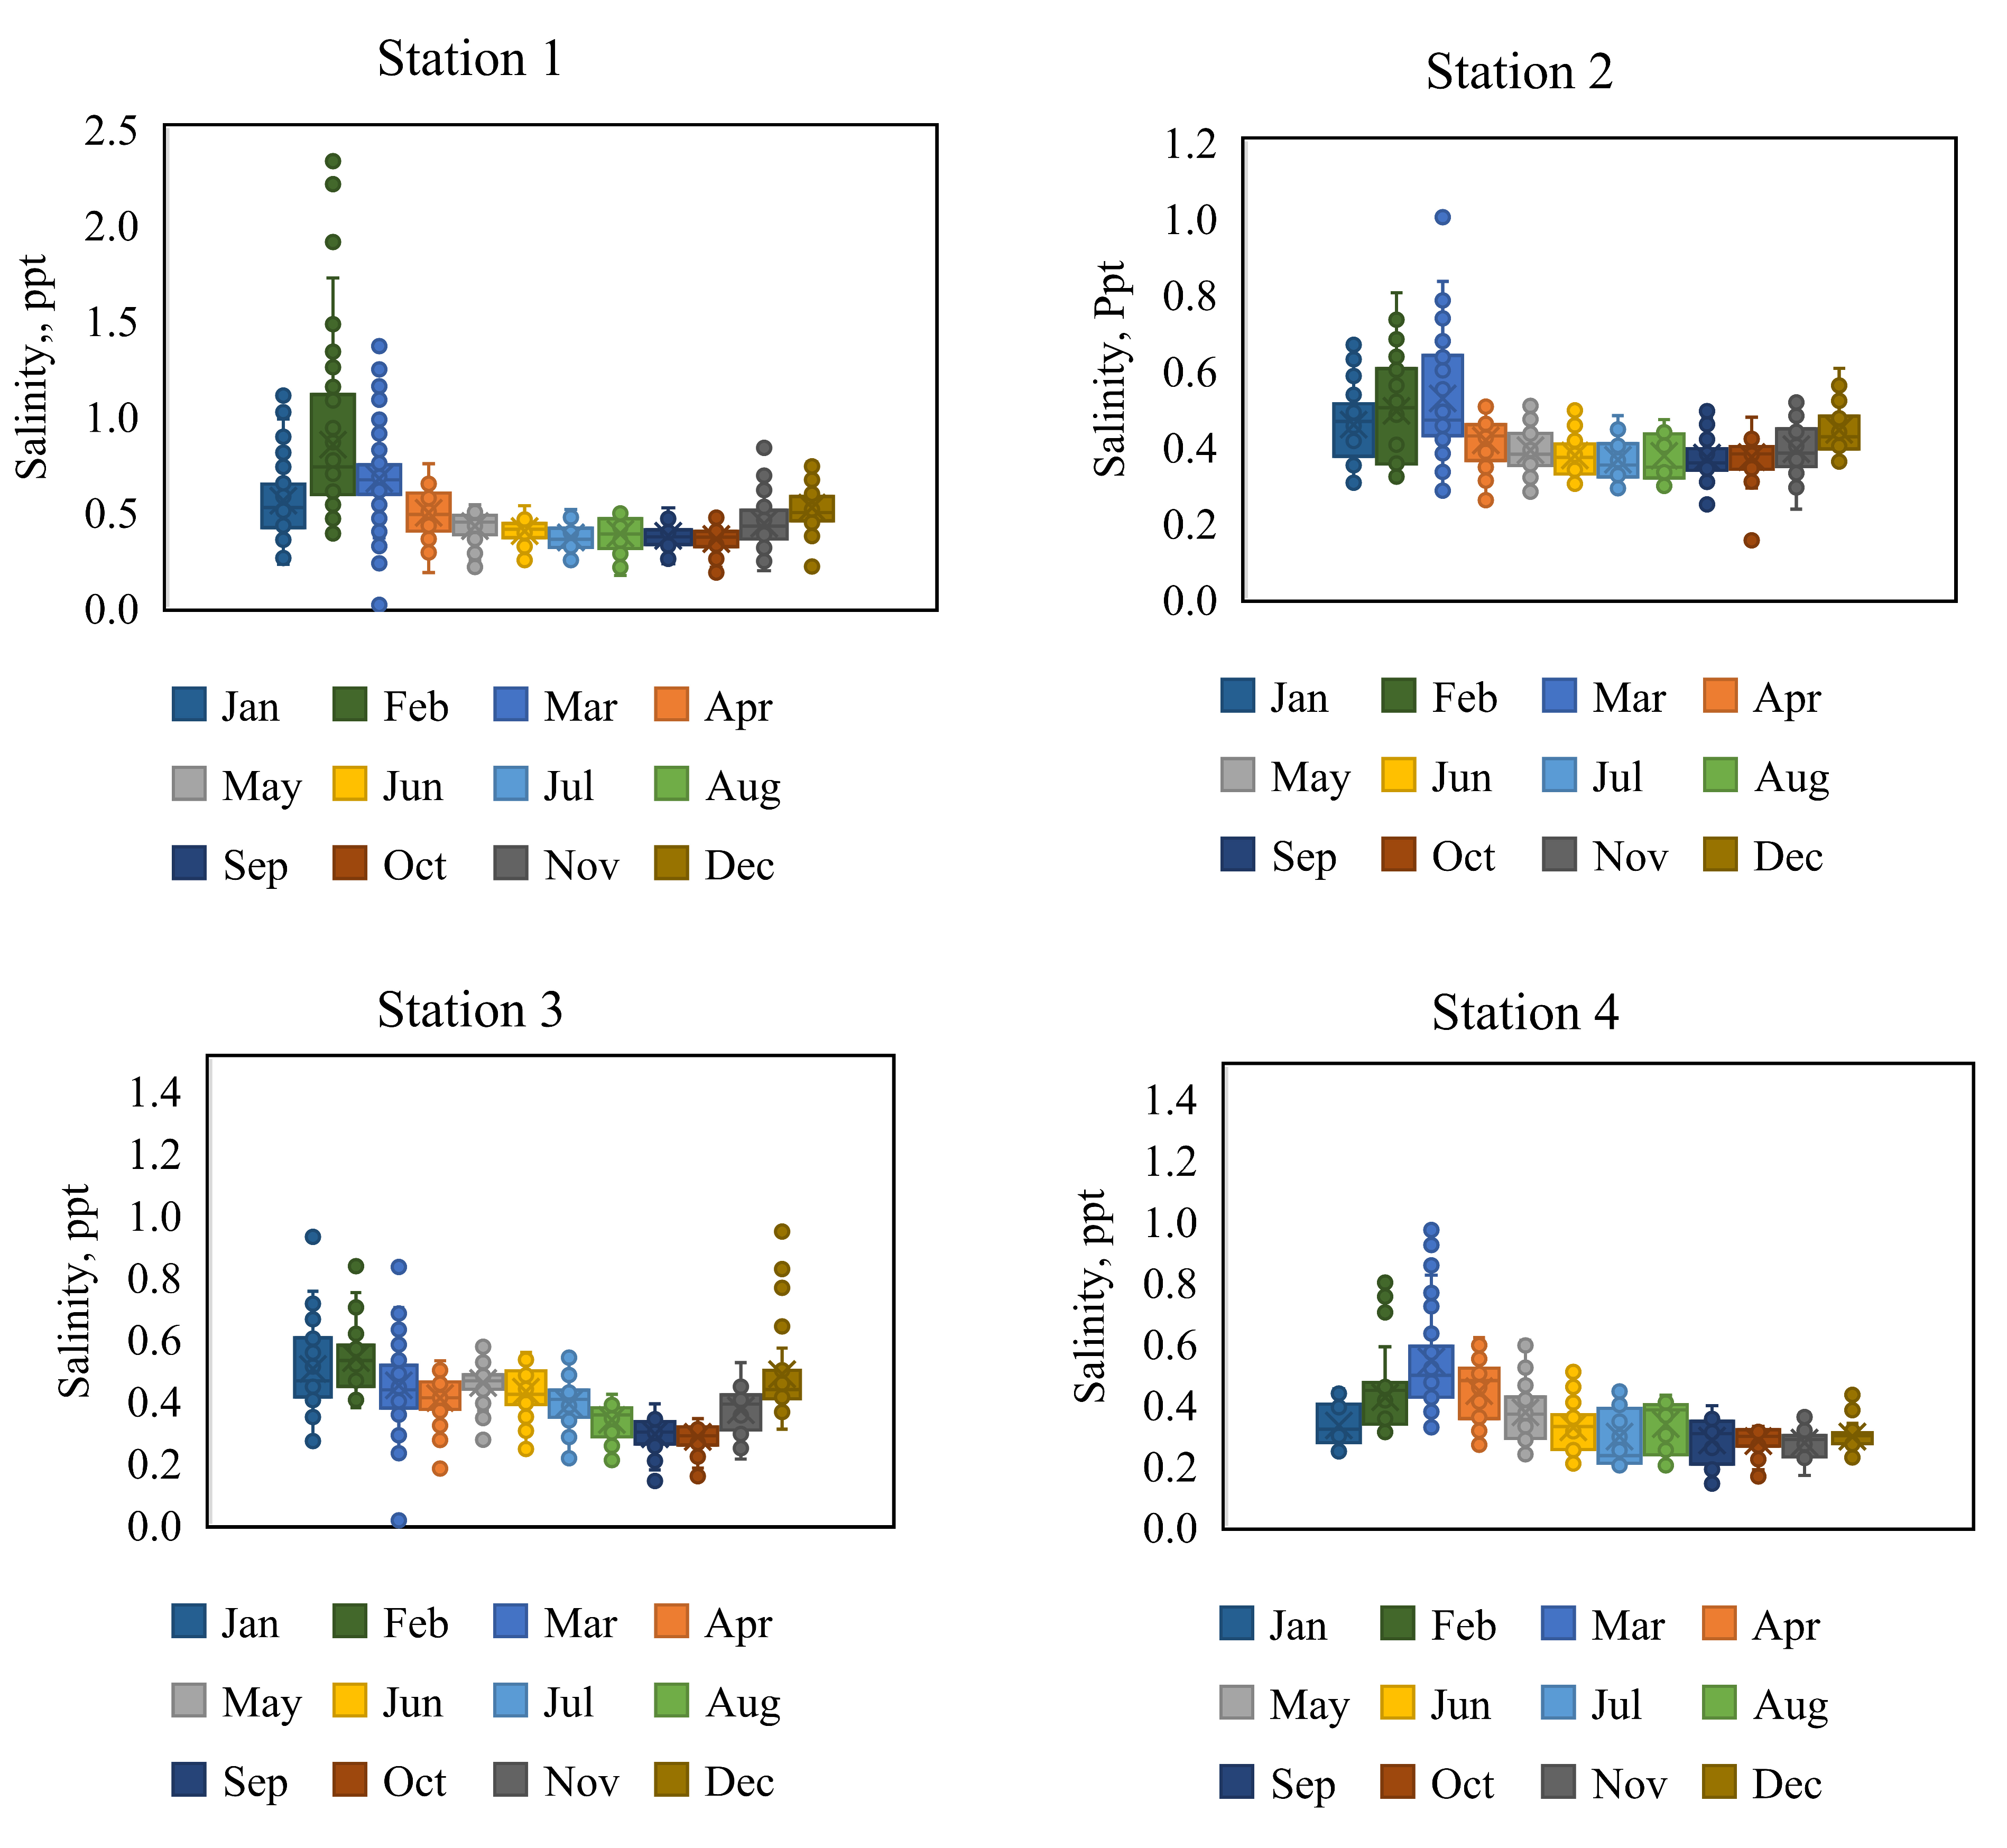
Additionally, the monthly salinity variation of the monitoring stations located in the western basin has been presented in the box plots (Figure 3). The majority of the stations demonstrated relatively higher concentrations of salinity especially in the months of non-growing seasons such as winter and spring except in Station 5, which is consistent with the studies conducted by Novotny et al., 2008 [51]. The salinity trend experienced in station 5 was not consistent with other stations. Station 3 and Station 5 were in the middle of the western basin; most importantly, these stations did not receive road salt unlikeother stations such as Station 1. In contrast to Station 1, Station 5 had the lowest salinity in March and the highest salinity in November.
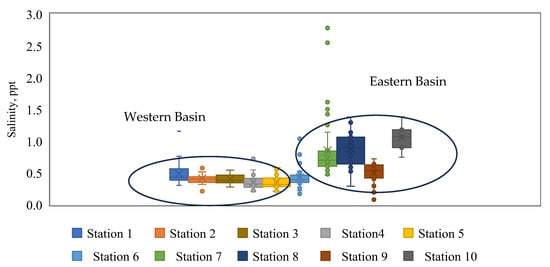
Figure 3.
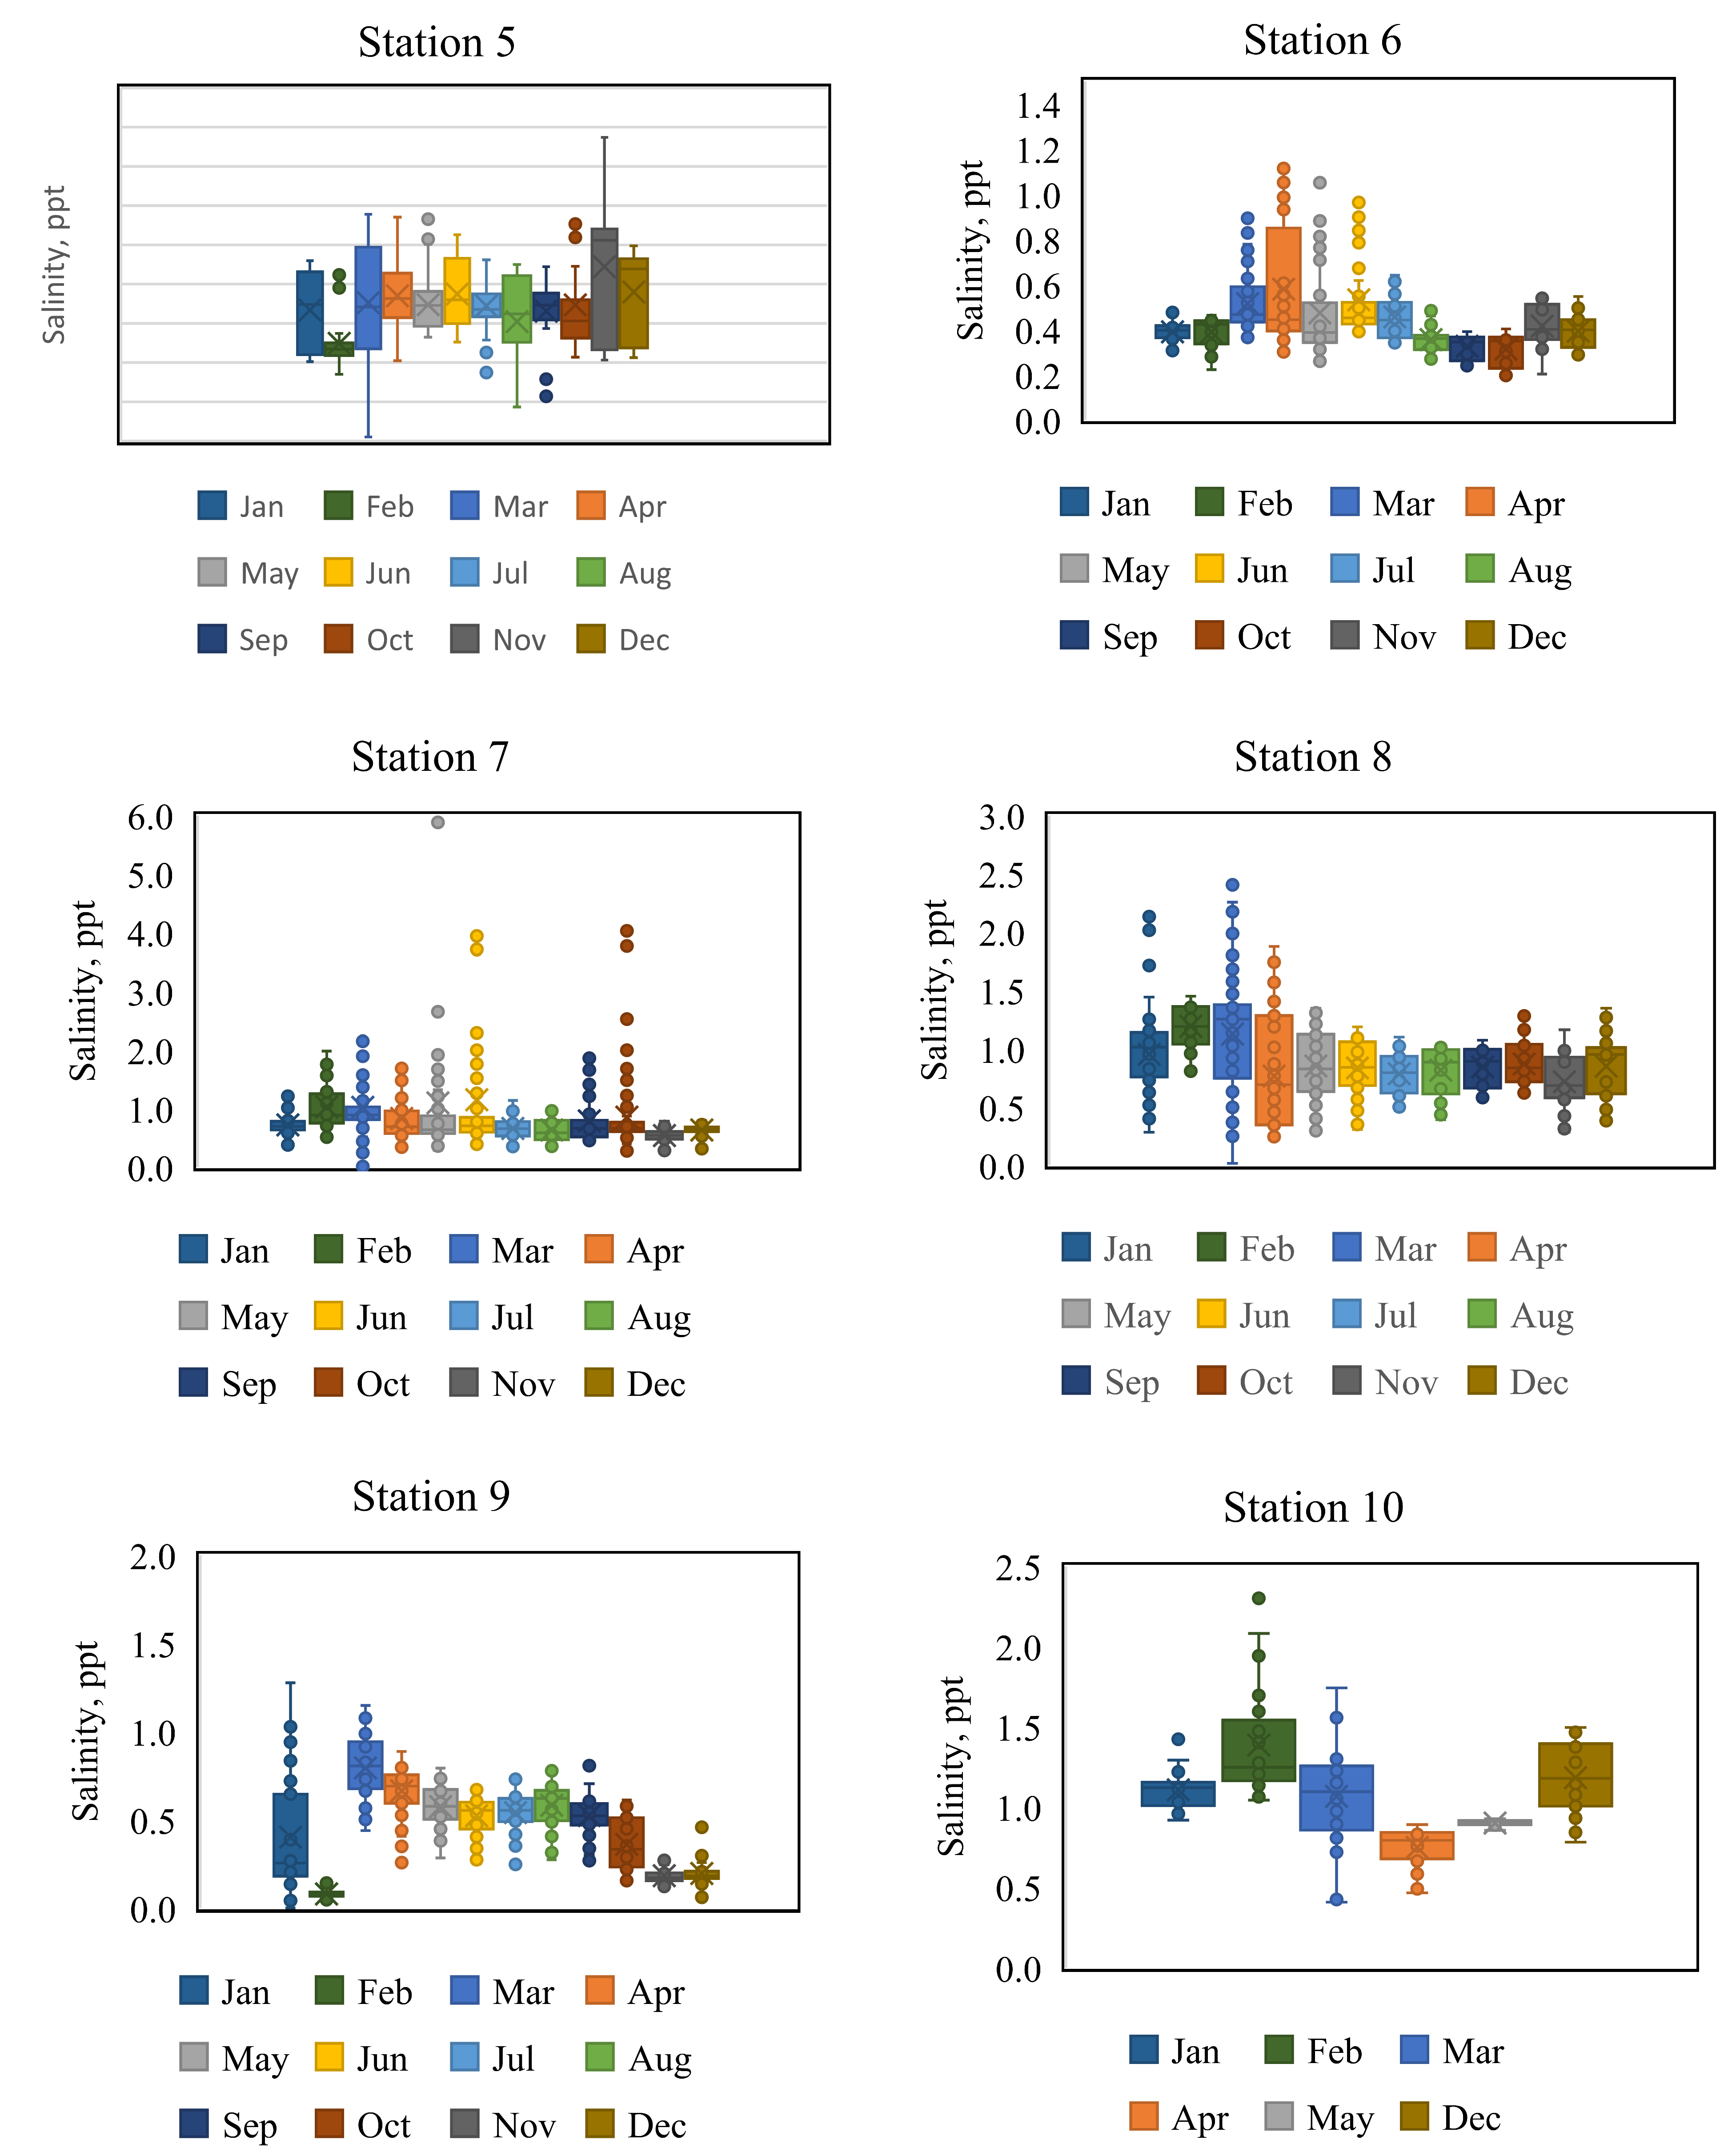
Total observed monthly salinity at all monitoring sites. Stations 1 to 5 are in the western basin, and Stations 6 to 10 are in the eastern basin.
While Station 5 showed a consistent pattern of salinity variation and was comparable to Station 1 and Station 2 during the growing season, during the non-growing season, the salinity recorded at Station 1 was significantly greater than the salinity at other stations in the western basin. Presumably, the road salt applied during the snowfall period should be one of the major causes for the increased salinity at Station 1, as this station is in the proximity of the road and directly receives the runoff from the road. Some of the stations including Station 2, Station 3, and Station 5 are away from the road network and do not receive the road runoff. In general, Mentor Marsh does not have a clear flow from the western basin to the eastern basin. Consequently, the station in the marsh where the water is predominantly standing revealed the steady salinity at this location. Station 1 reported the highest salinity whereas Station 2, Station 3, and Station 5 reported the lowest salinity. The salinity concentration at Station 2 was surprisingly lower and yet needs to be investigated. One of the reasons for less salinity could be the dilution due to the point source from the wastewater treatment plant near the outfall. Since Station 4 is located downstream of Marsh Creek (a western tributary to the marsh), Marsh Creek will contribute to the salinity at Station 4, which will discharge towards Station 1. As discussed earlier, winter salinity from Marsh Creek was relatively higher compared to other seasons.
Also, the water salinity was measured at various locations of the marsh in the western basin using YSI Sonde. The average water salinity in the western basin was found to be 0.5 ppt. The Kriging-Gaussian analysis also suggests that the salinity in the western basin is less than 0.6 ppt.
Also, the data from the other five stations from Station 6 to Station 10 were analyzed to quantify the salinity loadings in the eastern basin. The overall salinity in the eastern basin seems to be higher than that of the western basin as indicated by the box plots (Figure 3), except for Station 6. Station 8 reported a significant level of salinity concentration unswervingly compared to the rest of the stations, especially in the non-growing seasons of winter and spring. Since Station 8 was located immediately below the road, the salinity observed in this station was twice as much as the salinity recorded at other stations (2.6 ppt). The increased salinity at Station 8 seems to be due to road salinity in addition to the various other sources. Station 8 is somewhere in the middle of the eastern and western basins of the marsh and can receive windblown salinity from the nearby Morton Salt Company.
The salinity reported at Station 6 was relatively low compared to other stations in the eastern basin; however, the salinity recorded at this station was comparable to salinity in the western basin. Even though the average monthly salinity recorded at Station 7 was not significantly higher than other stations (Figure 3), the occasional recordings of daily data show a higher salinity at Station 7 (Figure 4). We encountered significant salinity at Station 7 occasionally as high as 40.6 ppt. We verified these data from independent sampling at other locations with the same instrument to ensure the high recording of salinity was not because of an instrumental failure. We also confirmed the salinity recorded by the Lake County Soil and Water Conservation District (LSWCD) in this location. The data collected by LSWCD also indicated a sudden spike on certain days especially during summertime. Based on our observation and discussion with the LSWCD, which is the main stakeholder and our partner in mitigating the salinity in the marsh, the sudden spike was mainly due to the recent heavy rains which drained the salt from the nearby Morton Salt facility.
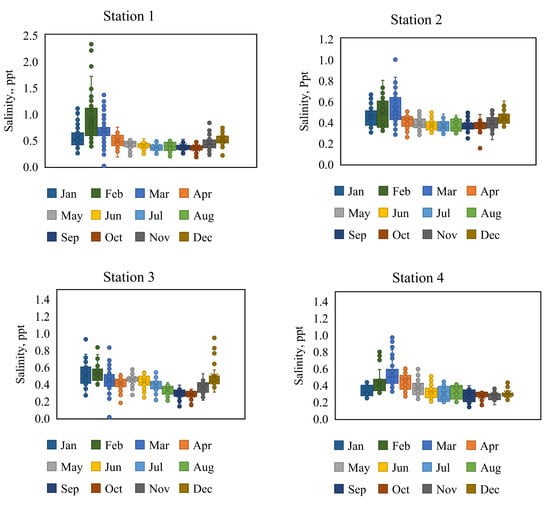
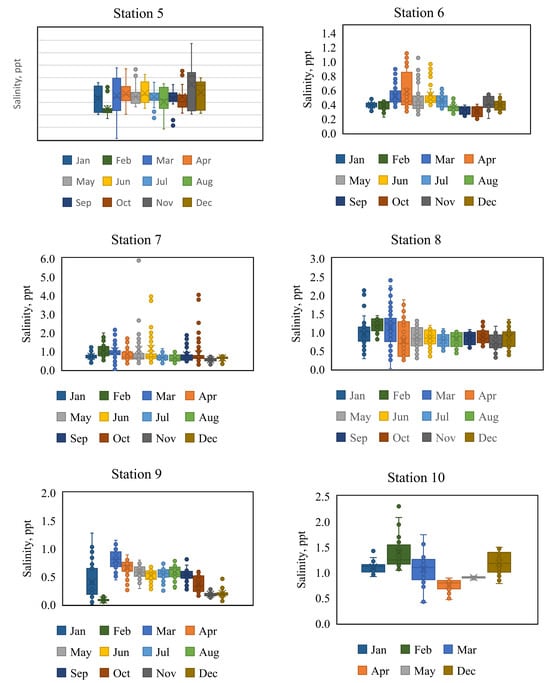
Figure 4.
Daily observed salinity in various months at all the stations.
Apart from these, one-time salinity was recorded in a sporadic location across the marsh at least in 30 locations using YSI Sonde.
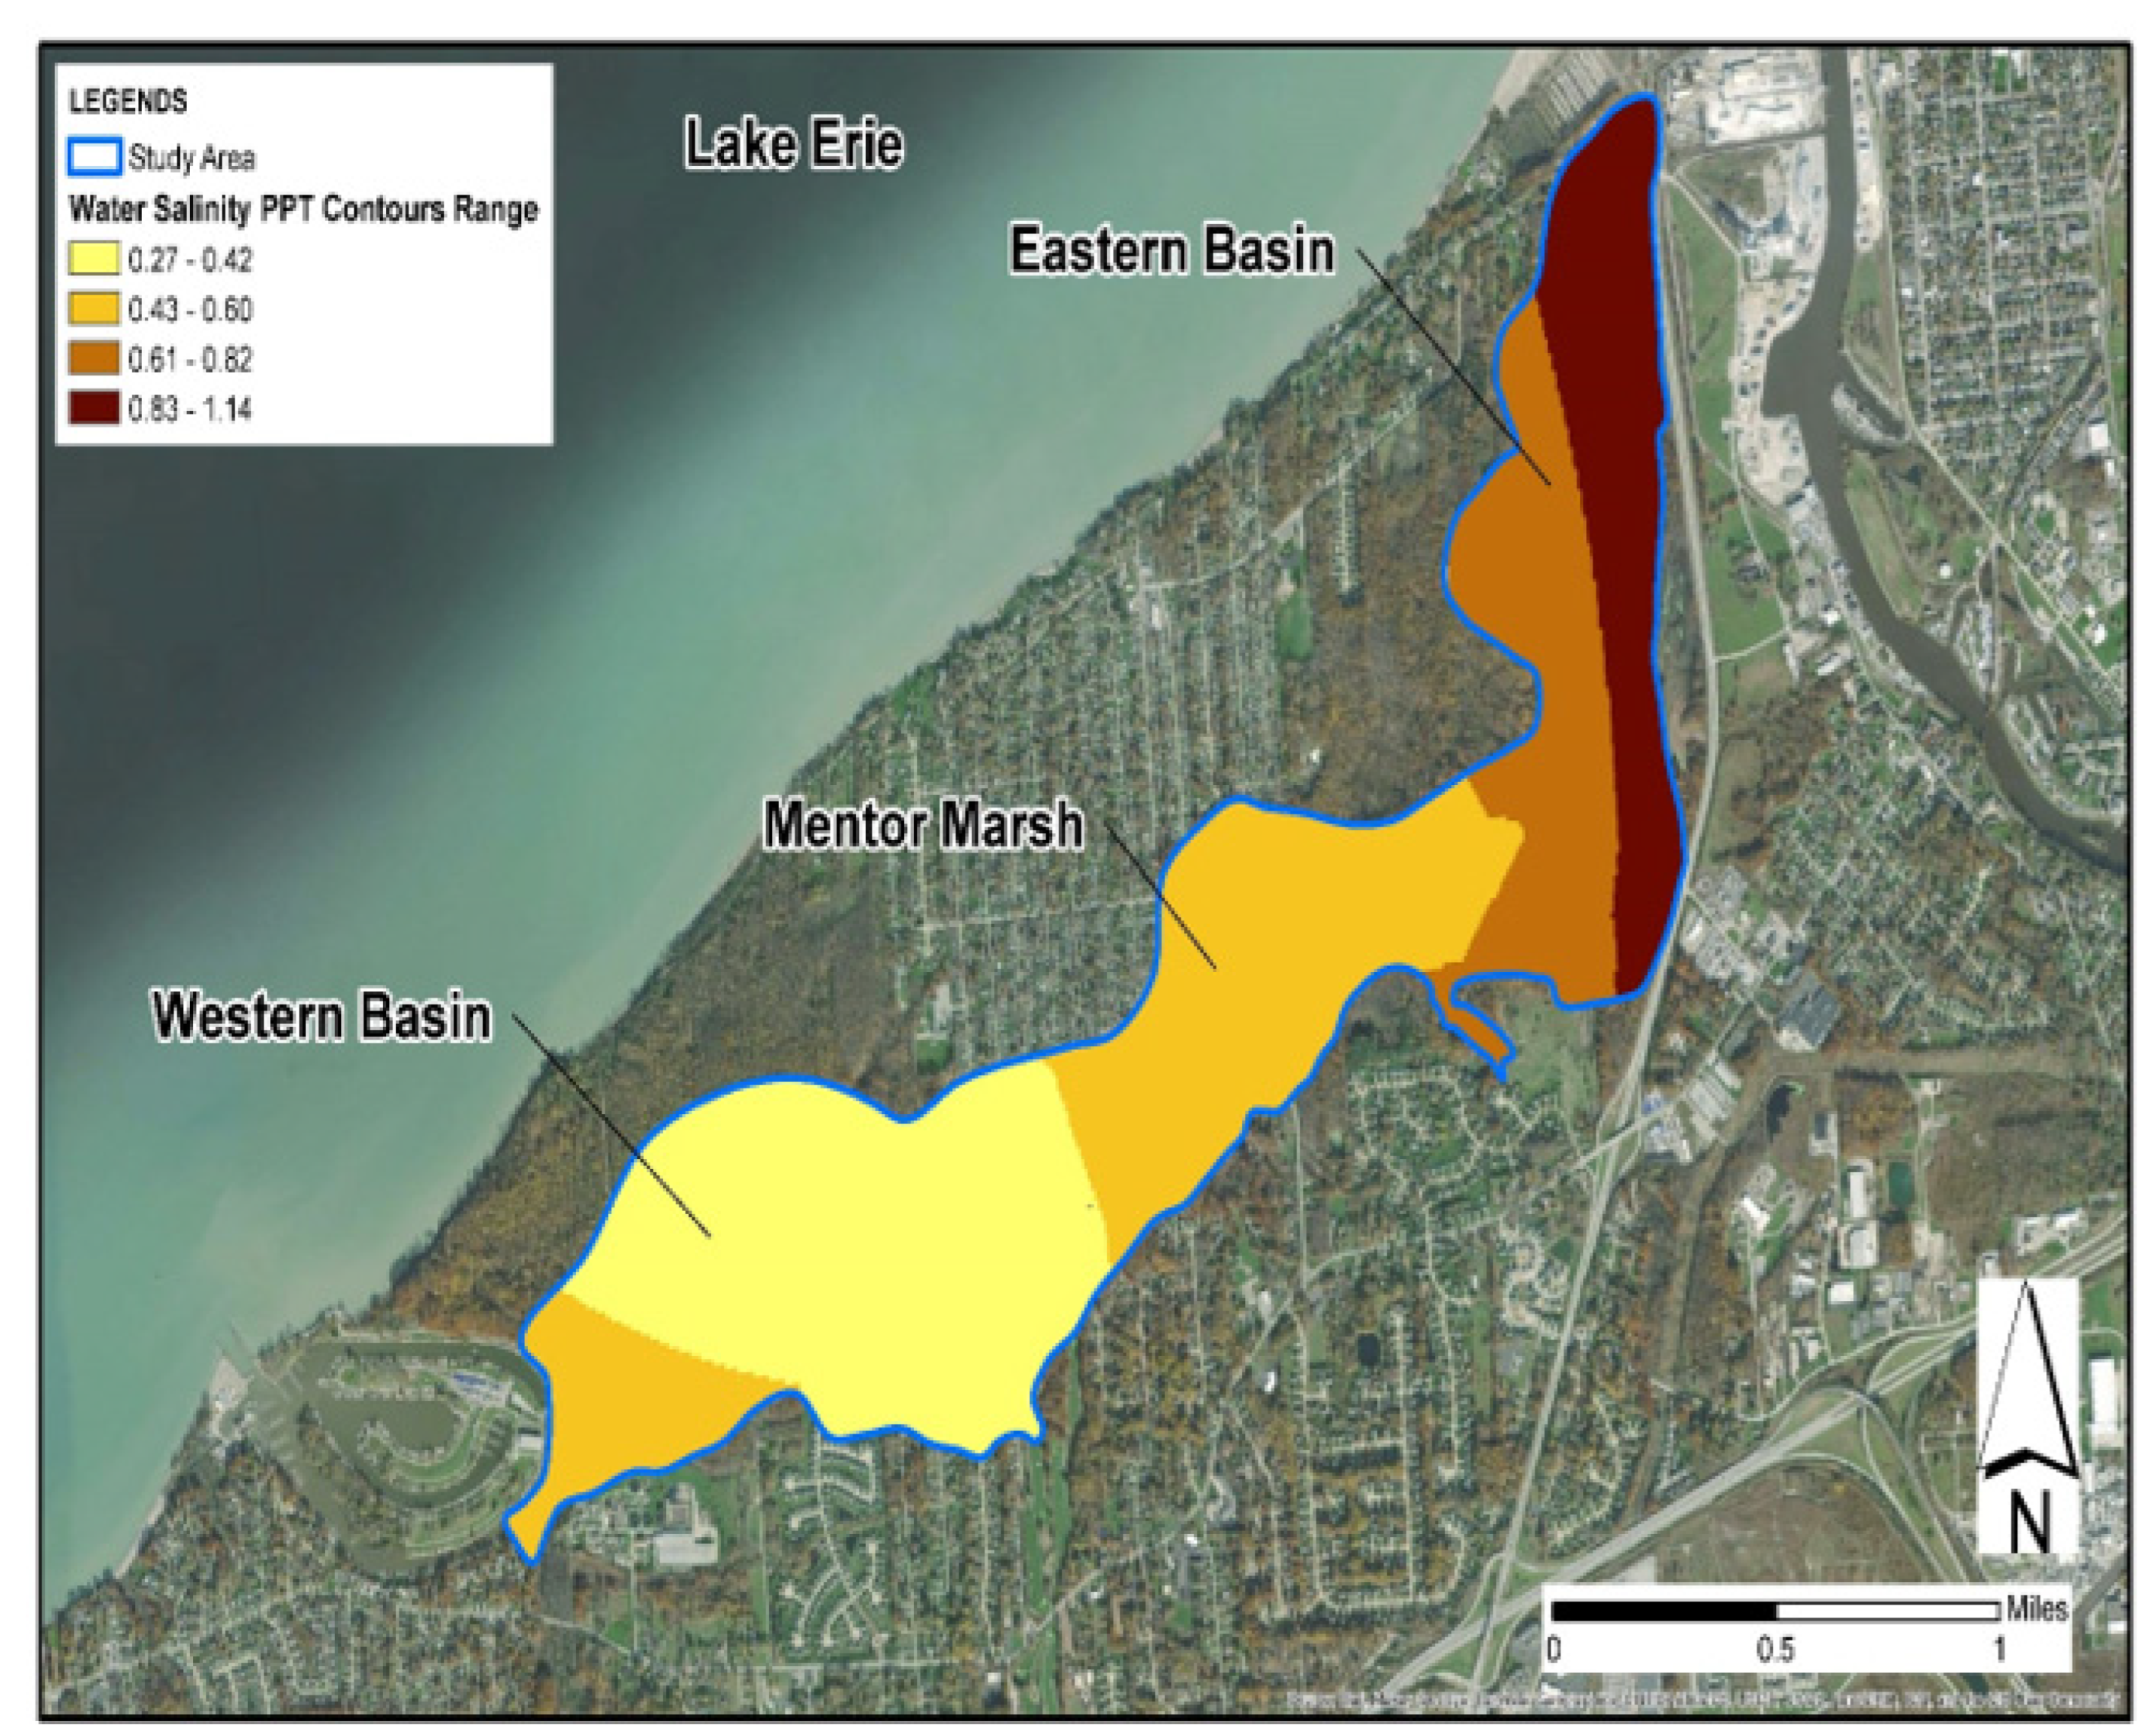
The salinity throughout the marsh was mapped using the Kriging interpolation methodology with the inputs as a point salinity measured using YSI Sonde at these 30 different locations. The Kriging analysis suggested that the water salinity in the eastern basin was relatively high compared to the salinity in the western basin (Figure 5), which is due to the rerouting of Blackbrook Creek along the eastern basin from a nearby salt fill site [4]. The average water salinity in the entire marsh was found to be 0.54 ppt. The Kriging-Gaussian analysis also resulted in relatively high salinity (0.95 ppt) as compared to the overall average salinity along the road that divides the two basins. This relatively high salinity value along this road corridor is possibly due to the road salt application.

Figure 5.
Water salinity contour maps prepared using the Kriging-Gaussian method from sporadic water salinity measurements.
3.2. Soil Salinity
The analysis was conducted using hourly observed data including the soil salinity, soil moisture, and soil temperature from January 2019 to July 2021 in order to investigate the temporal and spatial variability in soil salinity. The continuous measurement of soil parameters was conducted using soil sensor probes (SMEC-300) located at 1.5 ft depth below the ground surface. Analysis from eight monitoring sites was presented in this study as an instrument at one of the sites that simply malfunctioned after a few months of installation. In order to avoid confusion from water salinity stations, the soil salinity stations are labeled as “Sites”. The soil salinity at each monitoring site was studied on a daily and monthly scale.
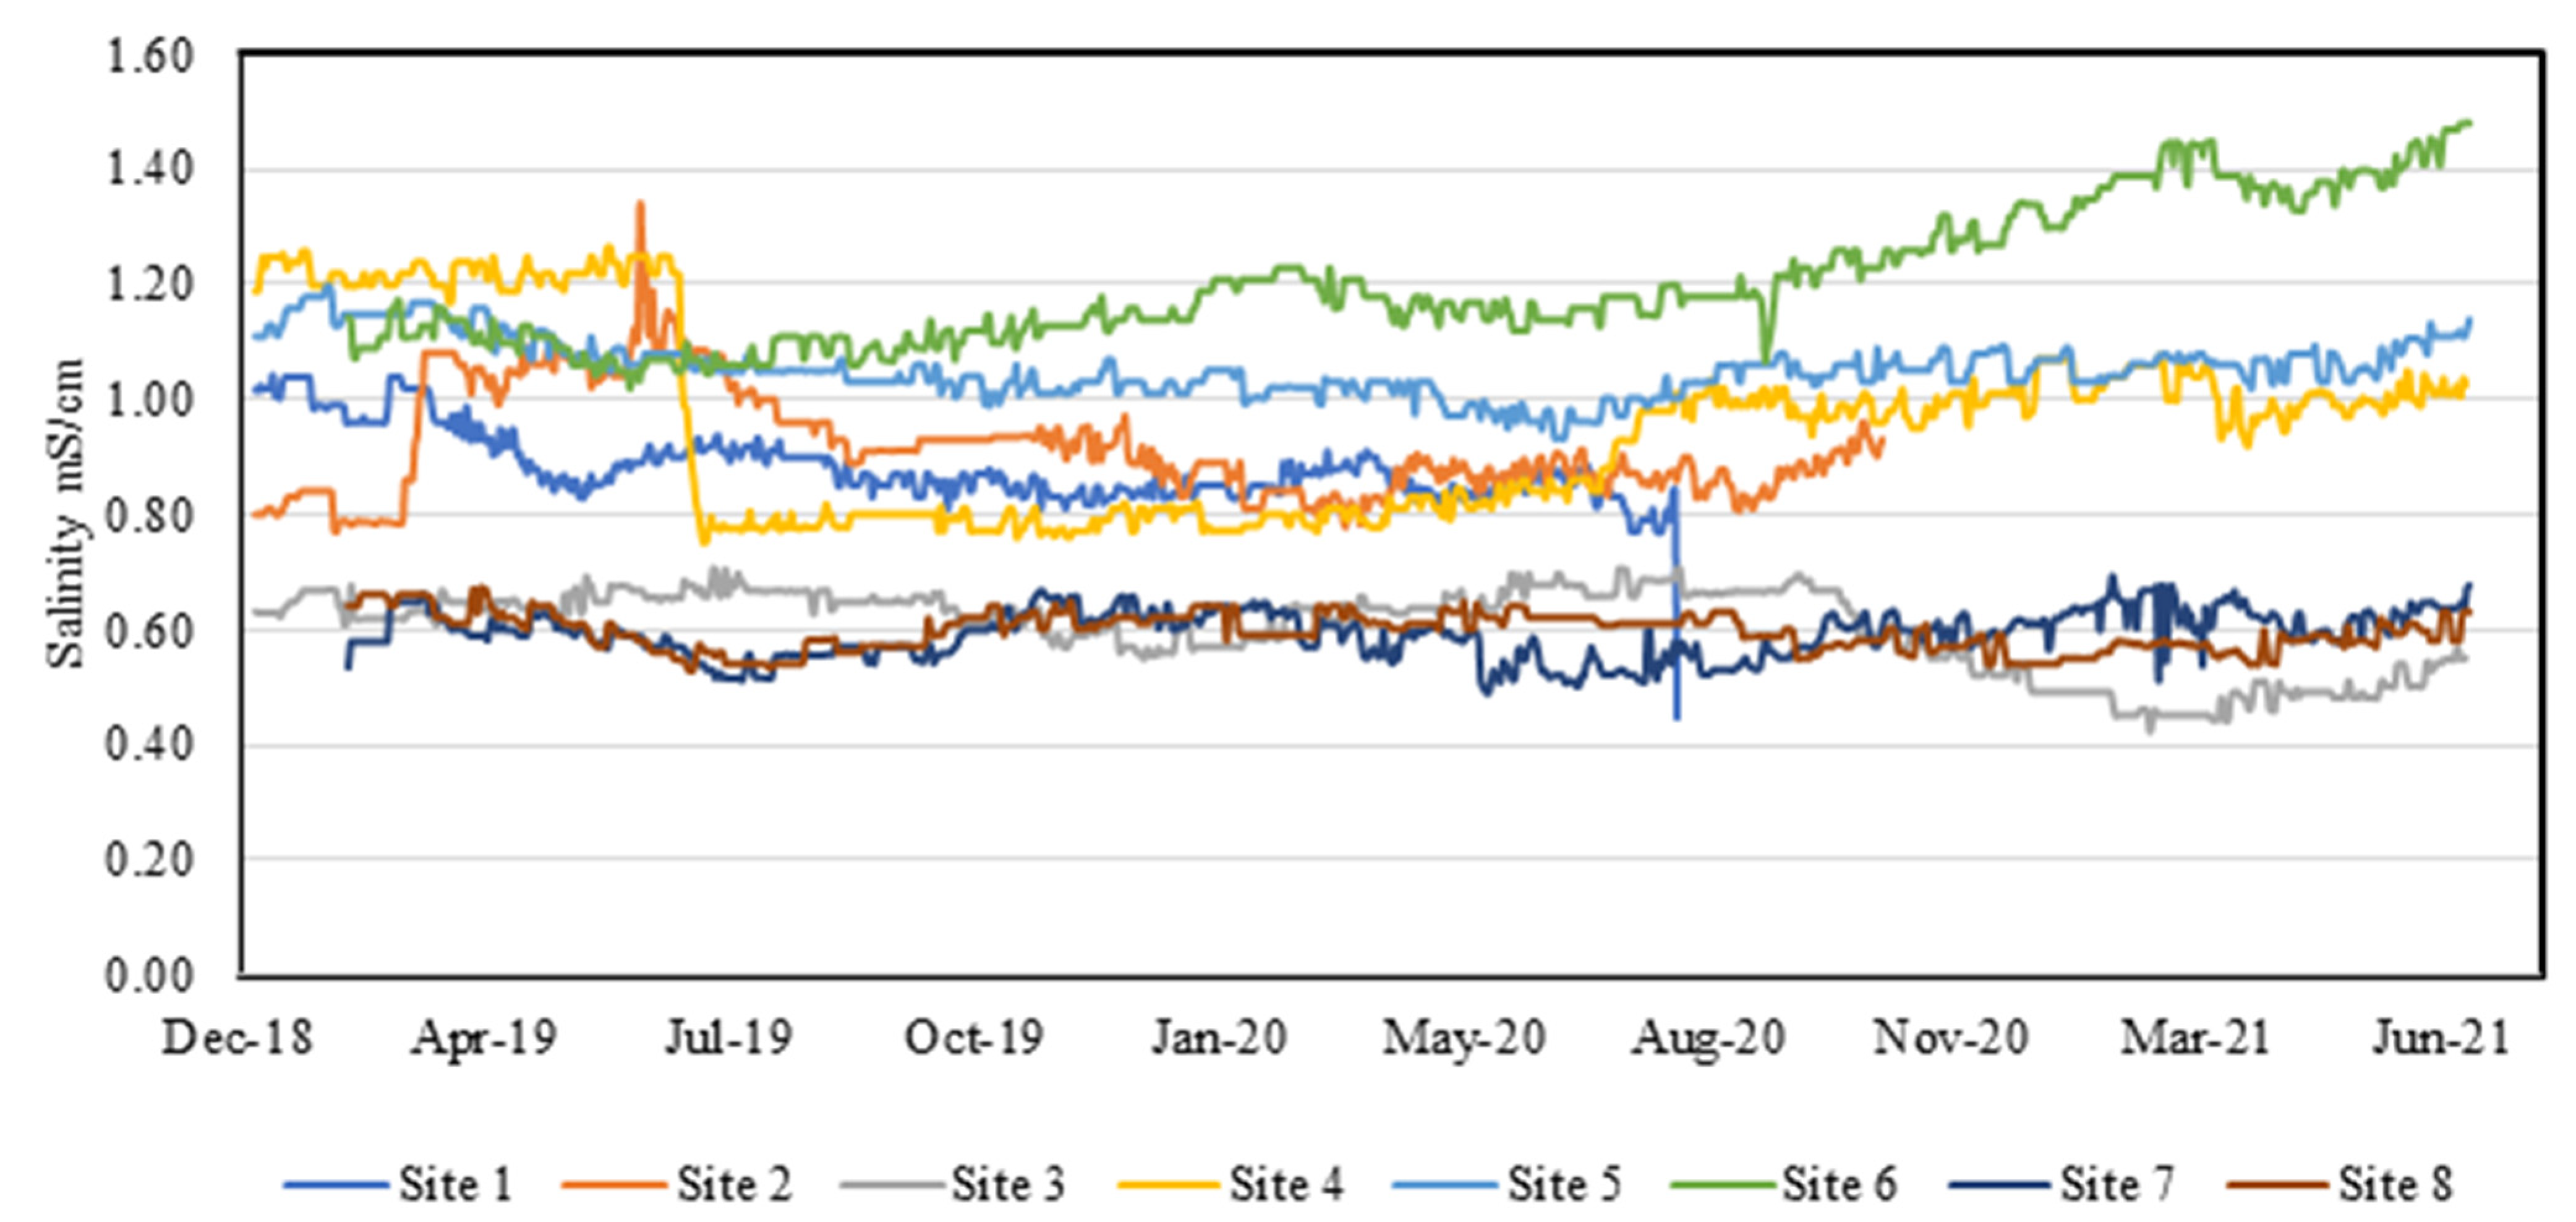
Figure 6 shows the comparison of daily soil electrical conductivity at eight critical monitoring sites. In general, the analysis shows that the daily variation in soil EC ranges from 1.33 mS/cm to 0.51 mS/cm, monthly soil EC varies from 1.23 mS/cm to 0.44 mS/cm, and seasonal soil EC is found to vary from 1.22 mS/cm to 0.417 mS/cm (not shown). After the conversion of EC to salinity as per the USDA guidelines (ECx640), results from most of the monitoring locations showed that Mentor Marsh had consistently been under the oligosaline category with soil salinity ranging from 854 gm/m3 to 326.933 gm/m3.

Figure 6.
Variations in soil EC at soil sensor locations in daily scale.
By and large, high variability was detected from January to June, whereas the variability in summer and early fall was relatively less; although, there were some exceptions. However, the variability of soil salinity at Site 2 and Site 7 during the winter was relatively less. Likewise, the variability in soil salinity in summer at Site 8 was relatively higher. As the water from the marsh is evaporated during the summer, the salt will be deposited in the soil. As a result, the soil salinity may not vary significantly during the summer months. However, the runoff-driven salinity may vary each year during January as the rainfall and snowfall vary each year [52].
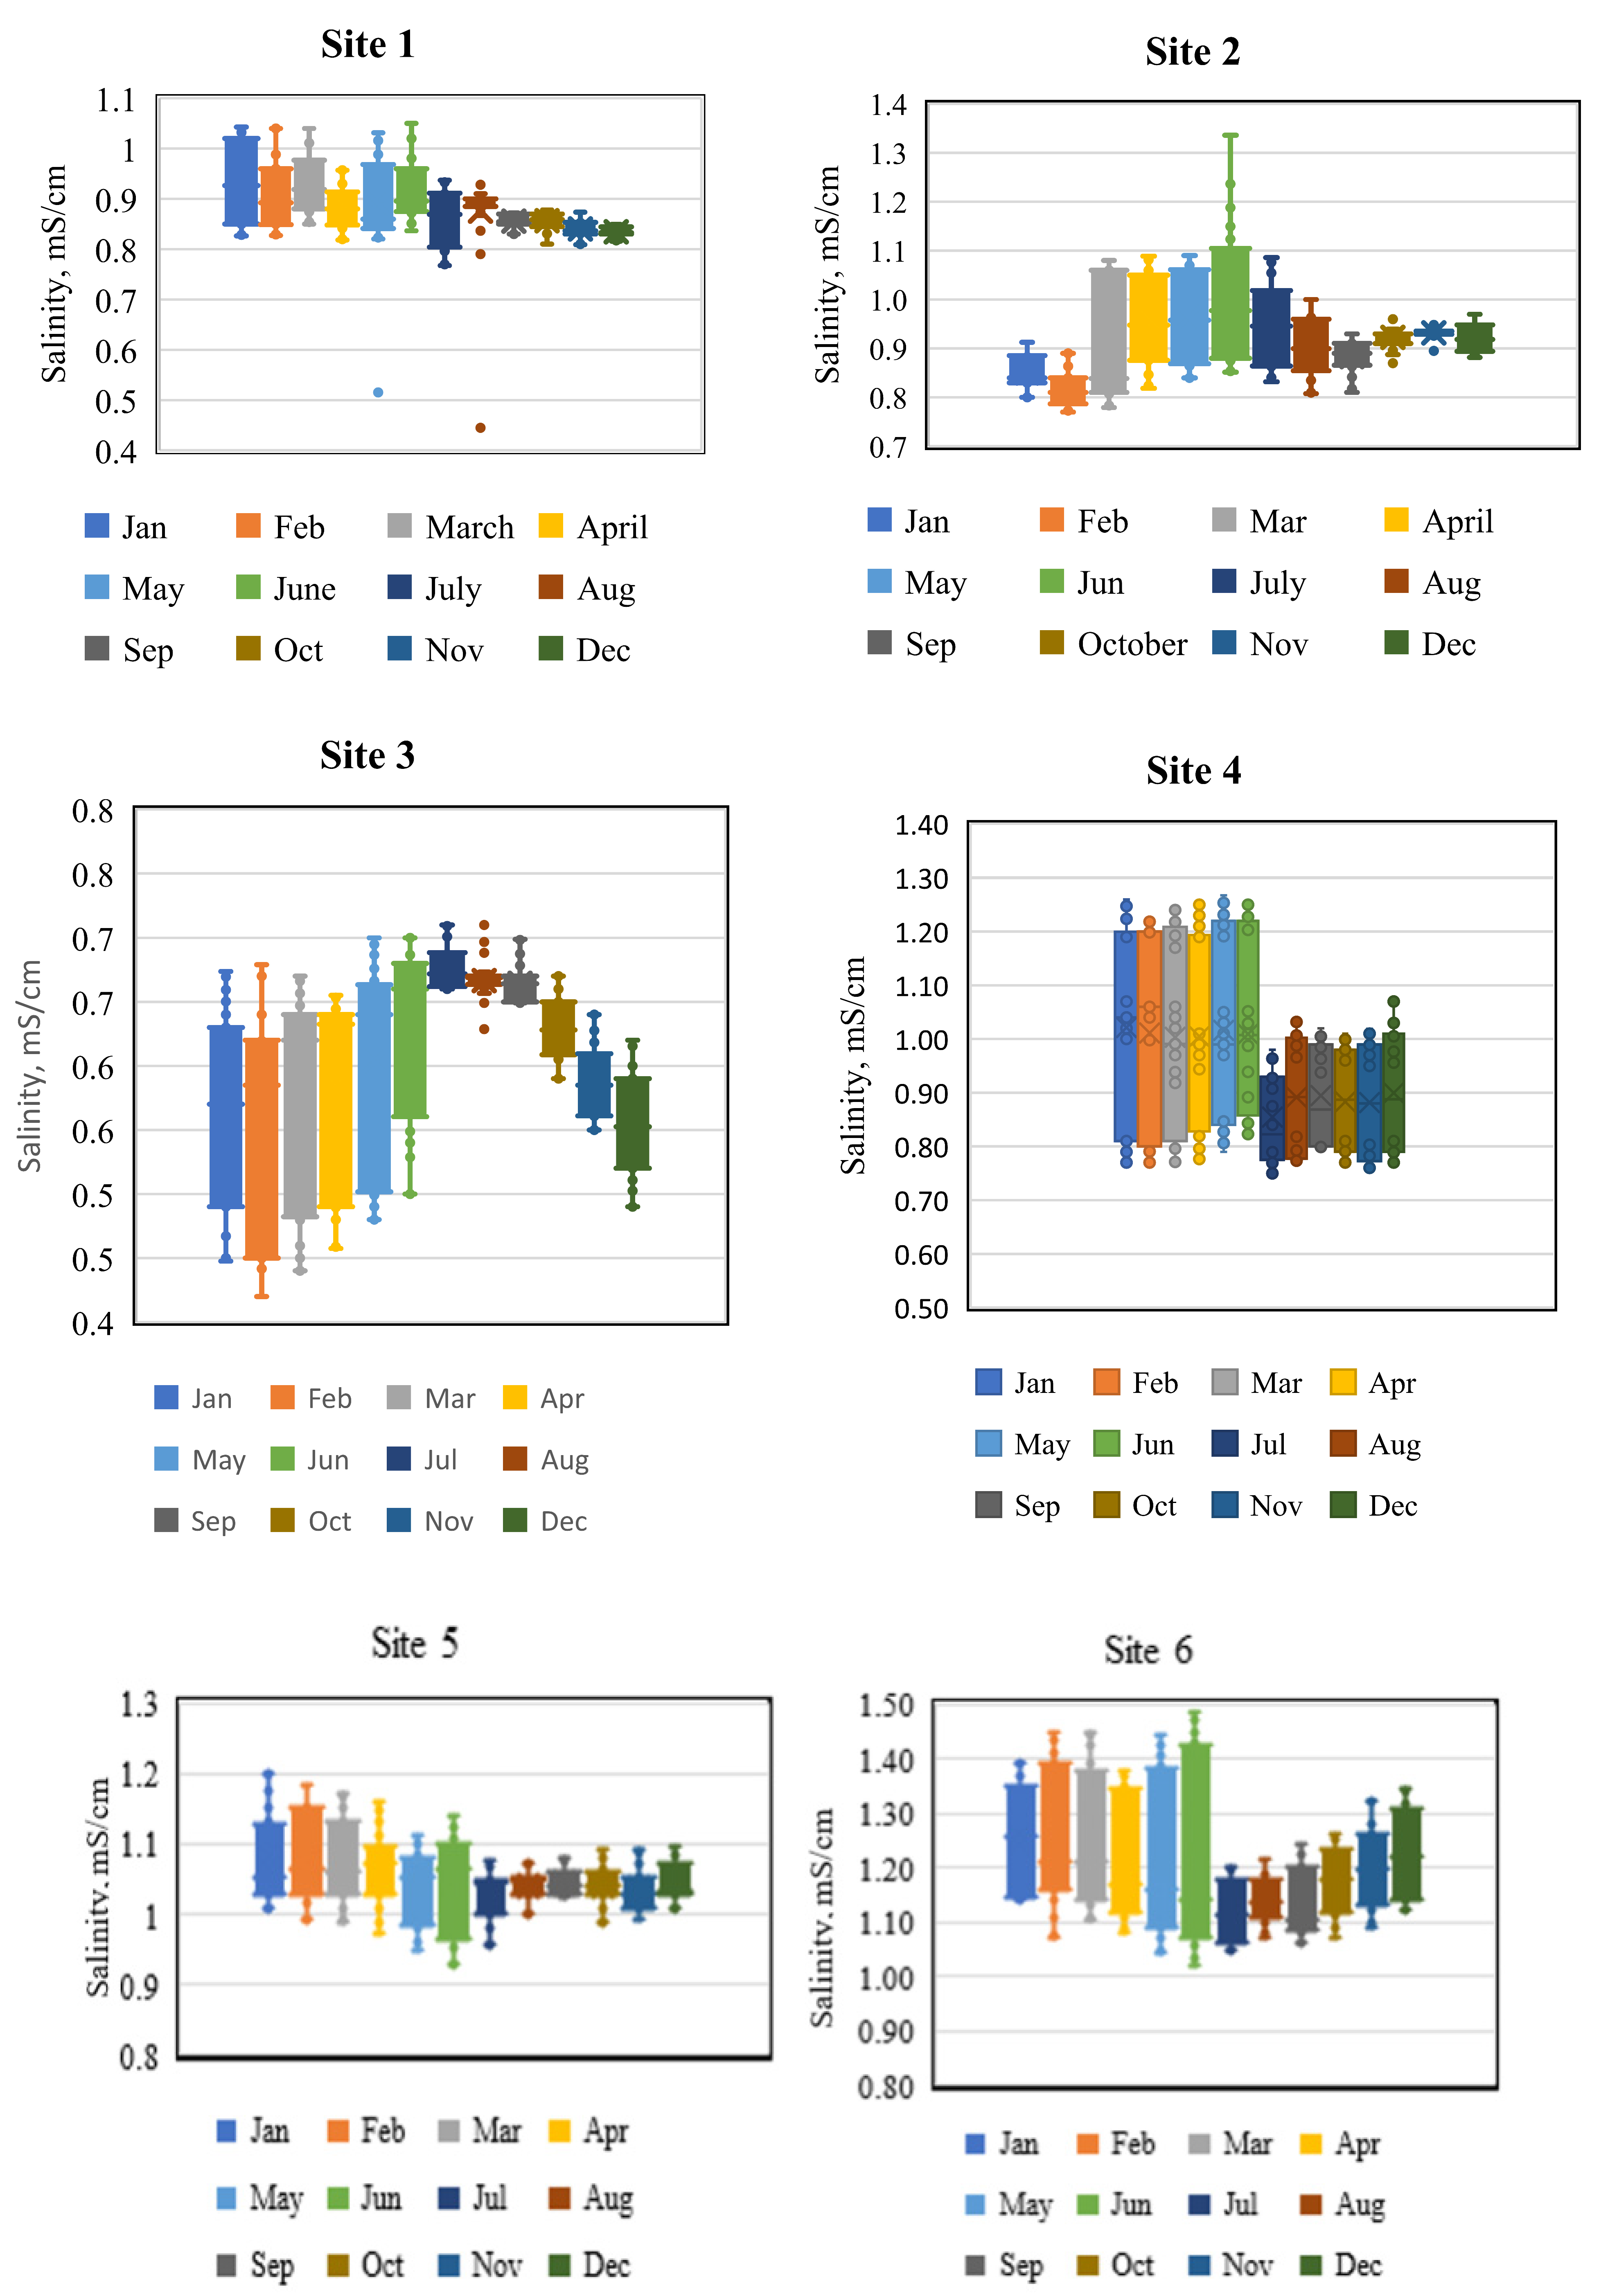
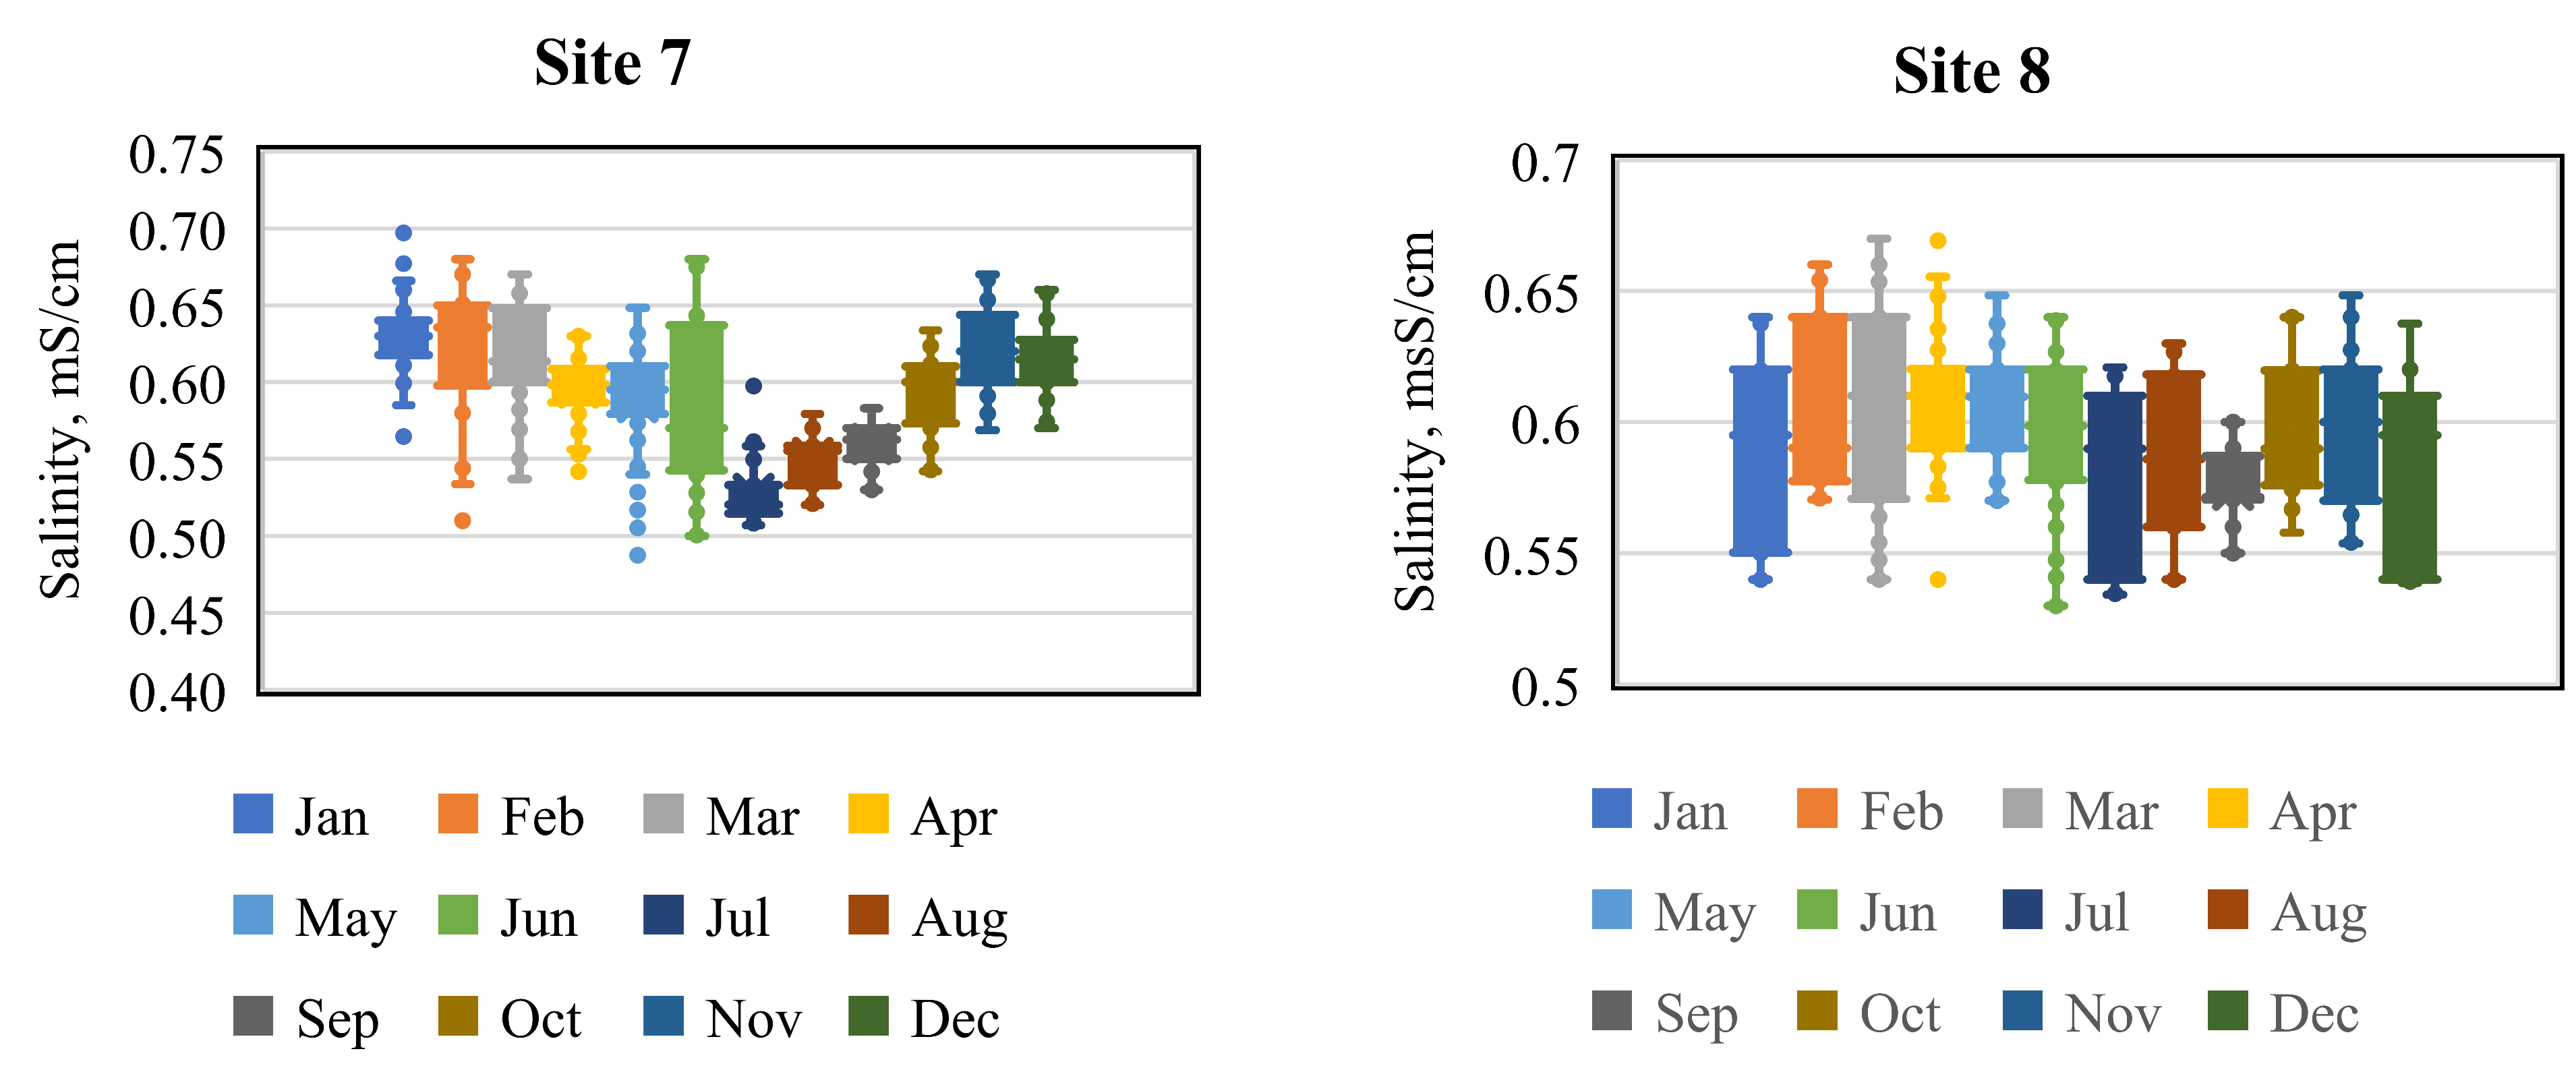
The daily soil salinity plotted on the monthly scale from Site 1 to Site 8 is reported in the box plots of Figure 7. The box plot shows that the variabilities of salinity in different months were consistent across Site 1, Site 4, Site 5, and Site 6. The salinity in Site 2, especially in the month of January and February was slightly different from other sites in terms of the variability in salinity. Site 8 is different from other sites as the salinity variability in summer was comparable to the salinity variability in winter. Also, the average salinity was more or less uniform throughout the year. The salinity variation across the various months of Site 3 and Site 7 were just opposite. Site 3 was revealing higher salinity with less variability during summer months, whereas Site 7 was depicting less salinity with less variability during summer months. In addition, the monthly salinity is reported in Figure 8.
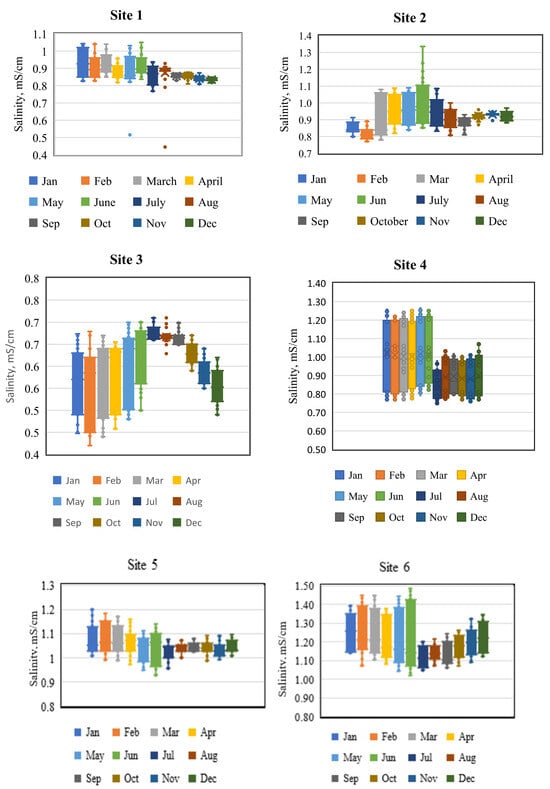
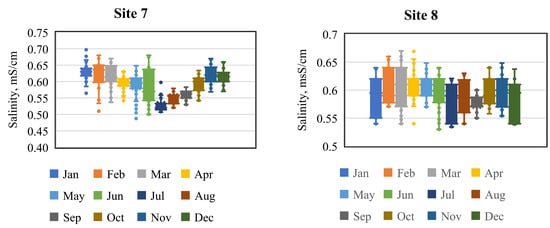
Figure 7.
Variations in soil EC at soil sensor locations in daily scale plotted for every month.
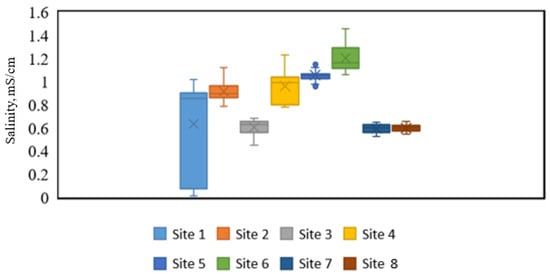
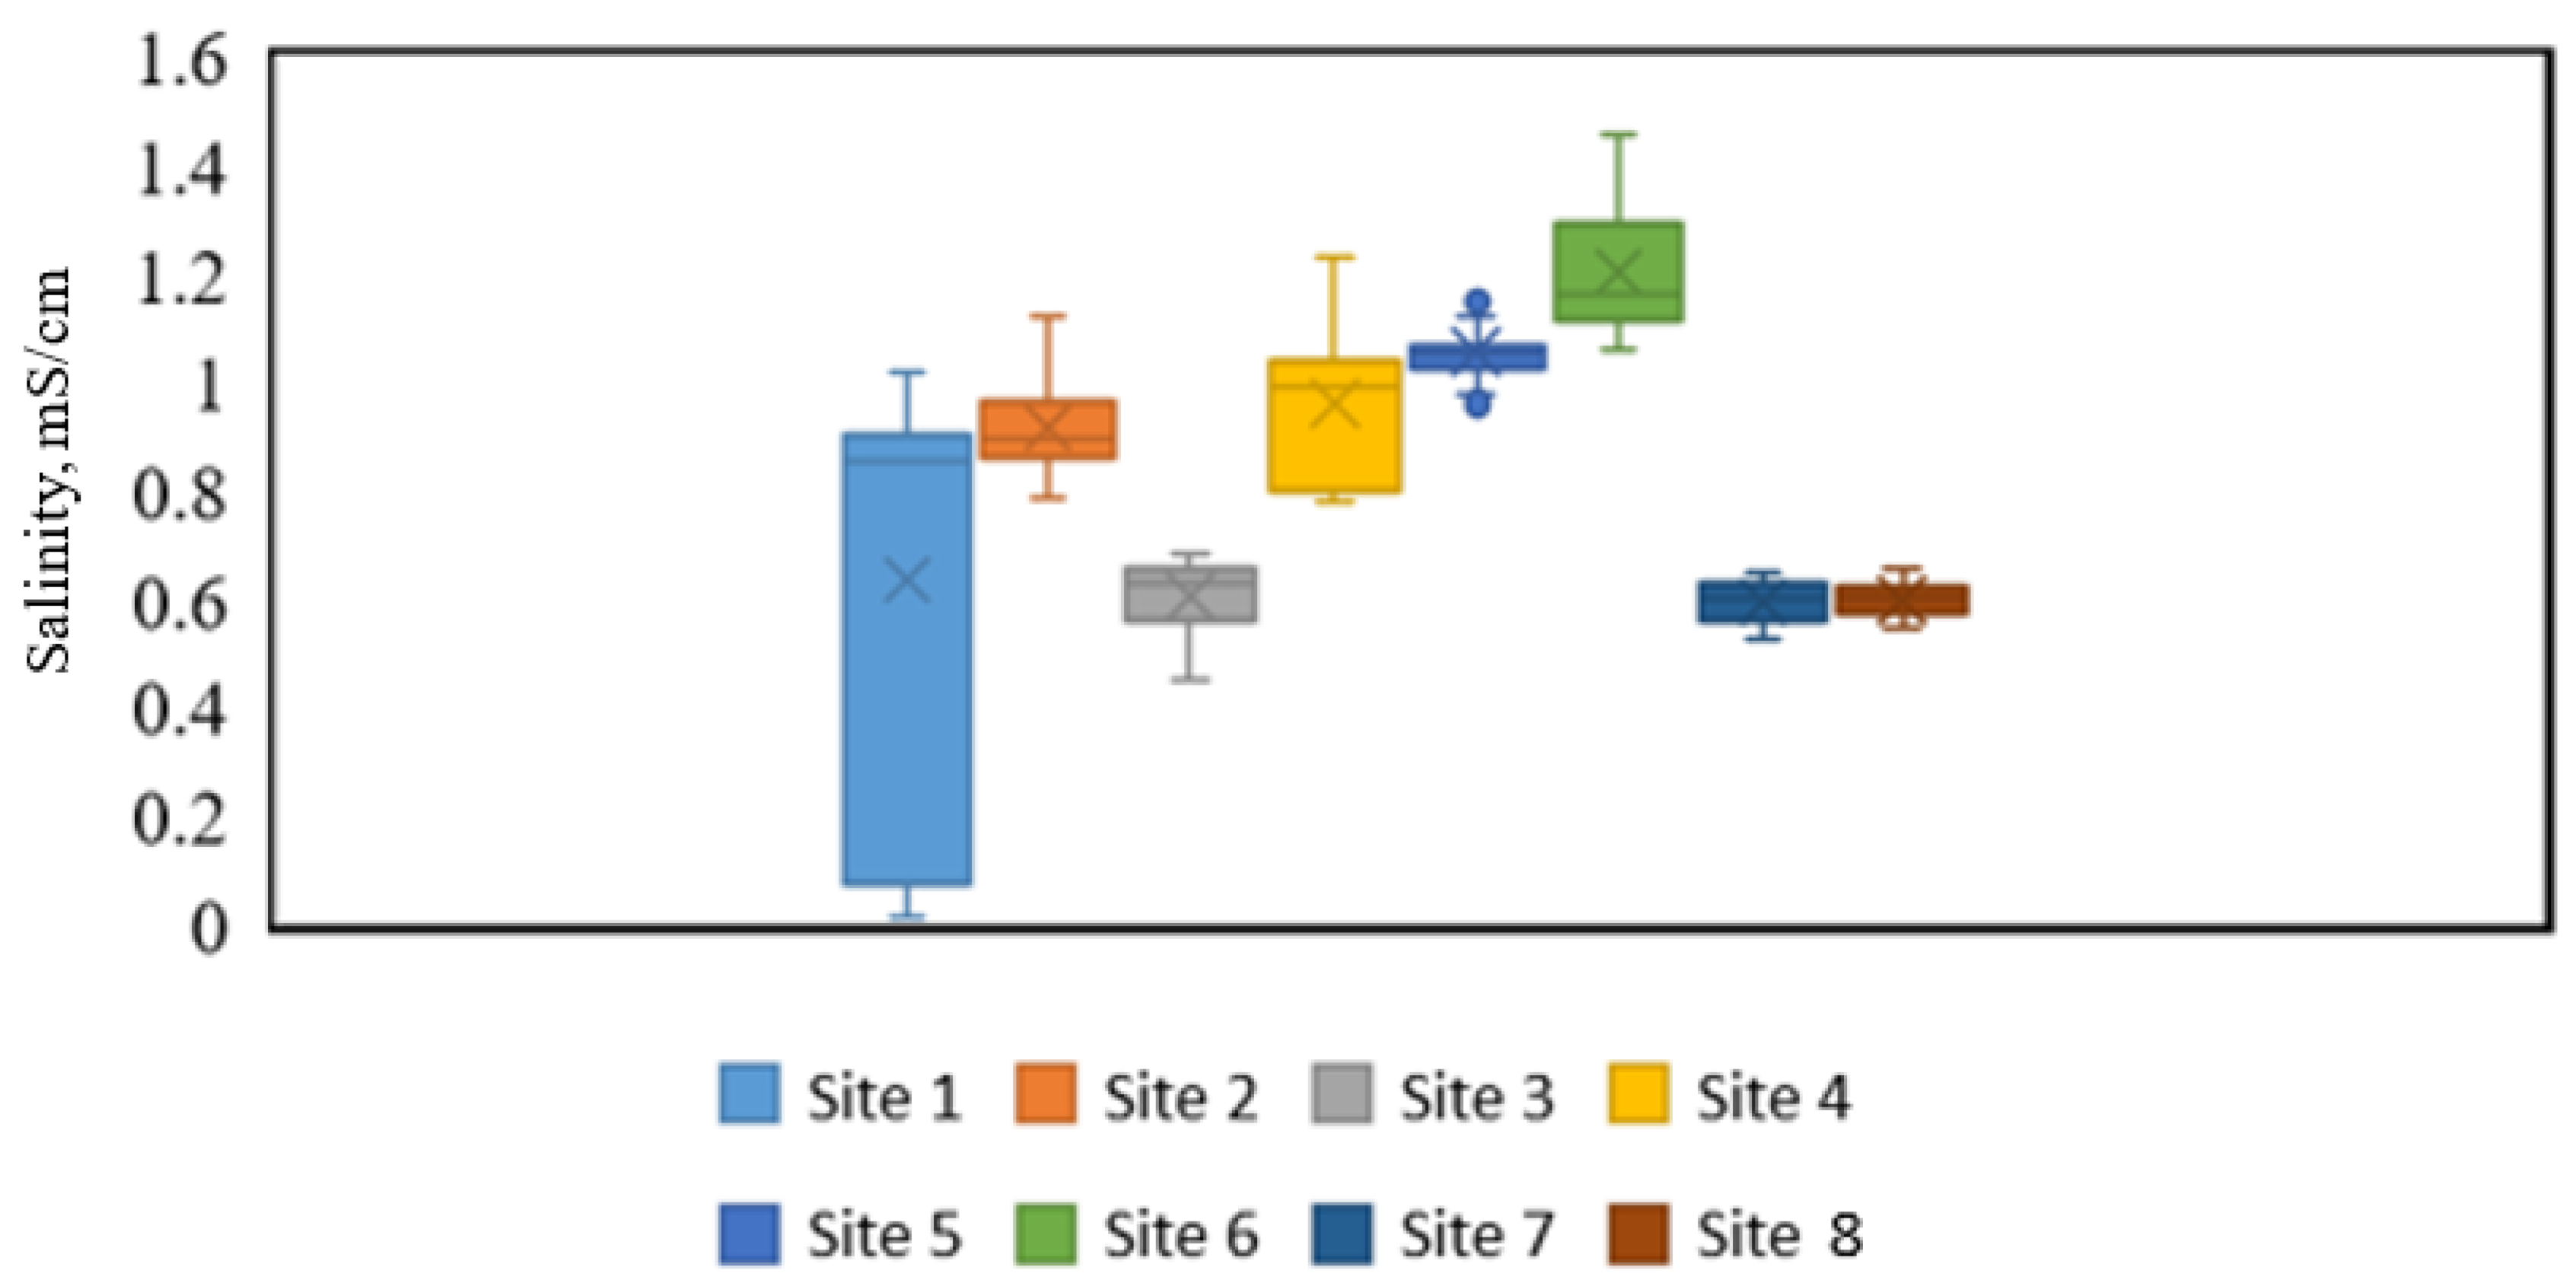
Figure 8.
Variations in soil EC (mS/cm) at soil sensor locations on a monthly scale.
Overall, summer salinity was less especially in July except at Site 3. If the drainage is poor in the low-lying areas such as Mentor Marsh, the salt concentration increases significantly and the salt in the water will remain in the soil as the water evaporates [53]. Site 3 might have recorded a higher salinity as a consequence of high evaporation. Site 3 is close to the salt fill sites. This station receives runoff which is high in salinity and undergoes evaporation during the summer, leaving the salt in the soil resulting in an increase in the soil salinity during summer. One of the interesting points is that the moisture content at Site 3 does not drastically decrease but rather remains uniform throughout the year. However, Site 7 is in a low-lying area and the secondary salinization mechanism is different at this station. In general, the volumetric water content at this station is relatively less than that of Site 3 throughout the year and much less during the summer (not shown). Presumably, the water runoff carries salinity downstream of Site 7 leaving the soil with less salt at Site 7. As a result, relatively less salinity was recorded in the summer at Site 7. There could be several other reasons, as we did not investigate the groundwater and surface water interaction. Regardless, the monthly salinity at Site 3 is relatively less than that at Site 7. Site 6 recorded the highest monthly salinity as it received more saline runoff from upstream, which was also revealed by the relatively higher moisture content at this location.
The graphical analysis also revealed that the salinity perceived at Site 4 (the outlet of diverted Blackbrook) was always higher than that of Site 3 (the outlet of Old Blackbrook Creek). This was not surprising as the diverted Blackbrook Creek was expected to carry a high amount of salt. Also, at site 4, a high variability in the soil salinity was observed, which could be due to the fluctuations observed in the diverted creek flow together with surface and groundwater interactions. Meanwhile, real-time data recorded at the other monitoring sites depicted little variations in soil EC. Moreover, the graphical monthly and seasonal analysis as noticed in the interquartile range from the measured electrical conductivity of box plots also depicted that Mentor Marsh had been experiencing persistent amounts of soil salinity.
Since we wanted to investigate the soil salinity variation from one location to another, we also analyzed the soil salinity using sporadic data from a hydro probe. A hydro probe was used to sample the soil salinity in more than 500 locations across the marsh. The soil mapping was prepared using the Kriging-Gaussian method (Figure 9). The analysis clearly revealed that the soil salinity was significantly higher in the eastern basin than that in the western basin.
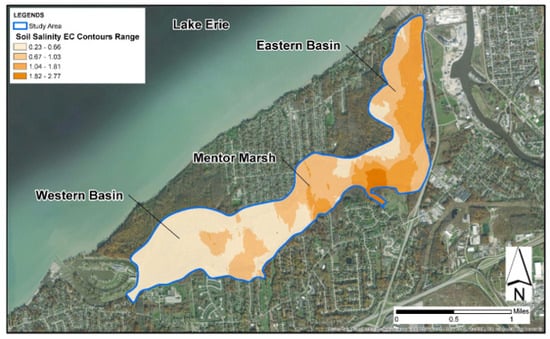
Figure 9.
Soil salinity mapping across the marsh using Kriging-Gaussian method.
4. Discussion
There were some stations where both the water and soil salinity were measured. For example, Site 1 and Station 8 were almost in the same location and the water and soil salinity were comparable. The water salinity was slightly higher than the soil salinity, especially during the winter. Both water and soil salinity had higher variability in winter and spring. The soil salinity in summer had less variability than the water salinity. Also, we put both soil salinity loggers (Site 3) and water salinity loggers (Station 6) virtually at the same location. Interestingly, the water salinity and soil salinity were comparable, except the water salinity tended to be higher during March/April. One of the key differences was that the water salinity was lowest in summer, whereas the soil salinity was highest in summer at this location.
Presumably, the salt fill sites and abandoned brine wells had been the major sources of salinity in the eastern part of the basin, whereas road salt was the major issue in the western section of the basin. Additionally, the windblown salt from the Morton Salt Company was responsible for the sudden spike in the eastern basin. The impact of the application of road salt into the road passing through the marsh has been of particular concern not only in this marsh but across the country. In general, freshwater wetlands experience ecological disturbance when the salinities exceed 1000 mg/L.
Mentor Marsh never received such a high flow required for flushing the salinity either to the eastern basin towards the Grand River or towards the western basin near Lake Erie [3,4]. As the runoff passes through the salt fill sites near Blackbrook Creek, it transports the salinity in the downstream marsh. Consequently, the salt accumulates behind the soil as the water evaporates, but the salinity is easily flushed neither towards the Grand River nor Lake Erie.
Over the period, the accumulated road salt might build up in the basin, which will again be dissolved during the next phase of the rainfall season. The continuous accumulation of salt in Mentor Marsh might be a potential risk for the future.
Deicing salt, when it enters the marsh, potentially alters the aquatic plant composition and alters the ecological systems. Consequently, road salt as a winter deicing agent has been easily transported from roads to the marsh resulting in invasive species. In addition, temperature can degrade the soil salinity significantly as high temperature causes the substantial evaporation of water from the soil surface. As a result, salinity increases in the soil surface due to the accumulation of salts.
Since the knowledge of the spatial and temporal distribution of water and soil salinity is essential for the restoration of the marsh, these findings are critical for the policymakers including the Lake County Soil and Water Conservation District and Cleveland Museum of Natural History for the restoration of the marsh and to decrease the salinity.
5. Conclusions
In this study, the water and soil salinity data were collected extensively across the marsh by establishing several monitoring stations for both water and soil salinity. The graphical analysis was conducted for both water and soil salinity at numerous monitoring locations both in the eastern and western basins. Moreover, the water salinity mapping was developed both for water and soil salinity using kriging. Our study revealed that the road salt being used for a deicing purpose during the snowfall period was the major source of the water salinity in the western basin, whereas the windblown salt, salt fill sites, and abandoned brine wells were the major causes of the water salinity in the eastern basin. The increased phragmite growth in the lower segment of the western basin of the marsh is due to road salt, whereas the significant growth of phragmites in the eastern basin of the marsh is due to salt from salt fill sites brine wells or windblown salt, or drainage from the Morton Salt Company.
For real-time monitoring of soil parameters, viz. electrical conductivity, moisture, and temperature, monitoring sites were established with the soil sensor probes located 1.5 ft beneath the ground surface. In the meantime, the variability in the soil and water salinity was detected through the time series plotting. Our analysis suggests that the temporal variability in water salinity is more than the soil salinity, especially on a daily scale. However, the variability in soil salinity was noticeable from month to month.
The spatial analysis of the soil salinity revealed that relatively higher salinity was prevalent in the eastern basin. The analysis suggested that the soil EC captured at these monitoring sites was consistently under the oligosaline range. While soil moisture and soil temperature varied significantly, their variation at most of the monitoring locations did not alter the soil salinity trends. Further research could be accomplished by considering a more in-depth numerical study relating to water and salinity.
The findings of this research can be useful for the stakeholders, who are engaged in the restoration of the marsh.
Author Contributions
S.S. conceptualized the research, analyzed the data, prepared the figures, and wrote the manuscript. R.B. helped with writing the paper, preparing the figures, and analyzing them in GIS. All authors have read and agreed to the published version of the manuscript.
Funding
We would like to acknowledge the Ohio Sea Grant (G00001148), Lake Erie Protection Fund (G00001065) and EPA Region 5 Wetland Grant (G00000992) for providing grant support to conduct this research.
Data Availability Statement
The datasets generated during and/or analyzed during the current study are available from the corresponding author upon reasonable request.
Acknowledgments
We would like to acknowledge the enormous contribution and strong motivation of Caitlin Stillisano from Lake County Soil and Water Conservation District to gather data for this research. We would also like to acknowledge the contribution of Chad Edgar and Adam G. Cimperman for monitoring the water and soil salinity across the marsh.
Conflicts of Interest
The authors declare no conflict of interest.
References
- Jolly, I.D.; McEwan, K.L.; Holland, K.L. A review of groundwater–surface water interactions in arid/semi-arid wetlands and the consequences of salinity for wetland ecology. Ecohydrol. Ecosyst. Land Water Process Interact. Ecohydrogeomorphol. 2008, 1, 43–58. [Google Scholar] [CrossRef]
- Nielsen, D.L.; Brock, M.A.; Rees, G.N.; Baldwin, D.S. Effects of increasing salinity on freshwater ecosystems in Australia. Aust. J. Bot. 2003, 51, 655–665. [Google Scholar] [CrossRef]
- Khadka, P.; Sharma, S.; Mathis, T. Monitoring an ungagged coastal marsh to analyze the salinity interaction of the marsh with Lake Erie. Environ. Monit. Assess. 2021, 193, 1–22. [Google Scholar] [CrossRef] [PubMed]
- Dhungel, H.; Sharma, S.; Bhatt, R.; Dhakal, K. Monitoring ungauged watersheds for investigating the variability of flow and salinity to implement the possible removal of salt fill sites. Environ. Monit. Assess. 2020, 192, 1–19. [Google Scholar] [CrossRef] [PubMed]
- Knighton, A.D.; Mills, K.; Woodroffe, C.D. Tidal-creek extension and saltwater intrusion in northern Australia. Geology 1991, 19, 831–834. [Google Scholar] [CrossRef]
- Wood, C.; Harrington, G.A. Influence of seasonal variations in sea level on the salinity regime of coastal groundwater–fed wetland. Groundwater 2015, 53, 90–98. [Google Scholar] [CrossRef] [PubMed]
- Baldwin, A.H.; Mendelssohn, I.A. Effects of salinity and water level on coastal marshes: An experimental test of disturbance as a catalyst for vegetation change. Aquatic Bot. 1998, 61, 255–268. [Google Scholar] [CrossRef]
- Goodsell, J.T. Distribution of waterbird broods relative to wetland salinity and pH in south-western Australia. Wildl. Res. 1990, 17, 219–229. [Google Scholar] [CrossRef]
- Halse, S.A.; Ruprecht, J.K.; Pinder, A.M. Salinisation and prospects for biodiversity in rivers and wetlands of south-west Western Australia. Aust. J. Bot. 2003, 51, 673–688. [Google Scholar] [CrossRef]
- Antonellini, M.; Mollema, P.N. Impact of groundwater salinity on vegetation species richness in the coastal pine forests and wetlands of Ravenna, Italy. Ecol. Eng. 2010, 36, 1201–1211. [Google Scholar] [CrossRef]
- Holman, I.P.; Hiscock, K.M. Land drainage and saline intrusion in the coastal marshes of northeast Norfolk. Q. J. Eng. Geol. 1998, 31, 47–62. [Google Scholar] [CrossRef]
- Oude Essink, G.H. Salt water intrusion in a three-dimensional groundwater system in the Netherlands: A numerical study. Transp. Porous Media 2001, 43, 137–158. [Google Scholar] [CrossRef]
- Enright, C.; Culberson, S.D. Salinity trends, variability, and control in the northern reach of the San Francisco Estuary. San Franc. Estuary Watershed Sci. 2009, 7. [Google Scholar] [CrossRef]
- Jun, M.H.; Altor, A.; Craft, C.B. Effects of increased salinity and inundation on inorganic N and P exchange by tidal freshwater floodplain forest soils, Georgia (USA). Estuaries Coasts 2013, 36, 508–518. [Google Scholar] [CrossRef]
- Krauss, K.W.; Duberstein, J.A. Sapflow and water use of freshwater wetland trees exposed to saltwater incursion in a tidally influenced South Carolina watershed. Can. J. For. Res. 2010, 40, 525–535. [Google Scholar] [CrossRef]
- Collins, S.J.; Russell, R.W. Toxicity of road salt to Nova Scotia amphibians. Environ. Pollut. 2009, 157, 320–324. [Google Scholar] [CrossRef]
- Kaushal, S.S.; Groffman, P.M.; Likens, G.E.; Belt, K.T.; Stack, W.P.; Kelly, V.R.; Band, L.E.; Fisher, G.T. Increased salinization of fresh water in the northeastern United States. Proc. Natl. Acad. Sci. USA 2005, 102, 13517–13520. [Google Scholar] [CrossRef] [PubMed]
- Findlay, S.E.; Kelly, V.R. Emerging indirect and long-term road salt effects on ecosystems. Ann. N. Y. Acad. Sci. 2011, 1223, 58–68. [Google Scholar] [CrossRef]
- Blasius, B.J.; Merritt, R.W. Field and laboratory investigations on the effects of road salt (NaCl) on stream macroinvertebrate communities. Environ. Pollut. 2002, 120, 219–231. [Google Scholar] [CrossRef]
- Drake, K.; Halifax, H.; Adamowicz, S.C.; Craft, C. Carbon sequestration in tidal salt marshes of the Northeast United States. Environ. Manag. 2015, 56, 998–1008. [Google Scholar] [CrossRef]
- Berzas, J.J.; García, L.F.; Rodríguez, R.C.; Martín-Álvarez, P.J. Evolution of the water quality of a managed natural wetland: Tablas de Daimiel National Park (Spain). Water Res. 2000, 34, 3161–3170. [Google Scholar] [CrossRef]
- Herbert, E.R.; Boon, P.; Burgin, A.J.; Neubauer, S.C.; Franklin, R.B.; Ardón, M.; Hopfensperger, K.N.; Lamers, L.P.M.; Gell, P. A global perspective on wetland salinization: Ecological consequences of a growing threat to freshwater wetlands. Ecosphere 2015, 6, 1–43. [Google Scholar] [CrossRef]
- Corwin, D.L. Climate change impacts on soil salinity in agricultural areas. Eur. J. Soil Sci. 2021, 72, 842–862. [Google Scholar] [CrossRef]
- Abrol, I.P.; Yadav, J.S.P.; Massoud, F.I. Salt-Affected Soils and Their Management; FAO Soils Bulletin, Soil Resources, Management and Conservation Service, FAO Land and Water Development Division: Rome, Italy, 1988; p. 131. [Google Scholar]
- Abbas, A.; Khan, S.; Hussain, N.; Hanjra, M.A.; Akbar, S. Characterizing soil salinity in irrigated agriculture using a remote sensing approach. Phys. Chem. Earth Parts A/B/C 2013, 55, 43–52. [Google Scholar] [CrossRef]
- Moral, R.; Perez-Murcia, M.D.; Perez-Espinosa, A.; Moreno-Caselles, J.; Paredes, C.; Rufete, B. Salinity, organic content, micronutrients and heavy metals in pig slurries from South-eastern Spain. Waste Manag. 2008, 28, 367–371. [Google Scholar] [CrossRef] [PubMed]
- Patel, A. Geotechnical Investigations and Improvement of Ground Conditions; Woodhead Publishing: Sawston, UK, 2019. [Google Scholar]
- Moreira Barradas, J.M.; Abdelfattah, A.; Matula, S.; Dolezal, F. Effect of fertigation on soil salinization and aggregate stability. J. Irrig. Drain. Eng. 2015, 141, 05014010. [Google Scholar] [CrossRef]
- Lefebvre, O.; Moletta, R. Treatment of organic pollution in industrial saline wastewater: A literature review. Water Res. 2006, 40, 3671–3682. [Google Scholar] [CrossRef]
- Wang, W.; Vinocur, B.; Altman, A. Plant responses to drought, salinity and extreme temperatures: Towards genetic engineering for stress tolerance. Planta 2003, 218, 1–14. [Google Scholar] [CrossRef] [PubMed]
- Argaman, E.; Keesstra, S.D.; Zeiliguer, A. Monitoring the impact of surface albedo on a saline lake in SW Russia. Land Degrad. Dev. 2012, 23, 398–408. [Google Scholar] [CrossRef]
- Saviozzi, A.; Cardelli, R.; Di Puccio, R. Impact of salinity on soil biological activities: A laboratory experiment. Commun. Soil Sci. Plant Anal. 2011, 42, 358–367. [Google Scholar] [CrossRef]
- Habibullah, M.; Ahmed, A.U.; Karim, Z. Assessment of foodgrain production loss due to climate induced enhanced soil salinity. In Vulnerability and Adaptation to Climate Change for Bangladesh; Springer: Dordrecht, The Netherlands, 1999; pp. 55–70. [Google Scholar]
- Shrivastava, P.; Kumar, R. Soil salinity: A serious environmental issue and plant growth promoting bacteria as one of the tools for its alleviation. Saudi J. Biol. Sci. 2015, 22, 123–131. [Google Scholar] [CrossRef] [PubMed]
- Szabo, S.; Hossain, M.; Adger, W.N.; Matthews, Z.; Ahmed, S.; Lázár, A.N.; Ahmad, S. Soil salinity, household wealth and food insecurity in tropical deltas: Evidence from south-west coast of Bangladesh. Sustain. Sci. 2016, 11, 411–421. [Google Scholar] [CrossRef] [PubMed]
- Benbow, M.E.; Merritt, R.W. Road-salt toxicity of select Michigan wetland macroinvertebrates under different testing conditions. Wetlands 2004, 24, 68–76. [Google Scholar] [CrossRef]
- Daley, M.L.; Potter, J.D.; McDowell, W.H. Salinization of urbanizing New Hampshire streams and groundwater: Effects of road salt and hydrologic variability. J. N. Am. Benthol. Soc. 2009, 28, 929–940. [Google Scholar] [CrossRef]
- Mussato, B.T.; Gepraegs, O.K.; Seabrook, P.T.; Davidson, J.P.; Charlton, R.S.; Parker, R.D. Guidelines for the Selection of Snow and Ice Control Materials to Mitigate Environmental Impacts; Transportation Research Board: Washington, DC, USA, 2007. [Google Scholar]
- Fineran, S.A. Assessing Spatial and Temporal Vegetative Dynamics at Mentor Marsh, 1796 to 2000 AD; The Ohio State University: Columbus, OH, USA, 2003. [Google Scholar]
- Munns, R. Salinity, growth and phytohormones. In Salinity: Environment-Plants-Molecules; Springer: Dordrecht, The Netherlands, 2002; pp. 271–290. [Google Scholar]
- Maas, E.V.; Nieman, R.H. Physiology of plant tolerance to salinity. Crop Toler. Suboptim. Land Cond. 1978, 32, 277–299. [Google Scholar]
- Flowers, T.J.; Troke, P.F.; Yeo, A.R. The mechanism of salt tolerance in halophytes. Ann. Rev. Plant Physiol. 1977, 28, 89–121. [Google Scholar] [CrossRef]
- Matoh, T.; Matsushita, N.; Takahashi, E. Salt tolerance of the reed plant Phragmites communis. Physiol. Plant. 1988, 72, 8–14. [Google Scholar] [CrossRef]
- Matson, T.O.; Smith, D.; Skerlec, S. A Survey of the Turtles of Mentor Marsh, Lake County, Ohio; Ohio Biological Survey, Inc.: Columbus, OH, USA, 2017. [Google Scholar]
- Xie, P.F. Socio-Economic Impacts of Birdwatching along Lake Erie: A Coastal Ohio Analysis; Bowling Green State University: Bowling Green, OH, USA, 2012. [Google Scholar]
- Jones, K. The continuing story of Mentor Marsh; Cleveland Museum of Natural History: Cleveland, OH, USA, 1975. [Google Scholar]
- Whipple, J.C. Geological and Environmental Assessment of Mentor Marsh. A Thesis Presented to the Graduate Faculty of the University of Akron. Ph.D. Thesis, Department of Geology, University of Akron, Mentor, OH, USA, 1999. [Google Scholar]
- Fofonoff, N.P. Computation of potential temperature of seawater for an arbitrary reference pressure. Deep. Sea Res. 1977, 24, 489–491. [Google Scholar] [CrossRef]
- Krige, D.G. A Statistical Approach to Some Basic Mine Valuation Problems on the Witwatersrand. J. Chem. Metall. Min. Soc. S. Afr. 1951, 52, 119–139. [Google Scholar]
- Volpi, G.; Gambolati, G. On the Use of a Main Trend for the Kriging Technique in Hydrology. Adv. Water Resourvoir. 1978, I, 345–349. [Google Scholar] [CrossRef]
- Novotny, E.V.; Murphy, D.; Stefan, H.G. Increase of urban lake salinity by road deicing salt. Sci. Total Environ. 2008, 406, 131–144. [Google Scholar] [CrossRef] [PubMed]
- Basile, S.J.; Rauscher, S.A.; Steiner, A.L. Projected precipitation changes within the Great Lakes and Western Lake Erie Basin: A multi-model analysis of intensity and seasonality. Int. J. Climatol. 2017, 37, 4864–4879. [Google Scholar] [CrossRef]
- Al-Shammiri, M. Evaporation rate as a function of water salinity. Desalination 2002, 150, 189–203. [Google Scholar] [CrossRef]

Disclaimer/Publisher’s Note: The statements, opinions and data contained in all publications are solely those of the individual author(s) and contributor(s) and not of MDPI and/or the editor(s). MDPI and/or the editor(s) disclaim responsibility for any injury to people or property resulting from any ideas, methods, instructions or products referred to in the content. |
© 2023 by the authors. Licensee MDPI, Basel, Switzerland. This article is an open access article distributed under the terms and conditions of the Creative Commons Attribution (CC BY) license (https://creativecommons.org/licenses/by/4.0/).