Abstract
The present work focuses on the removal of dyes from polluted water, and, more precisely, the targets are crystal violet (CV) and methylene blue (MB). For this purpose, a series of Zr-modified catalysts based on microporous Engelhard Titanium Silicate 10 (ETS-10) were developed and synthesized. Aiming at improvement in the photodegradation efficiency and stability of ETS-10, Zr centers replacing part of Ti ones were introduced during the synthesis procedure. The obtained Na-K-ETS-10/xZr catalysts were characterized by X-ray powder diffraction (XRD), wavelength dispersive X-ray fluorescence (WDXRF), N2 physisorption and Fourier transform infrared spectroscopy (FTIR). The photocatalytic properties of Na-K-ETS-10/xZr- (x = 5, 10, 15 and 20 wt% Zr) catalysts were studied in terms of water purification from crystal violet and methylene blue. The Na-K-ETS-10/xZr wt% x = 6 catalyst appeared to be the most efficient in the photodegradation of CV and MB, removing nearly 100% of the dyes. Kinetic studies showed that the removal of CV and MB is a rapid process and one, which obeys the non-linear pseudo-second-order model.
1. Introduction
Our society faces a critical challenge tied with the increasing demand for water resources, as only 3.5% of earth’s water is freshwater. This includes basins, lakes, rivers, groundwater and ice, all of which require careful monitoring. Various factors, such as environmental contaminants, technological advances, evolving water treatment methods and a deepened understanding of the link between water quality and human well-being, have led global health bodies, such as the World Health Organization (WHO) [1] and the European Union (EU), to establish and refine drinking water quality standards (Water Framework Directive 2000/60/EU (WFD) and Drinking Water Directive (2020/2184)) [2]. Numerous industries contribute to water pollution, with textile, pharmaceutical and mining industries among them. The textile industry, in particular, is a major polluter due to the release of dyes, chemicals and untreated wastewater [3,4,5]. Noteworthy pollutants in the textile industry include reactive dyes (prone to leaching), azo dyes (potentially carcinogenic breakdown products), indigo dye (from denim production) and direct dyes with poor fixation on fabrics. Crystal violet (CV) and methylene blue (MB), categorized as basic dyes, are used in textiles and biological staining [6]. However, CV and MB are stable in harsh conditions, pose environmental and health risks, and resist conventional degradation methods [7]. Considering the need for effective removal, various methods have been implemented, including chemical, physical and biological approaches [8,9]. Photocatalysis stands out due to its simplicity, absence of secondary pollution and recyclability. Zeolite-type porous materials, combining adsorption and photocatalysis, offer a promising solution [10]. These materials, characterized by a developed surface and good thermal stability, can undergo ion exchange, allowing for changes in their chemical composition and physicochemical properties [10,11]. Titanium Silicate 10 (ETS-10) has shown promising photocatalytic applications in various fields. ETS-10 is a zeolite-type material with a microporous framework characterized by pores ranging from 4 to 10 Å. The unique feature of ETS-10 is the replacement of aluminum (Al) with titanium (Ti), adopting an octahedral configuration [TiO6]2−. In photocatalysis, ETS-10 has demonstrated significant potential due to several advantageous properties. First, the Al/Ti substitution results in a more acid-resistant compound, enhancing stability under varying conditions. This stability is crucial for maintaining catalytic activity over extended periods [12]. Additionally, the material exhibits high ionic conductivity, good acidity and pH stability, contributing to its effectiveness as a photocatalyst. The photocatalytic activity of ETS-10 is particularly relevant in the degradation of organic dyes. In the presence of UV-Vis radiation, ETS-10 can initiate photoreactions, leading to the breakdown of dye molecules. Furthermore, ETS-10 offers simplicity in its application as a photocatalyst, often involving a straightforward reactor setup. Its ability to avoid secondary pollution caused by degraded organic substances and its recyclability make it an environmentally friendly choice for water purification [13]. The main drawbacks associated with ETS-10 photocatalytic application are related to its strict synthesis and modification conditions, its limited visible light absorption, surface area constraints—e.g., it requires microporosity—its deactivation due to factors such as agglomeration, reduction in surface area or changes related to structural and physicochemical properties.
In this context, ETS-10 zeolite modification with Zr (Na-K-ETS-10/xZr) is explored in this work. The study includes a repeatable and scalable hydrothermal synthesis, determining the limit of Zr/Ti substitution. The characterization of the synthesized materials was preformed using XRD, WDXRF, FTIR and N2 physisorption. The catalytic degradation of organic dyes CV and MB by the obtained Na-K-ETS-10/xZr samples is repeatable and achieved using white light irradiation. The data disclose 95–98% photodegradation, catalyst reutilization in several (four) cycles, regeneration of the catalytic activity up to the starting efficiency using ethanol washing. The PSO kinetics and photodegradation experiments conducted involving scavengers (IPA or EDTA) suggest a classical mechanism of photodegradation involving •OH and •O2− free radicals.
2. Materials and Methods
2.1. Materials
All starting reagents for the synthesis of Na-K-ETS-10, Na-K-ETS-10/xZr forms and those used for photocatalytic activity experiments were purchased from Sigma Aldrich (Schnelldorf, Germany) or Alfa Aesar (Heysham, UK) and used without additional purification. The reagents used included nanosized silicon dioxide (Fumed SiO2, 0.2–0.3 µm aggregates, Sigma Aldrich), nanosized titanium dioxide (TiO2, 99.6%, particle size 21 nm, Sigma Aldrich), sodium hydroxide (NaOH, 97%, Sigma Aldrich), potassium fluoride (KF, purity Alfa Aesar), Zirconium(IV) chloride (ZrCl4, 99.9%, Sigma Aldrich), methylene blue hydrate (>97%, Sigma Aldrich), crystal violet (97%, Sigma Aldrich). The water used was ultrapure water (electrical conductivity—0.055 µS/cm, Q-FRONT EDI/BIO, Adrona, Rīga, Latvia).
2.1.1. Synthesis of Na-K-Engelhard Titanium Silicate 10 (Na-K-ETS-10)
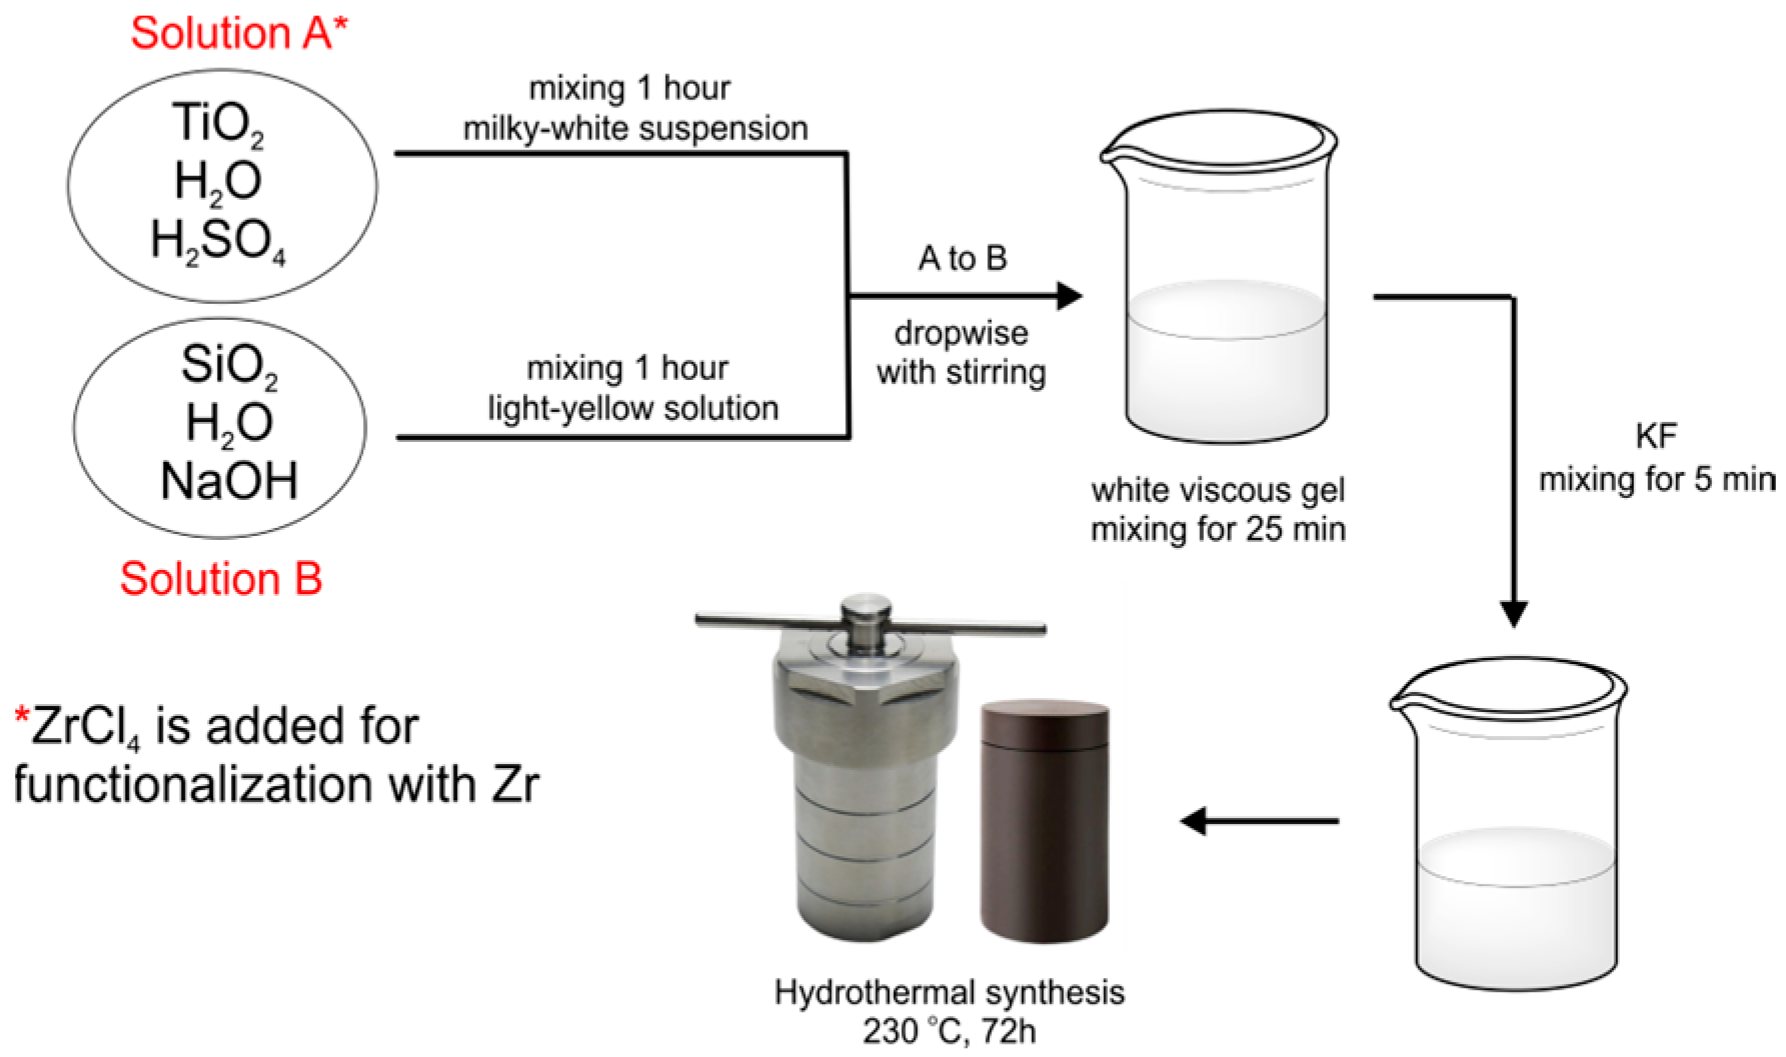
The titanosilicate Na-K-ETS-10 was synthesized from a viscous gel with a molar composition 7.65 Na2O:1.36 K2O:5.44 H2SO4:1.82 TiO2:10 SiO2:101 H2O [14,15,16]. The initial viscous gel was obtained by a slow addition of an acidic suspension of nanosized TiO2 (Solution A) to an alkaline aqueous solution of nanosized SiO2 (Solution B) with vigorous stirring at room temperature. In a typical procedure, Solution A was prepared by adding 0.8 g of nanosized TiO2 to 2 mL of distilled water and 1.6 ml of conc. H2SO4, followed by homogenization for 1 h with stirring. The resulting TiO2-H2SO4-H2O mixture appeared as a milky-white suspension. Solution B was obtained by adding 3.36 g of NaOH to 8 mL of distilled water with stirring. After dissolution of NaOH (~20 min), 3.30 g of nanosized SiO2 was slowly added with vigorous stirring until complete dissolution. The resulting light-yellow solution was homogenized for additional 1 h. Next, Solution A was added dropwise to Solution B, under constant stirring (for approximately 45 min). The resulting white viscous gel was homogenized for 25 min; then, 0.87 g of KF was added with additional 5 min of stirring. The pH of the viscous gel should be around 10.5. Finally, the gel was transferred to a 20 mL Teflon or PPL-lined autoclave, and crystallization of Na-K-ETS-10 was achieved under autogenous pressure at 230 °C for 72 h. The obtained product was vacuum-filtered and washed several times with distilled water until the pH reached ~7–8 and dried at 60 °C for 2 h. The synthesis steps are visualized in Scheme 1.

Scheme 1.
Depiction of the Na-K-ETS-10/xZr synthesis steps.
2.1.2. Functionalization of Na-K-ETS-10 with Zr
The partial substitution of Ti with Zr in the ETS-10 framework was performed in situ by adding 5, 10, 15 or 20 mol% ZrCl4 to the initial viscous gel at the expense of the same amount of TiO2. Thus, the molar composition of the initial gel can be given as 7.65 Na2O:1.36 K2O:5.44 H2SO4:xZrCl4:(1.82 − x) TiO2:10 SiO2:101 H2O, where x = 0.09, 0.18, 0.27 and 0.36. The procedure for preparing the initial viscous gel was similar to that for obtaining Na-K-ETS-10, with the exception that the required amount of ZrCl4 was added to the acidic suspension containing TiO2. Crystallization was performed in stainless-steel Teflon or PPL-lined autoclave under autogenous static conditions for 72 h at 230 °C. The obtained products were vacuum-filtered and washed several times with distilled water until the pH reached ~7–8 and dried at 60 °C for 2 h. The prepared Zr-modified samples (before performing WDXRD analyses) were labeled Na-K-ETS-10/xZr, where x = 5, 10, 15 and 20, corresponding to the added amount of ZrCl4.
2.2. Methods of Characterization
2.2.1. Powder X-ray Diffraction (PXRD) Analysis
Powder X-ray diffraction analysis was performed on Empyrean (Malvern Panalytical, Almelo, The Netherlands) diffractometer equipped with a PIXcel3D detector and copper X-ray source (CuKα = 1.5406 Å). The diffracting patterns were collected in the 3–70° 2Theta range, under operating conditions of 40 kV and 30 mA and a step size of 0.013°.
2.2.2. Wavelength Dispersive X-ray Fluorescence (WDXRF) Spectroscopy
The chemical composition of the synthesized samples was determined on a Supermini200 WDXRF spectrometer (Rigaku, Tokyo, Japan). Data collection was performed at 50 kV and 4.00 mA. Each sample was crushed and then pressed to obtain a tablet. The sample/tablet was placed in a holder with an irradiated area of 30 mm in diameter. The weight ratio of the amount of sample to the amount of glue (Acrawax C powder) was 5:1. A semi-quantitative method (SQX) was used to determine the elemental composition.
2.2.3. Specific Surface Area Analysis—N2 Physisorption
The specific surface area and porosity of Na-K-ETS-10 and Zr-modified Na-K-ETS-10 were analyzed using 3Flex surface analyzer (Micromeritics, Norcross, GA, USA). Before analysis, the samples were degassed in situ at 90 °C for 5 h under vacuum (>1.10−6 mmHg). The physisorption experiments were carried out under liquid nitrogen (77 K) using N2 probe molecule. Quantitative information for the specific surface area (S, m2·g−1), micropore volume (Vm, cm3·g−1), pore size distribution, etc., was obtained by analyzing the resulting N2 adsorption/desorption isotherms. Brunauer, Emmett and Teller (BET) specific surface areas were calculated from adsorption data in the relative pressure range from 0.05 to 0.31 [17]. The total pore volume was estimated based on the amount adsorbed at a relative pressure of 0.96 [18]. Micropore volumes were determined using the t-plot method [19] and the Horvath–Kawazoe micropore algorithm [20]. Pore size distributions (PSDs) were calculated from nitrogen adsorption data using an algorithm based on the ideas of Barrett, Joyner and Halenda (BJH) [21]. The mesopore diameters were determined as the maxima on the PSD for the given samples.
2.2.4. Fourier Transform Infrared (FTIR) Spectroscopy
The samples were examined using a Tensor 37 (Bruker, Berlin, Germany) spectrometer using KBr pellets. For each sample, 128 scans were collected at a resolution of 2 cm−1 over the wavenumber region 4000–400 cm−1.
2.3. Photocatalytic Degradation Experiments
The effective photocatalytic degradation of the organic dyes—crystal violet and methylene blue—in the presence of Zr-substituted Na-K-ETS-10 was evaluated using UV-Vis spectroscopy. The details of the experiments were as follows: 50 mg of zeolite Na-K-ETS-10/xZr was added to 10 mL of a 10 µg/mL CV or MB dye solution and stirred for 60 min at ambient conditions. The absorption resulting from the photodegradation of the dye was monitored at 585 nm for CV and 660 nm for MB using Biowave S2100 spectrophotometer (Biochrom WPA, Cambridge, UK) or Cary 4000 (Agilent, Santa Clara, CA, USA). The kinetics of the photodegradation reactions were examined based on the change in dye concentration by measuring the characteristic absorbance peak at different irradiation times. The efficiency of photodegradation was determined using the following equation [4,22]:
where C0 and C are the solution concentration at t = 0 and after some irradiation time.
3. Results and Discussion
One of the drawbacks associated with ETS-10 is related to its synthesis conditions. This is indeed valid, as we attempted several recipes for obtaining a monophasic Na-K-ETS-10 (without the use of organic structure-directing agent), but in most cases, the synthesis yielded Na-K-ETS-10 and a second phase, e.g., quartz, ETS-4, AM-1 or a significant amorphous halo. For example, the use of TiCl4 solution with SiO2 (not nanosized) resulted in a mixture of crystalline and amorphous phases. The combination of TiCl4 solution and nanosized SiO2 produced ETS-10 and quartz or ETS-10 and ETS-4 depending on the time and temperature. When titanium isopropoxide was employed as a Ti source, the results were similar. Noh et al. [14] claimed that for reproducible synthesis of ETS-10, the Ti source must be nanosized. This was confirmed in our experiments when P25 Degussa (anatase to rutile at an 80:20 ratio) was employed in the synthesis, yielding only small amounts of impurities. In their synthesis, Noh et al. [14] chose commercial Ti(SO4)2 or TiOSO4 as the Ti sources and sodium silicate or Ludox-AS40 solutions as the Si sources. In our case, Ti was introduced as a TiO2 nanopowder dissolved in H2O/H2SO4 solution. The silica source was introduced as amorphous fumed silica (nano silica) dissolved in NaOH/H2O solution. In order to minimize the quartz “formation”, the SiO2-NaOH/H2O dissolution was carried out in a plastic beaker. The obtained molar composition was 7.65 Na2O:2.72 KF:5.44 H2SO4:1.82 TiO2:10 SiO2:101 H2O. This molar composition fell within the crystallization region for ETS-10 proposed by Noh et al. [14], although the total H2O content was significantly reduced, resulting in formation of a viscous gel. Potassium fluoride was added to the gel just before its transfer into the Teflon/PPL vessel, and the pH was adjusted to around 10.5 (preventing the formation of ETS-4 at higher pH). Tentatively, KF helps the stabilization of the small 7-membered cages in the ETS-10 framework. Finally, the optimal temperature for the synthesis of Na-K-ETS-10 was found to be 230–240 °C.
The above considerations resulted in the synthesis of XRD pure Na-K-ETS-10 and also the partially substituted Zr forms. All samples obtained were characterized by WDXRF, PXRD, FTIR and N2 adsorption/desorption for micro-/mesoporosity, specific surface and PSDs.
3.1. Physicochemical Characterization of Na-K-ETS-10/xZr Form
The chemical composition of the obtained samples was investigated by WDXRF (Table 1). Based on the WDXRF results, it is visible that although the starting amounts of Zr are 5, 10, 15 and 20 wt%, the final amounts are ~3, 6, 8 and 12 wt%. Thus, not all of the supplied Zr managed to incorporate and substitute Ti in the ETS-10 framework. In addition, the amounts of Si exhibit a gradual decrease as the amounts of Zr increase (Table 1). This divergence in the expected chemistry suggests that the introduction of Zr atoms, in addition to replacing Ti atoms, produces Si vacancies in the ETS-10 framework [23] (Table 2). The explanation is related to the greater ionic radius of Zr than Ti and the possible partial dissolution of silica on the outer surfaces of the particles.

Table 1.
WDXRF—Elemental analysis of the synthesized Na-K-ETS-10/xZr samples.
Table 2.
Chemical composition of the synthesized samples.
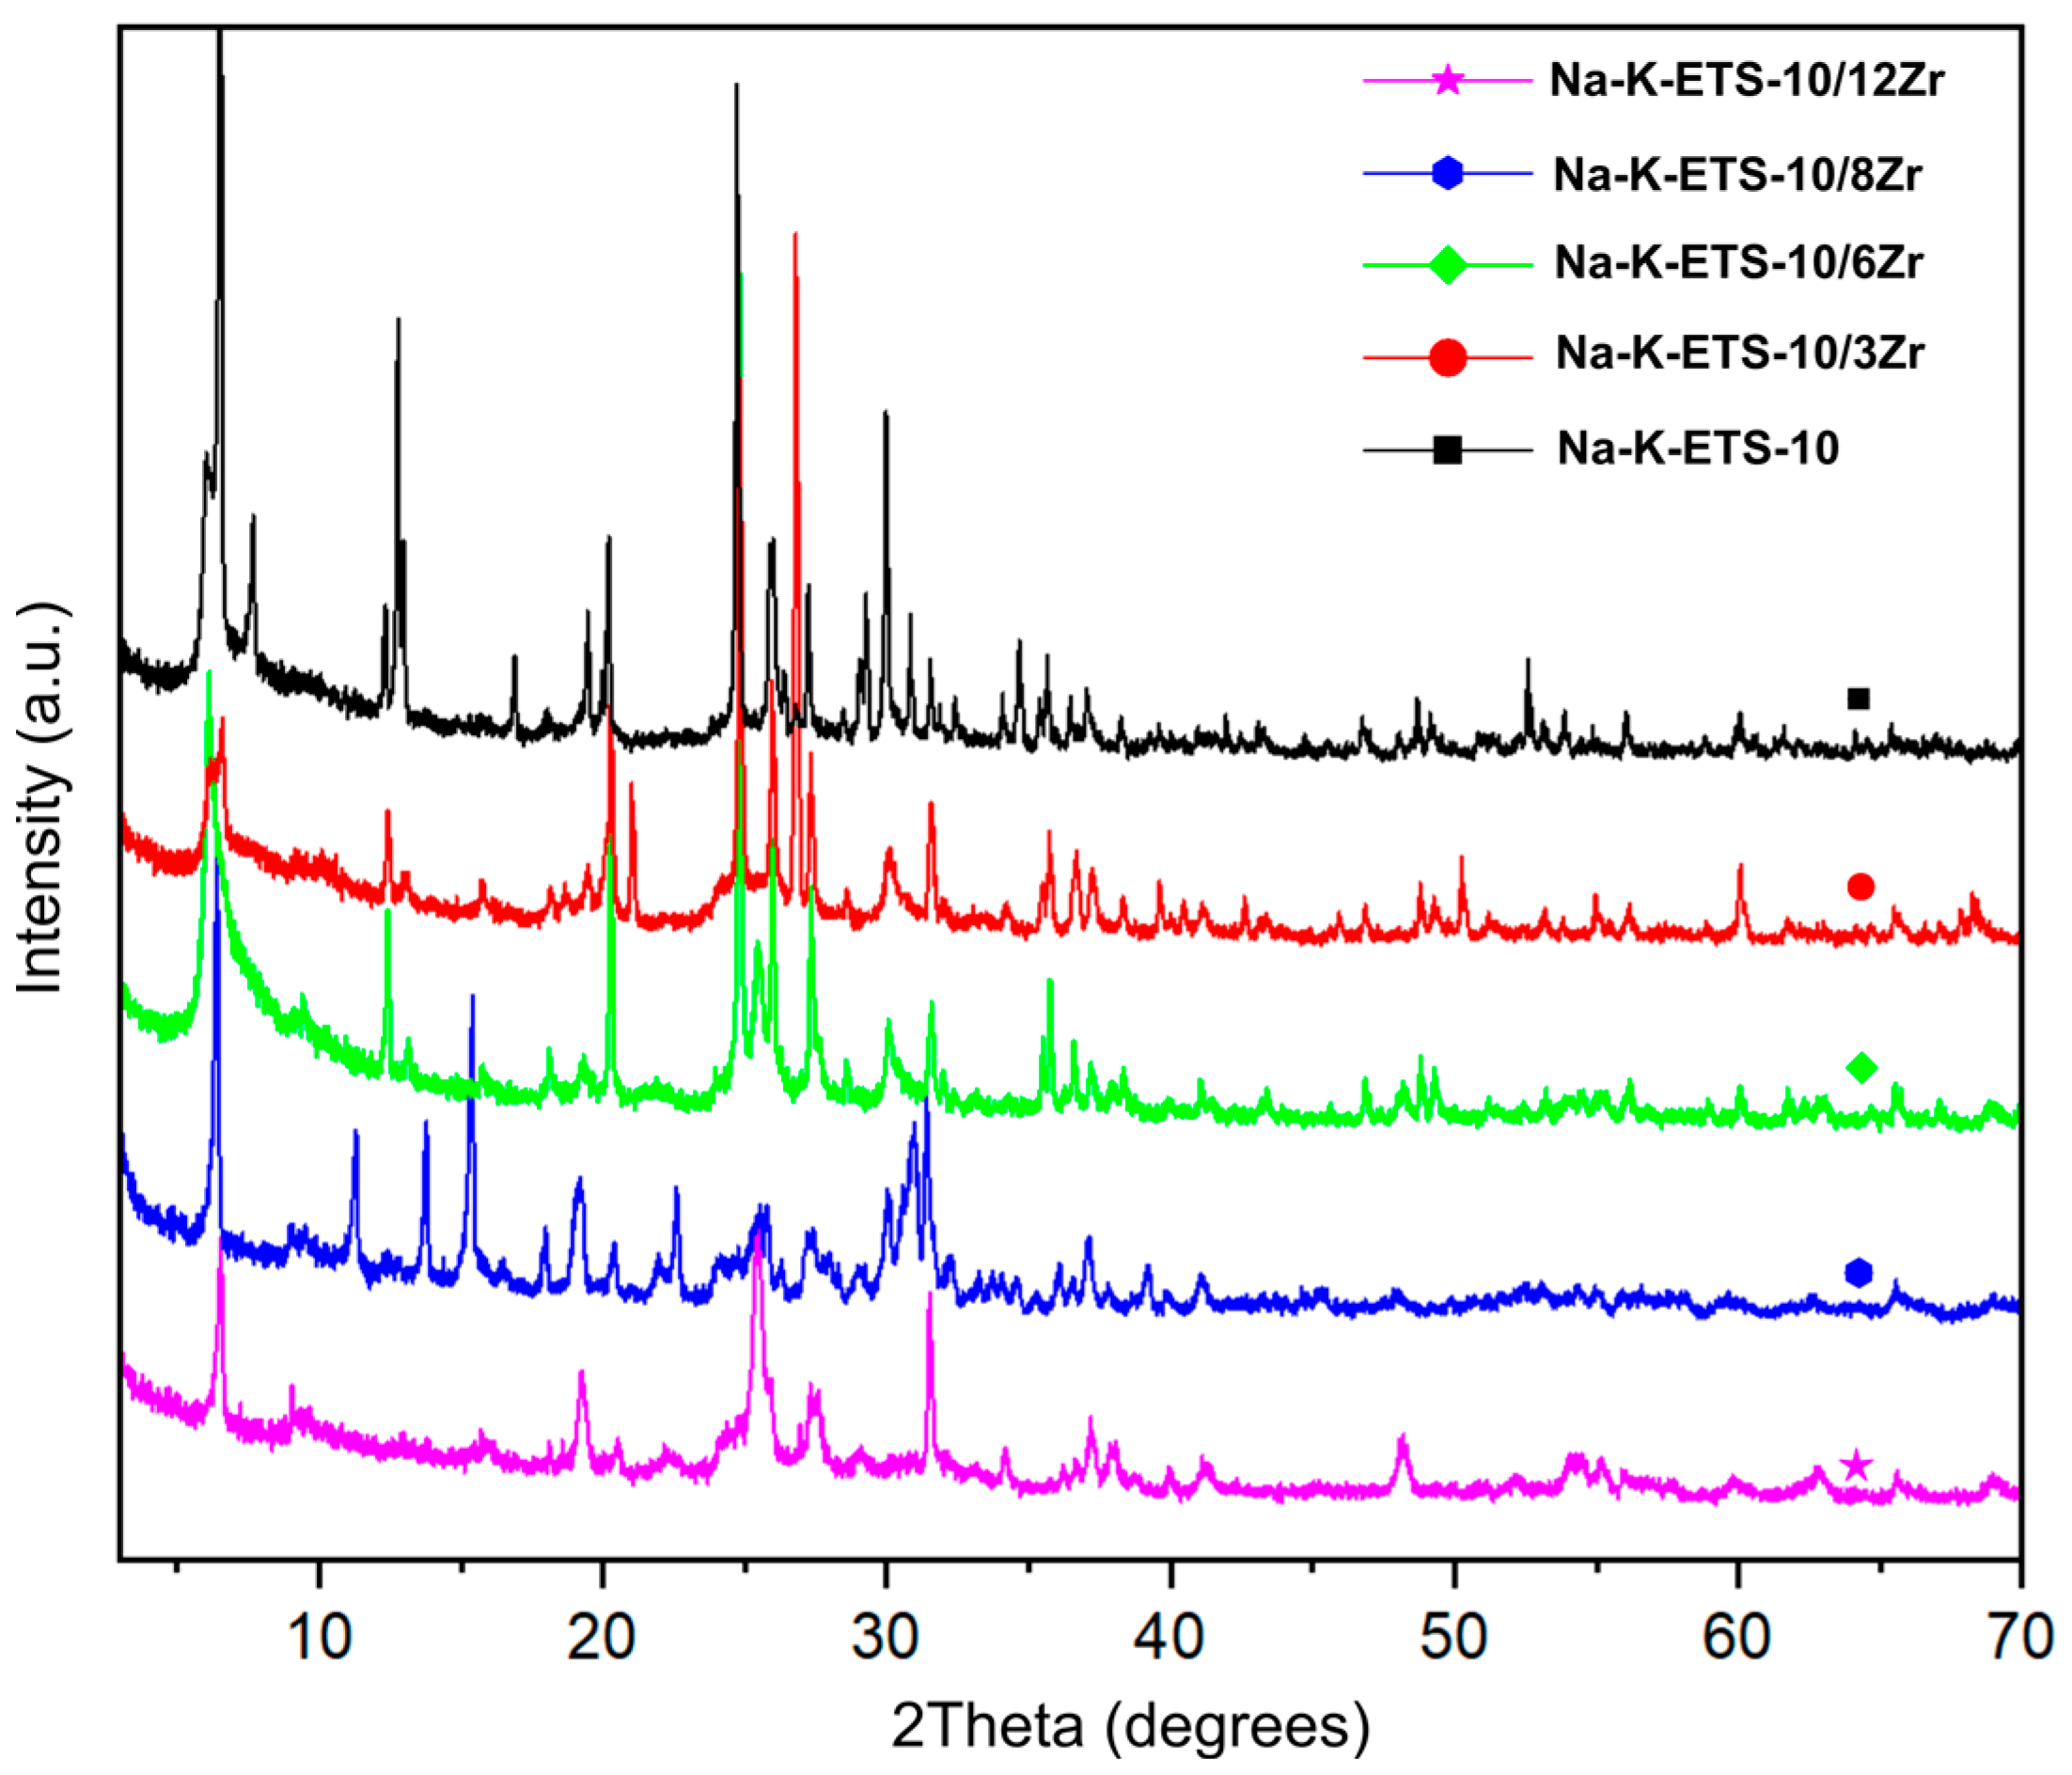
The data from WDXRF suggesting an imbalance in the chemical composition of the synthesized Na-K-ETS-10/xZr (x = 3, 6, 8 and 12) samples with the increase in Zr content are further supported by the powder X-ray diffraction results employed to monitor the syntheses and for phase identification. The PXRD patterns of the Na-K-ETS-10 and Na-K-ETS-10/xZr zeolites of the catalysts studied are shown in Figure 1. The PXRD data revealed that the starting Na-K-ETS-10 matched closely the ICDD pattern 01-073-9935 [24], and thus, the conclusion was that the synthesized samples are monophasic.
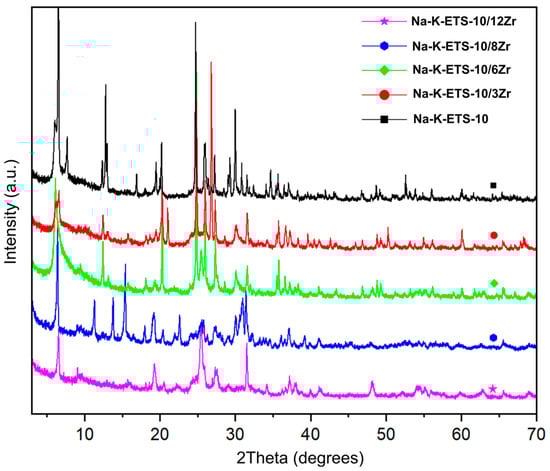
Figure 1.
X-ray powder diffraction of patterns of the studied samples.
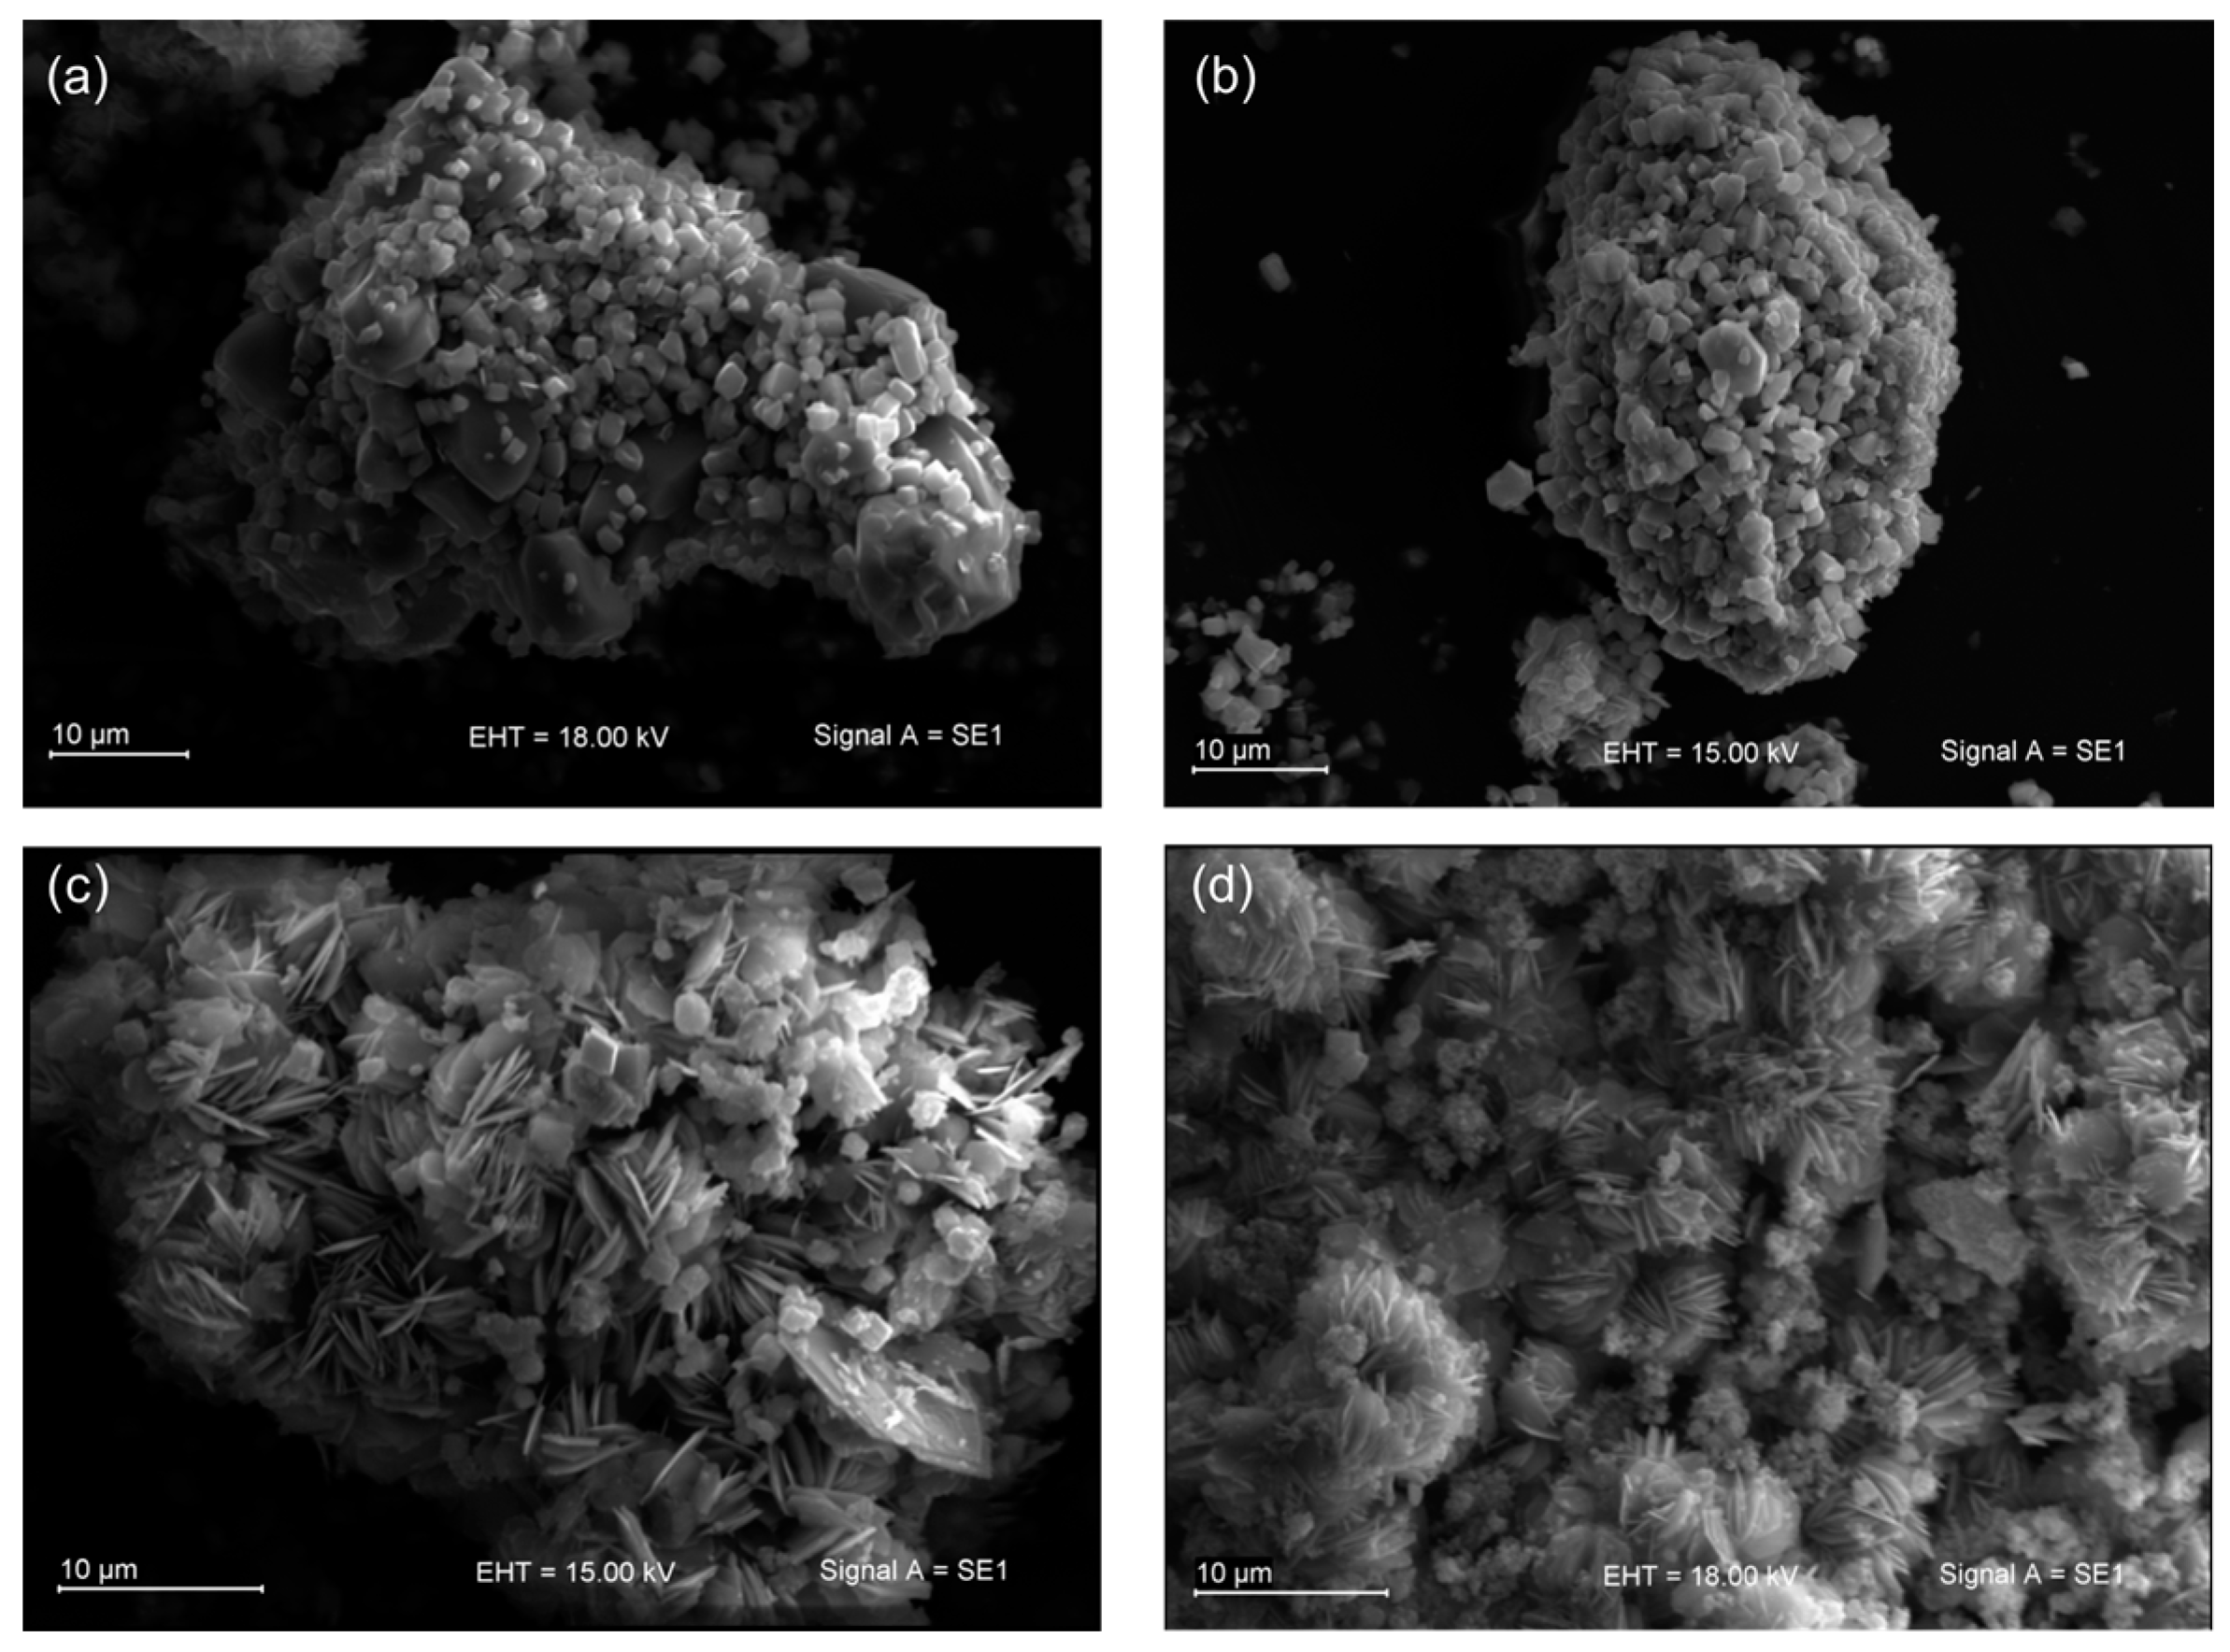
In the case of samples with x = 3 and x = 6 Zr, the PXRD shows that the structure is preserved, although some of the diffraction maxima at higher angles have lower intensity or are undetected. On the other hand, the PXRD of samples containing higher amounts of Zr—8 wt% and 12 wt%—reveals the destruction of the ETS-10 framework. This is also visualized in the SEM micrographs (Figure 2).

Figure 2.
Scanning electron microscope pictures of Na-K-ETS-10/xZr: (a) x = 3 wt%, (b) x = 6 wt%, (c) x = 8 wt% and (d) x = 12 wt%.
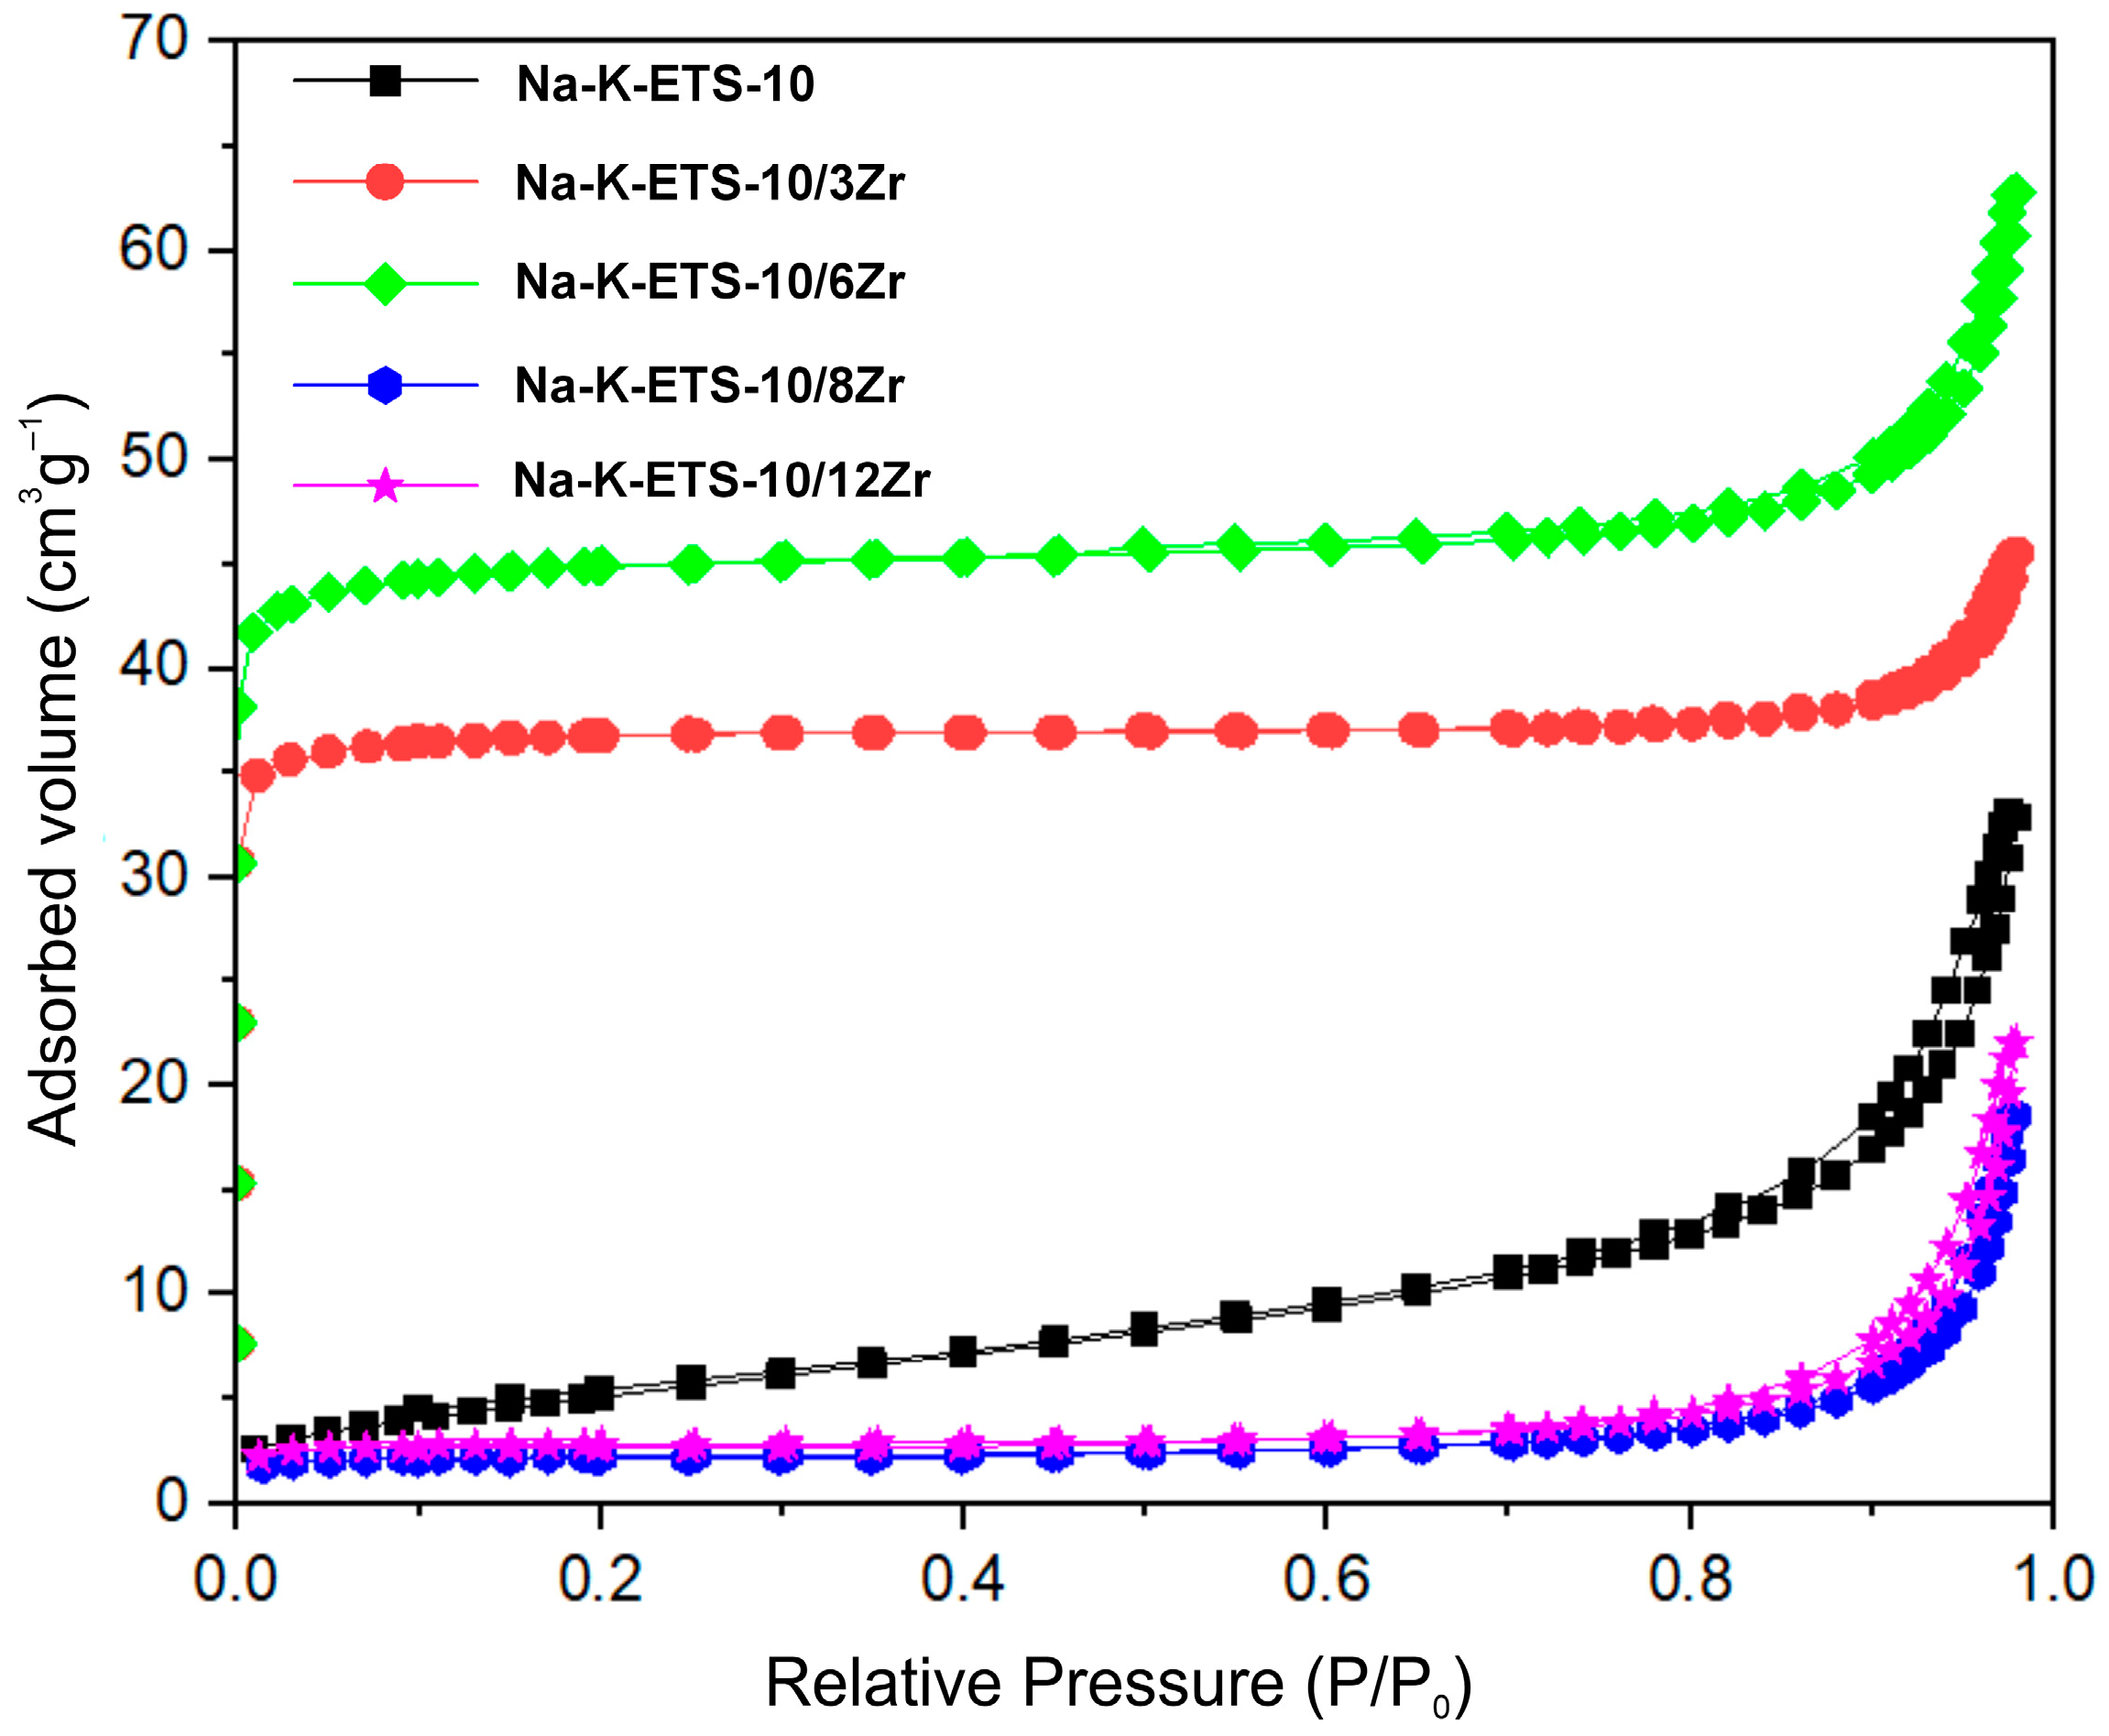
The nitrogen adsorption/desorption isotherms for Na-K-ETS-10 and Na-K-ETS-10/xZr samples are shown in Figure 3, and the textural parameters determined from analyzing the isotherms are listed in Table 3. In Figure 3, one can clearly see that the N2 adsorption/desorption isotherms for Na-K-ETS-10/xZr with x = 3 and x = 6 Zr possess a microporous part, while those for x = 8 and x = 12 lack microporous adsorption. This is in accordance with PXRD data and is related to the collapse of the ETS-10 structure at higher Zr content. The N2 adsorption/desorption isotherms of Na-K-ETS-10/x = 3 and 6 Zr wt% can be classified as a combination of type Ia and IV, according to the IUPAC classification [18], with H3 type hysteresis loop indicating the micro-/mesoporous texture of the materials. The specific surface area (SSA) of the samples is in the interval between 7.35 and 144.56 m2/g. The mesoporous diameters due to textural microporosity were found in the range of 2.1–10 nm. The highest surface area (144.56 m2/g) was registered for the Na-K-ETS-10/6 wt% Zr sample.

Figure 3.
Nitrogen adsorption/desorption isotherms of Na-K-ETS-10 and Na-K-ETS-10/xZr.
Table 3.
Surface of the Na-K-ETS-10 and Na-K-ETS-10/xZr samples.
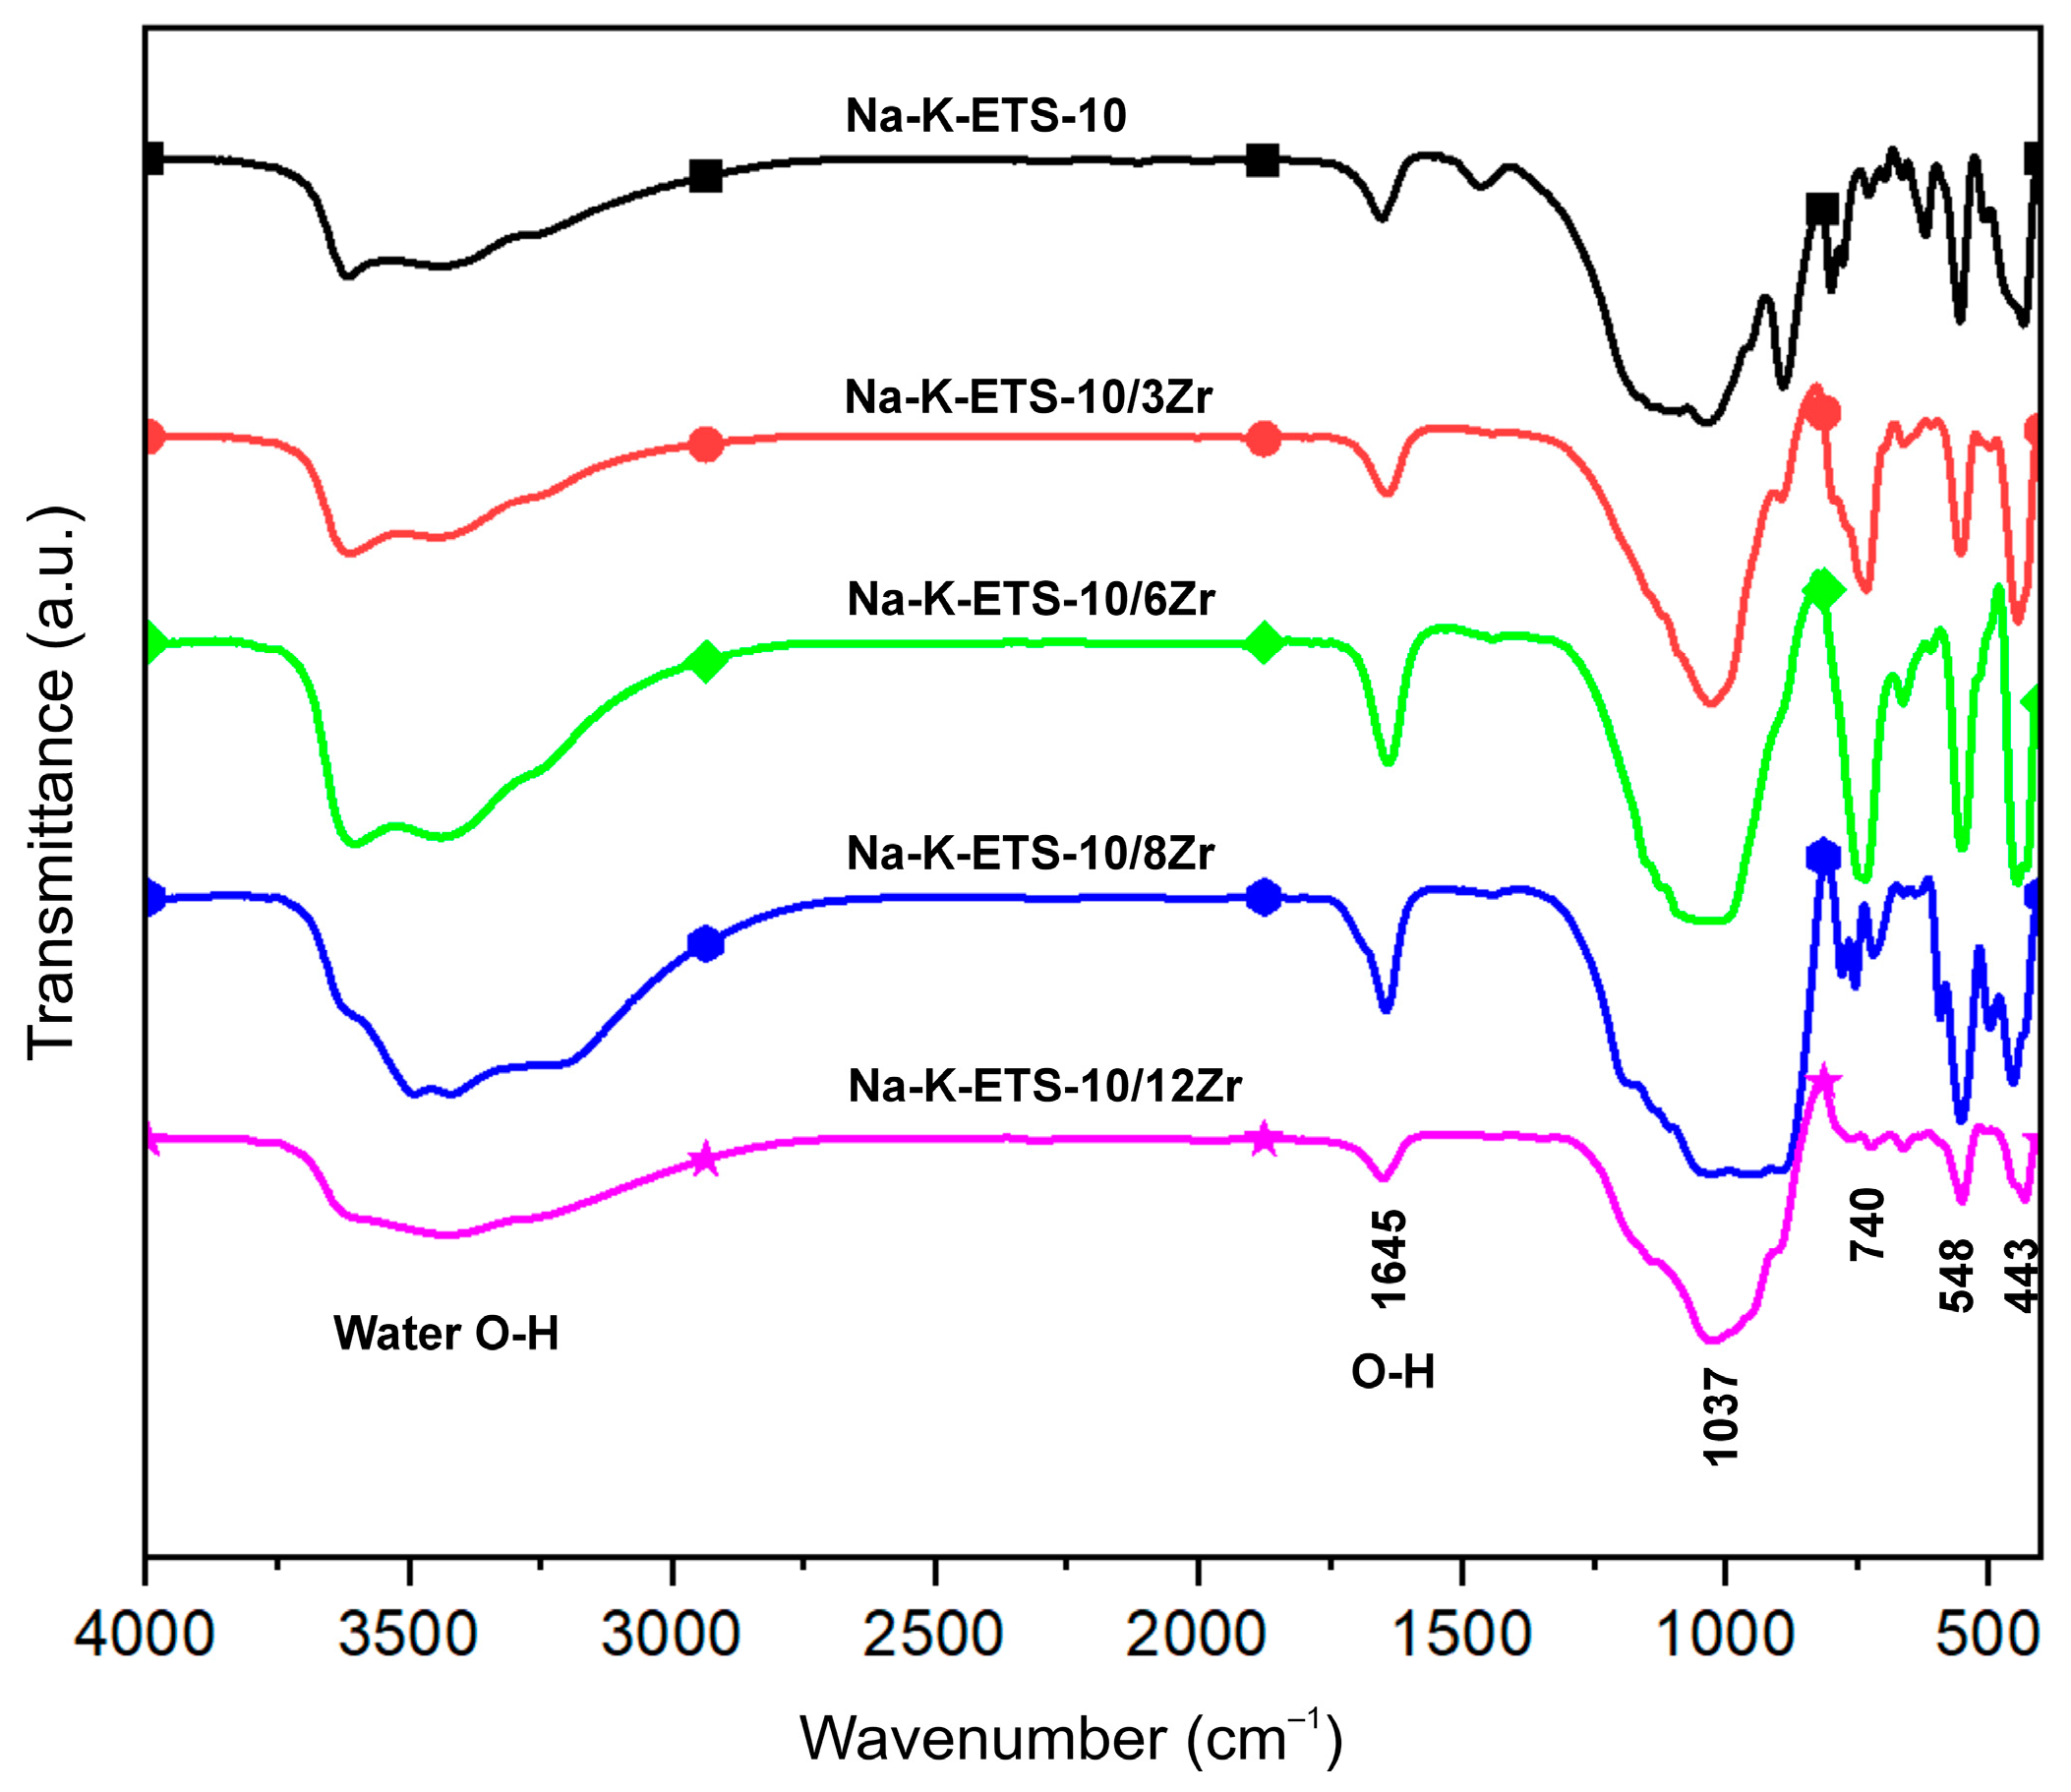
The FTIR spectra of Na-K-ETS-10 and Na-K-ETS-10/xZr (x = 3, 6, 8 and 12) are shown in Figure 4. The most intensive bands are observed in the 1000–400 cm−1 region of the FTIR spectra and correspond to the framework vibrations. The band around 1645 cm−1 is the result of deformation vibrations of bound water in the structure. The broad intensive bands observed in all spectra in the 3500–3200 cm−1 region were associated with the asymmetric stretching vibrations of O-H (water) groups. For all samples, a broad band at 1037 cm–1 is present. This band is attributed to the Si–O–Si stretching vibrations. The bands at 750 and 548 cm−1 with varied intensities are related to Ti–O, Si–O and O–Ti–O vibrations, respectively. The lowest band (443 cm−1) is mainly attributed to O–Si–O, O–Ti–O and Ti–O vibrations. These bands correlate well with the characteristic peaks reported previously for Na-K-ETS-10 [25,26,27,28]. Although there is a destruction of the crystalline structure (PRXD and N2 physisorption) in samples Na-K-ETS-10/8 wt% Zr and Na-K-ETS-10/12 wt% Zr, the FTIR spectra remain quite steady, and only the intensity drop and disappearance of the skeletal related band at 740 cm−1 are registered. This suggests that the nuclei or embryonic structural precursors are present, but the long-range order is not pronounced.

Figure 4.
FTIR spectra of the studied samples.
3.2. Photocatalytic Activity of Patterns of the Studied Samples
3.2.1. Photodegradation of Crystal Violet and Methylene Blue
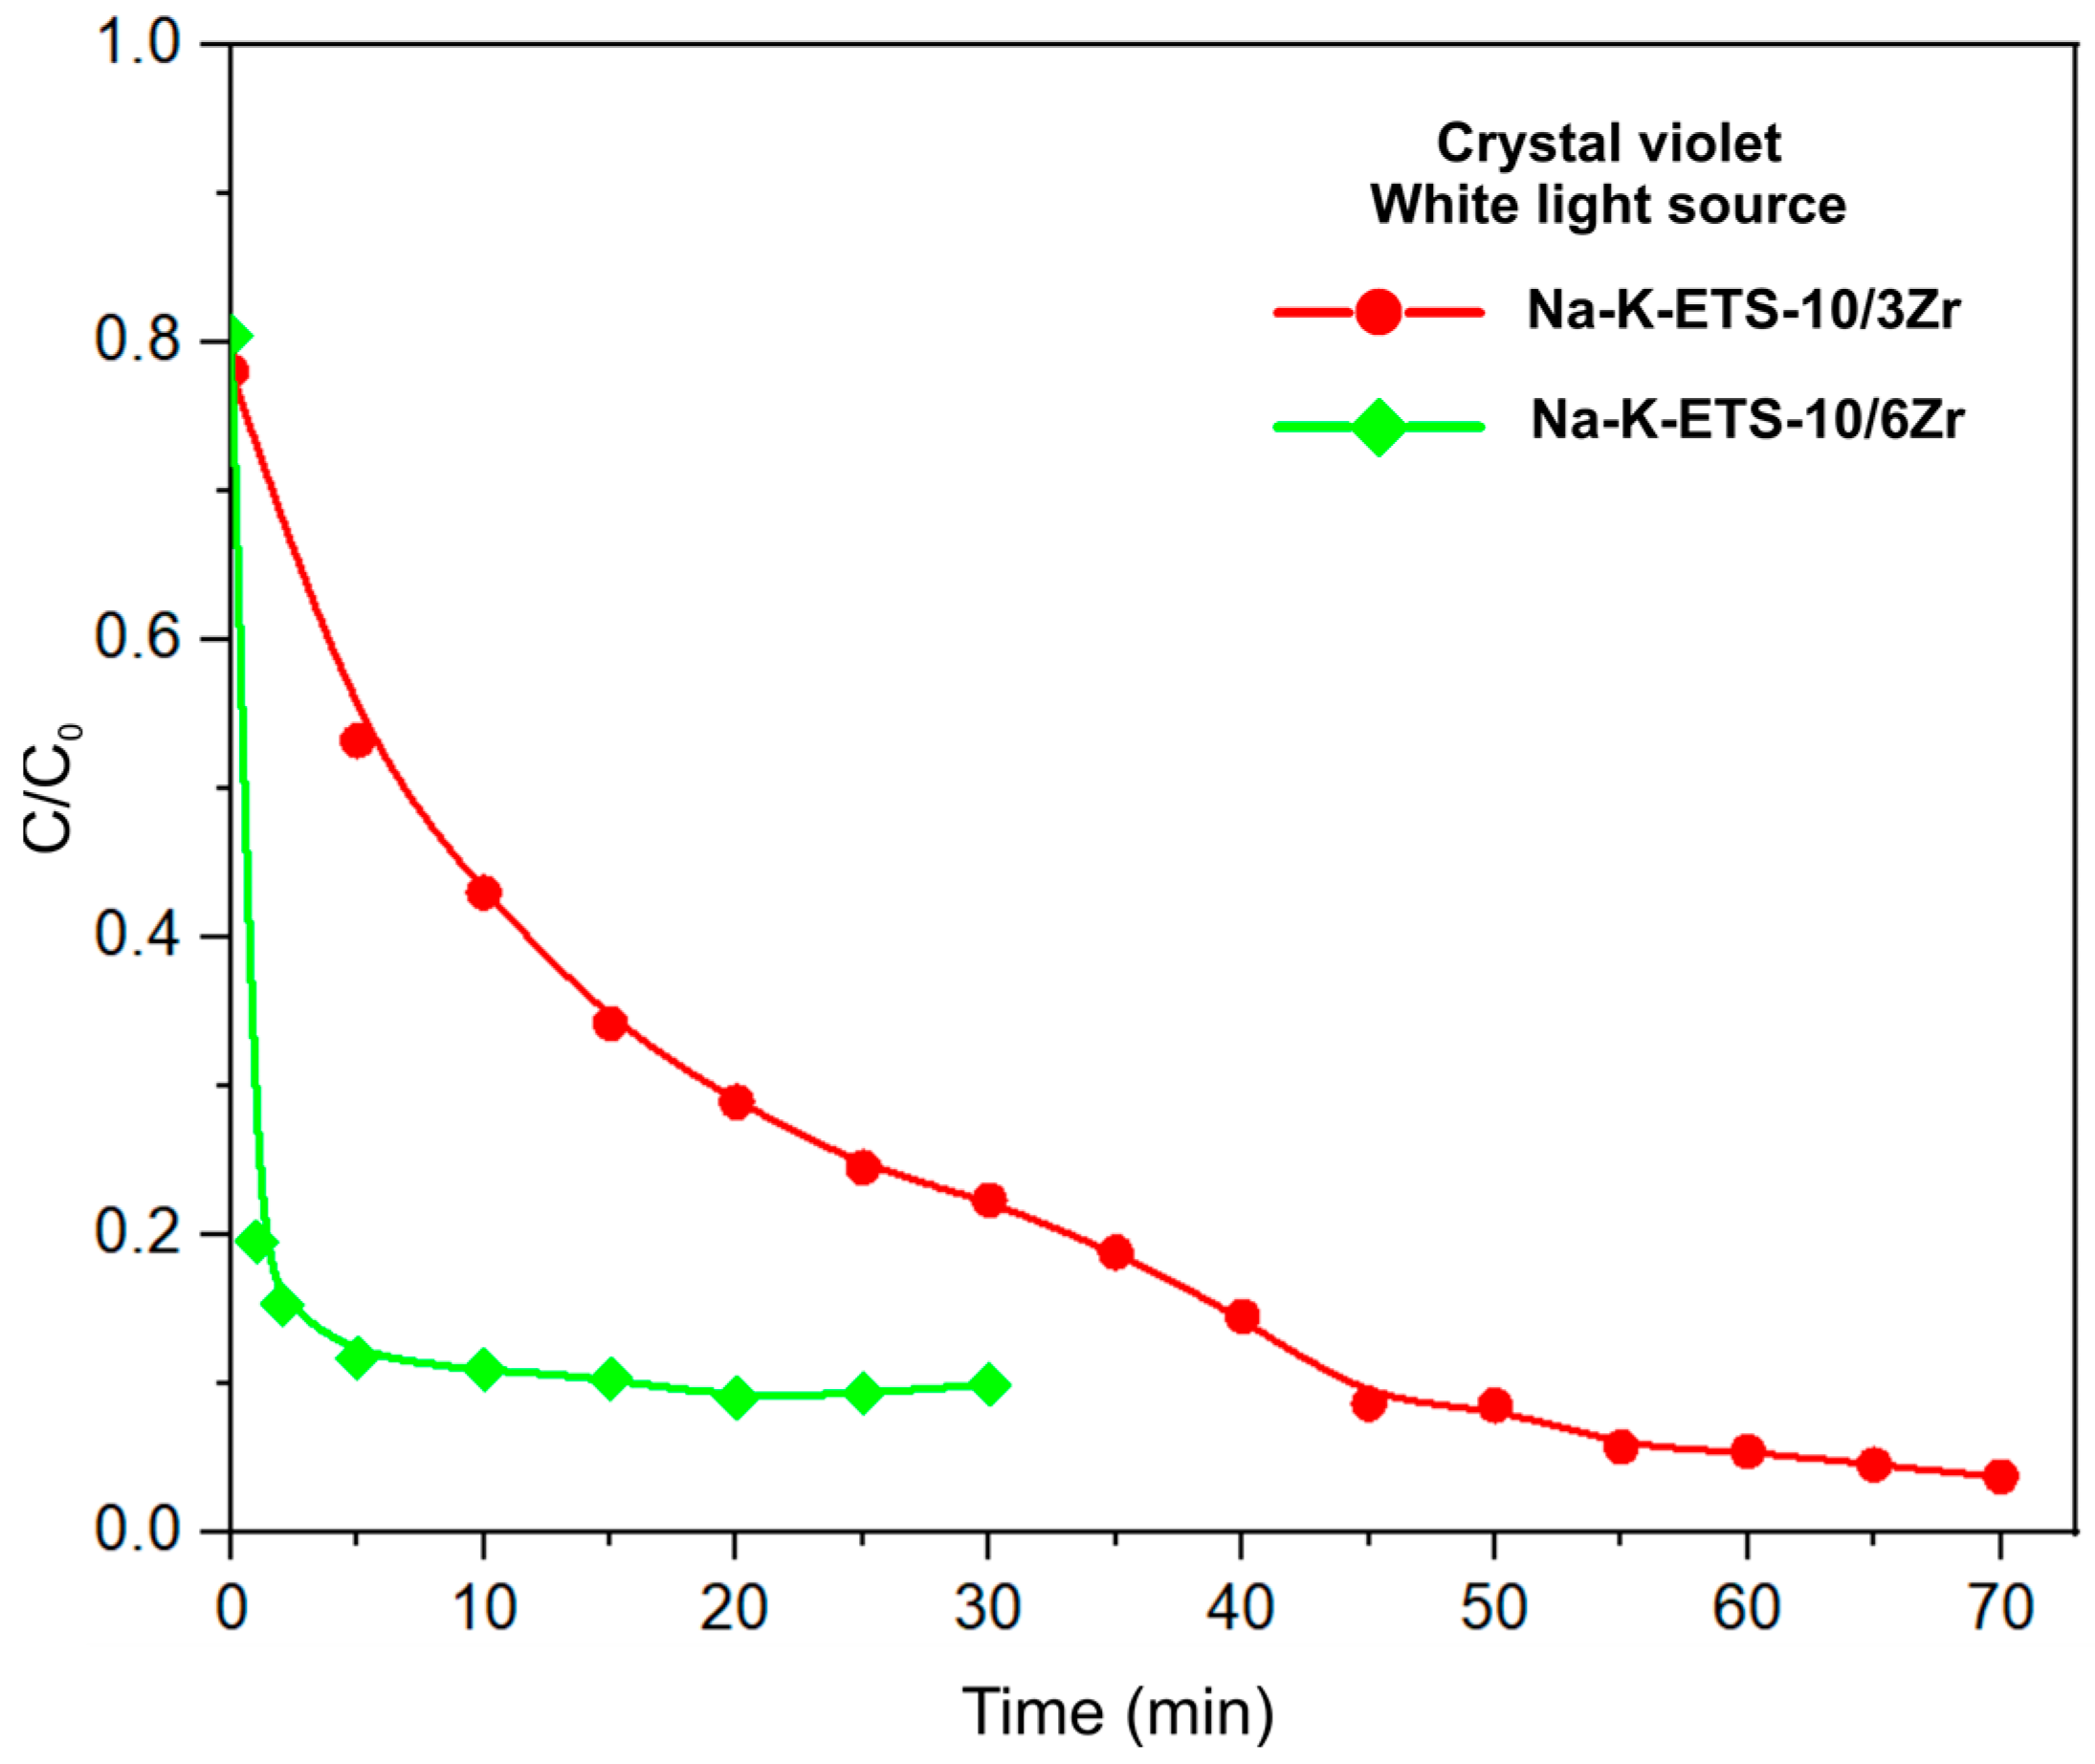
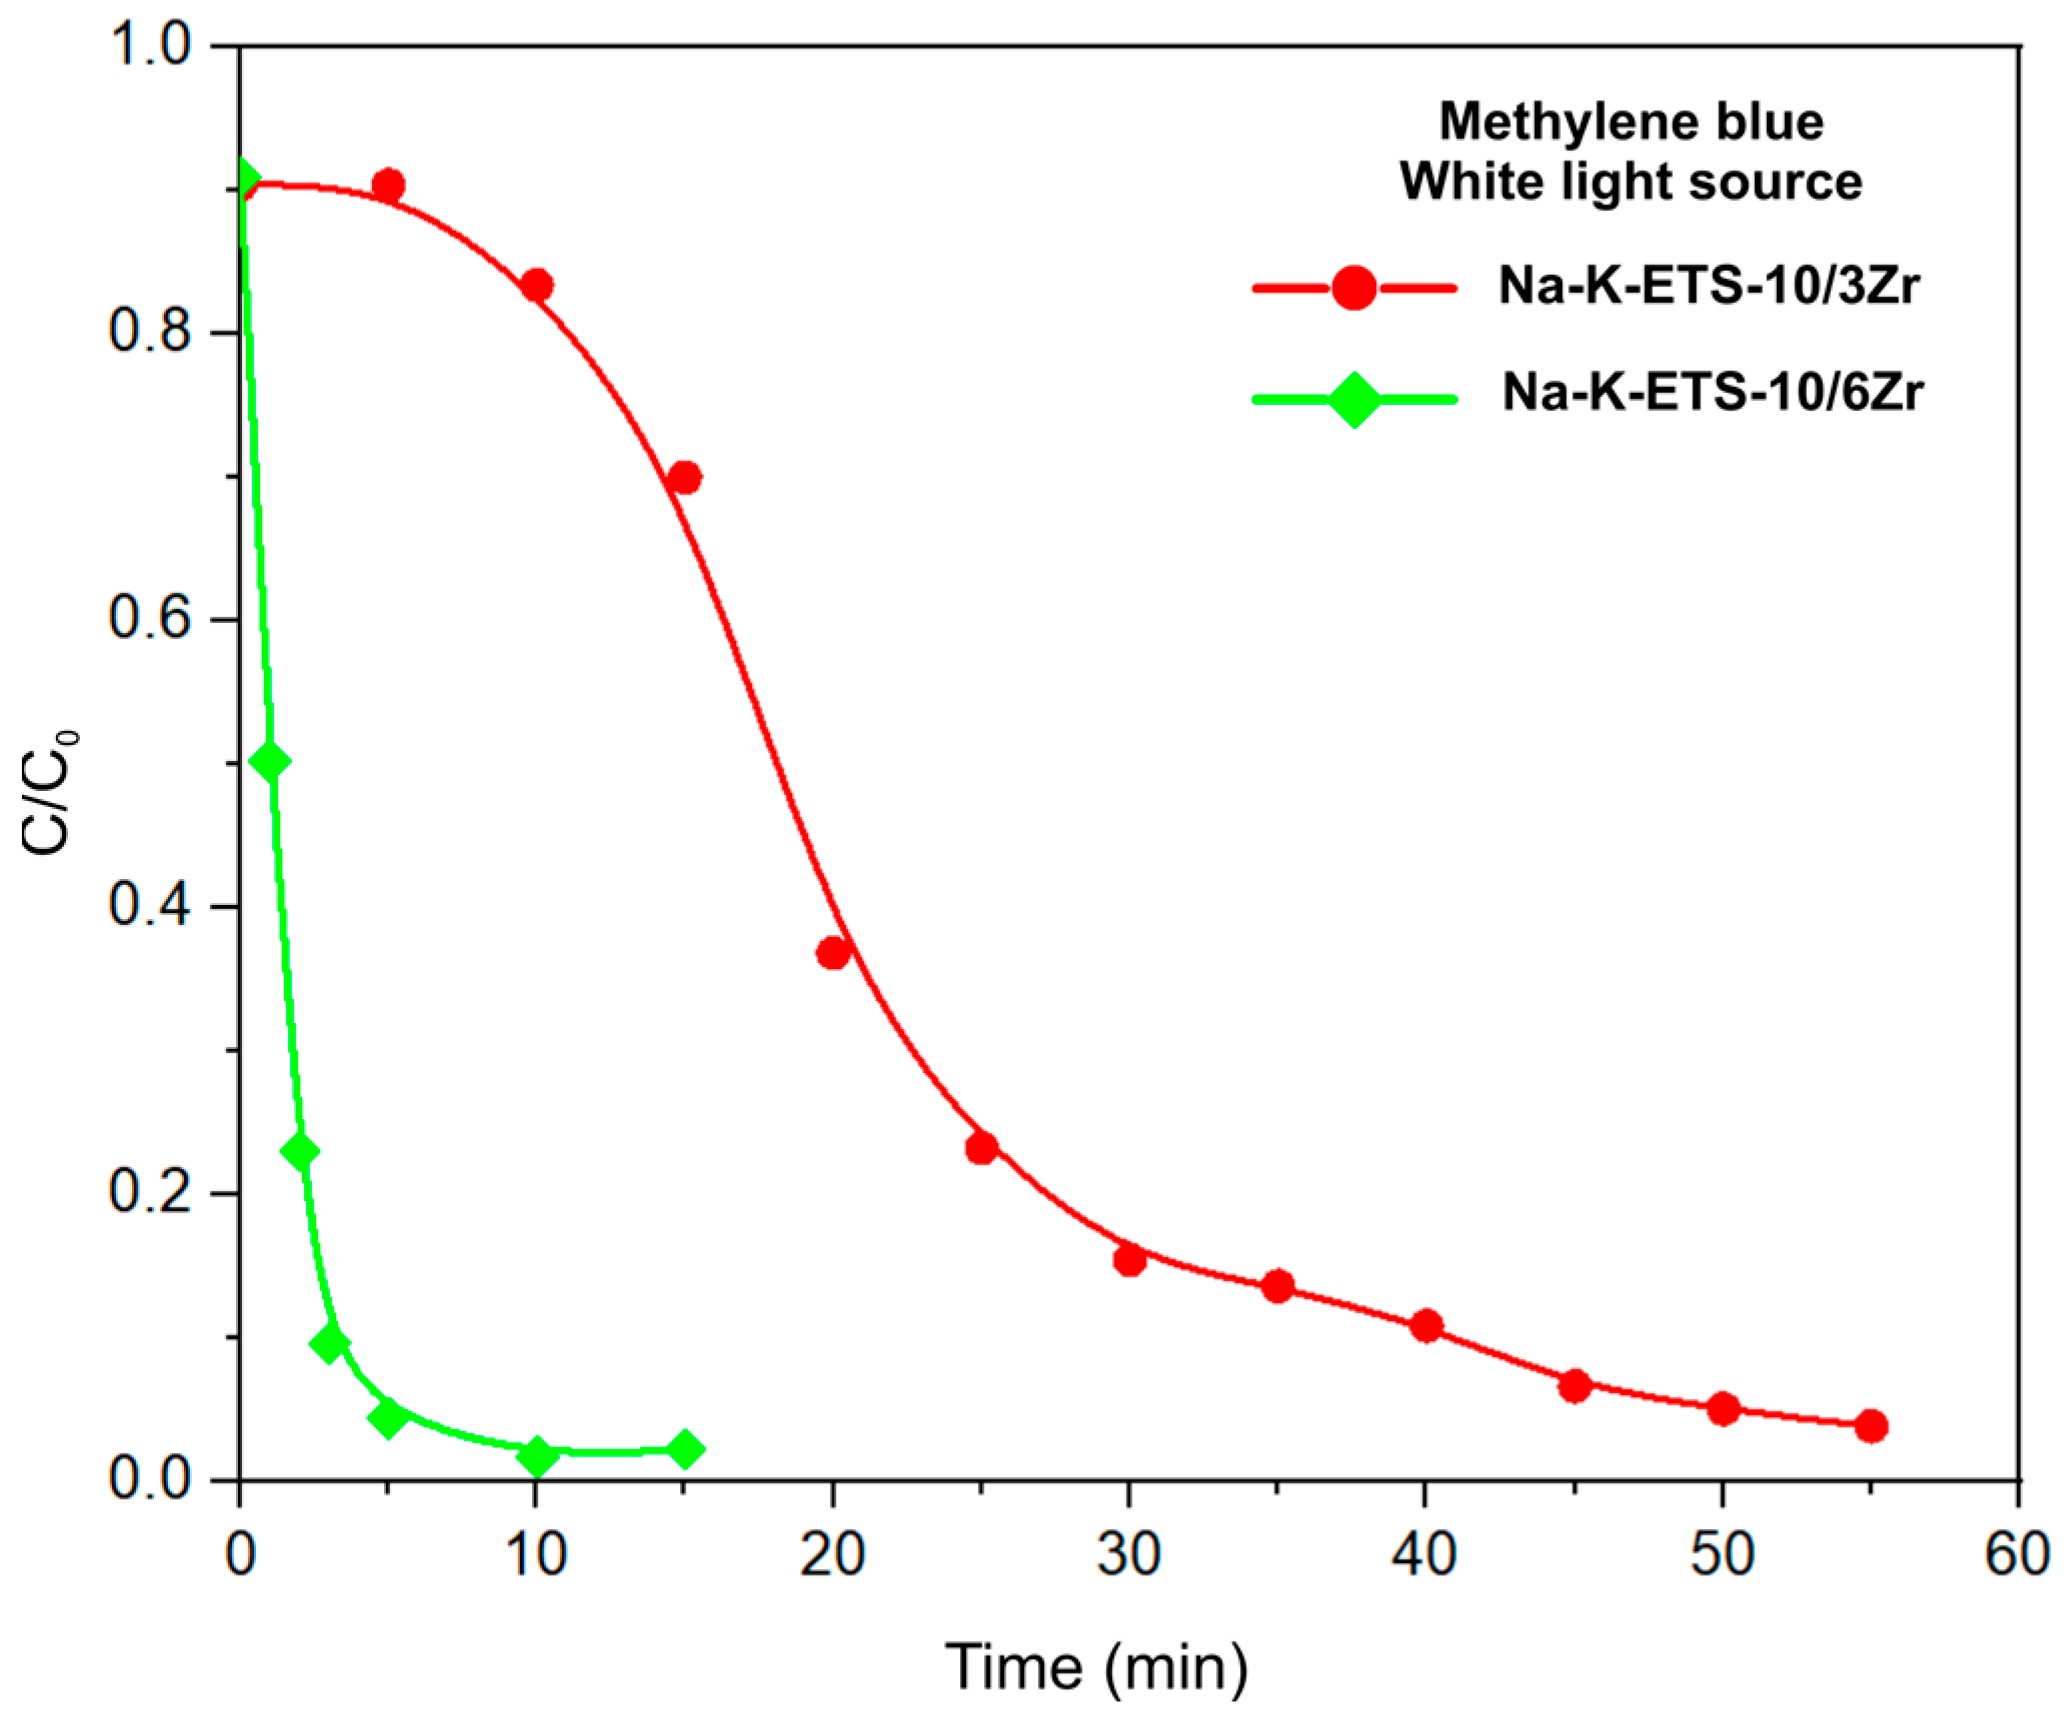
The photodegradation of crystal violet and methylene blue promoted by white light irradiation and the presence of Na-K-ETS-10/xZr (where x = 3 or 6 wt% Zr) was investigated. The specifically Zr-modified samples were chosen based on the results from PXRD and N2 adsorption/desorption analyses disclosing the preservation of the ETS-10 structure, the presence of microporosity and higher specific surface area (SSA) compared to the parent Na-K-ETS-10 sample. The results for crystal violet and methylene blue photodegradation are provided as a decrease in absorbance and as relative concentration (C/C0) versus time (min) plots in Figure 5, Figure 6 and Figure 7, respectively. For both dyes, the photodegradation is close to 100% (96.3 and 90.1% removal of CV, and 96.2 and 98.2% removal of MB by Na-K-ETS-10/3Zr and Na-K-ETS-10/6Zr, respectively). However, the speed of the degradation process is not the same, and it depends on the catalyst employed. When Na-K-ETS-10/6Zr is used, the photodegradation of both dyes proceeds significantly faster, reaching a plateau around the 10th min. On the other hand, Na-K-ETS-10/3Zr promotes a time-prolonged photodegradation, reaching a plateau around the 55th min for CV and 70th min for MB.
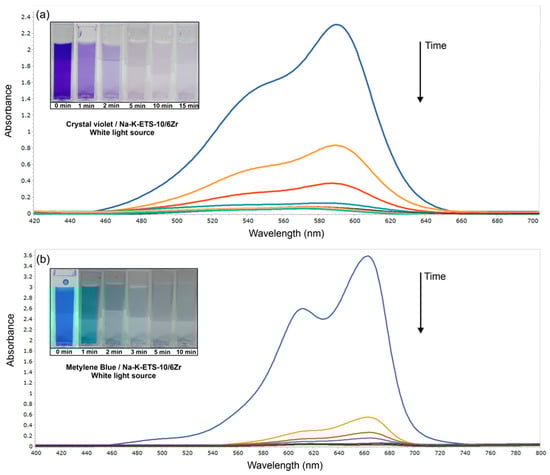
Figure 5.
UV-Vis analysis of the photodegradation processes of (a) crystal violet and (b) methylene blue promoted by Na-K-ETS-10/6Zr and white light irradiation; the inset displays the color change with the function of time.

Figure 6.
Photodegradation graph of crystal violet promoted by white light irradiation in the presence of Na-K-ETS-10/3Zr (red) and Na-K-ETS-10/6Zr (green); the line connecting the dots is provided as a guide for the eye.
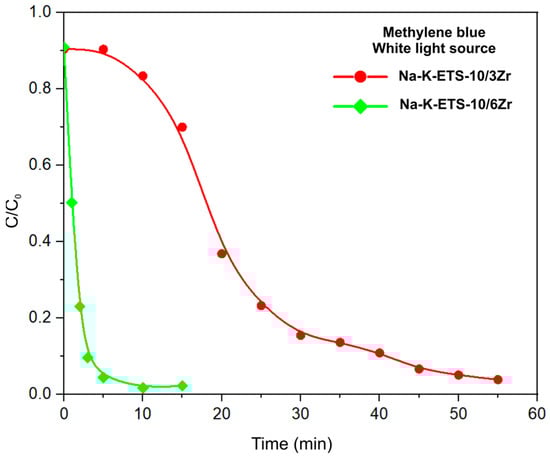
Figure 7.
Photodegradation graph of methylene blue promoted by white light irradiation in the presence of Na-K-ETS-10/3Zr (red) and Na-K-ETS-10/6Zr (green); the line connecting the dots is provided as a guide for the eye.
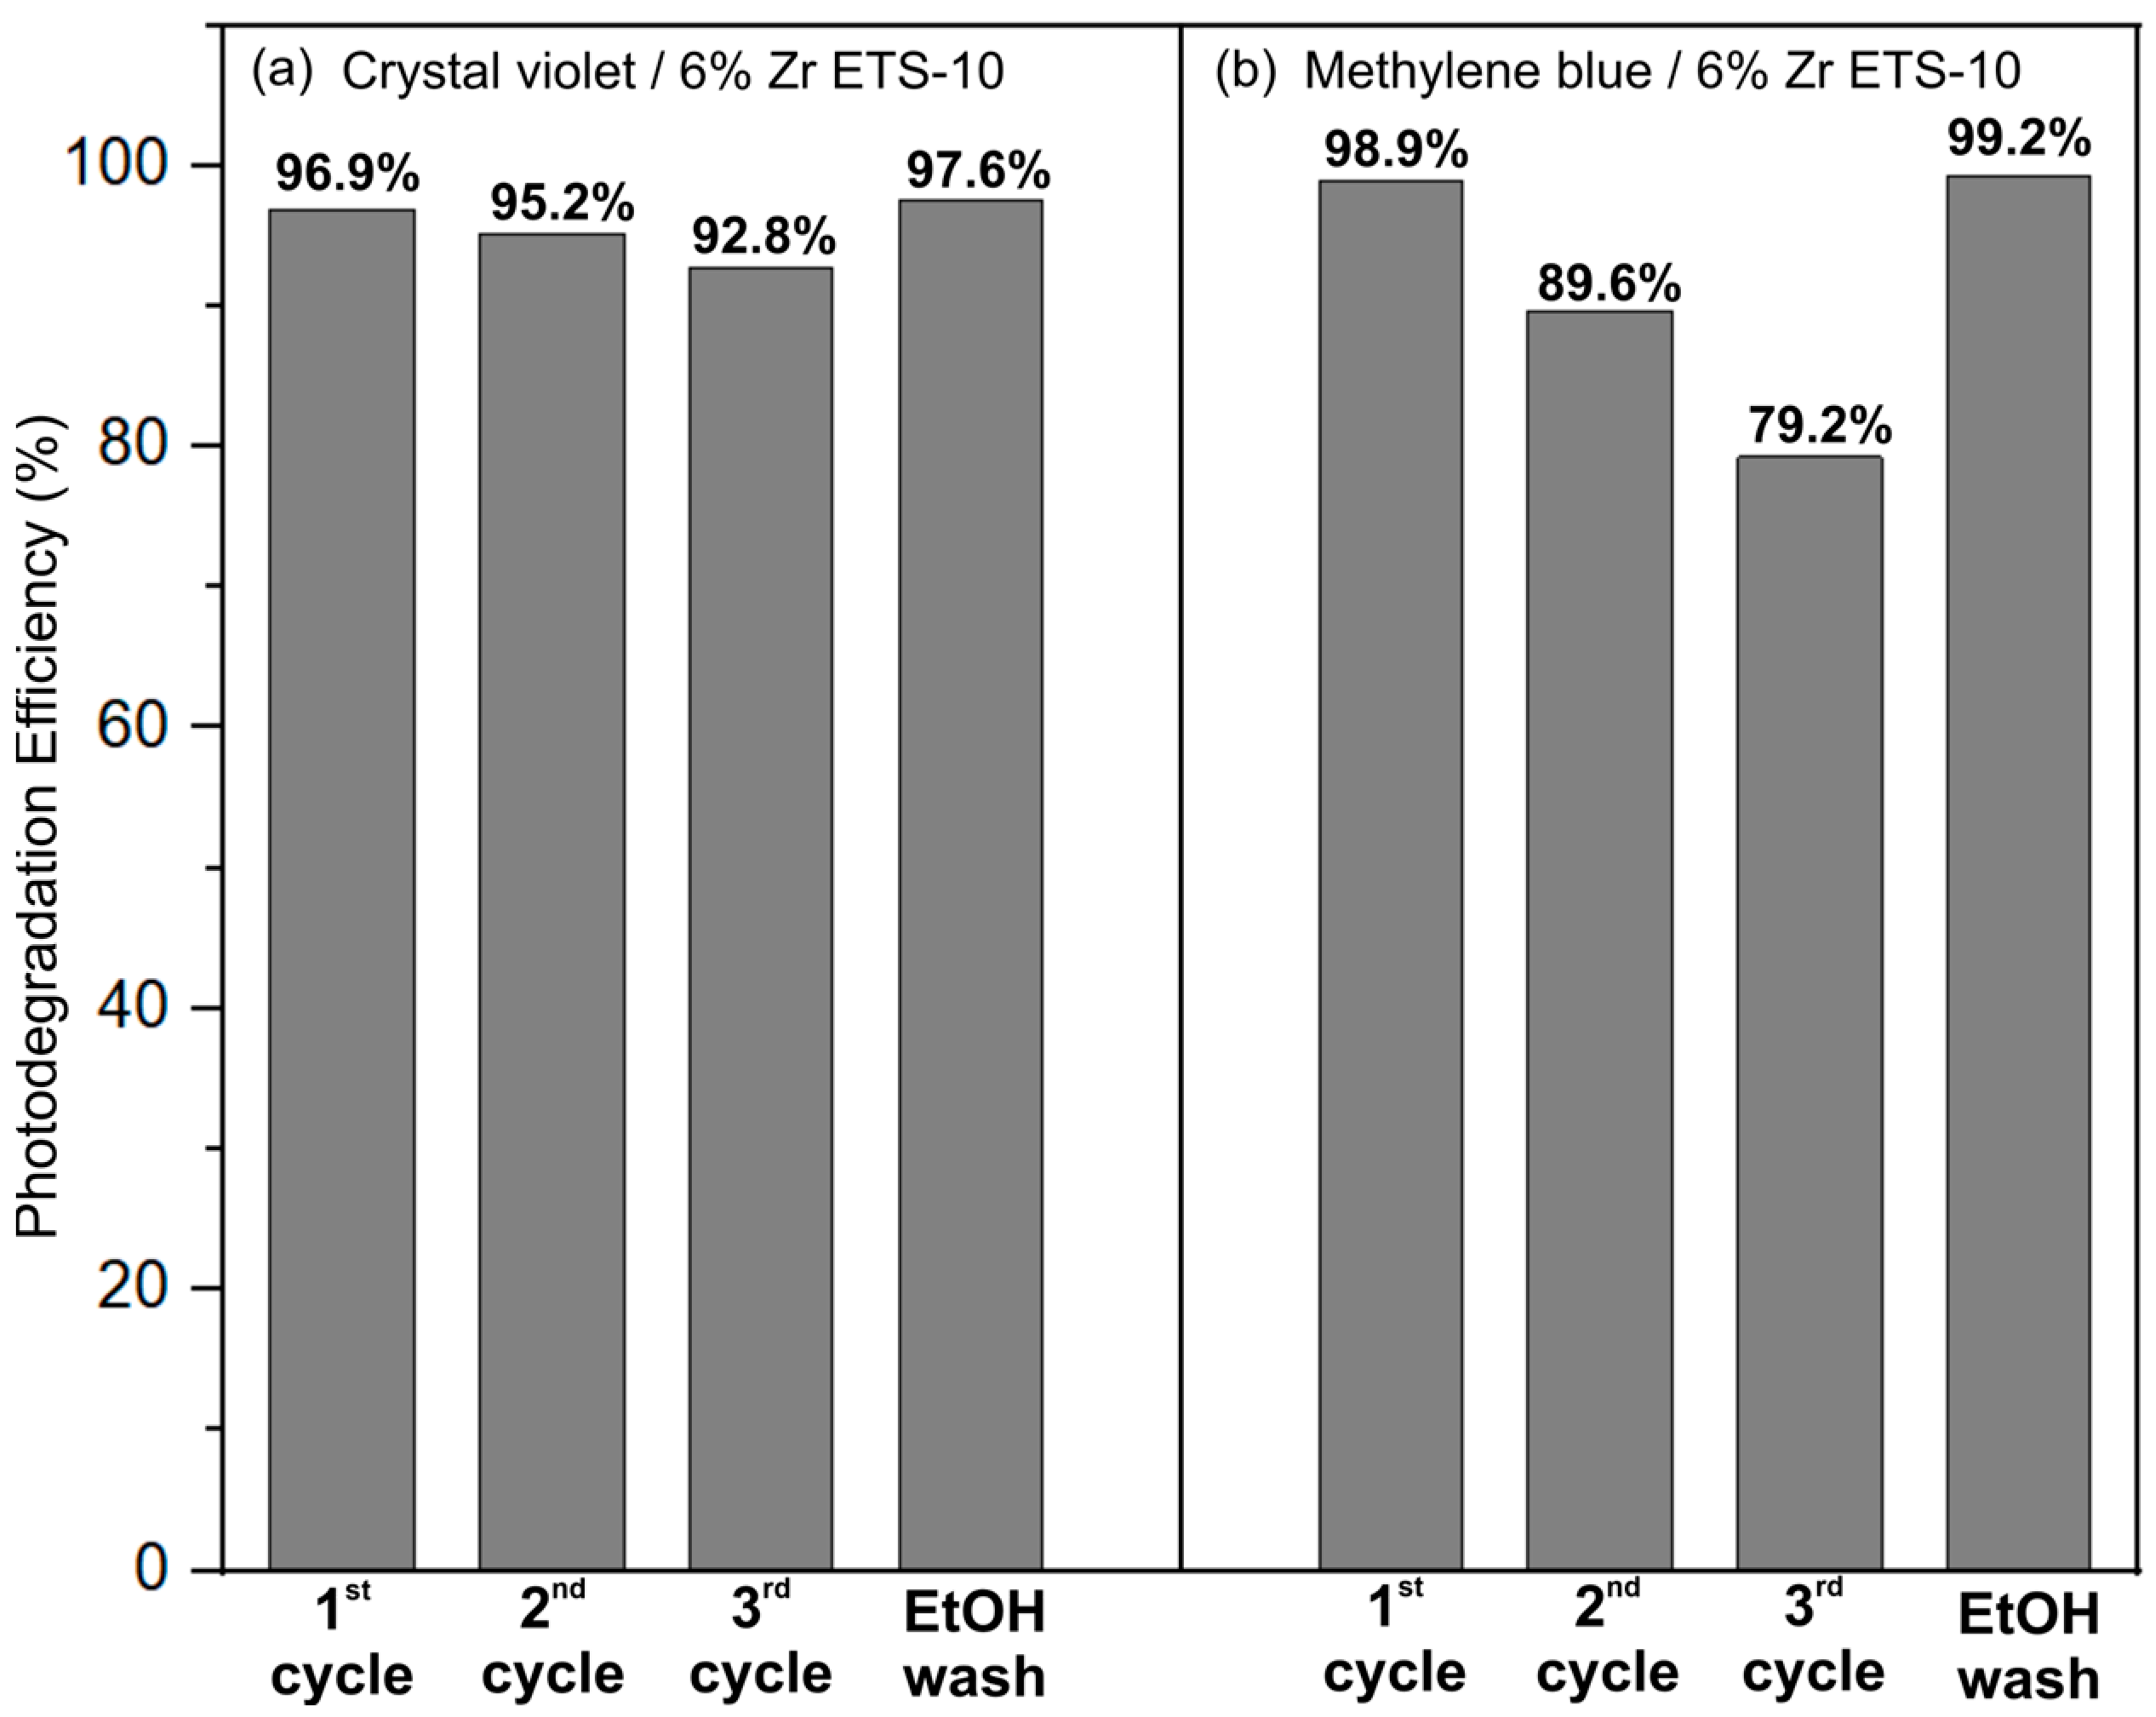
The reusability and recovery (regeneration) performances of the catalyst employed are among the key selection parameters for subsequent scale-up. The reusability of Na-K- Na-K-ETS-10/6Zr was investigated for four cycles of 15 min photodegradation of CV or MB (Figure 8). During the first three cycles, the photodegradation reaction is performed for 15 min; then, the solution is exchanged with a fresh crystal violet or methylene blue. For the fourth cycle, in addition to the exchange of solution, the catalyst is washed with ethanol (1 g catalyst in 50 mL) and dried at 60 °C. In the case of CV, for the first three cycles, the photodegradation efficiency of Na-K-ETS-10/6Zr drops slowly from 96.9 to 92.9% (Figure 8a). For MB, the drop in efficiency is more pronounced, e.g., from 98.9 to 79.2% (Figure 8b). In both cases, the regeneration performed by washing the catalyst with ethanol restores its starting efficiency (Figure 8, fourth cycle). Thus, the synthesized catalysts are suitable for repeated use in the photodegradation of crystal violet and methylene blue dyes from polluted waters.

Figure 8.
Reusability and regeneration potential of Na-K-ETS-10/6Zr for 15 min photodegradation of (a) crystal violet and (b) methylene blue; the fourth cycle discloses the catalyst recovery achieved with simple ethanol wash.
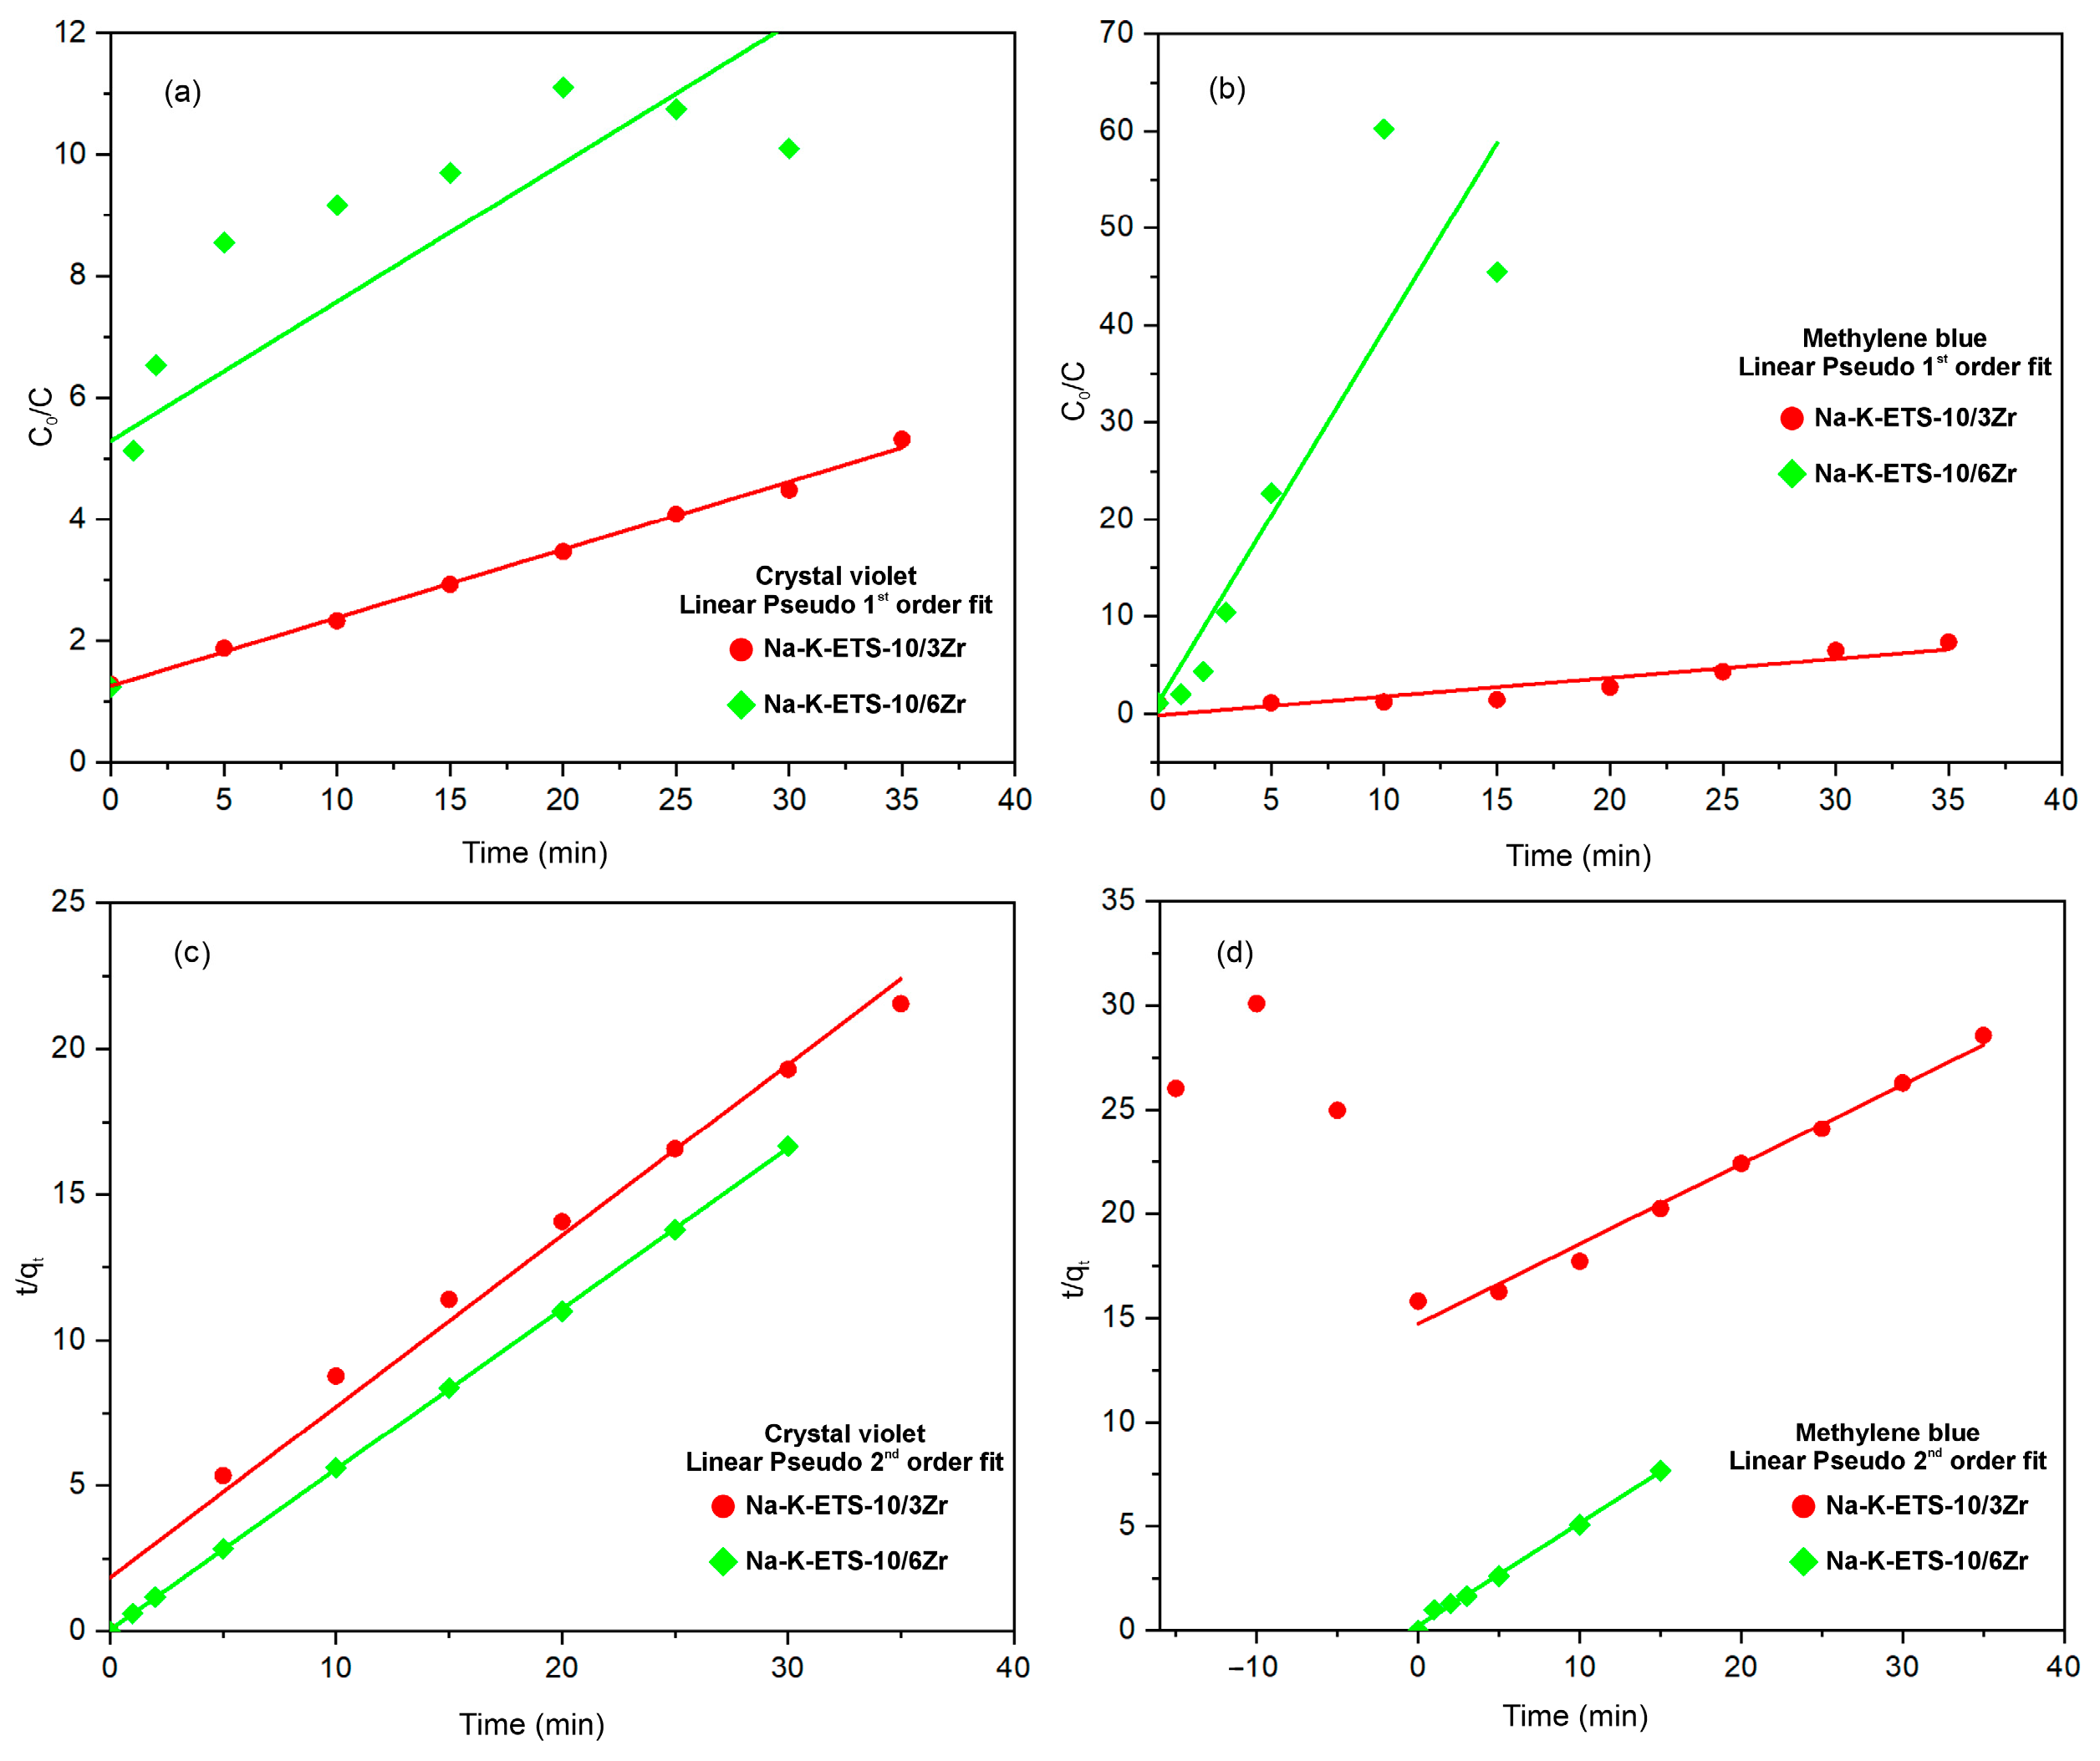
3.2.2. Kinetic Studies
The most common practice for determining photodegradation kinetic parameters involves the use of a linearized form of pseudo-first-order (PFO) and pseudo-second-order (PSO) models [29,30]. This is accomplished by plotting for pseudo-first-order (PFO) and pseudo-second-order (PSO) parameters, as dictated by Equations (2) and (3), respectively. The parameters are then estimated from the slope and intercept of the best fit line. However, other linear forms of PFO and PSO have been utilized for kinetic parameter estimation; these include the works by Uddin et al. [31] and Robati [32]. All linear forms of PSO can be applied at any t > 0 and are also suitable for a prolonged period of time. The model, which fits a photodegradation process, should be applicable to the process at any time t. Linear PFO modeling also requires prior knowledge of qe for a straightforward parameter estimation using either Equations (2) or (3). It is applicable only during the initial stage of the photodegradation process. This could be due to the discontinuity in the linear forms of PFO as soon as qe is attained.
The kinetic equation for the linear pseudo-first-order kinetic model [30,33,34] is represented as
where qt is the photodegradation capacity at a particular time, and K1 is a rate constant for the first-order reaction. The values of the rate constant, maximum photodegradation capacity and correlation coefficient are shown in Table 4. These were obtained by plotting C0/C versus contact period, as shown in Figure 9a,b.
Table 4.
Linear PFO and PSO parameters from Na-K-ETS-10/3Zr and Na-K-ETS-10/6Zr.
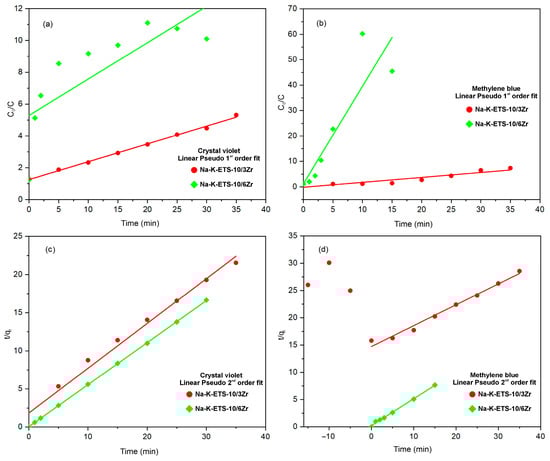
Figure 9.
Linear kinetic models: (a) PFO for CV and (b) PFO for MB; (c) PSO for CV and (d) PSO for MB.
The kinetic equation for the linear pseudo-second-order kinetic model [29,30,34,35] is represented as
Non-linear modeling uses a predefined objective (OF) [29,30], which facilitates the estimation of model parameters. The OF used is the sum of squares of the distances or differences between the experimental and calculated or predicted values of the response variable (Equation (4)) [29].
where yi is the experimental response for ith observation; is the calculated or predicted value of yi; and n is the total number of observations or data points. A model perfectly fitted with a dataset would have the OF equal to zero. The kinetic parameters are estimated by minimizing the above OF (i.e., least-squares minimization or least-squares regression). Non-linear modeling using PFO and PSO, which utilize fractional uptake, F(t), is defined in Equation (5):
The PFO and PSO models can be transformed or reduced to Equations (6) and (7), respectively.
where k2 = k2qe, F(t) is the amount adsorbed at time t; qe is the amount remaining after equilibrium of the photodegradation reaction; K1 is the pseudo-first-order rate constant; k2 is the pseudo-second-order rate constant.
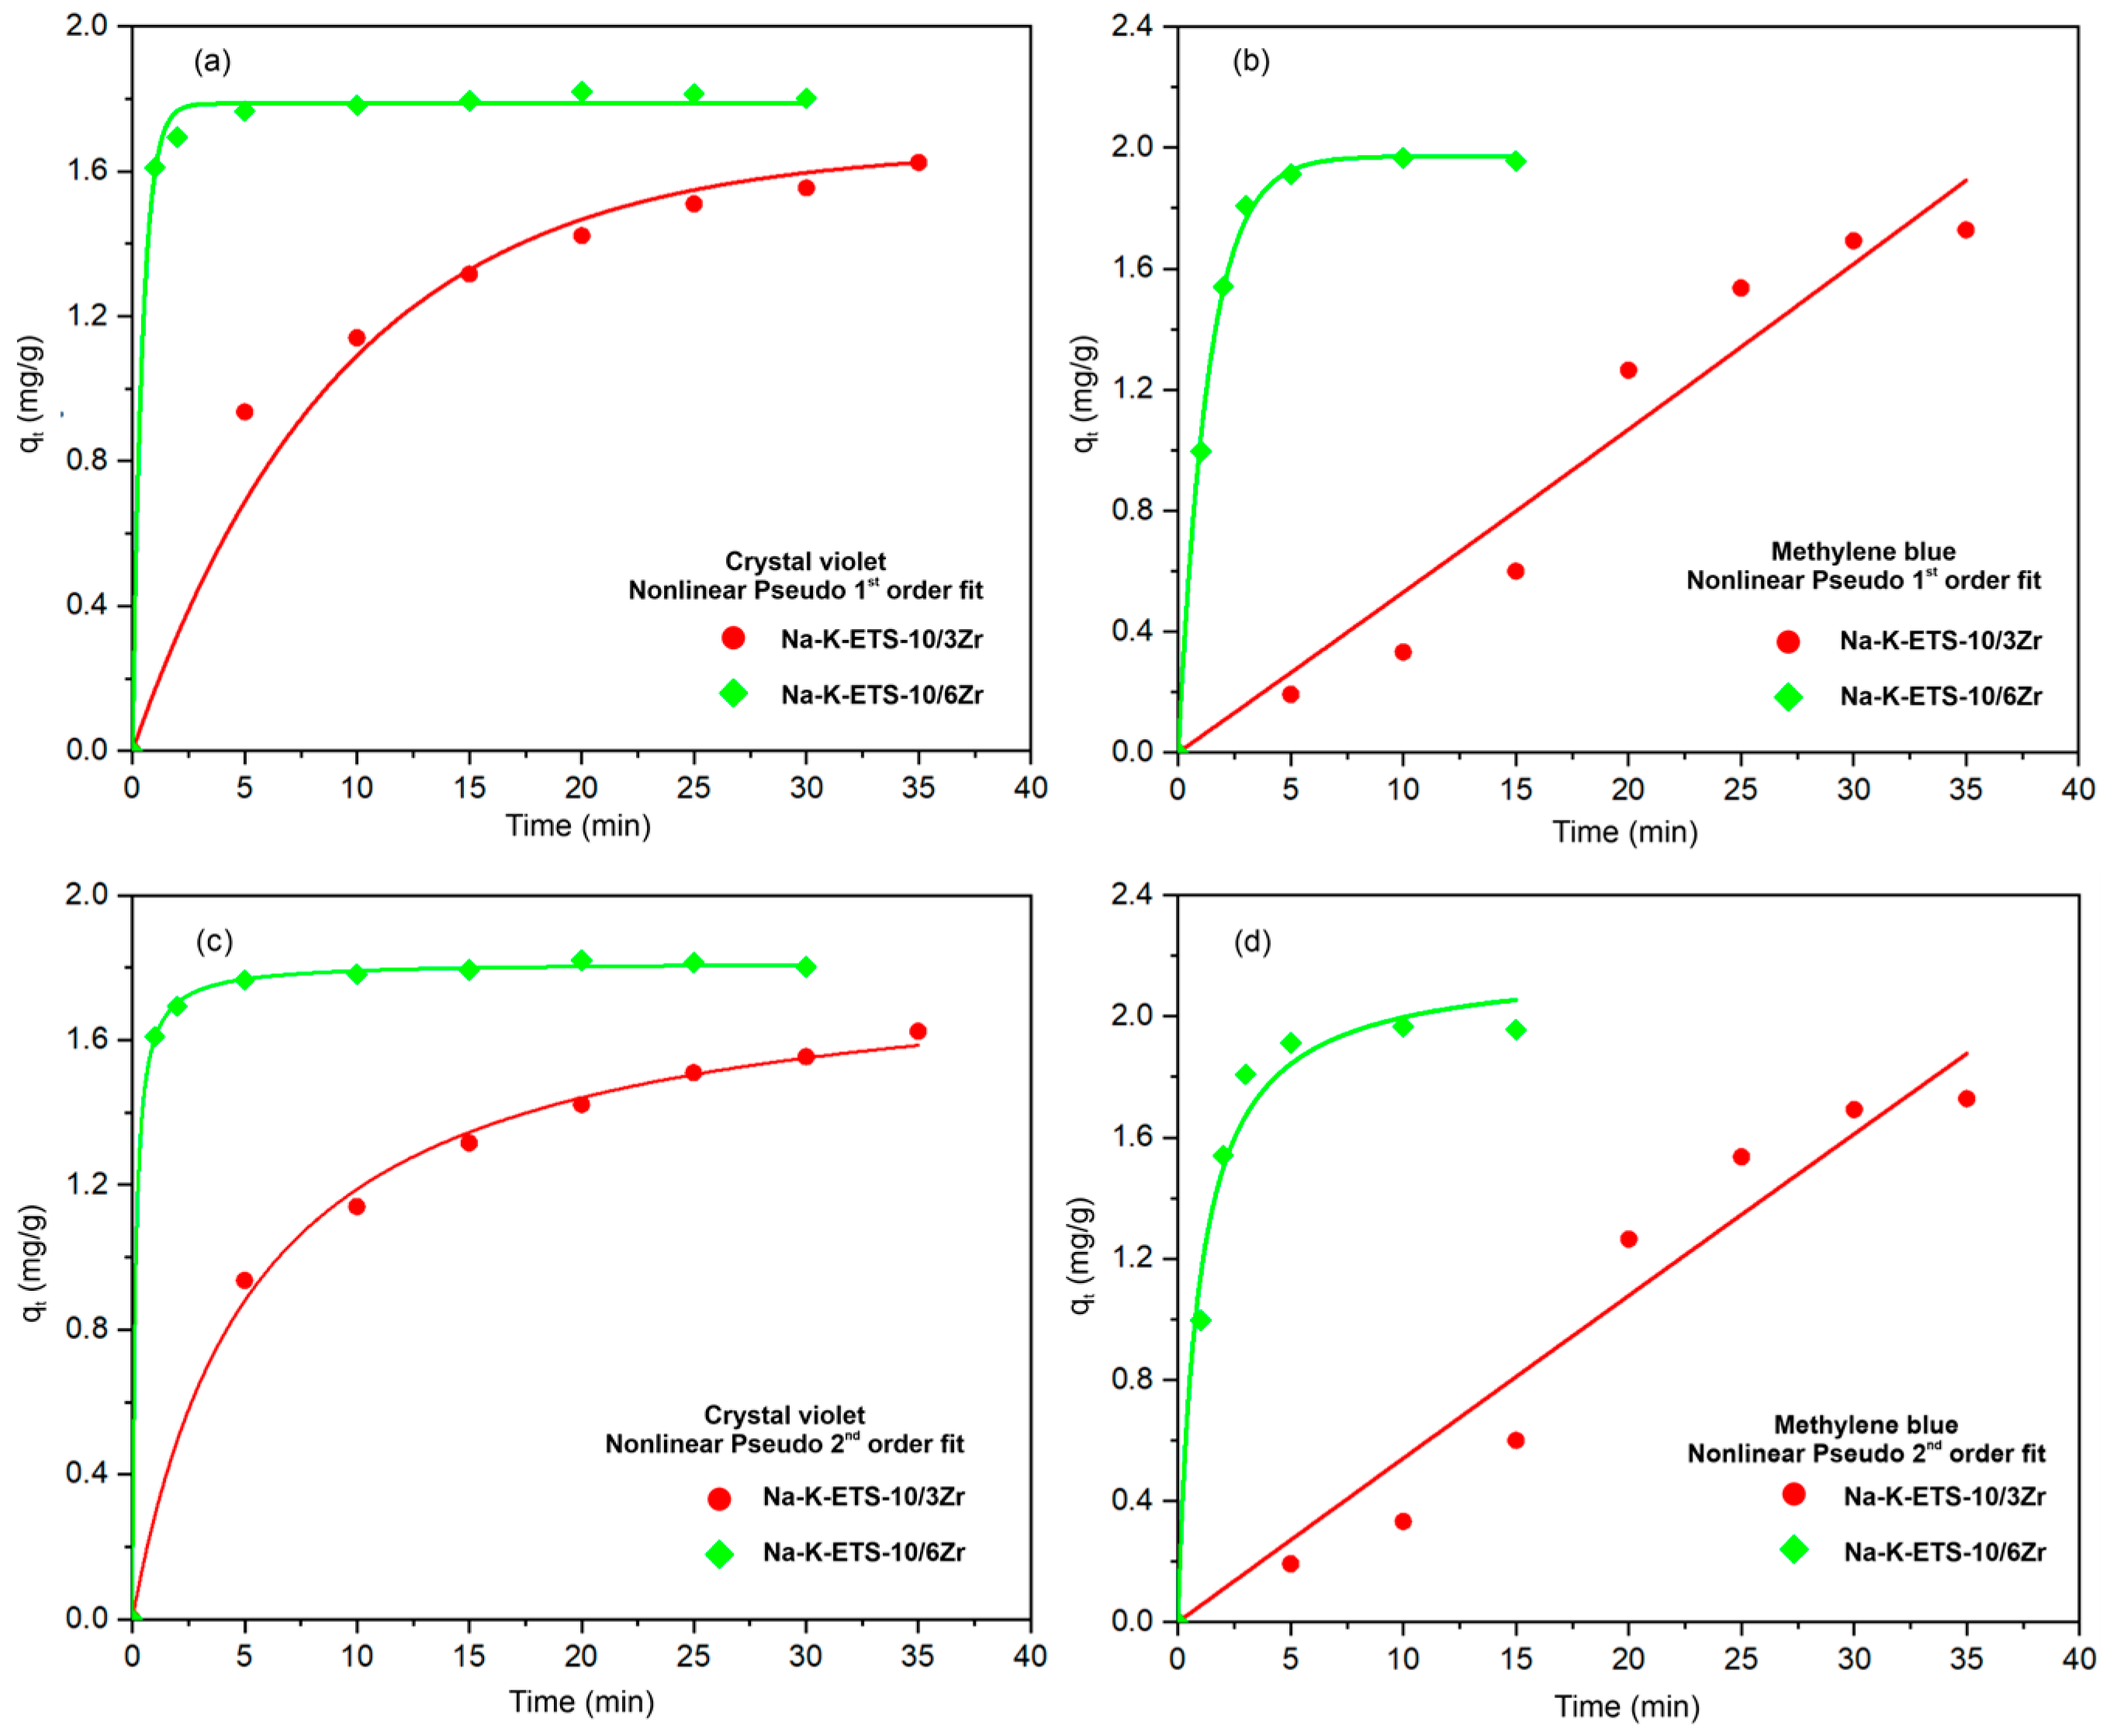
The advantage of using non-linear modeling is having a single unknown parameter. In 2017, Tan and Hameed [30] suggested non-linear modeling as a better technique compared to linear regression, as it provides more realistic kinetic parameters. The results for non-linear PFO and PSO are shown in Table 5 and Figure 10a,b for PFO, and Figure 10c,d for PSO.
Table 5.
Non-linear PFO and PSO parameters for pseudo first order and pseudo second order.
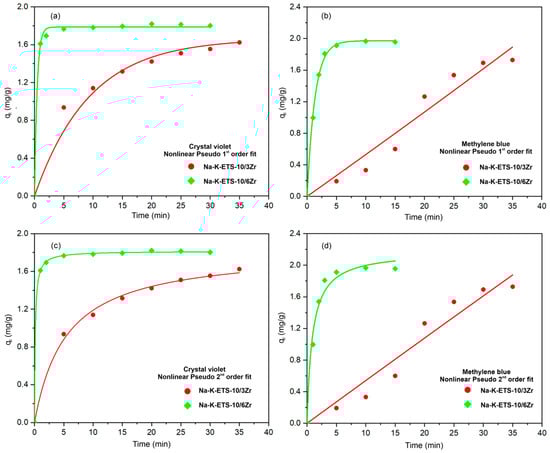
Figure 10.
Non-linear kinetic models: (a) PFO for CV and (b) PFO for MB; (c) PSO for CV and (d) PSO for MB.
In wastewater treatment, e.g., dye removal, an effective adsorbent should possess both high photodegradation capacity and rapid photodegradation rate. Kinetic models were developed to comprehend the mechanism and enhance the efficiency of the photodegradation process on a larger scale. To explore the potential rate-determining step, such as mass transfer processes, the linear and non-linear pseudo-first-order and pseudo-second-order models were employed. The determined equilibrium sorption capacity (qt) values obtained from the non-linear pseudo-second-order model are in agreement with the experimental data for MB. On the other hand, the results obtained for the equilibrium sorption capacity (qt) for CV correspond to a non-linear pseudo-first-order model.
Furthermore, the correlation coefficient values for all the chosen dyes are also close to unity. As a result, the photodegradation process can be effectively described by the non-linear pseudo-second-order kinetic model for MB and non-linear pseudo-first-order model for CV. On the other hand, the linear pseudo-first-order kinetics and linear pseudo-second-order kinetics exhibit low R2 values and fail to accurately predict the adsorbed dye amounts. Consequently, the linear pseudo-first-order and linear pseudo-second-order models are unsuitable for describing this particular system.
The sample of Na-K-ETS-10/6Zr leads to fast photodegradation of CV and MB in wastewater, probably because of the larger surface (144.56 m2/g−1). Due to its large surface area, the adsorbent interacts very well with the adsorbate, and the interaction leads to the rapid kinetics and degradation of the dyes.
3.2.3. Plausible Photodegradation Mechanism of MB and CV by Na-K-ETS-10/6Zr
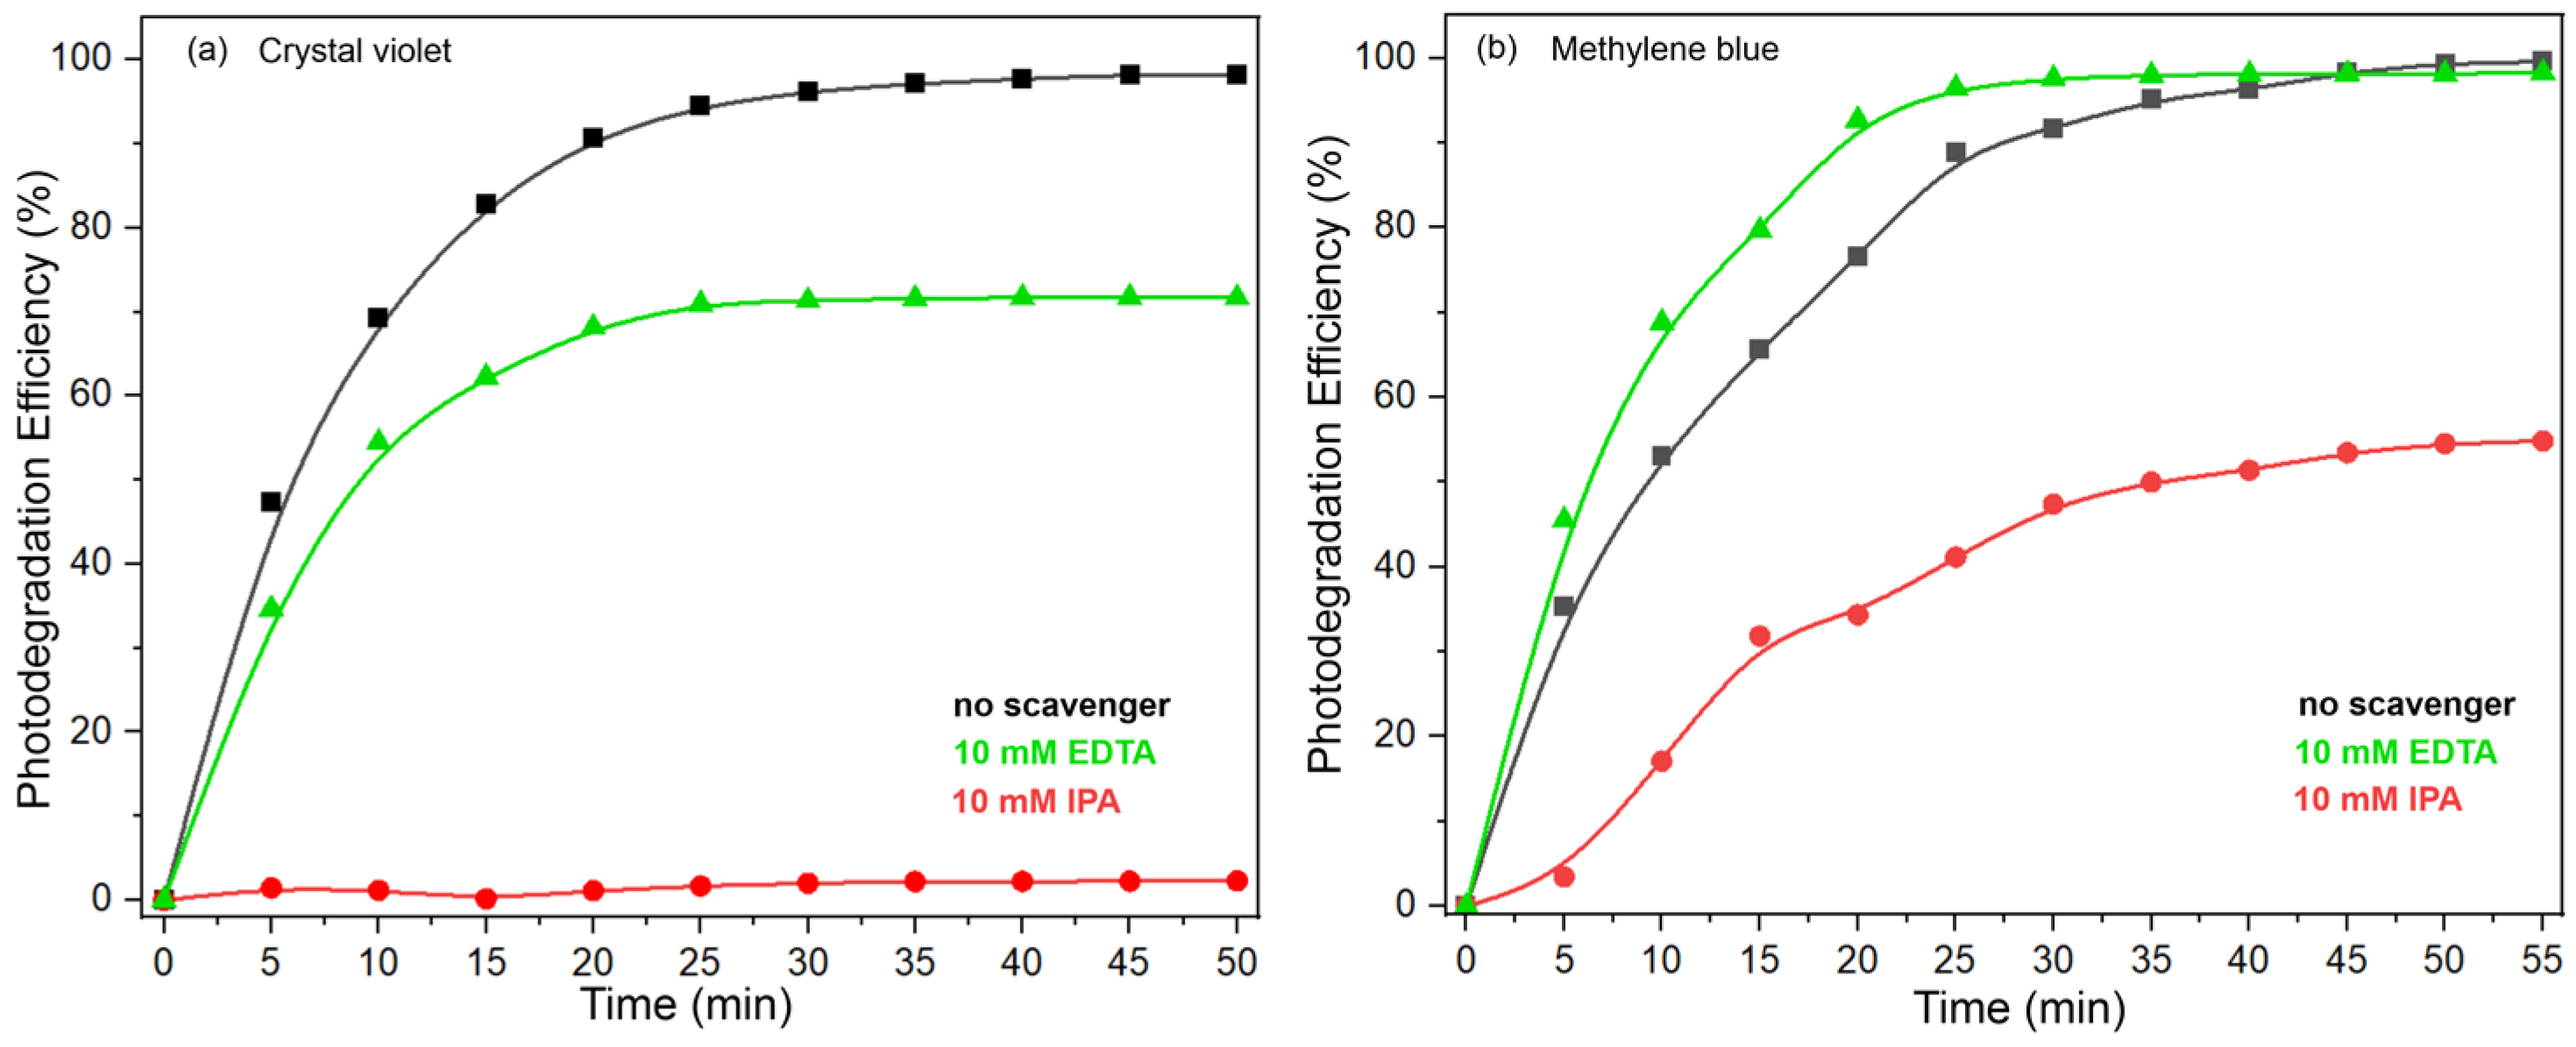
The photodegradations of MB and CV are well-studied processes [36,37,38,39,40,41]. According to the available literature, the degradation of MB and CV can be described in two major steps: (1) the formation of •OH and •O2− free radicals and (2) the progressive oxidation breakage of MB and CV molecules promoted by those free radicals into CO2, H2O, SO42– and NH4+ [42,43,44]. The role of •OH and •O2− free radicals in our photodegradation study was checked indirectly by adding isopropyl alcohol (IPA) as •OH scavenger and EDTA-Na2 as •O2− scavenger (Figure 11). Moreover, the experiments were conducted with Na-K-ETS-10/3Zr over Na-K-ETS-10/6Zr because of the slower photodegradation kinetics and with the assumption that the photodegradation mechanism is similar. The occurrence of IPA clearly inhibits the photodegradation of CV and MB in the presence of Na-K-ETS-10/3Zr. This inhibition is very well pronounced for CV (photodegradation does not start) and partial for MB (the photodegradation efficiency drops to 50%). On the other hand, the addition of EDTA-Na2 to the reaction mixture exhibits some photodegradation inhibition for CV and basically no incidence in the MB degradation process. The oxidative breakage of the MB and CV molecules was indirectly confirmed by the absence of signals from 1H NMR spectra related to organic molecules or fragments. The NMR data were collected after the reaction was performed in a 20 mg/mL D2O solution of CV or MB. Due to the very high concentration of the dyes, the reaction time was extended to three days. The NMR results of the solution following CV photodegradation (Figure S1) do not disclose the presence of low molecular intermediates; the only plausible remains may be some C–OH, C–NH2 fragments (though with extremely low concentration). In the case of MB, the concentration was too high, and the reaction could not be initiated (sonication was also attempted).

Figure 11.
The effect of EDTA and IPA scavengers on the degradation process of (a) CV and (b) MB by Na-K-ETS-10/3Zr.
The insights of the mechanism require knowledge of both physicochemical characterization and photodegradation results. As mentioned before, Na-K-ETS-10/6Zr has higher SSA and microporosity than Na-K-ETS-10/3Zr. This is particularly important, as the non-linear PSO model was chosen as the best model describing the photodegradation process. In other words, the non-linear PSO model suggests that the surface interactions of the dyes and the catalysts are the driving force behind the photodegradation process, e.g., higher surface area, faster degradation process. In terms of chemical composition, it is clear from the WDXRF analysis that Zr displaces Ti in the framework. However, the Si amounts also diminish. In small amounts, the targeted Ti→Zr is easily accommodated by the Na-K-ETS-10 framework (Figure 12a,b). The bulkier Zr4+ requires a lengthier Zr–O bond; in addition, the Zr–O bond energy is higher than Ti–O, and as a result, the expanding ETS-10 framework produces Ti vacancies. The breakage of the Ti–O–Ti chains produces TiOH centers. With the increase in Zr amounts, the number of TiOH centers increases, and in addition, Si vacancies are produced (Figure 12c). The Ti→Zr substitution for Zr > 8 wt% cannot be accommodated by the ETS-10 framework, and the PXRD reveals its collapse. The TiOH centers in the presence of defects in the Na-K-ETS-10/3Zr and 6Zr framework suggest that the photocatalytic mechanism must be similar to TiO2 nanoparticles (Figure 12d).
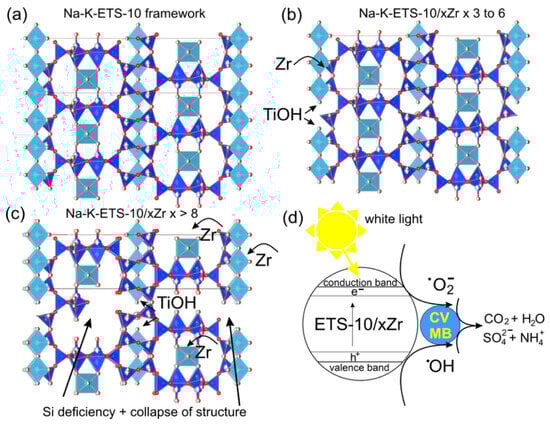
Figure 12.
Depiction of (a) the Na-K-ETS-10 framework, (b) defects produced by the substitution of Ti→Zr up to 6 wt%, e.g., TiOH centers, (c) defects produced by the substitution of Ti→Zr above 8 wt% and (d) mechanism based on TiO2 photodegradation; SiO4 tetrahedra are shown in blue, the TiO6 octahedra are light blue colored and oxygen atoms are red/white.
The photodegradation efficiencies of other catalysts toward MB and CV taken from the literature are provided in Table 6 for comparison. The values of the reported efficiencies of Na-K-ETS-10/6Zr compete with the most promising candidates [40].
Table 6.
Comparative degradation efficiencies of various catalysts toward CV and MB.
4. Conclusions
The purpose of this study was an investigation of the use of microporous Na-K-ETS-10/xZr for wastewater treatment—more specifically, the photodegradation of CV and MB dyes. Na-K-ETS-10/xZr, x = 3 and x = 6 forms were successfully synthesized using the conventional hydrothermal technique without the use of structure-directing agents or templates. When the amounts of Zr were increased (x > 10 wt%), the ETS-10 structure was not conserved. The N2 adsorption/desorption isotherms exhibited micro-/mesoporous features for both 3Zr and 6Zr catalysts; however, the SSA of the samples containing 6 wt% Zr was higher (144 versus 118 m2.g−1). The two synthesized Zr forms of Na-K-ETS-10/xZr (x = 3 and x = 6) were investigated for the treatment of water samples contaminated by crystal violet and methylene blue dyes. The results revealed that the efficiency of the photodegradation process for CV and MB was nearly complete (96–98%). The catalysts showed good reusability, with a slight drop in efficiency after three cycles—92.8% for CV and 79.2 for MB—and a complete regeneration of efficiency after a simple ethanol wash. The kinetic studies showed that the removal of CV and MB was a rapid process, which obeyed the non-linear pseudo-second-order model, with a strong affinity for the zeolite surface. The kinetics of the photodegradation process for the sample containing 6 wt% Zr (Na-K-ETS-10/6Zr) appeared to be faster than those for the sample containing 3 wt% Zr. The excellent photodegradation efficiency and kinetics of the obtained zeolites, along with their conserved reusability and easy regeneration, make them promising materials for industrial application.
Supplementary Materials
The following supporting information can be downloaded at: https://www.mdpi.com/article/10.3390/w15234186/s1, Figure S1: 1H NMR (D2O) spectra of the solution obtained after the degradation of Crystal violet dye—(a) full 1H NMR spectra (0–16 ppm), (b) the aliphatic region (0.5–3.6 ppm) and (c) the aromatic region (5.0–8.5 ppm). The 1HNMR spectra reveals a plethora of low intensive trace 1H signals related to unassigned organic post degradation products. The characteristic signals for CV were not detected.
Author Contributions
Conceptualization, H.L. and B.S.; methodology, H.L.; validation, R.R., H.L. and K.I.; formal analysis, B.B.; investigation, H.L., L.T. and R.R.; data curation, R.R.; writing—original draft preparation, H.L.; writing—review and editing, R.R. and B.S.; visualization, R.R.; project administration, H.L.; funding acquisition, H.L. All authors have read and agreed to the published version of the manuscript.
Funding
This work was supported by the Bulgarian Ministry of Education and Science under the National Research Program “Young scientists and postdoctoral students-2” approved by DCM 206/07.04.2022.
Data Availability Statement
The data used in the current study are available from the corresponding authors upon reasonable request.
Acknowledgments
The authors acknowledge the technical support from the project PERIMED BG05M2OP001-1.002-0005/29.03.2018 (2018–2023).
Conflicts of Interest
The authors declare no conflict of interest.
References
- World Health Organization. Guidelines for Drinking-Water Quality: First Addendum to the Fourth Edition; World Health Organization: Geneva, Switzerland, 2017. [Google Scholar]
- Dettori, M.; Arghittu, A.; Deiana, G.; Castiglia, P.; Azara, A. The revised European Directive 2020/2184 on the quality of water intended for human consumption. A step forward in risk assessment, consumer safety and informative communication. Environ. Res. 2022, 209, 112773. [Google Scholar] [CrossRef]
- Al-Tohamy, R.; Ali, S.S.; Li, F.; Okasha, K.M.; Mahmoud, Y.A.-G.; Elsamahy, T.; Jiao, H.; Fu, Y.; Sun, J. A critical review on the treatment of dye-containing wastewater: Ecotoxicological and health concerns of textile dyes and possible remediation approaches for environmental safety. Ecotoxicol. Environ. Saf. 2022, 231, 113160. [Google Scholar] [CrossRef]
- Chiu, Y.-H.; Chang, T.-F.M.; Chen, C.-Y.; Sone, M.; Hsu, Y.-J. Mechanistic insights into photodegradation of organic dyes using heterostructure photocatalysts. Catalysts 2019, 9, 430. [Google Scholar] [CrossRef]
- Haleem, A.; Shafiq, A.; Chen, S.-Q.; Nazar, M. A comprehensive review on adsorption, photocatalytic and chemical degradation of dyes and nitro-compounds over different kinds of porous and composite materials. Molecules 2023, 28, 1081. [Google Scholar] [CrossRef]
- Sharma, J.; Sharma, S.; Soni, V. Classification and impact of synthetic textile dyes on Aquatic Flora: A review. Reg. Stud. Mar. Sci. 2021, 45, 101802. [Google Scholar] [CrossRef]
- Iqbal, A.; Yusaf, A.; Usman, M.; Hussain Bokhari, T.; Mansha, A. Insight into the degradation of different classes of dyes by advanced oxidation processes; a detailed review. Int. J. Environ. Anal. Chem. 2023. [Google Scholar] [CrossRef]
- Carvalho, S.S.; Rodrigues, A.C.C.; Lima, J.F.; Carvalho, N.M. Photocatalytic degradation of dyes by mononuclear copper (II) complexes from bis-(2-pyridylmethyl) amine NNN-derivative ligands. Inorg. Chim. Acta 2020, 512, 119924. [Google Scholar] [CrossRef]
- Sangareswari, M.; Meenakshi Sundaram, M. Development of efficiency improved polymer-modified TiO2 for the photocatalytic degradation of an organic dye from wastewater environment. Appl. Water Sci. 2017, 7, 1781–1790. [Google Scholar] [CrossRef]
- Shanmugaratnam, S.; Selvaratnam, B.; Baride, A.; Koodali, R.; Ravirajan, P.; Velauthapillai, D.; Shivatharsiny, Y. SnS2/TiO2 nanocomposites for hydrogen production and photodegradation under extended solar irradiation. Catalysts 2021, 11, 589. [Google Scholar] [CrossRef]
- Jiang, L.; Gao, X.; Chen, S.; Ashok, J.; Kawi, S. Oxygen-deficient wo3/tio2/cc nanorod arrays for visible-light photocatalytic degradation of methylene blue. Catalysts 2021, 11, 1349. [Google Scholar] [CrossRef]
- Vogt, E.T.; Whiting, G.T.; Chowdhury, A.D.; Weckhuysen, B.M. Zeolites and zeotypes for oil and gas conversion. In Advances in Catalysis; Elsevier: Amsterdam, The Netherlands, 2015; Volume 58, pp. 143–314. [Google Scholar]
- Durán, B.; Saldías, C.; Villarroel, R.; Hevia, S.A. In Situ Synthesis of CuO/Cu2O Nanoparticle-Coating Nanoporous Alumina Membranes with Photocatalytic Activity under Visible Light Radiation. Coatings 2023, 13, 179. [Google Scholar] [CrossRef]
- Noh, S.H.; Kim, S.D.; Chung, Y.J.; Park, J.W.; Moon, D.K.; Hayhurst, D.T.; Kim, W.J. The effects of (Na + K)/Na molar ratio and kinetic studies on the rapid crystallization of a large pored titanium silicate, ETS-10 using cost efficient titanium oxysulfate, TiOSO4 under stirring. Microporous Mesoporous Mater. 2006, 88, 197–204. [Google Scholar] [CrossRef]
- Kostov-Kytin, V.; Ferdov, S.; Kalvachev, Y.; Mihailova, B.; Petrov, O. Hydrothermal synthesis of microporous titanosilicates. Microporous Mesoporous Mater. 2007, 105, 232–238. [Google Scholar] [CrossRef]
- Pavel, C.; Vuono, D.; Catanzaro, L.; De Luca, P.; Bilba, N.; Nastro, A.; Nagy, J.B. Synthesis and characterization of the microporous titanosilicates ETS-4 and ETS-10. Microporous Mesoporous Mater. 2002, 56, 227–239. [Google Scholar] [CrossRef]
- Brunauer, S.; Emmett, P.H.; Teller, E. Adsorption of gases in multimolecular layers. J. Am. Chem. Soc. 1938, 60, 309–319. [Google Scholar] [CrossRef]
- Sing, K.S. Reporting physisorption data for gas/solid systems with special reference to the determination of surface area and porosity (Recommendations 1984). Pure Appl. Chem. 1985, 57, 603–619. [Google Scholar] [CrossRef]
- Lippens, B.C.; De Boer, J. Studies on pore systems in catalysts: V. The t method. J. Catal. 1965, 4, 319–323. [Google Scholar] [CrossRef]
- Kowalczyk, P.; Terzyk, A.P.; Gauden, P.A.; Rychlicki, G. Numerical Analysis of the Horvath–Kawazoe Equation—The Adsorption of Nitrogen, Argon, Benzene, Carbon Tetrachloride and Sulphur Hexafluoride. Adsorpt. Sci. Technol. 2002, 20, 295–305. [Google Scholar] [CrossRef]
- Barrett, E.P.; Joyner, L.G.; Halenda, P.P. The determination of pore volume and area distributions in porous substances. I. Computations from nitrogen isotherms. J. Am. Chem. Soc. 1951, 73, 373–380. [Google Scholar] [CrossRef]
- Shaban, M.; Abukhadra, M.R.; Khan, A.A.P.; Jibali, B.M. Removal of Congo red, methylene blue and Cr (VI) ions from water using natural serpentine. J. Taiwan Inst. Chem. Eng. 2018, 82, 102–116. [Google Scholar] [CrossRef]
- Krisnandi, Y.K.; Lachowski, E.E.; Howe, R.F. Effects of Ion Exchange on the Structure of ETS-10. Chem. Mater. 2006, 18, 928–933. [Google Scholar] [CrossRef]
- Anderson, M.; Terasaki, O.; Ohsuna, T.; Philippou, A.; MacKay, S.; Ferreira, A.; Rocha, J.; Lidin, S. Structure of the microporous titanosilicate ETS-10. Nature 1994, 367, 347–351. [Google Scholar] [CrossRef]
- Xiang, M.; Zhang, F.; Tong, L.; Wang, H.; Ding, Y.; Zhang, W.; Wu, Z.; Zhang, Z.; Wei, X.; Jiang, F. Development of the hierarchical ETS-10 zeolite catalyst for improving the aqueous-phase biomass hydrodeoxygenation activity. J. Mater. Sci. 2020, 55, 10505–10521. [Google Scholar] [CrossRef]
- Faroldi, B.; Irusta, S.; Cornaglia, L. Influence of La incorporation on the catalytic activity of Ru/ETS-10 catalysts for hydrogen production. Appl. Catal. A Gen. 2015, 504, 391–398. [Google Scholar] [CrossRef]
- Surolia, P.K.; Tayade, R.J.; Jasra, R.V. Photocatalytic degradation of nitrobenzene in an aqueous system by transition-metal-exchanged ETS-10 zeolites. Ind. Eng. Chem. Res. 2010, 49, 3961–3966. [Google Scholar] [CrossRef]
- Lv, L.; Zhou, J.; Su, F.; Zhao, X. Local structure changes of microporous titanosilicate ETS-10 upon acid treatment. J. Phys. Chem. C 2007, 111, 773–778. [Google Scholar] [CrossRef]
- Revellame, E.; Fortela, D.; Sharp, W.; Hernandez, R.; Zappi, M. Adsorption kinetic modeling using pseudo-first order and pseudo-second order rate laws: A review. Clean. Eng. Technol. 2020, 1, 100032. [Google Scholar] [CrossRef]
- Tan, K.; Hameed, B. Insight into the adsorption kinetics models for the removal of contaminants from aqueous solutions. J. Taiwan Inst. Chem. Eng. 2017, 74, 25–48. [Google Scholar] [CrossRef]
- Uddin, M.T.; Islam, M.A.; Mahmud, S.; Rukanuzzaman, M. Adsorptive removal of methylene blue by tea waste. J. Hazard. Mater. 2009, 164, 53–60. [Google Scholar] [CrossRef]
- Robati, D. Pseudo-second-order kinetic equations for modeling adsorption systems for removal of lead ions using multi-walled carbon nanotube. J. Nanostruct. Chem. 2013, 3, 55. [Google Scholar] [CrossRef]
- Yuh-Shan, H. Citation review of Lagergren kinetic rate equation on adsorption reactions. Scientometrics 2004, 59, 171–177. [Google Scholar] [CrossRef]
- Kumbhar, P.; Narale, D.; Bhosale, R.; Jambhale, C.; Kim, J.-H.; Kolekar, S. Synthesis of tea waste/Fe3O4 magnetic composite (TWMC) for efficient adsorption of crystal violet dye: Isotherm, kinetic and thermodynamic studies. J. Environ. Chem. Eng. 2022, 10, 107893. [Google Scholar] [CrossRef]
- Ho, Y.-S.; McKay, G. Pseudo-second order model for sorption processes. Process Biochem. 1999, 34, 451–465. [Google Scholar] [CrossRef]
- Yang, C.; Wang, X.; Ji, Y.; Ma, T.; Zhang, F.; Wang, Y.; Ci, M.; Chen, D.; Jiang, A.; Wang, W. Photocatalytic degradation of methylene blue with ZnO@C nanocomposites: Kinetics, mechanism, and the inhibition effect on monoamine oxidase A and B. NanoImpact 2019, 15, 100174. [Google Scholar] [CrossRef]
- Dagher, S.; Soliman, A.; Ziout, A.; Tit, N.; Hilal-Alnaqbi, A.; Khashan, S.; Alnaimat, F.; Qudeiri, J.A. Photocatalytic removal of methylene blue using titania-and silica-coated magnetic nanoparticles. Mater. Res. Express 2018, 5, 065518. [Google Scholar] [CrossRef]
- Trandafilović, L.V.; Jovanović, D.J.; Zhang, X.; Ptasińska, S.; Dramićanin, M. Enhanced photocatalytic degradation of methylene blue and methyl orange by ZnO: Eu nanoparticles. Appl. Catal. B Environ. 2017, 203, 740–752. [Google Scholar] [CrossRef]
- Mohanty, S.; Moulick, S.; Maji, S.K. Adsorption/photodegradation of crystal violet (basic dye) from aqueous solution by hydrothermally synthesized titanate nanotube (TNT). J. Water Process Eng. 2020, 37, 101428. [Google Scholar] [CrossRef]
- Sahoo, C.; Gupta, A.; Pal, A. Photocatalytic degradation of Crystal Violet (CI Basic Violet 3) on silver ion doped TiO2. Dye. Pigment. 2005, 66, 189–196. [Google Scholar] [CrossRef]
- Yu, Z.; Chuang, S.S. Probing methylene blue photocatalytic degradation by adsorbed ethanol with in situ IR. J. Phys. Chem. C 2007, 111, 13813–13820. [Google Scholar] [CrossRef]
- Zhou, S.; Jiang, L.; Wang, H.; Yang, J.; Yuan, X.; Wang, H.; Liang, J.; Li, X.; Li, H.; Bu, Y. Oxygen Vacancies Modified TiO2/O-Terminated Ti3C2 Composites: Unravelling the Dual Effects between Oxygen Vacancy and High-Work-Function Titanium Carbide. Adv. Funct. Mater. 2023, 33, 2307702. [Google Scholar] [CrossRef]
- Wei, R.; Wang, H.; Jiang, L.; Yang, J.; Li, W.; Yuan, X.; Wang, H.; Liang, J.; Chen, Y.; Bu, Y. Molecular self-assembled synthesis of highly dispersed Co single-atom coordinated 2-methylimidazole modified carbon nitride for peroxymonosulfate activation. Chem. Eng. J. 2023, 471, 144494. [Google Scholar] [CrossRef]
- Wang, X.; Tang, W.; Jiang, L.; Feng, J.; Yang, J.; Zhou, S.; Li, W.; Yuan, X.; Wang, H.; Wang, J. Mechanism insights into visible light-induced crystalline carbon nitride activating periodate for highly efficient ciprofloxacin removal. Chem. Eng. J. 2023, 471, 144521. [Google Scholar] [CrossRef]
- Shaukat, A.; Farrukh, M.A.; Chong, K.-K.; Nawaz, R.; Qamar, M.T.; Iqbal, S.; Awwad, N.S.; Ibrahium, H.A. The Impact of Different Green Synthetic Routes on the Photocatalytic Potential of FeSnO2 for the Removal of Methylene Blue and Crystal Violet Dyes under Natural Sunlight Exposure. Catalysts 2023, 13, 1135. [Google Scholar] [CrossRef]
- Elashery, S.E.; Ibrahim, I.; Gomaa, H.; El-Bouraie, M.M.; Moneam, I.A.; Fekry, S.S.; Mohamed, G.G. Comparative Study of the Photocatalytic Degradation of Crystal Violet Using Ferromagnetic Magnesium Oxide Nanoparticles and MgO-Bentonite Nanocomposite. Magnetochemistry 2023, 9, 56. [Google Scholar] [CrossRef]
- Sharma, G.; Kumar, A.; Naushad, M.; Dhiman, P.; Thakur, B.; García-Peñas, A.; Stadler, F.J. Gum acacia-crosslinked-poly (acrylamide) hydrogel supported C3N4/BiOI heterostructure for remediation of noxious crystal violet dye. Materials 2022, 15, 2549. [Google Scholar] [CrossRef] [PubMed]
- Nguyen, N.T.A.; Kim, H. Ag3PO4-Deposited TiO2@ Ti3C2 Petals for Highly Efficient Photodecomposition of Various Organic Dyes under Solar Light. Nanomaterials 2022, 12, 2464. [Google Scholar] [CrossRef] [PubMed]
- Foroutan, R.; Peighambardoust, S.J.; Boffito, D.C.; Ramavandi, B. Sono-photocatalytic activity of cloisite 30B/ZnO/Ag2O nanocomposite for the simultaneous degradation of crystal violet and methylene blue dyes in aqueous media. Nanomaterials 2022, 12, 3103. [Google Scholar] [CrossRef] [PubMed]
- Ibrahim, I.; Belessiotis, G.V.; Elseman, A.M.; Mohamed, M.M.; Ren, Y.; Salama, T.M.; Mohamed, M.B.I. Magnetic TiO2/CoFe2O4 photocatalysts for degradation of organic dyes and pharmaceuticals without oxidants. Nanomaterials 2022, 12, 3290. [Google Scholar] [CrossRef] [PubMed]
- Valizadeh, K.; Bateni, A.; Sojoodi, N.; Ataabadi, M.R.; Behroozi, A.H.; Maleki, A.; You, Z. Magnetized inulin by Fe3O4 as a bio-nano adsorbent for treating water contaminated with methyl orange and crystal violet dyes. Sci. Rep. 2022, 12, 22034. [Google Scholar] [CrossRef]
- Abdel-Hady, E.; Mohamed, H.F.; Hafez, S.H.; Fahmy, A.M.; Magdy, A.; Mohamed, A.S.; Ali, E.O.; Abdelhamed, H.R.; Mahmoud, O.M. Textural properties and adsorption behavior of Zn–Mg–Al layered double hydroxide upon crystal violet dye removal as a low cost, effective, and recyclable adsorbent. Sci. Rep. 2023, 13, 6435. [Google Scholar] [CrossRef]
- Ali, N.; Khan, A.A.; Wakeel, M.; Khan, I.A.; Din, S.U.; Qaisrani, S.A.; Khan, A.M.; Hameed, M.U. Activation of Peroxymonosulfate by UV-254 nm Radiation for the Degradation of Crystal Violet. Water 2022, 14, 3440. [Google Scholar] [CrossRef]
- Algethami, J.S.; Hassan, M.S.; Alorabi, A.Q.; Alhemiary, N.A.; Fallatah, A.M.; Alnaam, Y.; Almusabi, S.; Amna, T. Manganese Ferrite–Hydroxyapatite Nanocomposite Synthesis: Biogenic Waste Remodeling for Water Decontamination. Nanomaterials 2022, 12, 1631. [Google Scholar] [CrossRef] [PubMed]
- Wang, J.; Gao, B.; Liu, D.; Cheng, L.; Zhang, Y.; Lu, D.; Yu, H.; Chen, A.; Yuan, S.; Chen, K. Morphological Control of Supported ZnO Nanosheet Arrays and Their Application in Photodegradation of Organic Pollutants. Nanomaterials 2023, 13, 443. [Google Scholar] [CrossRef] [PubMed]
- Gharbani, P.; Mehrizad, A.; Mosavi, S.A. Optimization, kinetics and thermodynamics studies for photocatalytic degradation of Methylene Blue using cadmium selenide nanoparticles. NPJ Clean Water 2022, 5, 34. [Google Scholar] [CrossRef]
- Qu, T.; Yao, X.; Owens, G.; Gao, L.; Zhang, H. A sustainable natural clam shell derived photocatalyst for the effective adsorption and photodegradation of organic dyes. Sci. Rep. 2022, 12, 2988. [Google Scholar] [CrossRef] [PubMed]
- Wang, C.; Liu, Y.; Han, H.; Wang, D.; Chen, J.; Zhang, R.; Zuo, S.; Yao, C.; Kang, J.; Gui, H. C, N co-doped TiO2 hollow nanofibers coated stainless steel meshes for oil/water separation and visible light-driven degradation of pollutants. Sci. Rep. 2023, 13, 5716. [Google Scholar] [CrossRef] [PubMed]
- Berehe, B.A.; Assen, A.H.; Kumar, A.S.K.; Ulla, H.; Duma, A.D.; Chang, J.-Y.; Gedda, G.; Girma, W.M. Highly efficient visible light active ZnO/Cu-DPA composite photocatalysts for the treatment of wastewater contaminated with organic dye. Sci. Rep. 2023, 13, 16454. [Google Scholar] [CrossRef]
- Nutescu Duduman, C.; Gómez de Castro, C.; Apostolescu, G.A.; Ciobanu, G.; Lutic, D.; Favier, L.; Harja, M. Enhancing the TiO2-Ag Photocatalytic Efficiency by Acetone in the Dye Removal from Wastewater. Water 2022, 14, 2711. [Google Scholar] [CrossRef]
- Ahmad, Z.; Tahir, R.; Sajjad, N.; Batool, F.; Zada, N.; Ullah, H. Cleansing Water: Harnessing Trimetallic Nanoparticles in Sunlight to Degrade Methylene Blue Dye, Aiding Aquatic Contaminant Cleanup. Water 2023, 15, 3404. [Google Scholar] [CrossRef]
- Vallejo, W.; Cantillo, A.; Salazar, B.; Diaz-Uribe, C.; Ramos, W.; Romero, E.; Hurtado, M. Comparative study of ZnO thin films doped with transition metals (Cu and Co) for methylene blue photodegradation under visible irradiation. Catalysts 2020, 10, 528. [Google Scholar] [CrossRef]
- Zhang, J.; Zhang, H.; Li, W.; Yang, L.; Wu, H.; Mao, N. Photocatalytic Properties of a Novel Keratin char-TiO2 Composite Films Made through the Calcination of Wool Keratin Coatings Containing TiO2 Precursors. Catalysts 2021, 11, 1366. [Google Scholar] [CrossRef]
- Weon, S.H.; Han, J.; Choi, Y.-K.; Park, S.; Lee, S.H. Development of Blended Biopolymer-Based Photocatalytic Hydrogel Beads for Adsorption and Photodegradation of Dyes. Gels 2023, 9, 630. [Google Scholar] [CrossRef] [PubMed]
- Altaf, N.U.H.; Naz, M.Y.; Shukrullah, S.; Ghaffar, A.; Irfan, M.; Walczak, D.; Głowacz, A.; Mahnashi, M.H.; Rahman, S.; Królczyk, G. Concurrent synthesis and immobilization of Ag nanoparticles over TiO2 via plasma reduction for photocatalytic treatment of methyl blue in water. Materials 2021, 14, 6082. [Google Scholar] [CrossRef] [PubMed]


Disclaimer/Publisher’s Note: The statements, opinions and data contained in all publications are solely those of the individual author(s) and contributor(s) and not of MDPI and/or the editor(s). MDPI and/or the editor(s) disclaim responsibility for any injury to people or property resulting from any ideas, methods, instructions or products referred to in the content. |
© 2023 by the authors. Licensee MDPI, Basel, Switzerland. This article is an open access article distributed under the terms and conditions of the Creative Commons Attribution (CC BY) license (https://creativecommons.org/licenses/by/4.0/).