Article

Study on Calculating Appropriate Impact Assessment for LID Facility Using A-I-R Curve

1
Department of Fire and Disaster Prevention, Konkuk University, Chungju 27478, Republic of Korea
2
Department of Environmental Research, Korea Institute of Civil Engineering and Building Technology, Goyang 10223, Republic of Korea
3
Department of Aeronautics and Civil Engineering, Hanseo University, Seosan 31962, Republic of Korea
4
Department of Civil Environmental Engineering, Dongshin University, Naju 582452, Republic of Korea
*
Author to whom correspondence should be addressed.
Water 2023, 15(23), 4198; https://doi.org/10.3390/w15234198
Submission received: 5 November 2023 / Revised: 26 November 2023 / Accepted: 1 December 2023 / Published: 4 December 2023

Abstract

:
Low impact development (LID) facilities are designed to maintain water circulation functions on the surface and subsurface. LID facilities can be applied to various areas and are expected to have both short-term and long-term effects, making them widely installed in urban areas. In this study, our objective is to calculate the A-I-R (Area ratio-rainfall Intensity-Runoff reduction rate) curve by applying design standards to tree filter boxes, garden plant pots, infiltration ditches, and rain barrels among various LID facilities. The analysis was conducted by constructing a SWMM-LID model and analyzing 209 items, considering the area ratio (A) and rainfall intensity (I) of the LID facilities. The runoff reduction rate (R) varies by LID facility according to the A-I-R curve. It reaches up to 100.0% for rain barrels, up to 30.0% for infiltration ditches, up to 20.0% for garden plant pot, and up to 12.0% for tree filter boxes. If the A-I-R curve of the LID facility is applied to the design standards, it is expected to facilitate the design of the facility’s size and inlet according to the target reduction rate.

1. Introduction

Urbanization is progressing rapidly due to the construction of various social infrastructures [1,2]. Gray infrastructure constructed with impervious materials is disrupting the natural water cycle process and increasing the surface runoff of rainwater [3]. To restore a healthy water cycle process, both structural and non-structural measures are essential. In the 1990s, the need for low-impact development was recognized in the United States to manage rainwater and restore the natural water cycle. LID is a technique developed to reinstate water circulation in impervious areas. By introducing LID facilities in a comprehensive manner, it is possible to reduce stormwater runoff and non-point pollutants throughout the study area [4,5,6,7,8,9]. LID facilities offer various advantages, such as flexibility in designing the facility size, a distributed layout, effectiveness, and improved aesthetics [10]. Therefore, cities in developed countries, including New York City in the United States, actively employ LID facilities [11,12]. The LID facility prevents floods by securing storage time for the water purification system in case of rainfall. In addition, it reduces environmental pollution by reducing the inflow of streams by storing non-point pollutants.
In Korea, the gradual introduction of LID facilities is underway under the leadership of central and local governments. The establishment of a comprehensive non-point pollution source management plan for LID facilities in 2004, the implementation of a non-point pollution source installation reporting system in 2006, the initiation of a government subsidy project in 2006, and the development of the second comprehensive non-point pollution source management plan in 2012 were carried out [13]. Through comprehensive measures and institutional regulations, the introduction of LID facilities is being promoted when developing urban areas and industrial complexes with high impervious rates. There is a need for facilities that can reduce the initial rainfall due to the short time of concentration in urban areas. If the LID facility that can reduce the outflow of rainfall in the initial stormwater is used, both the maximum outflow and the damage will be reduced.
Godeok New Town, situated in Pyeongtaek, Gyeonggi-do, planned to install LID facilities, including infiltration channels, retention ponds, and permeable pavements, covering a total area of 82,000 m2. Recently, the “Zero Rainwater Runoff Complex Construction Project Maintenance and Effectiveness Evaluation” project targeted the Ochang Science Industrial Complex in Cheongju, Chungcheongbuk-do [13,14]. Jeonju City in Jeollabuk-do introduced low-impact development techniques in all urban development projects to preserve natural waterways as much as possible [15]. The introduction of an LID facility can reduce complex stormwater runoff across the entire watershed beyond the individual facility’s impact.
In addition to installing LID facilities, various studies are being conducted to verify the effectiveness of reducing stormwater runoff. Initially, studies were conducted to verify the effectiveness of LID facilities through experiments [16,17,18,19,20]. Furthermore, as LID facilities were applied to the Storm Water Management Model, verification of the LID facility using modeling and validation of the effectiveness of the facility’s reduction effect were studied [5,21,22,23]. It analyzed the effect of watershed reduction following the installation of an LID facility in the Brooklyn area of New York, USA. Additionally, a review was conducted on the cost-effectiveness of installing LID facilities [24]. Moreover, the adequacy of LID facilities was assessed by evaluating the reduction effect on the watershed unit or a small drainage area [22,25,26].
In countries such as Germany, Italy, India and China, LID facilities have been installed on school campuses to evaluate their effectiveness [27,28,29,30,31,32,33]. Installed facilities include permeable pavements and parking lots, green roofs and vertical greening, wet ponds, sunken green spaces, bioretention, rain gardens, vegetative swales, green walls, and more that can be used in urban construction [34]. Numerous computational models have been developed and utilized to simulate the construction of the sponge city and LID facilities, including SWMM, MIKE Urban and InfoWorks ICM, among others [35,36].
Prior research used experiments and modeling to verify and evaluate the reduction effect from the development of LID facilities. In addition, a continuous reduction effect and maintenance plan for the LID facility was proposed through continuous monitoring [37,38]. The design standards of LID facilities at home and abroad provide facility specifications, design drawings, and reduction rates [39,40,41,42,43]. Some design standards suggest reduction efficiency for simple rainfall, but there are no design standards for the target reduction rate or installable capacity. However, the runoff reduction rate (R) of an LID facility increases as the capacity of the facility increases. Even if the installed capacity is the same, it varies depending on the rainfall intensity, and as the rainfall intensity increases, the runoff reduction rate (R) decreases.
In this study, we intend to analyze the runoff reduction rate (R) according to the area ratio (A) and rainfall intensity (I) for four types of LID facilities installed in the study area. The runoff reduction rate (R) is the ratio of the runoff after installation to the difference between the runoff before and after the installation of LID facilities. The area ratio (A) is defined as the ratio of the LID facility surface area to the catchment area of the LID facility. The LID facility selected is a tree filter box, garden plant pot, infiltration ditch, and rain barrel, and it proposes appropriate design standards by analyzing the reduction effect according to various rainfall intensities.

2. Materials and Methods

2.1. SWMM-LID Facility

The SWMM (Storm Water Management Model) was developed in 1971 by Metcalf & Eddy in collaboration with the University of Florida and W.R.E. with the support of the United States Environmental Protection Agency (USEPA) to simulate flow rates and water quality in urban sewerage systems [44]. SWMM is based on a series of processes that simulate the effluent and pollutant loads generated by rainfall in the drainage area in consideration of the physical characteristics of the hydraulic structure. It has the advantage of enabling tracking and comparison of runoff generation and transport processes, which can significantly contribute to urban watershed management [45,46].
SWMM-LID is a model in which the LID facility management function is added to the existing model, and it continues to perform the distributed rainfall runoff function. The LID technology elements provided by SWMM-LID are listed in Table 1. LID technology elements can analyze a total of eight types of LID facilities, and the drainage functions of four vertical layers for surface, soil, storage, and pavement can be set to consider the installed land conditions.
The characteristics of each LID technology element provided by SWMM-LID are as follows. (a) The bio-retention cell retains, infiltrates, and detains runoff water through vegetation and soil mixing. (b) The rain garden is composed of a surface layer and a soil layer, with functions for rainwater infiltration, retention, and storage within the soil layer. (c) The green roof is a technical element specialized for rooftop greening and has functions for rainwater infiltration, retention, storage, and drainage. (d) The infiltration trench is a technical element consisting of a surface layer and a storage layer, primarily serving to store and drain rainwater. (e) The permeable pavement is a technical element specialized for roads and sidewalks where permeable pavement materials are applied. It is composed of a surface layer, pavement layer, soil layer, and storage layer. (f) The rain barrel is a representative rain barrel primarily used for storing precipitation. (g) The rooftop disconnection is a rainwater conduit installed in a general building, one of the technical elements applied to improve stormwater drainage function. (h) The vegetative swale is a technical element composed solely of the ground layer, and its function can be influenced by the ground layer’s covering condition.

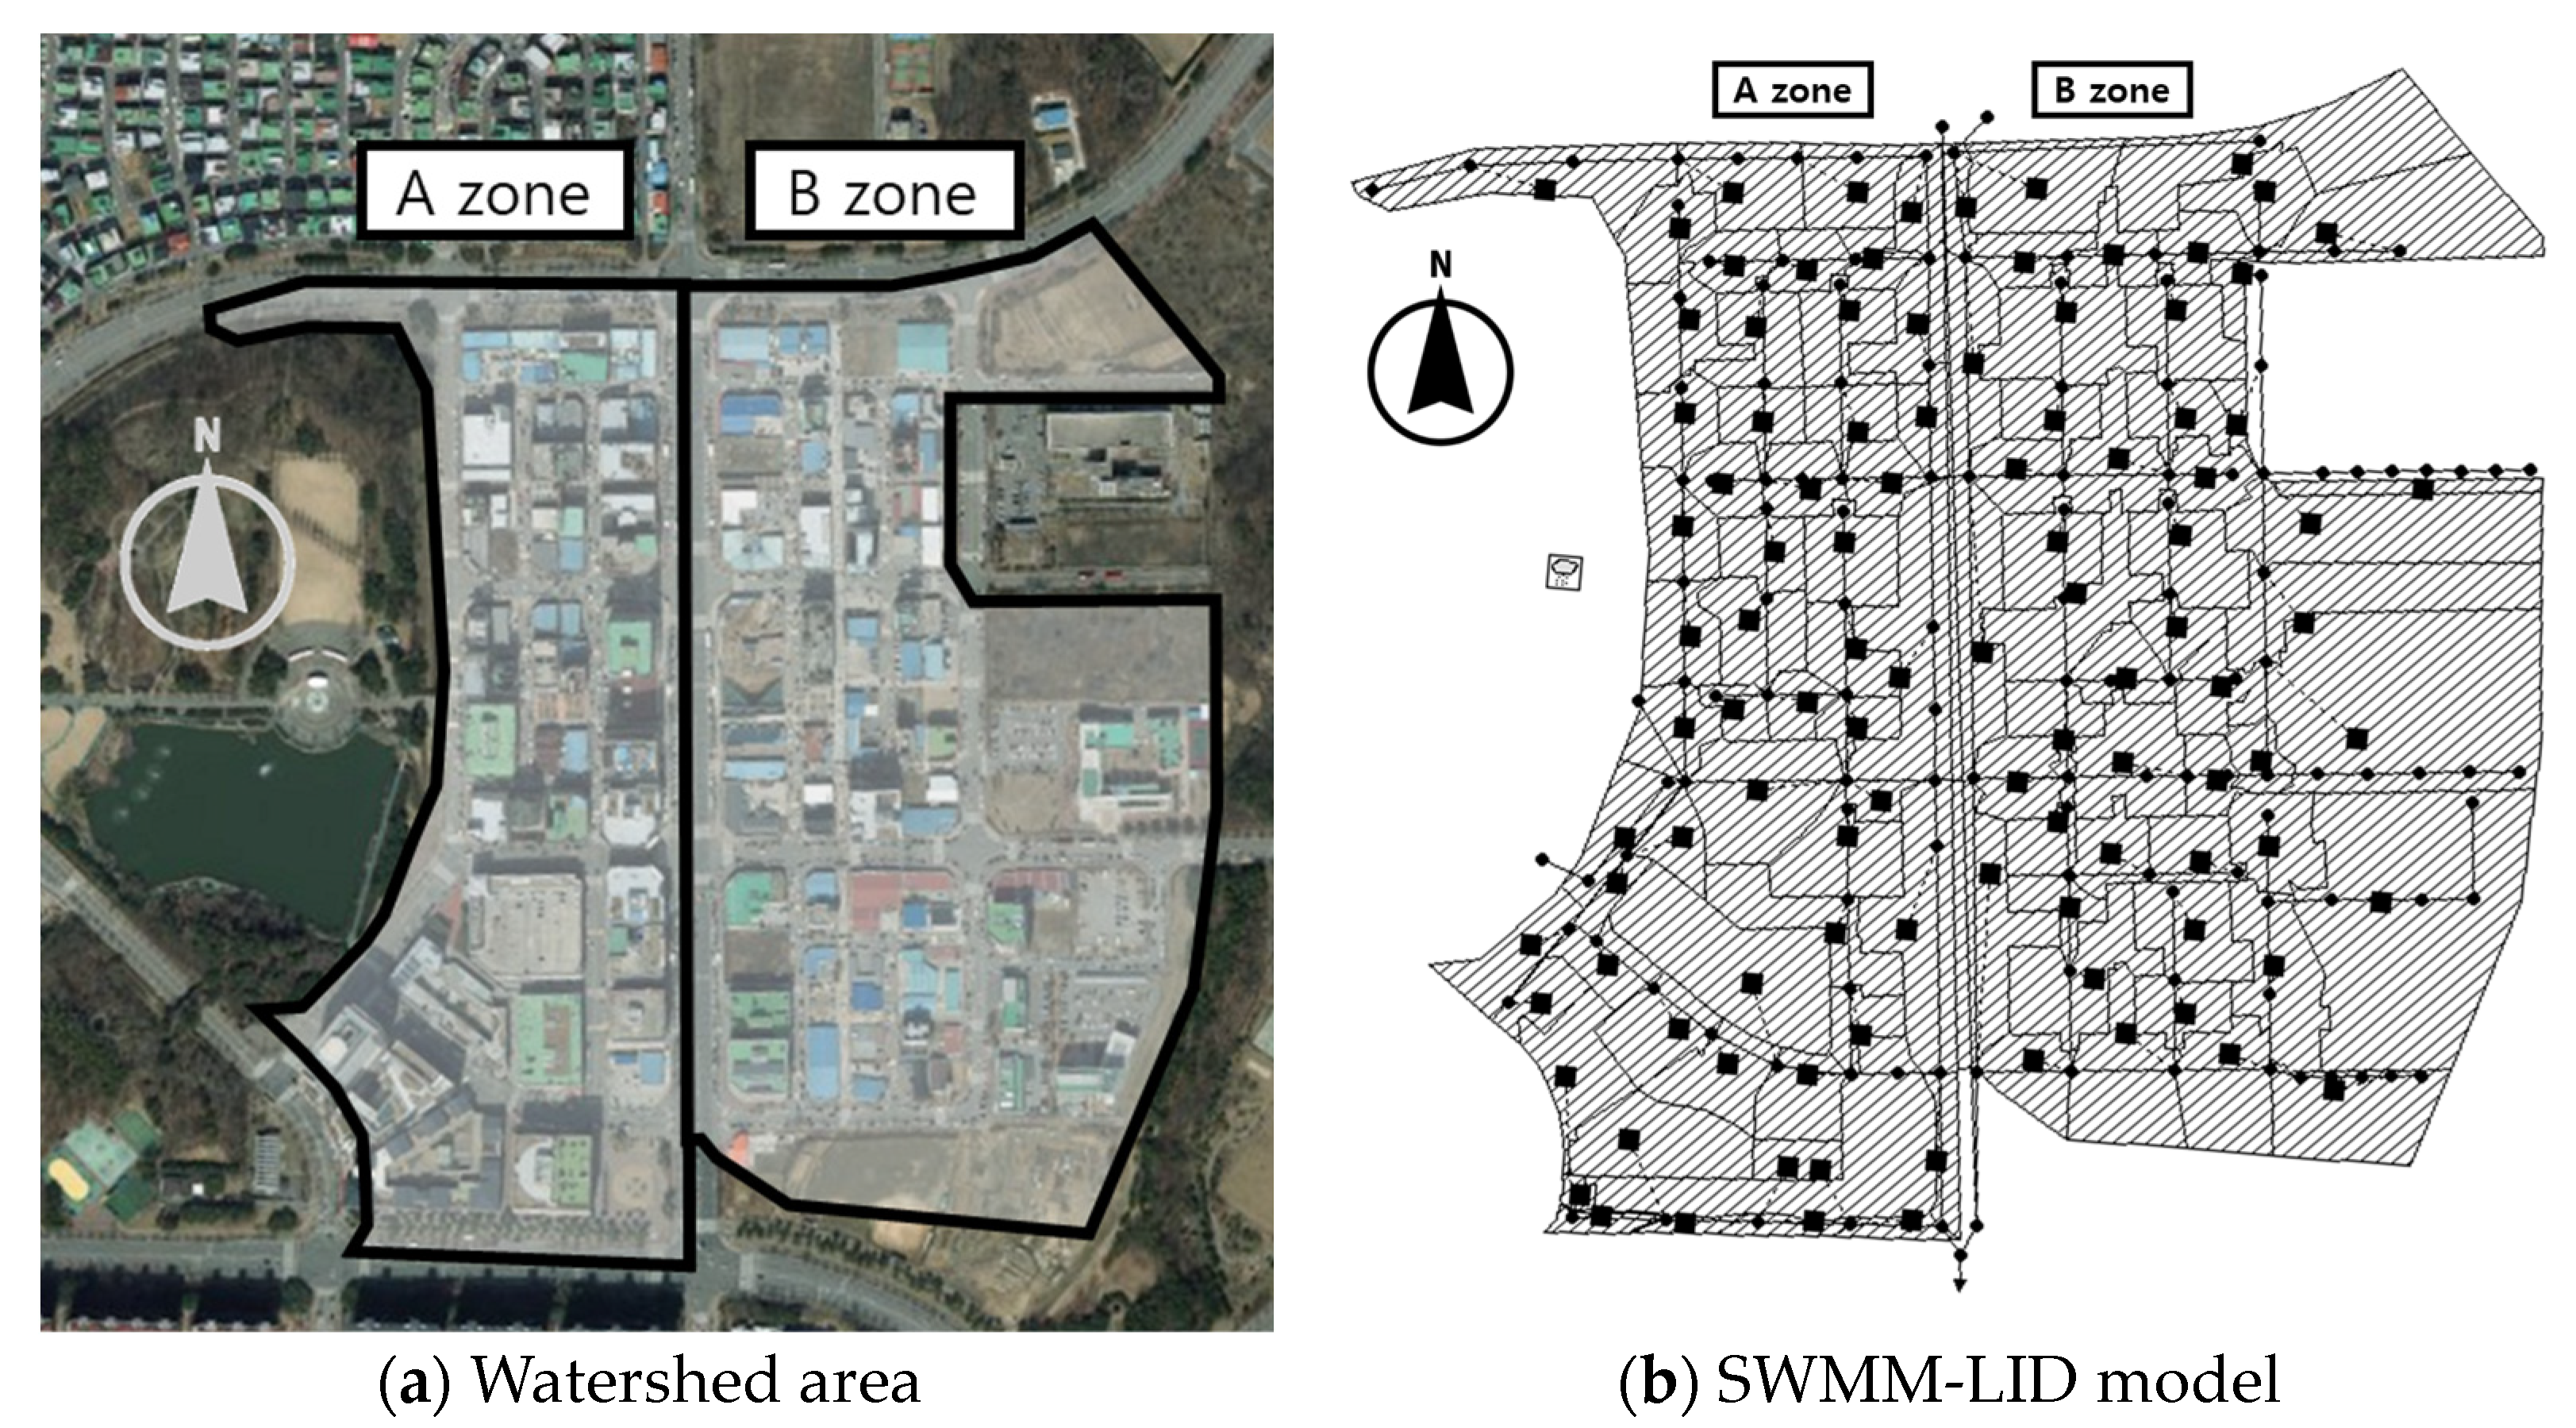
2.2. Study Area and LID Facilities

The study area for this research is the Ochang Science Industrial Complex, situated in Cheongwon-gun, Cheongju-si, Chungcheongbuk-do, South Korea. The total watershed area of the study region covers 411,183 m2, divided into 180,003 m2 in the A zone on the left and 231,180 m2 in the B zone on the right, centered on the road (Figure 1a). This study area is an industrial complex with wide roads, sidewalks, and various infrastructure elements such as plazas and parks distributed across the area, making it conducive for the application and installation of LID facilities. In total, four types of LID facilities were installed, with two types in the A zone and four types in the B zone, considering land use plans and watershed characteristics.
To analyze the reduction effect of the LID facilities, a pipe network diagram was constructed for SWMM-LID modeling (Figure 1b) [47]. The study area is composed of a total of 100 conduits and 140 manholes, with an average conduit length of around 60.6 m and an average slope of approximately 1.2%. For spatial analysis, a digital elevation model (DEM) was assessed using ArcGIS, and elevation and slope data were applied.
The LID facilities installed in this study area include a tree filter box, a garden plant pot, an infiltration ditch, and a rain barrel. The design drawings are shown in Figure 2. A zone has a tree filter box and a garden plant pot. B zone has a tree filter box, a garden plant pot, an infiltration ditch and a rain barrel.
The LID facility in the study area has a total area of 141,688 m2, accounting for approximately 34.5% of the total watershed area. The facility area of the LID facility catchment area is 46,984 m2 in zone A and 94,704 m2 in zone B (Table 2). The LID facilities installed in zone A consist of a tree filter box and a garden plant pot. A total of seven tree filter boxes were installed, covering an area of 22,777 m2. Additionally, six garden plant pots were installed, covering an area of 24,207 m2. In zone B, the LID facilities include a tree filter box, garden plant pot, an infiltration ditch, and a rain barrel. A total of 10 tree filter boxes were installed, covering an area of 62,733 m2. Four garden plant pots were installed, covering an area of 23,418 m2. Two infiltration ditches were installed, covering an area of 8474 m2. Additionally, two rain barrels were installed, covering an area of 79 m2.

3. Results

3.1. Calibration for SWMM-LID Installation

Monitoring data and the SWMM-LID model were verified and adjusted for the LID facility installed in this study area. Monitoring took place from June 2015 to December 2015 to assess whether the installed LID facility had a reduction effect. Based on the rainfall and flow data recorded during the monitoring period, verification and adjustments were carried out by incorporating these data into the SWMM-LID model. Among the monitored data, five rainfall events were selected, as shown in Table 3. These rainfall events had characteristics that included a total rainfall ranging from 8.3 mm to 34.1 mm, a rainfall duration between 4 h and 18 h, and an average rainfall intensity ranging from 0.5 mm/h to 3.5 mm/h.
For watershed-level verification and adjustment, cases that simulate flow rates similar to the observed data are chosen for each heavy rainfall event by fine-tuning parameters related to the direct runoff volume (such as impervious, slope, width of overland flow path, and Manning (n)). The parameter characteristics of each watershed in the study area are shown in Table 4.
The ultimate parameters were determined by averaging the overall outcomes. By comparing the monitoring data with the verification and correction results, as illustrated in Figure 3, it was observed that the simulation results appropriately captured the outflow characteristics of the actual watershed. CMS is the flow rate unit and it is the same as that of m3.
To verify the calibration results, this study employed various error indices to evaluate the model’s performance against the observed data. The correlation coefficient (CC), Nash–Sutcliffe efficiency coefficient (NSE), bias (B), percent bias (PBIAS), RMSE-observations standard deviation ratio (RSR), root-mean-square error (RMSE), and R-squared are used as the error indices. For the specific formulations of these error indices, readers can refer to [37].
The average value of the error index in both the A zone and B zone of the study area was 0.82, confirming that the analysis results of the constructed model were suitable for simulation. The error indices of the NSE and PBIAS in the B zone were not satisfactory, although most of the calibrated results demonstrated that the model’s performance was adequate for simulating runoff flow (Table 5).

3.2. Derivation and Utilization of A-I-R Curve for Each LID Facility

For LID facilities, the runoff reduction rate (R) improves as the facility capacity increases within the same watershed area. Additionally, as the rainfall intensity increases, the inflow increases and the runoff reduction rate (R) decreases. To evaluate the outflow reduction effect of this LID facility, it is necessary to assess the reduction effect under various rainfall intensities and facility capacities. Inflow is the inflow by the watershed area according to rainfall occurrence, runoff is the outflow of the LID facility, and outflow is the outflow of the watershed area.
The purpose of this study is to evaluate the runoff reduction rate (R) concerning the area ratio (A) and rainfall intensity (I) of the LID facility. The area ratio (A) is defined as the ratio of the LID facility’s surface area (SA) to the catchment area (CA) of the LID facility. The area ratio (A) was set to 19 conditions, ranging from 0.1% to 1.0% (0.1% intervals), and from 2.0% to 10.0% (1.0% intervals), considering the water collection area and surface area of each LID facility installed in the study area. Rainfall intensity (I) was established at 11 rainfall conditions, including 5 mm/h, and intervals from 10 mm/h to 100 mm/h (10 mm/h intervals), to account for the various design frequencies of the study area. Rainfall intensity for the frequency of 500 years in the study area was 100.4 mm/h, and a maximum analysis range of 100 mm/h was set. In the evaluation of the reduction effect by the LID facility, a total of 209 analyses were conducted, encompassing 19 conditions for the area ratio and 11 conditions for rainfall intensity (I) (Table 6).
The A-I-R curve was analyzed for the LID facilities of a tree filter box, garden plant pot, infiltration ditch, and rain barrel installed in the study area. The analysis method fixed the installation conditions of the LID facilities in the study area and assessed the runoff reduction rate (R) for changes in the area and rainfall intensity (I) for each facility. The analysis results of the A-I-R curve provided design standards for each LID facility for rainfall intensity (I) and the area ratio reduction rate (R).
The analysis results of the tree filter box are depicted in Figure 4, showing the runoff reduction rate (R) based on area ratio (A) and rainfall intensity (I). The runoff reduction rate (R) of the tree filter box increased linearly as the area ratio (A) increased, reaching a maximum of about 11%. When the area ratio (A) was 5% or more, the difference in the runoff reduction rate (R) due to variations in rainfall intensity was less than 0.1%, indicating a minimal effect. The runoff reduction rate (R) ranged from 2.5% to 11.3% concerning the area ratio (A) to rainfall intensity (I). As the area ratio (A) increased, the runoff reduction rate (R) also increased, but depending on the rainfall intensity (I), the change was determined to be not significantly different.
The analysis results for the garden plant pots are depicted in Figure 5, displaying the runoff reduction rate (R) based on the area ratio (A) and rainfall intensity (I). The runoff reduction rate (R) for garden plant pots continued to increase as the area ratio (A) increased, reaching a maximum of about 16%. When the area ratio (A) is less than 5%, there is a difference in the slope depending on the rainfall intensity, but the runoff reduction rate (R) consistently increases, with a maximum of about 16% observed.
For area ratios (A) of 5% or more, the impact of rainfall intensity (I) on the runoff reduction rate (R) was found to be minimal. The runoff reduction rate (R) regarding the area ratio (A) to rainfall intensity (I) decreased as it increased in the range of 0.1% to 1.0%. However, the change in the area ratio (A) from 2.0% to 10.0% with respect to rainfall intensity (I) was small, and the runoff reduction rate (R) was analyzed to be within the range of 10.0% to 20.0%.
The analysis results of the infiltration ditch are presented in Figure 6, showing the runoff reduction rate (R) in relation to the area ratio (A) and rainfall intensity (I). The runoff reduction rate (R) for the infiltration ditch continued to increase as the area ratio (A) increased, reaching a maximum of about 25.0%. While there are differences based on the rainfall intensity (I), the slope gradually increases when the runoff reduction rate (R) reaches 20.0%. It was observed that the runoff reduction rate (R) significantly decreased as the area ratio (A) decreased. When the rainfall intensity (I) was less than 20 mm/h, a runoff reduction rate of approximately 5.0% was observed, depending on the area ratio (A). However, as rainfall intensity (I) increases, the disparity in the area ratio (A) widens, resulting in a maximum runoff reduction rate (R) of about 25.0%.
The analysis results for the rain barrel are displayed in Figure 7, illustrating the runoff reduction rate (R) in relation to the area ratio (A) and rainfall intensity (I). The runoff reduction rate (R) for the rain barrel was observed to continuously increase, reaching 100.0% as the area ratio (A) increased. As the rainfall intensity (I) increased, the slope concerning the area ratio (A) decreased, but the runoff reduction rate (R) continued to rise steadily. It was determined that the runoff reduction rate (R) decreased with a decreasing area ratio (A). When the area ratio (A) was less than 0.5% or more than 5.0%, the runoff reduction rate (R) was found to be in the range of 20.0% to 50.0%. However, when the area ratio (A) was between 0.5% and 5.0%, a significant runoff reduction rate (R) was observed.

4. Discussion

LID facilities are installed and operated as measures to minimize environmental impacts and prevent disasters resulting from urban development. The development and installation of LID facilities are increasing through urban water circulation policies both domestically and internationally [15,24]. Numerous studies have been conducted to develop LID facilities and demonstrate their reduction efficiency.
One study aimed to verify the outflow reduction effect by installing and monitoring an LID facility [3,5,16,18,21,22]. Previous studies have verified the reduction effect of rainfall observed in LID facilities compared to before installation. Only the reduction effect of LID facilities on rainfall events was presented as a percentage (%), while the application of design frequency was not studied. Furthermore, modeling was analyzed using SWMM-LID to assess the varied reduction effects based on the installed capacity for the LID facility in the study area. In the analysis, adequacy was demonstrated through various assessments of LID facility parameters and rainfall conditions [2,24,25,26]. In the modeling analysis using SWMM-LID, the optimal installation conditions that can be installed according to the parameters and rainfall conditions of the study area were studied. However, various rainfall intensities for design standards could not be applied to all LID facilities or terrain conditions. Design standards for LID facilities have been proposed in numerous prior studies [37,38,39,40,41,42,43]. However, some studies only provide design drawings for LID facility installations or offer reduction effects for a single installation capacity.
The installation of an LID facility can be applied in various fields, and it is essential to determine the facility size based on the desired reduction efficiency. Naturally, as the scale of the LID facility increases, the reduction efficiency will also rise. Conversely, with increasing rainfall intensity, the reduction efficiency of the LID facility tends to decrease. Given the recent climate changes that have led to abnormal rainfall patterns and increased localized rainfall occurrences, researching the reduction efficiency concerning the LID facility area and rainfall intensity is imperative.
Studying the reduction efficiency related to the facility area and rainfall intensity (I) through monitoring after the LID facility installation requires long-term rainfall events. Therefore, in this study, we selected a study area, conducted verification and calibration of the LID facility, and presented the runoff reduction rate (R) based on the area ratio and rainfall intensity (I) for four types. The A-I-R curve developed in this study can serve as a design standard for determining the capacity and design rainfall intensity (I) of the LID facility. When the area ratio (A) and rainfall intensity (I) of the LID facility are known, the target runoff reduction rate (R) can be predicted from the A-I-R curve. Furthermore, to calculate the annual runoff reduction rate (R), it can be estimated by considering the expected rainfall intensity (I), the number of rainfall events, and the reduction rate.
The A-I-R curves for the four types of LID facilities proposed in this study have limitations as they are modeling analysis results and cannot be used for calculating quantitative reduction effects. However, it is anticipated that highly practical design standards will be attainable if monitoring is applied to detect and correct various rainfall intensity (I) events.

5. Conclusions

In this study, we analyzed the runoff reduction rate (R) using the area ratio (A) and rainfall intensity (I) for LID facilities and investigated the calculation of appropriate design standards from the A-I-R curve. The study area selected was the Ochang Science Industrial Complex in Korea, and the LID facility is equipped with a tree filter box, garden plant pot, infiltration ditch, and rain barrel.
We constructed a SWMM-LID model to analyze the runoff reduction rate (R) of the LID facility. For verification and model correction, parameters were selected using five rainfall events. The model’s performance was assessed using seven types of error indices, resulting in a high correlation coefficient of 0.82, confirming the model’s adequacy. To analyze the A-I-R curve for each LID facility, we established analysis conditions for the area ratio and rainfall intensity (I).
The A-I-R curve primarily determined the design standards for the area ratio (A) and rainfall intensity (I) for each LID facility. Among the four LID facilities, the rain barrel showed the highest runoff reduction rate (R). Although it varied depending on the area ratio (A), it was found that for a rainfall intensity (I) of about 60 mm/h or less and an area ratio (A) of 0.8% or more, a 100% reduction was achieved. Additionally, the LID facility was found to achieve a runoff reduction rate (R) of up to 30.0% for the infiltration ditch, up to 20.0% for the garden plant pot, and up to 12.0% for the tree filter box, depending on the area ratio (A) and rainfall intensity (I).
In this study, we presented the A-I-R curve as design standards that can be used in the planning and design of LID facilities. Using the A-I-R curve, one can calculate the area ratio (A) of the LID facility and predict the runoff reduction rate (R) for rainfall events. Furthermore, by determining the target reduction rate and the capacity of the LID facility, it is possible to design an appropriate inlet according to rainfall intensity (I). If the A-I-R curve is applied in the LID facility, the runoff reduction rate can be evaluated for the rainfall intensity occurring at the maximum frequency of 500 years. The runoff reduction rate can be used to secure the budget for the installation of LID facilities. It is believed that the A-I-R curve for each LID facility, when used as a design standard, can facilitate the easy application and effective planning of LID facilities.

Author Contributions

Conceptualization, Y.S. and J.J.; methodology, Y.S.; software, J.J.; validation, Y.S., Y.P. and M.P.; formal analysis, M.P.; investigation, Y.S.; resources, Y.P.; data curation, Y.S.; writing—original draft preparation, Y.S.; writing—review and editing, J.J.; visualization, Y.P.; supervision, M.P.; project administration, M.P.; funding acquisition, Y.S. All authors have read and agreed to the published version of the manuscript.

Funding

This research was supported by the program of Research Program to Solve Urgent Safety Issues (2021M3E9A1103525), through the National Research Foundation of Korea (NRF), funded by the Korean government (Ministry of Science and ICT (MSIT), Ministry of the Interior and Safety (MOIS)).

Data Availability Statement

These data are analyzed based on a book report and have not been published on the site.

Conflicts of Interest

The authors declare no conflict of interest.

References

  1. Grimmond, S. Urbanization and global environmental change: Local effects of urban warming. Geogr. J. 2007, 173, 83–88. [Google Scholar] [CrossRef]
  2. Damodaram, C.; Giacomoni, M.H.; Prakash Khedun, C.; Holmes, H.; Ryan, A.; Saour, W.; Zechman, E.M. Simulation of combined best management practices and low impact development for sustainable stormwater management 1. JAWRA J. Am. Water Resour. Assoc. 2010, 46, 907–918. [Google Scholar] [CrossRef]
  3. Dietz, M.E. Low impact development practices: A review of current research and recommendations for future directions. Water Air Soil Pollut. 2007, 186, 351–363. [Google Scholar] [CrossRef]
  4. Yu, Z.; Aguayo, M.; Montalto, F.; Piasecki, M.; Behr, C. Developments in LIDRA 2.0: A Planning Level Assessment of the Cost-Effectiveness of Low Impact Development. In World Environmental and Water Resources Congress 2010: Challenges of Change, Rhode Island, United States of America; ASCE: Reston, VA, USA, 2010; pp. 3261–3270. [Google Scholar]
  5. Ahiablame, L.M.; Engel, B.A.; Chaubey, I. Effectiveness of low impact development practices: Literature review and suggestions for future research. Water Air Soil Pollut. 2012, 223, 4253–4273. [Google Scholar] [CrossRef]
  6. Ahiablame, L.M.; Engel, B.A.; Chaubey, I. Effectiveness of low impact development practices in two urbanized watersheds: Retrofitting with rain barrel/cistern and porous pavement. J. Environ. Manag. 2013, 119, 151–161. [Google Scholar] [CrossRef] [PubMed]
  7. U.S. Environmental Protection Agnecy. Storm Water Management Model User’s Manual Version 5.1. 2015. Available online: https://www.epa.gov/sites/default/files/2019-02/documents/epaswmm5_1_manual_master_8-2-15.pdf (accessed on 1 September 2015).
  8. Kim, J.; Choi, S.; Joo, J. EPA SWMM-LID Modeling for Low Impact Development. J. Korean Soc. Hazard. Mitig. 2017, 17, 415–424. [Google Scholar] [CrossRef]
  9. Kim, J.; Joo, J. A Study on the Performance Comparison of the Low Impact Development Facilities for Long-term Stormwater Reduction. J. Korean Soc. Hazard. Mitig. 2017, 17, 337–344. [Google Scholar] [CrossRef]
  10. Dietz, M.E.; Clausen, J.C. Stormwater runoff and export changes with development in a traditional and low impact subdivision. J. Environ. Manag. 2008, 87, 560–566. [Google Scholar] [CrossRef] [PubMed]
  11. De Sousa, M.R.; Montalto, F.A.; Spatari, S. Using life cycle assessment to evaluate green and grey combined sewer overflow control strategies. J. Ind. Ecol. 2012, 16, 901–913. [Google Scholar] [CrossRef]
  12. Eckart, K.; McPhee, Z.; Bolisetti, T. Performance and implementation of low impact development—A review. Sci. Total Environ. 2017, 607, 413–432. [Google Scholar] [CrossRef]
  13. Ministry of Environment. Manual of Installation, Management and Operation of the Non-Point Pollutant Source Reduction Facility. 2014. Available online: https://t1.daumcdn.net/cfile/tistory/2221424D58D8445923.pdf (accessed on 1 April 2014).
  14. Lee, J.-M. Study on the Introduction Plan of Low Impact Development Technique in Pyeongtaek-Godeok New Town (Ⅱ). Land &Housing Institute, 2017. Available online: https://www.codil.or.kr/filebank/original/RK/OTKCRK170411/OTKCRK170411.pdf (accessed on 26 September 2016).
  15. Kim, M. LID Evaluation of the Stormwater Management Planning for LID Adoption-Case Studies of Apartment Complex in Jeonju City, South Korea. Master’s Thesis, Chonbuk National University, Jeonbuk, Republic of Korea, 2013. [Google Scholar]
  16. Perez-Pedini, C.; Limbrunner, J.F.; Vogel, R.M. Optimal location of infiltration-based best management practices for storm water management. J. Water Resour. Plan. Manag. 2005, 131, 441–448. [Google Scholar] [CrossRef]
  17. Joo, J.; Yoo, D.; Kim, J. Determination of design capacity for NPS pollutant treatment facilities by long-term simulation in urban areas. J. Korean Soc. Water Environ. 2011, 27, 841–847. [Google Scholar]
  18. James, R. Modelling LIDs Using PCSWMM and EPA SWMM5. 2012, pp. 69–131. Available online: https://www.pcswmm.com/Downloads/USEPASWMM (accessed on 22 July 2018).
  19. Shamsi, S. CSO reduction using green infrastructure. In Proceedings of the 13th Annual River Wet Weather Sewer Conference on Rivers Wet Weather Demonstration Program, Monroeville, PA, USA, 4–5 October 2011. [Google Scholar]
  20. Joo, J.G.; Lee, Y.H.; Cho, H.J.; Kim, J.H. Analysis of long-term runoff reduction effects by installation of street tree box. J. Korean Soc. Hazard Mitig. 2012, 12, 193–198. [Google Scholar] [CrossRef]
  21. Qin, H.-p.; Li, Z.-x.; Fu, G. The effects of low impact development on urban flooding under different rainfall characteristics. J. Environ. Manag. 2013, 129, 577–585. [Google Scholar] [CrossRef] [PubMed]
  22. Zahmatkesh, Z.; Burian, S.J.; Karamouz, M.; Tavakol-Davani, H.; Goharian, E. Low-impact development practices to mitigate climate change effects on urban stormwater runoff: Case study of New York City. J. Irrig. Drain. Eng. 2015, 141, 04014043. [Google Scholar] [CrossRef]
  23. Shafique, M.; Kim, R. Low impact development practices: a review of current research and recommendations for future directions. Ecol. Chem. Eng. S 2015, 22, 543–563. [Google Scholar] [CrossRef]
  24. Montalto, F.; Behr, C.; Alfredo, K.; Wolf, M.; Arye, M.; Walsh, M. Rapid assessment of the cost-effectiveness of low impact development for CSO control. Landsc. Urban Plan. 2007, 82, 117–131. [Google Scholar] [CrossRef]
  25. Pyke, C.; Warren, M.P.; Johnson, T.; LaGro Jr, J.; Scharfenberg, J.; Groth, P.; Freed, R.; Schroeer, W.; Main, E. Assessment of low impact development for managing stormwater with changing precipitation due to climate change. Landsc. Urban Plan. 2011, 103, 166–173. [Google Scholar] [CrossRef]
  26. Damodaram, C.; Zechman, E.M. Simulation-optimization approach to design low impact development for managing peak flow alterations in urbanizing watersheds. J. Water Resour. Plan. Manag. 2013, 139, 290–298. [Google Scholar] [CrossRef]
  27. Wadhwa, A.; Pavan Kumar, K. Selection of best stormwater management alternative based on storm control measures (SCM) efficiency indices. Water Policy 2020, 22, 702–715. [Google Scholar] [CrossRef]
  28. Yang, W.; Brüggemann, K.; Seguya, K.D.; Ahmed, E.; Kaeseberg, T.; Dai, H.; Hua, P.; Zhang, J.; Krebs, P. Measuring performance of low impact development practices for the surface runoff management. Environ. Sci. Ecotechnol. 2020, 1, 100010. [Google Scholar] [CrossRef] [PubMed]
  29. Rong, G.; Hu, L.; Wang, X.; Jiang, H.; Gan, D.; Li, S. Simulation and evaluation of low-impact development practices in university construction: A case study of Anhui University of Science and Technology. J. Clean. Prod. 2021, 294, 126232. [Google Scholar] [CrossRef]
  30. Zhu, Y.; Li, H.; Yang, B.; Zhang, X.; Mahmud, S.; Zhang, X.; Yu, B.; Zhu, Y. Permeable pavement design framework for urban stormwater management considering multiple criteria and uncertainty. J. Clean. Prod. 2021, 293, 126114. [Google Scholar] [CrossRef]
  31. Ciriminna, D.; Ferreri, G.B.; Noto, L.V.; Celauro, C. Numerical comparison of the hydrological response of different permeable pavements in urban area. Sustainability 2022, 14, 5704. [Google Scholar] [CrossRef]
  32. Su, J.; Li, J.; Gao, X.; Yao, Y.; Jiang, C. Comprehensive analysis of waterlogging control and carbon emission reduction for optimal LID layout: A case study in campus. Environ. Sci. Pollut. Res. 2022, 29, 87802–87816. [Google Scholar] [CrossRef]
  33. Zhao, L.; Zhang, T.; Li, J.; Zhang, L.; Feng, P. Numerical simulation study of urban hydrological effects under low impact development with a physical experimental basis. J. Hydrol. 2023, 618, 129191. [Google Scholar] [CrossRef]
  34. De Paola, F.; Giugni, M.; Pugliese, F.; Romano, P. Optimal design of LIDs in urban stormwater systems using a harmony-search decision support system. Water Resour. Manag. 2018, 32, 4933–4951. [Google Scholar] [CrossRef]
  35. Kong, F.; Ban, Y.; Yin, H.; James, P.; Dronova, I. Modeling stormwater management at the city district level in response to changes in land use and low impact development. Environ. Model. Softw. 2017, 95, 132–142. [Google Scholar] [CrossRef]
  36. Pons, V.; Abdalla, E.M.H.; Tscheikner-Gratl, F.; Alfredsen, K.; Sivertsen, E.; Bertrand-Krajewski, J.-L.; Muthanna, T.M. Practice makes the model: A critical review of stormwater green infrastructure modelling practice. Water Res. 2023, 236, 119958. [Google Scholar] [CrossRef]
  37. Huber, J. Low Impact Development. A Design Manual for Urban Areas; UACDC: Fayetteville, AK, USA, 2010. [Google Scholar]
  38. Tian, H. Evaluating Low Impact Development Performance on the Site in Grand Rapids; Michigan State University: East Lansing, MI, USA, 2016. [Google Scholar]
  39. Martin, P. Sustainable Urban Drainage Systems: Design Manual for England and Wales; Ciria: Peter Tavy, UK, 2000. [Google Scholar]
  40. Coffman, L.S.; Goo, R.; Frederick, R. Low-impact development: An innovative alternative approach to stormwater management. In WRPMD’99: Preparing for the 21st Century, Maryland, United States of America; ASCE: Reston, VA, USA, 1999; pp. 1–10. [Google Scholar]
  41. Ahmed, F.; James, W. The Needs of Stormwater Management Planning in Ontario: Is BMPPlanner a Useful Tool? J. Water Manag. Model. 1995. Available online: https://web.archive.org/web/20180721112435id_/https://www.chijournal.org/Content/Files/R183-03.pdf (accessed on 15 February 2015).
  42. County, P.G.S. Design Manual for Use of Bioretention in Stormwater Management; Prince George’s County (MD) Government Department of Environmental Protection; Watershed Protection Branch: Landover, MD, USA, 1993. [Google Scholar]
  43. Shaver, E. Low Impact Design Manual for the Auckland Region; Auckland Regional Council: Auckland, New Zealand, 2000. [Google Scholar]
  44. Barco, J.; Wong, K.M.; Stenstrom, M.K. Automatic calibration of the US EPA SWMM model for a large urban catchment. J. Hydraul. Eng. 2008, 134, 466–474. [Google Scholar] [CrossRef]
  45. Abi Aad, M.P.; Suidan, M.T.; Shuster, W.D. Modeling techniques of best management practices: Rain barrels and rain gardens using EPA SWMM-5. J. Hydrol. Eng. 2010, 15, 434–443. [Google Scholar] [CrossRef]
  46. Moriasi, D.N.; Arnold, J.G.; Van Liew, M.W.; Bingner, R.L.; Harmel, R.D.; Veith, T.L. Model evaluation guidelines for systematic quantification of accuracy in watershed simulations. Trans. ASABE 2007, 50, 885–900. [Google Scholar] [CrossRef]
  47. Korea Environment Corporation (KEC). A Pilot Project to Develop a Complex for Zeroising Storm Water Runoff in Ochang; Korea Environment Corporation, KEC: Sejong, Republic of Korea, 2014.
Figure 1. Study area.
Water 15 04198 g001
Figure 2. LID facility.
Water 15 04198 g002
Figure 3. Calibration results of the observed and the simulated runoff for rainfall events.
Water 15 04198 g003
Figure 4. A-I-R curve of tree filter box. (a) Relationship between area ratio and reduction rate. (b) Relationship between rainfall intensity and reduction rate.
Water 15 04198 g004
Figure 5. A-I-R curve of garden plant pot. (a) Relationship between area ratio and reduction rate. (b) Relationship between rainfall intensity and reduction rate.
Water 15 04198 g005
Figure 6. A-I-R curve of infiltration ditch. (a) Relationship between area ratio and reduction rate. (b) Relationship between rainfall intensity and reduction rate.
Water 15 04198 g006
Figure 7. A-I-R curve of rain barrel. (a) Relationship between area ratio and reduction rate. (b) Relationship between rainfall intensity and reduction rate.
Water 15 04198 g007
Table 1. LID facility of each technical content.
TypeLID FacilitySurfaceSoilStoragePavement
(a)Bio-Retention CellOOO-
(b)Rain GardenOO--
(c)Green RoofOO--
(d)Infiltration TrenchO-O-
(e)Permeable PavementOOOO
(f)Rain Barrel--O-
(g)Rooftop DisconnectionO---
(h)Vegetative SwaleO---
Table 2. Specifications of LID facility.
ZoneElement of LID TechniqueLID Facility Catchment Area (m2)LID Facility Surface Area (m2)Count
AWatershed Area180,003--
Facility Area46,984182
Tree Filter Box22,777947
Garden Plant Pot24,207886
Infiltration Ditch---
Rain Barrel---
BWatershed Area231,180--
Facility Area94,704253-
Tree Filter Box62,7337010
Garden Plant Pot23,418464
Infiltration Ditch84741362
Rain Barrel7912
Table 3. Characteristics of rainfall events.
Rainfall Events
(dd/mm/yyyy)
Number of Antecedent Days with no Rain (Day)Total Rainfall
(mm)
Duration
(Hour)
Mean Intensity
(mm/h)
12 July 201539.2170.5
29 July 201548.342.1
25 August 2015224.1181.3
1 October 20151834.1181.9
27 October 20151527.783.5
Table 4. Parameter characteristics by watershed area.
ZoneImpervious
(%)
Slope
(%)
Width of Overland Flow Path (m)Manning
(n)
A81.532.8920–500.013
B86.612.71500.013
Table 5. Error indices to verify the calibration results.
Error IndicesAB
Correlation Coefficient (CC)0.800.84
Nash–Sutcliffe Efficiency Coefficient (NSE)0.640.43
Bias(B)0.960.74
Percent Bias (PBIAS)−4.40−35.6
RMSE-observations Standard Deviation Ratio (RSR)0.600.75
Root-mean-square Error (RMSE)0.030.04
R-squared0.650.71
Table 6. Analysis conditions for area ratio (A) and rainfall intensity (I).
ParameterCaseTotal
Area ratio
(%)
0.1%0.2%0.3%0.4%0.5%0.6%0.7%0.8%0.9%1.0%19 case
2.0%3.0%4.0%5.0%6.0%7.0%8.0%9.0%10.0%-
Rainfall intensity
(mm/h)
5 mm/h10 mm/h20 mm/h30 mm/h40 mm/h50 mm/h11 case
60 mm/h70 mm/h80 mm/h90 mm/h100 mm/h-
Disclaimer/Publisher’s Note: The statements, opinions and data contained in all publications are solely those of the individual author(s) and contributor(s) and not of MDPI and/or the editor(s). MDPI and/or the editor(s) disclaim responsibility for any injury to people or property resulting from any ideas, methods, instructions or products referred to in the content.

