1. Introduction
Basins are key geomorphological and hydrological units that evolve through the dynamic interplay of geological, climatic, and hydrological processes [
1]. A basin is a vital component of a catchment area, and all water flows within it are influenced by its diverse characteristics [
2]. A geographic information system (GIS) and remote sensing (RS) are highly efficient tools for analyzing hydrological processes in drainage basins [
3]. Consequently, these tools are employed for various purposes in understanding the hydrology of different basins. Morphological analysis of basins is crucial for several aspects, including the assessment and management of groundwater and surface water resources [
4,
5].
In general, the basic geographical factors that characterize a basin include various elements such as basin area, channel length, and channel slope. Along with these factors, the parameters representing the morphological characteristics of the basin are varied, including shape coefficient, shape factor, branching ratio, and length ratio. The geomorphological characteristics of these basins are closely linked with hydrological processes and cycles, making their understanding crucial for water resource-related concerns. This encompasses a variety of applications such as selecting suitable sites for soil and water management systems, preparatory work, identifying erosion-prone areas, flood analysis, and the development of various water infrastructures. Hydrologically, water carries with it various elements like sediments, nutrients, and pollutants [
6], impacting ecosystems both within and outside the basin. Investigating these properties is key to understanding water movement within the hydrological cycle. Additionally, these morphological parameters are vital in addressing hydrological issues and promoting sustainable water use in drainage basins [
7,
8,
9].
Research on morphological factors has been ongoing for a long time. Horton was one of the pioneering scholars who applied morphological measurement techniques first [
10]. Following him, some geomorphologists introduced and actively used the morphological characteristics of drainage basins [
11,
12,
13,
14]. In the late 1970s, the development of a relatively precise digital elevation model (DEM) provided new insights in the field of basin geomorphology [
15]. Since then, various studies have been conducted using this approach. For instance, Hajam et al. [
16] utilized geospatial information technology to analyze the morphological characteristics of southeastern Kashmir in terms of linearity, area, and relief. Aher and Sharma [
17] examined the morphological characteristics of basins for the development, management, and utilization of land and water resources. Subsequently, Moges and Bhole [
18] performed a quantitative analysis of the morphological parameters of the Goro River in linear and area aspects. Tribhuvan and Sonar [
19] analyzed the basin characteristics of the Phulambri region through RS GIS-based morphological analysis. Bogale [
4] analyzed the characteristics of the Blue Nile Basin in Ethiopia by calculating various morphological factors.
In Korea, there have been a few studies conducted on the relevant topics. Representatively, Lee et al. [
20] obtained morphological characteristics such as linearity and area for 19 rivers in the Han River basin in Korea and conducted multiple regression analysis with runoff rates. Some research has also been carried out on soil erosion and landform formation. For example, Nam et al. [
21] identified the relative importance of rainfall characteristics, soil slope, and geological features on soil erosion. Meanwhile, Kang [
22] examined the impact of Korea’s climate and vegetation on landform formation.
Rainfall patterns can significantly influence the geomorphology of a basin. Firstly, they can affect erosion and sediment movement [
23,
24]. Extended periods of heavy rainfall can increase the erosion of soil particles and sediments within basins. The erosive power of rainfall can alter the landscape by eroding topsoil and carrying it downstream. Over time, this erosion can reshape waterway networks, form new rivers, and alter overall drainage patterns. Additionally, rainfall is crucial in the formation of rivers within a basin. In other words, when the characteristics of the basin are relatively uniform, the impact of precipitation becomes significantly influential. However, research examining both the morphological and precipitation characteristics of basins remains limited.
Probability precipitation is a reliable indicator that can represent precipitation characteristics. This is because probability precipitation is derived from long-term historical observation data, which could be closely related to the development of river networks. In this study, a morphological analysis was conducted using GIS for major dam basins in Korea. We obtained long-term RS-based precipitation data and investigated their relationships. Ultimately, the average and the standard deviation (i.e., variation within the basin) of the probability precipitation were derived, and the correlation between them and topographic morphological factors was examined.
2. Methods
2.1. Overview
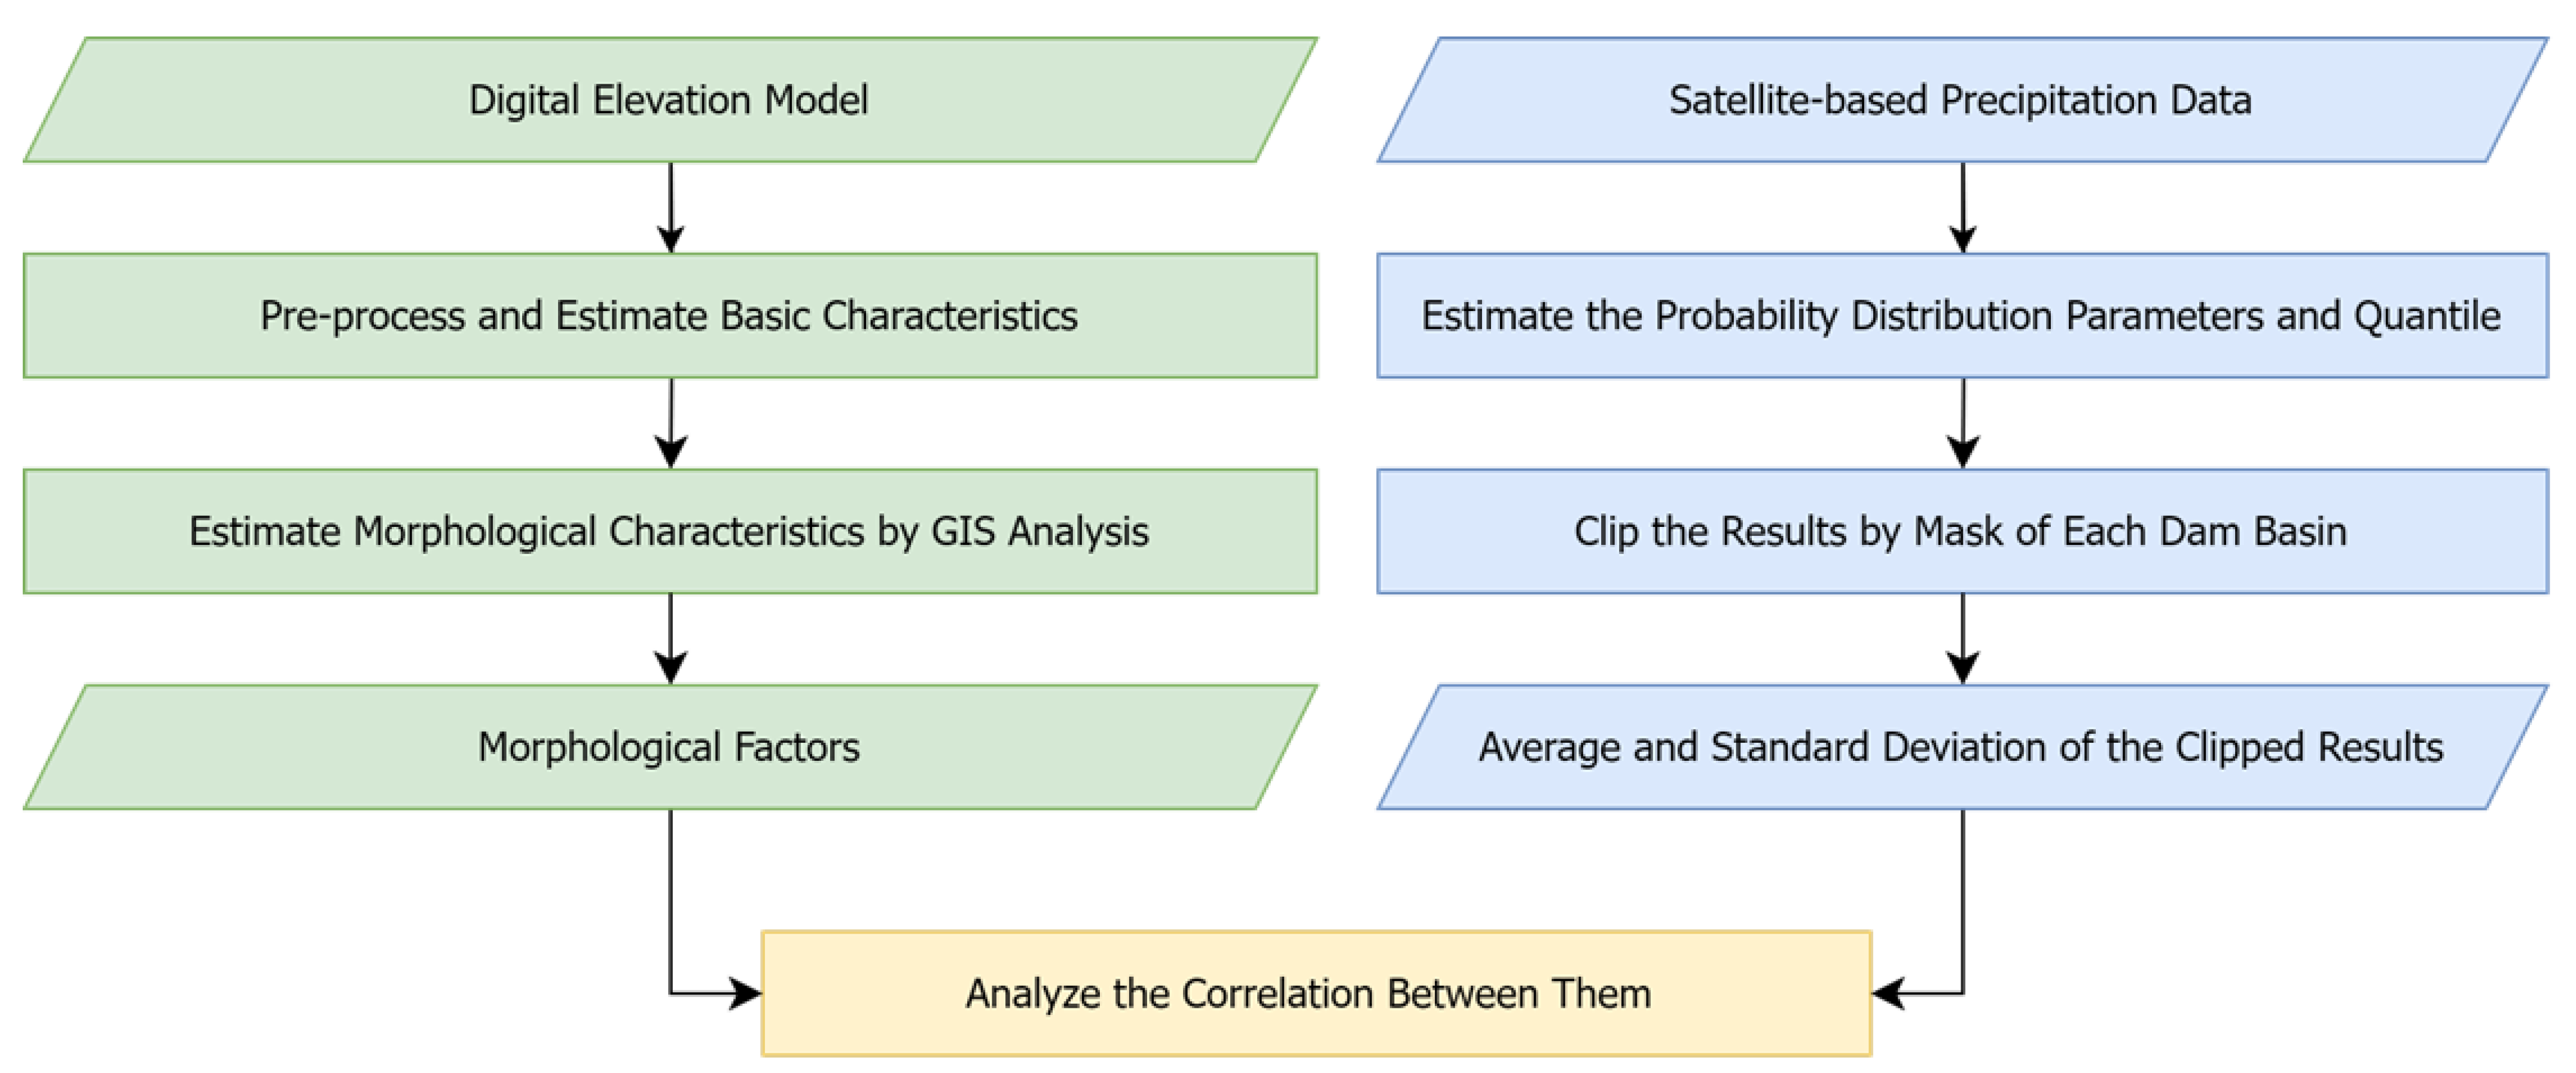
Figure 1 presents an overview of this study. In the section displaying the topographic and morphological characteristics of the basin, shown in green, these characteristics are derived from the fundamental basin characteristics. Subsequently, in the section where the probability precipitation is calculated, depicted in blue, grid-like probability precipitation is computed. The data are then clipped using a mask file for each basin, and the average and standard deviation are subsequently obtained. Following this, a comparison of the correlation between the two results is conducted.
2.2. Morphological Characteristics
2.2.1. Shape Characteristics
The form factor (
) is calculated as the ratio of the area to the square of basin length, as shown in Equation (1). A small form factor is more likely to cause a sharp runoff response in the short term.
where the basin area is (
), which is the area (km
2) in the closed curve created by the basin.
refers to the basin length and represents the distance from the basin boundary (km) along the mainstream to the basin outlet.
The elongation ratio (
) is the ratio of the diameter of a circle having the same area as the basin area to the basin length, as follows. Similar to the form factor, the elongation ratio is smaller for thinner and longer basins.
where
is the diameter of a circle having the same area as the basin area, calculated as
. The elongation ratio approaches 1.0 as the shape of the basin becomes circular. This ratio typically ranges from 0.6 to 1.0, depending on the meteorological and geological conditions. Specifically, the value is close to 1.0 for regions with low relief and between 0.6 and 0.9 for regions with high relief.
The fineness ratio is the ratio of the stream length to the basin perimeter, as shown in Equation (3). The shape factor is the ratio of the length of the mainstream to the diameter of a circle having the same area as that of the basin (
), as shown in Equation (4). Unlike the previous two indices (
and
), the fineness ratio and shape factor are larger for thinner and longer basins.
where
represents the stream length, which is the distance (km) from the starting point of the mainstream to the basin outlet.
is the basin perimeter and it refers to the length (km) of the closed curve created by the basin.
The circularity ratio is the ratio of the basin area to the area of a circle with the same circumference as the basin perimeter.
where
represents the area of a circle having the same circumference as the basin perimeter and is calculated as
.
2.2.2. River Network Characteristics
Horton’s ratios, i.e., the bifurcation ratio, stream length ratio, and area ratio (Horton, 1945), were considered as the river network characteristics. The number of streams with the same order within a basin and the average length and area of streams for each order can be expressed as in Equations (6) and (7).
where
denotes the stream order,
is the number of
-order streams, and
is the highest order of the streams.
is the length of the
-th stream of
-order streams, and
is the average length of
-order streams.
is the area of the
-th stream in
-order streams, and
is the average area of
-order streams.
The bifurcation ratio (
), length ratio (
), and area ratio (
) can be expressed as
In natural basins, the bifurcation ratio, length ratio, and area ratio exhibit the following ranges: 3.0–5.0, 1.5–3.5, and 3.0–6.0, respectively. Although the theoretical minimum value of the bifurcation ratio is 2.0, it is rarely observed in natural river basins. In addition, if basins have uniform structural characteristics, they exhibit geometrical similarities, and thus, the bifurcation ratio does not vary significantly across basins.
2.3. Estimation of Probability Precipitation Quantiles
The choice of probability distribution in precipitation frequency analysis is crucial. The Generalized Extreme Value (GEV) distribution has been extensively used for annual maximum series (AMS) analysis globally [
25,
26,
27]. GEV distribution has three parameters (location, scale, and shape); the distribution with a shape parameter of 0 is defined as GEV-I (also called the Gumbel distribution). In Korea, an improvement and supplementary study on probability precipitation [
28] also identified the Gumbel distribution as the appropriate probability distribution for all observatories under the Korea Meteorological Administration. Furthermore, in the Standard Guidelines for Flood Estimation [
29], it was formalized to consider the Gumbel distribution in precipitation frequency analysis. Therefore, in this study, precipitation frequency analysis was conducted using the Gumbel distribution.
The probability density function and cumulative distribution function of the Gumbel distribution are the same as Equations (11) and (12).
where
represents the probability precipitation (mm) for a specific duration,
is a location parameter that indicates the point of maximum probability occurrence, and
is a scale parameter. Both
and
are expressed in the same units as
.
Meanwhile, the World Meteorological Organization (WMO) suggests that among the methods for parameter estimation, the probability weighted moment (PWM) is suitable for hydrological frequency analysis. Specifically, it has been reported that there is stability in the interpretation of data series that lack long records, as is often the case in Korea [
30]. Additionally, PWM is recommended in Korea [
29,
31]. Similar to the moment method, PWM estimates parameters by assuming that the probability weighted moments of the population and the sample data are equivalent. Unlike the moment method or the maximum likelihood method, which do not account for the size of the data, PWM arranges the data in ascending order and estimates parameters by giving maximum weight to the largest data and minimum weight to the smallest. Parameter estimation using PWM is less biased than the simple moment method and is more accurate than the maximum likelihood method when the sample size is small. In particular, it has recently become one of the most popular methods, as it can yield relatively stable results even with small sample sizes or skewed data.
The general formula for the probability weighted moment is as follows [
32].
where,
,
, and
are positive integers.
is a random variable,
represents the expectation,
is the cumulative probability or non-exceedance probability, and
denotes the excess probability. If
and
are set to 0 in the equation, then
, which corresponds to the
th moment of the origin in the moment method. In most hydrological data,
is 1, and when using non-exceedance probability,
is set to 0 and
is considered as a positive integer. Therefore, the population’s PWM can be calculated using the equation as follows.
where
is PWM, and
refers to the moment order.
The zeroth and first moments according to the
are provided in Equations (15) and (16).
where
and
represent the 0th and 1st PWM of the sample, respectively.
denotes the number of sample data, and
refers to the
th data sorted in ascending order.
The parameters using the PWM method are calculated with
and
from Equations (17) and (18) [
32,
33].
where
and
represent the probability weighted moments, while
and
are the first and second L-moments, respectively.
stands for Euler’s number, which is approximately 0.5772157. Through this process, the parameters of the Gumbel distribution, derived using the PWM method, are directly employed in the estimation of probability precipitation.
3. Study Area and Data
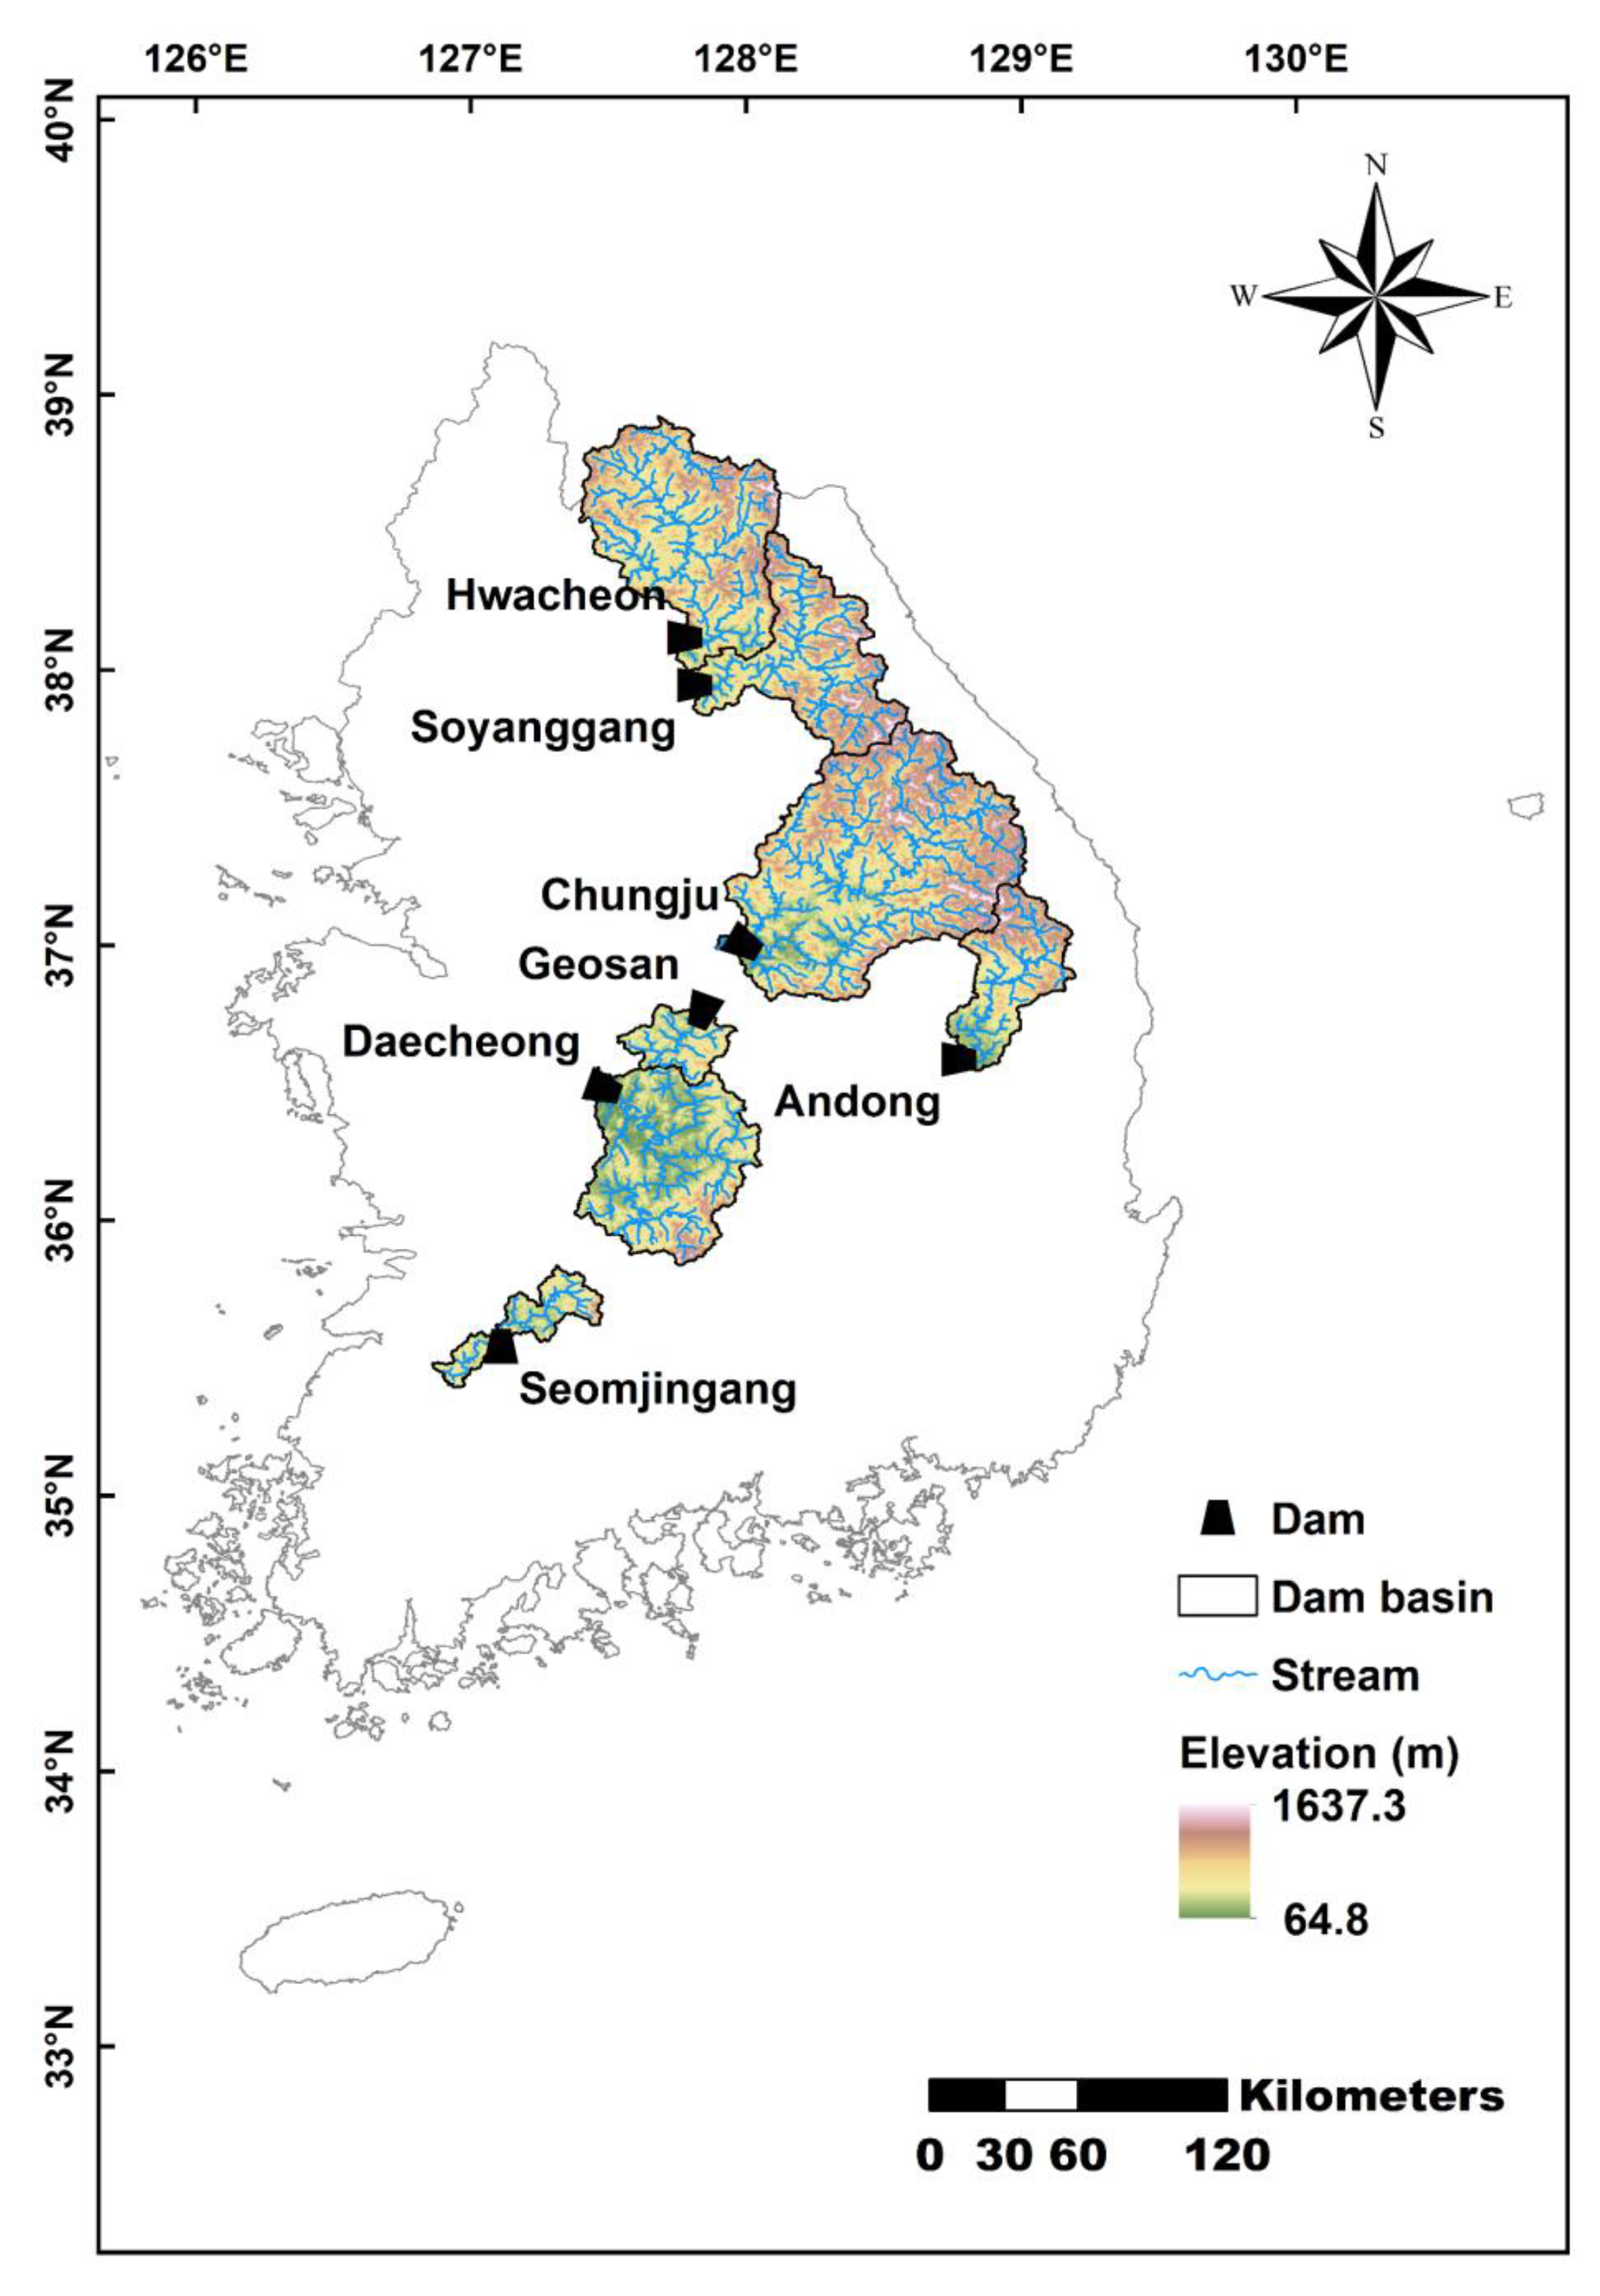
3.1. Basins and Basic Characteristics
This study focused on seven domestic dam basins. For the GIS analysis, we utilized a DEM with a resolution of 90 m, provided by the National Geographic Information Service in Korea. The data is available for download from the public data portal at “
https://www.data.go.kr/data/15059920/fileData.do (accessed on 13 February 2023)”.
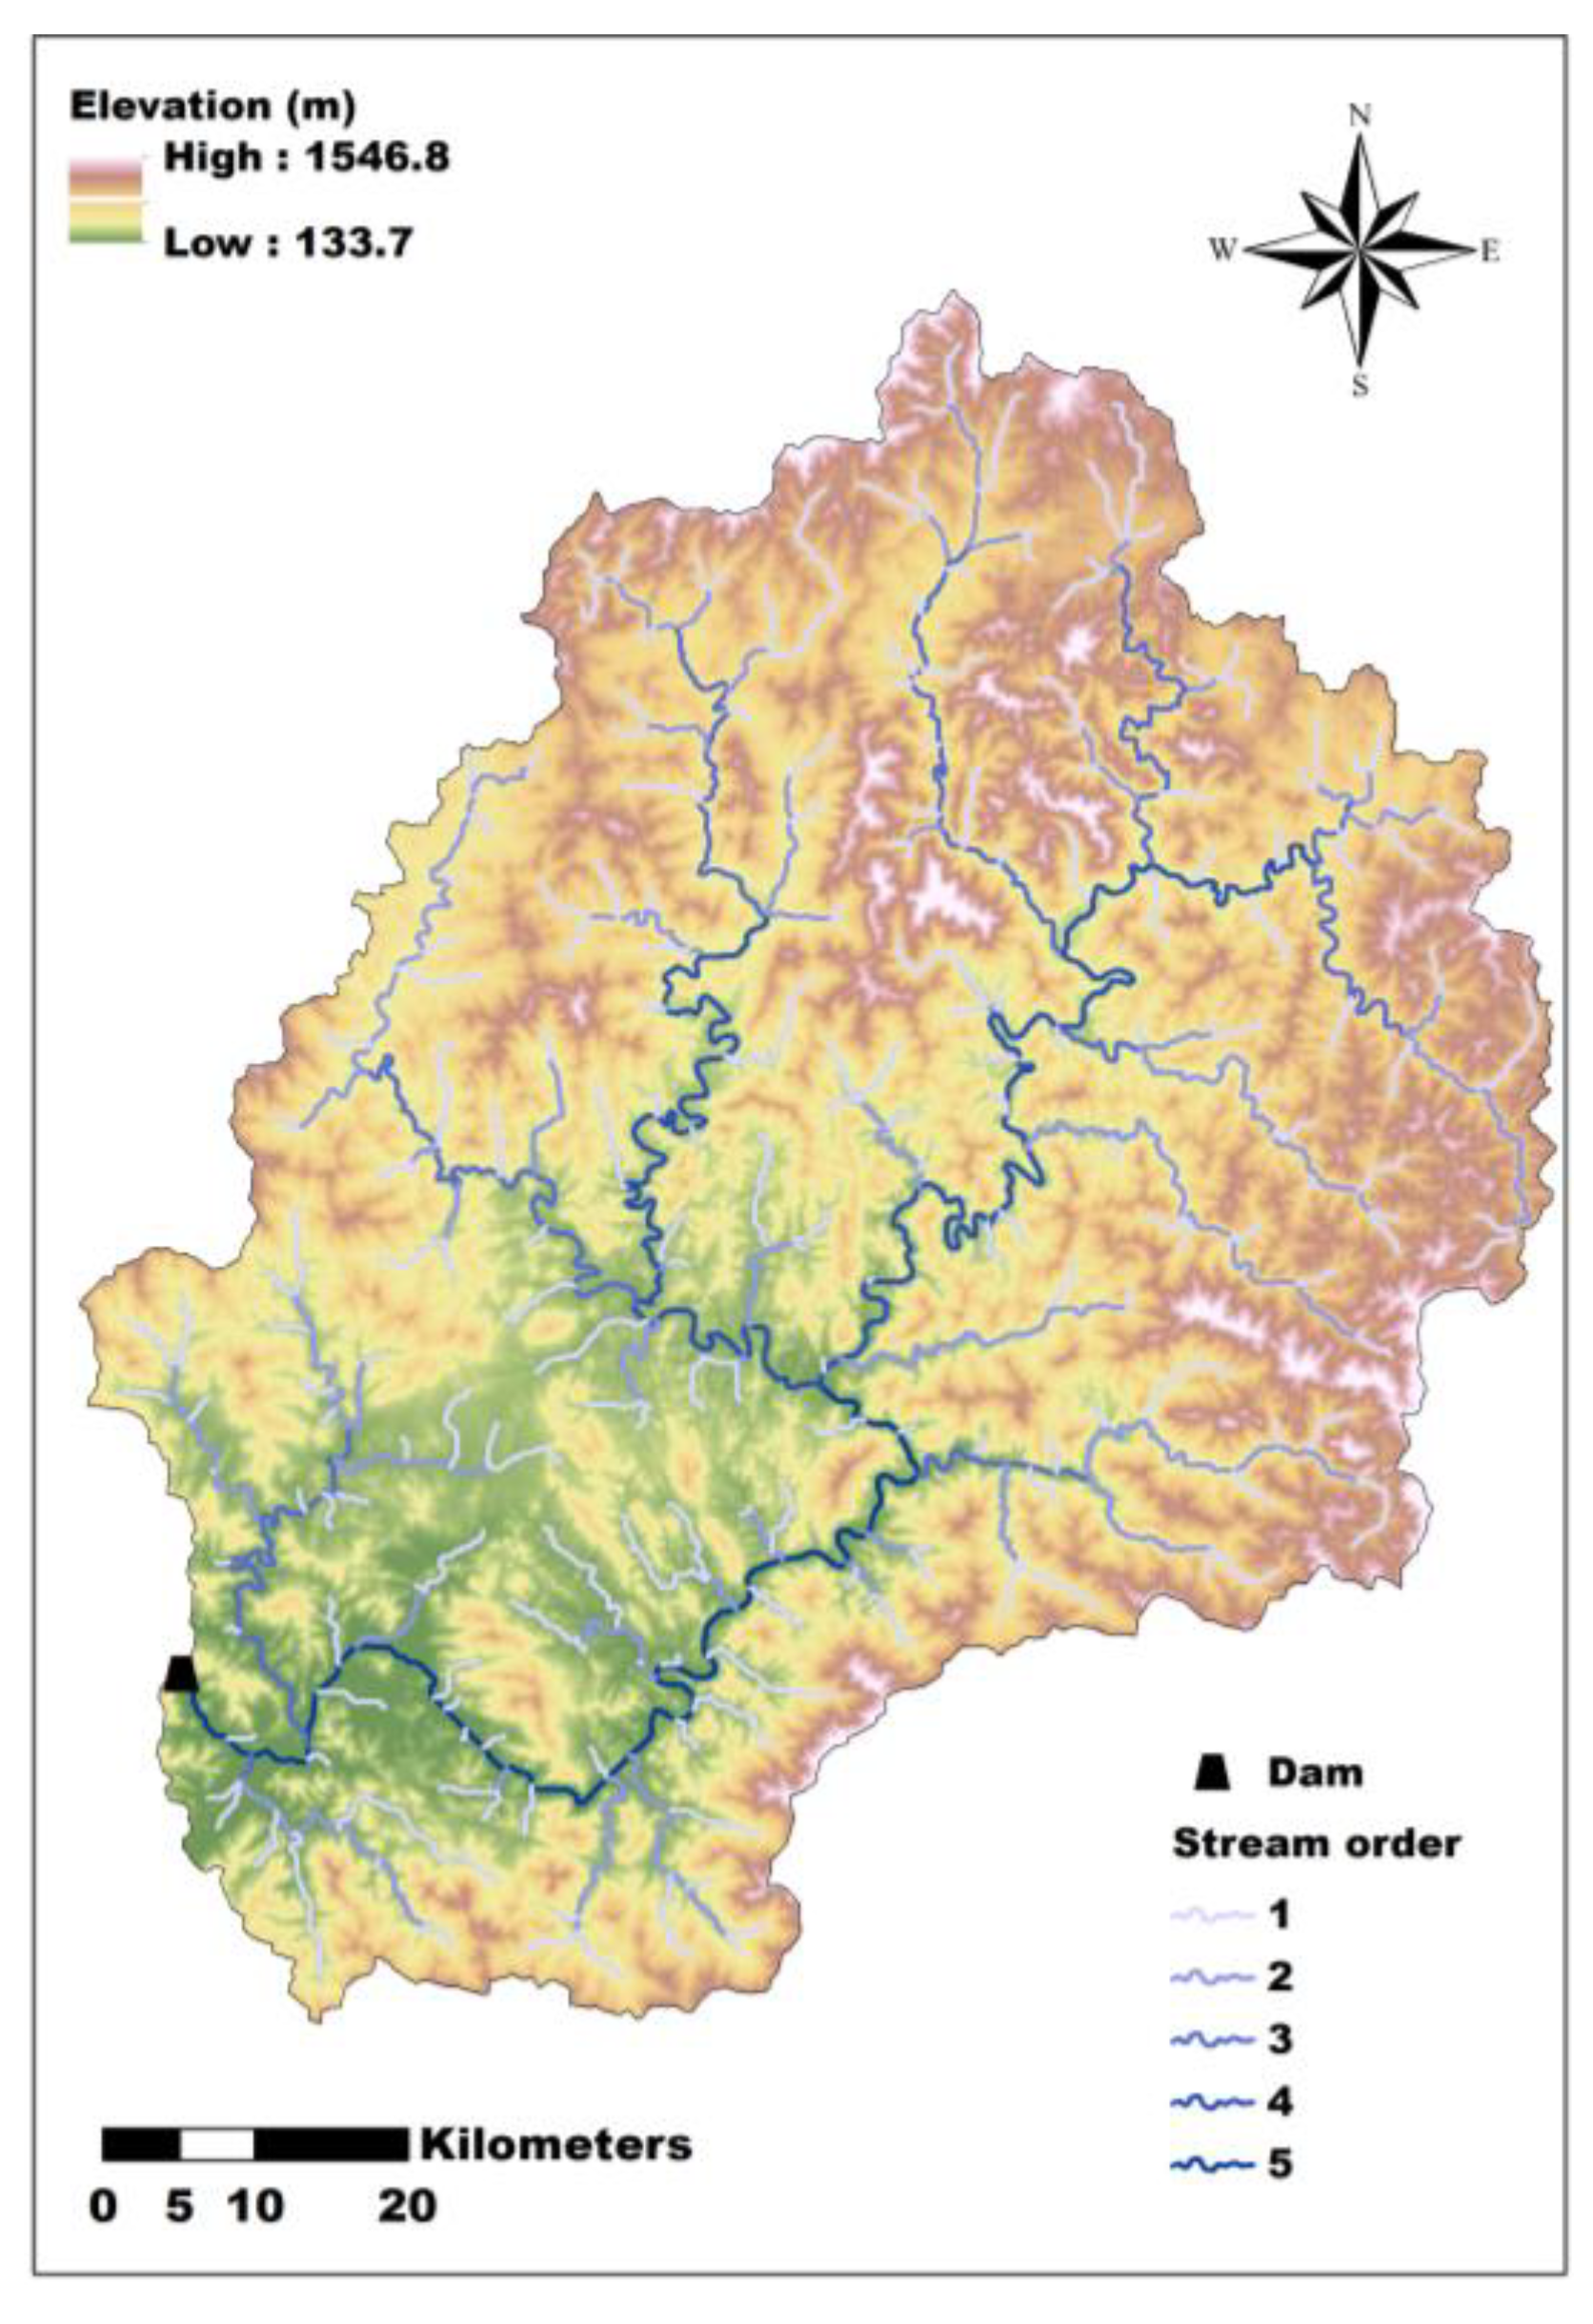
Figure 2 displays the considered basin, river network, DEM, and the dam’s location. The area of the basins ranges from a minimum of 671 km
2 to a maximum of 23,800 km
2. Additionally, due to the location of the Taebaek Mountain Range to the east, some basins are relatively elevated.
Table 1 summarizes the basic information about the study dam basins. In the table, the basin area (
) is the area (km
2) in the closed curve created by the basin, and it directly influences the outflow hydrograph [
16]. The stream length (
) represents the distance (km) from the starting point of the mainstream to the basin outlet. The basin perimeter (
) refers to the length (km) of the closed curve created by the basin. The basin slope (
) refers to the average slope of the basin and is calculated by averaging the slopes of all grids in the basin. The channel slope (
) is defined as the slope between the starting point of the mainstream and the end point, which is the outlet of the basin.
3.2. Precipitation Data
Satellite-based global reanalysis precipitation data are available in various forms, depending on the type of satellite or algorithm used to produce the data. These data cover different regions and periods, with varying spatial and temporal resolutions. Spatial resolution ranges from a minimum of 0.04° to a maximum of 2.5°, and temporal resolution varies from 1 h to 1 month. Considering the size of the study basins, the highest possible spatial resolution is required. For temporal resolution, a minimum resolution of 1 h seems necessary, but there is a limitation in acquiring reanalysis data before the year 2000. Therefore, selecting appropriate reanalysis precipitation data requires considering these factors in combination, depending on the purpose of the analysis.
In this study, for the purpose of estimating probability precipitation, Precipitation Estimation from Remotely Sensed Information using Artificial Neural Networks–Cloud Classification System–Climate Data Record (PERSIANN-CCS-CDR), which covers a sufficient period and offers dense spatial resolution, was selected for analysis. PERSIANN-CCS-CDR data divide the region from 60° S to 60° N in latitude and from 180° W to 180° E in longitude, with a spatial resolution of 0.04°, and has recorded precipitation every 3 h since 1 January 1983. This dataset improves the precipitation estimation algorithm of PERSIANN data by using existing geostationary satellite infrared brightness temperature images, considering cloud characteristics, and correcting bias with ground rain gauges. Specifically, PERSIANN-CCS-CDR data are known to have relatively better accuracy for extreme rainfall events than other datasets [
34].
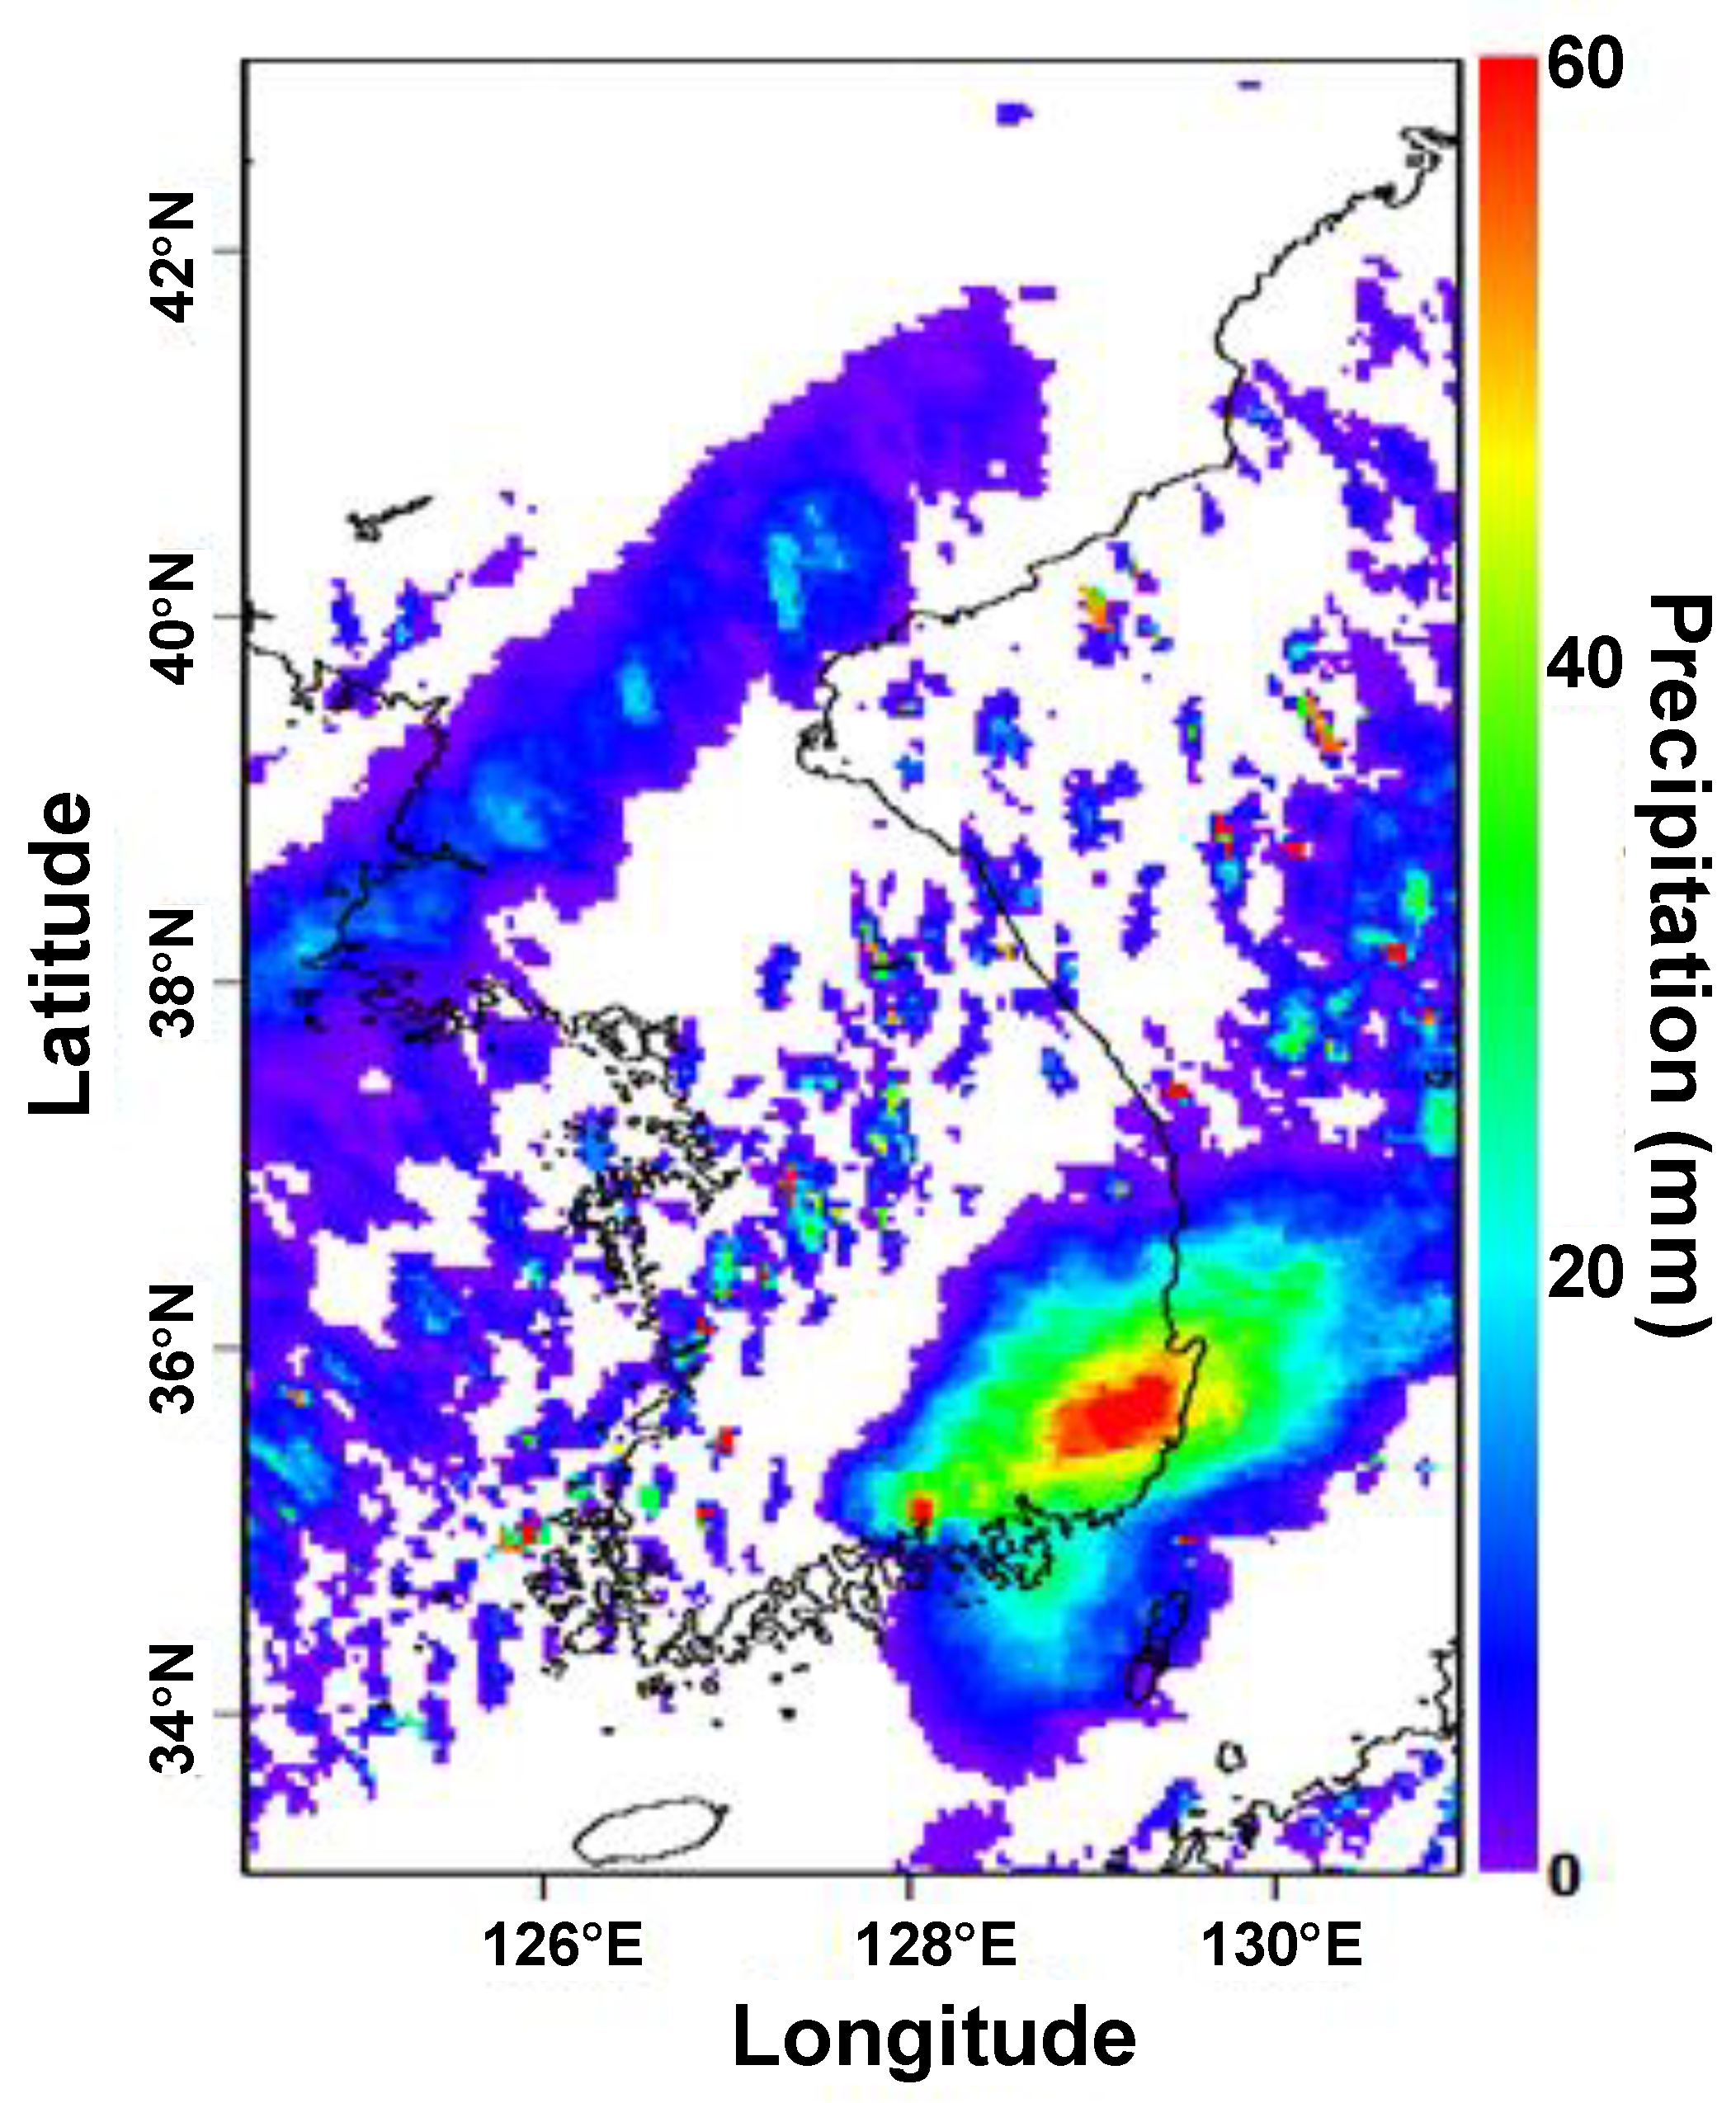
In this study, the entire region of the Korean Peninsula, corresponding to the latitude of 33.20° N to 43.00° N and the longitude of 124.36° E to 130.92° E, was initially analyzed.
Figure 3 shows an example of PERSIANN-CCS-CDR observation data corresponding to 03:00 on 18 August 2014. The PERSIANN-CCS-CDR observation data have a time resolution of 3 h. Therefore, the precipitation data depicted in
Figure 3 refer to the cumulative precipitation (mm) from 00:00 to 03:00.
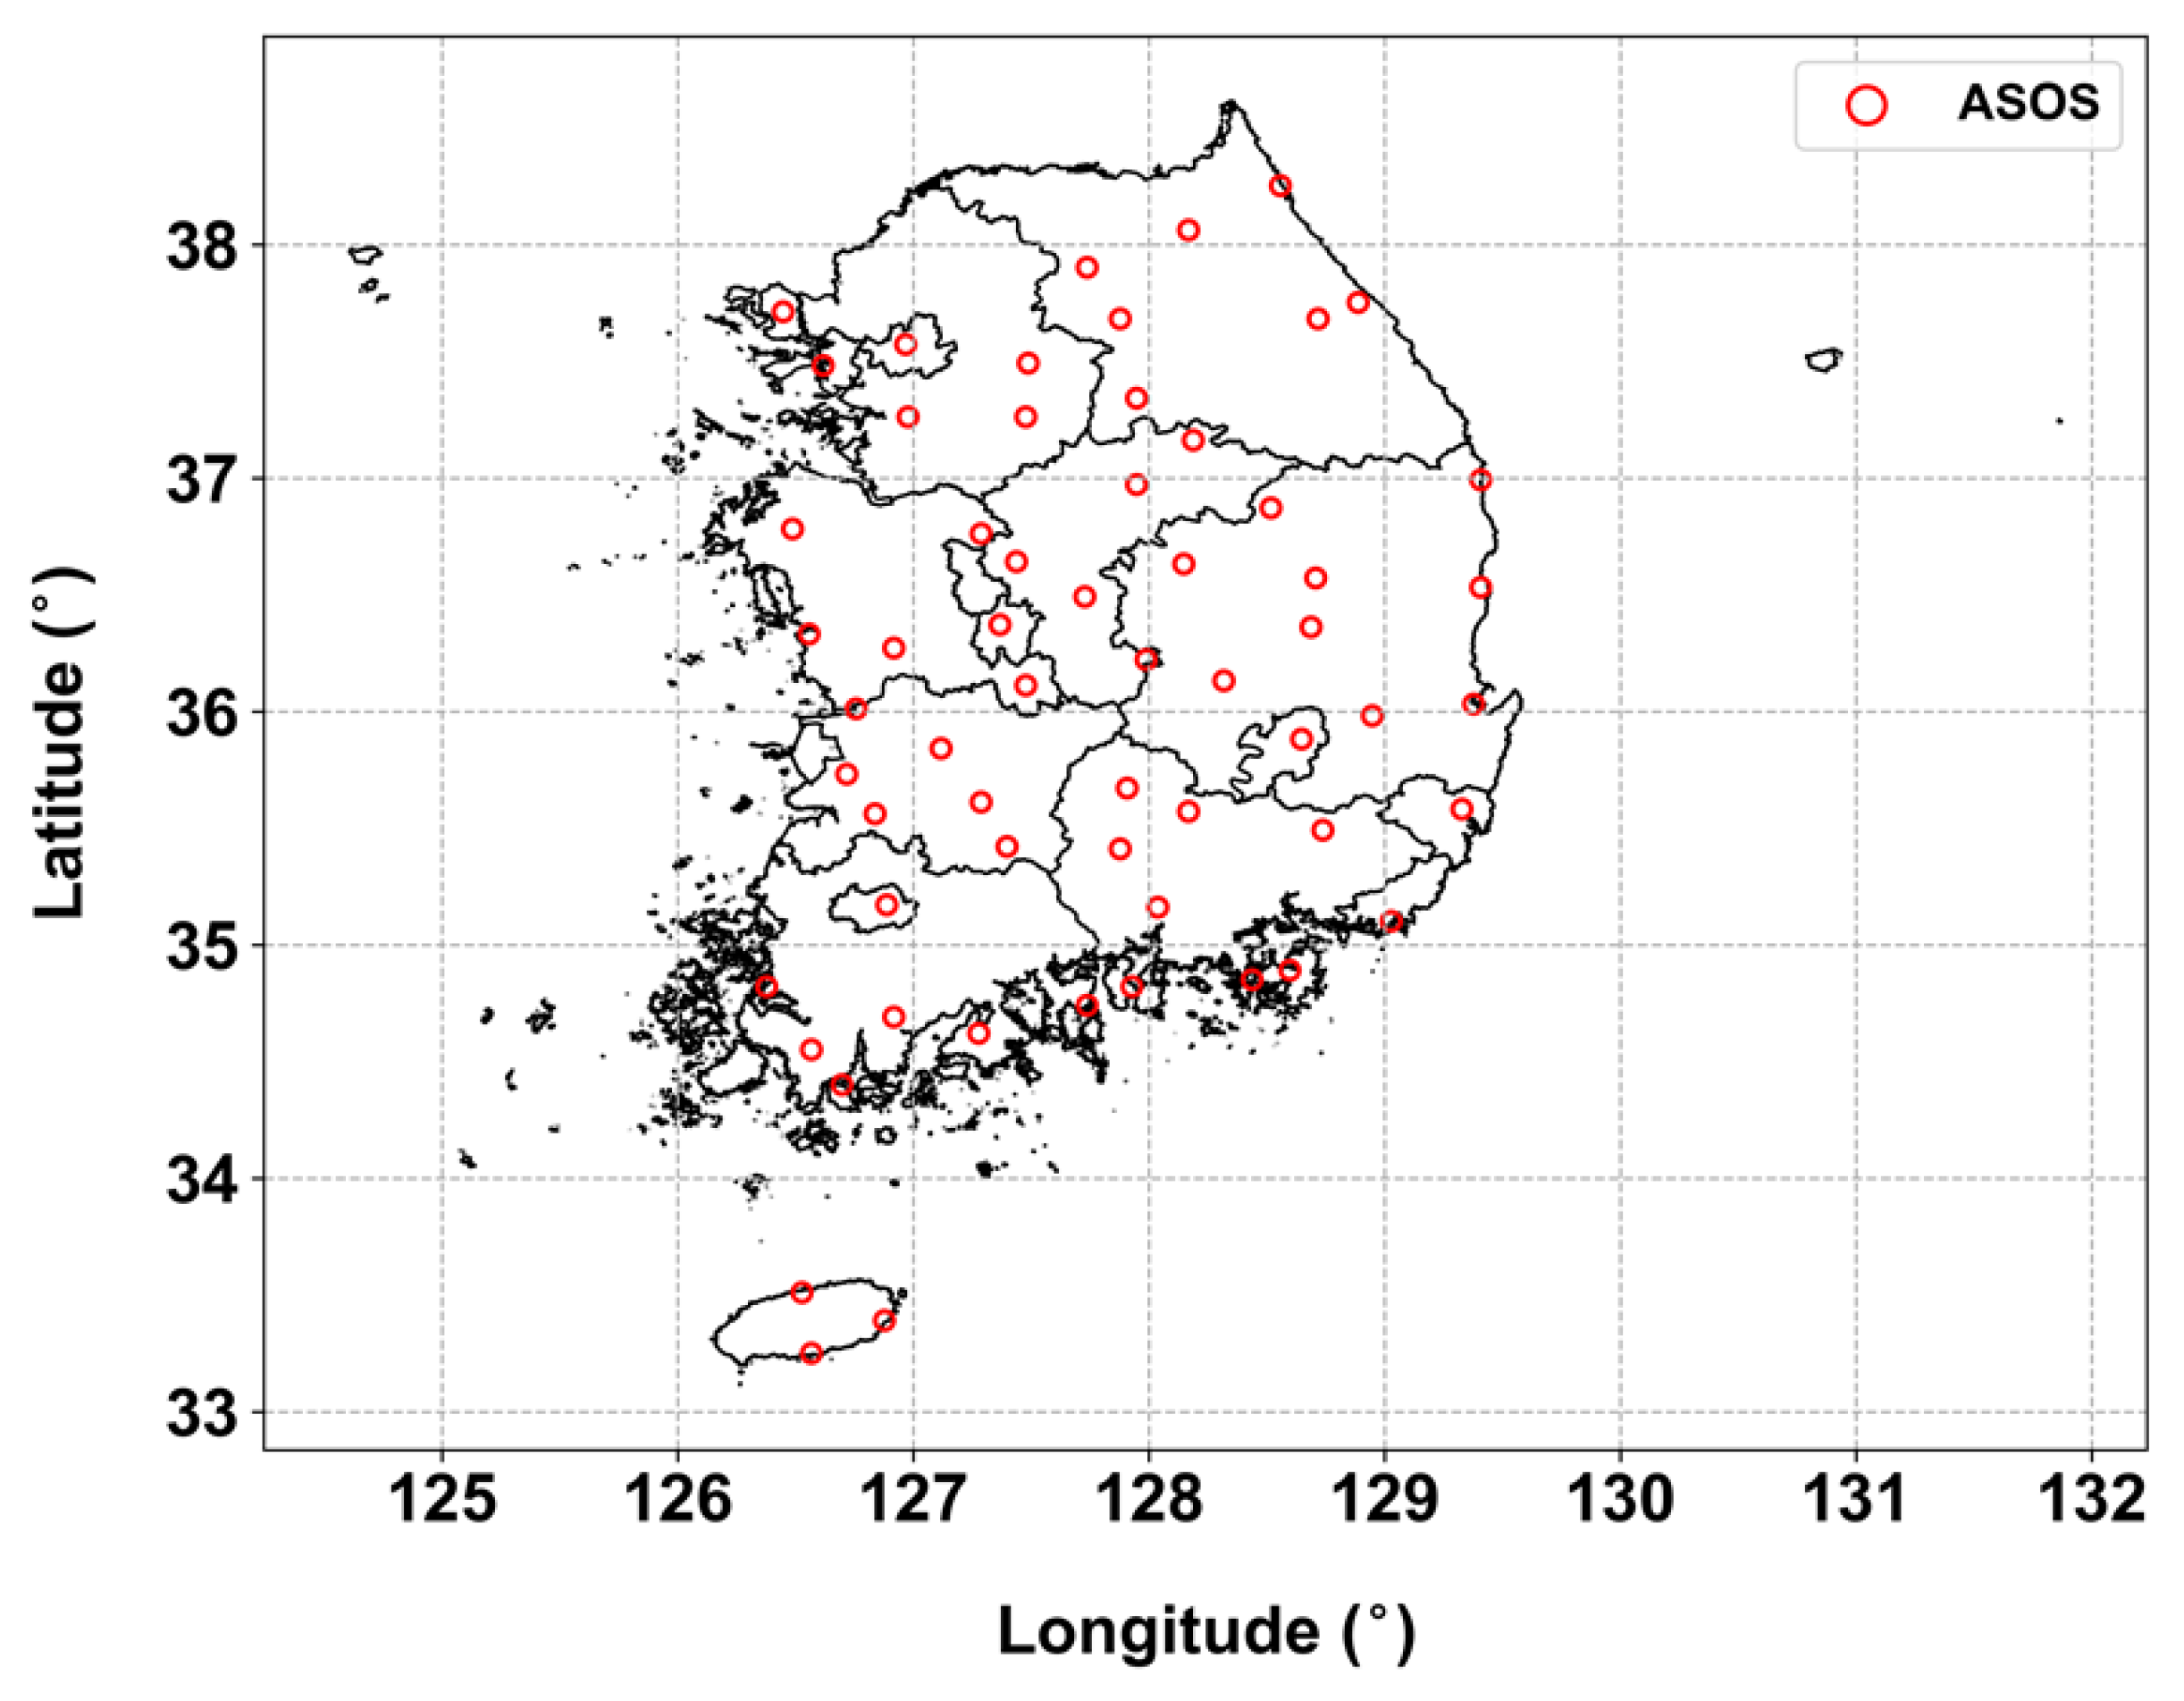
In this study, to examine the uncertainty of the reanalyzed data, PERSIANN-CCS-CDR, we utilized ground data from the Automated Synoptic Observing System (ASOS) in South Korea. Among all stations, we selected 60 stations based on the availability of data for the same period of 38 years (1983–2020).
Figure 4 illustrates the locations of all 60 selected stations considered in this study.
4. Results
4.1. Morphological Characteristics
A pilot basin, i.e., the Chungju Dam basin, was selected to illustrate the process of estimating the morphological characteristics. In general, to calculate the morphological characteristics, the DEM of the basin is required to extract the river network. To determine the river network, the source area (area in which the river is formed) must be identified. In this study, the source area of the river was set as 1000 grids, that is, 8.1 km
2. The Horton–Strahler method [
35,
36] was used to determine stream order.
Figure 5 shows the DEM and extracted river network in the Chungju Dam basin. The slope of the basin tends to be steeper in the upstream parts and gentler in the downstream areas. Steep terrains often give rise to many short streams. In contrast, flatter parts of the basin tend to have longer streams, but they are fewer in number.
The factors related to the shape were determined considering the basic characteristics. The form factor was calculated to be 0.088 by extending the basin area and stream length. The elongation ratio was calculated by dividing the diameter () of a circle having the same area as the basin area by the basin length (). was calculated as , i.e., 92.0 km. The elongation ratio was calculated to be 0.334. The fineness ratio was calculated to be 0.553, by dividing the stream length by the basin perimeter. The shape factor was calculated to be 2.742 by dividing the stream length by . The circularity ratio was calculated to be 0.348 by dividing the basin area by the basin perimeter.
To calculate the drainage characteristics, it was necessary to determine the number and length of streams. Although there are various methods for classifying the order of rivers, in this study, river order was analyzed using Strahler’s method, a slightly modified version of Horton’s method, commonly known as the Horton–Strahler method [
35,
36]. A first-order river is defined as one that does not branch. When two first-order rivers merge, they form a second-order river, and when rivers of different orders merge, the resulting river is classified at the highest order of the merging rivers.
Table 2 shows the total number and length of streams according to stream order. For example, the Chungju Dam basin has a total of five orders of rivers. A total of 299 rivers were identified in this basin, with 232 rivers classified as first-order, 53 as second-order, 11 as third-order, 2 as fourth-order, and 1 as fifth-order.
To calculate the river network, the average length and area for each order was required to be determined. Information related to these entities can be found in
Table 2. Horton’s ratios were obtained by the regression analysis of the relationship between the number and length of each order, area, and stream order. The bifurcation, length, and area ratios were calculated to be 4.125, 2.554, and 4.648, respectively. The characteristics of streams in the basin were in line with Horton’s law of stream length, which posits that cumulative stream length tends to form a geometric series beginning with the average length of a first-order segment and increasing at a constant ratio of lengths [
37]. The bifurcation ratios range from 2 in flat and hilly areas to 4 or 5 in mountainous terrains or highly incised drainage basins.
Table 3 summarizes the morphological factors calculated for all basins using the same process. Most of the study basins exhibit a broad, nearly radial shape. Additionally, they generally have a high branching rate. This is thought to be due to the fact that most of the basins encompass mountainous areas. Therefore, overall, these areas can be considered as potentially vulnerable to flooding.
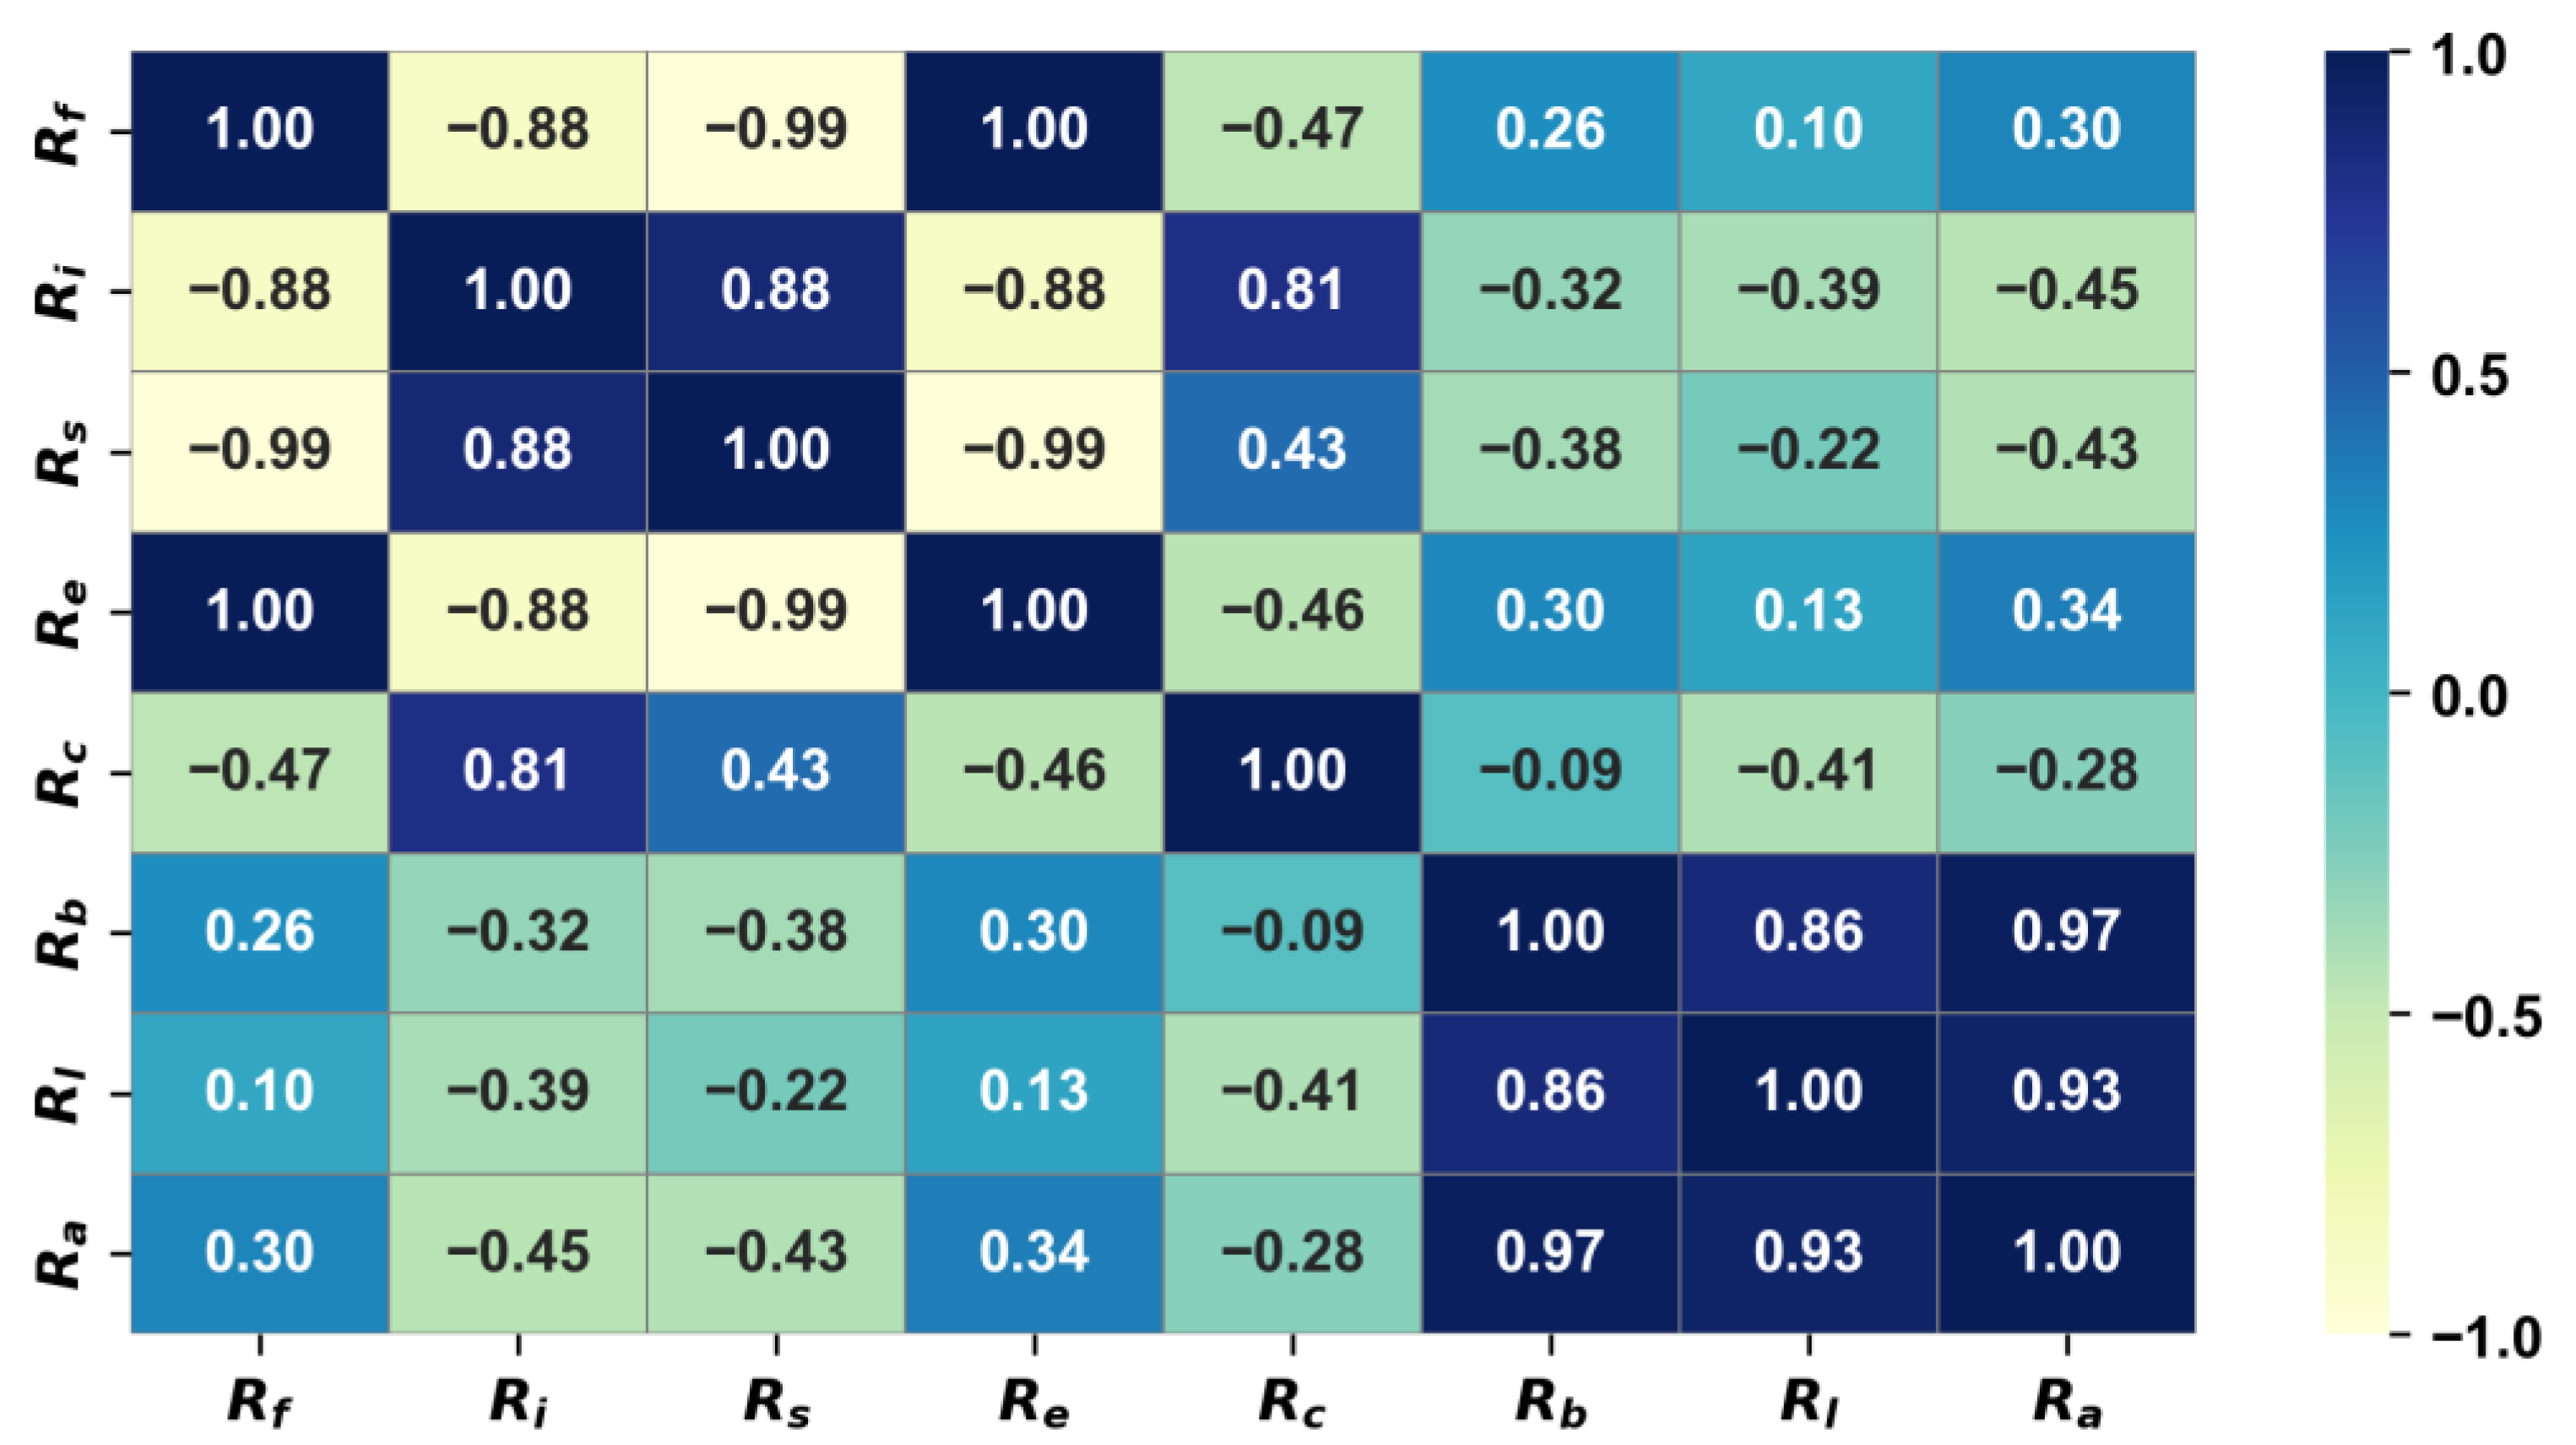
Figure 6 displays the correlation coefficient between them. Indices related to the shape of the basin generally exhibit a very high correlation.
and
demonstrate a very large positive correlation, while the remaining
and
show a very large negative correlation with them. This means that the wider the basin, the larger the values of
and
, and conversely, the smaller the values of
and
. However, there is no significant correlation with
. A large positive correlation is also observed between indicators related to the river network of the basin, with
showing a negative correlation with these indicators. This indicates that the closer the basin is to a circular shape, the less developed the river network is.
4.2. Probability Precipitation Quantiles
For frequency analysis, it is essential to establish the annual maximum series (AMS), and then take into account a conversion factor to transition from fixed time to the scale of random time. In Korea, various studies have been conducted, and an appropriate time conversion factor has been proposed. In this study, the empirical equation provided in the standard guidelines for design flood estimation [
29] was employed. For more details, refer to the related study by Lee et al. [
38].
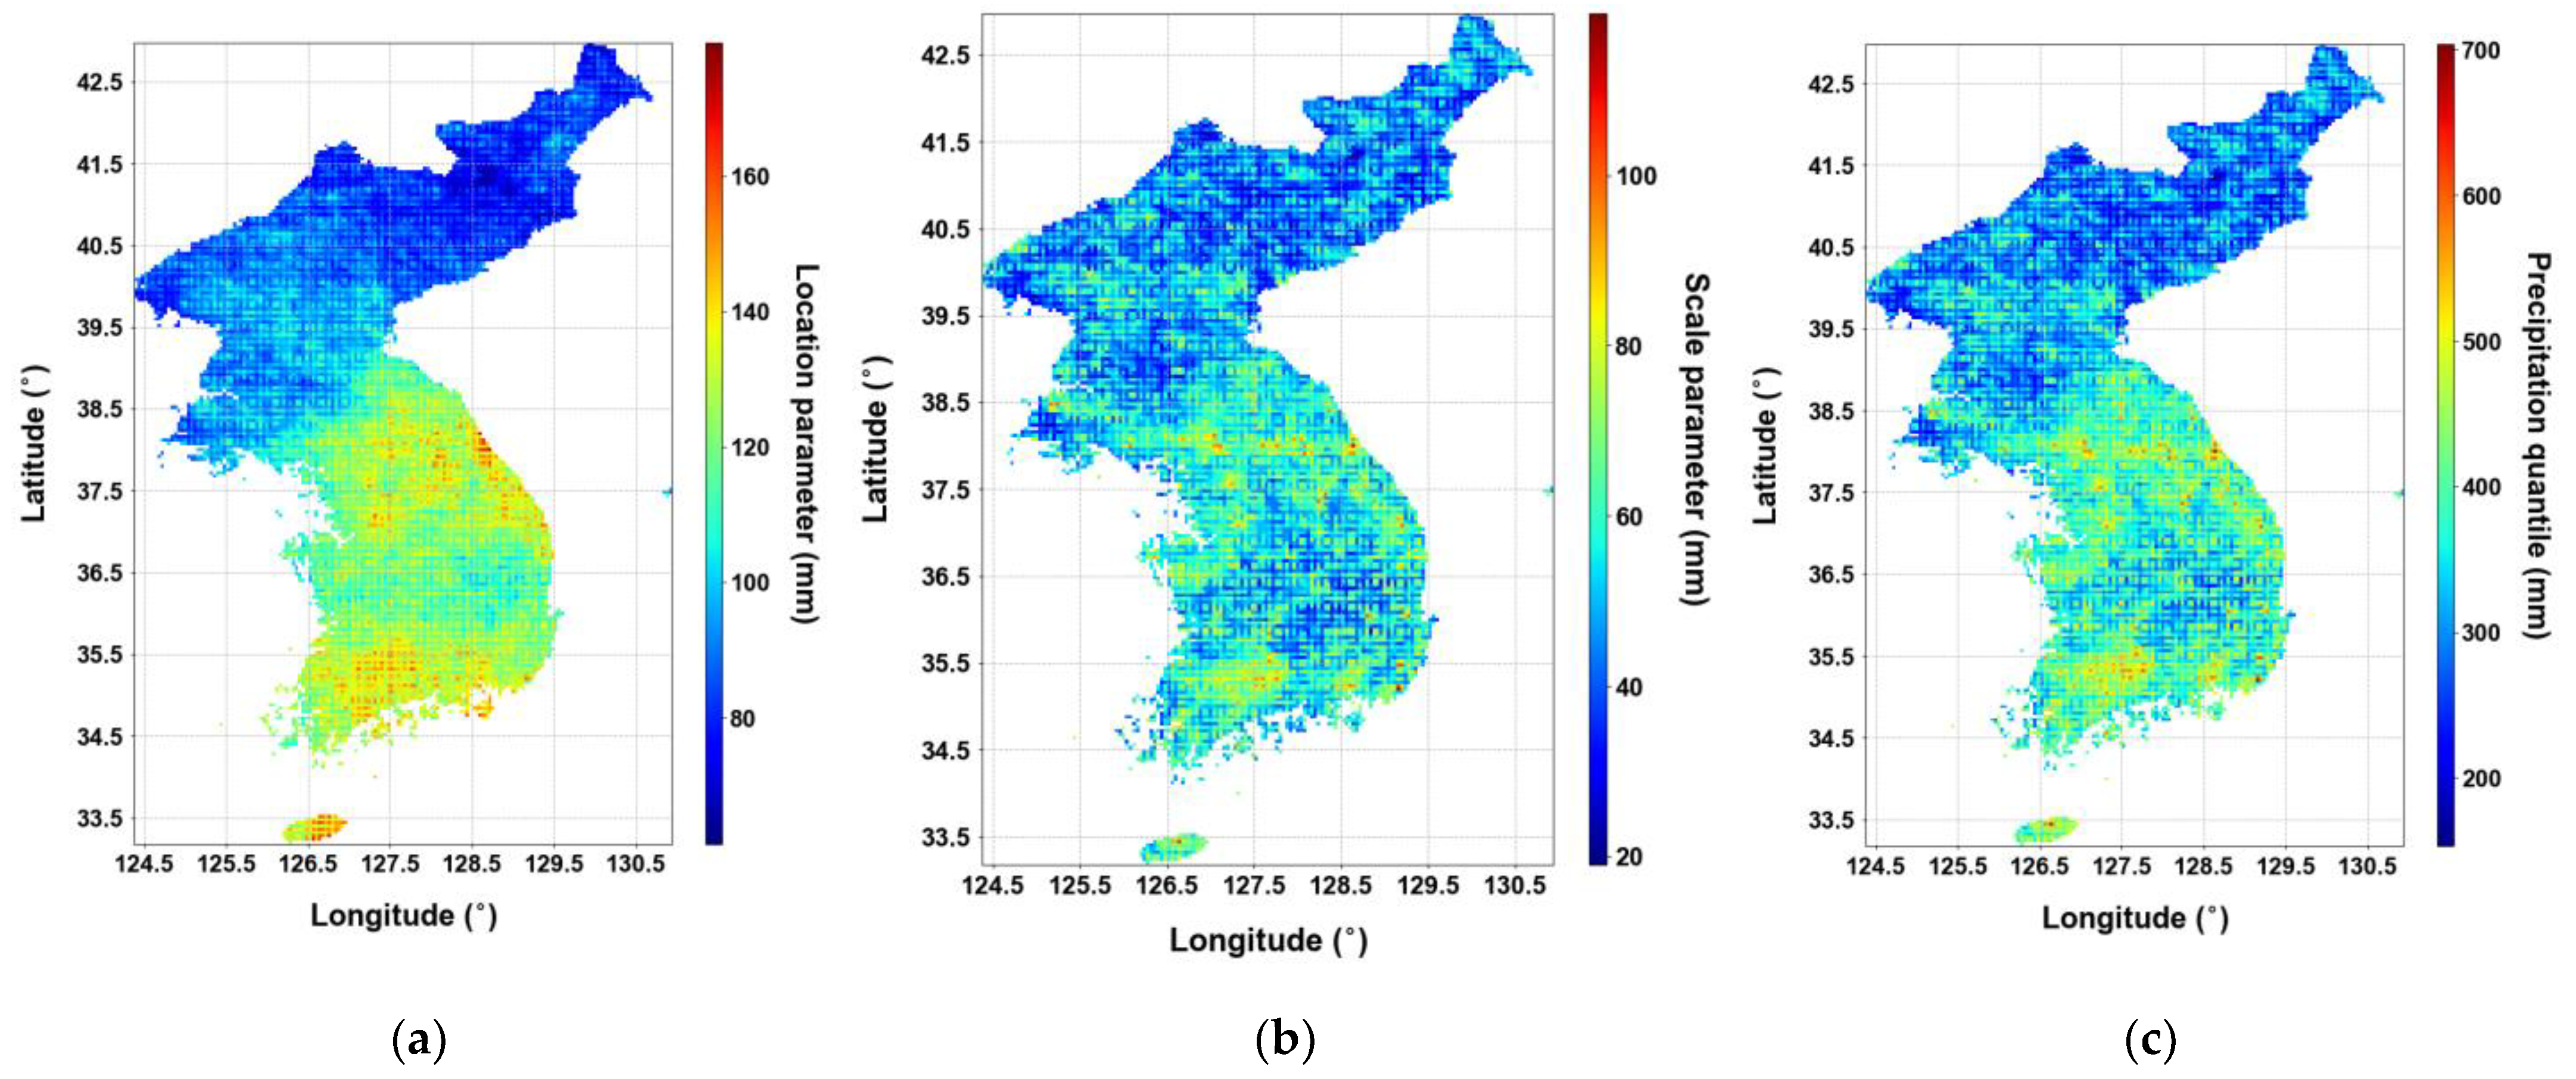
Utilizing the AMS established through the aforementioned process, the parameters of the Gumbel distribution were estimated for each duration. Based on these parameters, the probability precipitation for a 100-year frequency across a total of 12 durations was determined. For instance,
Figure 7 illustrates two parameters for a 24 h duration and the 100-year frequency probability precipitation calculated based on them. Generally, it is observed that the probability of precipitation tends to be higher in areas of high altitude. Moreover, it is also noted that adjacent regions do not always exhibit the most similarity.
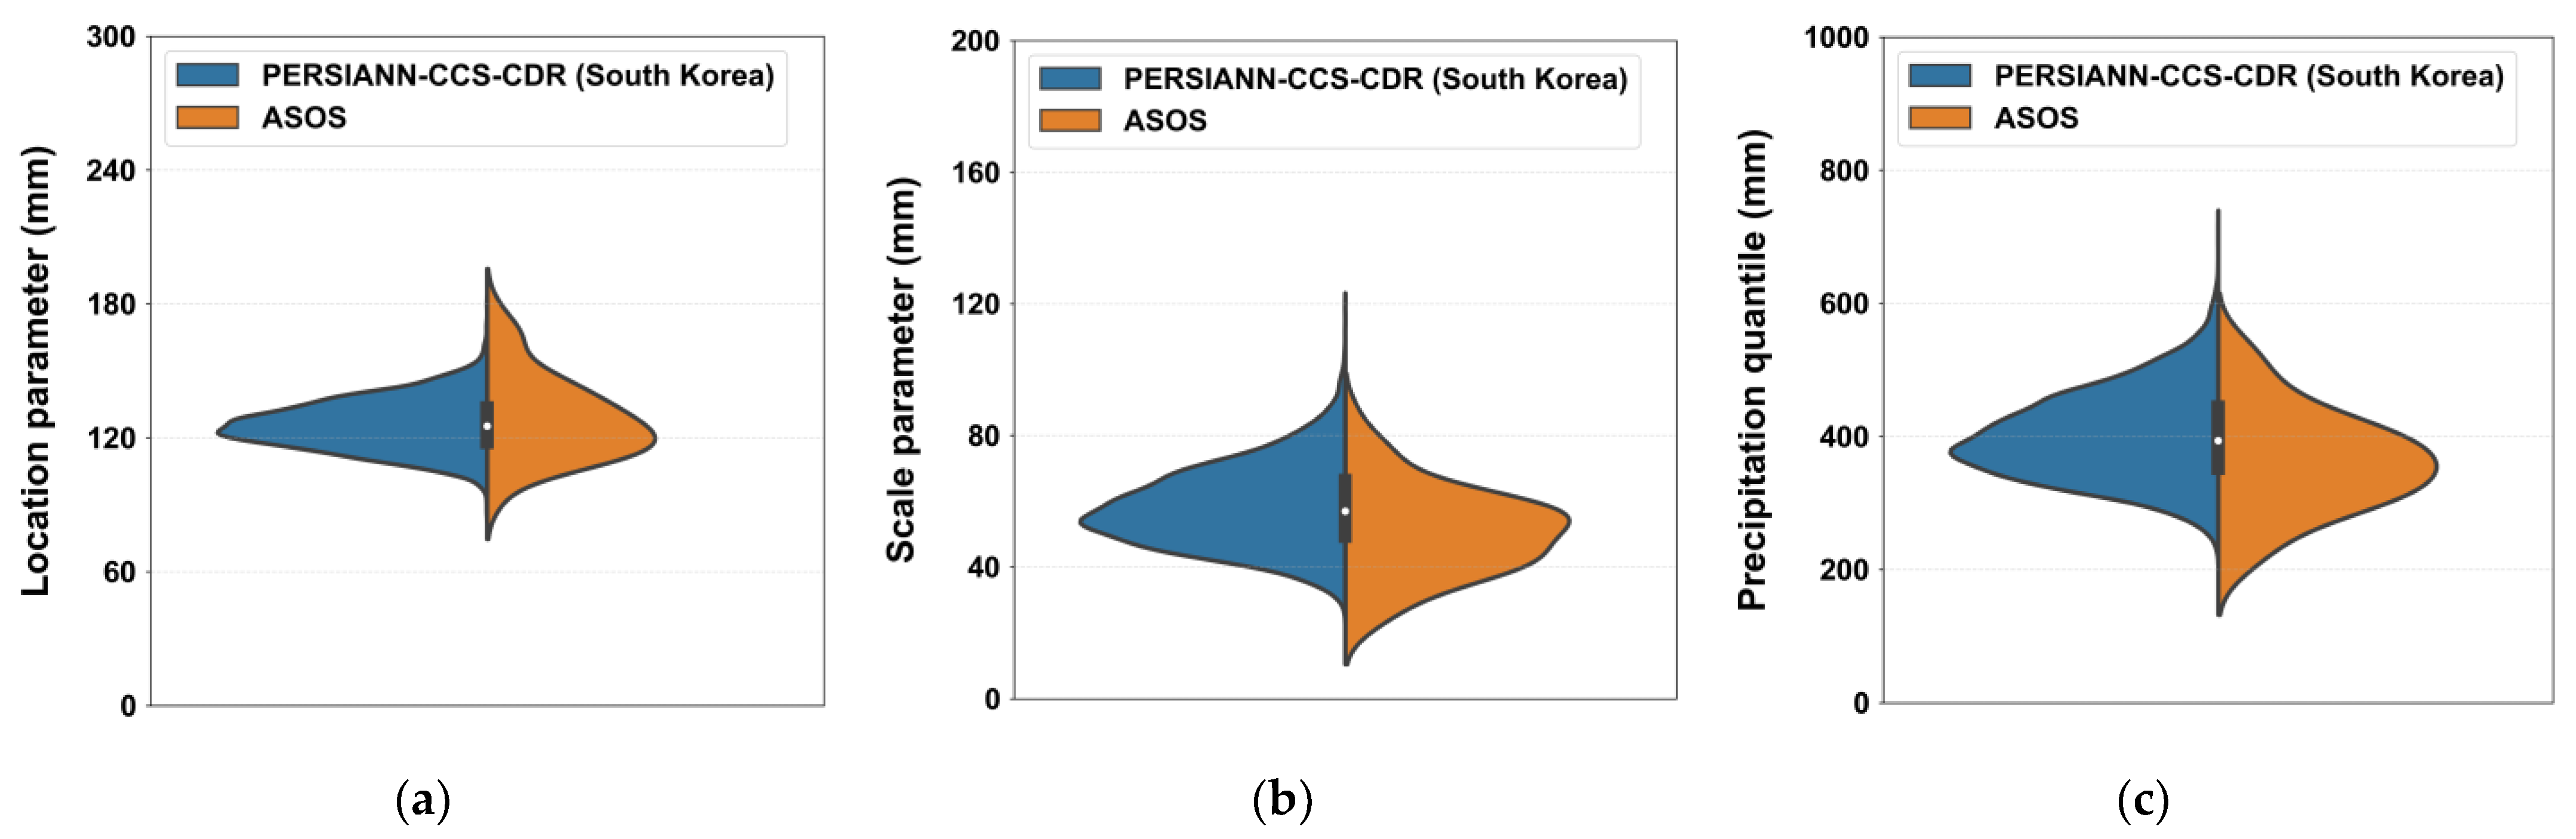
Using the same approach, parameters of the Gumbel distribution for 24 h were estimated for 60 ASOS stations, and based on this, 100-year probability precipitation quantiles were estimated. These results from the ASOS stations were compared with those derived for the whole of South Korea from PERSIANN-CCS-CDR using a violin plot (
Figure 8). Here, a violin plot is a graph that combines a kernel density curve and a box-plot to describe the distribution of continuous data. The curves on both sides represent the distribution of each dataset. Initially, it is observed that PERSIANN-CCS-CDR tends to be more concentrated towards the center. This is attributed to the significantly larger sample size of the grid-type PERSIANN-CCS-CDR compared to the ASOS data. However, the overall statistical characteristics are found to be almost identical. The median and mean values are nearly equivalent. Thus, it can be inferred that the uncertainty in the reanalyzed data, PERSIANN-CCS-CDR, is relatively small concerning 24 h probability precipitation distribution and 100-year precipitation quantile.
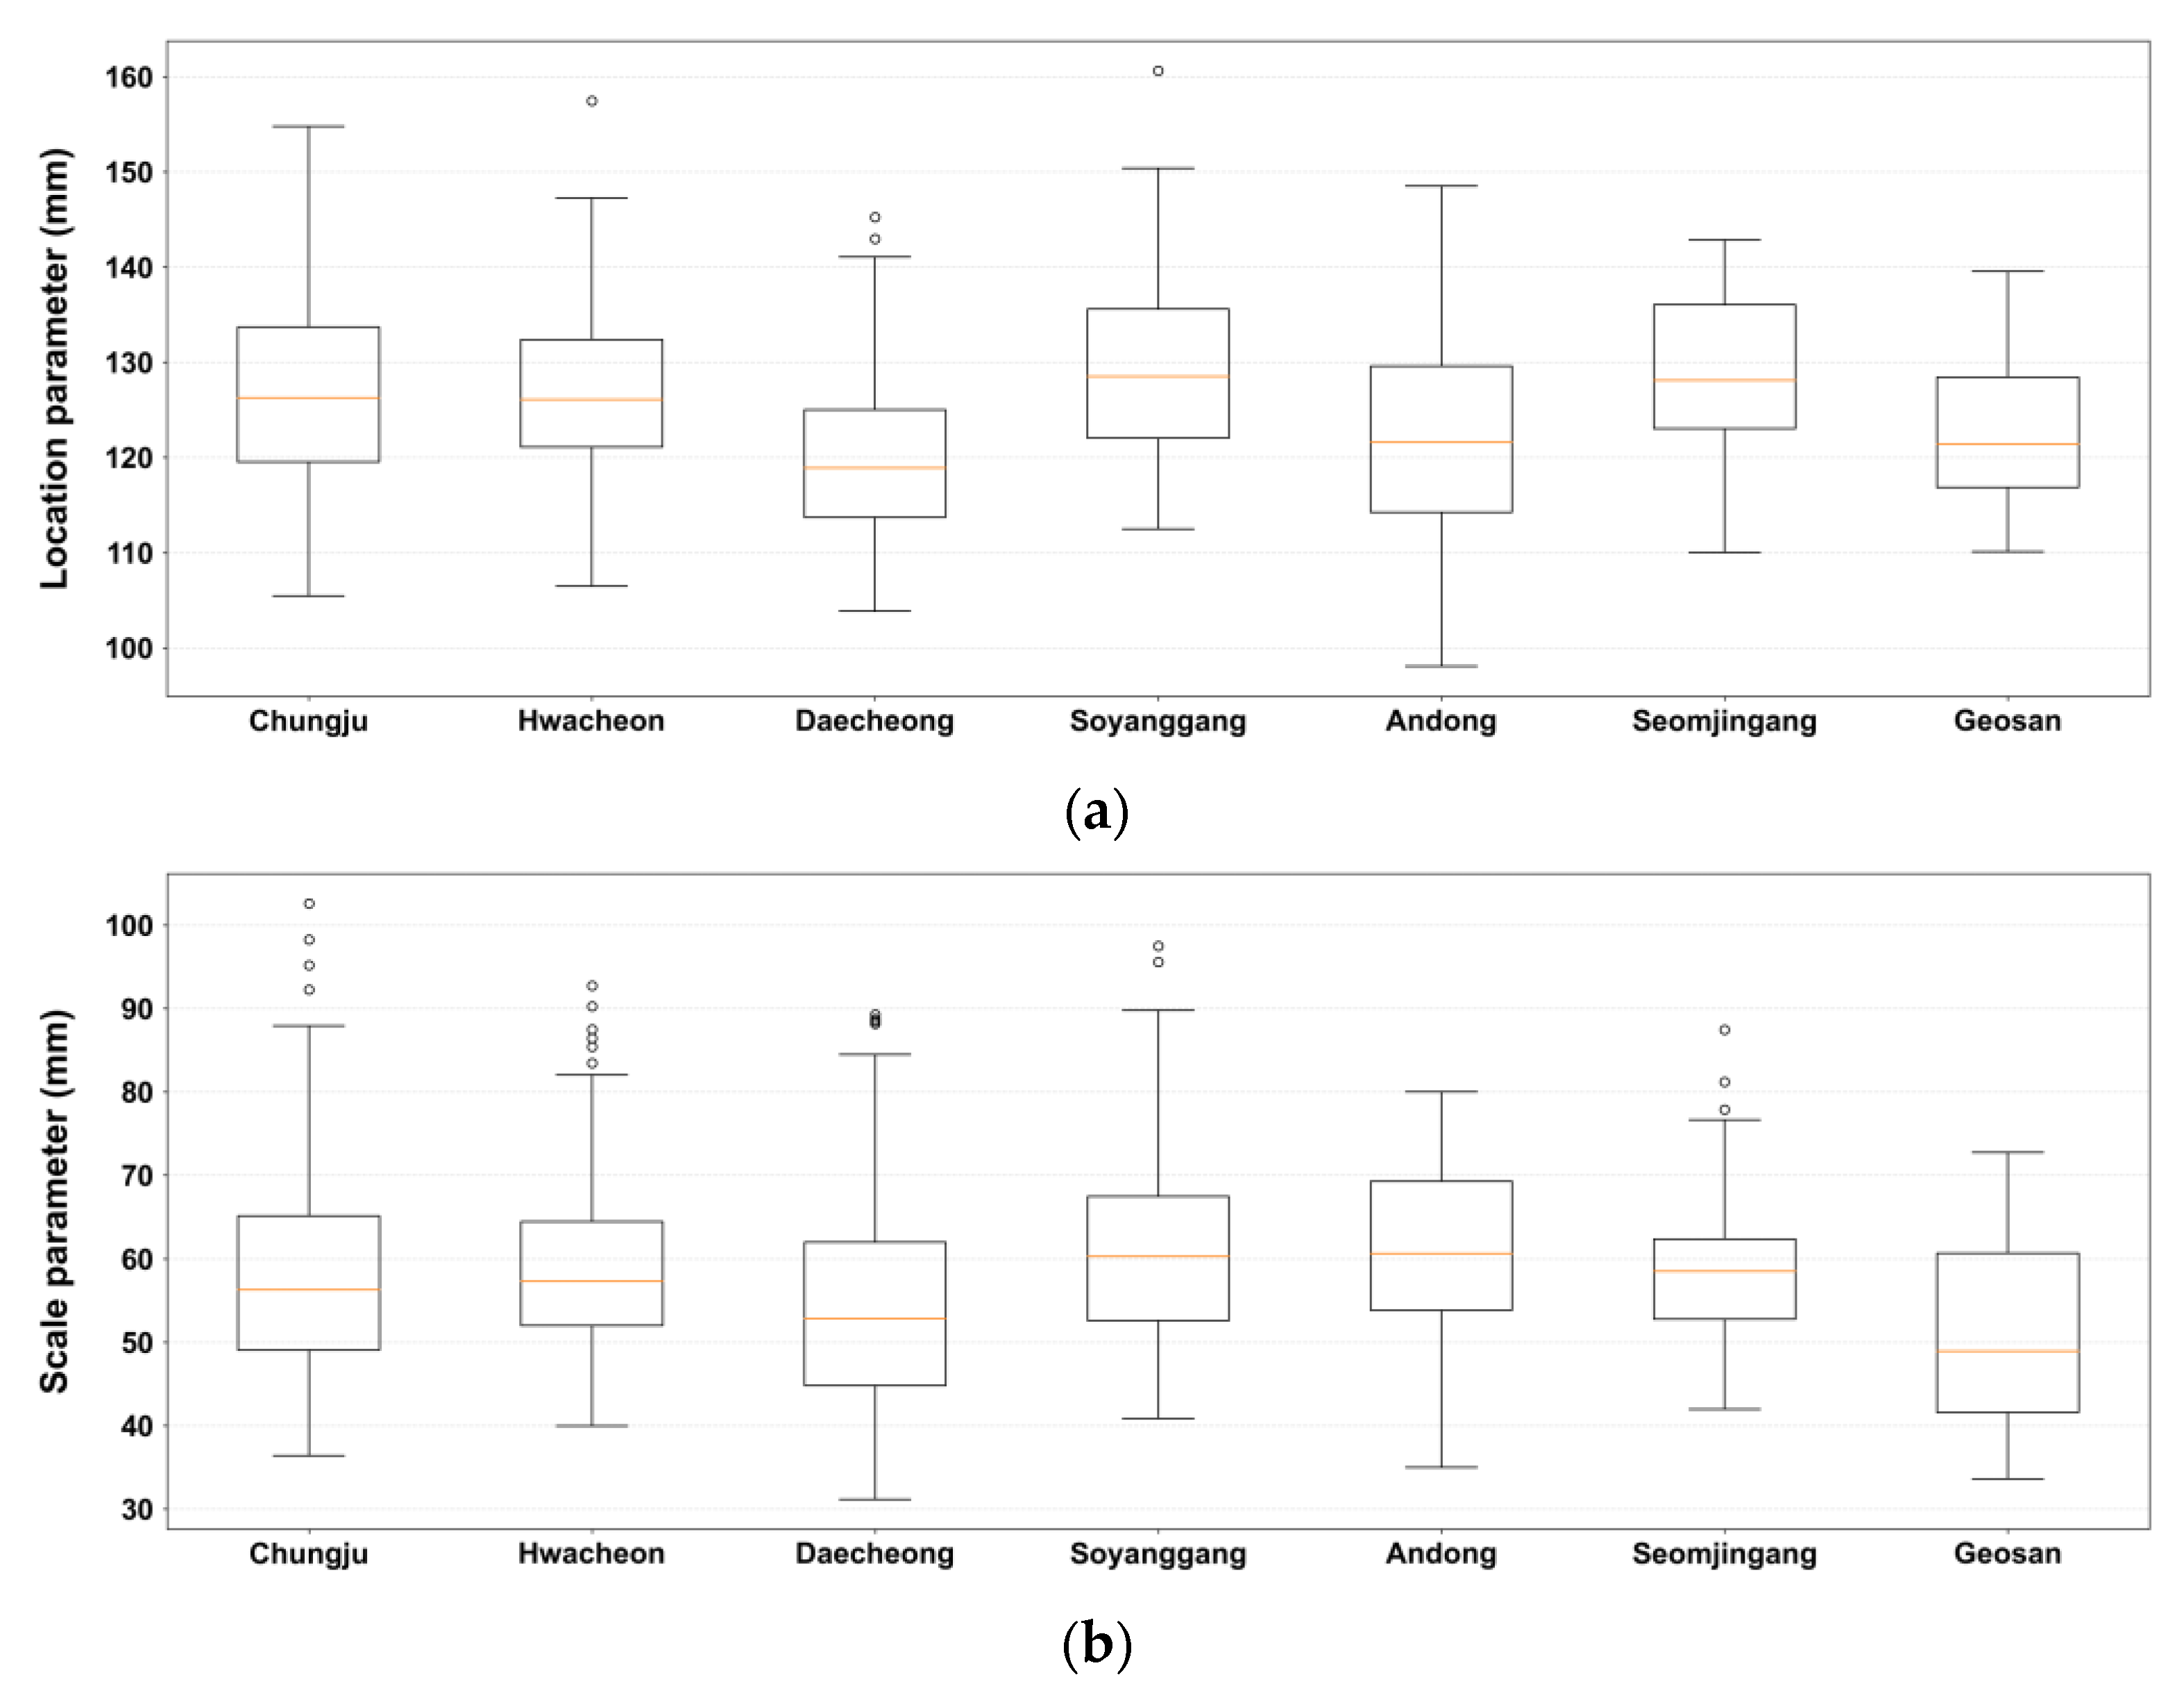
Figure 9 extracts each parameter using the mask file for each basin and presents the results in a box-plot format. Overall, it is observed that basins with larger location parameters tend to have larger scale parameters. However, the spatial deviation (indicated by the length of the box and tails) appears to be unrelated.
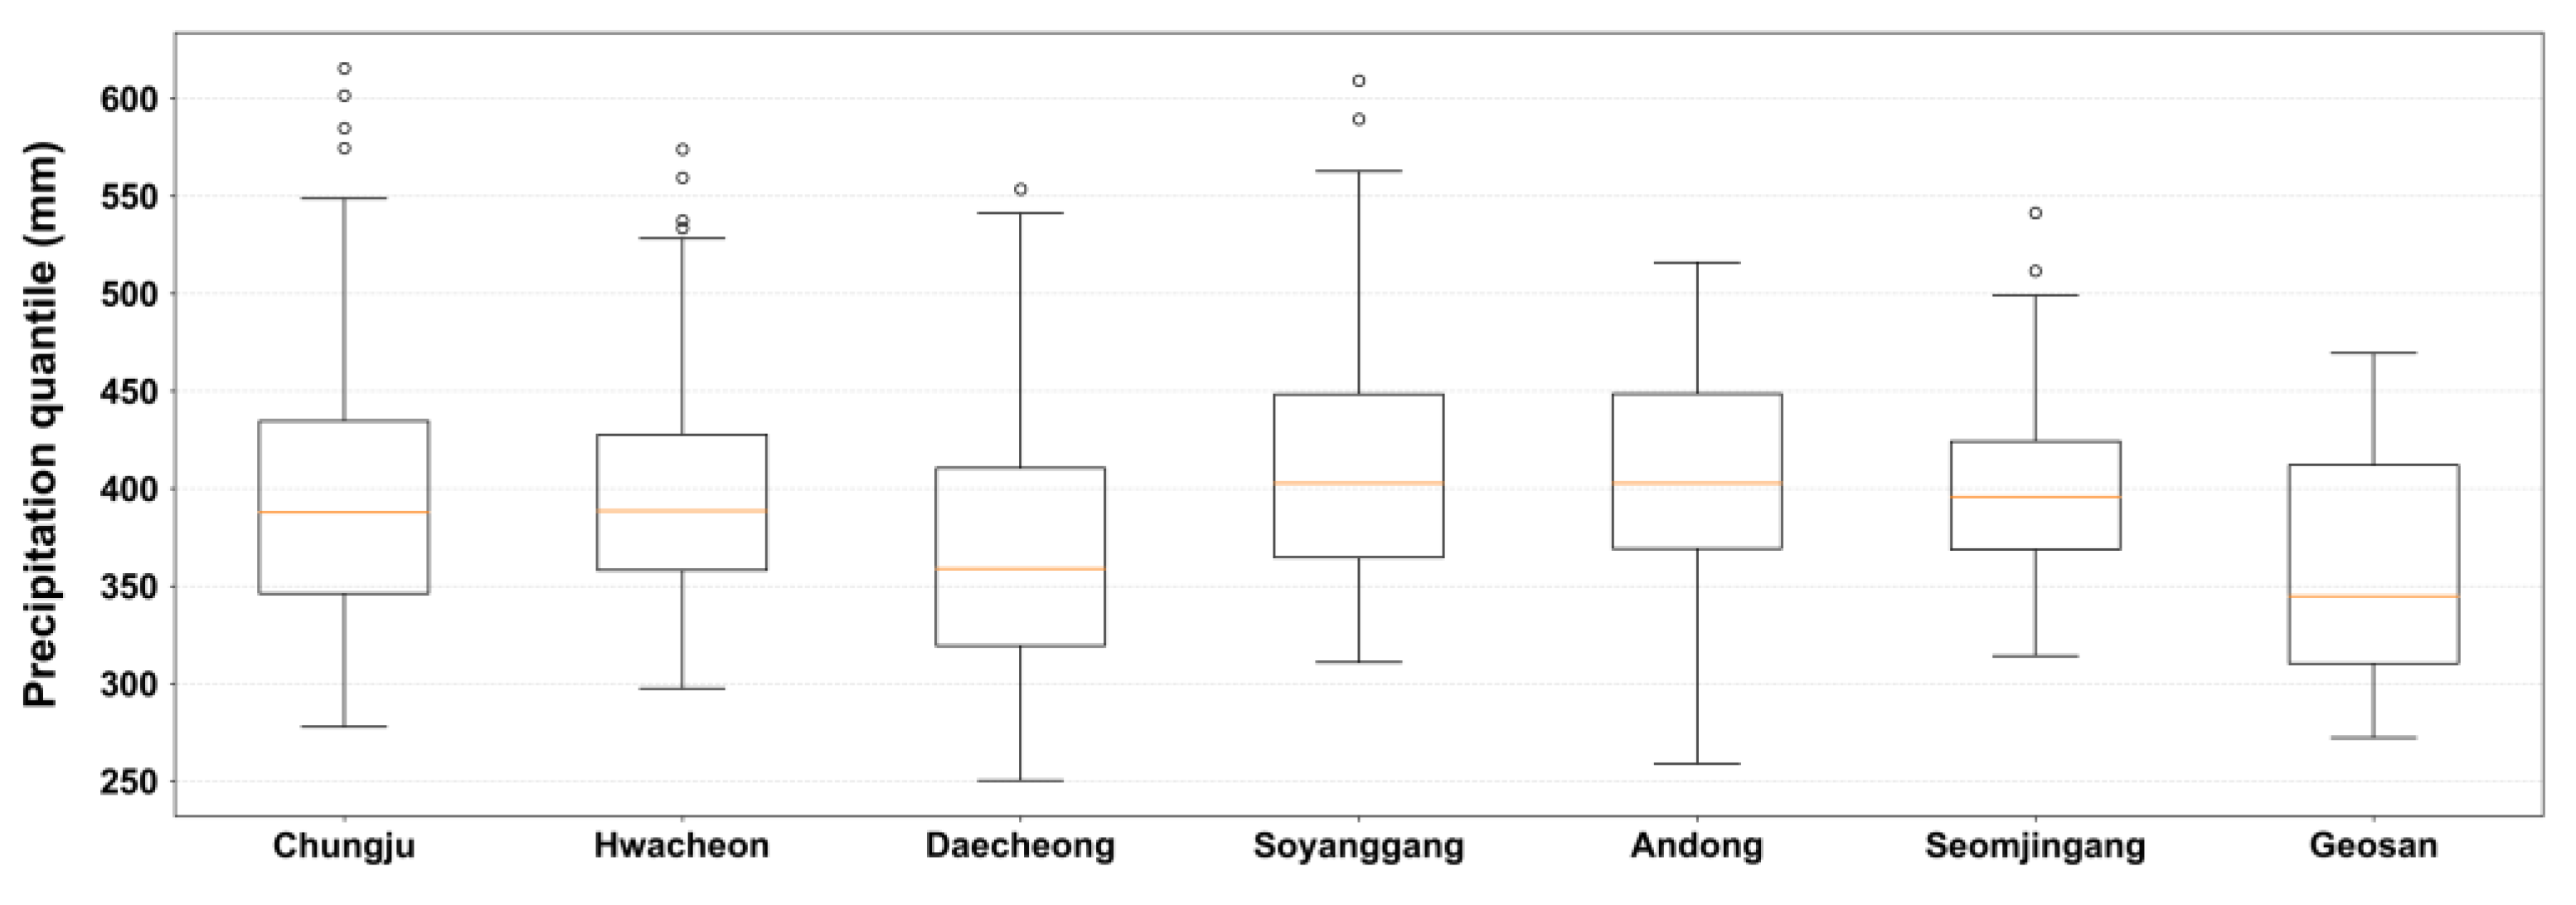
Figure 10 displays the probability precipitation for 100 years and 24 h, calculated based on the aforementioned parameters, as a box-plot for each basin. This reflects a complex effect of location and scale parameters, and since the frequency is high, it is observed that the results tend to be closer to the scale parameter.
4.3. Comparison between Morphological Characteristics and Probability Quantiles
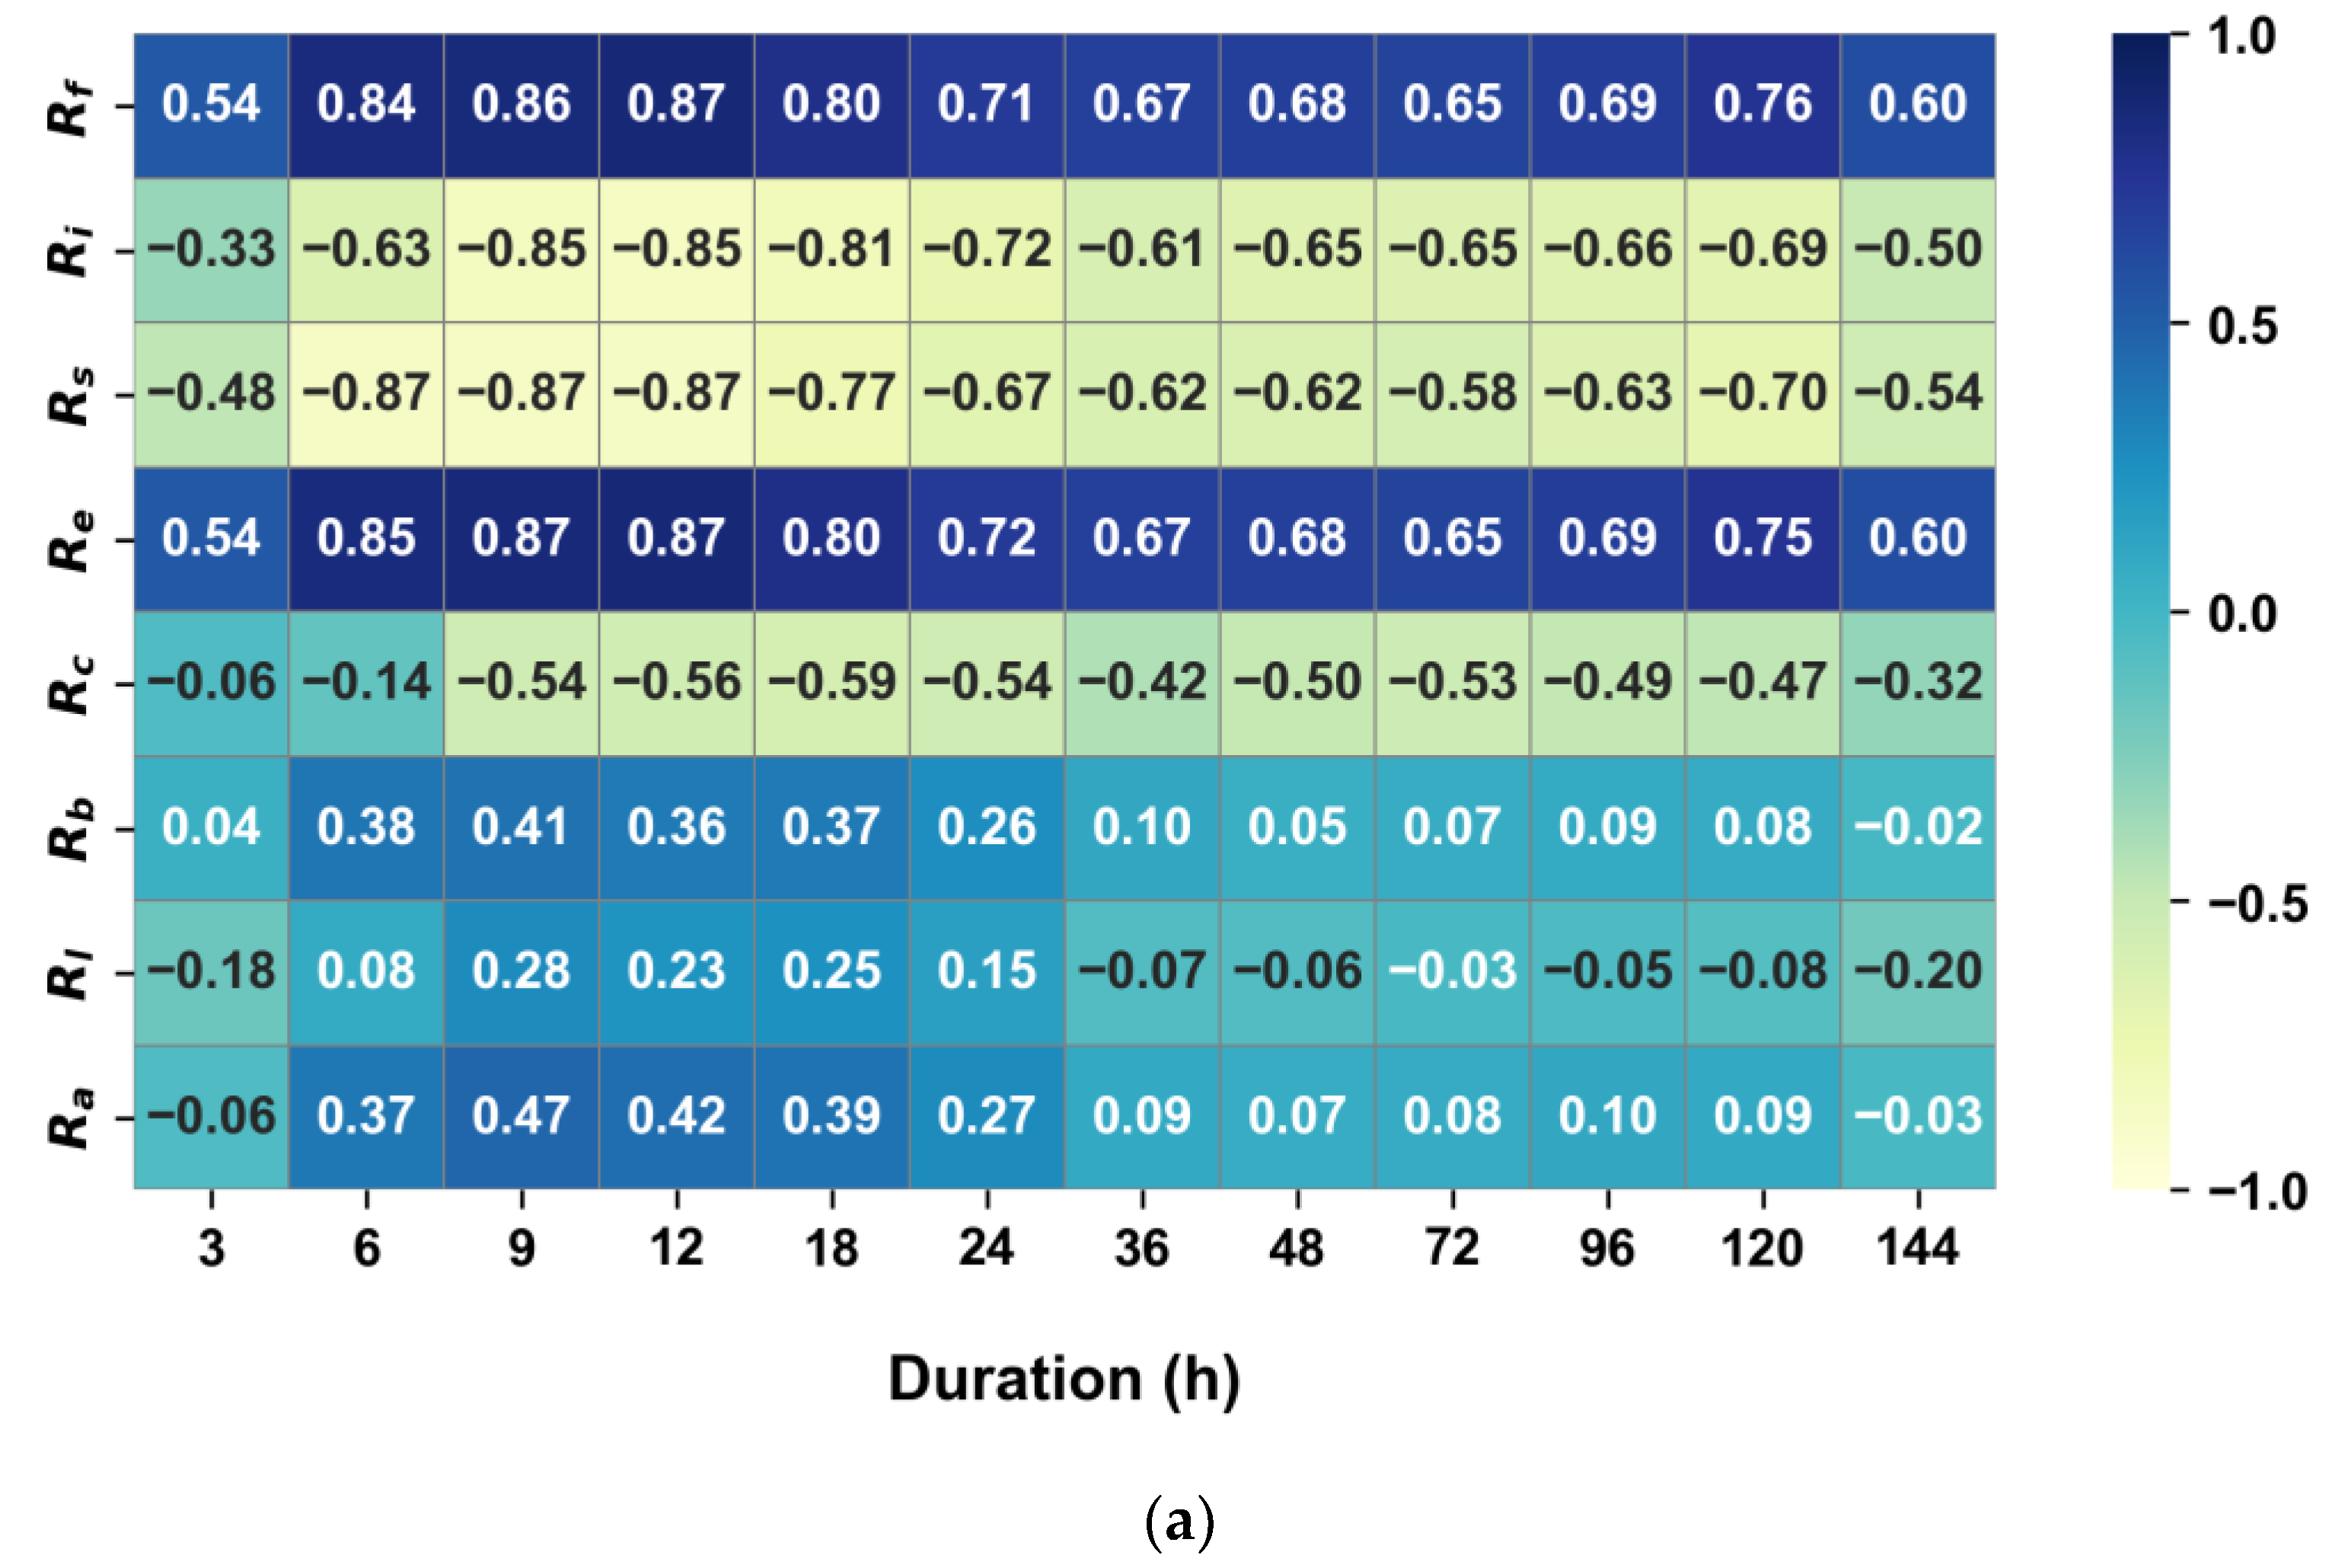
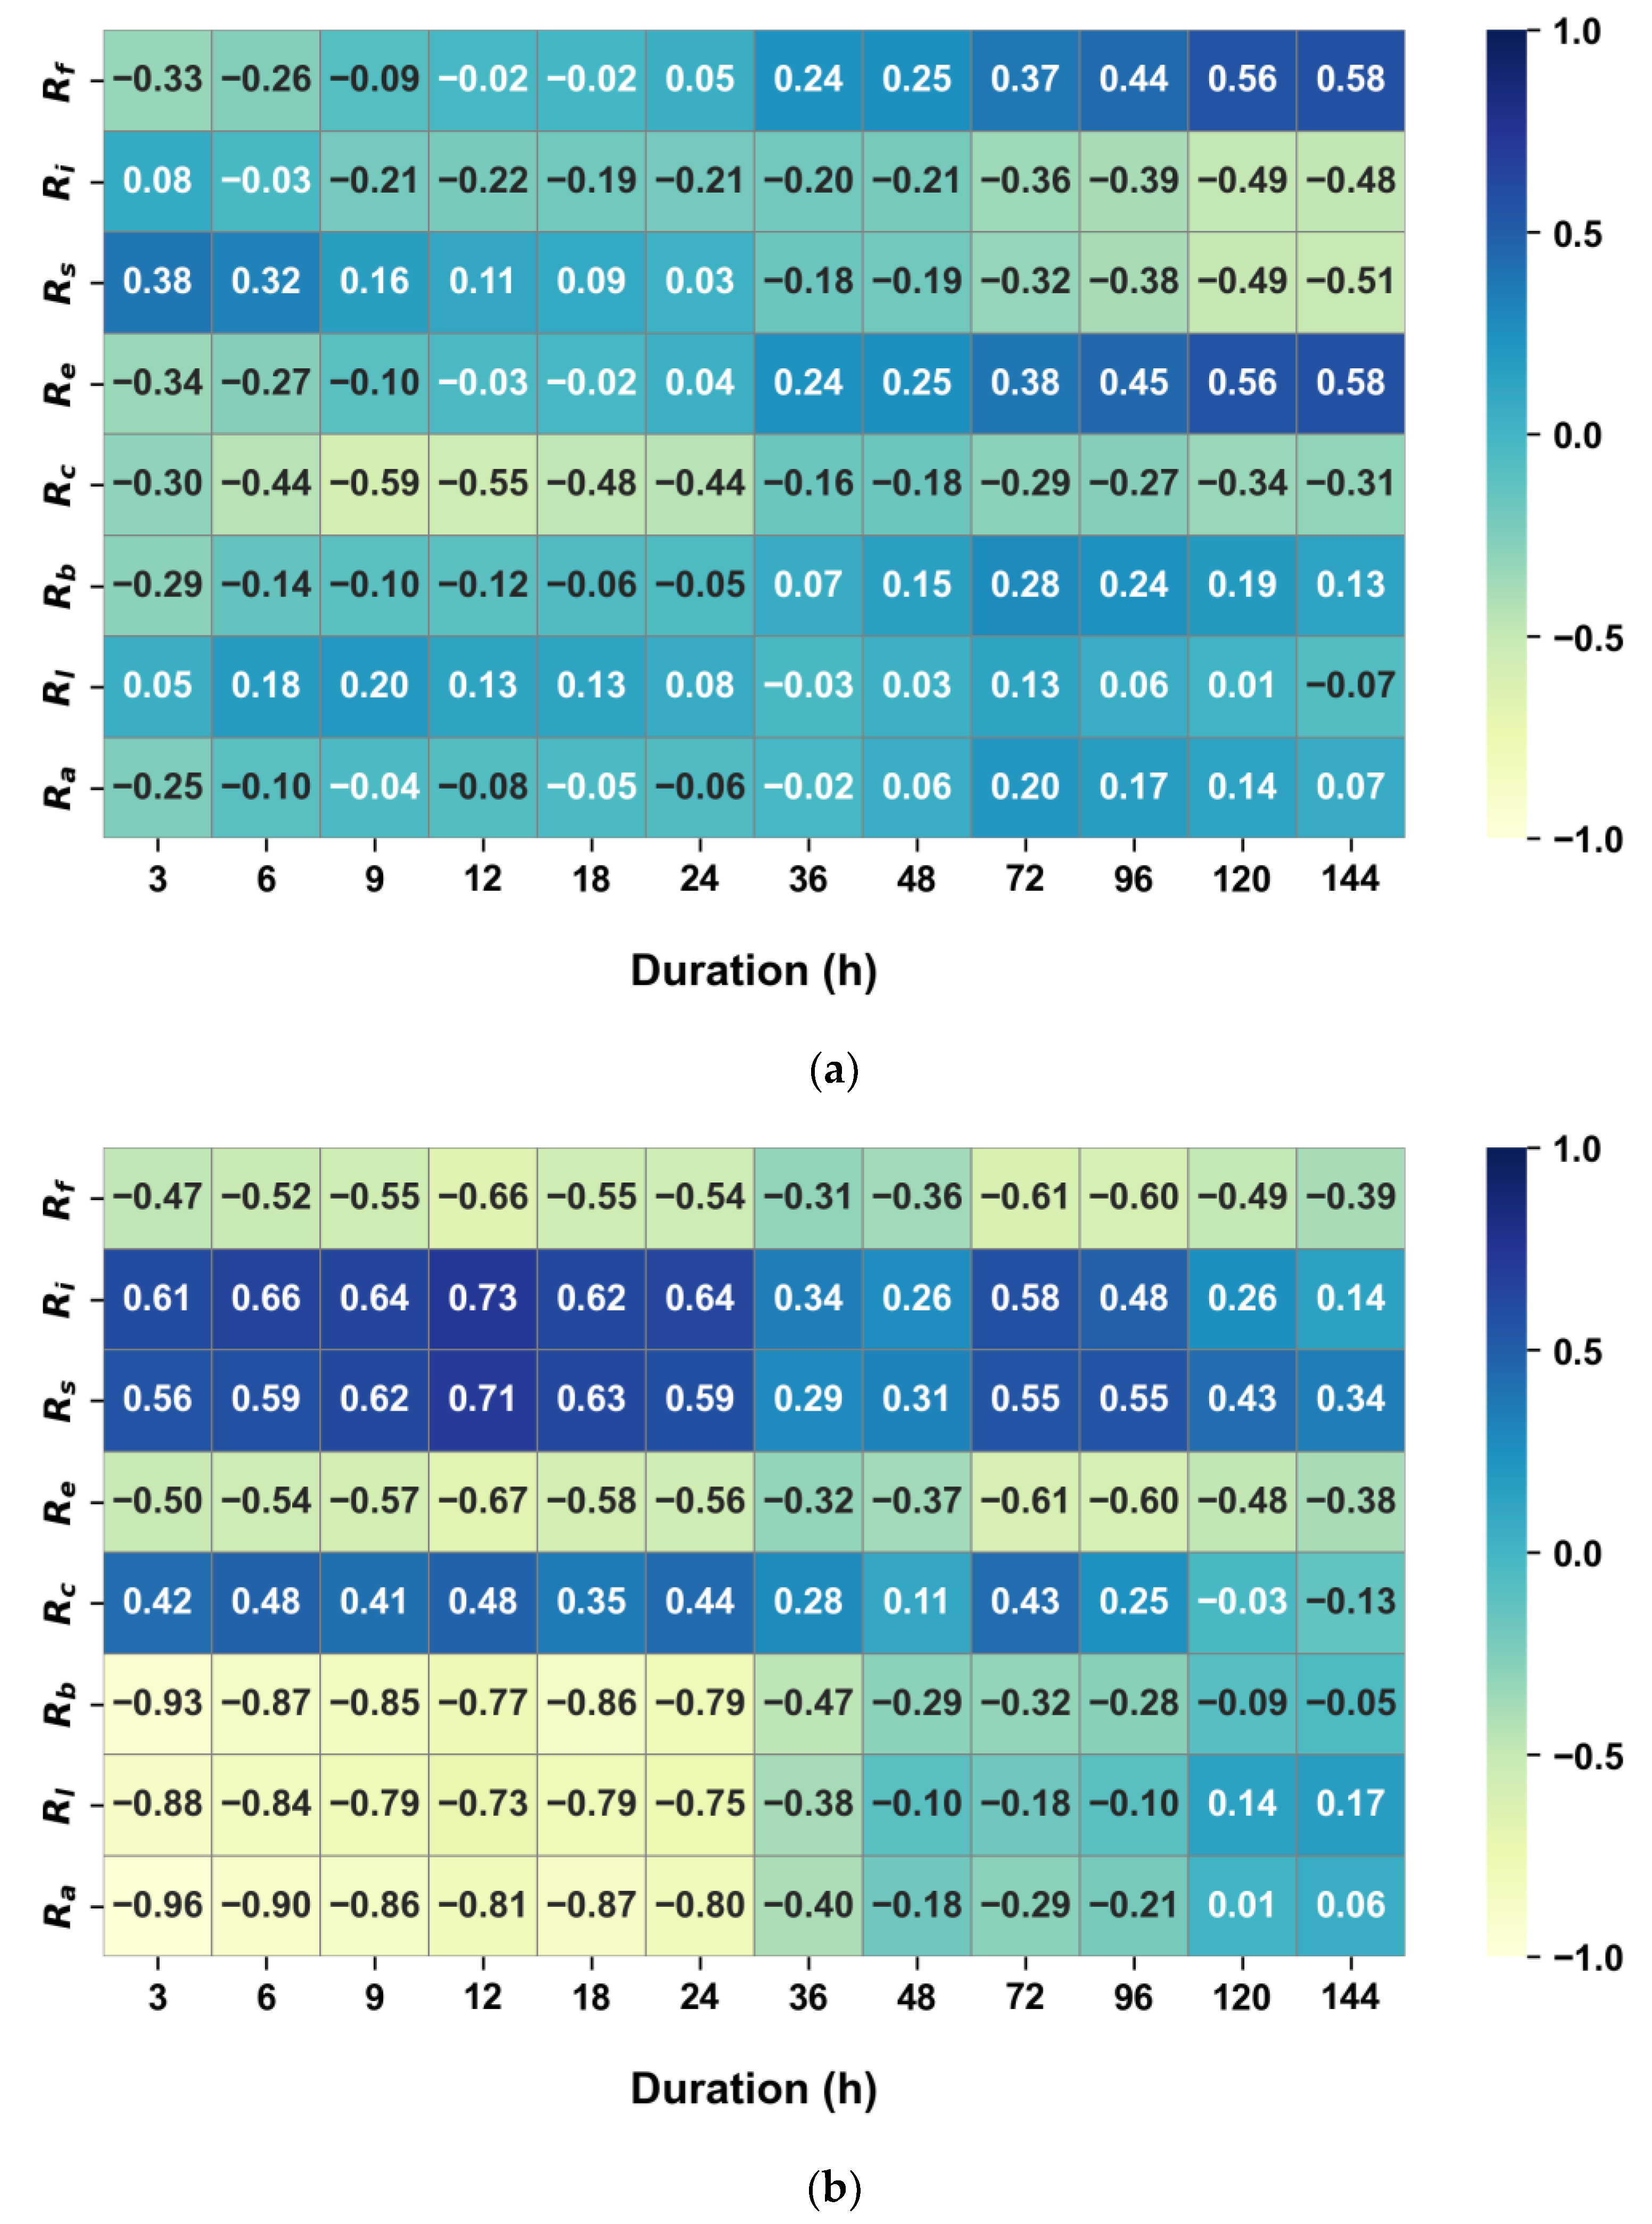
Figure 11 shows the results of the correlation between the parameters. Starting with the location parameters, they exhibit a very high correlation with the elongation of the basin. This means that the wider the basin is (as indicated by larger
and
values), the larger the location parameter becomes. Conversely, the more elongated the basin is (as indicated by larger
and
values), the smaller the location parameter of the probability precipitation becomes. It is also observed that as the basin shape becomes closer to a circle (with increasing
), the value decreases. This correlation becomes more evident starting from a duration of approximately 9 h or longer. Additionally, no significant correlation has been found with the degree of development of the river network.
Next, examining the standard deviation (STD) of the location parameter reveals a somewhat opposite pattern. This implies that the wider the basin, the smaller the STD tends to be, and conversely, the more elongated or circular the basin, the larger the STD of the location parameter becomes. However, this correlation appears to be very weak for periods longer than 1 day (24 h). Additionally, there is a weak negative correlation observed with the degree of development of the river network.
In other words, if the location parameter signifies the magnitude of large-scale heavy rain events, then in wide basins, these events appear to be larger and their spatial distribution seems more uniform. Furthermore, if the rainfall distribution is uniform in this manner, it can be inferred that the formation of the river network tends to be more complex. Conversely, in basins that are narrow and elongated, the magnitude of heavy rainfall events appears relatively smaller, and the spatial distribution seems somewhat diverse over short durations. This evenly distributed rainfall could lead to a simplification in the formation of river networks.
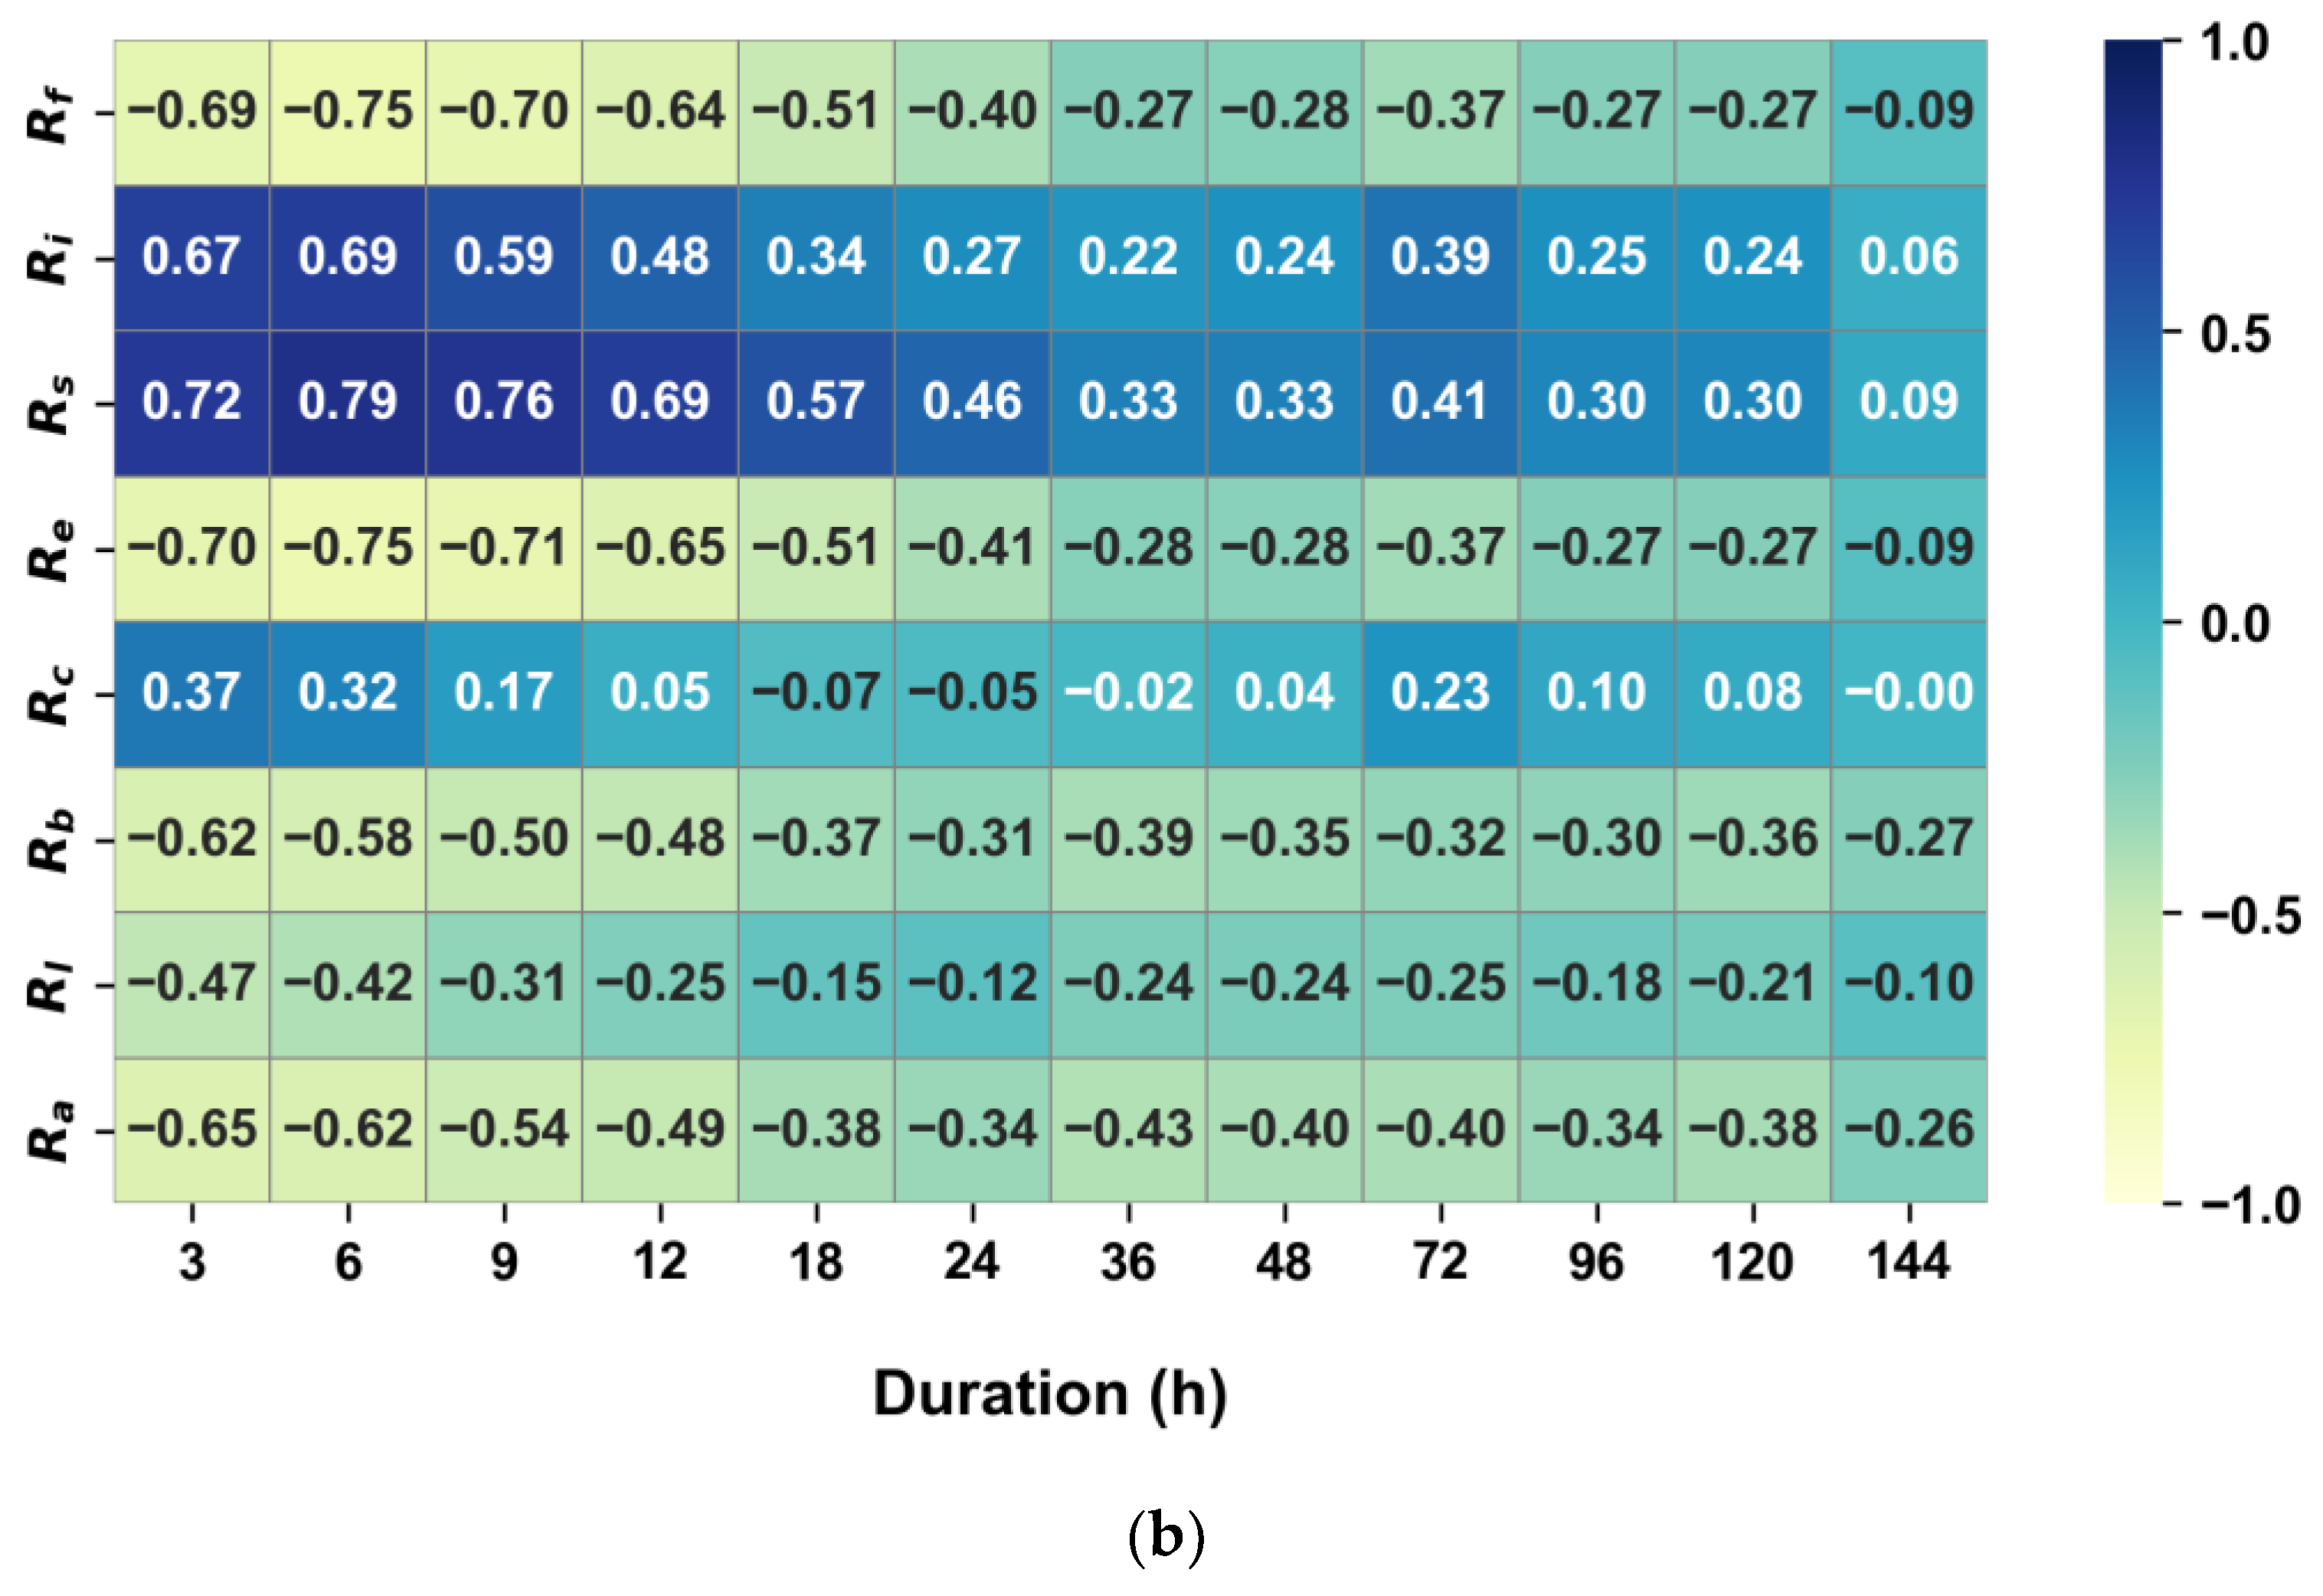
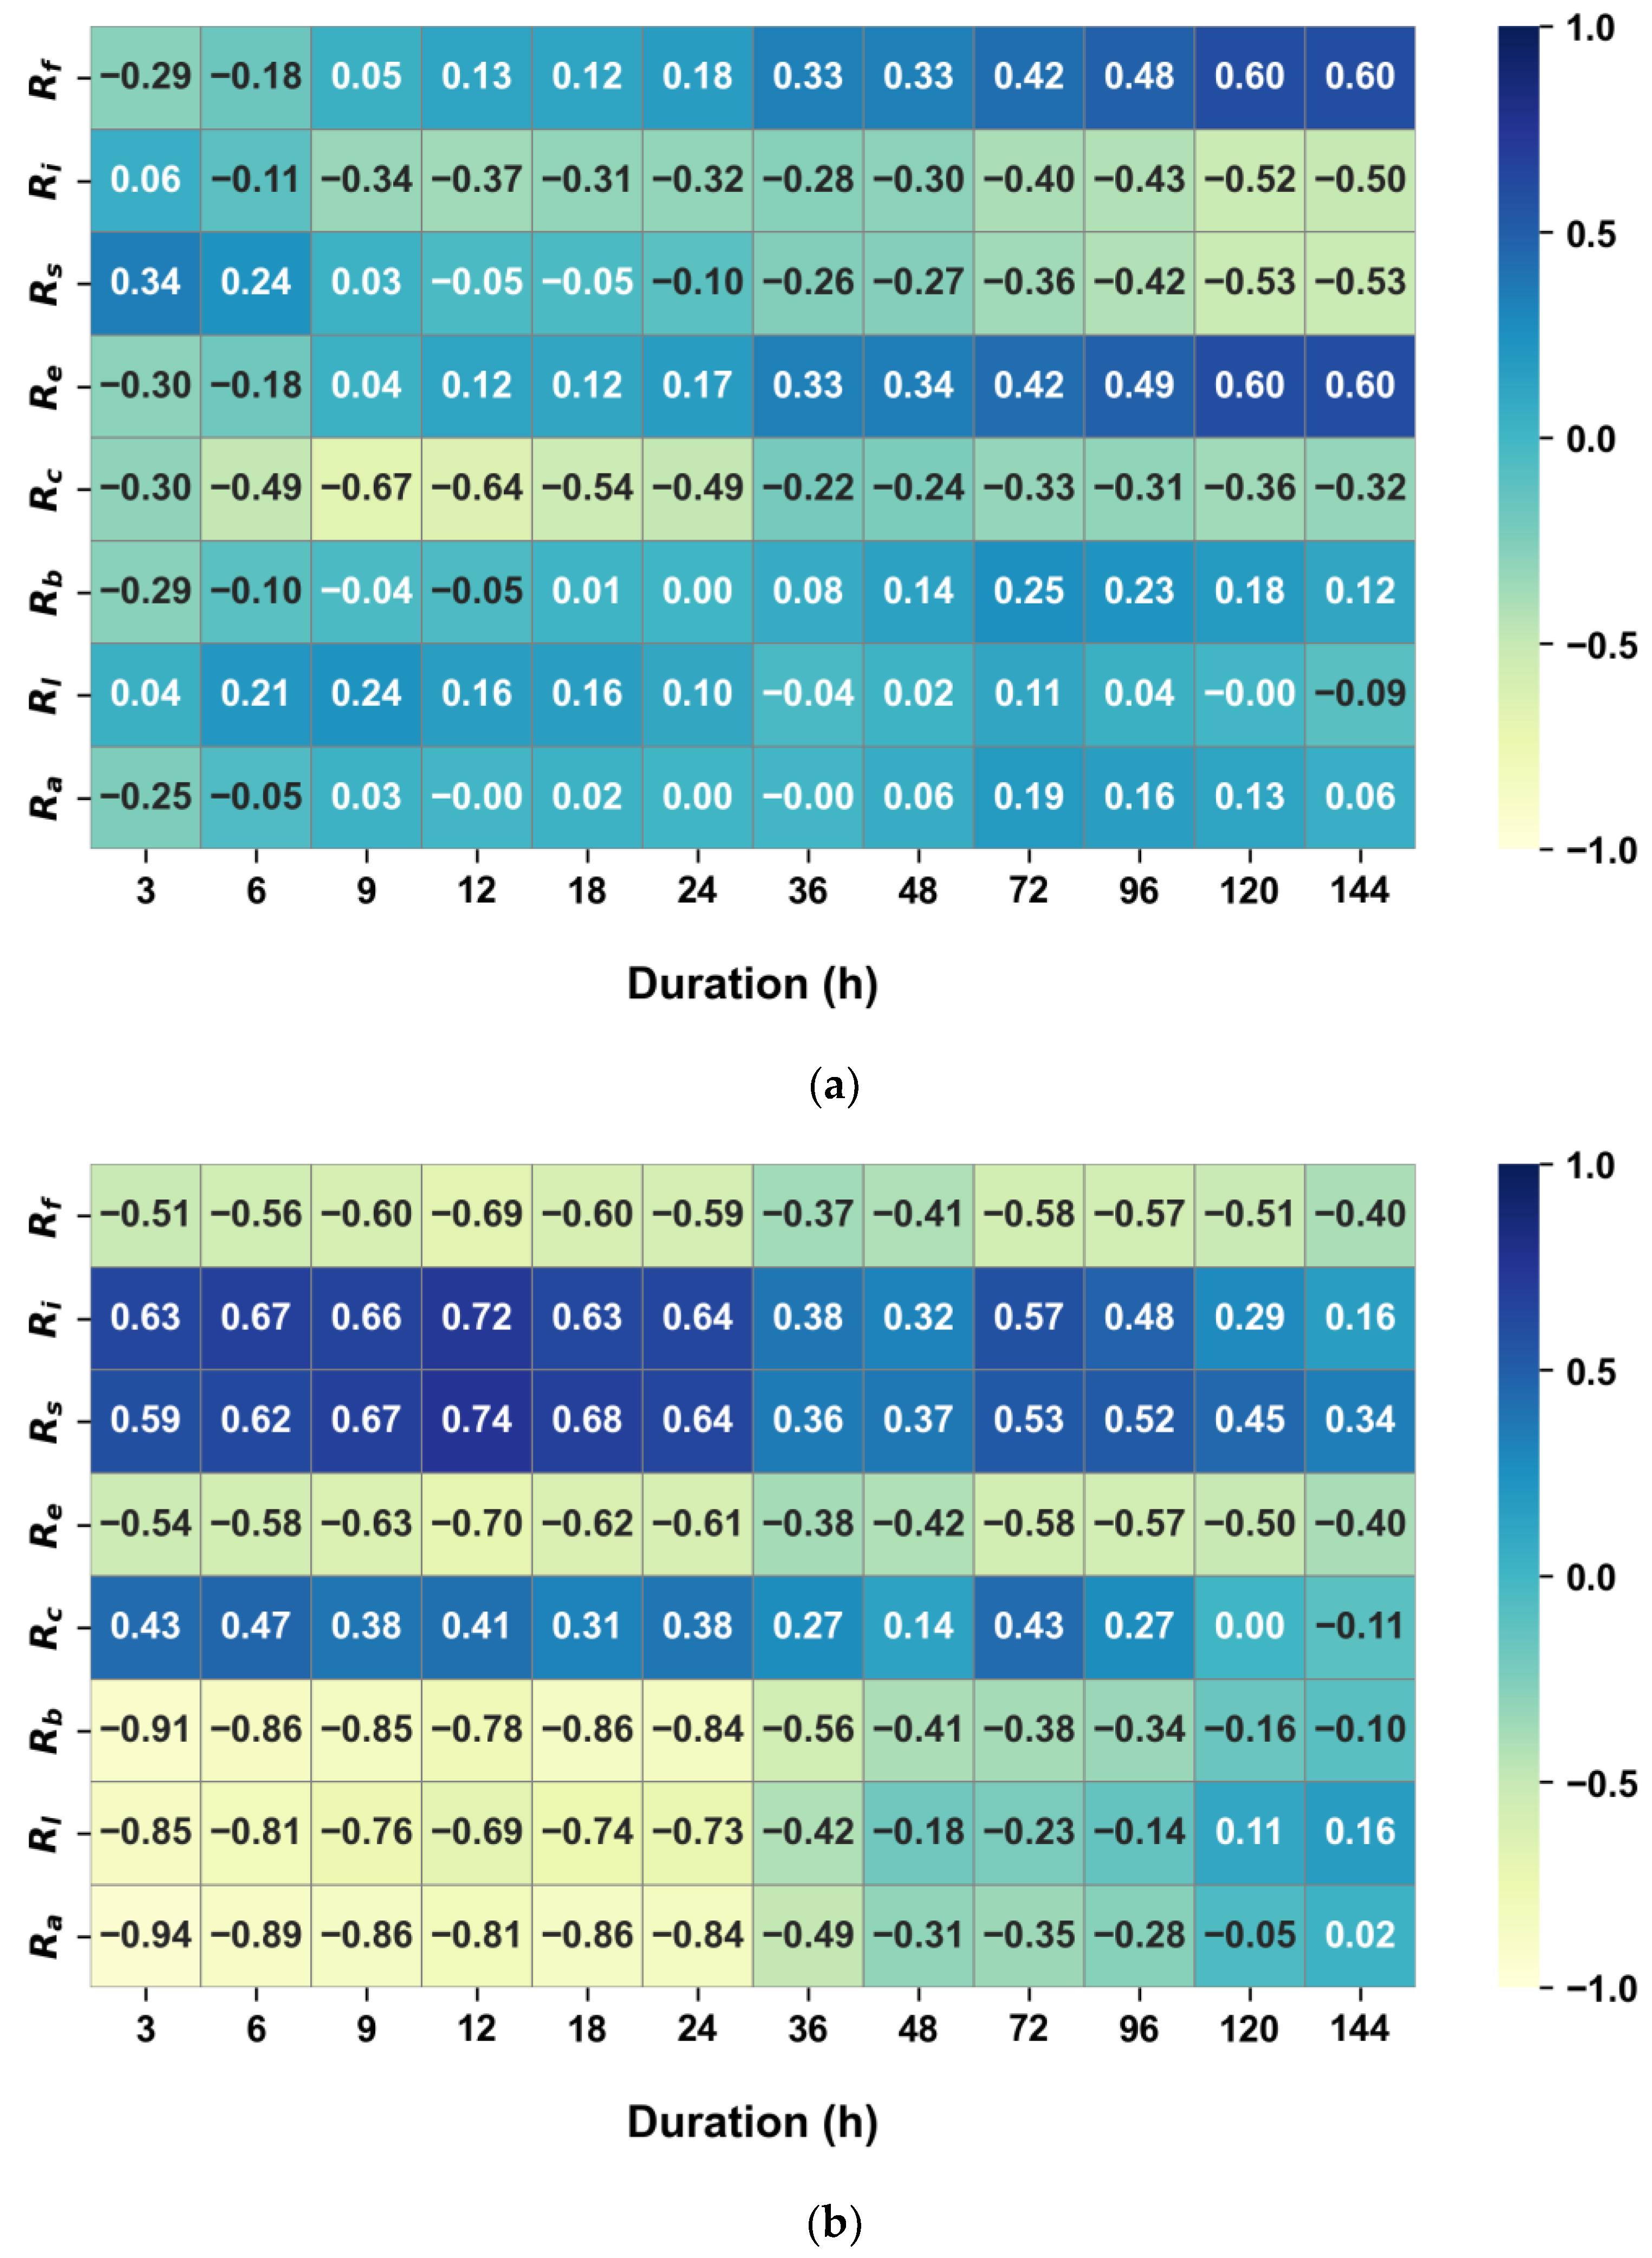
Figure 12 illustrates the correlation between scale parameters and morphological factors. The scale parameter displays a pattern similar to that of the location parameter. This means that the correlation for the mean value is higher in wider basins, while for the standard deviation, it appears larger in basins that are more elongated or closer to circular shapes. Furthermore, while the mean does not show a significant relationship with the river network, a strong negative relationship is observed with the STD.
In essence, if the scale parameter indicates the variability of large-scale heavy rain events, then in basins with a wide shape, these events demonstrate large fluctuations, and their spatial distribution appears relatively uniform. Additionally, when there are such spatially uniform and large-scale fluctuations in heavy rain events, it can be observed that the formation of the river network becomes complex. Conversely, in basins that are narrow and elongated, the fluctuations in large-scale heavy rain events appear to be relatively small, and their spatial distribution seems somewhat diverse. These varied changes can also lead to a simplification in the formation of river networks.
Figure 13 displays the correlation between the morphological characteristics and the grid-based 100-year precipitation quantiles for all basins. The probability precipitation exhibits a pattern similar to that of the scale parameter. Given that 100 years represents a significant frequency, the scale parameter could exert a greater influence.
If the basin is wider, the probability precipitation is typically larger, and its distribution is somewhat consistent. On the other hand, if the basin is elongated or somewhat round, the probability precipitation tends to decrease, and the spatial dispersion increases. The more consistent the spatial distribution of probability precipitation appears, the more complex the river network becomes. This tendency is more pronounced in aspects related to size during longer durations, and in terms of spatial dispersion during shorter durations.
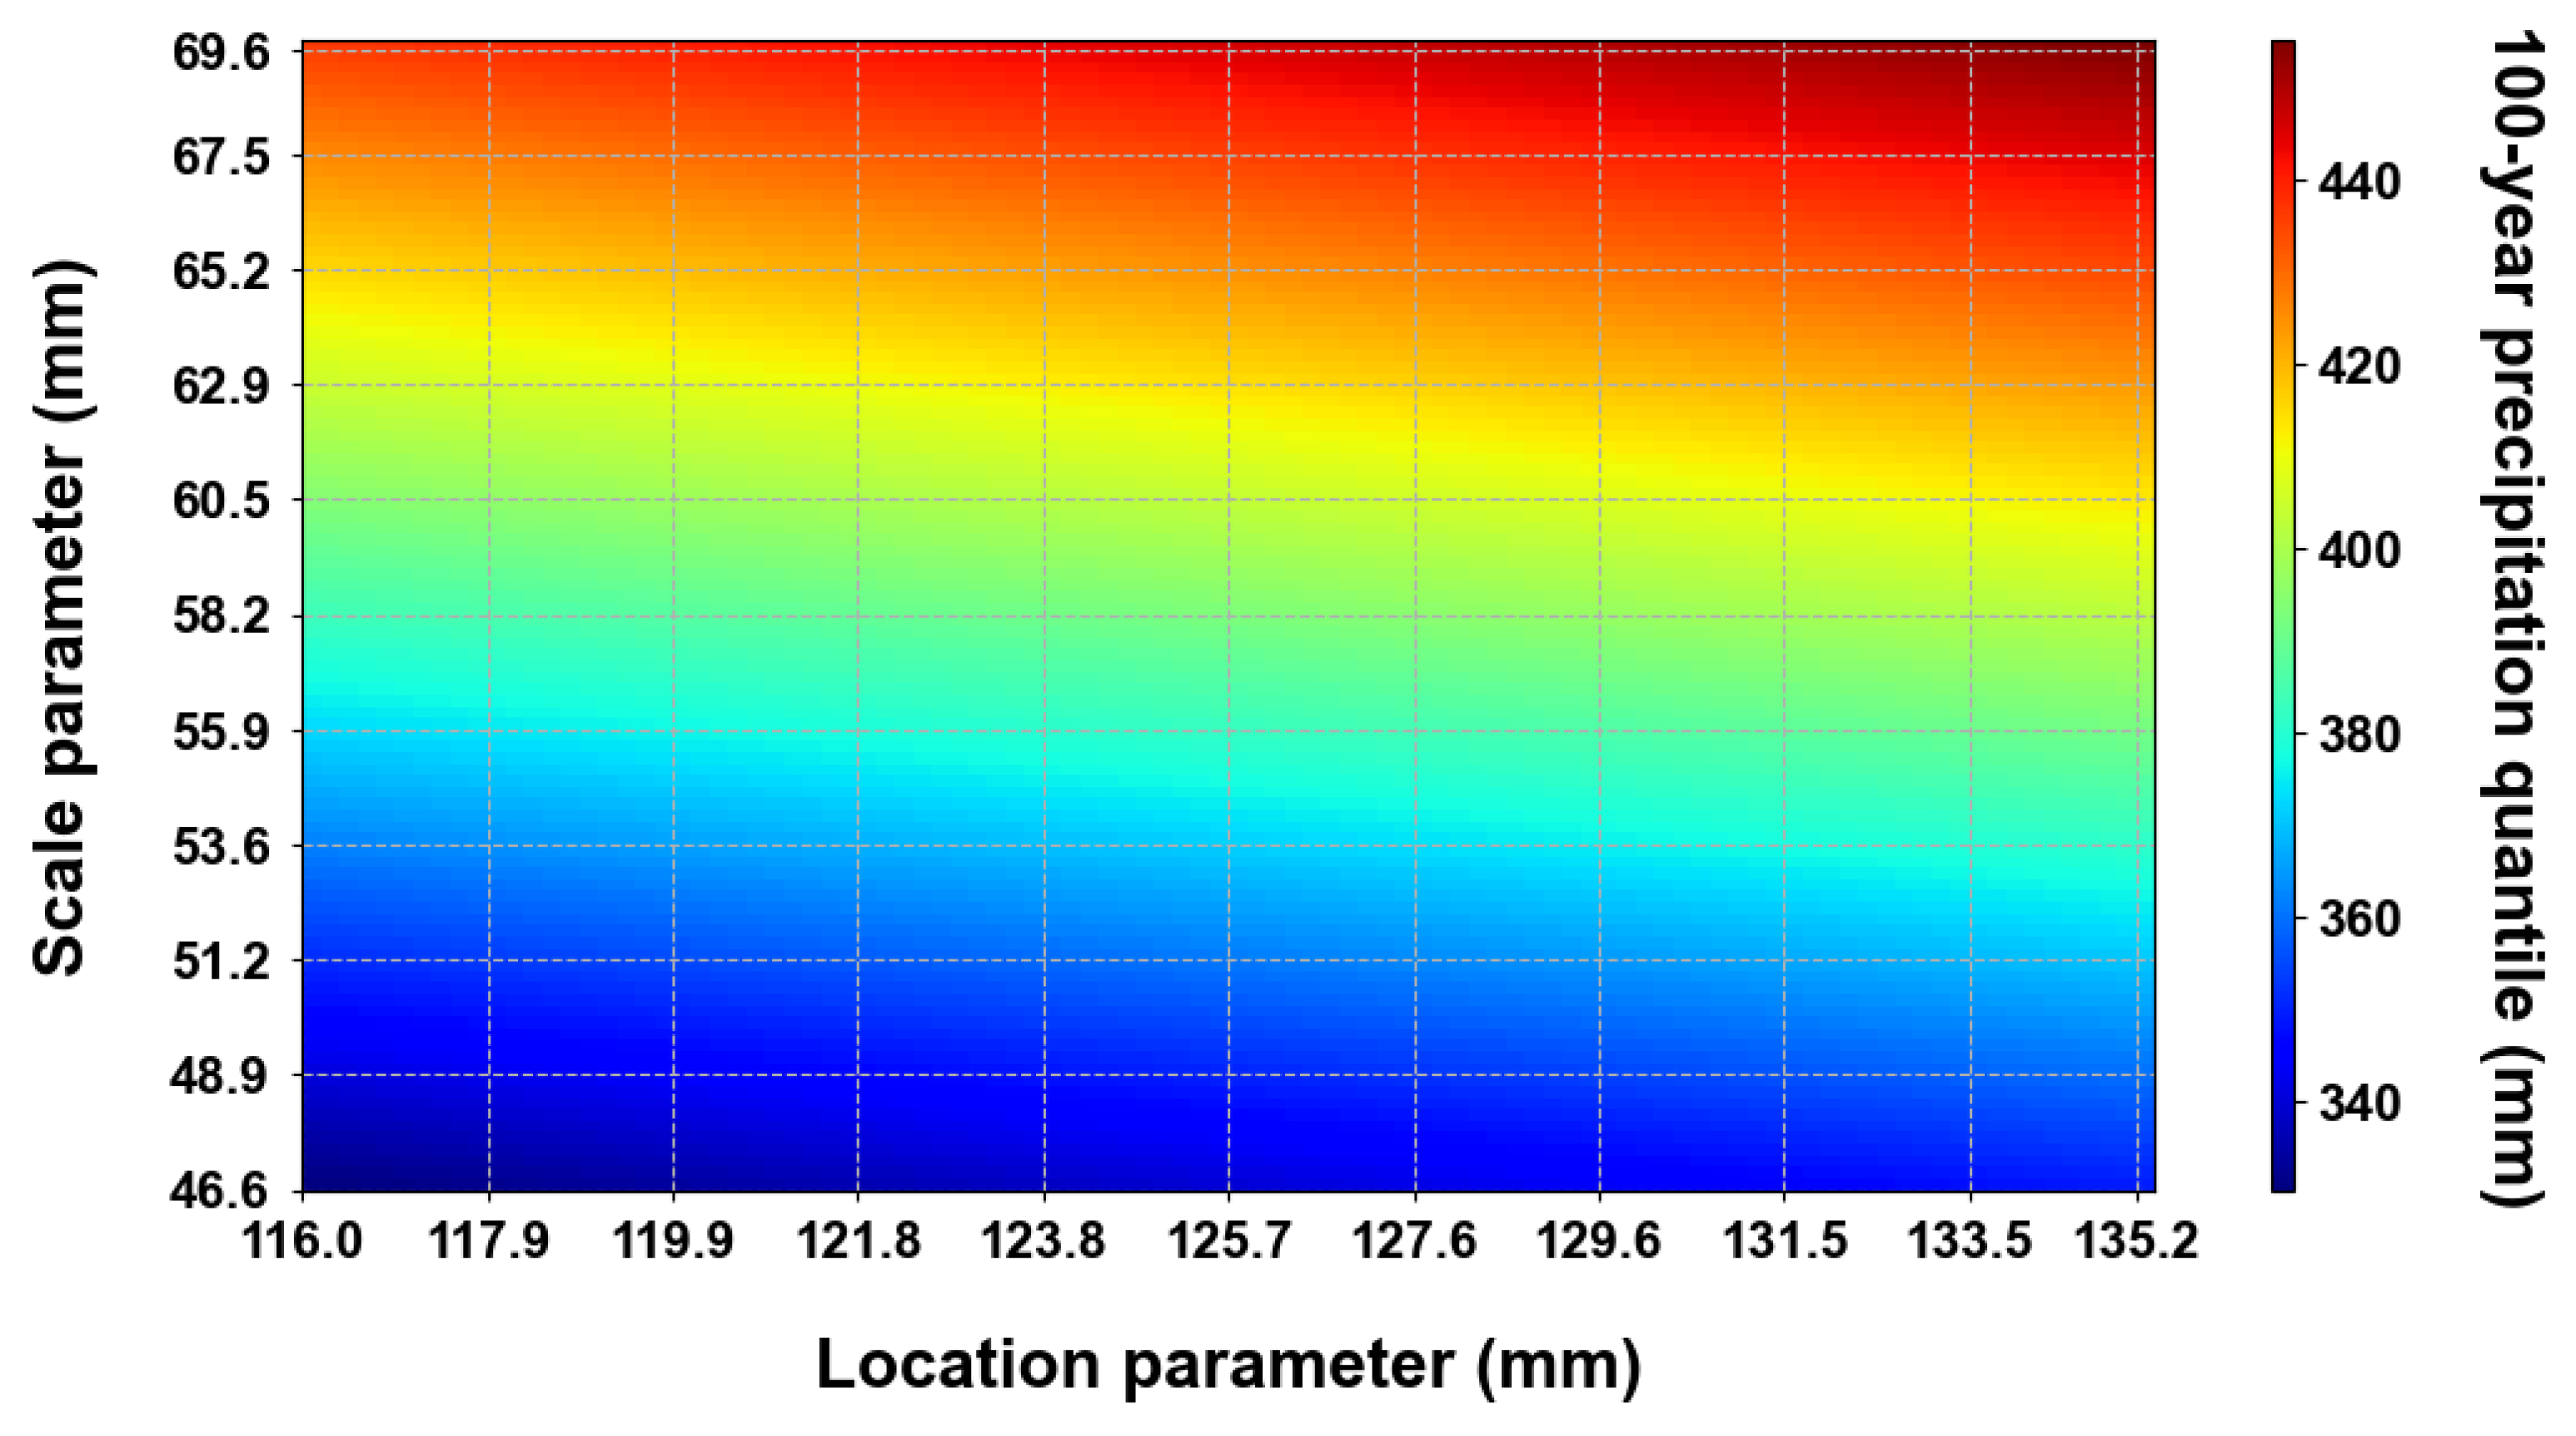
5. Discussion
First, the sensitivity of the parameters of the Gumbel distribution in estimating the probable precipitation quantile was analyzed. The average and standard deviation of the location parameter for the entire study area were 125.6 and 9.6 mm, respectively, while those of the scale parameter were 58.1 and 11.5 mm. Within the range of standard deviations, variations in the parameters were examined to look into changes in the 100-year probable precipitation quantile (
Figure 14). The maximum was found to be 455.4 mm, and the minimum was 330.4 mm. Additionally, as evident from the figure, the scale parameter appears to be more sensitive than the location parameter. A change (±
) in the location parameter under the same scale parameter resulted in a variation of approximately 19.2 mm in the 100-year probable precipitation amount. In contrast, a change (±
) in the scale parameter under the same location parameter led to a variation of around 105.8 mm in the 100-year probable precipitation quantile. The similarity between the results of the scale parameter and the 100-year probable precipitation quantile observed in
Section 4 is presumed to stem from these reasons.
The shape of the basin does not directly alter the absolute amount of precipitation. However, it can influence and be affected by the spatial distribution of precipitation and the manner in which water flows within a basin. In other words, the relationship between basin morphology, climate, and hydrological processes is highly complex and is affected by numerous factors.
Yi et al. [
39] observed that basins in dry climates tend to have a long and thin shape, regardless of their size. This finding somewhat aligns with the results of this study and indicates that the regional climate, particularly regional precipitation and potential evapotranspiration, can influence and be affected by the shape of the river basin. However, it is crucial to note that the absolute size or amount of precipitation is more directly impacted by other factors such as climate, altitude, and local geographic conditions.
Meanwhile, the complexity of river networks is influenced by a variety of factors, including precipitation patterns. However, the relationship between precipitation distribution and the complexity of river networks is not straightforward. River networks are dynamic systems that adapt to environmental changes, such as variations in precipitation. If precipitation were distributed evenly across a region, as suggested by the findings of this study, the flow of water within the river network could potentially be more uniform. This uniformity might lessen the variability in river flow and erosion patterns, potentially leading to a more homogeneous river network over time. Alternatively, if rainfall is uneven and certain areas within a basin experience more rainfall, this can result in increased erosion and fluctuation in stream flow. In such cases, the risk of sudden flooding can increase, posing a threat to the safety of dams. When evaluating the safety of dams, it is essential to adequately consider the findings of this study, such as the shape of the basin or the spatial variability of rainfall. Such variability can lead to more complex river networks, as different parts of the network respond differently to varying water flows and erosion patterns.
The complexity of a river network is also influenced by other factors such as the basic geology, topography, and vegetation of the area. These elements can interact with rainfall patterns to affect the development and evolution of river networks. Precipitation characteristics might influence differences in river networks, as shown in this study; the actual impact on river network complexity will be contingent upon a multitude of factors, including local geography and climatic conditions. Further research is likely required to fully comprehend this aspect.
In summary, the shape of the basin, the complexity of the river network, climate, geology, and rainfall, among other hydrological processes, intricately influence each other. Achieving a comprehensive understanding of the causal relationships in these aspects requires further research. Therefore, future studies should collect diverse cases from worldwide basins to conduct integrated research that clearly identifies independent and dependent variables.
6. Conclusions
GIS and RS technologies are potent tools for assessing different aspects of basin hydrology. They can be instrumental in comprehending basin hydrology for tasks like sub-basin prioritization, effective soil and water conservation measures, natural resource management, and flood risk analysis. In our study, we conducted morphological analysis on seven major dam basins in Korea, gathered long-term satellite-based precipitation data, computed probability precipitation, and explored the relationships between these elements. The findings of this study are summarized as follows.
(1) The study revealed that most of the major dam basins in Korea had a broad radial shape. Additionally, it was observed that these basins had a relatively high number of river branches, which is attributed to the influence of the mountainous topography.
(2) Indicators related to the shape of the basin and those related to the river network exhibited a very high correlation with each other. Among the basin shape-related indicators, it was found that the longer the basin (i.e., the larger the values of and ), the higher the circularity () tended to be.
(3) Upon calculating the probability precipitation and comparing it with morphological indices, it was established that the wider the basin, the greater the amount of precipitation and the more uniform its spatial distribution. Furthermore, it was observed that the more uniform the spatial distribution, the simpler the river network becomes. This trend intensifies in relation to the size of the basin over long durations, and in terms of spatial dispersion over short durations.
The findings of this study provided insights into the relationship between basin shape, probability precipitation, and river networks in Korea’s dam basins. However, it is crucial to note that precipitation patterns and the complexity of river networks are also influenced by other factors, including climate, altitude, and local geographical conditions. To fully comprehend this aspect, further research is necessary.


