

Temporal and Spatial Changes of Hydrographic Connectivity with the Development of Agriculture, Industry, and Urban Areas: A Case Study of the Yellow River Basin in Henan Province during the Last Two Decades


Abstract
:1. Introduction
2. Material and Methods
2.1. Study Area
2.2. Data Collection
2.3. Processing of Satellites Images
2.4. Hydrographic Connectivity Evaluation System Construction
2.4.1. Structural Connectivity Indicators Selection
2.4.2. Functional Connectivity Indicators Selection
3. Result and Discussion
3.1. Land Cover
3.2. Hydrographic Connectivity
3.3. Water Usage Distribution
4. Conclusions
Supplementary Materials
Author Contributions
Funding
Data Availability Statement
Conflicts of Interest
References
- Freeman, M.C.; Pringle, C.M.; Jackson, C.R. Hydrologic connectivity and the contribution of stream headwaters to ecological integrity at regional scales. J. Am. Water Resour. Assoc. 2007, 43, 5–14. [Google Scholar] [CrossRef]
- Pringle, C. What is hydrologic connectivity and why is it ecologically important? Hydrol. Process. 2003, 17, 2685–2689. [Google Scholar] [CrossRef]
- Bracken, L.J.; Wainwright, J.; Ali, G.A.; Tetzlaff, D.; Smith, M.W.; Reaney, S.M.; Roy, A.G. Concepts of hydrological connectivity: Research approaches, pathways and future agendas. Earth-Sci. Rev. 2013, 119, 17–34. [Google Scholar] [CrossRef]
- Liu, J.; Engel, B.A.; Zhang, G.; Wang, Y.; Wu, Y.; Zhang, M.; Zhang, Z. Hydrological connectivity: One of the driving factors of plant communities in the Yellow River Delta. Ecol. Indic. 2020, 112, 106150. [Google Scholar] [CrossRef]
- Turnbull, L.; Wainwright, J.; Brazier, R.E. A conceptual framework for understanding semi-arid land degradation: Ecohydrological interactions across multiple-space and time scales. Ecohydrology 2008, 1, 23–34. [Google Scholar] [CrossRef]
- Deng, X.; Xu, Y.; Han, L.; Song, S.; Xu, G.; Xiang, J. Spatial-temporal changes in the longitudinal functional connectivity of river systems in the Taihu Plain, China. J. Hydrol. 2018, 566, 846–859. [Google Scholar] [CrossRef]
- Cui, Y.; Xiao, R.; Zhang, M.; Wang, C.; Ma, Z.; Xiu, Y.; Wang, Q.; Guo, Y. Hydrological connectivity dynamics and conservation priorities for surface-water patches in the Yellow River Delta National Nature Reserve, China. Ecohydrol. Hydrobiol. 2020, 20, 525–536. [Google Scholar] [CrossRef]
- Dai, L.Y.; Zhang, Y.H.; Liu, Y.; Xie, L.M.; Zhao, S.Q.; Zhang, Z.M. Thick roots and less microaggregates improve hydrological connectivity. Chemosphere 2021, 266, 9. [Google Scholar]
- Lesschen, J.P.; Schoorl, J.M.; Cammeraat, L.H. Modelling runoff and erosion for a semi-arid catchment using a multi-scale approach based on hydrological connectivity. Geomorphology 2009, 109, 174–183. [Google Scholar] [CrossRef]
- Liu, C.X.; Chen, Y.N.; Fang, G.H.; Zhou, H.H.; Huang, W.J.; Liu, Y.C.; Wang, X.X.; Li, Z. Hydrological connectivity improves the water-related environment in a typical arid inland river basin in Xinjiang, China. Remote Sens. 2022, 14, 18. [Google Scholar] [CrossRef]
- Tan, Z.Q.; Li, Y.L.; Zhang, Q.; Liu, X.G.; Song, Y.Y.; Xue, C.Y.; Lu, J.Z. Assessing effective hydrological connectivity for floodplains with a framework integrating habitat suitability and sediment suspension behavior. Water Res. 2021, 201, 9. [Google Scholar] [CrossRef]
- Tian, N.; Zhang, Y.; Li, J.; Du, W.; Liu, X.; Jiang, H.; Bian, H. Evaluation and optimization of hydrological connectivity based on graph theory: A case study in Dongliao river basin, China. Water 2022, 14, 3958. [Google Scholar] [CrossRef]
- Ocallaghan, J.F.; Mark, D.M. The extraction of drainage networks from digital elevation data. Comput. Vis. Graph. Image Process. 1984, 28, 323–344. [Google Scholar] [CrossRef]
- Karim, F.; Kinsey-Henderson, A.; Wallace, J.; Arthington, A.H.; Pearson, R.G. Modelling wetland connectivity during overbank flooding in a tropical floodplain in north Queensland, Australia. Hydrol. Process. 2012, 26, 2710–2723. [Google Scholar] [CrossRef]
- Grimm, K.; Chu, X. Modeling of spatiotemporal variations in runoff contribution areas and analysis of hydrologic connectivity. Land. Degrad. Dev. 2018, 29, 2629–2643. [Google Scholar] [CrossRef]
- Feng, J.; Li, Q.; Liang, C.; Zhang, X.; Yue, Y.; Gao, J. Landscape index analysis of hydrological connectivity dynamics in the Yellow River Delta. J. Beijing Norm. Univ. Nat. Sci. 2021, 57, 12–21. [Google Scholar]
- Liu, X.; Zhang, Q.; Li, Y.; Tan, Z.; Werner, A.D. Satellite image-based investigation of the seasonal variations in the hydrological connectivity of a large floodplain (Poyang Lake, China). J. Hydrol. 2020, 585, 124810. [Google Scholar] [CrossRef]
- McFeeters, S.K. The use of the normalized difference water index (NDWI) in the delineation of open water features. Int. J. Remote. Sens. 1996, 17, 1425–1432. [Google Scholar] [CrossRef]
- Ding, F. A new method for fast information extraction of water bodies using remotely sensed data. Remote Sens. Technol. Appl. 2009, 24, 167–171. [Google Scholar]
- Yin, L.; Feng, X.; Fu, B.; Wang, S.; Wang, X.; Chen, Y.; Tao, F.; Hu, J. A coupled human-natural system analysis of water yield in the Yellow River basin, China. Sci. Total Environ. 2021, 762, 143141. [Google Scholar] [CrossRef]
- Chen, H.; Jeanne Huang, J.; McBean, E.; Singh, V.P. Evaluation of alternative two-source remote sensing models in partitioning of land evapotranspiration. J. Hydrol. 2021, 597, 126029. [Google Scholar] [CrossRef]
- Liao, Y.; Liao, Y.Q.; Zhao, W.J.; Chen, Q.H.; Li, T.; Yang, T.J. Study on mangrove of maximum likelihood: Reclassification method in Xiezhou bay. J. Coast. Res. 2020, 102, 334–343. [Google Scholar] [CrossRef]
- Xu, H. Modification of normalised difference water index (NDWI) to enhance open water features in remotely sensed imagery. Int. J. Remote. Sens. 2007, 27, 3025–3033. [Google Scholar] [CrossRef]
- Zhang, Y.; Huang, C.; Zhang, W.; Chen, J.; Wang, L. The concept, approach, and future research of hydrological connectivity and its assessment at multiscales. Environ. Sci. Pollut. Res. 2021, 28, 52724–52743. [Google Scholar] [CrossRef]
- Zhang, Z.; Yu, X.; Song, X.; Xue, Z.; Wu, H. Impacts of hydrological connectivity on key ecological processes and functions in wetlands: A general review. Wetl. Sci. 2019, 17, 1–8. [Google Scholar]
- GB3838-2002; Environmental Quality Standards for Surface Water. Ministry of Ecology and Environment of the People’s Republic of China: Beijing, China, 2002.
- GB5749-2006; Standards for Drinking Water Quality. State Administration for Market Regulation: Beijing, China, 2006.
- GB5084-2005; Standard for Irrigation Water Quality. Ministry of Ecology and Environment of the People’s Republic of China: Beijing, China, 2005.
- Wang, W.S.; Jin, J.L.; Ding, J.; Li, Y.Q. A new approach to water resources system assessment—Set pair analysis method. Sci. China Ser. E-Technol. Sci. 2009, 52, 3017–3023. [Google Scholar] [CrossRef]
- Wu, K.; Jin, J.; Wang, W. Combination evaluation model based on Set Pair analysis and Its application. Math. Pract. Theory 2013, 43, 1–6. [Google Scholar]
- Wang, W.S.; Li, Y.Q.; Jin, J. Relation analysis of hydrological variables based on Set Pair principle. J. Sichuan Univ. Eng. Sci. Ed. 2009, 41, 1–5. [Google Scholar]
- Jin, J.; Wei, Y.; Wang, W. Set pair analysis based on similarity forecast model of water resources. J. Hydroelectr. Eng. 2009, 28, 72–77. [Google Scholar]
- Niu, H.; Zhao, X.; Xiao, D.; An, R.; Liu, M. Spatial-temporal pattern evolution and trade-off relationship of cultivated land multifunction in the Yellow River Basin (Henan Section). Trans. Chin. Soc. Agric. Eng 2022, 38, 223–236. [Google Scholar]
- Li, A.; Xia, G.; Xu, J.; Yan, C. Analysis of the spatial and temporal variation of the lower yellow river channel before and after the operation of Xiaolangdi reservoir. J. Geomat. Sci. Technol. 2018, 35, 373–375+382. [Google Scholar]
- Chen, X.X.; Ye, S.; Pan, H.; Wang, J.; Ran, Q.H. The impacts of reservoir operation on river hydrological regime: A case study of Longyangxia reservoir and Xiaolangdi reservoir. Chin. Rural Water Hydropower 2022, 15, 96–104. [Google Scholar]
- Shao, Y.; Xu, Y.; Ma, S. Change of river structure and stream network connectivity in the Taihu lake basin under the unbanization development -a case study in urban Suzhou. Resour. Environ. Yangtze Basin 2012, 21, 1167–1172. [Google Scholar]
- Wei, H.; Zhang, Y.; Zhu, N.; Li, X. Temporal-spatial changes of farmland productivity in Henan province using MODIS data. Sci. Surv. Mapp 2014, 39, 67–71. [Google Scholar]
- Tao, J.; Qiao, W.Z.; Li, H.; Qu, X.N.; Gan, R. Spatial and temporal evolution characteristics and causes of drought and flood in the Henan section of the Yellow River. Nat. Hazards 2022, 113, 997–1016. [Google Scholar] [CrossRef]
- Wang, S.S.; Yang, J.Y.; Wang, A.L.; Yan, Y.F.; Liu, T.F. Coupled coordination of water resources-economy-ecosystem complex in the Henan section of the Yellow River basin. Water Supply 2022, 22, 8835–8848. [Google Scholar] [CrossRef]
- Cui, B.; Cai, Y.; Xie, T.; Ning, Z.; Hua, Y. Ecological effects of wetland hydrological connectivity: Problems and prospects. J. Beijing Norm. Univ. Nat. Sci. 2016, 52, 738–746. [Google Scholar]
- Yao, S.; Wu, D.; Yang, H.; Yang, W.; Feng, S.; Li, G. Preliminary study on problems and solutions in soil and water-environment of agricultural irrigation system in Henan province. J. Water Resour. Water Eng. 2010, 21, 35. [Google Scholar]
- Xu, F.; Shi, J.; Han, Y.; Zhao, H.; Wang, F. Evolution of water use structure and evaluation of spatial equilibrium in the Yellow river basin of Henan province. J. North Chin. Univ. Water Resour. Electr. Power (Nat. Sci. Ed.) 2023, 44, 41–48. [Google Scholar]
- Sun, S.; Tang, Q. Spatiotemporal patterns and driving factors of water resources use in the Yellow River Basin. Resour. Sci. 2020, 42, 2261–2273. [Google Scholar] [CrossRef]


| Parameters | Value | Parameters | Value |
|---|---|---|---|
| Sensor type | Landsat | Sensor height (km) | 705 |
| Pixel size (m) | 30 | Ground elevation (km) | 0.494 |
| Aerosol model | Suburban model | Atmospheric model | Midlatitude summer |
| Water vapor inversion | None | Aerosol retrieval | 2-Band (K-T) |
| Category | Indicator Name | Equation | Notes |
|---|---|---|---|
| Structural form indicators | Length of river (L) | L | Total length of rivers in the region |
| Water area (A) | Aw | Area occupied by all water surface under the average water level in the region | |
| Density of river network (Rd) | A: Total area of the region | ||
| Water surface rate (WP) | |||
| Connectivity form indicators | α index | n: Number of water systems in the river network v: Number of river network nodes | |
| β index | |||
| γ index |
| Target Layer | Guideline Layer | Indicator Layer | Notes |
|---|---|---|---|
| Natural Functions | Material–energy transfer | River breakage rate | The share of disconnected rivers in the water system |
| Water environment purification | Water quality compliance rate | Proportion of compliant watercourse length in the water system. | |
| Social Functions | Water allocation | Percentage of urban water supply | The proportion of surface water in urban water supply |
| Percentage of industrial water supply | The proportion of surface water in industrial water use | ||
| Percentage of agricultural water supply | The proportion of surface water in agricultural water use |
| Indicator Layer | Excellent | Good | Medium | Poor |
|---|---|---|---|---|
| River breakage rate | 10% | 30% | 60% | 100% |
| Water quality compliance rate | 95% | 60% | 40% | 20% |
| Percentage of urban water supply | 100% | 90% | 80% | 70% |
| Percentage of industrial water supply | 40% | 20% | 10% | 5% |
| Percentage of agricultural water supply | 80% | 60% | 30% | 10% |
| 2000 (km2) | 2005 (km2) | 2010 (km2) | 2015 (km2) | 2020 (km2) | |
|---|---|---|---|---|---|
| Built-up land | 1176.91 | 2408.96 | 2725.57 | 4403.19 | 3762.83 |
| Unused land | 2344.59 | 2198.56 | 2092.83 | 2547.14 | 1537.43 |
| Forests | 286.97 | 1423.29 | 2249.70 | 1598.02 | 1022.06 |
| Agricultural land | 15,854.78 | 13,706.31 | 12,734.67 | 11,435.36 | 12,274.25 |
| Reservoirs/lakes | 65.59 | 277.19 | 332.02 | 122.24 | 114.73 |
| Rivers | 677.88 | 377.408 | 260.38 | 283.57 | 394.55 |
| Total | 20,406.70 | 20,391.72 | 20,395.17 | 20,389.52 | 19,105.84 |
| 2000 | 2005 | 2010 | 2015 | 2020 | |
|---|---|---|---|---|---|
| River network Density Rd | 0.042 | 0.055 | 0.060 | 0.055 | 0.073 |
| River network Nodes V | 12 | 14 | 19 | 17 | 27 |
| α | 0.37 | 0.22 | 0.09 | 0.07 | 0.08 |
| β | 1.50 | 1.29 | 1.11 | 1.06 | 1.11 |
| γ | 0.60 | 0.50 | 0.41 | 0.40 | 0.40 |
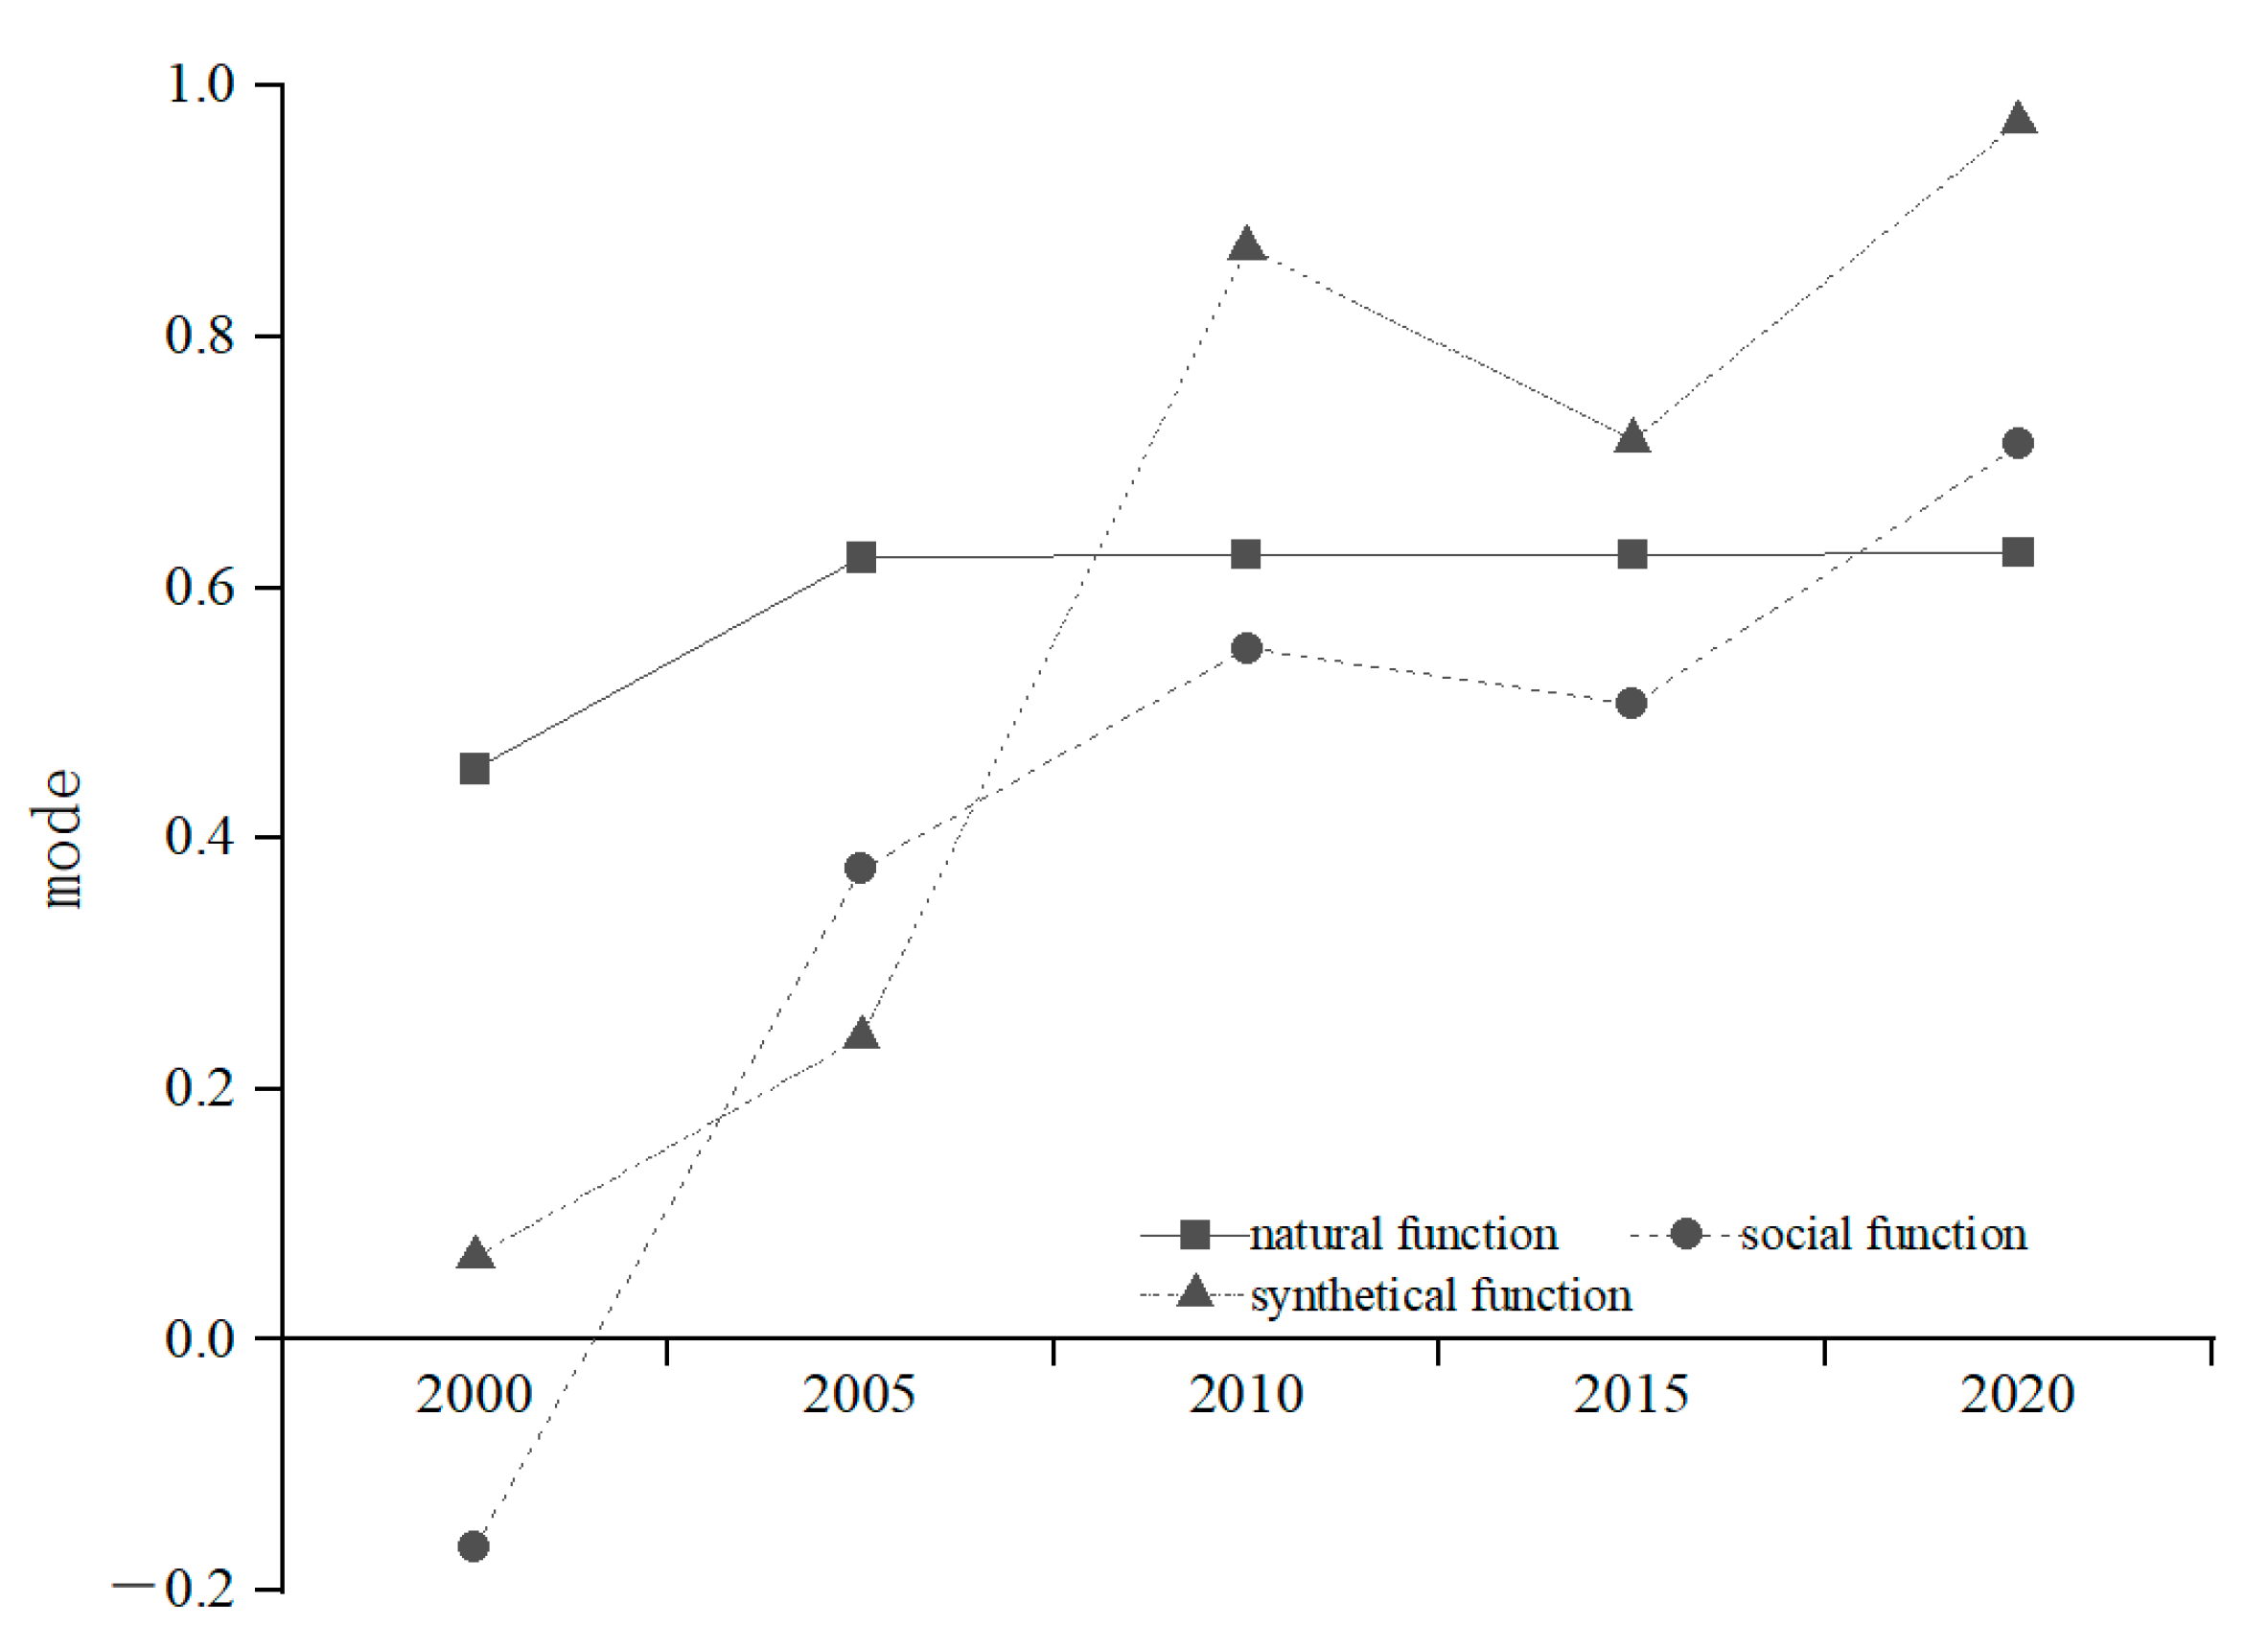
| Target Layer | 2000 | 2005 | 2010 | 2015 | 2020 | |||||
|---|---|---|---|---|---|---|---|---|---|---|
| Main Value | Grade | Main Value | Grade | Main Value | Grade | Main Value | Grade | Main Value | Grade | |
| Natural function | 0.46 | Medium | 0.62 | Good | 0.63 | Good | 0.63 | Good | 0.63 | Good |
| Social function | −0.17 | Poor | 0.38 | Medium | 0.55 | Good | 0.51 | Medium | 0.71 | Good |
| Integrated functions | 0.07 | Medium | 0.24 | Medium | 0.87 | Good | 0.72 | Good | 0.97 | Excellent |
Disclaimer/Publisher’s Note: The statements, opinions and data contained in all publications are solely those of the individual author(s) and contributor(s) and not of MDPI and/or the editor(s). MDPI and/or the editor(s) disclaim responsibility for any injury to people or property resulting from any ideas, methods, instructions or products referred to in the content. |
© 2023 by the authors. Licensee MDPI, Basel, Switzerland. This article is an open access article distributed under the terms and conditions of the Creative Commons Attribution (CC BY) license (https://creativecommons.org/licenses/by/4.0/).
Share and Cite
Li, Z.; Wei, C.; Zhou, J.; Yang, F. Temporal and Spatial Changes of Hydrographic Connectivity with the Development of Agriculture, Industry, and Urban Areas: A Case Study of the Yellow River Basin in Henan Province during the Last Two Decades. Water 2023, 15, 4245. https://doi.org/10.3390/w15244245
Li Z, Wei C, Zhou J, Yang F. Temporal and Spatial Changes of Hydrographic Connectivity with the Development of Agriculture, Industry, and Urban Areas: A Case Study of the Yellow River Basin in Henan Province during the Last Two Decades. Water. 2023; 15(24):4245. https://doi.org/10.3390/w15244245
Chicago/Turabian StyleLi, Zhiying, Chaoyang Wei, Jianli Zhou, and Fen Yang. 2023. "Temporal and Spatial Changes of Hydrographic Connectivity with the Development of Agriculture, Industry, and Urban Areas: A Case Study of the Yellow River Basin in Henan Province during the Last Two Decades" Water 15, no. 24: 4245. https://doi.org/10.3390/w15244245
APA StyleLi, Z., Wei, C., Zhou, J., & Yang, F. (2023). Temporal and Spatial Changes of Hydrographic Connectivity with the Development of Agriculture, Industry, and Urban Areas: A Case Study of the Yellow River Basin in Henan Province during the Last Two Decades. Water, 15(24), 4245. https://doi.org/10.3390/w15244245