Abstract
Moisture plays a pivotal role in the establishment of vegetation in sandy areas, underscoring the need to comprehend the water utilization strategies employed by established trees for the judicious use of water resources. Despite this significance, there exists a research gap concerning the water uptake patterns and consumption disparities between the dominant trees, namely the dry willow (Salix matsudana) and small-leafed poplar (Populus simonii), in the Mu Us sandy region. Consequently, our study sought to investigate the water utilization patterns and transpiration water consumption of these two plants. This was achieved through the analysis of hydrogen and oxygen isotope compositions in xylem water, soil water, and groundwater, coupled with the assessment of stem flow rates of tree trunks. The findings reveal that both Salix matsudana and Populus simonii exhibited variations in soil water content with soil depth, characterized by an initial increase followed by a subsequent decrease. During the months of July, August, and September, both species demonstrated the ability to absorb water from multiple sources concurrently. Specifically, Salix matsudana and Populus simonii predominantly utilized middle and shallow soil water sources in July and September, respectively. However, in August, both species primarily relied on shallow soil water for absorption. Over the period from July to September, the sap flow rate of Salix matsudana surpassed that of Populus simonii by 1888.2 mL·h−1 to 2499.04 mL·h−1, representing a 1.5 to 2.2 times increase. This underscores the necessity for Salix matsudana to draw water from middle and deep soil layers to compensate for shallow water deficits. In summary, schemes for the establishment of vegetation in sandy areas should consider the dynamic nature of water uptake and evapotranspiration, emphasizing the importance of regulating these processes for efficient water conservation and utilization.
1. Introduction
In arid and semi-arid regions, the structure and function of ecosystems, as well as the physiological characteristics and spatial distribution of plants, are profoundly influenced by water availability [1,2]. Vegetation, as a vital component of the ecosystem, plays a crucial role in the regional water cycle [3]. Adaptations to the scarcity of rainfall in arid areas lead plants to employ various water use strategies for survival [4]. In response to seasonal water shortages or prolonged precipitation deficits, deep-rooted plants may absorb water from deep soil layers or groundwater to cope with or evade drought conditions [5]. However, inappropriate plant water uptake can result in soil water deficits and even disrupt the balance of the entire ecosystem. Therefore, understanding the water use patterns of artificial vegetation in arid areas, assessing the utilization rate of potential water sources by vegetation under varying water conditions, elucidating the water use and competition dynamics among different vegetation types in the same ecosystem, and comprehending the characteristics of vegetation transpiration stem flow are essential for optimizing water resource utilization and promoting rational water use.
The advancement of stable isotope technology, particularly the application of stable isotopes of hydrogen and oxygen as natural tracers, has emerged as a valuable method for examining plant water sources. This technology has been widely utilized to identify and quantify the contribution rates of different water sources to plant water absorption [6,7]. Plant roots absorb water in a mixture from various sources without isotope fractionation during the uptake process [8]. Comparative analysis of hydrogen and oxygen isotopes in plant xylem and different water sources enables the confirmation of the absorption and utilization of diverse water sources by plants [9]. Researchers such as Rothfuss and Javaux [6] and West [10], have successfully employed stable isotopes of hydrogen and oxygen for water traceability in various ecosystems and regions. Wang [11] utilized this technique to investigate water use patterns in plants in arid and semi-arid regions, determining that the contribution of soil water sources to plants can be estimated through a two-layer or three-layer mixed model. McCole and Stern [12] applied a two-layer mixed model to examine juniper water supply in different seasons in central and southern Texas, revealing that juniper primarily used groundwater in dry and hot seasons and soil water in cold and wet seasons. Other studies, such as those by Darrouzet-Nardi [13], have leveraged δ18O values to discern that sage in the southern Nevada Mountains predominantly utilizes deeper water than most herbaceous plants but also acquires 10–30% of water from shallow (<30 cm) soil. Ding [14] and McCole and Stern noted that, when shallow soil water supply is insufficient, deep-rooted trees and shrubs may resort to absorbing deep soil water or groundwater, whereas shallow-rooted plants like herbs primarily rely on shallow soil water throughout the growing season. Furthermore, many plants in arid and semi-arid regions exhibit dimorphic roots, allowing them to switch between shallow and deep water sources depending on water availability [15].
Water use patterns among different plants are additionally influenced by variations in soil moisture and plant transpiration water demand. Jackson’s study, for instance, discovered that the tropical rainforest in Barro Colorado adapts to dry seasons by acquiring deep soil water, while it relies on shallow soil water during the rainy season, even increasing transpiration water consumption in the dry season [16]. Similarly, Schwendenmann investigated seasonal water uptake patterns of trees in an experimental plantation in central Panama and found that trees capable of utilizing deep soil water maintained higher transpiration rates during the dry season [17].
The Mu Us sandy land represents a typical arid and semi-arid region where seasonal drought is prevalent. This phenomenon is primarily attributed to the dry climate, decreased rainfall, and the excessive planting of high-water-consuming plants. The cumulative effect of these factors results in the seasonal fluctuation of groundwater levels, progressively declining year by year. The diminishing soil water supply and water scarcity have emerged as critical constraints to the ecological restoration and sustainable development of vegetation in the Mu Us sandy land [18].
Although recent years have witnessed an increase in research on plant water sources in the Mu Us sandy land, much of this work has focused on native vegetation such as Artemisia ordosica, Juniperus sabina, and Salix matsudana [19]. However, there remains a notable gap in understanding how artificial vegetation utilizes soil water and groundwater, particularly the impact of transpiration water consumption in areas characterized by shallow groundwater depths. Therefore, an investigation into the root water absorption sources and transpiration water consumption patterns of typical artificial vegetation, namely Salix matsudana and Populus simonii, in the Mu Us sandy land is imperative to enhance water resource utilization efficiency and promote the sustainability of ecological restoration in this region [20].
In this study, the Mu Us sandy land served as the research focus. The stable isotope technique and stem flow method were employed to examine variations in water absorption, utilization, and transpiration water consumption by Salix matsudana and Populus simonii at different temporal intervals. The objectives of this study are threefold: (1) to quantitatively analyze the relative contribution rates of different water sources to the water absorption of Salix matsudana and Populus simonii by measuring stable isotope ratios of hydrogen (δ2H) and oxygen (δ18O) in plant xylem water, soil water, and groundwater; (2) to determine the patterns of transpiration water consumption by Salix matsudana and Populus simonii through the measurement of stem flow rates; and (3) to elucidate the differences in water sources and transpiration water consumption between Salix matsudana and Populus simonii at various time points. The outcomes of this study are expected to offer valuable insights for the development of artificial sand-fixing vegetation and the judicious allocation of groundwater resources in the Mu Us sandy land.
2. Materials and Methods
2.1. Overview of the Study Area
This study was conducted at Meilin Temple (109°22′59″ E, 38°50′44″ N) in Wushen Banner, Ordos City, Inner Mongolia Autonomous Region, situated in the heart of the Mu Us sandy land at an average altitude of 1100 m (refer to Figure 1). The region experiences a semi-arid continental monsoon climate, characterized by an annual average temperature of 6.8 °C, annual sunshine duration ranging from 2800 to 3000 h, an effective accumulated temperature between 2800 and 3000 °C, and an average annual rainfall of 358.2 mm. Precipitation is predominantly concentrated in the months of July to September, accounting for over 70% of the annual precipitation. The annual evaporation rate ranges from 2200 to 2800 mm, the average annual wind speed is 3.4 m/s, and the frost-free period spans 113 to 156 days.
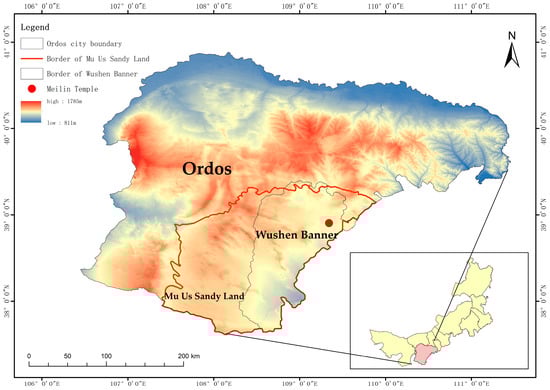
Figure 1.
Study area location map.
The soil particle composition in the study area is relatively uniform throughout the soil profile of 0–210 cm (see Table 1). The predominant landform type consists of fixed and semi-fixed dunes, and the soil type is characteristic of aeolian sandy soil. The groundwater level in the study area is relatively shallow, typically remaining around 4 m from the surface, providing a potential water source for vegetation growth. The age of Salix matsudana and Populus simonii in the study area is 16 years. Salix matsudana stands at a height of 5.8 m with a diameter at breast height of 12.2 cm and a crown width of 3.2 m2. Populus simonii measures 8.6 m in height, 13.1 cm in diameter at breast height, and has a crown width of 2.8 m2.

Table 1.
Basic physical and chemical properties of the studied soils.
2.2. Sample Collection and Determination
2.2.1. Experimental Sample Collection
During the peak plant growth season from July to September 2022, we conducted monthly collections of soil water, plant xylem, and groundwater samples. At each sampling date, soil samples were obtained using a spiral drill (diameter = 6 cm, height = 40 cm) positioned 1 m away from Salix matsudana and Populus simonii. The sampling depths were categorized as follows: 0–30 cm, 30–60 cm, 60–90 cm, 90–120 cm, 120–150 cm, 150–180 cm, and 180–210 cm. Three soil samples were collected from each soil layer of each tree, once a month, and a total of 126 soil samples were collected for 3 months. The collected soil samples underwent a dual partitioning process: one portion was placed in a glass bottle with a spiral cap, enveloped in polyethylene (Parafilm) sealing film, and stored in a refrigerator at −20 °C until water extraction, while the other part was loaded into an aluminum box for soil water content (SWC) determination.
Simultaneously, plant xylem samples were gathered on each sampling date. Healthy twigs from each plant, fully exposed to sunlight and situated at different positions in the canopy, were collected on sunny mornings between 9:00 and 12:00. To prevent contamination of xylem samples by isotope-rich phloem tissue, the sampled twigs underwent the removal of phloem tissue [4]. The collected twig segments (3–5 cm each) were promptly placed in glass bottles with threaded caps, sealed with polyethylene (Parafilm) film, and rapidly transferred to a refrigerator at −20 °C for subsequent isotope analysis. Three plant samples were collected from each tree every month, and a total of 18 plant samples were collected in 3 months. Groundwater samples were extracted from the groundwater observation well (diameter = 11 cm) located 5 m from the sampling point. The timing, frequency, and storage of groundwater samples were synchronized with the collection of soil and plant xylem samples. Temperature and precipitation data were recorded using a small weather station (Campbell Scientific, Utah, USA) installed in the study area.
2.2.2. Measurement of Soil Water Content
The aluminum box, employed for determining soil water content, underwent a two-step process. Initially, it was placed on an electronic balance and weighed. Subsequently, the box was transferred to a constant temperature blast drying oven and dried until reaching a constant weight at 105 °C. The calculation of soil water content utilized Formula (1):
This formula provides the percentage of water content in the soil based on the weight difference before and after drying. In the formula, is soil water content (%), and and are soil wet weight and soil dry weight, respectively.
Based on the depth and seasonal variation characteristics of soil water content (), the soil moisture profiles of Salix matsudana and Populus simonii were categorized into three levels: 0–60 cm was strongly affected by soil evaporation and precipitation, and was classed as shallow soil water. The of the 60~150 cm soil layer changed greatly and the activity was strong; this was considered middle soil water. The variation of in the 150–210 cm soil layer was small and the activity was stable, and this region was classed as deep soil water.
- Shallow depth: 0~60 cm
- Middle depth: 60~150 cm
- Deep depth: 150~210 cm
This classification allows for a nuanced understanding of the moisture distribution at different soil depths, aiding in the analysis of the water absorption patterns and requirements of Salix matsudana and Populus simonii across various levels in the soil profile.
2.2.3. Analysis of Hydrogen and Oxygen Isotope Sample Measurement
The plant xylem water and soil water were extracted using a low-temperature vacuum condensation extraction system (L1-2100 type, LICA United Technology Limited, BeiJing, China) [1]. The plant xylem water, soil water, and groundwater were filtered through a size 0.22 μm filter, and the hydrogen and oxygen isotope values were determined by utilizing a liquid water isotope analyzer (TLWIA-921, LICA United Technology Limited, Beijing, China) [2].
δ2H(‰) = 1000 × [(Rsample/Rstandard) − 1]
δ18O(‰) = 1000 × [(Rsample/Rstandard) − 1]
Here, δ2H and δ18O are the hydrogen and oxygen isotope ratios of the corresponding samples, respectively. Rsample and Rstandard are the ratios of abundance of heavy and light isotopes of elements in the samples according to international common standards (such as 18O/16O), respectively. The accuracy of δ18O/16O is better than 0.1‰, and 2H/H is better than 0.3‰. The test error of the δ2H value is less than 1‰, and the test error of the δ18O value is less than 0.2‰.
The MixSIAR model was used to quantify the proportion of water absorption:
δX = C1δX1 + C2δX2 + C3δX3 + C4δX4 + C5δX5 + C6δX6 + C7δX7
c1 + c2 + c3 + c4 + c5 + c6 + c7 = 1
In the formula, X is the 2H/18O value (‰) of the tree branch water; and X1, X2, X3, X4, X5, X6, and X7 are the 2H/18O values of soil water at depths of 0~30, 30~60, 60~90, 90~120, 120~150, 150~180, 180~210 cm, respectively. In the formula, C1, C2, C3, C4, C5, C6, C7 represent the absorption ratio of trees for 0~30, 30~60, 60~90, 90~120, 120~150, 150~180, 180~210 cm soil water, respectively.
2.2.4. Measurement of Transpiration Sap Flow
Stem flow density was determined using the Granier thermal diffusion probe method [21]. The trunks of Salix matsudana and Populus simonii, located at a height of 1.3 m, were meticulously polished with sandpaper. A pair of Granier thermal diffusion probes, each with a length of 2 cm and a diameter of 2 mm, were inserted into the sapwood at intervals of 10 cm and sealed with silica gel. To mitigate the impact of solar radiation and rain, aluminum foil was wrapped around the trunk at the probe installation site [22].
The emitted signals from the stem flow probe were scanned every 60 s, and the data recorder (Delta-T, Cambridge, UK) recorded the average value over 30 min intervals. It is noteworthy that, in this study, azimuthal and radial changes in stem flow within the tree were not considered, given that each sampled tree was equipped with only one pair of probes. The monitoring period aligned with the experimental sample collection time, spanning from July to September 2022. Stem flow density and stem flow were calculated using Formula (5), below. This calculation provides insight into the density of stem flow per unit area of the stem cross-section, contributing to a quantitative understanding of water transport dynamics in Salix matsudana and Populus simonii during the specified monitoring period.
In the formula, 3600 is the unit conversion coefficient, is sap flow density (mL/cm2·h), is the maximum temperature difference between day and night, and is the instantaneous temperature difference.
In the formula, is stem flow (mL·h−1), and is the sapwood area at (cm2).
The sapwood area of the whole sample tree was calculated by using the growth cone drill to sample the xylem of the tree to determine the sapwood thickness. The calculation formula is as follows:
where is the diameter at breast height (cm) of the tree, d is bark thickness (cm), and r is the radius of heartwood (cm).
2.2.5. Data Processing
SPSS27.0 software was used to linearly fit the plant water and soil water of Salix matsudana and Populus simonii. Then, using ArcGIS10.2 version to draw the general map of the study area. Origin2018 software was used to plot and analyze the temperature and rainfall, the soil water content of Salix matsudana and Populus simonii, the changes of hydrogen and oxygen isotopes, and the changes of stem flow rate. Finally, based on R software (v.4.1.2, R Core Team, 2021), the MixSIAR model was used to analyze the water use from each soil layer by Salix matsudana and Populus simonii.
Through the above processing results, the transpiration water consumption characteristics and water use patterns of Salix matsudana and Populus simonii were analyzed, and then the differences between the two were compared.
2.2.6. Flowchart for Methodology
According to the process of the experiment in this study, the flow chart of the method is drawn(refer to Figure 2).
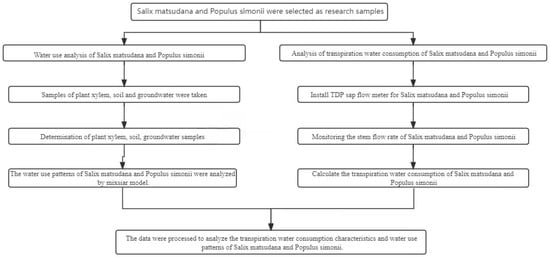
Figure 2.
Experimental procedure flow chart.
3. Results
3.1. Temperature and Rainfall
The temporal variations in temperature and rainfall from July to September 2022 are summarized as follows(refer to Figure 3). The peak values for monthly temperature and precipitation both occurred in July. Temperature fluctuated above 20 °C until August 22, after which it exhibited a declining trend, settling around 15–20 °C. Cumulatively, the observed precipitation during the entire monitoring period was 271.7 mm, with a predominant concentration in July and August, accounting for 96.7% of the total precipitation. Specifically, July experienced 117.6 mm of precipitation, and August witnessed 145.4 mm. The highest daily precipitation was recorded on July 11, reaching 43.6 mm. These weather patterns and precipitation levels provide context for understanding the environmental conditions during the study period, essential for interpreting the observed dynamics in soil moisture, plant water utilization, and transpiration.
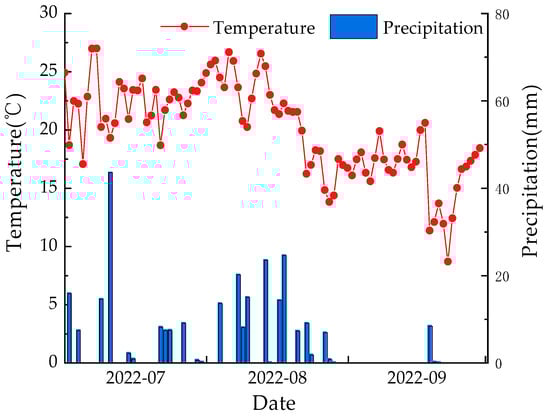
Figure 3.
Variation characteristics of temperature and precipitation during monitoring period.
3.2. Changes of Soil Water Content
The monthly soil water content for Salix matsudana and Populus simonii exhibited a pattern of initial increase followed by a decrease with changes in soil depth(refer to Figure 4). Following a heavy rainfall event (P = 43.6 mm) in July, soil water content increased, along with an increase in infiltration depth. Consequently, the soil water content for Populus simonii and Salix matsudana reached its maxima at 120 and 150 cm, respectively, registering values of 5.02% and 4.86%. These figures were 1.86% and 1.70% higher than the average value of 3.16%. Subsequently, soil water content began to decrease.
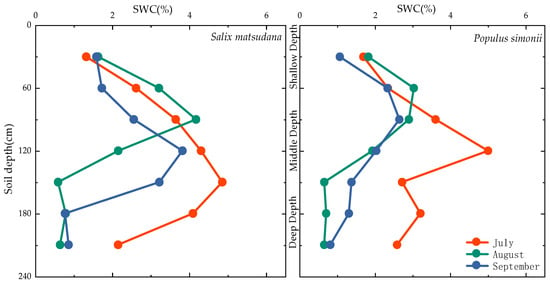
Figure 4.
Variation characteristics of soil water content in Salix matsudana and Populus simonii.
In August, despite higher overall rainfall, individual rainfall events were smaller, resulting in increased soil moisture content but with a shallower infiltration depth. Populus simonii and Salix matsudana achieved their respective maxima at 60 and 90 cm, recording values of 4.18% and 3.05%. These figures were 2.4% and 1.27% higher than the average value of 1.78%. Following this period, soil moisture content decreased with increasing depth, with a significant decline observed below 150 cm.
In September, characterized by reduced rainfall, the soil water content of Populus simonii and Salix matsudana decreased overall. The maxima were recorded at 90 and 120 cm, with values of 3.82% and 2.66%, respectively. These figures represented increases of 1.95% and 0.79%, respectively, compared with the average value of 1.87%. Overall, soil moisture content exhibited minimal change in the shallow soil layer (0–60 cm) but displayed pronounced variations in the middle depth layer (60–150 cm). In the deep soil layer below 150 cm, the range of change decreased, and water content began to decrease significantly.
3.3. Composition of Xylem Water, Soil Water, and Groundwater in Salix matsudana and Populus simonii
The δ18O and δ2H of plant xylem water were different with regards to time(refer to Figure 5). In the months of July, August, and September, the distribution of δ18O values of the xylem moisture in Salix matsudana ranged from −4.27‰ to 4.89‰, −4.24‰ to −3.26‰, and −3.82‰ to 3.35‰, with average values of −0.59‰, −4.04‰, and 0.95‰, respectively. Theδ2H values were distributed between −41.01‰ and −17.76‰, −35.20‰ and −31.50‰, −48.88‰ and −27.89‰; and the average values were −30.78‰, −33.69‰ and −40.32‰, respectively. In the months of July, August, and September, the distribution of δ18O values of Populus simonii wood moisture ranged from −3.51‰ to 1.29‰, −3.98‰ to 5.70‰, and 3.03‰ to 13.80‰, with average values of −1.00‰, −0.22‰, and 8.33‰, respectively. The δ2H values were distributed between −41.39‰ and −4.06‰, −40.76‰ and −20.02‰, and −53.89‰ and −40.91‰, with average values of −28.26‰, −32.31‰, and −48.44‰, respectively. The average value of δ18O in xylem water of Salix matsudana followed the pattern September > July > August, the pattern for the average value of δ18O in xylem water of Populus simonii was September > August > July, and that for the average value of δ2H in xylem water of both was July > August > September. The δ18O and δ2H values of xylem water in Salix matsudana and Populus simonii were linearly correlated, and the slopes of the plant water line (PWL) in July, August, and September were 1.40–2.77 and 2.20–2.79, respectively.
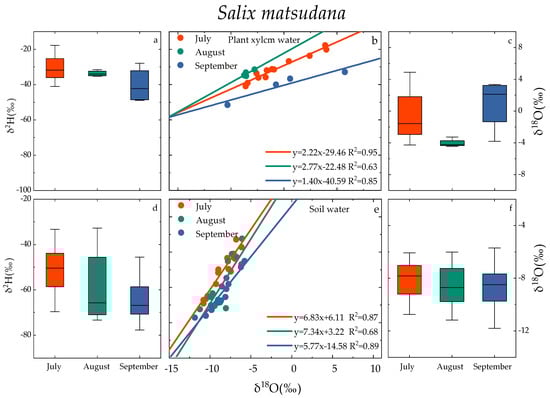
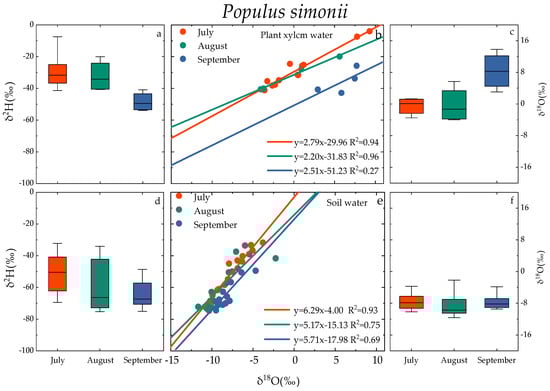
Figure 5.
Variation characteristics of xylem water (a–c) and soil water (d–f) in Salix matsudana and Populus simonii. Note: The scatter plot and box plot show the isotopic composition of xylem water and soil water of Salix matsudana and Populus simonii in July, August, and September. Box plots show the median values (black line in box), interquartile range (extent of the box), and range of data (whiskers).
The isotopic composition of soil moisture was also different with regards to time (Figure 3). In the months of July, August, and September, the δ18O values of soil moisture in Salix matsudana were −8.41 ± 2.33‰, −8.57 ± 2.61‰, and −8.60 ± 3.21‰, respectively. The δ2H values were −51.27 ± 18.36‰, −59.68 ± 13.66‰, and −64.20 ± 13.52‰, respectively. The δ18O values of soil moisture for Populus simonii in July, August, and September were −7.53 ± 2.62‰, −8.51 ± 3.10‰, and −7.99 ± 1.44‰, respectively. The corresponding δ2H values were −51.41 ± 18.06‰, −59.14 ± 14.84‰, and −63.58 ± 11.50‰. The changes of δ18O and δ2H values of soil water in Salix matsudana and Populus simonii were similar in July, August, and September. The soil water line (SWL) fitted by δ18O and δ2H linear regression showed that the SWL slope of Salix matsudana from July to September was in the range of 5.77~7.34, and the SWL slope of Populus simonii from July to September was in the range of 5.17~6.29.
The δ18O value of groundwater from July to September was between −9.40‰ and −8.57‰, and the δ2H value was between −57.05‰ and −55.80‰, which is relatively stable compared with plant xylem water and soil water.
3.4. Seasonal Variation of Water Use Patterns of Salix matsudana and Populus simonii
During the measurement period, distinct changes in the soil profile water use patterns of Salix matsudana and Populus simonii were observed in July, August, and September (refer to Figure 6). In July, Salix matsudana primarily sourced water from the shallow layer (29.7%), middle layer (33.5%), deep layer (18.5%), and groundwater (18.3%). The highest water contribution rate was observed in the 60~90 cm layer, accounting for 15.7% of the total. In August, Salix matsudana predominantly utilized water from the shallow layer (52.8%), middle layer (19.1%), deep layer (13.6%), and groundwater (14.5%). The highest water contribution rate occurred in the 30~60 cm layer, constituting 16.7% of the total. In September, Salix matsudana obtained water from the shallow layer (24.3%), middle layer (34.5%), deep layer (16.4%), and groundwater (24.8%). The highest water contribution rate was observed in the 60~90 cm layer, accounting for 16.4% of the total. For Populus simonii in July, the major water sources were the shallow layer (40.3%), middle layer (25.4%), deep layer (18.1%), and groundwater (16.1%). The highest water contribution rate occurred in the 0~30 cm layer, constituting 14.6% of the total. In August, Populus simonii primarily utilized water from the shallow layer (58.3%), middle layer (15.8%), deep layer (11.3%), and groundwater (14.7%). The highest water contribution rate was observed in the 30~60 cm layer, constituting 18.4%. In September, Populus simonii sourced water from the shallow layer (32.7%), middle layer (22.3%), deep layer (18.7%), and groundwater (26.3%). The highest water contribution rate occurred in the 30~60 cm layer, accounting for 13.4%.
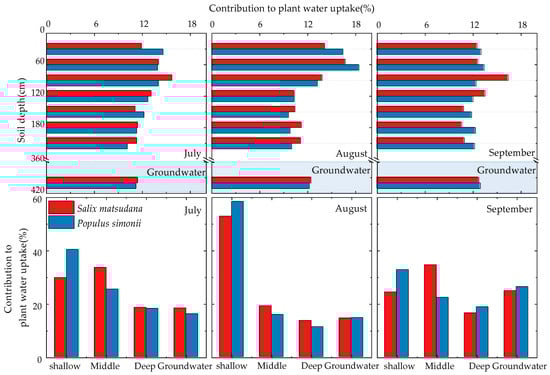
Figure 6.
Contribution of potential water sources to Salix matsudana and Populus simonii during the measurement period.
When both Salix matsudana and Populus simonii have an ample supply of shallow soil water, they prioritize its utilization. For instance, during periods of increased rainfall, such as in August, the utilization of shallow soil water can account for 50–60% of the total water usage. Conversely, during drier periods, like in September, when shallow soil water becomes insufficient, both species increase their utilization of middle and lower soil layers as well as groundwater.
3.5. Changes of Sap Flow Rate of Salix matsudana and Populus simonii
During the measurement period, the diurnal variation characteristics of stem flow rate for Salix matsudana and Populus simonii were analyzed (refer to Figure 7). It was observed that both Salix matsudana and Populus simonii exhibited a single-peak curve in the diurnal variation of stem flow rate, but there were differences in the start time, peak time, and peak size of the stem flow between the two species.
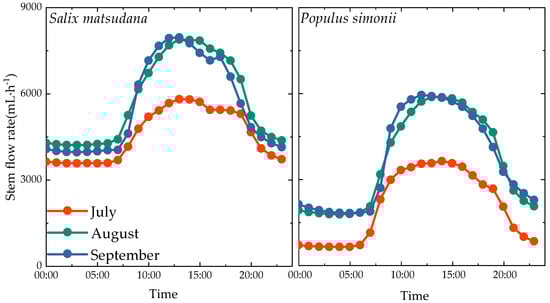
Figure 7.
Diurnal variation characteristics of sap flow rate of Salix matsudana and Populus simonii.
For Salix matsudana, the sap flow rate began to rise rapidly after 7:00 in the morning, peaked around 13:00 at noon, and started to decline thereafter. The decrease in sap flow rate weakened around 21:00 in the evening, remaining relatively stable. The sap flow rates for Salix matsudana in July, August, and September ranged from 3573.38 mL·h−1 to 5810.30 mL·h−1, 4211.24 mL·h−1 to 7889.36 mL·h−1, and 3957.66 mL·h−1 to 7939.50 mL·h−1, respectively. The daily average sap flow rates were 4551.86 mL·h−1, 5760.56 mL·h−1, and 5554.33 mL·h−1, respectively. Notably, the sap flow rate of Salix matsudana was highest in August, with decreases of 1208.7 mL·h−1 and 206.23 mL·h−1 in July and September, respectively, compared with August.
For Populus simonii, the sap flow rate started to increase rapidly after 6:00 in the morning, with the peak time shifting from about 14:00 in July to about 13:00 in August and about 12:00 in September. The peak was followed by a decline, with a weakened decrease in sap flow rate around 21:00 in the evening, stabilizing thereafter. The sap flow rates for Populus simonii in July to September ranged from 634.33 mL·h−1 to 3633.12 mL·h−1, 1773.68 mL·h−1 to 5876.43 mL·h−1, and 1816.90 mL·h−1 to 5944.66 mL·h−1, respectively. The daily average sap flow rates were 2052.82 mL·h−1, 3620.01 mL·h−1, and 3666.13 mL·h−1, respectively. Notably, the sap flow rate in September increased by 1613.31 mL·h−1 and 46.12 mL·h−1 compared with July and August, reaching its maximum.
Overall, the changes in stem flow rate for Salix matsudana and Populus simonii were quite similar from July to September. Both species showed a rapid increase in stem flow rate from 6:00 to 7:00 in the morning, reaching a peak around 12:00 to 14:00, followed by a gradual decrease. The rates stabilized around 21:00 but did not drop to zero. However, the sap flow rate of Salix matsudana increased by 2499.04 mL·h−1, 2140.55 mL·h−1, and 1888.2 mL·h−1 from July to September compared with Populus simonii, representing roughly 1.5–2.2 times that of Populus simonii.
4. Discussion
4.1. Isotope Composition and Seasonal Variation in Various Water Bodies
Soil moisture stands out as the primary factor influencing the growth and distribution patterns of vegetation in arid sandy regions. Plants in these areas predominantly rely on soil water and groundwater as their primary water sources, both of which are influenced by precipitation, as well as factors such as soil evaporation and movement. This leads to changes in soil water content, affecting the δ2H and δ18O values of soil water at various depths(refer to Figure 8). The relative natural abundance of δ18O and δ2H in different water bodies can serve as indicators of hydrological processes. Throughout the measurement period, the isotope composition of soil moisture in Salix matsudana and Populus simonii remained essentially similar. This similarity can be attributed to their proximity and the shared soil environment. Notably, Populus simonii predominantly absorbed water from the shallow layer from July to September, a period marked by stronger evaporation, resulting in enriched isotopes in the shallow soil water [23]. In contrast, Salix matsudana primarily utilized soil water from the middle layer in July and September, where the isotopes were relatively lighter compared with the shallow layer. Consequently, the average values of δ18O and δ2H in the xylem water of Populus simonii were higher than those of Salix matsudana [24,25].
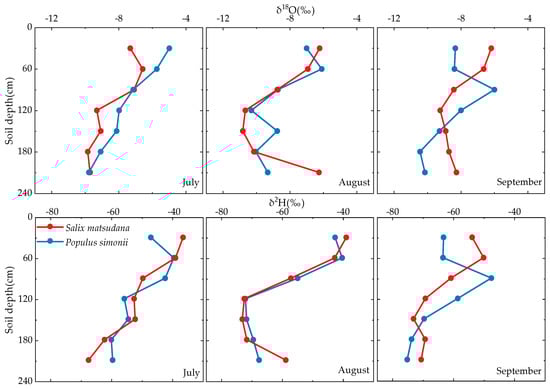
Figure 8.
Vertical distribution of soil water isotopes (δ18O and δ2H) in Salix matsudana and Populus simonii from July to September.
The isotopic composition of soil water varied significantly with depth and time due to the combined effects of precipitation and evaporation. The average values of δ18O and δ2H in soil water for both Salix matsudana and Populus simonii followed the sequence July > August > September. Shallow soil water, influenced by precipitation and evaporation, exhibited isotopic enrichment [26]. Large precipitation events coupled with existing soil water generated new soil water during the infiltration process, leading to changes in its stable isotope values over time and further contributing to isotopic enrichment [27]. With increasing soil depth, the isotope fractionation effect of soil water diminished, resulting in a gradual decrease in δ2H and δ18O values. Notably, the δ18O and δ2H values of groundwater from July to September remained relatively consistent, indicating that seasonal precipitation events had minimal impact on the isotope composition of groundwater.
4.2. Water Use Patterns of Salix matsudana and Populus simonii
Plants in arid regions demonstrate a remarkable sensitivity to variations in soil moisture, adjusting their water absorption strategies accordingly. Their ability to absorb and utilize soil water from stable layers contributes to their overall viability. Throughout the measurement period, the water utilization strategies of Salix matsudana and Populus simonii exhibited temporal fluctuations, with varying proportions of water absorption and utilization at different soil depths.
Trees generally prioritize easily accessible, stable, and sufficient water sources to support their growth [28]. Liu’s analysis [29] of the water use characteristics of Platycladus orientalis and Quercus variabilis in Beijing revealed that Platycladus orientalis primarily absorbed soil water from the 0–20 cm layer during the rainy season, while Quercus variabilis predominantly utilized soil water and groundwater from the same layer. In the dry season, Platycladus orientalis relied heavily on deep soil water, while Quercus variabilis favored shallow soil water [30]. Consequently, when shallow soil water is abundant, vegetation tends to prioritize its utilization.
In degraded forests, Zhang Huan observed a shift in the water source for Populus simonii from deep to shallow with increasing degradation degree, suggesting an adaptive response to drought [31,32]. In the current study, Salix matsudana demonstrated a higher utilization rate of middle soil water in July, while Populus simonii exhibited the highest utilization rate of shallow soil water. In August, with increased rainfall, both species favored shallow soil water. Come September, Salix matsudana returned to maximizing the utilization of middle soil water, while Populus simonii continued to predominantly rely on shallow soil water, albeit with increased utilization of deep soil water and groundwater.
The observed variations in water uptake by Salix matsudana and Populus simonii at different times can be attributed to the following factors: (1) The two-state nature of the root system plays a crucial role. In arid and semi-arid regions, plants with shallow roots, such as herbs, generally rely on surface soil water and precipitation. In contrast, deep-rooted plants like trees or shrubs tend to utilize more stable water sources, such as groundwater and deep soil water. Although a two-layer water use model hypothesis [33] has been proposed, some studies, like Le Roux’s [34], have found that regardless of root depth, plants predominantly depend on surface soil water. (2) The variation in soil water content is a key determinant. In months with higher rainfall, such as August, the content of shallow soil water is elevated and closer to the plant roots. This results in a shorter duration for water absorption, making it more accessible for Salix matsudana and Populus simonii. Conversely, during periods when the shallow soil water content is low, plants shift their water absorption towards the middle and deep soil layers and groundwater. The uniform utilization of potential water sources by both species suggests an optimal water absorption mode. When shallow soil water is insufficient, the utilization rate of middle and deep soil water and groundwater increases, allowing plants to access more stable water sources. (3) Variations in plant water requirements and transpiration rates also contribute. Salix matsudana exhibits a higher sap flow rate compared with Populus simonii, indicating a greater demand for water to meet transpiration needs. Consequently, Salix matsudana tends to absorb water from the middle and deep soil layers to compensate for the deficit in shallow soil water. In summary, the interplay of root system characteristics, soil water content, and plant water requirements leads to dynamic changes in the water uptake strategies of Salix matsudana and Populus simonii at different times, enabling them to adapt to varying environmental conditions.
4.3. Changes of Transpiration Sap Flow of Salix matsudana and Populus simonii
During the measurement period, the sap flow rate of both Salix matsudana and Populus simonii exhibited similar diurnal variations, following bell-shaped curves from July to September. This pattern aligns with previous studies on Caragana microphylla conducted by Yue [35]. The sap flow rates of both species were higher in August and September compared with July, probably due to these months being the peak seasons for transpiration. During this period, the leaves of Salix matsudana and Populus simonii are the most mature and dense, and the high temperatures and low humidity, along with strong radiation, create optimal conditions for leaf transpiration, as observed in Jia’s research [36].
The diurnal variation analysis revealed that the sap flow rate increased rapidly from 6:00 to 7:00 in the morning, reaching its peak around 12:00 to 14:00, followed by a gradual decline. The sap flow rate remained relatively stable from around 21:00 but did not drop to zero. This phenomenon is attributed to the substantial water consumption by Salix matsudana and Populus simonii during the day, leading to water deficit in the plants [37]. To counteract this, weak transpiration occurs at night, and water is actively transported to the plant body under root pressure, replenishing the water consumed during the day. This helps restore the water balance in the plants and aids in adapting to the arid environment with water deficits. This finding is consistent with Yu Feng’s study [38] on the transpiration water consumption pattern of artificial Caragana korshinskii in the arid zone of central Ningxia.
Salix matsudana exhibited a higher sap flow rate from July to September, indicating a greater demand for water to meet its transpiration needs. Despite more rainfall in August, which could satisfy its transpiration demands with shallow soil water, Salix matsudana still absorbed water from the middle and deep layers in July and September. In contrast, Populus simonii had a lower stem flow rate during this period, and the water demands for its transpiration were met by shallow soil water, making it the main water-absorbing layer from July to September. These observations highlight the dynamic nature of water absorption strategies employed by these species based on their water requirements and the availability of soil moisture.
5. Conclusions
In this study, the water use patterns and sap flow transpiration of Salix matsudana and Populus simonii in the Mu Us sandy land were investigated using stable isotope techniques and thermal diffusion sap flow methods. The findings indicate that both Salix matsudana and Populus simonii absorbed water from multiple sources simultaneously from July to September. Populus simonii predominantly absorbed water from the shallow soil layer (0~60 cm), with a contribution ranging from 32.7% to 58.3%. On the other hand, Salix matsudana exhibited a different water absorption pattern, drawing water from deeper soil layers and groundwater during dry periods. The diurnal variation of sap flow rate for both Salix matsudana and Populus simonii showed a single-peak curve. The sap flow rates of Salix matsudana and Populus simonii ranged from 3573.38 mL·h−1 to 7939.50 mL·h−1 and from 634.33 mL·h−1 to 5944.66 mL·h−1, respectively, during the period from July to September. Salix matsudana consistently exhibited higher sap flow rates, ranging from 1888.2 mL·h−1 to 2499.04 mL·h−1 more than Populus simonii. This difference indicates that Salix matsudana required 1.5 to 2.2 times more water for transpiration compared with Populus simonii. Therefore, in contrast to Populus simonii, which primarily absorbed water from shallow soil layers, Salix matsudana needed to extract water from middle and deep soil layers to compensate for the water deficit in the shallow soil. These findings contribute to a better understanding of the water use strategies and transpiration patterns of these two vegetation species in the Mu Us sandy land.
Author Contributions
Conceptualization, Q.Z. and T.Z.; methodology, L.X. and J.G; validation, T.Z. and Q.Z.; investigation, H.G.; resources, B.Y.; data curation, R.J. writing—original draft preparation, Q.Z.; review and editing, T.Z.; visualization, R.J.; supervision, L.X. and J.G.; project administration, H.G.; funding acquisition, B.Y. All authors have read and agreed to the published version of the manuscript.
Funding
This work was supported by the Inner Mongolia Natural Science Foundation (2021MS04022), Inner Mongolia Science and Technology Program (2021GG0198, 2022YFHH0063), Collaborative Innovation Center for Grassland Ecological Security (Jointly Supported by the Ministry of Education of China and Inner Mongolia Autonomous Region), the Science and Technology Program of Inner Mongolia Autonomous Region, China (KJXMEEDS-2020006).
Data Availability Statement
The data are not publicly available due to confidentiality. The data presented in this study are available on request from the corresponding author.
Acknowledgments
The authors are very grateful for the strong support provided by all the cooperative institutions involved in the project research. We would like to thank Savannah Grace at the University of Florida for her assistance with English language and grammatical editing of the manuscript.
Conflicts of Interest
The authors declare no conflict of interest.
References
- Zhang, Z.; Wang, W.; Gong, C.; Zhao, M.; Franssen, H.-J.H.; Brunner, P. Salix psammophila afforestations can cause a decline of the water table, prevent groundwater recharge and reduce effective infiltration. Sci. Total Environ. 2021, 780, 146336. [Google Scholar] [CrossRef]
- Brunel, J.-P.; Walker, G.R.; Kennett-Smith, A.K. Field validation of isotopic procedures for determining sources of water used by plants in a semi-arid environment. J. Hydrol. 1995, 167, 351–368. [Google Scholar] [CrossRef]
- Yu, X.; Liu, H.; Wang, L.; Wang, Q.; Liu, X.; Wen, L.; Dong, S.; Pan, B. Analysis on Water Sources of Riverbank Vegetation in Tributary of Yellow River Based on Stable lsotope Technique. J. Soil. Water Conserv. 2021, 41, 75–82+91. (In Chinese) [Google Scholar] [CrossRef]
- Ehleringer, J.R.; Dawson, T.E. Water uptake by plants: Perspectives from stable isotope composition. Plant Cell Environ. 2010, 15, 1073–1082. [Google Scholar] [CrossRef]
- Wang, Y.L.; Liu, L.C.; Gao, Y.H.; Li, G.; Zhao, J.C.; Xie, M. Analysis of water sources of plants in artificial sand-fixation vegetation area based on large rainfall events. Chin. J. Appl. Ecol. 2016, 27, 1053–1060. (In Chinese) [Google Scholar] [CrossRef]
- Youri, R.; Mathieu, J. Reviews and syntheses: Isotopic approaches to quantify root water uptake: A review and comparison of methods. Biogeosciences 2017, 14, 2199–2224. [Google Scholar] [CrossRef]
- Penna, D.; Hopp, L.; Scandellari, F.; Allen, S.T.; Benettin, P.; Beyer, M.; Geris, J.; Klaus, J.; Marshall, J.D.; Schwendenmann, L. Ideas and perspectives: Tracing terrestrial ecosystem water fluxes using hydrogen and oxygen stable isotopes—Challenges and opportunities from an interdisciplinary perspective. Biogeosciences 2018, 15, 6399–6415. [Google Scholar] [CrossRef]
- Montgomery, J.A.; Klimas, C.A.; Arcus, J.; Deknock, C.; Rico, K.; Rodriguez, Y.; Vollrath, K.; Webb, E.; Williams, A. Soil quality assessment is a necessary first step for designing urban green infrastructure. J. Environ. Qual. 2016, 45, 18–25. [Google Scholar] [CrossRef]
- Midwood, A.J.; Boutton, T.W.; Archer, S.R.; Watts, S.E. Water use by woody plants on contrasting soils in a savanna parkland: Assessment with δ2H and δ18O. Plant Soil. 1998, 205, 13–24. [Google Scholar] [CrossRef]
- West, A.G.; Dawson, T.E.; February, E.C.; Midgley, G.F.; Bond, W.J.; Aston, T.L. Diverse functional responses to drought in a Mediterranean-type shrubland in South Africa. New Phytol. 2012, 195, 396–407. [Google Scholar] [CrossRef]
- Peng, W.; Song, X.; Han, D.; Xin, L. A study of root water uptake of crops indicated by hydrogen and oxygen stable isotopes: A case in Shanxi Province. Agric. Manag. Water Qual. 2010, 97, 475–482. (In Chinese) [Google Scholar] [CrossRef]
- McCole, A.A.; Stern, L.A. Seasonal water use patterns of Juniperus ashei on the Edwards Plateau, Texas, based on stable isotopes in water. J. Hydrol. 2007, 342, 238–248. [Google Scholar] [CrossRef]
- Darrouzet-Nardi, A.; D’Antonio, C.M.; Dawson, T.E. Depth of water acquisition by invading shrubs and resident herbs in a Sierra Nevada meadow. Plant Soil. 2006, 285, 31–43. [Google Scholar] [CrossRef]
- Ding, Y.; Nie, Y.; Schwinning, S.; Chen, H.; Yang, J.; Zhang, W.; Wang, K. A novel approach for estimating groundwater use by plants in rock-dominated habitats. J. Hydrol. 2018, 565, 760–769. [Google Scholar] [CrossRef]
- Zhao, Y.; Wang, Y.; He, M.; Tong, Y.; Zhou, J.; Guo, X.; Liu, J.; Zhang, X. Transference of Robinia pseudoacacia water-use patterns from deep to shallow soil layers during the transition period between the dry and rainy seasons in a water-limited region. For. Ecol. Manag. 2019, 457, 117727. [Google Scholar] [CrossRef]
- Jackson, P.C.; Cavelier, J.; Goldstein, G.; Meinzer, F.C.; Holbrook, N.M. Partitioning of water resources among plants of a lowland tropical forest. Oecologia 1995, 101, 197–203. [Google Scholar] [CrossRef] [PubMed]
- Schwendenmann, L.; Pendall, E.; Sanchez-Bragado, R.; Kunert, N.; Hulscheer, D. Tree water uptake in a tropical plantation varying in tree diversity: Interspecific differences, seasonal shifts and complementarity. Ecohydrology 2015, 8, 1–12. [Google Scholar] [CrossRef]
- Hao, B.; Ai, N.; Jia, Y.; Zong, Q.; Liu, J.; Liu, C. Soil water characteristics of different vegetation types in the south of MU Us Sandy Land. J. Arid Environ. 2020, 34, 196–200. (In Chinese) [Google Scholar] [CrossRef]
- Ohte, N.; Koba, K.; Yoshikawa, K.; Sugimoto, A.; Matsuo, N.; Wang, K.L. Water Utilization of Natural and Planted Trees in the Semiarid Desert of Inner Mongolia, China. Ecol. Appl. 2003, 13, 337–351. [Google Scholar] [CrossRef]
- Li, R.; Huang, L.; Pei, Y.; Shao, M.; Zhang, Y. Water Use Source of Salix psammophila in Gechougou Small Watershedof Mu Us Sandy Land. J. Soil Water Conserv. 2021, 35, 122–130. (In Chinese) [Google Scholar] [CrossRef]
- Granier, A. Evaluation of transpiration in a Douglas-fir stand by means of sap flow measurements. Tree Physiol. 1987, 3, 309–320. [Google Scholar] [CrossRef]
- Yin, L.H.; Huang, J.T.; Wang, X.Y.; Dong, J.Q.; Ma, H.Y.; Zhang, J. Characteristics of night time sap flow of Salix matsudana and Populus simonii in Yulin, Shaanxi. J. Northwest A F Univ. 2013, 41, 85–90. (In Chinese) [Google Scholar] [CrossRef]
- Gazis, C.; Feng, X.H. A stable isotope study of soil water: Evidence for mixing and preferential flow paths. Geoderma 2004, 119, 97–111. [Google Scholar] [CrossRef]
- Allen, S.T.; Kirchner, J.W.; Braun, S.; Siegwolf, R.T.W.; Goldsmith, G.R. Seasonal origins of soil water used by trees. Hydrol. Earth Syst. Sci. 2019, 23, 1199–1210. [Google Scholar] [CrossRef]
- Wang, J.; Fu, B.; Lu, N.; Zhang, L. Seasonal variation in water uptake patterns of three plant species based on stable isotopes in the semi-arid Loess Plateau. Sci. Total Environ. 2017, 609, 27–37. [Google Scholar] [CrossRef] [PubMed]
- Bowen, G.J.; Putman, A.; Brooks, J.R.; Bowling, D.R.; Oerter, E.J.; Good, S.P. Inferring the source of evaporated waters using stable H and O isotopes. Oecologia 2017, 187, 1025–1039. [Google Scholar] [CrossRef]
- Tian, C.; Meng, P.; Zhang, J.; Sun, S.; He, C.; Jia, C.; Li, J. Seasonal characteristics of 8D and 8180 in precipitation and its water vaporsources in the Xiaolangdi Reservoir area of Yellow River, China. J. Appl. Ecol. 2015, 26, 3579–3587. (In Chinese) [Google Scholar] [CrossRef]
- Eggemeyer, K.D.; Awada, T.; Harvey, F.E.; Wedin, D.A.; Zhou, X.; Zanner, C.W. Seasonal changes in depth of water uptake for encroaching trees Juniperus virginiana and Pinus ponderosa and two dominant C4 grasses in a semiarid grassland. Tree Physiol. 2009, 29, 157–169. [Google Scholar] [CrossRef]
- Liu, Z.; Yu, X.; Deng, W.; Jia, G.; Jia, J.; Lou, Y.; Li, H. Water sources of Pinus tabuliformis and Platycladus orientalis before and after rain in northern China. J. Soil Water Conserv. 2016, 14, 111–119. (In Chinese) [Google Scholar] [CrossRef]
- Liu, Z.; Yu, X.; Jia, G.; Jia, J.; Lou, Y.; Zhang, K. Water Use Characteristics of Platycladus orientalis and Quercus variabilis in Beijing Mountain Area. Sci. Silvae Sin. 2016, 52, 22–30. (In Chinese) [Google Scholar]
- Hasselquist, N.J.; Allen, M.F. Increasing demands on limited water resources: Consequences for two endangered plants in Amargosa Valley, USA. Am. J. Bot. 2009, 96, 620–626. [Google Scholar] [CrossRef]
- Zhang, H.; Jia, G.; Liu, Z.; Yu, X.; Cao, J.; Wang, H.; Song, B.; Zeng, J. Water utilization characteristics of the degraded poplar shelterbelts inZhangbei, Hebei, China. J. Appl. Ecol. 2018, 29, 1381–1388. (In Chinese) [Google Scholar] [CrossRef]
- Ward, D.; Wiegand, K.; Getzin, S. Walter’s two-layer hypothesis revisited—Back to the roots! S. Afr. J. Bot. 2013, 86, 141. [Google Scholar] [CrossRef][Green Version]
- Roux, X.L.; Bariac, T.; Mariotti, A. Spatial partitioning of the soil water resource between grass and shrub components in a West African humid savanna. Oecologia 1995, 104, 147–155. [Google Scholar] [CrossRef]
- Yue, G.Y.; Zhao, H.L.; Zhang, T.H.; Yun, J.Y.; Niu, L.; He, Y.H. Characteristics of Caragana microphylla sap flow and water consumptionunder different weather conditions on Horqin sandy land of northeast China. J. Appl. Ecol. 2007, 18, 2173–2178. (In Chinese) [Google Scholar]
- Jia, T.; Liu, T.; Duan, L.; Zhang, Y.; Tong, X.; Bao, Y. Transpiration and water consumption of poplar trees in semi-arid dunemeadow transition zone. Chin. J. Ecol. 2020, 39, 3255–3264. (In Chinese) [Google Scholar] [CrossRef]
- Li, L.; Nie, H.; Jing, Q.; Zhang, Y.; Lan, Y.; Zhu, L. Correlations between the Transpiration Water Consumption of Hedysarummongolicum and Environmental Factors in Mu Us Sandy Land. Water SA 2022, 12, 103–109+118. (In Chinese) [Google Scholar] [CrossRef]
- Yu, F.; Chen, L.; Wang, F.; Liu, H.; Du, J.M.; Guo, Y.Z.; Li, H.X. The Study on Sap Flow and Transpiration of Artificial Caragana korshinkii in the Arid Area of Central Ningxia Hui Autonomous Region. Soil Water Conserv. 2011, 18, 143–147. (In Chinese) [Google Scholar]


Disclaimer/Publisher’s Note: The statements, opinions and data contained in all publications are solely those of the individual author(s) and contributor(s) and not of MDPI and/or the editor(s). MDPI and/or the editor(s) disclaim responsibility for any injury to people or property resulting from any ideas, methods, instructions or products referred to in the content. |
© 2023 by the authors. Licensee MDPI, Basel, Switzerland. This article is an open access article distributed under the terms and conditions of the Creative Commons Attribution (CC BY) license (https://creativecommons.org/licenses/by/4.0/).