Article

Hydrogeochemical Characteristics and Evolution of Karst Groundwater in Heilongdong Spring Basin, Northern China

1
Institute of Hydrogeology and Environmental Geology, Chinese Academy of Geological Sciences, Shijiazhuang 050061, China
2
School of Resources and Environmental Engineering, Hefei University of Technology, Hefei 230009, China
3
Key Laboratory of Groundwater Sciences and Engineering, Ministry of Natural Resources, Shijiazhuang 050061, China
*
Authors to whom correspondence should be addressed.
Water 2023, 15(4), 726; https://doi.org/10.3390/w15040726
Submission received: 15 December 2022 / Revised: 7 February 2023 / Accepted: 8 February 2023 / Published: 12 February 2023
(This article belongs to the Special Issue Groundwater Chemistry and Quality in Coastal Aquifers)

Abstract

:
Understanding the impact of natural processes and anthropogenic activities on geochemical evolution is vital for groundwater protection and utilization. This research was devoted to identifying the water quality status and the main controlling factors of the hydrochemical evolution of karst groundwater by combining hydrogeochemical indicators with multi-isotope analysis techniques in the Heilongdong Spring Basin, North China. The results showed that the karst groundwater in the area was of meteoric origin, and the dissolution of carbonate minerals was dominant in water–rock interactions. Meanwhile, the positive and negative cation exchange occurred in the process. The main hydrochemical types of karst groundwater were HCO3-Ca·Mg and HCO3-Ca in the recharge area, while the predominant hydrochemical types were the HCO3·SO4-Ca·Mg and HCO3·SO4-Ca in the runoff and discharge area. Under the influence of coal mining and other factors, the average concentrations of major ions kept rising in the runoff area where coal mines were distributed, and the SO42− concentrations of the karst groundwater changed the most in the study area. In addition, sewage from agricultural production and domestic sources had also negatively impacted the quality of regional groundwater in the runoff and discharge area, as evidenced by the increasing NO3 and Cl contents in the Quaternary sediment groundwater, Permian bedrock groundwater and a small portion of karst groundwater. These results were helpful to explain the mechanism of gradual hydrogeochemical changes and provided a scientific basis for the effective management and utilization of karst groundwater.

1. Introduction

Water is essential to life, yet 844 million people worldwide lack access to basic drinking water. Most of them are individuals who reside in the rural areas of developing countries, such as in Subsaharan Africa [1,2]. Since the last century, the population has increased threefold, and the consumption of water has increased sixfold. Moreover, due to global climate change, the supply of water has decreased, resulting in prolonged drought and increased pollution [3]. We are facing a global water crisis. Previous studies have shown that groundwater is more adaptable to climate change than surface water, and it is more reliable and easier to obtain than surface water, because it can be directly exploited by users [4]. However, climate change can also affect groundwater quality by reducing the aquifer recharge and increasing artificial pressures [5].
Karst groundwater is one of the most important and well-used groundwater sources around the world. More than a quarter of the world’s population lives in areas where karst groundwater is used as a source drinking water [6,7]. In some areas, it is even the only available water resource [8]. Most of Northern China has a large area of arid or semiarid climate with a relative shortage of surface water resources, while groundwater resources are more extensively exploited and utilized [9,10,11]. The area of carbonate rocks in Northern China can reach 68.5 × 10⁴ km2, with a total exposed area of 7.78 × 10⁴ km2 [12,13]. Karst groundwater with abundant and good water quality is the significant water supply for Northern China, supporting a huge population and providing an important guarantee for local industry, agriculture and civil use. While the karst groundwater is convenient for human beings, people gradually realize the serious consequences caused mainly by the long-term abstraction of karst groundwater. The excessive exploitation of karst groundwater has caused a series of ecological and environmental problems in Northern China, such as the decline in the regional groundwater level, attenuation of karst springs and deterioration of water quality [9,14,15].
Hydrochemical and isotopic indicators are effective tools that are frequently used to solve multiple problems in hydrology and hydrogeology [11,16,17,18]. The combination of hydrogeochemical methods such as the Gibbs diagram, Piper diagram and ionic ratios have been widely used in the analysis of hydrochemical evolution process, which provides a way to deeply understand the control mechanism of various geochemical reactions occurring in groundwater. Additionally, as an effective tracer, stable isotopes are useful in studying the origin of groundwater as well as calculating the mixing proportion among different water sources [19,20]. The δ18O and δ2H isotopes have frequently been used to identify the origin and recharge mechanism of groundwater. The stable isotopes of dissolved sulfate (δ34S and δ18O) are excellent tracers for investigating the source of sulfate in groundwater or surface water. Therefore, the combination of hydrochemical and isotopic methods can determine the geochemical factors and mechanisms controlling the hydrochemical composition of groundwater.
The Heilongdong Spring Basin (HSB), located in Southwestern Hebei Province, is a typical representative of karst groundwater systems in Northern China. The abundant and good quality of karst groundwater in this region has long been an important source of water for domestic use, agricultural irrigation and industrial production in Handan, Northern China. The region is also the main coal mining distribution area and agricultural cultivation area in Northern China. In the past decades, the demand for groundwater has increased with the development of industry and agriculture. However, the local groundwater quality has shown a continuous deterioration due to the long-term discharge of coal mining water, industrial wastewater and domestic sewage, as well as the extensive use of agricultural fertilizers and pesticides.
Since the 1970s, many scholars have successively carried out research on the evaluation of groundwater circulation and evolution processes and made a lot of achievements in the area. Guo et al. [21] used four parameter ionic ratios to reveal the hydrochemical characteristics in the Fengfeng mining area and conducted reverse hydrogeochemical process modeling. Hao et al. [22] found that the hydraulic gradient of karst groundwater increased after coal mining activities and the groundwater quality became deteriorated in the Fengfeng coal mining area. Hao et al. [23] revealed the 2H and 18O drift were attributed to water–rock reactions between the Ordovician limestone, carbonate and silicate minerals in the Fengfeng coal mining area. However, most of the previous studies have focused on regional hydrogeological investigations and the hydrochemical and isotopic characteristics of a small local scale or in a particular year [7]. The knowledge of the hydrogeochemical evolution characteristics of the whole spring basin and the relationship between different aquifers is still insufficient or unclear. The present study systematically studied the geochemical evolution of karst groundwater in the whole HSB and obtained a new understanding.
To comprehensively understand the hydrochemical characteristics and evolution processes of karst groundwater in the HSB, it is necessary to clarify the impact of natural and anthropogenic activities on karst groundwater chemistry. Therefore, the main objectives of this study are to: (1) ascertain the sources of karst groundwater and clarify the hydraulic connection between karst aquifers and other aquifers and (2) compare the hydrochemical characteristics of karst groundwater in different periods and reveal the hydrochemical formation mechanisms controlling the chemical composition, especially SO42 and NO3 in karst groundwater.
As a typical representative of the karst groundwater system in Northern China, the Heilongdong Spring Area is facing huge pollution risks with the rapid development of coal mining and agricultural activities, which makes it practically significant to evaluate the spatiotemporal variations in karst groundwater. The findings will provide a scientific basis for promoting the protection and utilization of karst groundwater resources in the HSB and a reference for the management of other karst groundwater resources in mining areas.

2. Study Area

2.1. General Setting

The HSB is located in the southwestern part of Hebei Province, which belongs to Handan City in Northern China. To the west of the study area is a series of mountains, while the east is mainly hilly and plain. The elevation gradually decreases from west to east, with the Heilongdong (HLD) spring groups at the lowest altitude in the whole region. The total area of the HSB is 2002 km2.
The study area has significant seasonal variations with a mean annual temperature of 13.9 °C. The mean annual precipitation is 545 mm, while the mean annual evaporation is 1895.7 mm. The rainy season (July to September) accounts for 66.4% of the annual precipitation. Zhanghe River, Fuyang River and Nanming River are the main rivers in the basin. Additionally, Yuecheng (YC) Reservoir and Dongwushi (DWS) Reservoir are two large reservoirs in the region.
The Heilongdong spring groups are located at the intersection of Gushan Mountain and Fuyang River. They are composed of more than 60 springs, which are concentrated in an area of about 2 km2. The outcrop elevation of the springs is 122.8~132.4 m. Fuyang River is mainly formed by the spring groups’ discharge. The HLD springs’ flow ranged from 7 m3/s to 9 m3/s before the 1980s. After the 1980s, due to the increase in human exploitation and the decrease in precipitation, the HLD springs dried up successively in 1987. Since then, the springs have only flowed intermittently in the rainy years or seasons (usually from July to September). It was not until 2016 that the spring flow completely resumed, and the current spring flow was 4.76 m3/s in 2019.

2.2. Geological and Hydrogeological Setting

The boundaries of the HSB are defined by groundwater divides, water-blocking faults and impermeable igneous rocks. Therefore, the study area is a relatively independent hydrogeological unit. As a whole, it is an east-inclining monoclinic structure with a stratigraphic dip angle roughly of 10°~20°. The faults, with NE, NW, near SN and EW strikes, are distributed throughout the region. The main strata exposed in the study are of Sinian (Z), Cambrian (∈), Ordovician (O), Carboniferous (C), Permian (P), Triassic (T) and Quaternary sediments (Q), in which the main coal-bearing strata are Carboniferous and Permian.
The key aquifers (simplified) from bottom to top in the area are the Cambrian limestone aquifer, Ordovician limestone aquifer, Carboniferous thin-limestone aquifer, Permian sandstone aquifer and Quaternary sediment aquifer (Figure 1). The Cambrian and Ordovician limestone aquifers, with large thicknesses and high water abundance, are the main aquifer in the study area. The Cambrian and Ordovician strata are exposed in the western and central mountainous areas yet are covered by Quaternary and coal measure strata in the middle and east of the basin, which are mainly composed of limestone and dolomite [24]. In addition, the karstic fissures, honeycombed karstic pores and layered gypsum lenses are also developed in the Ordovician strata, with a total thickness of 470~584 m [23]. The gypsum layers in the Ordovician strata are about 2~3 mm thick [25]. Karst groundwater (KGW), which is extremely abundant in the Cambrian and Ordovician limestone aquifers, is an important source of drinking water for local residents. The Carboniferous thin limestone and the Permian sandstone aquifer, located above the Ordovician limestone aquifer and overlain by the Quaternary sediment aquifer, have poor water yields. The Carboniferous and Permian strata are composed of multilayer coal seams, and the main lithology is sandstone, thin limestone and multilayer coal seams with shale interbedded. The vertical distance between the lower coal seam of the Carboniferous strata and the underlying Ordovician limestone aquifer is generally 20~50 m. Due to the widespread distribution of structural fractures, karst collapse columns and fractures formed in the process of coal mining, there is a direct or indirect hydraulic connection between the coal seam and the underlying Ordovician limestone aquifer as well as the overlying Permian sandstone aquifer. The Quaternary sedimentary aquifer is dominated by sand, gravel and clay with a thickness of 0~60 m, which is mainly distributed around the piedmont area along the main rivers in the central and eastern regions.
Karst groundwater is mostly recharged by atmospheric precipitation from the outcrop areas of limestone in the western and central mountainous areas. Under natural conditions, the flow direction of karst groundwater is generally from the west, north, southwest and northeast to the Heilongdong spring groups. However, due to the overexploitation of groundwater extraction and mine drainage, the regional karst groundwater level has dropped dramatically since the 1980s, resulting in several karst groundwater depression cones around some coal mines and well fields [7]. With the increasing amount of groundwater pumping and mine drainage, karst groundwater gradually changed from spring drainage to groundwater exploitation and mine drainage.
Since the middle route of the South-to-North Water Transfer Project (SNWTP) was opened in 2014, the water-using structure of Handan has changed significantly. The water source of the SNWTP gradually replaced the local groundwater resources, and the exploitation of the Yangjiaopu (YJP) well field was greatly reduced. At the same time, the local government implemented a lot of measures such as some old mine closures, groundwater-pumping reduction and mine drainage utilization, resulting in a rise in the regional groundwater table to varying degrees.

2.3. Coal Mining

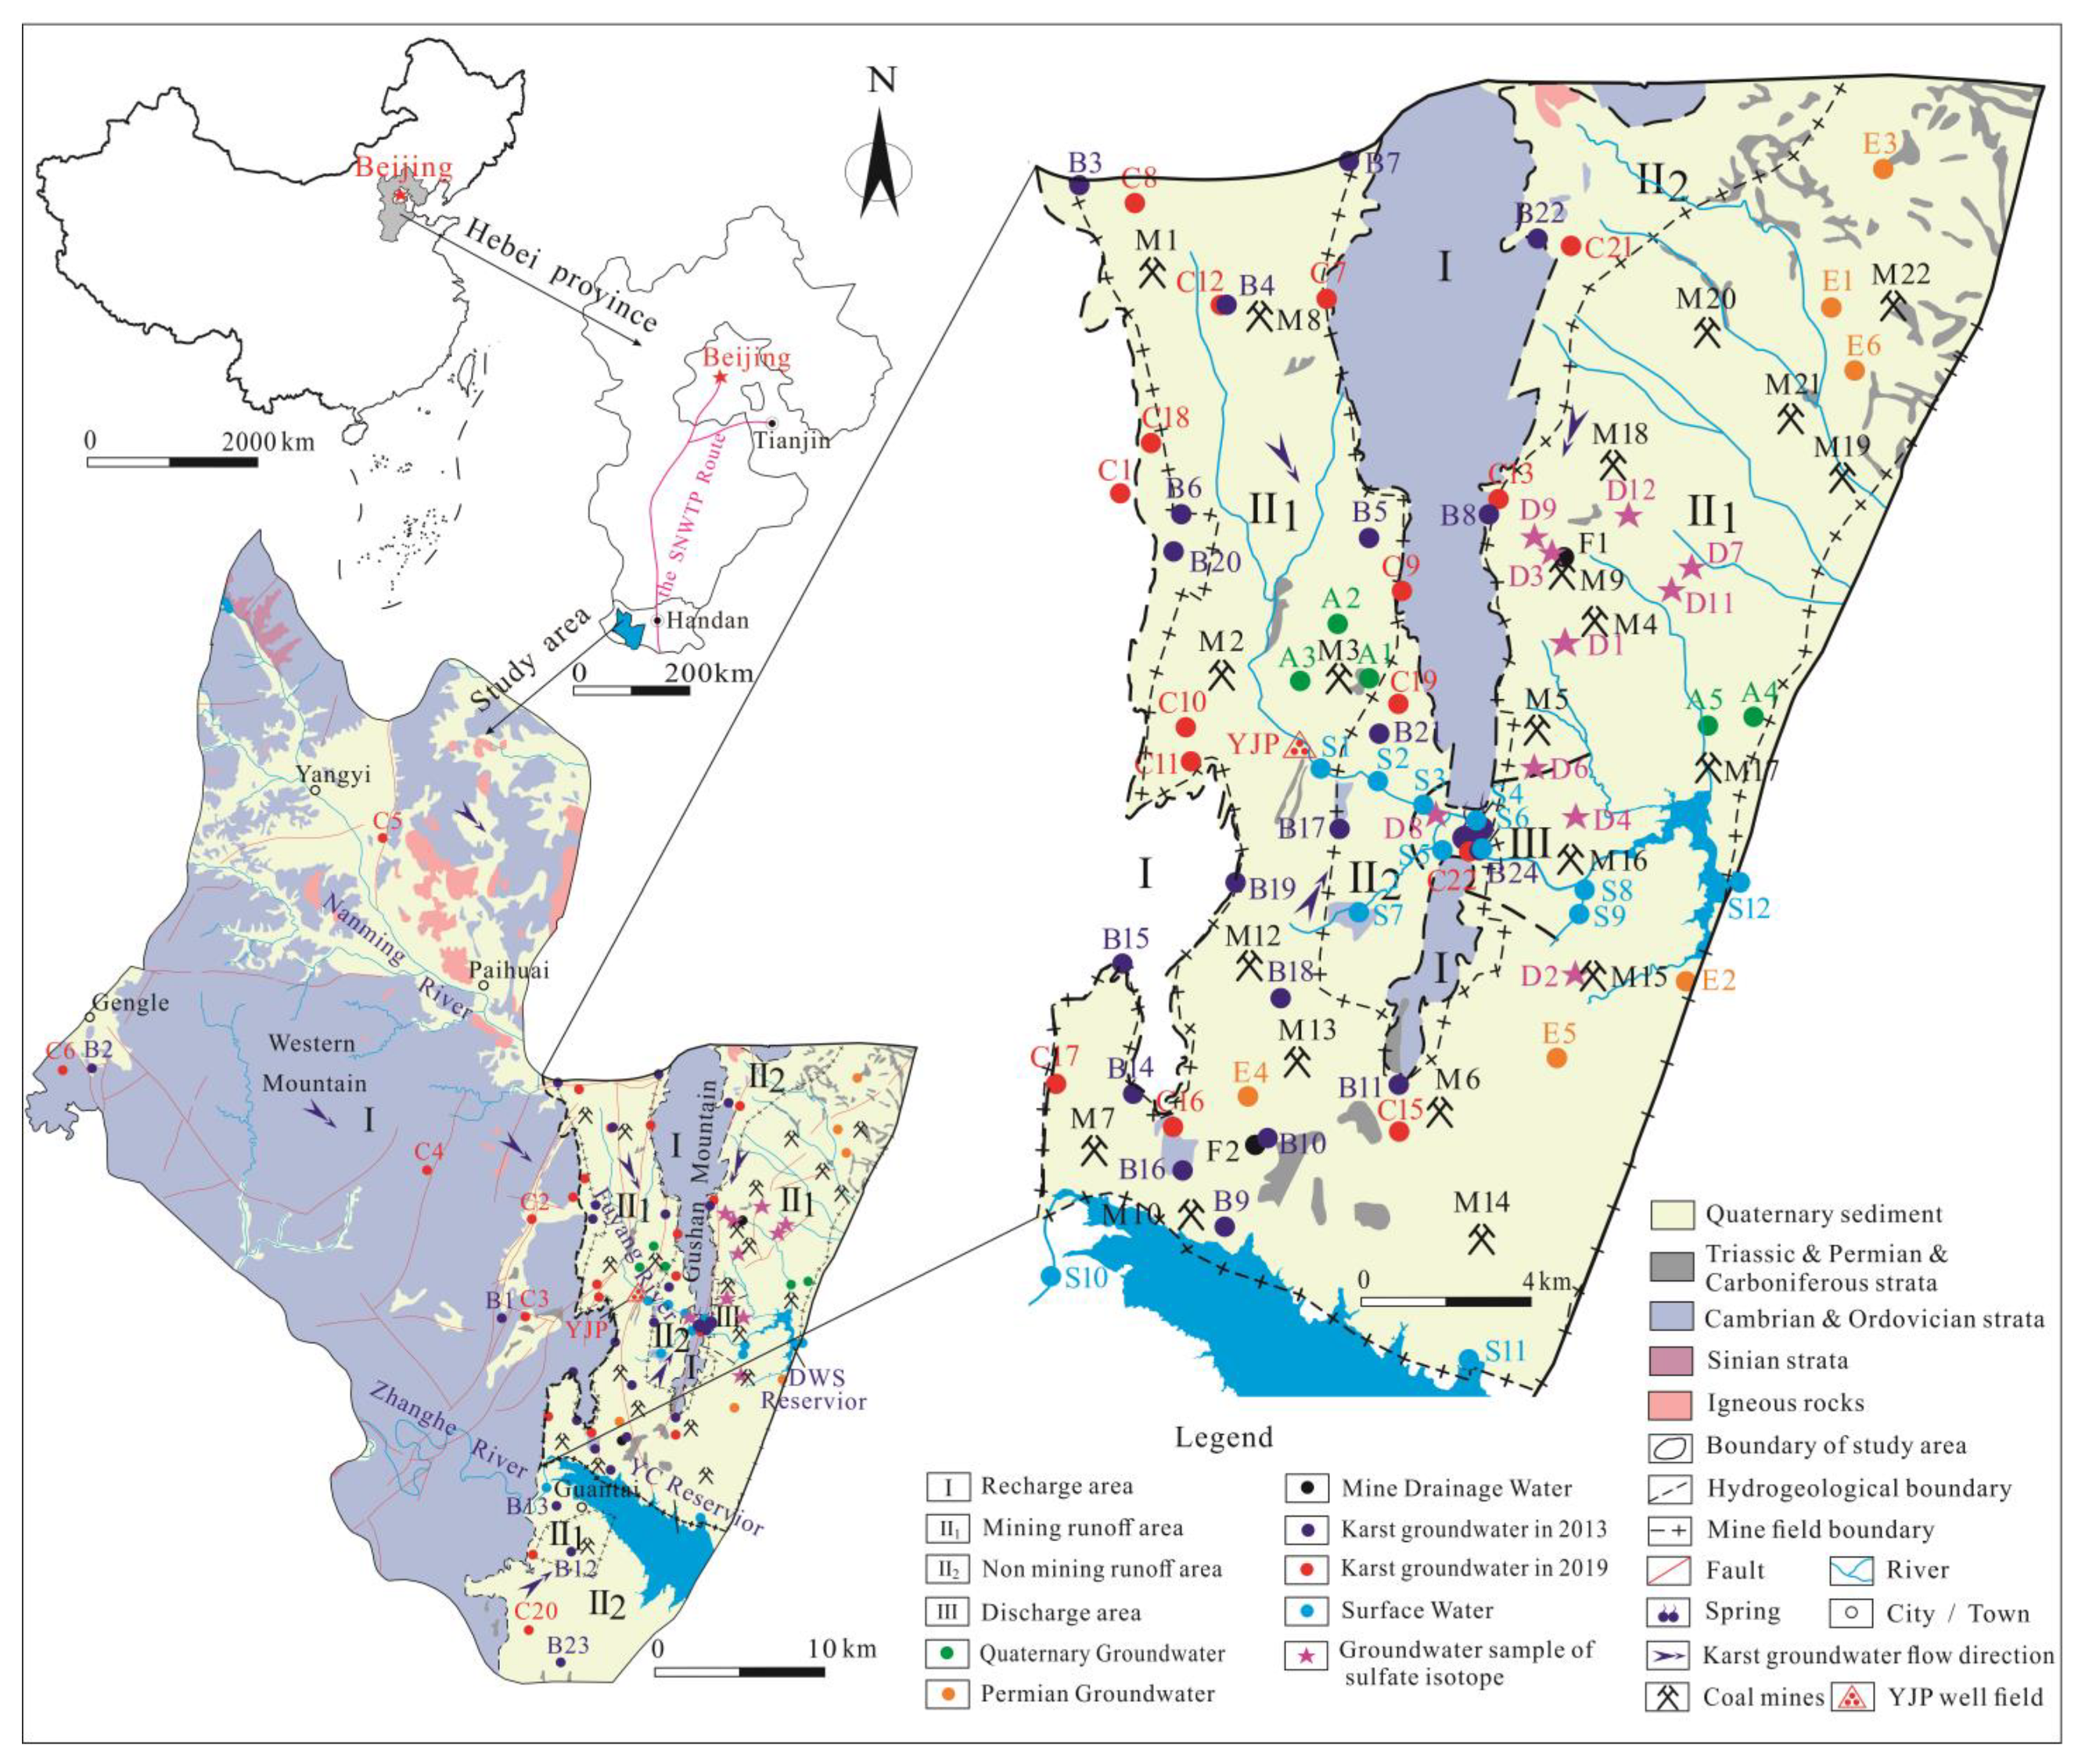
The coal mines are located in the northern, southern and eastern areas of the spring area. The main coal-bearing strata are the upper Carboniferous Taiyuan Formation and the lower Permian Shanxi formation, with a total thickness of 170~250 m. There are 22 state-owned and local-owned coal mines (M1–M22) in the spring basin. Specifically, 7 coal mines were closed before 2015 (M1–M7) and 4 coal mines were closed from 2015 to 2018 (M8–M11); the other 11 coal mines still stay in production (M12–M22). Moreover, the production mines are mainly located in the eastern and southern areas of the spring area (Figure 2).
After decades of mining, the shallow coal resources have been nearly exhausted, and most of the production mines have been transferred to the deep coal seams. As mentioned above, the vertical distance between the deep coal seams of Carboniferous strata and the underlying Ordovician limestone aquifer is only 20~50 m. So, the risk of water inrush is increasing due to the more abundant and higher water pressure of the Ordovician karst groundwater [26].

3. Materials and Methods

3.1. Sample Collection and Analysis

A total of 59 water samples from wells and springs were taken from late May to mid-September in 2013 and 2019, respectively. Specifically, 24 samples were taken in 2013, all of which were karst groundwater (B1–B24). Among them, there were 2 samples (B1–B2) in the recharge area (Zone I), 17 samples (B3–B19) in the mining runoff area (Zone II1), 4 samples (B20–B23) in the nonmining runoff area (Zone II2) and 1 sample (B24) in the discharge area (Zone III).
To compare the differences in the major chemical compositions from different aquifers in different years, 35 samples were taken in 2019, including 22 samples of karst groundwater (C1–C22), 5 samples of Quaternary sediment groundwater (A1–A5), 6 samples of Permian groundwater (E1–E6) and 2 samples of mine drainage water (F1–F2). Among the karst groundwater samples, there were 6 samples (C1–C6) in the recharge area (Zone I), 11 samples (C7–C17) in the mining runoff area (Zone II1), 4 samples (C18–C21) in the nonmining runoff area (Zone II2) and 1 sample (C22) in the discharge area (Zone III). In addition, 12 samples of surface water (S1–S12) were collected in 2019, including 9 samples of Fuyang River water (S1–S9). The other 3 water samples were from Zhanghe River, Yuecheng (YC) Reservoir and Dongwushi (DWS) Reservoir (S10–S12) [7].
Most of the karst groundwater samples were collected from the public and private supply wells ranging in depth from 170 to 600 m, and almost all the Quaternary sediment and Permian groundwater were pumped from the private wells (ranging from 5 to 100 m). Surface water samples were collected from rivers and reservoirs. Mine drainage water and spring water samples were taken directly from the mine drainage outlet and karst spring outlet, respectively.
Only major ions and trace element analyses were carried out in all the samples of karst groundwater taken in 2013. δ2H and δ18O isotope tests were carried out in all the samples of groundwater (except C6, C14 and C20) in addition to the major ions and trace element analysis in 2019. The above 3 samples failed the tests for the δ2H and δ18O isotope due to damage during transportation. Moreover, 10 samples were chosen from the 35 samples for the δ34SSO4 analysis in 2019, including 7 samples (C1, C4, C6, C7, C8, C11, C22) of Ordovician groundwater and 3 samples (E2, E5, E6) of Permian sandstone groundwater. In addition, 10 samples were collected for δ34SSO4 analysis in August 2015, including 7 samples (D1-D4, D6-D8) of Ordovician groundwater and 3 samples (D9, D11, D12) of Carboniferous thin limestone water [20]. Specifically, among the karst groundwater samples, there were 3 samples (C1, C4, C6) in the recharge area (Zone I), 9 samples (C7, C8, C11, D1-D4, D6-D7) in the mining runoff area (Zone II1) and 2 samples (C22, D8) in the discharge area (Zone III). All the other samples of Permian sandstone groundwater (E2, E5, E6) and Carboniferous thin limestone water (D9, D11, D12) were taken from the mining runoff area (Zone II1).
Prior to sampling, each well was pumped at least three well volumes of groundwater with a low-rate submersible pump to remove the stagnant water, and each sampling bottle was rinsed three times with the sample water before collection. Then, the pH, electrical conductivity (EC) and water temperature were measured in situ using the HANNA (HI98194) multiparameter instrument, with a precision of ±0.02 for pH, ±0.15 °C for temperature and ±1 µs/cm for EC.
All the water samples were filtered through 0.45 μm membrane filters and poured into 1.5 L and 250 mL polyethylene bottles for analyses of major and trace elements. The 250 mL samples were acidified in situ by adding double distilled nitric acid to Ph < 2, while the 1.5L samples were untreated. All the samples were stored at 4 °C until analysis (within one week). In addition, groundwater samples for the stable isotope (δ2H and δ18O) analysis were collected in 50 mL glass bottles, which were sealed with airtight caps. To measure the values of δ34S of the dissolved SO42 in the groundwater, the water samples were separately collected in a 5 L bucket and acidified with HCl to pH 2–3; then, they were reacted with BaCl2 to form BaSO4 precipitates and were sent immediately to the laboratory.

3.2. Analytical Methods

K+, Na+, Ca2+, Mg2+, Cl, SO42, NO3 and other chemical indicators were tested at the Groundwater Mineral Water and Environmental Monitoring Center of the Institute of Hydrogeology and Environmental Geology, Chinese Academy of Geological Sciences.
The TDS was determined using the gravimetric method. Major anions, except HCO3, were analyzed using a Thermo Scientific Dionex ICS-4000 (precision, ±1%). HCO3 and CO32− were titrated with 0.05 mol/L HCl in situ on the sampling day using phenolphthalein and Methyl orange as indicators. Major cations and minor elements were analyzed with an Inductively Coupled Plasma Optical Emission Spectrometer (ICP-OES, PerkinElmer Optima 8300) (precision, ±1%). The reliability of the chemical data was checked using the Charge Balance Error (% CBE). The results showed that all the samples were within CBE values of ±10%, indicating that the measurement accuracy was reasonably good in the study area.
The hydrogen (δ2H) and oxygen (δ18O) compositions in the water samples were identified using isotopic mass spectrometry (Picarro L2130-I) at the Institute of Hydrogeology and Environmental Geology, Chinese Academy of Geological Sciences. The stable isotope ratios are expressed in the standard δ-notation and calculated with respect to the Vienna Standard Mean Ocean Water (VSMOW, ‰) with the precision of ±1.0‰ (δ2H) and ± 0.1‰ (δ18O).
The 34S isotope of SO42 was analyzed with a thermal conversion elemental analyzer (TCEA) coupled with an isotope ratio mass spectrometer (Finnigan MAT253) at the Analytical Laboratory of the Beijing Research Institute of Uranium Geology (ALBRIUG). The notation was expressed in terms of δ (‰) relative to the Vienna Canyon Diablo Troilite (V-CDT) standard, and the working standards of δ34SSO4 were GBW 04414 and GBW 04415. The results of the repeated analysis of internal standards showed that the precision was better than ± 0.2‰ for δ34SSO4.
Quality assurance (QA) and quality control (QC) measures for field sampling, storage, transportation and laboratory analysis were implemented. To ensure the data quality, each sample was analyzed in triplicate, and each batch was interspersed with the standard and blank sample in proportion to evaluate the experimental methods. In addition, about 20% of the samples in each batch were randomly selected as validation set samples to ensure that the relative standard deviations were within 10%.

4. Results

4.1. Statistics of Hydrochemical Compositions

The water samples, taken in 2013 and 2019, were classified into five categories: Karst groundwater in the Cambrian and Ordovician limestone aquifers (KGW), groundwater in the Quaternary sediment aquifer (QGW), groundwater in the Permian sandstone aquifer (PGW), mine drainage water (MDW) and surface water (SW). Additionally, karst groundwater samples were further divided into four groups based on the sampling location, which were taken in the recharge area (Zone I), the mining runoff area (Zone II1), the nonmining runoff area (Zone II2) or the discharge area (Zone III). Subsequently, the samples of karst groundwater were divided into KGW1 ~ KGW4 in 2013 and KGW5 ~ KGW8 in 2019, as listed in Table 1 and Table 2.
As shown in Table 1, all the pH values were slightly higher than 7.0, indicating their alkaline nature. The TDS ranged from 313.40~599.60mg/L, with an average of 405.95mg/L. The order of abundance of cation concentrations (expressed in mg/L) were Ca2+ > Mg2+ > Na+ > K+, while those of the anions (expressed in mg/L) were HCO3 > SO42− > Cl > NO3. From Table 2, it can be observed that the range of TDS was 301.50 ~ 798.50 mg/L, with an average of 466.96 mg/L in 2019. The order of abundance of major cation and anion concentrations remained the same, but the concentration of each ion was slightly higher than that in 2013.
In addition, the concentrations of TDS, Ca2+, Mg2+, Cl, SO42 and other major ions increased in the runoff area (Zone II1, II2), especially in the Zone II1 runoff area where coal mines were distributed. The average SO42 concentration was the largest, and the average concentration changed the most. Compared with 2013, the average SO42 concentration increased by 77.78% in Zone II1.
It can also be seen that the major ion concentrations of groundwater in different aquifers varied considerably (Table 2). The highest contents of most major ions (Na+, Ca2+, Cl, SO42, NO3) were observed in QGW, followed by the contents in PGW, and the contents in KGW were the lowest. Moreover, it is worth noticing that the average concentration of SO42 in the mine drainage water was very high, which was close to the average concentration of QGW. While the average concentration of NO3 in the mine drainage water was the lowest, reflecting the ionic components in the mine drainage water may mainly come from the dissolution of sulfate or other minerals, and they were hardly affected by the external environment and human activities, such as domestic wastes and fertilizer application.
The mean concentrations of ions in the surface water (SW) were similar to those in KGW, while they were significantly different from those in QGW and PGW, implying the close hydraulic connection between surface water (SW) and karst groundwater (KGW).
To sum up, KGW had the best quality groundwater, followed by the PGW and MDW, and the QGW was the worst. It reflected that the effect of human activities such as industrial and agricultural activities had a greater impact on shallow groundwater (QGW and PGW) and a relatively little impact on deep groundwater (KGW). Furthermore, from the spatiotemporal perspective, the quality of karst groundwater was deteriorating.
In recent years, the mean concentrations of TDS, Na+, Cl, SO42 and other major ions increased in the runoff area with coal mine distribution (Zone II1), even exceeding those in the discharge area (Zone III), while the concentrations of the major ions had little change in the recharge area (Zone I) and the discharge area (Zone III). This reflected the increase in ion concentrations in karst groundwater, which may be related to human activities such as coal mining.

4.2. Hydrochemical Types

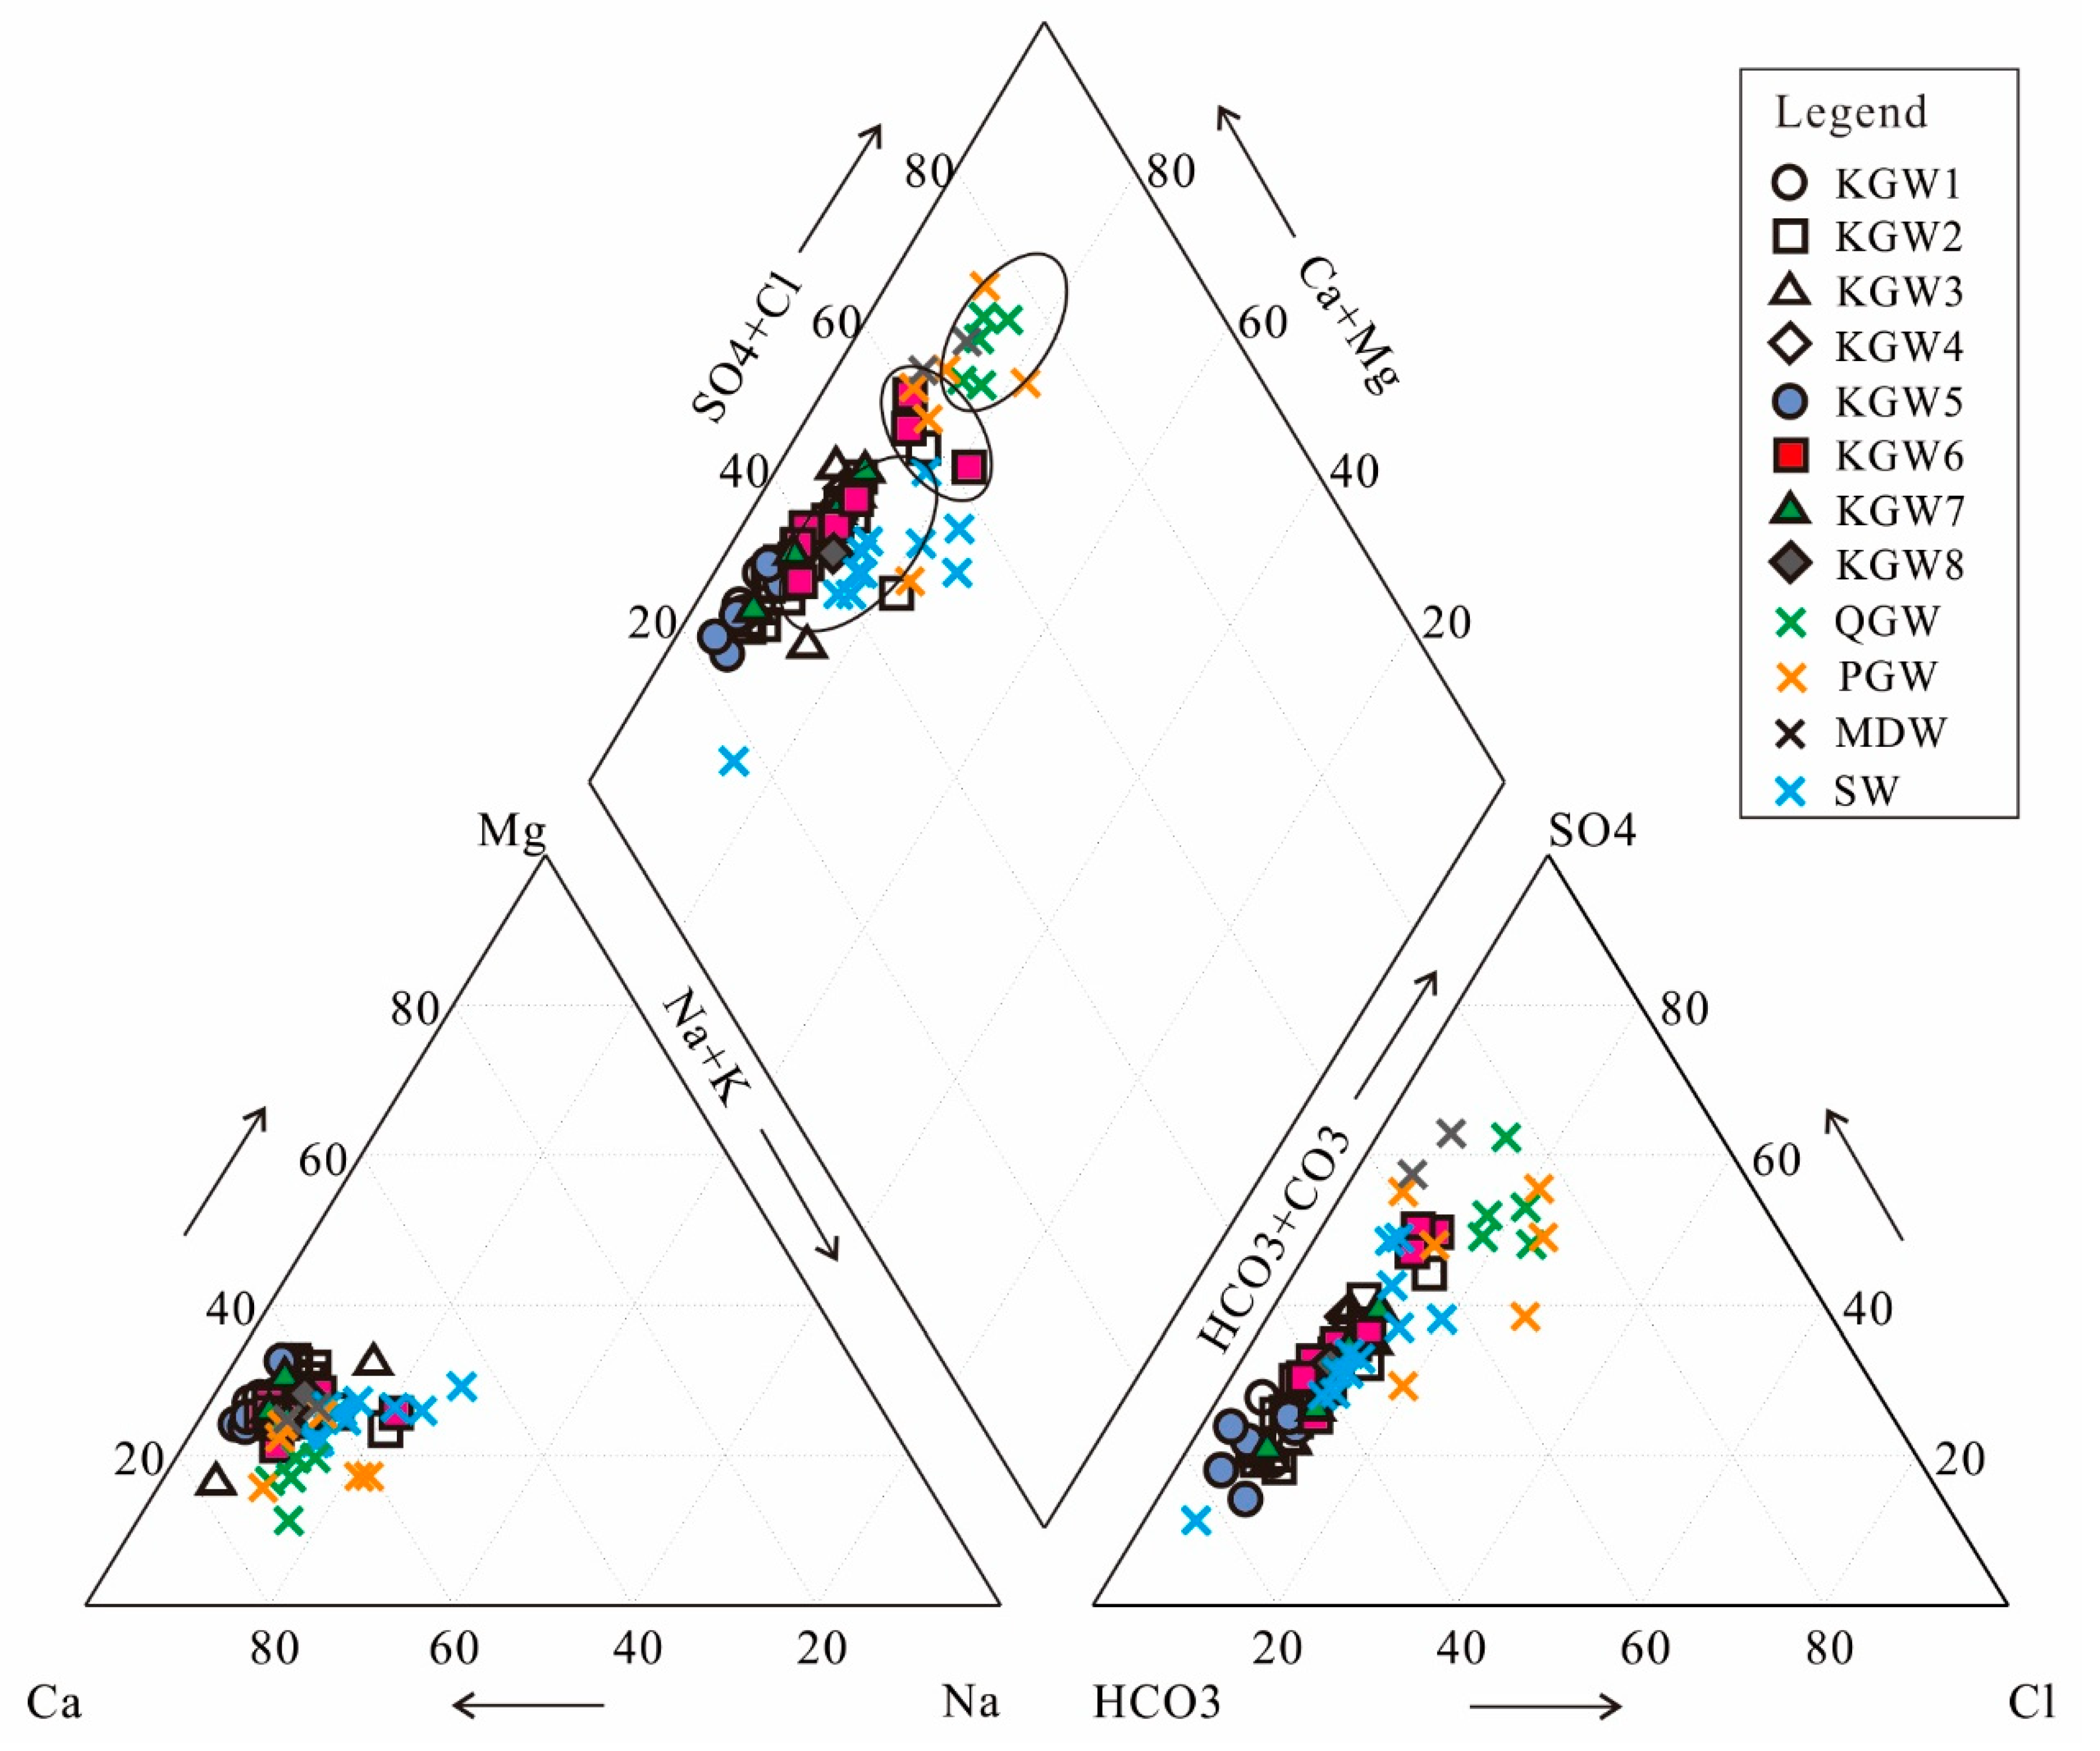
The Piper diagram is often used to show the relative contents of major ions in water samples, and it can be applied to analyze the evolution laws of groundwater [10,27]. With regard to cations, almost all points were close to the lower left triangle, indicating that the Ca2+ type was dominant. For anions, most of the karst groundwater (KGW) and surface water (SW) samples were distributed in the middle and lower corner of the right triangle, showing HCO3 as the dominant anion, while the majority of samples of the Quaternary sediment groundwater (QGW) and Permian sandstone groundwater (PGW) showed the dominance of the SO42- type. Moreover, as shown in Figure 3, most of the samples (including the KGW and SW samples) were found to concentrate in the lower left side of the diamond-shaped field, indicating the hydrochemical type of the HCO3-Ca·Mg, HCO3-Ca and HCO3·SO4-Ca·Mg facies, while the majority of the QGW and PGW samples were distributed in the upper left side of the diamond-shaped area, which was dominated by SO4·HCO3-Ca·Mg, SO4·HCO3-Ca and SO4-Ca water types. This was also consistent with the actual situation. The western and central mountain areas were the recharge areas of karst groundwater. The hydrochemical type was relatively simple. The ion concentrations and hydrochemical types increased from the recharge area to the discharge area, indicating that the rock–water interaction was strengthened. Moreover, the QGW and PGW samples were mostly distributed in the runoff and discharge areas with a shallower groundwater depth in the central and eastern parts of the area. Therefore, they had a relatively close hydraulic connection.
Further analysis showed that the KGW samples from the recharge area were closer to the left lower part of the diamond-shaped field, which were mainly HCO3-Ca·Mg and HCO3-Ca water types, while the hydrochemical types of the KGW samples in the runoff area (Zone II) and discharge area (Zone III) were similar to that of the SW samples with HCO3·SO4-Ca·Mg water types.
Additionally, it was worth noting that the hydrochemical composition of the mine drainage water (MDW) samples was similar to that of some karst groundwater (Zone II1) and Permian sandstone groundwater samples with HCO3·SO4-Ca·Mg and SO4·HCO3-Ca·Mg water types. This might be related to coal seam mining. The coal seams of Carboniferous (C) and Permian (P) contained sulfur elements. Due to the coal mining activities, the upper Permian sandstone aquifer (PGW) and the lower Ordovician limestone aquifer (KGW) were connected, resulting in the mean concentrations of SO42- and other major ions being higher in the mining runoff area (Zone II1).

5. Discussion

5.1. Groundwater Isotopic Composition and Sources

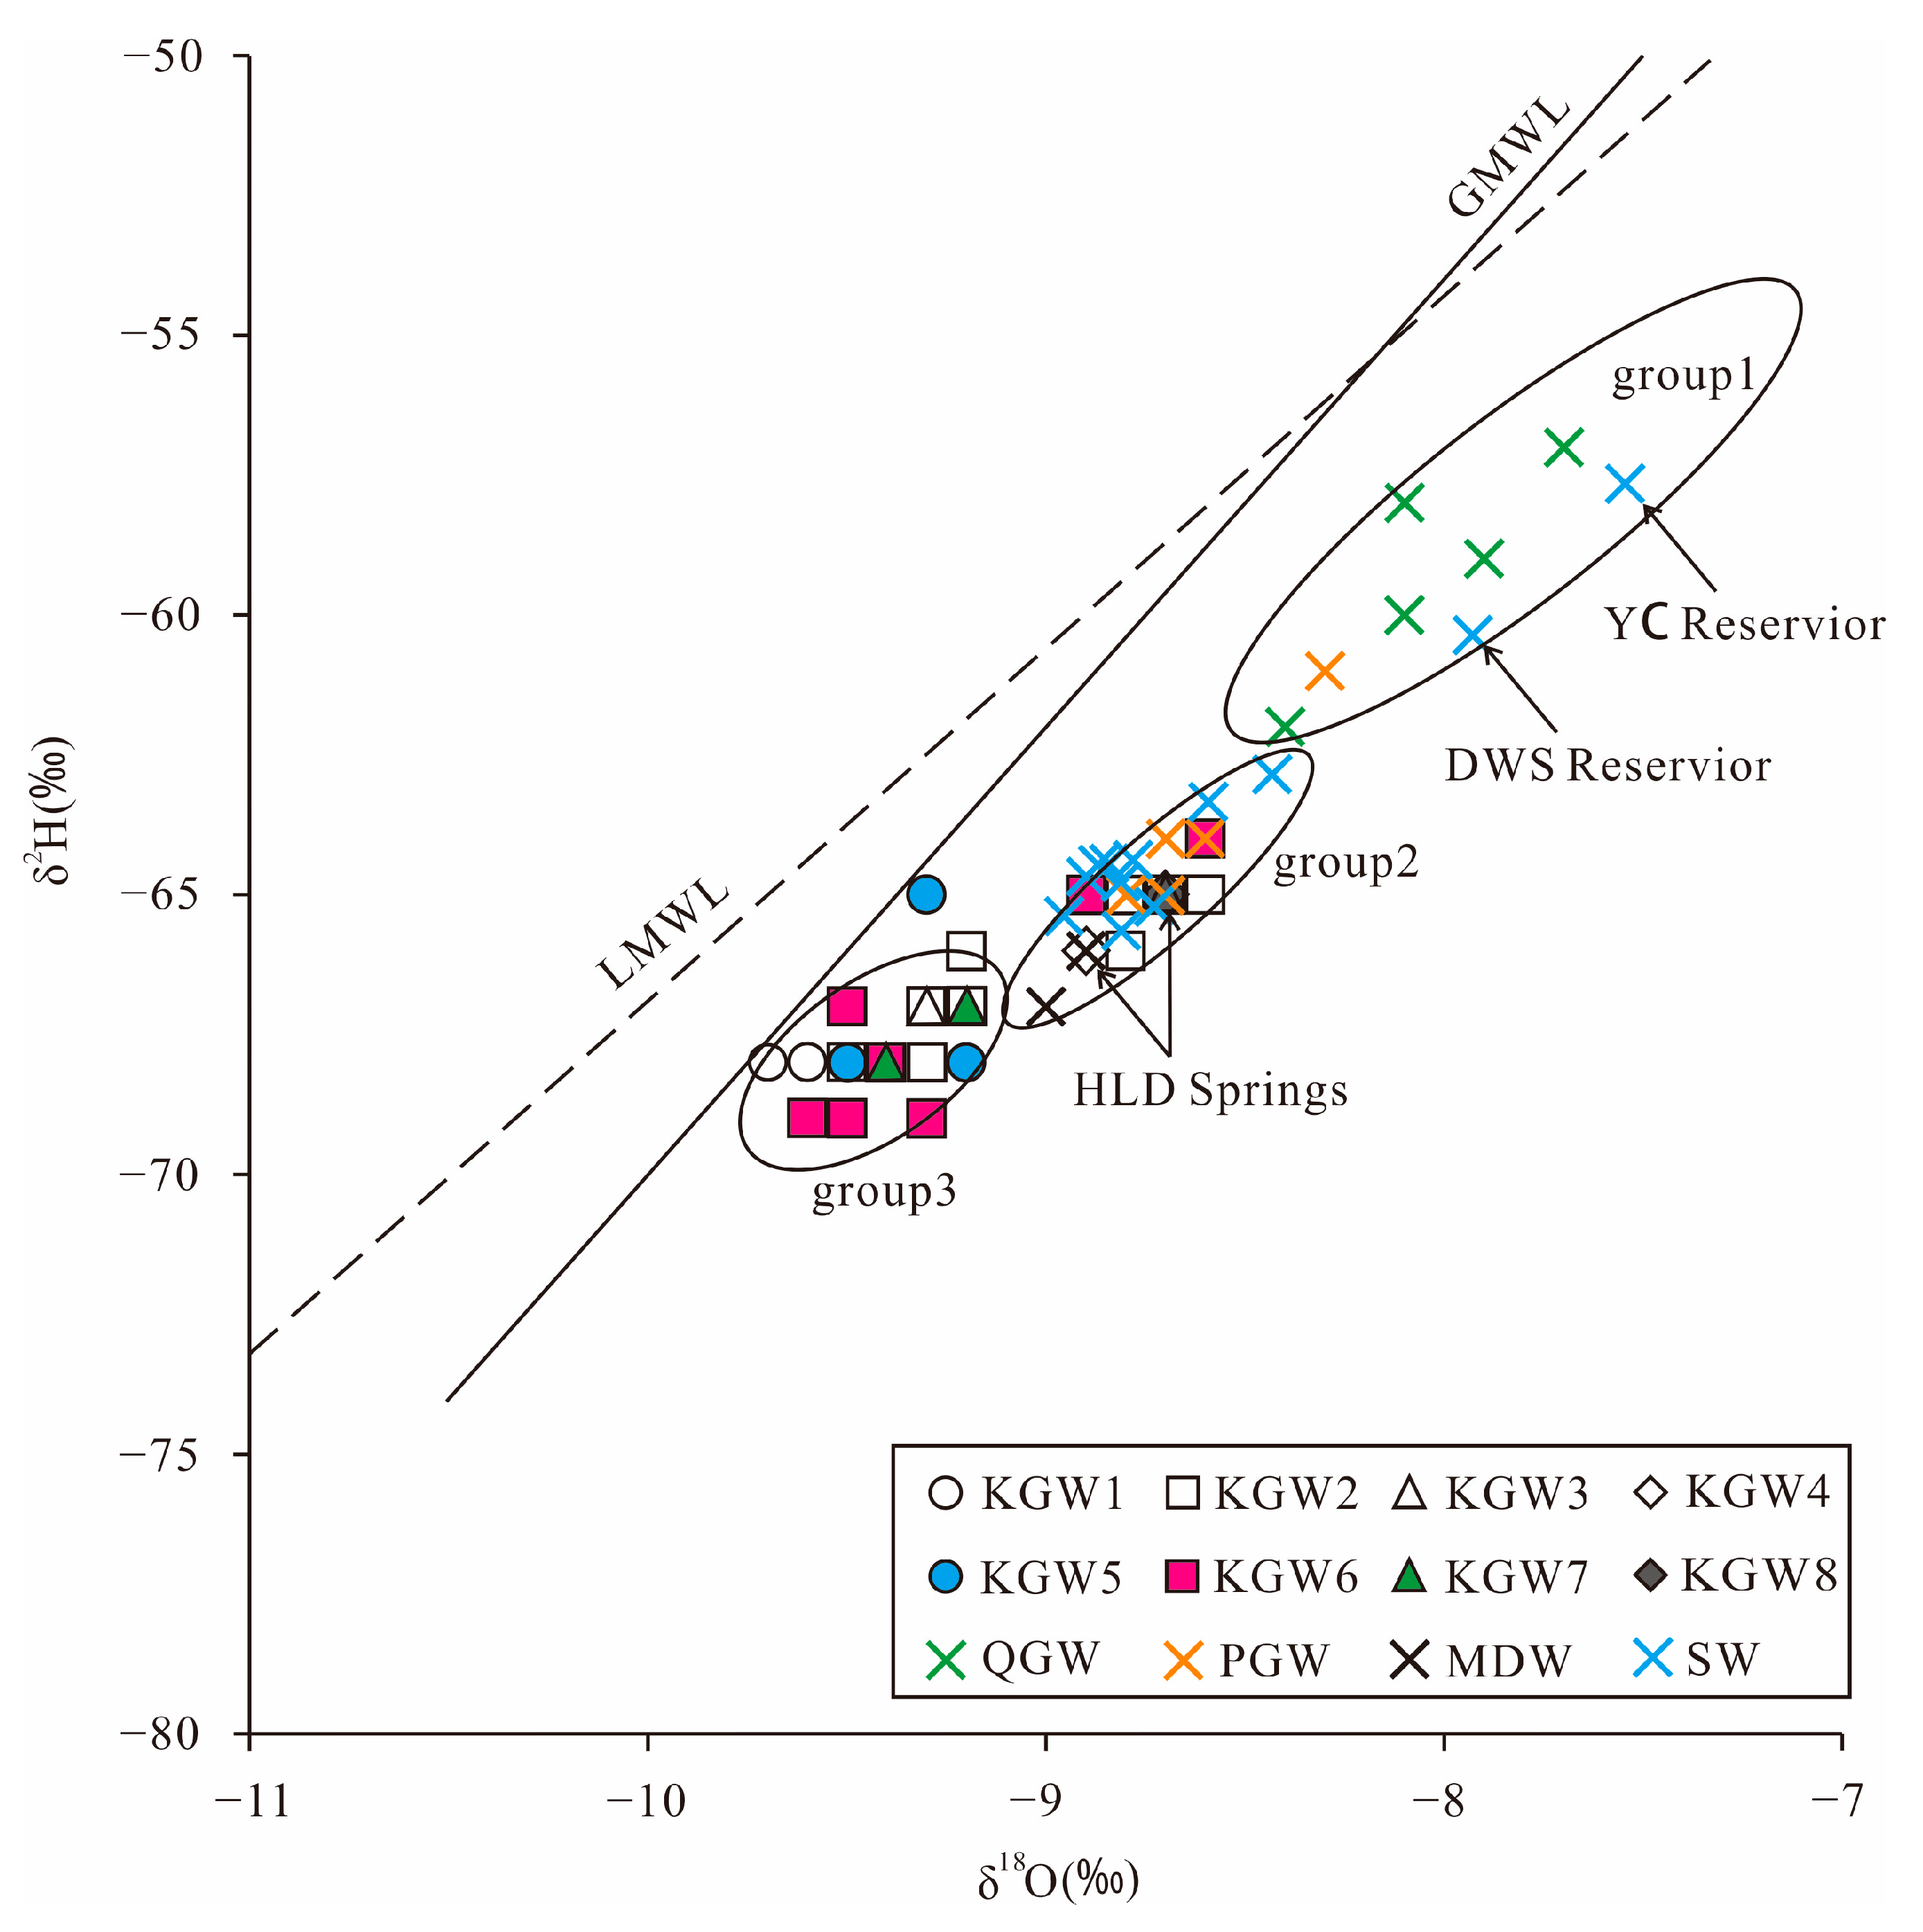
Hydrogen (δ2H) and oxygen (δ18O) isotopes are effective tools for analyzing hydrological processes across various scales [11]. Table 3 summarizes the isotopic composition of the water samples taken in the HSB. The relationship between δ2H and δ18O for all water samples is plotted in Figure 4. Due to the lack of precipitation isotope data in the study area, the data of the adjacent Shijiazhuang station were selected. The local meteoric water line was fitted as δ2H = 6.4δ18O-3.8. The slope and intercept of the local meteoric water line (LMWL) were lower than that of the global meteoric water line (GMWL: δ2H= 8δ18O + 10) [28], which probably resulted from secondary evaporation during rainfall.
As can be seen in Figure 4, all samples were distributed near GMWL and LMWL, indicating that the groundwater in the study area was mainly derived from meteoric water. In addition, all the samples were distributed in parallel to the LMWL, but the intercept was lower. This phenomenon can be interpreted as the evaporated soil moisture mixing with the subsequent rainfall, which infiltrated the soil and impelled the residual water downward by regular rainfall events [7].
The δ2H and δ18O values of the QGW samples ranged from −62.0 to −57.0 and −8.4~−7.7, respectively. The PGW samples ranged from −65.0 to −64.0 and −8.8~−8.5, respectively. The KGW samples ranged from −69.0 to −64.0 and −9.6~−8.6, respectively, while the MDW samples ranged from −67.0 to −66.0 and −9.1~−8.9, respectively (Table 3).
It can also be seen that the QGW samples were concentrated in the upper right corner (group 1), which reflected the fact that the QGW potentially underwent strong evaporation, resulting in higher δ2H and δ18O values, while the δ2H and δ18O values for most of the KGW samples were significantly low, implying the KGW was probably formed by precipitation under wet and cold climate or high-altitude conditions [10,18]. In addition, the δ2H and δ18O values of the PGW and MDW samples were closer to those of the KGW samples, reflecting that some of the KGW samples had a relatively close hydraulic connection with the PGW and MDW samples.
It is worth noting that most of the surface water (SW) samples were located in group 2, except the YC Reservoir (S11) and DWS Reservoir (S12). The river water samples were isotopically similar to the spring water and some of the KGW samples. This showed that both the reservoir water and the Quaternary groundwater (QGW) had experienced strong evaporation. The concentration of heavy isotopes in the reservoir water was higher than that in the river water. The river water was mainly recharged by the karst groundwater rather than precipitation.

5.2. Rock Weathering and Evaporation

A Gibbs diagram can be used to ascertain the influence of rock weathering, precipitation and evaporation on water chemistry [29]. As shown in Figure 5, almost all the groundwater samples were affected by rock weathering. In addition, the values of ρ(Na+)/ρ(Na+ + Ca2+), ρ(Cl)/ρ(Cl + HCO3) and TDS in most of the QGW and PGW samples were relatively high, which indicated that the hydrochemical compositions of QGW and PGW were affected by evaporation. It is also worth noting that the TDS of the karst groundwater in the recharge area (Zone I) had little change with the increase in ρ(Na+)/ρ(Na+ + Ca2+) and ρ(Cl)/ρ(Cl + HCO3) values, indicating that cation exchange also played an essential role under the background of rock dominance, while the TDS concentrations of the karst groundwater in the runoff area (Zone II) and discharge area (Zone III) had a rising trend with the increase in ρ(Na+)/ρ(Na+ + Ca2+) and ρ(Cl)/ρ(Cl + HCO3) values, implying that the increase in TDS concentrations was potentially associated with human activities.

5.3. Correlation of Hydrochemical Composition

The consistency of the sources of the hydrochemical composition in groundwater can be inferred with a correlation analysis [10,30]. The correlation matrix of the major water chemical index was determined using SPSS software (Table 4). The results showed that TDS had a high positive correlation (r ≥ 0.70, p = 0.01) with Na+, Ca2+, Mg2+, Cl, SO42 and HCO3, which proved that the above ions were the main factors affecting the TDS value. Na+-Cl, Ca2+-SO42, Ca2+-HCO3 and Ca2+-Mg2+ also had a high positive correlation (r ≥ 0.70, p = 0.01), indicating that the dissolution of carbonate, sulfate and halite occurred in the study area. In addition, the NO3 had a positive strong correlation with Na+ and Cl (r ≥ 0.70, p = 0.01) and moderate correlations with Ca2+ and SO42 (0.50 ≤ r <0.70, p = 0.01). As mentioned above, the NO3 concentration was relatively high and had a relatively high correlation with Na+ and HCO3, indicating that NO3 in groundwater might be related to anthropogenic activities such as agricultural irrigation and domestic pollution.

5.4. Water–Rock Interaction

The ratios of ion concentrations can effectively reflect the formation mechanisms and sources of the major ions in groundwater [11,31].
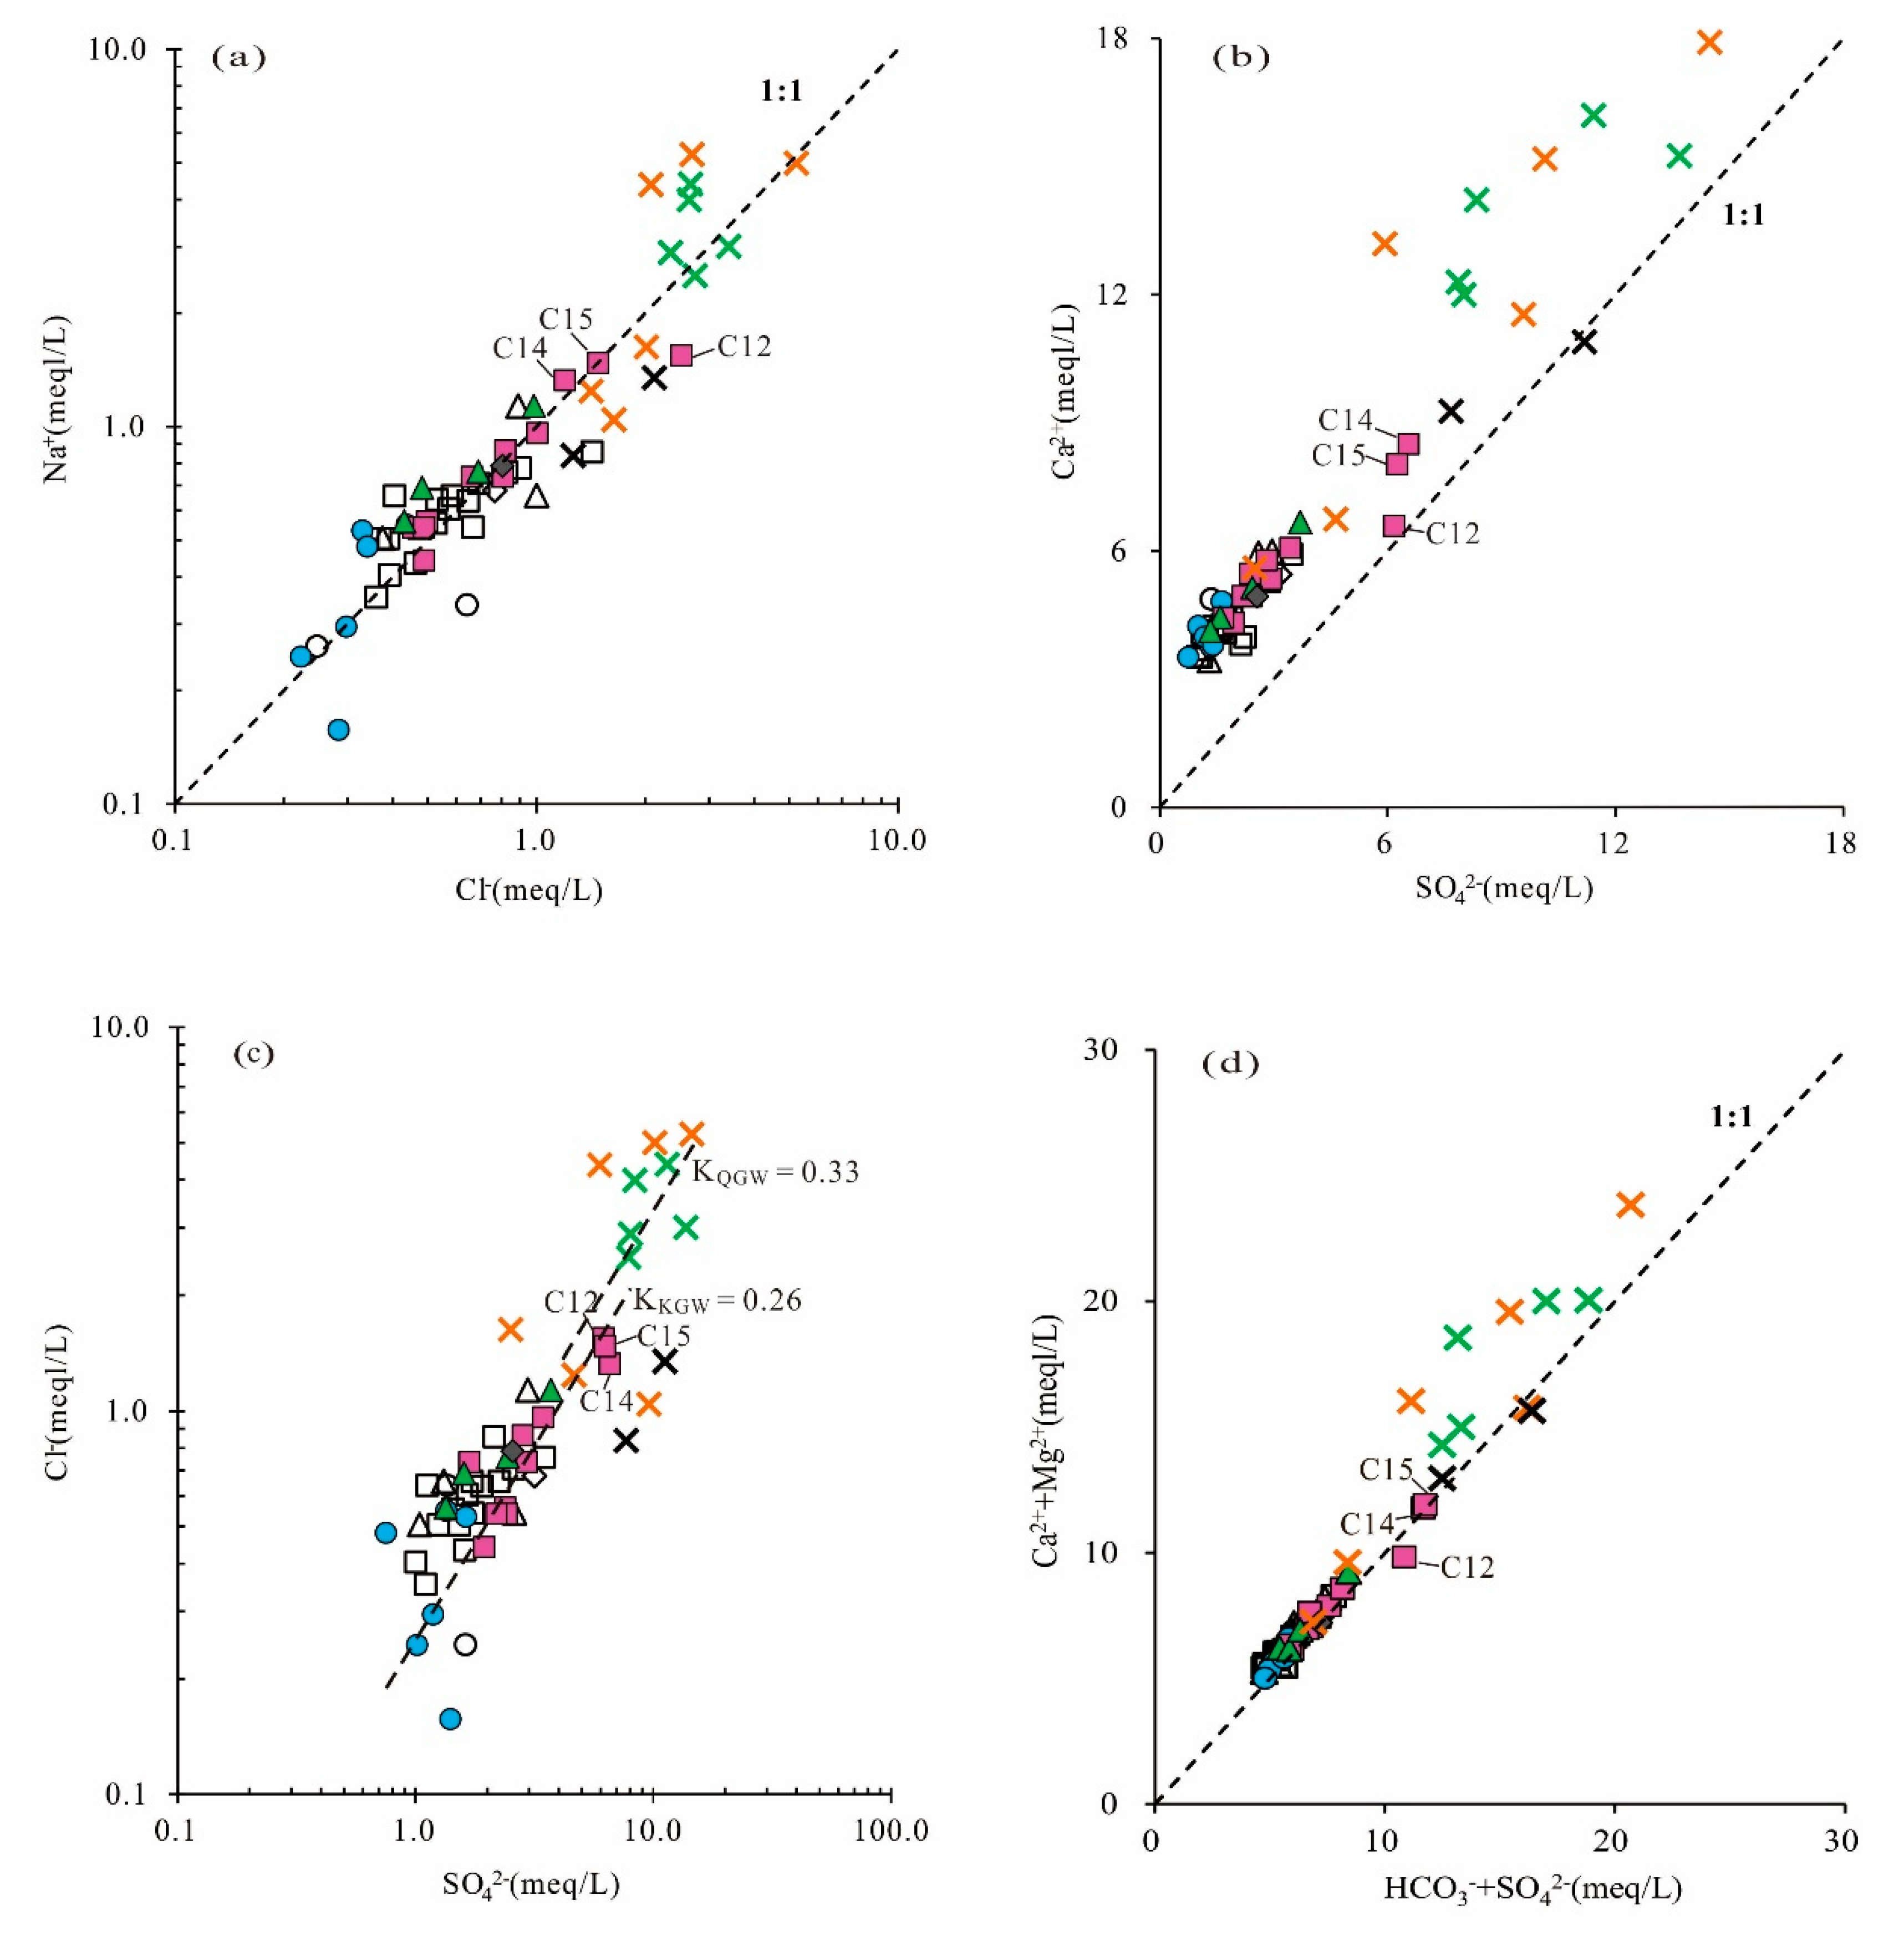
The scatter diagram of Cl versus Na+ (Figure 6a) showed that almost all the water samples were close to the 1:1 line. It indicated that the dissolution of halite might be the main source of Cl and Na+ in different types of groundwater. The ratio of Na+/Cl ranged from 0.47 to 1.80 with a mean value of 0.99. The results followed the expected 1:1 trend line, which further confirmed that Na+ and Cl were derived primarily from halite dissolution. Halite could dissolve continuously into the groundwater.
In the plot of SO42 and Ca2+, if gypsum dissolution is the only source of SO42 in the groundwater, Ca2+/SO42 will follow the 1:1 line. It can be seen in Figure 6b that the majority of the samples were distributed above the 1:1 line, and the Ca2+ concentration was higher than SO42, suggesting that Ca2+ was not completely from gypsum dissolution and that there were other sources such as carbonate (dolomite, calcite) mineral dissolution, reverse cation exchange or anthropogenic input.
As shown in Figure 6c, there were no significant correlations between SO42 and Cl in some of the PGW and KGW samples (Zone I), while there were significant positive correlations between SO42 and Cl in the majority of QGW, PGW and KGW samples from the runoff area (Zone II). It indicated that SO42 and Cl in these samples probably had the same sources and might have been related to anthropogenic activities, such as coal mining development, agricultural irrigation and industrial production. In addition, it was worth noting that the slope of Cl/SO42 in the QGW was higher than that in the KGW, implying that anthropogenic activities had a greater impact on shallow groundwater, resulting in higher concentrations of SO42 and Cl.
The relationship between (HCO3+SO42) and (Ca2++Mg2+) (expressed in meq/L) in groundwater samples will follow the 1:1 line if these ions are strongly controlled by the carbonate and gypsum equilibrium [18]. As shown in the scatter plot (Figure 6d), nearly all the KGW samples were distributed along the equiline (1:1 line), reflecting that Ca2+, Mg2+, HCO3 and SO42 were mainly derived from the dissolution of carbonate and gypsum, whereas most of the QGW and PGW samples fell above the 1:1 line, indicating that there were extra sources of Ca2+ and Mg2+ in the QGW and PGW, such as the dissolution of silicate minerals.
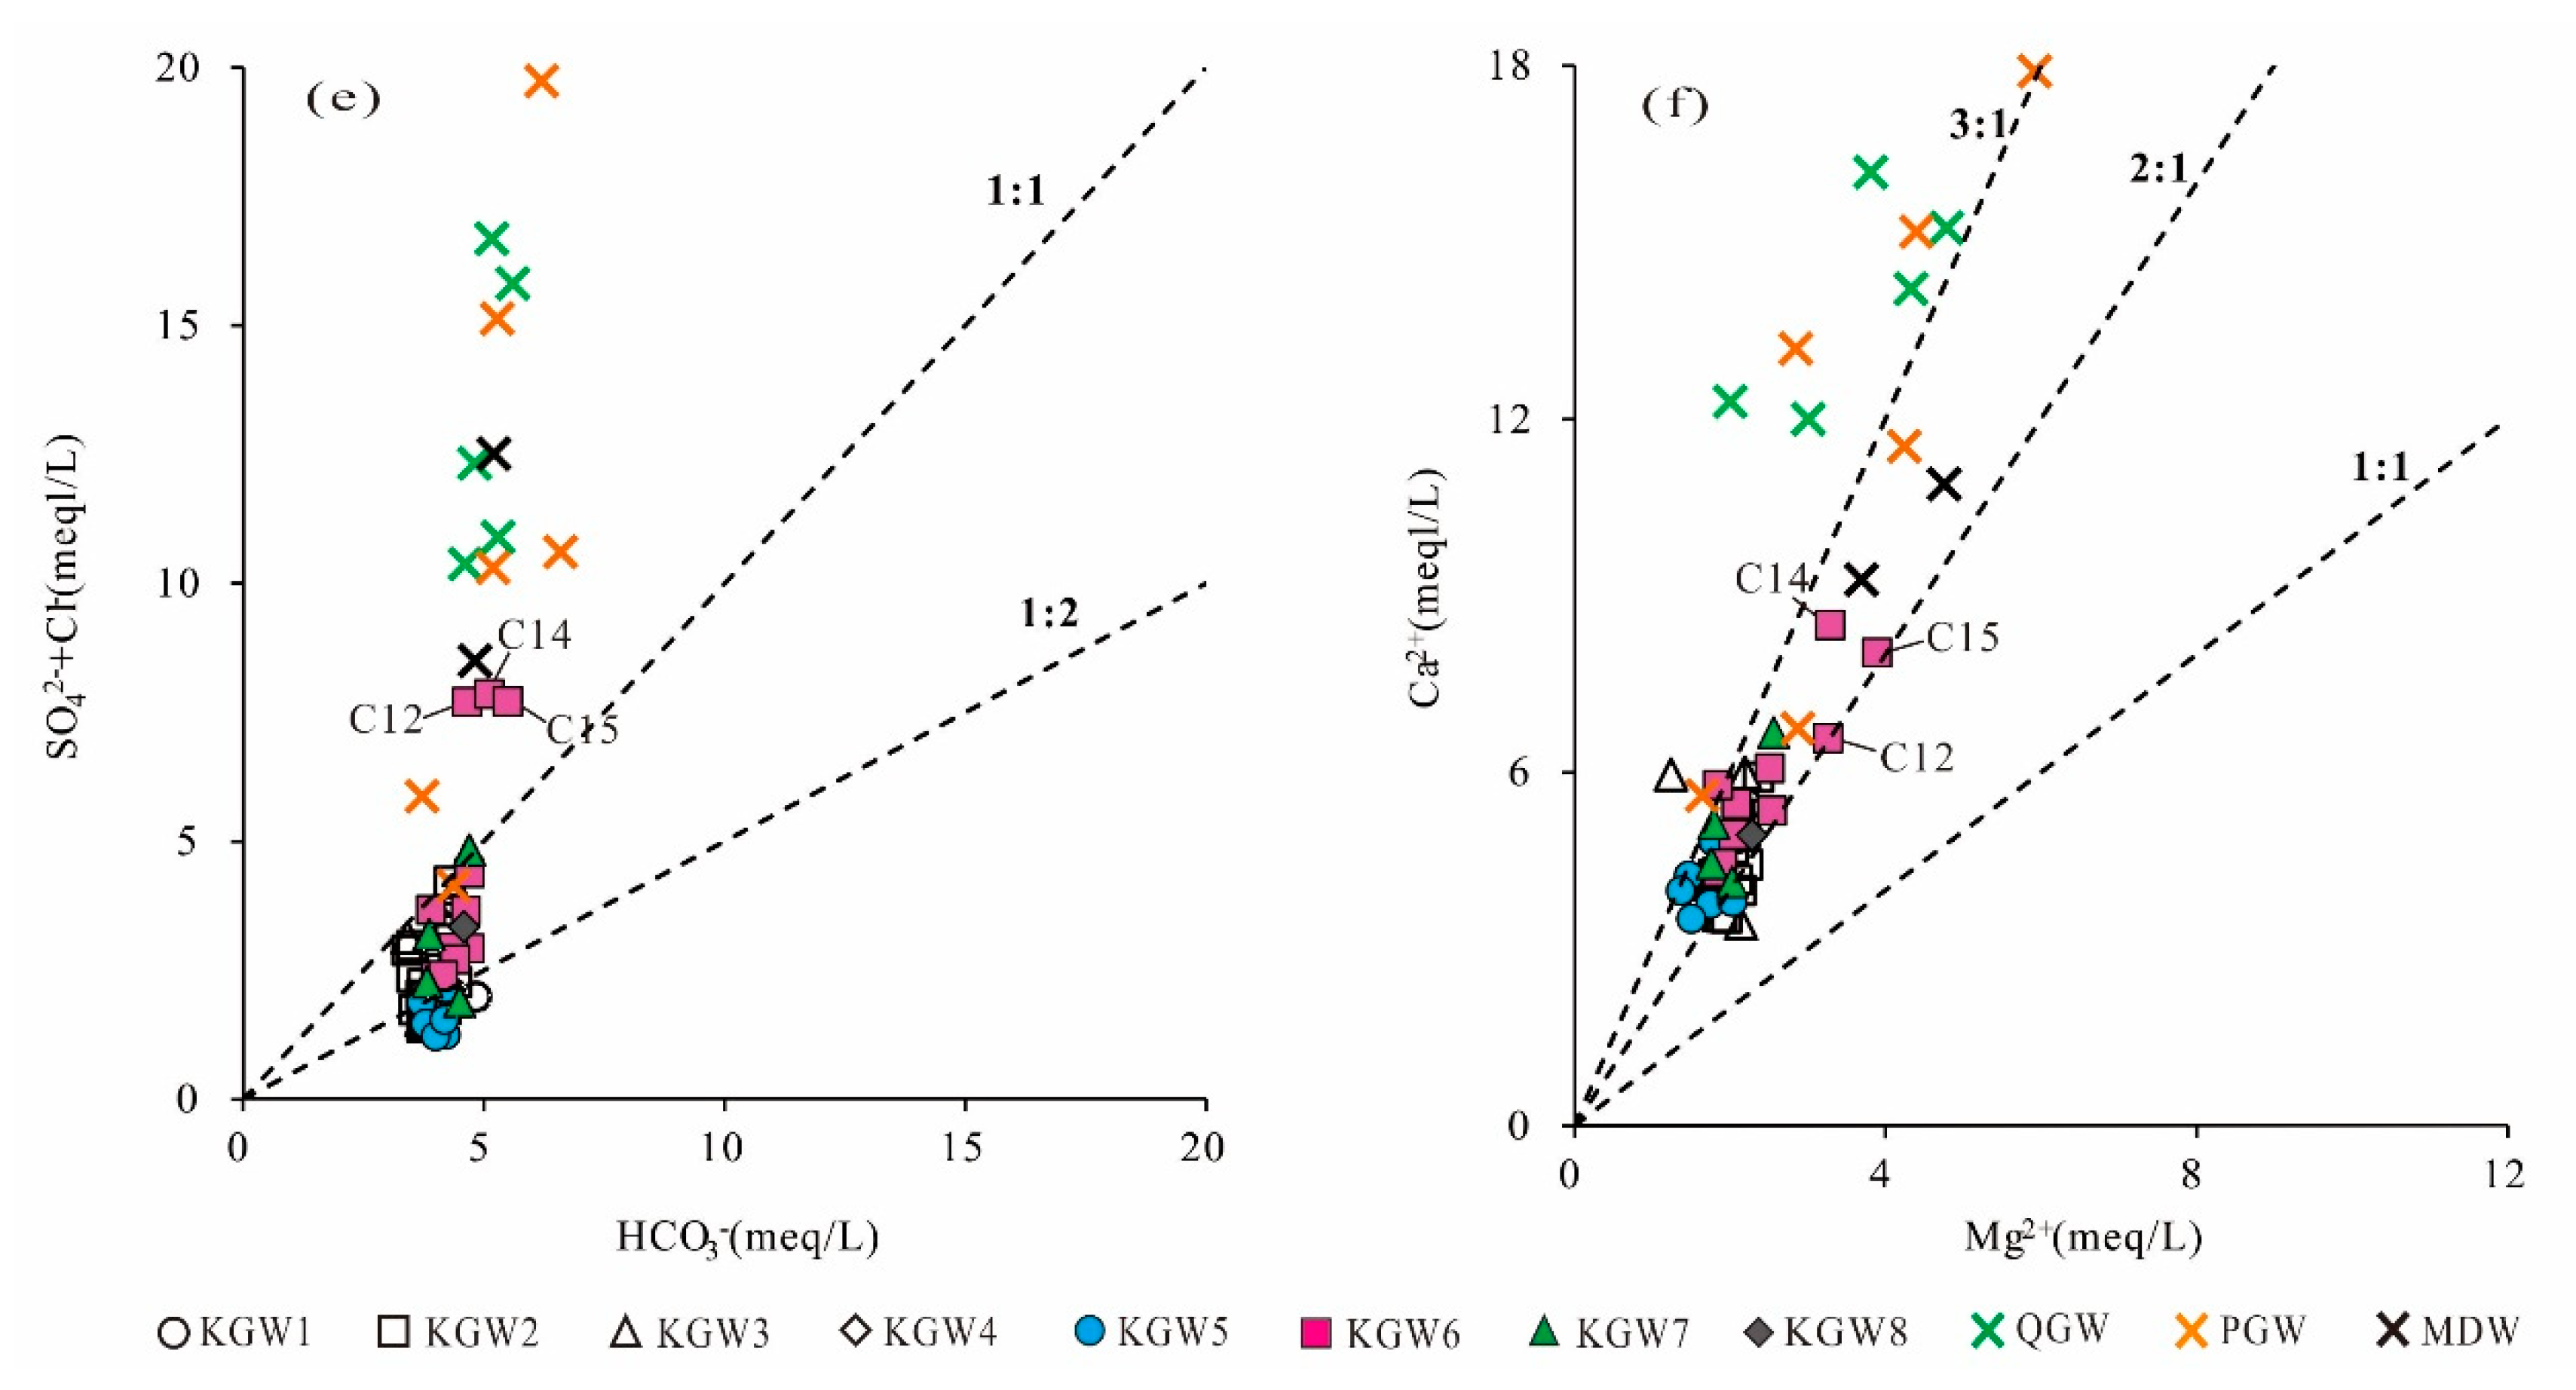
From the relationship between HCO3 and (Cl+SO42) (Figure 6e), it can be seen that most of the PGW, QGW and KGW samples had different influence mechanisms in the area. Specifically, the majority of KGW samples were below the 1:1 line except for three points, indicating that most of the KGW samples were dominated by the dissolution of carbonate rocks. While most of the QGW and PGW samples deviated far from the 1:1 line, the high concentration of Cl and SO42 could be related to agricultural and industrial activities. Excess Cl and SO42 were the evidence of increased pollution. In addition, three KGW samples (C12, C14, C15) from the coal mining runoff area (Zone II1) were distributed above the 1:1 line and mixed with the QGW and PGW samples, suggesting that the karst groundwater in some runoff areas closely connected with the shallow groundwater and was affected by anthropogenic activities.
The scatter plots of Mg2+ versus Ca2+ can be used to infer whether the Mg2+ and Ca2+ in groundwater were derived from the dissolution of dolomite, calcite and gypsum. Theoretically, when the ratio of γ(Ca2+)/γ(Mg2+) is 1:1, it indicates that dolomite is dissolved in groundwater. When the ratio of γ(Ca2+)/γ(Mg2+) is 2:1, it implies that calcite and dolomite are dissolved at the same time in groundwater. If the ratio of γ(Ca2+)/γ(Mg2+) is greater than two, there are other sources of Ca2+ in the groundwater, such as gypsum dissolution, silicate dissolution, reverse cation exchange or external input. As shown in Figure 6f, almost all the KGW samples were located between the 2:1 and 3:1 lines. The concentration of Ca2+ in the groundwater ranged from 3.4 to 8.5 meq/L with a mean of 4.8 meq/L. The concentration of Mg2+ varied from 1.2 to 3.9 meq/L and had an average mean of 2.0 meq/L. It implied that the dissolution of calcite, dolomite and gypsum might occur simultaneously in the carbonate aquifer. In contrast, most of the PGW and QGW samples fell above the 3:1 line. The concentration of Ca2+ was much greater than that of Mg2+, which indicated that there might be other factors contributing to excessive Ca2+, such as the dissolution of silicate minerals.

5.5. Ion Exchange Processes

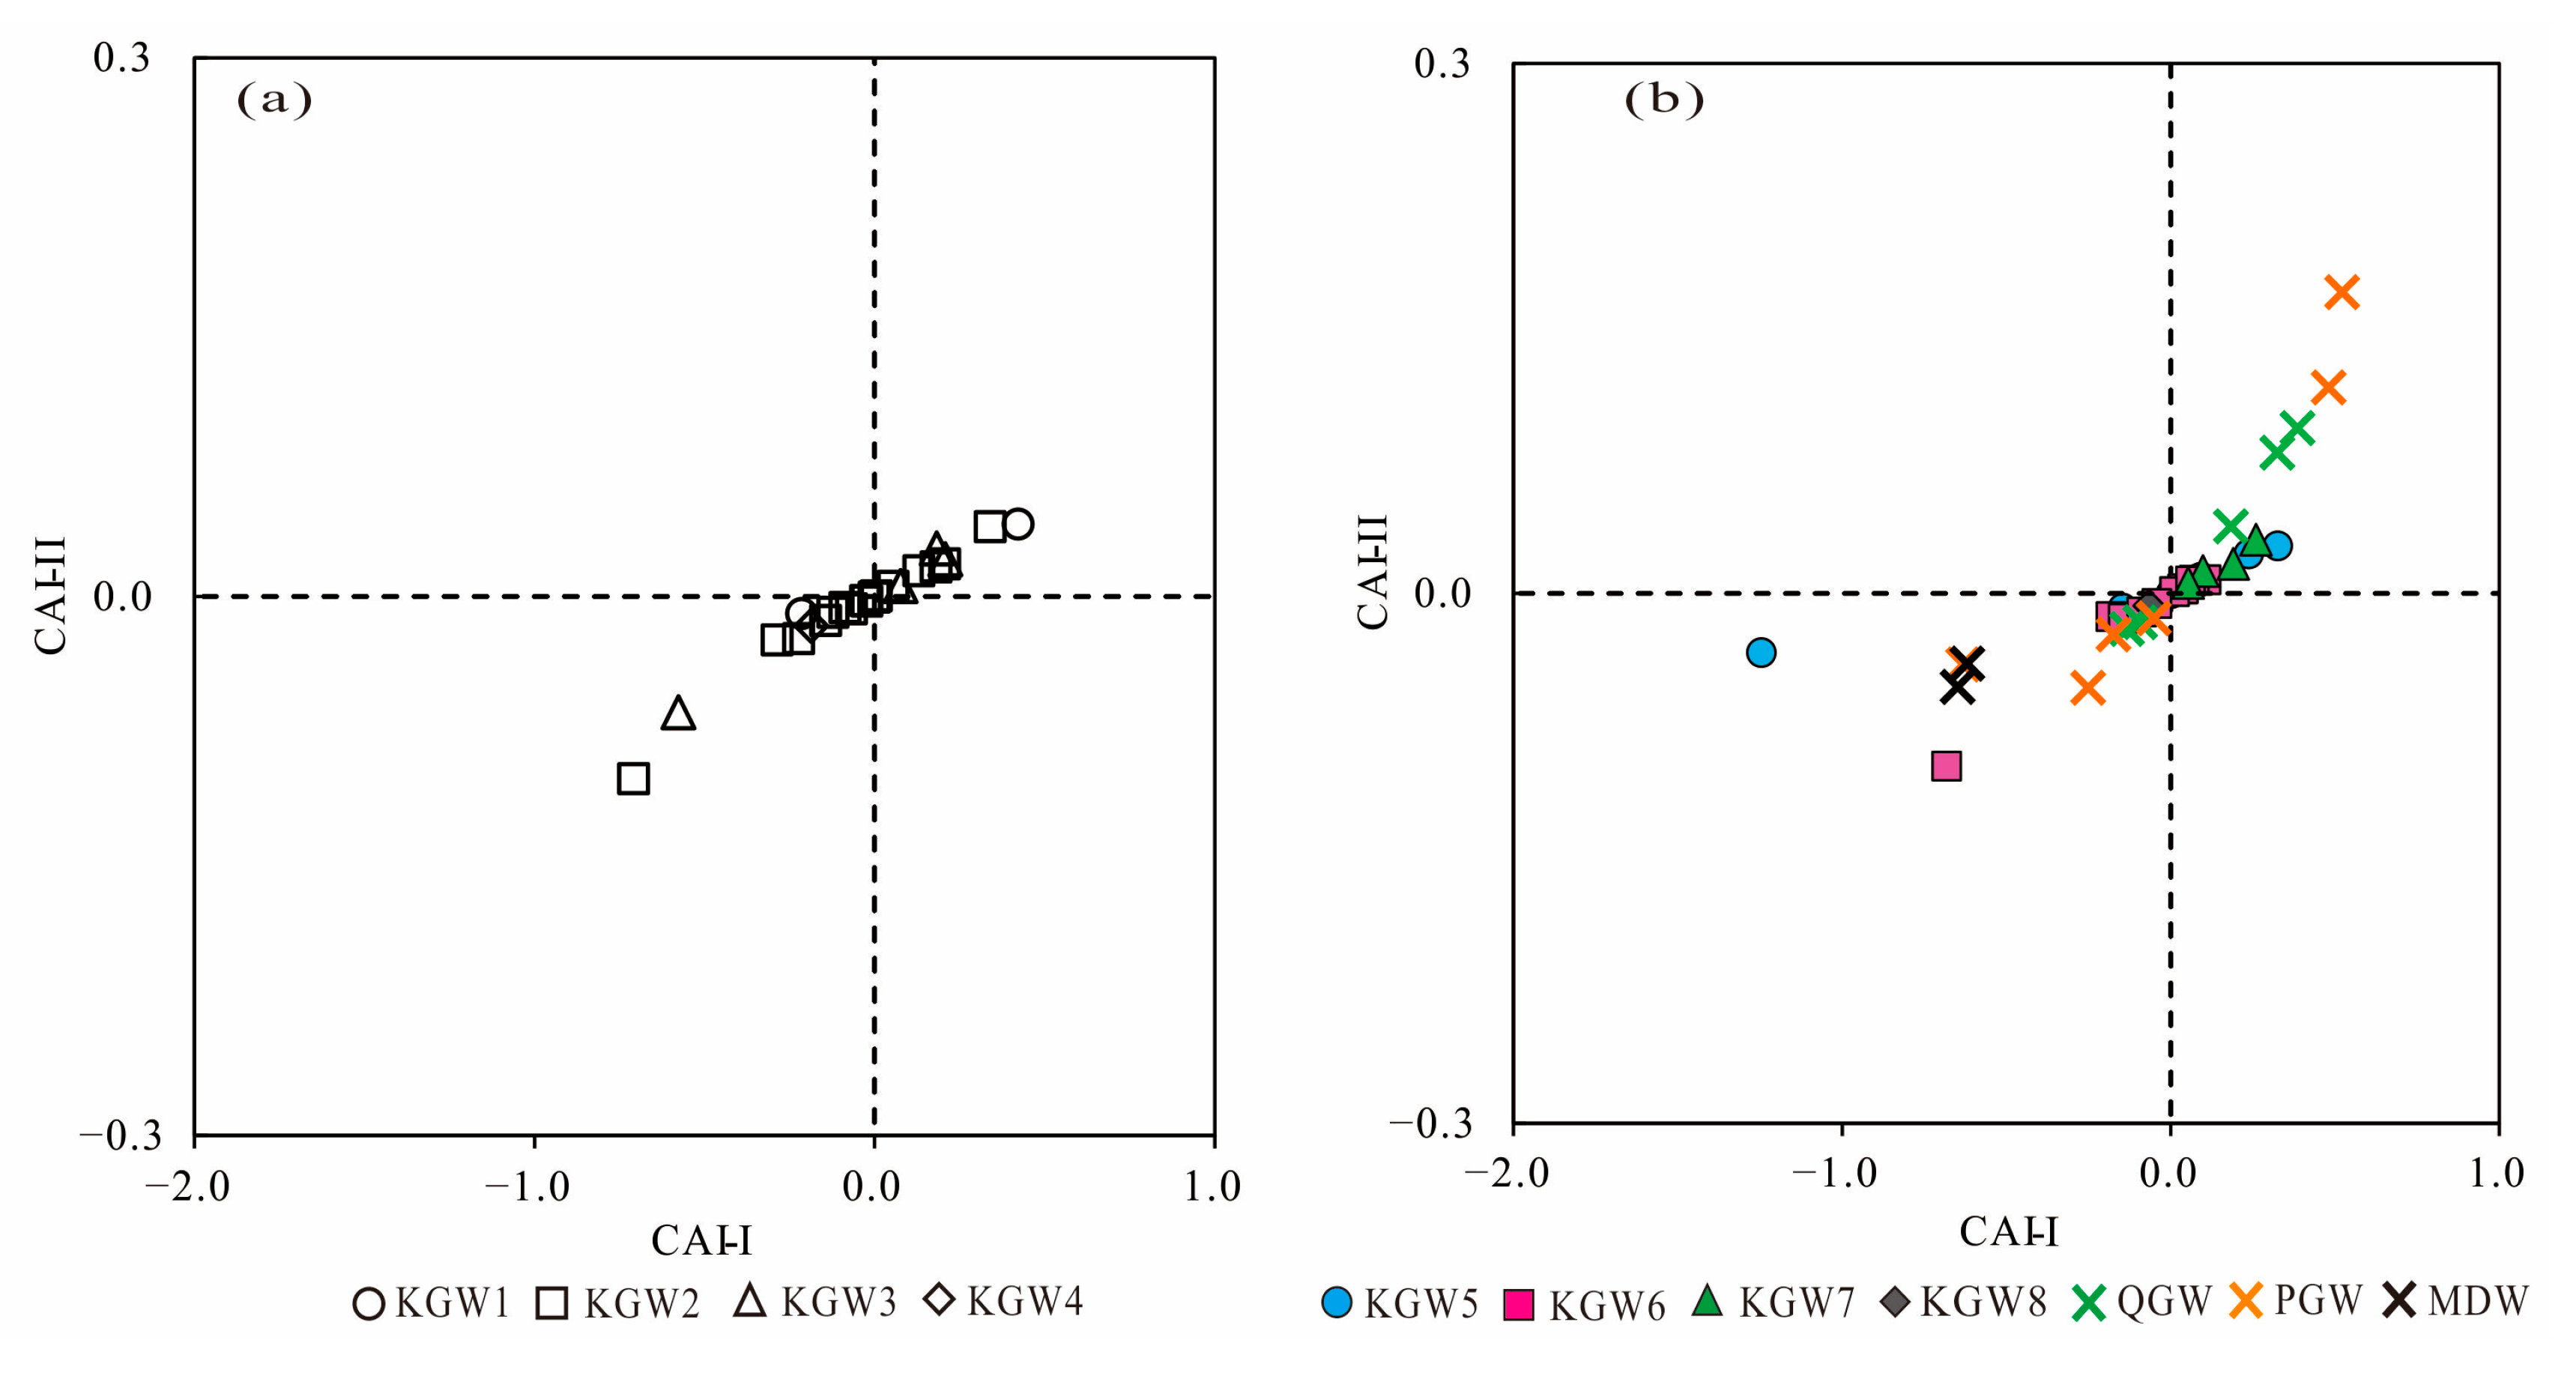
Ion exchange is a natural reaction in the hydrochemical evolution of groundwater, which influences the major chemical composition of groundwater. The Schoeller indices (CAI-I and CAI-II) are vital indicators of the ion exchange occurring in the aquifer [32,33]. The CAI (CAI-I and CAI-II) value can be positive or negative; the positive CAI value indicates that the ion exchange takes place between Ca2+ and Mg2+ from the rocks with Na+ of the water, and similarly, the negative CAI value means the Na+ from the rocks was replaced by Ca2+ and Mg2+ in the water. The ion exchange reactions can be expressed by the following equations (Equations (1) and (2)):
CAI-I = Cl − (Na+ + K+)/Cl
CAI-II = Cl − (Na+ + K+)/(HCO3 + SO42 + CO32 + NO3)
Both of the indices (CAI-I and CAI-II) are positive, implying that a reverse ion exchange occurs in the groundwater, whereas the negative values of CAI indicate forward ion exchange in the groundwater.
As shown in Figure 7a,b, there were both positive and negative ion exchanges of all samples in 2013 and 2019, indicating that the forward and reverse ion exchange simultaneously occurred in different types of groundwater.

5.6. Saturation Indices

To better understand the equilibrium state between groundwater and minerals, the saturation indices (SI) of calcite, dolomite, gypsum and halite were calculated with PHREEQC [34,35]. Generally, the SI value is less than −0.5, between −0.5 and 0.5 or greater than 0.5, which represents that the mineral is in an unsaturated state (dissolution), saturated state (equilibrium) or oversaturated state (precipitation), respectively [10]. The SI values of calcite and dolomite in the karst groundwater indicated notable differences in 2013 and 2019. As shown in Figure 8a,b, the SI values of calcite and dolomite in the karst groundwater ranged from 0.30 to 1.33 and 0.20 to 2.39, respectively, with an average of 0.86 and 1.41 in 2013. It suggested that the karst groundwater was oversaturated with respect to calcite and dolomite in 2013, and these carbonate mineral phases might have influenced the chemical composition in the HSB. However, the SI values of calcite and dolomite in the karst groundwater varied from 0.16 to 0.66 and −0.08 to 1.13 with a mean of 0.40 and 0.44, respectively, in 2019, indicating that the karst groundwater was saturated with respect to calcite and dolomite in 2019. Especially in the runoff area where coal mines were distributed (Zone II1), most of the KGW samples changed from the oversaturated to saturated state during 2013–2019.
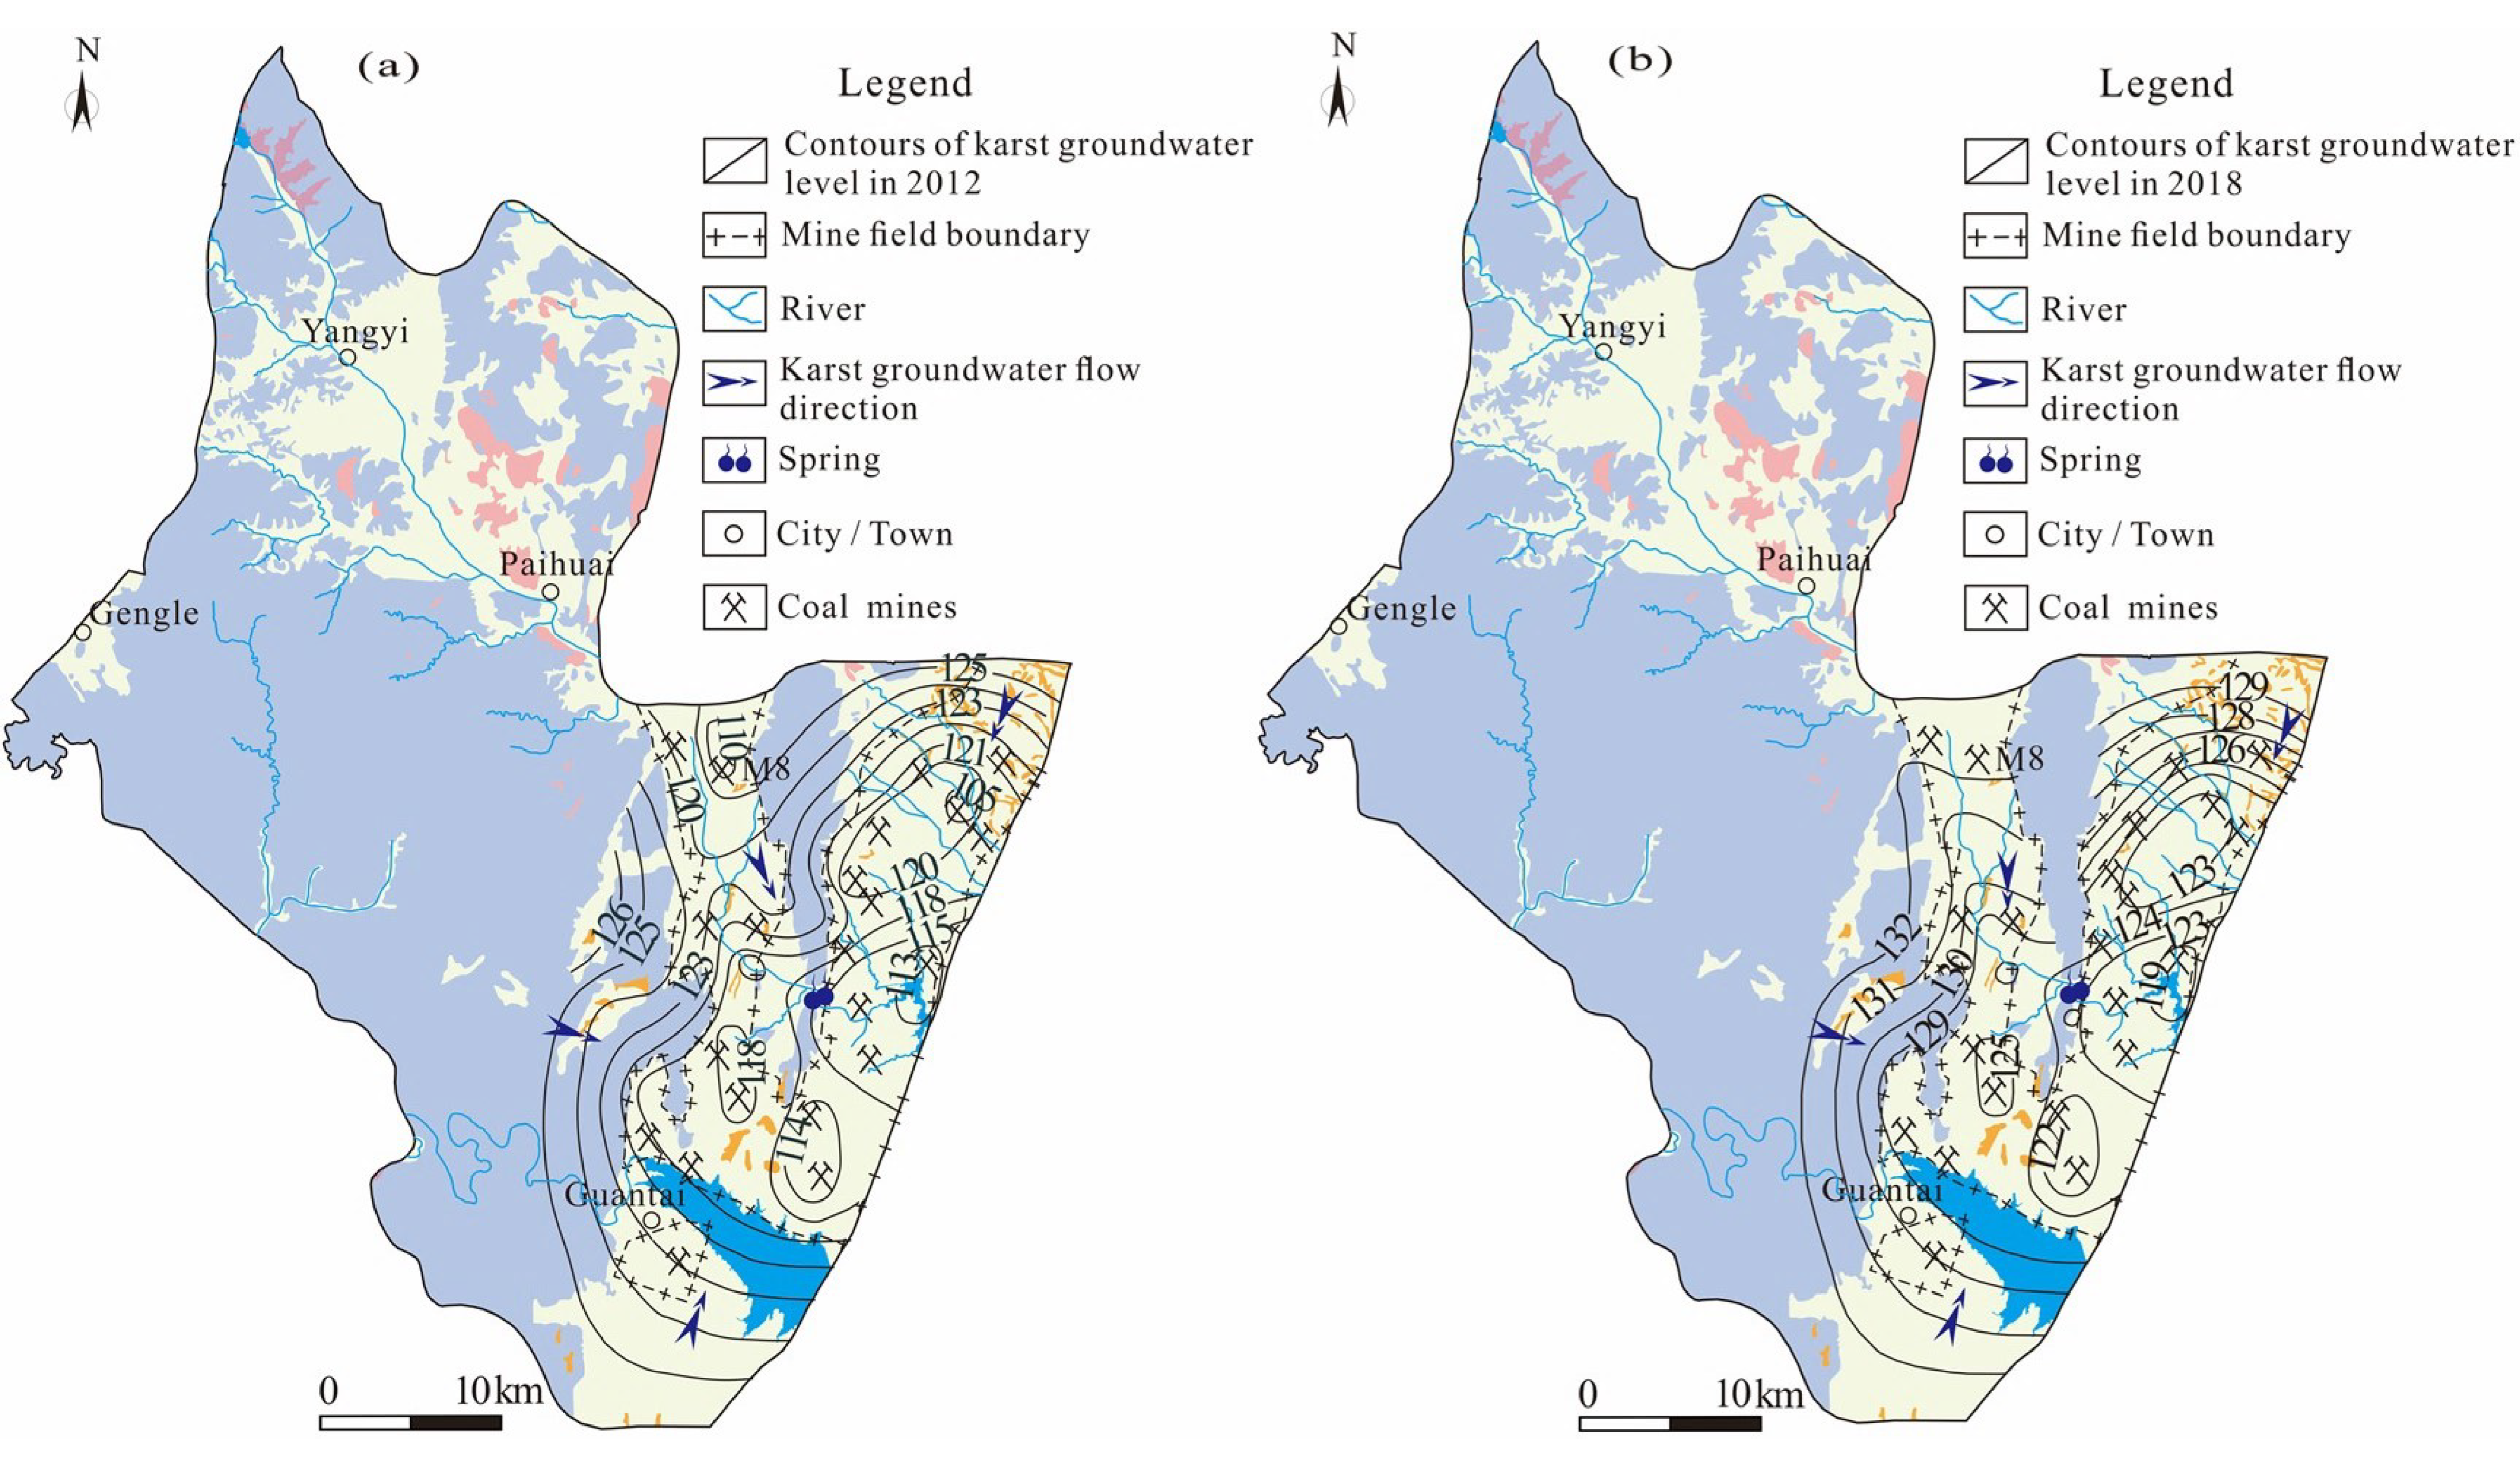
This might have been related to the overall uplift of the karst groundwater level in the study area. Understanding the temporal and spatial variations in groundwater level is an essential prerequisite for groundwater management [36]. Taking the northern runoff area as an example (Figure 9), only one coal mine (M8) in the northern runoff area was in production (this coal mine was closed in 2016), and the karst groundwater level was between 118 and 123 m in 2012. In recent years, due to the increase in rainfall and the decrease in exploitation, the karst groundwater level in the northern runoff area rose to 124~132 m, with the overall groundwater level rising by 6~8 m and even 15 m in some areas in 2018 [37]. Consequently, the overall groundwater level was relatively low, and the flow was very slowly affected by natural and human factors in 2012–2013, as calcite and dolomite minerals were in an oversaturated state. However, the calcite and dolomite minerals gradually transited to a saturated state with the groundwater level rising during the period of 2018–2019. As time goes on, if the groundwater level continues to rise, the groundwater and minerals will be expected to reach a new equilibrium state again.
The SI values of gypsum and halite in the karst groundwater in 2013 and 2019 are shown in Figure 8c and Figure 8d, respectively. The SI values of gypsum and halite in the karst groundwater ranged from −1.93 to −1.27 and −8.84 to −7.57, respectively, with an average of −1.62 and −8.15 in 2013, respectively, indicating that gypsum and halite minerals were in a dissolved state in 2013. In contrast, the SI values of gypsum and halite in the karst groundwater varied from −2.03 to −0.92 and −9.00 to −7.09 with a mean of −1.49 and −8.09 in 2019, respectively. Compared with 2013, the SI values of gypsum and halite had little change in 2019. In addition, the SI values of gypsum and halite showed an increasing tendency along the TDS, which indicated that the increase in TDS concentration in the karst groundwater might be related to the dissolution of gypsum and halite, whereas there were no significant correlations between the TDS and SI values of calcite and dolomite, which indicated that the dissolution of calcite and dolomite was a very rapid process. Considering the carbonate rocks were widely distributed in the aquifer of the entire region, the dissolution of carbonate rocks had most likely been completed rapidly in the initial stage of the chemical evolution in the karst groundwater. Therefore, it can be considered that carbonate rock dissolution was an important source of HCO3, Ca2+ and Mg2+ in karst groundwater, which was consistent with the above conclusion.
Furthermore, the SI values of calcite, dolomite, gypsum and halite had little difference in different aquifers. However, the TDS concentrations from Quaternary sediment and most Permian sandstone aquifers were obviously higher than those in carbonate aquifers. It showed that there was a close hydraulic connection between Quaternary sediment groundwater and most Permian sandstone groundwater, which was likely affected by human activities.

5.7. Analyses of the Sources of SO42− in Groundwater

As previously discussed, the concentration of SO42 showed a significant change, especially in the runoff areas impacted by mining activities during 2013–2019. Therefore, it is necessary to identify the source of SO42 in the study area.
In general, the main sources of SO42 in groundwater include atmospheric precipitation, sulfate mineral dissolution (gypsum, etc.) and sulfide minerals oxidation such as pyrite [20]. The δ34S value of SO42 from atmosphere precipitation is generally around −3~+9‰; the δ34S content from evaporite and limestone can reach above +20‰, even up to +35‰ from gypsum, and the δ34S composition of SO42 from the oxidation of sulfides varies from-30‰ to +5‰ [20,38].
It can be seen from Table 5 that the concentrations of SO42 in the groundwater from the Carboniferous thin-layer limestone aquifer were the highest in the study area followed by the Permian sandstone groundwater, and SO42 concentrations in the karst groundwater from the Cambrian and Ordovician aquifers were the lowest. This was likely related to the dissolution of sulfate minerals in different aquifers. The Carboniferous Taiyuan Formation is one of the main coal-bearing strata in Northern China, and the pyrite content in the coal is relatively high. Therefore, the concentrations of SO42 in the groundwater from Carboniferous strata were proportionally high.
According to Figure 10a, the δ34S values gradually increased with the decrease in the SO42/Cl ratios. The samples from the Carboniferous thin-layer limestone groundwater (CGW) had relatively high SO42/Cl ratios and low δ34 values, distributing around the end member of sulfide oxidation (pyrite, etc.) (Figure 10b), which implied that the major sources of SO42 and the S-isotopic composition were derived from mineral dissolution. While the δ34S values of the other water samples were close to the end member of precipitation, the concentrations of SO42 were much higher than those of precipitation, indicating that the sulfate in the groundwater was probably derived from the combination of gypsum dissolution and sulfide mineral oxidation by meteoric water. These reactions were as follows (Equations (3) and (4)):
gypsum dissolution: CaSO4·2H2O → Ca2+ + SO42 + 2H2O
pyrite oxidation: 2FeS2+ 7O2 + 2H2O → 2Fe2+ + 4SO42 + 4H+
There are several relatively impermeable layers among the Permian sandstone, Carboniferous thin-layer limestone and the Cambrian–Ordovician karst aquifer, and they are relatively independent of each other under natural conditions. However, anthropogenic activities such as coal mining and groundwater pumping lead to the hydraulic connection among different aquifers.
As shown in Figure 10b, some samples (E5, E6, D2) from the Permian sandstone groundwater and Cambrian–Ordovician karst groundwater in the runoff areas (Zone II) fell on the mixing line between gypsum dissolution and sulfide oxidation, which lay close to the samples of Carboniferous thin-layer limestone groundwater. The results further showed that there was a certain hydraulic connection between the karst groundwater and other types of groundwater in some parts of the study area.

5.8. Anthropogenic Factors Affecting the Groundwater Quality

The concentration of NO3 ion in groundwater does not exceed 20 mg/L under natural conditions [39]. A total of 56.9% of the groundwater samples exceeded this threshold, indicating that the groundwater was influenced by anthropogenic inputs in the area. Anthropogenic activities such as domestic sewage, manure and agricultural fertilization have been proven to be the main sources of NO3 in groundwater. In addition, domestic sewage infiltration into groundwater often occurs in urbanized areas [40]. As shown in Table 4, the concentration of NO3 had a good correlation with Na+, Ca2+, Cl and SO42, and showed the best correlation with Cl (r = 0.773, p = 0.01), indicating that NO3 and these ions might have had the same anthropogenic origin. In addition to the dissolution of halite, excessive Cl was generally related to agricultural activities and domestic pollution.
The variation trend of NO3 concentrations in groundwater with well depth is shown in Figure 11a. A total of 80% of the samples from the Quaternary sediment aquifer and 66.7% of the samples from the Permian sandstone aquifer exceeded 50 mg/L, which is the permissible limit for drinking water set by the World Health Organization (WHO) [41]. The results showed that 95.6% of the samples of karst groundwater were within this threshold. In addition, the groundwater samples with NO3 exceeding the standard were mainly distributed at the depth of 0~100 m below the surface, and the maximum concentration was up to 198 mg/L. It showed that shallow groundwater was more affected by anthropogenic activities than deep groundwater.
Theoretically, shallow groundwater is greatly affected by evaporation due to its shallow groundwater table. As shown in Figure 11b, compared to the karst groundwater, the shallow Quaternary sediment groundwater and most of the Permian sandstone groundwater were more enriched in heavy isotopes. In addition, the NO3 concentrations were significantly higher in several deep karst groundwater samples (B22, C13) in the runoff area, indicating that some karst groundwater was affected by nitrate pollution due to coal mining, agricultural activities and other factors.
Generally, the TDS values of all the groundwater samples increased with the increasing (Cl + SO42)/HCO3 (expressed in molar ratios) (Figure 11c). Similarly, the TDS values of the groundwater samples in the Quaternary sediments aquifer and most Permian sandstone aquifer increased with the increasing of (NO3 + Cl)/Na+ molar ratio, whereas there were no significant correlations between the TDS values and (NO3 + Cl)/Na+ in the karst groundwater (Figure 11d).
The results showed that the contribution from evaporite dissolution to the karst groundwater exceeded that from anthropogenic influence, while the Quaternary sediment groundwater and most of the Permian sandstone groundwater were affected by agricultural activities and domestic sewage. These were consistent with the fact that the NO3 concentrations in the shallow groundwater generally exceeded the WHO standard.

6. Conclusions

This research adopted the comprehensive method of correlation analysis, Piper trilinear diagram, Gibbs plot, ionic ratios and multiple isotopic analyses, which provided an effective method for analyzing the origin of karst groundwater and the hydrochemical process in the HSB. The main conclusions are as follows:
(1)
In the past six years (2013–2019), due to the influence of coal mining and other factors, the average concentrations of TDS, Na+, Cl, SO42 and other major ions had been increasing in the mining runoff areas, and even exceeded the concentrations in the discharge area. Especially, the concentration of SO42 in the karst groundwater changed the most. A sulfur isotope analysis showed that SO42 concentrations in the karst groundwater were potentially derived from the combination of gypsum dissolution and sulfide oxidation by meteoric water.
(2)
With the closure of some coal mines, the karst groundwater level in the runoff area began to recover. The SI values of calcite and dolomite in karst groundwater varied greatly during 2013–2019, which reflected the changing runoff conditions in the area, and the karst groundwater transferred gradually from an oversaturated state to saturated state.
(3)
Agricultural production and domestic sewage except for mining activities also had a negative impact on the quality of regional groundwater, which caused the increase in the content of NO3 and Cl in the Quaternary sediment groundwater, Permian bedrock groundwater and a small amount of karst groundwater. It also meant that some samples (C12, C14, C15) from the coal mine runoff area (II1) had a relatively close hydraulic connection with shallow groundwater.
(4)
Given the increasingly serious environmental and geological problems in the HSB, future research work should enhance the hydraulic connection between karst aquifers and coal seams or other aquifers, reduce the pollution of karst groundwater by coal mining and agricultural activities and strengthen the continuous monitoring of groundwater level and hydrochemical abnormal areas, which is important for the management of karst groundwater resources in North China.

Author Contributions

Methodology, M.G.; software, M.G. and C.F.; validation, M.G. and X.L.; formal analysis, X.L. and J.Q.; investigation, X.H., J.M., C.Z. and J.L.; data curation, Z.W.; writing—original draft preparation, M.G.; writing—review and editing, M.G. and C.F.; visualization, M.G.; supervision, X.L. and J.Q.; project administration, Z.W.; funding acquisition, Z.W. All authors have read and agreed to the published version of the manuscript.

Funding

This study was supported by the China Geological Survey’s project (Grant No. DD20190252, DD20221812), the National Natural Science Foundation of China (Grant No. 42002264) and the Fundamental Research Funds for the Chinese Academy of Geosciences (No. SK202109, SK202205).

Institutional Review Board Statement

Not applicable.

Informed Consent Statement

Not applicable.

Data Availability Statement

The datasets generated and/or analyzed during the current study are not publicly available.

Acknowledgments

Many thanks to the editors and anonymous reviewers for providing valuable comments that significantly improved this paper.

Conflicts of Interest

The authors declare no conflict of interest.

Abbreviations

The following abbreviations are used in this manuscript:
HSBHeilongdong Spring Basin
HLDHeilongdong
YCYuecheng (place name)
DWSDongwushi (place name)
ZSinian
Cambrian
OOrdovician
CCarboniferous
PPermian
TTriassic
QQuaternary sediments
KGWKarst groundwater in the Cambrian and Ordovician limestone aquifers
SNWTPSouth-to-North Water Transfer Project
YJPYangjiaopu (place name)
QGWGroundwater in the Quaternary sediment aquifer
PGWGroundwater in the Permian sandstone aquifer
CGWCarboniferous thin-layer limestone groundwater (CGW)
ECElectrical conductivity
ICP-OESInductively Coupled Plasma Optical Emission Spectrometer
CBECharge Balance Error
VSMOWVienna Standard Mean Ocean Water
TCEAThermal conversion elemental analyzer
V-CDTVienna Canyon Diablo Troilite
MDWMine drainage water
SWSurface water
KGW1Karst groundwater in recharge area in 2013
KGW2Karst groundwater in mining runoff area in 2013
KGW3Karst groundwater in no mining runoff area in 2013
KGW4Karst groundwater in discharge area in 2013
KGW5Karst groundwater in recharge area in 2019
KGW6Karst groundwater in mining runoff area in 2019
KGW7Karst groundwater in no mining runoff area in 2019
KGW8Karst groundwater in discharge area in 2019
LMWLThe local meteoric water line
GMWLThe global meteoric water line
SISaturation indices
WHOThe World Health Organization

References

  1. Gomez, M.; Perdiguero, J.; Sanz, A. Socioeconomic Factors Affecting Water Access in Rural Areas of Low and Middle Income Countries. Water 2019, 11, 202. [Google Scholar] [CrossRef]
  2. Santos, S.D.; Adams, E.A.; Neville, G.; Wada, Y.; Sherbinin, A.D.; Bernhardt, E.M.; Adamo, S.B. Urban growth and water access in sub-Saharan Africa: Progress, challenges, and emerging research directions. Sci. Total Environ. 2017, 607–608, 497–508. [Google Scholar] [CrossRef]
  3. Chiocchini, U.; Castaldi, F.; Barbieri, M.; Eulilli, V. A stratigraphic and geophysical approach to studying the deep-circulating groundwater and thermal springs, and their recharge areas, in Cimini Mountains-Viterbo area, central Italy. Hydrogeol. J. 2010, 18, 1319–1341. [Google Scholar] [CrossRef]
  4. Carrard, N.; Foster, T.; Willetts, J. Groundwater as a Source of Drinking Water in Southeast Asia and the Pacific: A Multi-Country Review of Current Reliance and Resource Concern. Water 2019, 11, 1605. [Google Scholar] [CrossRef]
  5. Barbieri, M.; Barberio, M.D.; Banzato, F.; Billi, A.; Boschetti, T.; Franchini, S.; Gori, F.; Petitta, M. Climate change and its effect on groundwater quality. Environ. Geochem. Health 2021, 1–12. [Google Scholar] [CrossRef] [PubMed]
  6. Hao, Z.; Gao, Y.; Green, S.M.; Wen, X.F.; Yang, J.; Xiong, B.L.; Quine, T.A.; He, N.P. Chemical Characteristics of Flow Driven by Rainfall and Associated Impacts on Shallow Groundwater Quality in a Karst Watershed, Southwest China. Environ. Prog. 2021, 8, 615–636. [Google Scholar] [CrossRef]
  7. Liu, F.; Wang, S.; Wang, L.S.; Shi, L.M.; Song, X.F.; Yeh, T.C.; Zhen, P.N. Coupling hydrochemistry and stable isotopes to identify the major factors affecting groundwater geochemical evolution in the Heilongdong Spring Basin, North China. J. Geochem. Explor. 2019, 205, 106352. [Google Scholar] [CrossRef]
  8. Stevanović, Z. Global distribution and use of water from karst aquifers. Geol. Soc. Lond. Spec. Publ. 2018, 466, 217–236. [Google Scholar] [CrossRef]
  9. Li, X.Q.; Zhang, C.C.; Hou, X.W. Characteristics of groundwater circulation and evolution in Jindong large coal base driven by coal mining: An example of Xin’an spring area. J. China Coal Soc. 2021, 46, 3015–3026. [Google Scholar]
  10. Wang, R.; Li, X.H.; Wei, A.H. Hydrogeochemical characteristics and gradual changes of groundwater in the Baiquan karst spring region, northern China. Carbonates Evaporites 2022, 37, 47. [Google Scholar] [CrossRef]
  11. Zhang, C.C.; Li, X.Q.; Ma, J.F.; Wang, Z.X.; Hou, X.W. Stable isotope and hydrochemical evolution of shallow groundwater in mining area of the Changzhi Basin, northern China. Environ. Earth Sci. 2022, 81, 294. [Google Scholar] [CrossRef]
  12. Liang, Y.P.; Gao, X.B.; Zhao, C.H.; Tang, C.L.; Shen, H.Y.; Wang, Z.H.; Wang, Y.X. Review: Characterization, evolution, and environmental issues of karst water systems in Northern China. Hydrogeol. J. 2018, 26, 1371–1385. [Google Scholar] [CrossRef]
  13. Sun, W.J.; Song, J.X.; Yang, W.K.; Zheng, Y.J.; Li, C.Y.; Kuang, D. Distribution of carbonate rocks and variation analysis of karst water resources in China. Carbonates Evaporites 2020, 35, 121. [Google Scholar] [CrossRef]
  14. Huang, Q.B.; Qin, X.Q.; Yang, Q.Y.; Liu, P.Y.; Zhang, J.S. Identification of dissolved sulfate sources and the role of sulfuric acid in carbonate weathering using δ13CDIC and δ34S in karst area, northern China. Environ. Earth Sci. 2016, 75, 51. [Google Scholar]
  15. He, K.Q.; Guo, L.; Guo, Y.Y.; Luo, H.L.; Liang, Y.P. Research on the effects of coal mining on the karst hydrogeological environment in Jiaozuo mining area, China. Environ. Earth Sci. 2019, 78, 434. [Google Scholar]
  16. Liu, P.; Hoth, N.; Drebenstedt, C.; Sun, Y.J.; Xu, Z.M. Hydro-geochemical paths of multi-layer groundwater system in coal mining regions—Using multivariate statistics and geochemical modeling approaches. Sci. Total Environ. 2017, 601–602, 1–14. [Google Scholar] [CrossRef]
  17. Qian, J.Z.; Peng, Y.X.; Zhao, W.D.; Ma, L.; He, X.R.; Lu, Y.H. Hydrochemical processes and evolution of karst groundwater in the northeastern Huaibei Plain, China. Hydrogeol. J. 2018, 26, 1721–1729. [Google Scholar] [CrossRef]
  18. Fu, C.C.; Li, X.Q.; Ma, J.F.; Liu, L.X.; Gao, M.; Bai, Z.X. A hydrochemistry and multi-isotopic study of groundwater origin and hydrochemical evolution in the middle reaches of the Kuye River basin. Appl. Geochem. 2018, 98, 82–93. [Google Scholar] [CrossRef]
  19. Keesari, T.; Roy, A.; Mohokar, H.; Pant, D.; Sinha, U.K. Characterization of mechanisms and processes controlling groundwater recharge and its quality in drought-prone region of central India (Buldhana, Maharashtra) using isotope hydrochemical and end-member mixing modeling. Nat. Resour. Res. 2020, 29, 1951–1973. [Google Scholar] [CrossRef]
  20. Qu, S.; Wang, G.C.; Shi, Z.M.; Xu, Q.Y.; Guo, Y.Y.; Ma, L.; Sheng, Y.Z. Using stable isotopes (δD, δ18O, δ34S and 87Sr/86Sr) to identify sources of water in abandoned mines in the Fengfeng coal mining district, northern China. Hydrogeol. J. 2018, 26, 1443–1453. [Google Scholar] [CrossRef]
  21. Guo, Y.Y.; Lyu, Z.C.; Wang, G.C.; Ma, L.; Xu, Q.Y.; Huang, X.J.; Gao, S.Z. Hydrogeochemical simulation of groundwater in Eastern Fengfeng mining area. Coal Geol. Explor. 2016, 44, 101–105. [Google Scholar]
  22. Hao, C.M.; Sun, W.; He, P.Y.; Li, C. The impact of nearly 30 years mining activities on the hydrochemistry characteristic of karst groundwater in Fengfeng coal mining area. China Min. Mag. 2015, 24, 45–51. [Google Scholar]
  23. Hao, C.M.; Huang, Y.; He, P.Y.; Sun, W. Isotope Drift Characteristics in Ordovician Limestone Karst Water Caused by Coal Mining in Northern China. Mine Water Environ. 2019, 38, 507–516. [Google Scholar] [CrossRef]
  24. Liu, F.; Zhen, P.N.; Wang, S. Groundwater quality assessment and health risks from nitrate contamination in the Heilongdong Spring Basin, a typical headwater basin of the North China Plain. Environ. Sci. Pollut. Res. 2022, 29, 17655–17670. [Google Scholar] [CrossRef]
  25. Wang, S. Research on Groundwater Circulation and Hydrochemical Formation Mechanism in the Heilongdong Spring Basin. Ph.D. Thesis, Hebei University of Engineering, Handan, China, 2020. [Google Scholar]
  26. Liu, B.; Guan, Y.Q.; Sun, Y.Z.; Zhang, H.S.; Bian, K. Water inrush type division and water inrush mode in Fengfeng Mining Area. Saf. Health Coal Mines 2021, 52, 186–194. [Google Scholar]
  27. Wang, Z.X.; Li, X.Q.; Hou, X.W. Hydrogeochemistry of River Water in the Upper Reaches of the Datong River Basin, China: Implications of Anthropogenic Inputs and Chemical Weathering. Acta Geol. Sin.-Engl. Ed. 2021, 95, 962–975. [Google Scholar] [CrossRef]
  28. Craig, H. Isotopic variations in meteoric waters. Science 1961, 133, 1702–1703. [Google Scholar] [CrossRef]
  29. Gibbs, R.J. Mechanisms controlling world water chemistry. Science 1970, 170, 1088–1090. [Google Scholar] [CrossRef] [PubMed]
  30. Wu, X.C.; Li, C.S.; Sun, B.; Geng, F.Q.; Gao, S.; Lv, M.H.; Ma, X.Y.; Li, H.; Xing, L.T. Groundwater hydrogeochemical formation and evolution in a karst aquifer system affected by anthropogenic impacts. Environ. Geochem. Health 2020, 42, 2609–2626. [Google Scholar] [CrossRef] [PubMed]
  31. Lin, Y.; Ren, H.X.; Wu, Y.Z.; Cao, F.L.; Jia, F.J.; Qu, P.C. The evolution of hydrogeochemical characteristics of a typical piedmont karst groundwater system in a coal-mining area, Northern China. Environ. Earth Sci. 2019, 78, 557. [Google Scholar] [CrossRef]
  32. Schoeller, H. Qualitative Evaluation of Groundwater Resources. In Methods and Techniques of Groundwater Investigations and Development; Unesco: Paris, France, 1965; pp. 54–83. [Google Scholar]
  33. Venkatramanan, S.; Chung, S.Y.; Ramkumar, T.; Gnanachandrasamy, G.; Vasudevan, S.; Lee, S.Y. Application of GIS and hydrogeochemistry of groundwater pollution status of Nagapattinam district of Tamil Nadu, India. Environ. Earth Sci. 2015, 73, 4429–4442. [Google Scholar] [CrossRef]
  34. Parkhurst, D.L.; Appelo, C.A.J. User’s Guide to PHREEQC (Version 2) a Computer Program for Speciation, Batch-Reaction, One-Dimensional Transport, and Inverse Geochemical Calculations: U.S Geological Survey Water-Resources Investigations Report 99-4259. 1999. Available online: https://pubs.er.usgs.gov/publication/wri994259 (accessed on 14 December 2022).
  35. Wu, J.H.; Li, P.Y.; Qian, H. Hydrochemical characterization of drinking groundwater with special reference to fluoride in an arid area of China and the control of aquifer leakage on its concentrations. Environ. Earth Sci. 2015, 73, 8575–8588. [Google Scholar] [CrossRef]
  36. Li, L.P.; Huang, G.X. Groundwater Level Mapping Using Multiple-Point Geo-statistics. Water 2016, 8, 400. [Google Scholar] [CrossRef]
  37. Ma, Z.J. Study on Karst Water Cycle Evolution Law in Heilongdong Spring Area. Ph.D. Thesis, Hebei University of Engineering, Handan, China, 20 December 2021. [Google Scholar]
  38. Krouse, H.R.; Mayer, B. Sulphur and Oxygen Isotopes in Sulphate. In Environmental Tracers in Subsurface Hydrology; Cook, P.G., Herczeg, A.L., Eds.; Springer: Boston, MA, USA, 2000; pp. 195–231. [Google Scholar]
  39. Bahrami, M.; Zarei, A.R.; Rostami, F. Temporal and spatial assessment of groundwater contamination with nitrate by nitrate pollution index (NPI) and GIS (case study: Fasarud Plain, southern Iran). Environ. Geochem. Health 2020, 42, 3119–3130. [Google Scholar] [CrossRef] [PubMed]
  40. Huang, G.X.; Liu, C.Y.; Sun, J.C.; Zhang, M.; Jing, J.H.; Li, L.P. A regional scale investigation on factors controlling the groundwater chemistry of various aquifers in a rapidly urbanized area: A case study of the Pearl River Delta. Sci. Total Environ. 2018, 625, 510–518. [Google Scholar] [CrossRef] [PubMed]
  41. WHO. Guidelines for Drinking-Water Quality, 4th ed.; WHO: Geneva, Switzerland, 2011; pp. 398–403. [Google Scholar]
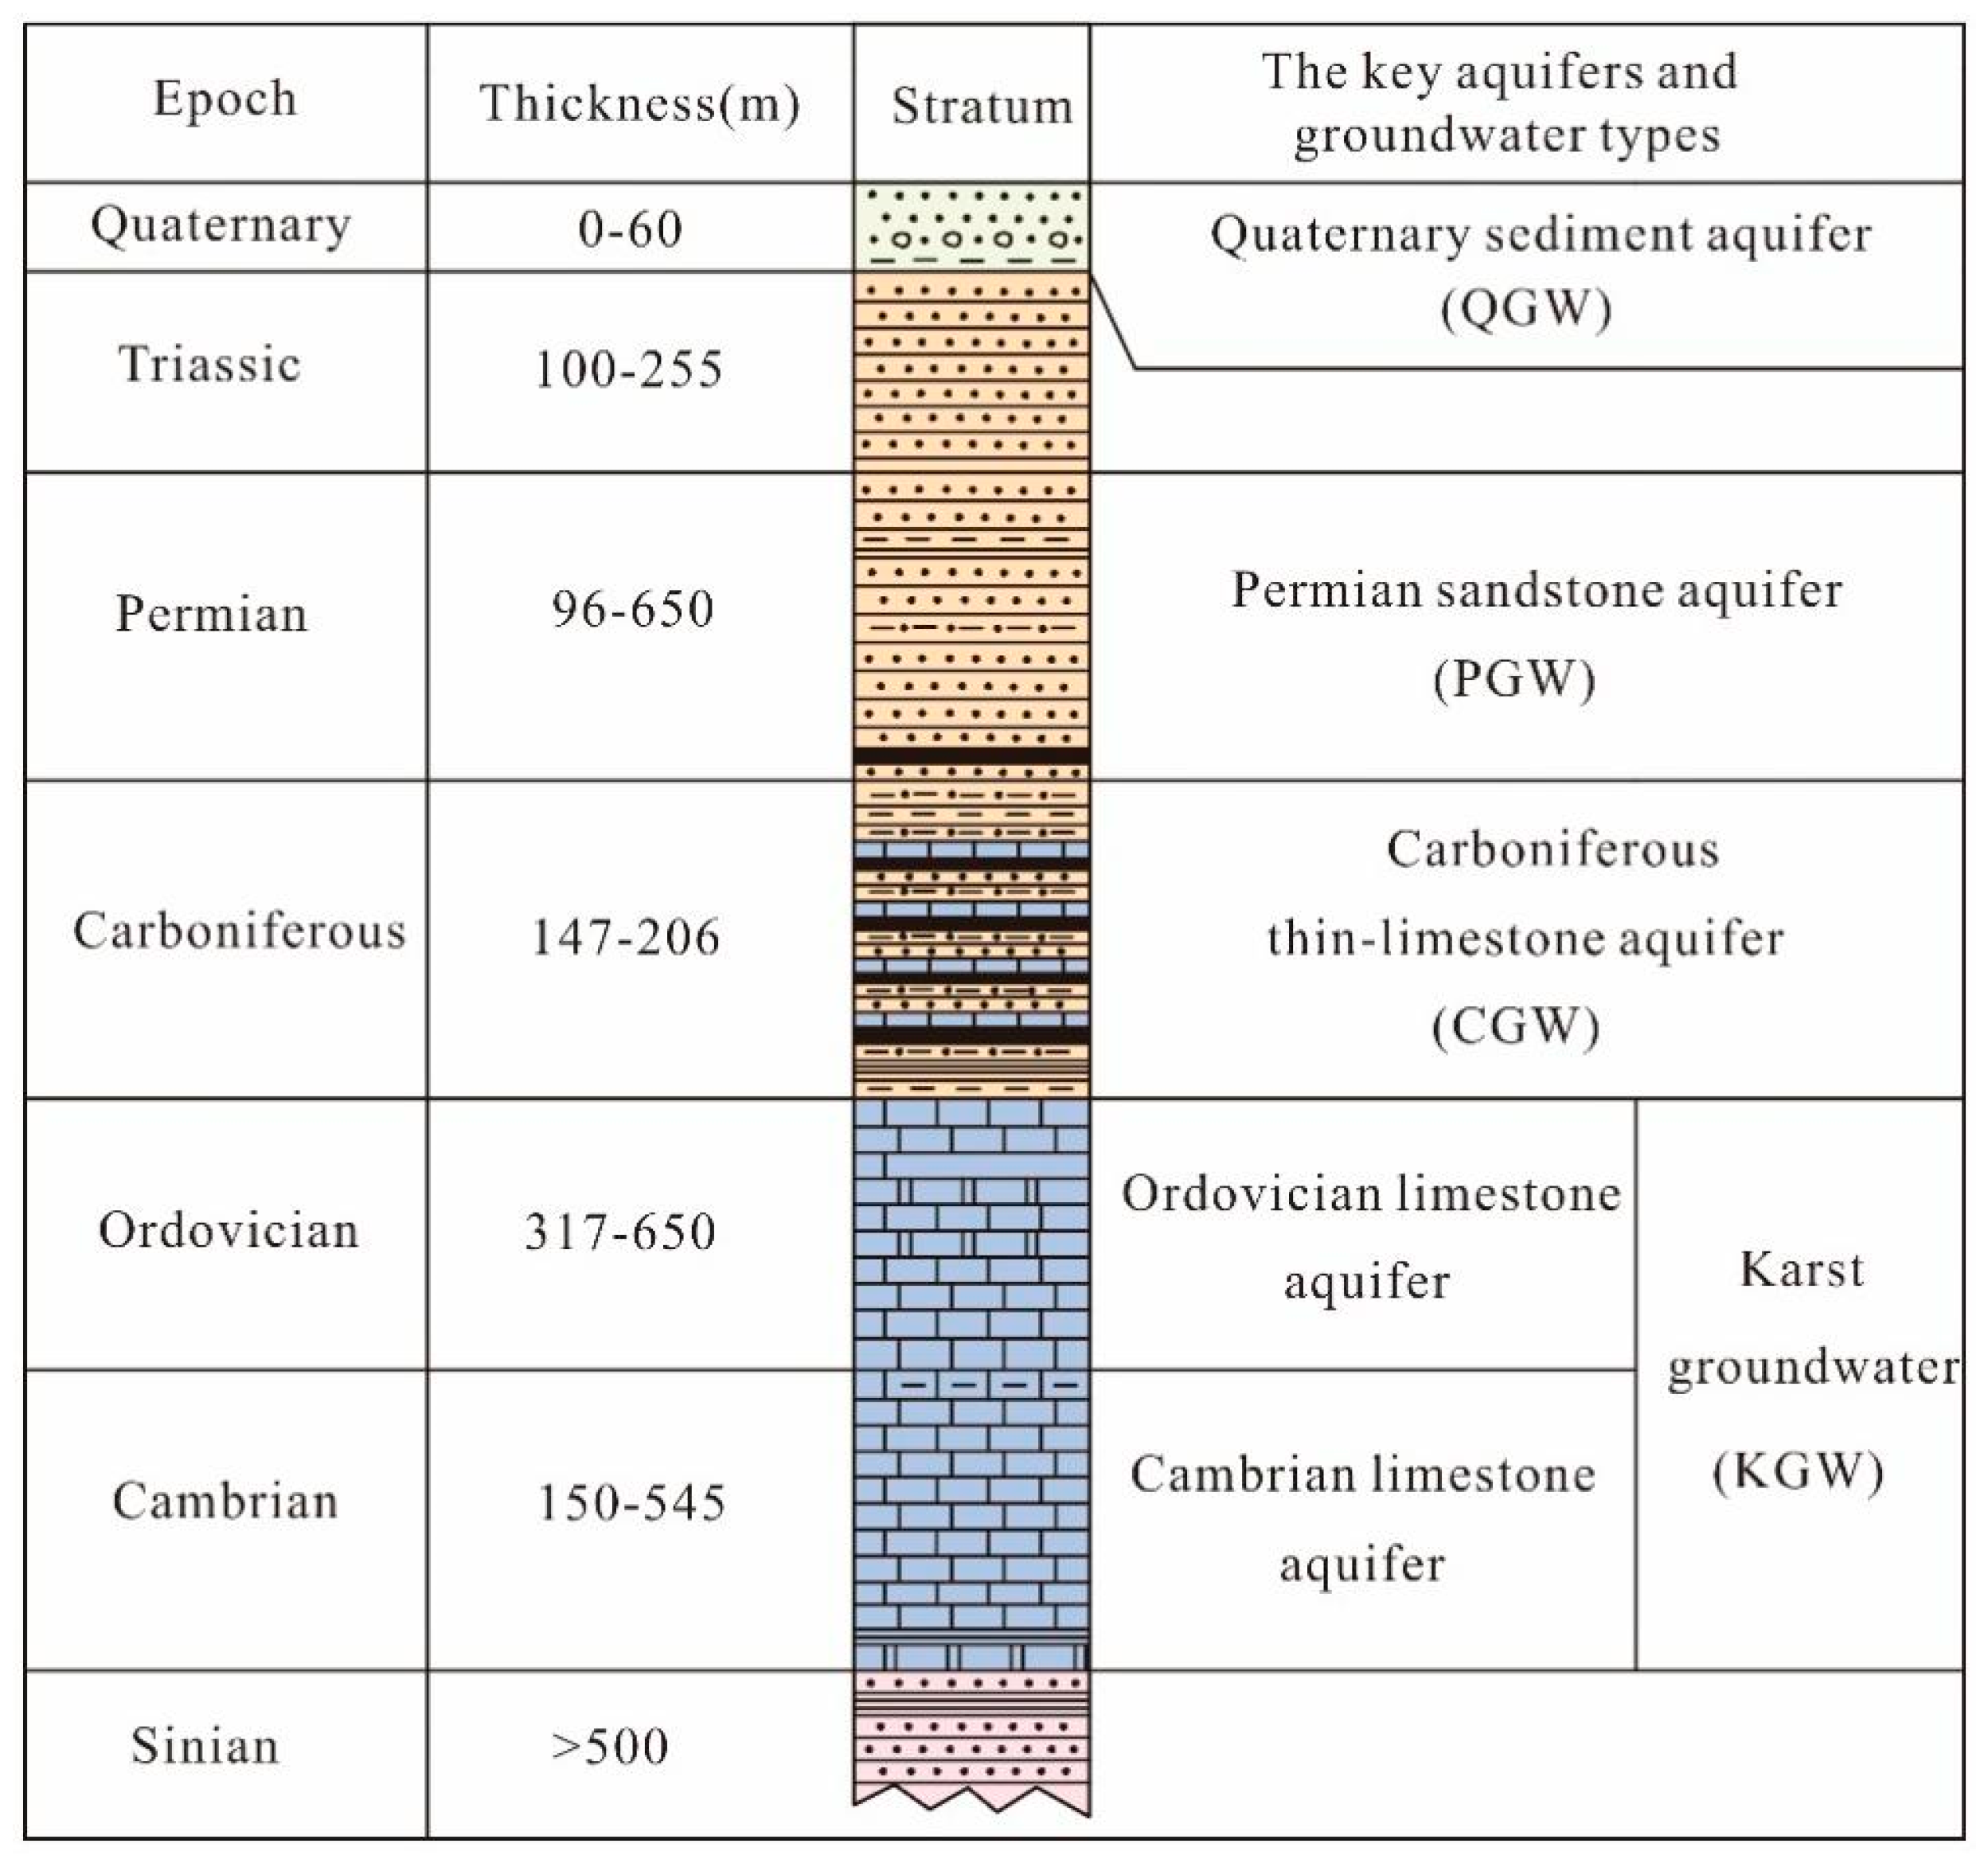
Figure 1. Stratigraphic column and the key aquifers of the study area.
Water 15 00726 g001
Figure 2. The hydrogeological sketch of Heilongdong Spring Basin.
Water 15 00726 g002
Figure 3. The Piper diagram of water samples in 2013 and 2019.
Water 15 00726 g003
Figure 4. The relationship between δ2H and δ18O for all water samples.
Water 15 00726 g004
Figure 5. Gibbs diagrams of groundwater samples in the HSB: (a) TDS vs. ρ(Na+)/ρ(Na+ + Ca2+), (b) TDS vs. ρ(Cl)/ρ(Cl + HCO3).
Water 15 00726 g005
Figure 6. Scatter plots of major ions: (a) Cl vs. Na+, (b) SO42 vs. Ca2+, (c) SO42 vs. Cl, (d) (HCO3 + SO42) vs. (Ca2+ + Mg2+), (e) HCO3 vs. (Cl + SO42), (f) Mg2+ vs. Ca2+.
Water 15 00726 g006aWater 15 00726 g006b
Figure 7. Scatter plot of CAI-I versus CAI-II: (a) plot in 2013, (b) plot in 2019.
Water 15 00726 g007
Figure 8. SI values of groundwater samples vs. TDS: (a) calcite, (b) dolomite, (c) gypsum, (d) halite.
Water 15 00726 g008
Figure 9. Contour maps of karst groundwater levels (m) in 2012 (a) and 2018 (b) [37].
Water 15 00726 g009
Figure 10. Scatter plot of (a) δ34S versus SO42/Cl, (b) δ34S versus 1/SO42.
Water 15 00726 g010
Figure 11. Plots of (a) NO3 vs. well depth, (b) δ18O vs. NO3, (c) TDS vs. (Cl + SO42)/HCO3, (d) TDS vs. (NO3 + Cl)/Na+.
Water 15 00726 g011
Table 1. Statistical summary of hydrochemical parameters in 2013.
K+Na+Ca2+ Mg2+ClSO42−HCO3NO3TDSpH
KGW Total (n = 24)
Min 0.926.0368.7914.958.7547.94207.512.8313.47.55
Max 2.9432.72120.131.749.18207.3294.957.6599.68.52
Mean 1.3714.6191.0123.4622.7795.34241.9121.63405.958.05
Std 0.447.1616.853.738.4541.82238.7476.240.39
KGW1(n = 2)
Min 1.36.0382.7319.968.7564.96237.812.8336.97.55
Max 1.457.7797.6724.9522.7677.45294.929.36404.97.66
Mean 1.386.990.222.4615.7671.21266.3521.08370.97.61
Std 0.111.2310.563.539.918.8340.3811.7148.080.08
KGW2 (n = 17)
Min 0.928.2870.7619.2912.5647.94207.513.48317.17.57
Max 2.9432.72120.131.749.18207.3270.227.52599.68.52
Mean 1.3915.0788.9423.8322.9594.97238.5319.95402.388.15
Std 0.517.4615.043.358.343.0620.13.876.570.38
KGW3 (n = 4)
Min 0.998.6268.7914.9517.9549.8820917.8313.47.64
Max 1.4423.0212026.3140.27141.926957.6522.28.49
Mean 1.215.7695.6621.4325.294.91238.229.84416.47.97
Std 0.247.0527.755.5310.345.326.2818.7994.070.36
KGW4 (n = 1) 1.5217.59109.227.3124.05151.6265.418.48494.97.61
Note: units: concentrations are expressed in milligram per liter (mg/L), except for pH. KGW1: karst groundwater in recharge area; KGW2: karst groundwater in mining runoff area; KGW3: karst groundwater in no mining runoff area; KGW4: karst groundwater in discharge area.
Table 2. Statistical summary of hydrochemical parameters in 2019.
K+Na+Ca2+ Mg2+ClSO42−HCO3NO3TDSpH
KGW Total (n = 22)
Min 0.925.1270.4416.445.5935.94225.81.25301.57.3
Max 3.757.75170.246.6954.97313.833564.62798.57.74
Mean 1.6216.42103.726.0225.72125.72265.2722.98466.967.52
Std 0.6811.8226.497.5713.2480.9127.5911.44145.540.13
KGW5 (n = 6)
Min 0.925.1270.4416.445.5935.94225.818.35301.57.45
Max 2.7610.0396.6124.3919.5678.03256.931.42394.67.74
Mean 1.697.3280.6119.8413.3958.43244.9222.19336.687.63
Std 0.781.649.242.975.8814.8313.634.7931.710.1
KGW6 (n = 11)
Min 1.1510.4586.5822.1615.7280.512381.25386.67.3
Max 3.757.75170.246.6954.97313.833564.62798.57.64
Mean 1.7621.75117.3329.8331.45168.84277.822.61545.087.46
Std 0.7314.1427.378.3714.0889.3328.6215.91155.450.08
KGW7 (n = 4)
Min 0.959.982.7821.2119.9164.17233.119.92378.37.38
Max 1.5722.61133.630.8240.27177.5286.829.18582.97.73
Mean 1.214.87102.0624.527.9108.83257.6525.98446.987.54
Std 0.265.7722.634.458.7551.0327.114.1795.820.17
KGW8 (n = 1) 1.3618.598.827.4227.94122.8280.119.72469.27.35
QGW (n = 5)
Min 0.2653.9524024.0889.28377.528234.8210317.21
Max 2.2378.22323.957.5156.1656.7341.7190.114657.4
Mean 1.0563.49279.8443.1119.34473.4311.2100.521253.87.31
Std 0.828.9536.4913.2628.26124.1423.7860.45189.210.07
PGW (n = 6)
Min 0.9532.53112.219.7637.02120.5227.312.09563.47.21
Max 2.56120.4358.271.07186.9694.9402.719816477.62
Mean 1.5257.74233.9543.89109.79378.15319.1386.691095.47.4
Std 0.6332.395.7218.0770.6208.8765.8268.53437.380.14
MDW (n = 2)
Min 3.7629.06185.544.3429.8368294.110.08846.67.3
Max 4.0348.7521857.1247.85536.4317.917.410967.55
Mean 3.938.91201.7550.7338.83452.230613.74971.37.43
Std 0.1913.9222.989.0412.76119.0816.835.18176.350.18
SW * (n = 12)
Min 0.987.1330.756.339.8228.85198.075.81223.658
Max 6.4464.57155.3840.5958.91312.84349.5322.31784.568.6
Mean 3.9631.1294.9426.1632.83151.15268.3617.46491.88.2
Std 1.5515.5533.199.5311.7788.7147.415.27168.520.2
Note: KGW5: karst groundwater in recharge area; KGW6: karst groundwater in mining runoff area; KGW7: karst groundwater in no mining runoff area; KGW8: karst groundwater in discharge area; QGW: Quaternary groundwater; PGW: Permian groundwater; MDW: mine drainage water; SW: surface water; n: number of samples; * data from [7].
Table 3. δ2H and δ18O isotope composition of all the water samples taken in the HSB.
QGW (n = 5)PGW (n = 6)KGW (n = 19)MDW (n = 2)SW (n = 12)
MinMaxMeanMinMaxMeanMinMaxMeanMinMaxMeanMinMaxMean
δ2H (‰)−62.0 −57.0 −59.2 −65.0 −64.0 −64.3 −69.0 −64.0 −67.3 −67.0 −66.0 −66.5 −65.4 −57.6 −63.6
δ18O (‰)−8.4 −7.7 −8.0 −8.8 −8.5 −8.7 −9.6 −8.6 −9.3 −9.1 −8.9 −9.0 −8.9 −7.5 −8.6
Note: QGW: Quaternary groundwater; PGW: Permian groundwater; KGW: Karst groundwater; MDW: mine drainage water; SW: surface water.
Table 4. Correlation matrix of all the samples.
KNaCaMgClSO4HCO3NO3TDSpH
K1.000 0.118 0.106 0.413 **−0.020 0.274 *0.244 −0.222 0.161 −0.176
Na0.118 1.000 0.866 **0.762 **0.876**0.849 **0.626 **0.716 **0.907 **−0.434 **
Ca0.106 0.866 **1.000 0.861 **0.923**0.954 **0.788 **0.676 **0.992 **−0.524 **
Mg0.413 **0.762 **0.861 **1.000 0.742**0.932 **0.819 **0.395 **0.896 **−0.429 **
Cl−0.020 0.876 **0.923 **0.742 **1.000 0.817 **0.646 **0.773 **0.920 **−0.452 **
SO40.274 *0.849 **0.954 **0.932 **0.817**1.000 0.793 **0.494 **0.970 **−0.504 **
HCO30.244 0.626 **0.788 **0.819 **0.646**0.793 **1.000 0.290 *0.786 **−0.525 **
NO3−0.222 0.716 **0.676 **0.395 **0.773**0.494 **0.290 *1.000 0.668 **−0.368 **
TDS0.161 0.907 **0.992 **0.896 **0.920**0.970 **0.786 **0.668 **1.000 −0.519 **
pH−0.176 −0.434 **−0.524 **−0.429 **−0.452**−0.504 **−0.525 **−0.368 **−0.519 **1.000
Note: ** correlation is significant at the 0.01 level (two-tailed); * correlation is significant at the 0.05 level (two-tailed).
Table 5. Chemical and sulfur isotopic composition for groundwater taken in the HSB.
SO42− (mg/L)Cl (mg/L)δ34S (‰, CDT)
MinMaxMeanMinMaxMeanMinMaxMean
PGW120.5 694.9 481.4 57.8 186.9 140.7 2.7 5.7 4.7
CGW513.5 2591.1 1262.0 30.9 59.2 43.6 −10.6 −1.0 −5.8
KGW in the recharge area56.6 67.0 62.7 5.6 19.6 11.9 3.0 14.1 7.1
KGW in the runoff area93.1 408.9 159.515.7 70.4 30.82.113.06.2
KGW in the discharge area97.4 122.8 110.1 15.8 27.9 21.9 6.3 8.2 7.3
Disclaimer/Publisher’s Note: The statements, opinions and data contained in all publications are solely those of the individual author(s) and contributor(s) and not of MDPI and/or the editor(s). MDPI and/or the editor(s) disclaim responsibility for any injury to people or property resulting from any ideas, methods, instructions or products referred to in the content.