Article

Simulation of Soil Water Movement and Root Uptake under Mulched Drip Irrigation of Greenhouse Tomatoes

1
College of Water Conservancy, Shenyang Agricultural University, Shenyang 110866, China
2
Department of Foreign Languages Teaching, Shenyang Agricultural University, Shenyang 110866, China
3
College of Energy and Water Resources, Shenyang Institute of Technology, Fushun 113122, China
4
College of Hydraulic Engineering, Liaoning Vocational College of Ecological Engineering, Shenyang 110122, China
5
College of Land and Environment, Shenyang Agricultural University, Shenyang 110866, China
*
Author to whom correspondence should be addressed.
Water 2023, 15(7), 1282; https://doi.org/10.3390/w15071282
Submission received: 4 March 2023 / Revised: 17 March 2023 / Accepted: 21 March 2023 / Published: 24 March 2023

Abstract

:
Three irrigation treatments were set up in northeast China to investigate soil water movement and root water uptake of greenhouse tomatoes, and the collected experimental data were simulated by HYDRUS-2D. The computation and partitioning of evapotranspiration data into soil evaporation and crop transpiration was carried out with the double-crop coefficient method. The HYDRUS-2D model successfully simulated the soil water movement, producing RMSE ranging from 0.014 to 0.027, an MRE ranging from 0.062 to 0.126, and R2 ranging from 79% to 92%, when comparing model simulations with two-year field measurements. Under different water treatments, 83–90% of the total root quantity was concentrated in 0–20 cm soil layer, and the more the water deficit, the more water the deeper roots will absorb to compensate for the lack of water at the surface. The average area of soil water shortage in W1 was 2.08 times that in W2. W3 treatment hardly suffered from water stress. In the model, parameter n had the highest sensitivity compared with parameters α and Ks, and sensitivity ranking was n > Ks > α. This research revealed the relationships between soil, crop and water under drip irrigation of greenhouse tomatoes, and parameter sensitivity analysis could guide the key parameter adjustment and improve the simulation efficiency of the model.

1. Introduction

Solar greenhouses have been widely used in agricultural production, meeting the growing diversified needs of people [1,2,3,4,5]. Tomatoes are one of the most important crops cultivated in the solar greenhouses [6,7,8,9]. Nowadays, drip-irrigation technology has been widely used in the cultivation of greenhouse crops, which can accurately transport water to the roots of crops and improve water-use efficiency and yield [10,11,12,13]. However, due to a lack of scientific guidance, most farmers irrigate without assessing the water requirements of crops, which leads to the waste of water resources. Studies have shown that, although a large amount of irrigation can promote plant growth and increase yield, it will increase water consumption and reduce fruit quality [14]. In addition, excessive irrigation will increase the air humidity in the greenhouse, leading to the aggravation of pests and diseases, and finally worsening the greenhouse environment [14,15]. Therefore, in order to save water resources, improve crop quality and optimize the greenhouse environment, many scholars have begun to explore the characteristics of the soil water distribution. However, field trials waste time and money and the results are susceptible to uncertainties, such as crops, soils, and meteorology.
Root water uptake is an important process of the terrestrial water cycle, and how this process works depends on the soil water content, root distribution, and root water uptake. Therefore, a comprehensive understanding of when and where plants absorb water from the soil is essential to reveal interrelationships between climate, soil and plant growth, as well as for the design and management of the drip-irrigation systems [16,17,18]. Because the root water uptake is difficult to measure from field experiments, some scholars have estimated root water uptake by the soil water balance method [17]. However, the calculated values were not accurate enough, so many scholars began to explore the laws of root water uptake through modeling. Root zone modeling is divided into two broad categories, microscopic and macroscopic methods, of which macroscopic models have undergone many developments, in which the introduction of sink S, based on Richard’s equation, is a common macroscopic method for simulating root water uptake [19].
With the in-depth study of soil water movement and root water uptake, various monitoring technologies have developed rapidly, and research models have been continuously improved [20,21]. Among them, the HYDRUS model is widely used in the study of soil water movement and root water uptake, with its user-friendly interface and standardized computer program. Nazari et al. [22] conducted a field experiment on the land around an apple tree, which mainly measured the soil water content and root water uptake under the subsurface drip irrigation. Nazari simulated it based on different scenarios in HYDRUS-2D, and the results showed that HYDRUS-2D had a good ability to estimate the water content under subsurface drip irrigation. Geng et al. [23] used the improved HYDRUS-2D model of dynamic root growth model to simulate water movement and root water uptake under different drip-irrigation conditions, and the results showed that the simulation results were in good agreement with the observation results, and the model could provide a basis for accurate irrigation of soilless substrate cultivation under drip irrigation. Karandish and Simunek et al. [24] combined the study of corn under drip irrigation with the HYDRUS-2D model, and the results showed that the HYDRUS-2D model could be reliably used to explore soil–water–plant interactions under water-scarce irrigation and partial root-zone-drying strategies. Li et al. [25] used the HYDRUS-2D model to explore the soil moisture dynamics of the root zone of tomato–maize intercrops under three water treatments, and he said that the results were very useful for designing the optimal irrigation plan for intercropping fields.
The HYDRUS model has been used to study soil water movement and root water uptake under drip irrigation by many scholars, but most studies have focused on field crops [26,27,28,29]. The application of the HYDRUS model in greenhouses is rarely reported. Moreover, most scholarly research on root water uptake focuses on the dynamic change of root water uptake during the whole growth period. Some scholars have proposed that due to various factors, such as soil type, irrigation change and uneven root distribution, soil water content in the root zone is usually heterogeneous. Therefore, plants often compensate for water uptake by roots and respond to soil water heterogeneity through adaptive root growth [18]. Thus, accurate estimation of compensating root water uptake is essential to understand root water uptake laws. This article discussed the following objectives: (1) using the HYDRUS-2D model to establish soil water movement model to explore the applicability of HYDRUS-2D model in a greenhouse by comparing observation data and simulation data; (2) establishing soil water movement and root water uptake model to investigate the characteristics of soil water movement and the laws of root water uptake under different water treatments; (3) making the use of numerical simulation method to reveal the soil–water–plant interaction under mulched drip irrigation of greenhouse tomatoes; and (4) find out the more sensitive parameters of the HYDRUS model by sensitivity analysis, which can guide the key parameter adjustment and improve the simulation efficiency of the model.

2. Materials and Methods

2.1. Overview of the Test Area

The experiments were conducted in no. 43 solar greenhouse of Shenyang Agricultural University Test Base, from March to July in 2020 and 2021, with geographical coordinates 41°82′ N, 123°57′ E. The test base is affected by the monsoon, precipitation is concentrated, and the temperature difference is large. January is the coldest month, with an average temperature of −11.0 °C, and July is the hottest month with an average temperature of 24.7 °C. The soil in the greenhouse is brown loam. The soil bulk density is 1.26 g·cm−3 and the field capacity (θFC) is 0.31 cm3·cm−3.

2.2. Experimental Design

In this experiment, tomatoes were used as the test material and the tomato variety was “Fenguang No. 1”. The experiment adopted the planting mode of a double row in a large ridge. Each cell was 7 m long and 1.3 m wide, with tomato planting row spacing of 50 cm and plant spacing of 40 cm. The irrigation conditions of each treatment were consistent. The mulched drip irrigation was adopted, and the drip flow rate was 1.6 L/h. The drip hole spacing was 50 cm, which corresponded to the plant. The test arrangement is shown in Figure 1.
In 2020, tomatoes were planted on 15 March and grown for 130 days. In 2021, tomatoes were planted on 16 March and grown for 125 days. Three water treatments were set up in this experiment and each water treatment was repeated three times. Water treatments were controlled by the upper and lower limits of irrigation, which were W3: 85%θFC–95%θFC, W2: 75%θFC–85%θFC, and W1: 65%θFC–75%θFC. All treatments were fully irrigated at the seedling stage, and deficit irrigation was carried out in the third period of growth, until the experimental treatments were completed at the end of fruit harvesting.
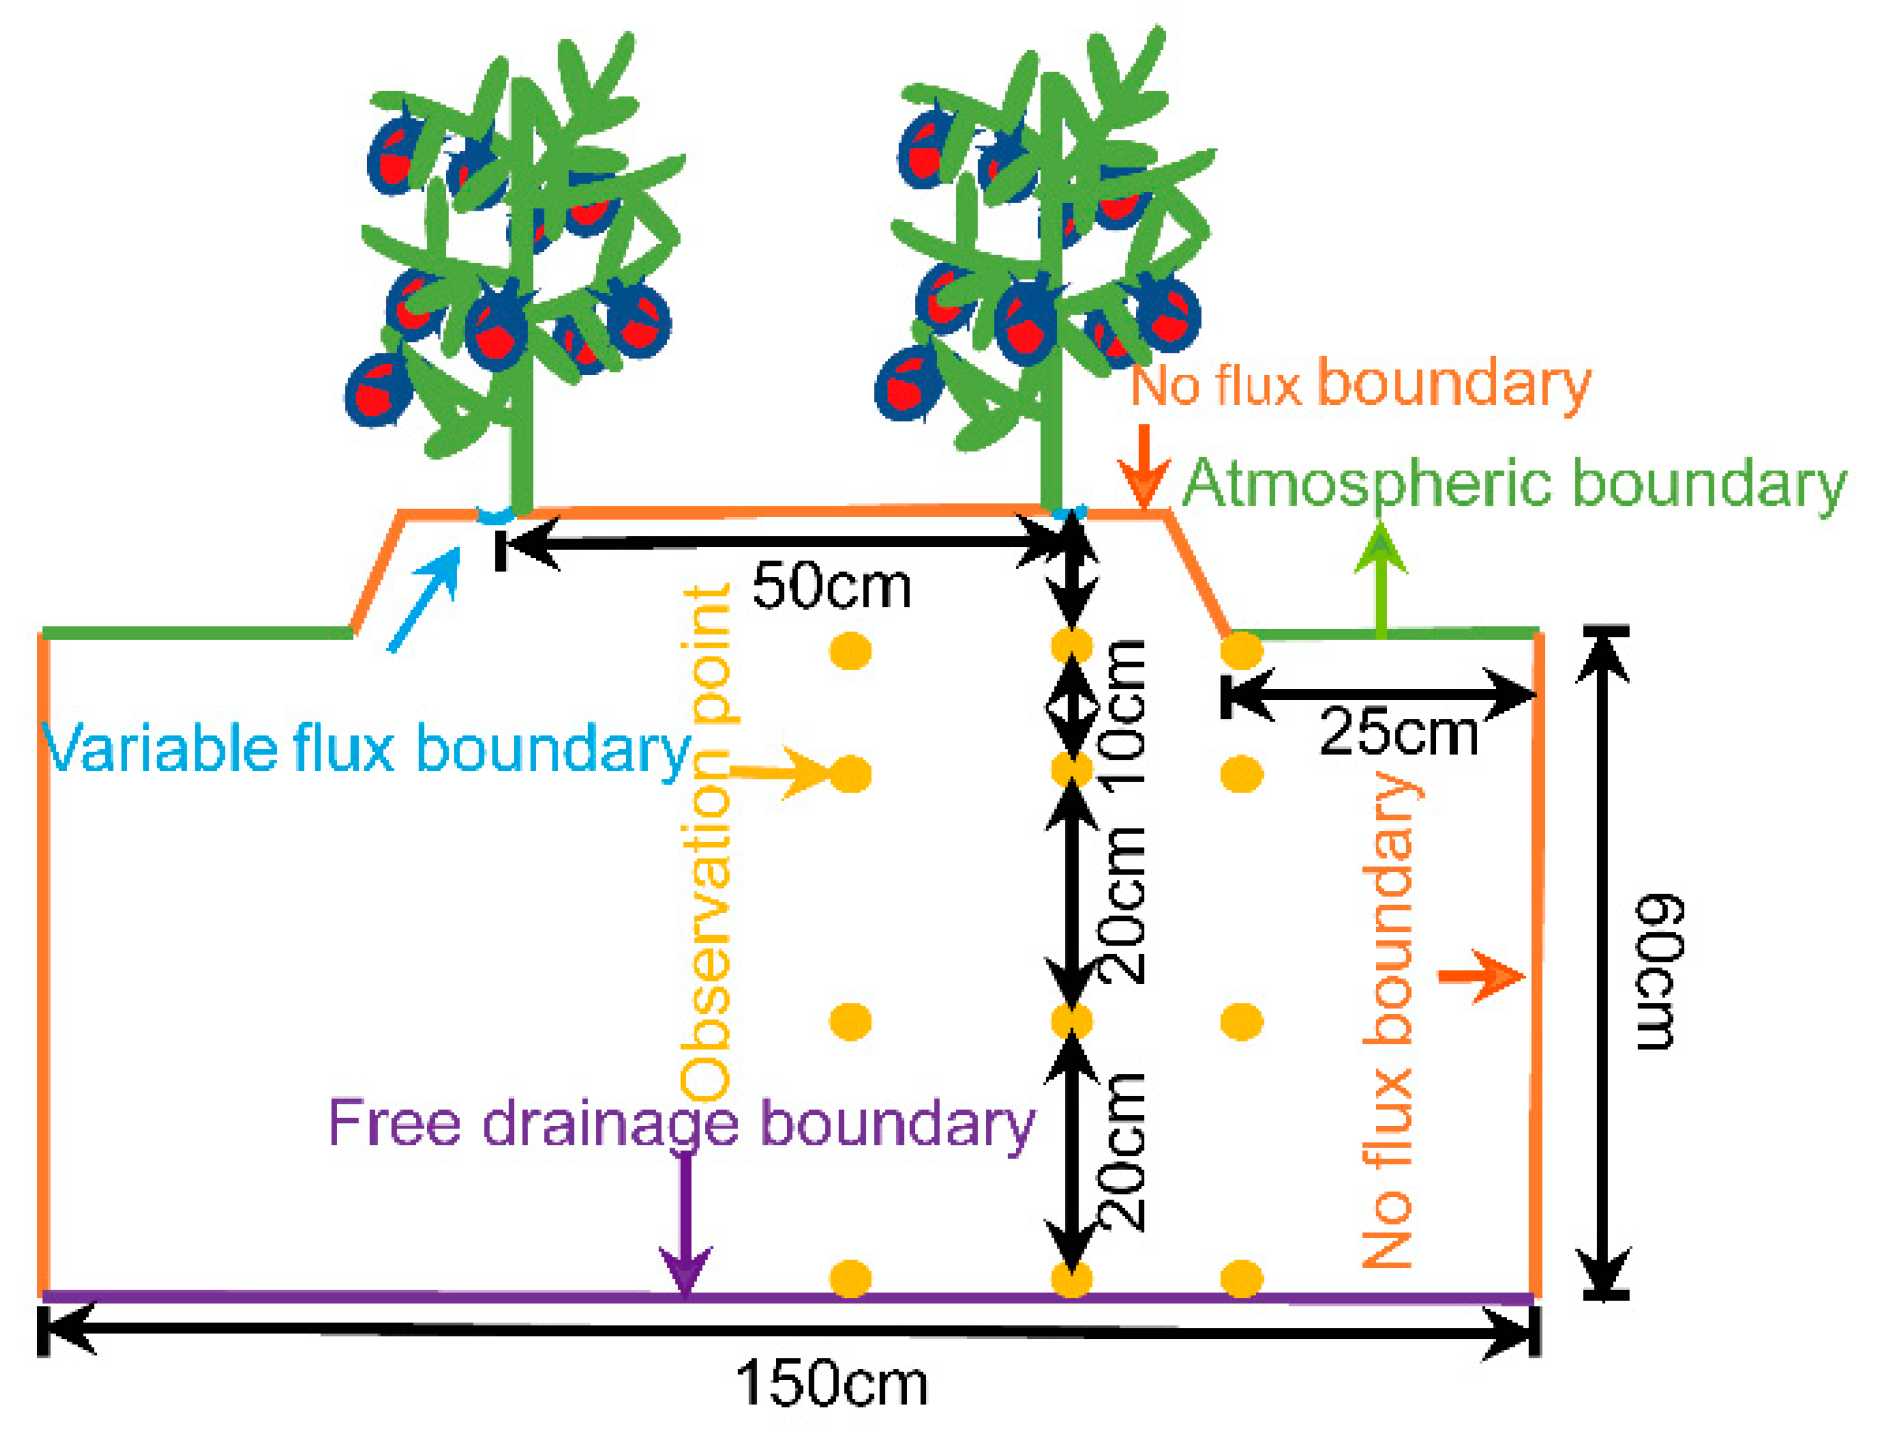
Soil bulk density was measured by the ring knife method. Saturated water conductivity was determined by the constant head method in the interior. Soil particle composition (clay < 0.002 mm, silt < 0.002–0.05 mm and sand > 0.05 mm) was determined by Masterize 2000 laser size detector (Malvern, Greater Manchester, UK). The content of soil organic matter was determined by potassium dichromate volumetric method. Before irrigation, the initial soil water content was measured by the drying method. Soil samples were taken every 20 cm with a soil drill and measured to 60 cm. Three plants with good growth were selected for each treatment. The soil water content was monitored by CR1000X (Campbell Scientific, Inc., Logan, UT, USA) in time. The water probes were inserted into the soil in the center of the ridge, directly below the dropper and in the furrow, and the soil water content was recorded every 30 min at the depths of 10 cm, 20 cm, 40 cm, and 60 cm. The soil water content was corrected by the oven-drying method every 60 days. The arrangement of observation points is shown in Figure 2. A HOBO (Onset, Bourne, MA, USA) was set up in the open area of the test area to automatically record wind speed, air humidity, air temperature, atmospheric pressure, solar radiation, and other data. The data were measured every 15 min and recorded every 15 min. The average value was taken every day. In each growth stage of the plant, six representative plants were selected from each cell, and the roots were taken between the plants and between the rows, with a diameter of 7 cm root drill. The root depth was 60 cm, and each 10 cm had a layer. The roots were washed in the net bag. Black and white image files were scanned by a double-sided scanner (Seiko Epson, Nagano, Japan), and root morphological characteristics were analyzed by WinRHIZO (Regent Instruments, Montreal, QC, Canada). The leaf area index was calculated by AutoCAD in the early stage of growth, and LAI-2200C plant canopy analyzer (LI-COR, Lincoln, NE, USA) was used for measurement in the late stage. When measuring the plant height, six plants were randomly selected from each cell, and their natural plant height was measured with a tape measure. To calculate the root water uptake, after removing the gravity water from the soil profile, it was considered as the starting point for the root water uptake. The difference between the water content of each day, and the days after that, was determined as the root water uptake in that period. The reasons for reducing the soil water content over time were related to three factors: evaporation, root water uptake, and gravity water. After removing the gravity water from the soil, in the top layer of the soil, two factors of evaporation and root water uptake, and at lower depths only root water uptake could affect the outflow of water from the soil. Therefore, to calculate the root water uptake in the top layer, the evaporation was subtracted from the difference of the soil water content (the difference between soil water content was measured by Campbell CR1000X in two consecutive days [22]).

2.3. HYDRUS-2D Model

The water movement of tomatoes under drip irrigation in solar greenhouse was simulated based on the HYDRUS-2D model [30]. The Galerkin finite element was used to solve the Richards equation in this model. The formula is as follows:
θ t = x [ K ( h ) h x ] + z [ K ( h ) h z + K ( h ) ] S ( h ) ,
where θ is soil volumetric moisture content (cm3·cm−3), h is the pressure head (cm), K(h) is the water conductivity (cm·d−1), t is the simulation time (d), x and z are horizontal and vertical coordinates (cm), S(h) is the water absorption term of roots, which refers to the water absorption rate of roots in soil per unit time volume (d−1).
In this model, the soil water retention curve, θ(h), by van Genuchten [31], and the unsaturated hydraulic conductivity function, K(h), by Mualem [32], were obtained from Equations (2)–(4) respectively:
θ ( h ) = θ r + θ s θ r ( 1 + ( α | h | ) n ) m ( m = 1 1 n )
K ( h ) = K s S e l [ 1 ( 1 S e 1 m ) m ] 2
S e = θ θ r θ s θ r ,
where θr and θs denote the residual and saturated water content, respectively (L3·L−3), α is the inverse of the air-entry value (L−1), Ks is the saturated hydraulic conductivity (L·T−1), n is the pore-size distribution index, Se is the effective water content (L3·L−3), and l is the pore-connectivity parameter, with an estimated value of 0.5, resulting from averaging conditions in a range of soils [32].

2.3.1. Initial Conditions and Boundary Conditions

In this experiment, the groundwater was buried deep, so the influence of groundwater on the simulated area was not considered. Therefore, the lower boundary of this profile was selected as the “free drainage boundary”. The lateral boundary was set as “zero flux boundary”. The upper boundary was divided into film-covered zone and unfilm-covered zone. The film-covered zone was set as “zero flux boundary”, because it cut off the water transmission path between the atmosphere and the surface, and the unfilm covered zone was set as “atmospheric boundary”. The drip holes were set as “variable flow boundary”, which was determined by the actual irrigation volume. Each boundary condition is shown in Figure 2. Since the whole drip-irrigation belt can be regarded as a symmetrical distribution of wide row centers, the right half of the ridge was selected for simulation in this simulation.
The point-source infiltration was transformed into a linear water flux, which can be calculated by the following formula [33]:
q = Q · L L ,
where q is the water flux through the upper boundary (cm·d−1), Q is the drip-irrigation flow (cm·d−1), L is the length of the dripper control boundary (cm), and L’ is the drip input flow boundary (cm).

2.3.2. Root Water Uptake

In HYDRUS-2D, root water uptake is modeled as a sink term in the Richards equation, using the stress response function proposed by Feddes [34]:
S ( h ) = a ( h ) b ( x , z ) T p S t
b ( x , z ) = b ( x , z ) Ω R b ( x , z ) d Ω
a ( h ) = { h 1 h h 1 h 2 h 2 < h h 1 1 h 3 h h 2 h h 4 h 3 h 4 h 4 h h 3 ,
where b(x, z) is the water absorption distribution parameter of roots, which is determined according to the actual root distribution, Tp is the potential transpiration rate (cm·d−1), a(h) is a dimensionless parameter of soil water pressure, St is the soil surface width related to the crop transpiration process (cm), h is the anaerobic point pressure water head of root water absorption (cm), h2 is the most suitable root water absorption pressure head (cm), h3 is the pressure water head at the end of root water absorption (cm), and h4 is the pressure water head at the root water absorption droop point (cm). The specific parameters of root water absorption were directly selected in the HYDRUS-2D software by referring to the reference values proposed by Wesseling et al. [35].

2.3.3. Transpiration and Evaporation of Greenhouse Tomatoes

In the soil–plant–environment system of the greenhouse, due to the controllable environment, its water and heat transport mode is very different from that in the natural environment. In particular, the total radiation and wind speed in the greenhouse have greatly changed compared with that in the natural environment. Therefore, when calculating the evapotranspiration of crops in the greenhouse, the formula applicable to the natural environment cannot be directly applied. Thus, the double-crop coefficient method was used to calculate potential transpiration and potential evaporation [36].
Due to the characteristics of low wind speed in the greenhouse, Gong [36] set the aerodynamic resistance term as 295 s·m−1, and integrated it into the Penman–Monteith equation to accurately estimate the reference evapotranspiration (ET0) of greenhouse crops:
E T 0 = 0.408 Δ ( R n G ) + γ [ 628 D / ( T a + 273 ) ] Δ + 1.24 γ ,
where ET0 is the reference crop evapotranspiration (mm·d−1), Rn is net radiation (MJ·m−2·d−1), G is soil heat flux (MJ·m−2·d−1), γ is the constant of the wet and dry table (kPa·°C −1), ∆ is the slope of temperature change with saturated water vapor pressure (kPa·°C −1), D is the saturated vapor pressure difference (kPa), and Ta is the air temperature (°C).
For dual crops, the crop coefficient (Kc) was divided into two parts: the basic crop coefficient (Kcb) and the soil evaporation coefficient (Ke), which were used to estimate crop transpiration and soil evaporation, respectively. The formula recommended by FAO [37] was used for calculation:
E s = K e E T 0
T r = K s K c b E T 0 ,
where Kcb is the coefficient of the base crop, Ke is soil evaporation coefficient, and ET0 is the reference evapotranspiration.

2.4. Susceptivity Analysis

In this paper, single-factor sensitivity analysis was used. Firstly, each parameter was changed by an appropriate multiple, one by one. Then, the sensitivity coefficient was calculated according to the simulation results, and the influence degree of the change of a single parameter on the objective function (water content of different soil layers) was analyzed. Ai > 0 indicates that the independent variable corresponds to a positive influence, and vice versa, an inverse influence. The greater |Ai| suggests the higher sensitivity:
A i = Δ y / y Δ x i / x i ,
where y is the value of the objective function, xi is the ith parameter, ∆y is the change value in the objective function, ∆xi is the change value in the ith parameter.

2.5. Calibration and Validation of HYDRUS-2D Model

The simulated and measured values of soil water content were evaluated by the mean relative error (MRE), determination coefficient (R2), and root mean square error (RMSE).
MRE = 1 n i = 1 n | S i M i | S i × 100 %
R 2 = i = 1 n ( M i M a v e ) ( S i S a v e ) i = 1 n ( M i M a v e ) i = 1 n ( S i S a v e ) ,
RMSE = 1 n i = 1 n ( S i M i ) 2
where Si is the simulation value, Mi is the measured value, i is the observation point, n’ is the total number of observation points, Save and Mave are the average simulated value and the average measured value, respectively.

3. Results

3.1. Parameter Determination and Validation of Soil Water Movement Model

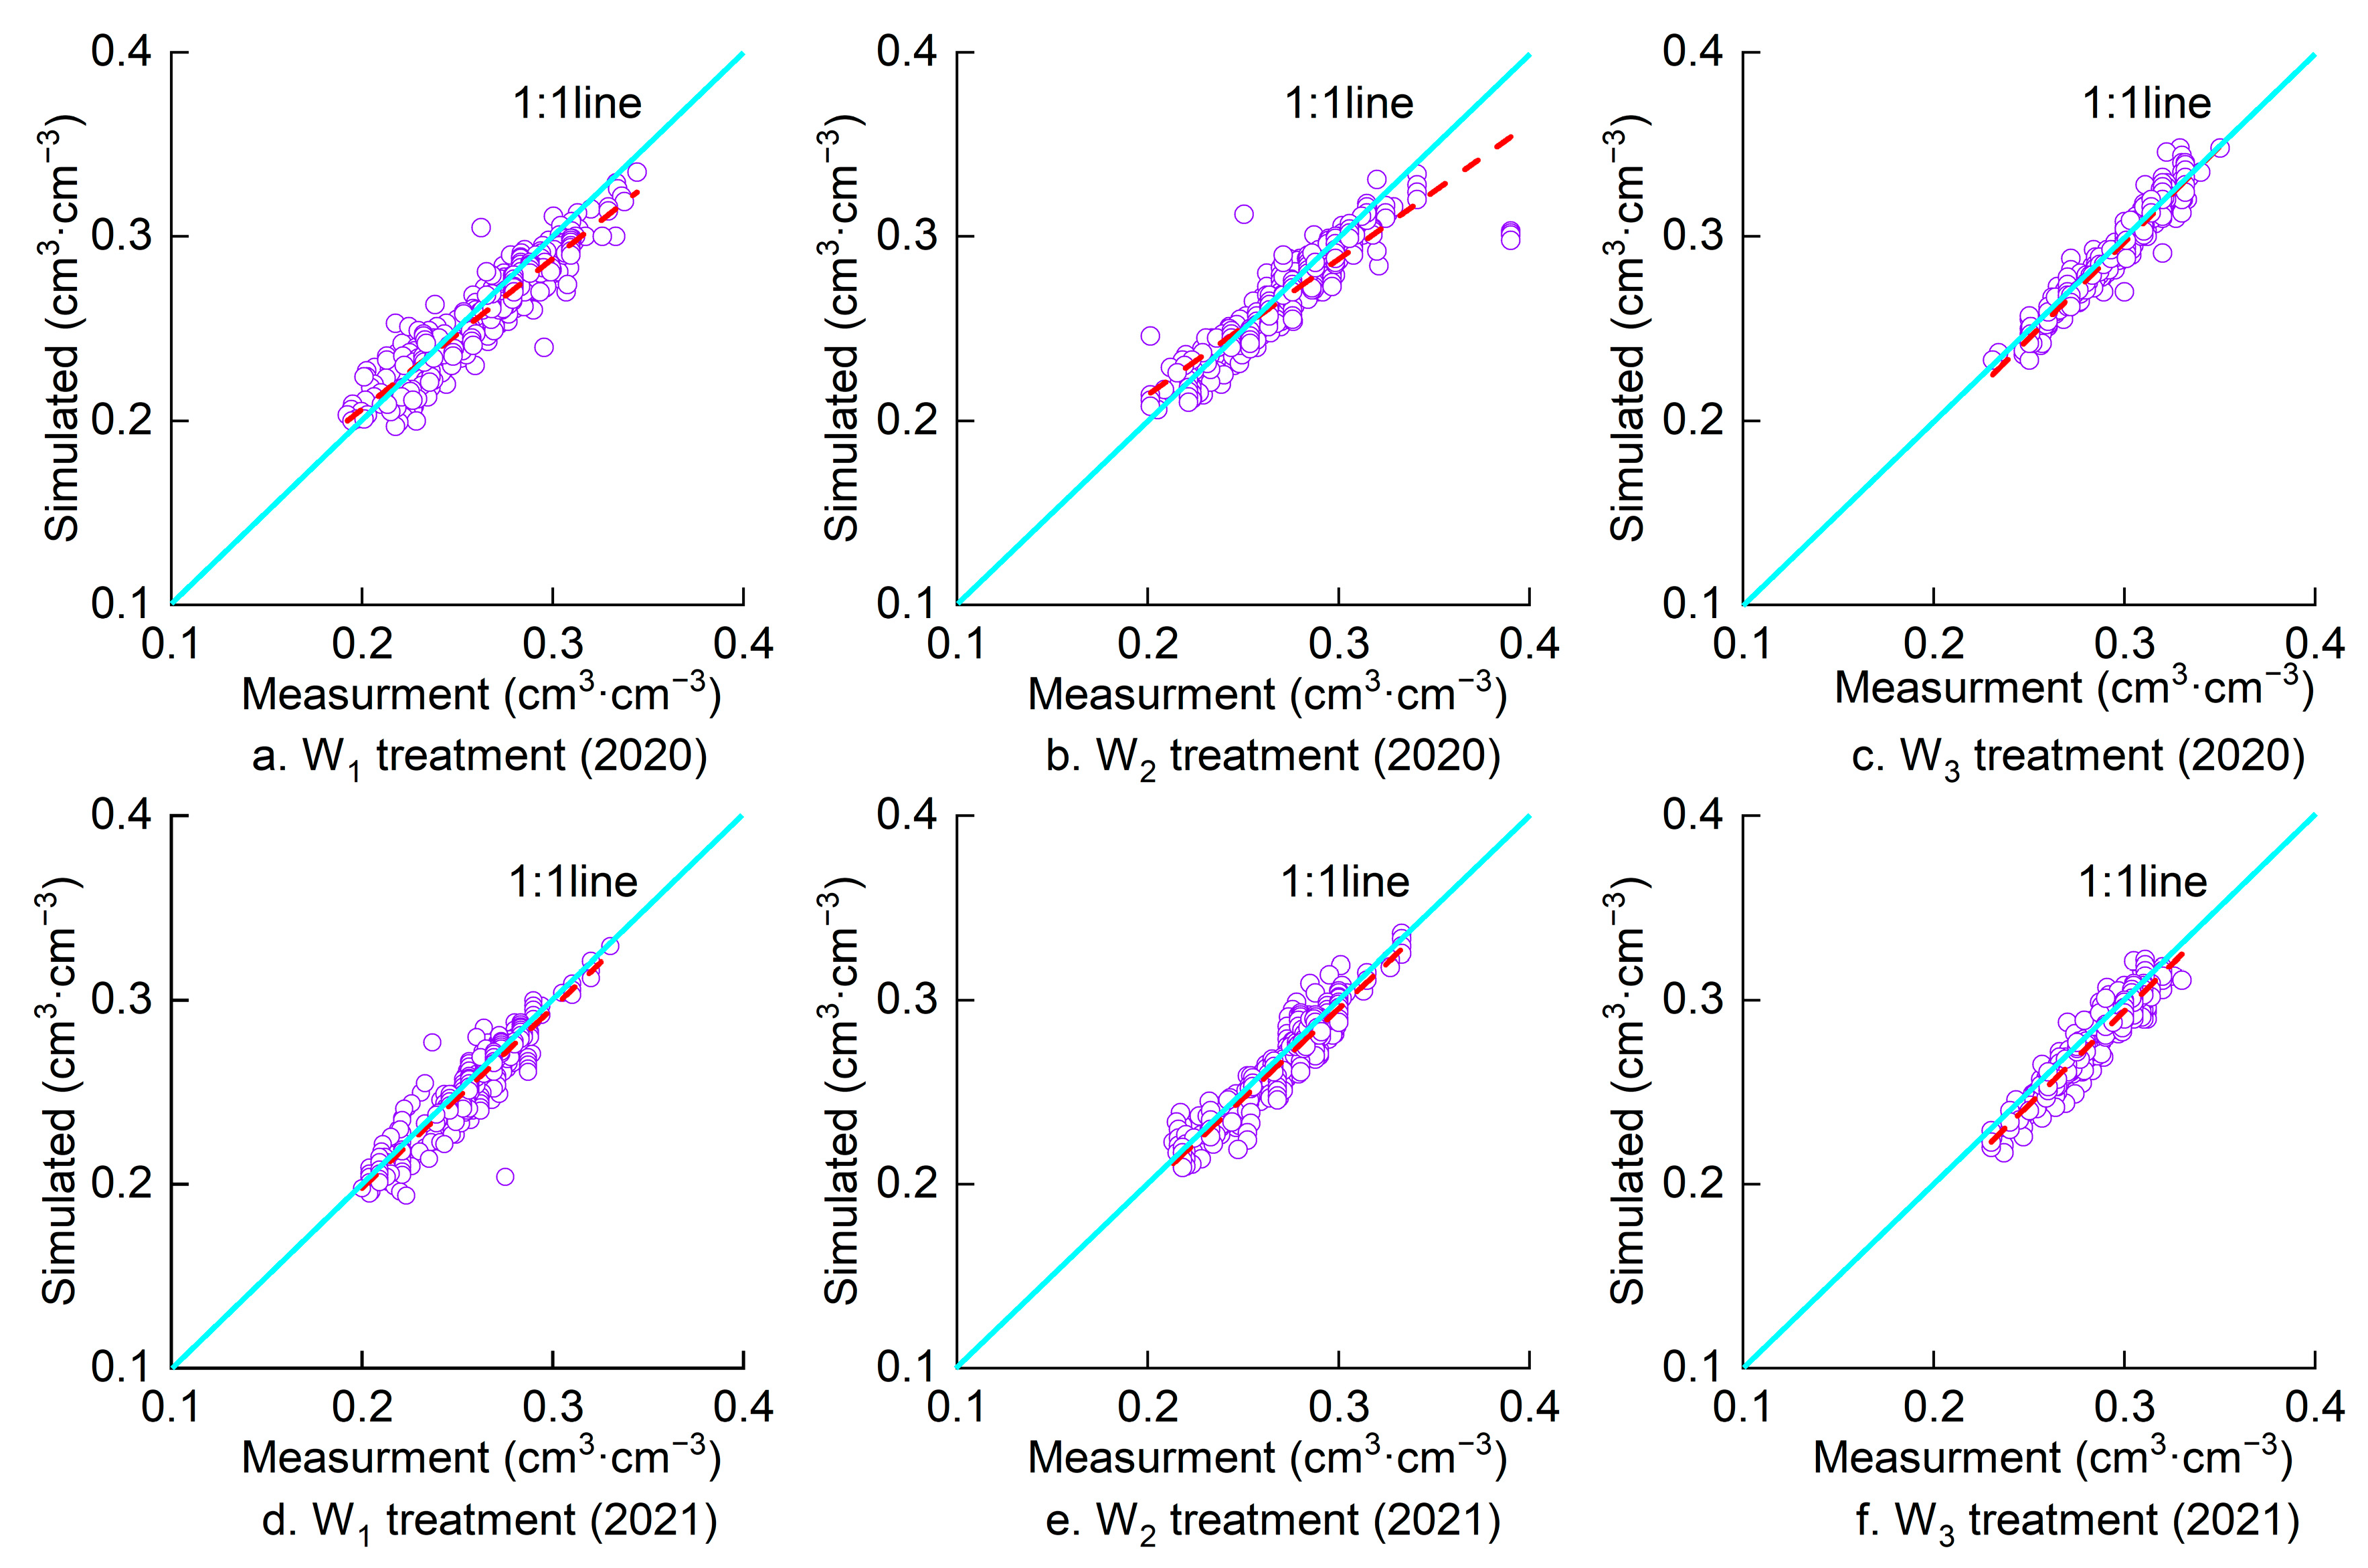
The test data of 2020 was used to determine the model parameters, and the test data of 2021 was used to validate the model. The measured values and simulated values of different soil layers at different times under each treatment are shown in Figure 3. Figure 3 shows that the simulated values and measured values of each treatment are evenly distributed on both sides of the 1:1 line. Therefore, the greenhouse soil water movement model, constructed by the HYDRUS-2D model, has a high simulation accuracy. The MRE of each treatment in two years ranged from 0.062 to 0.126 cm3·cm−3, the R2 ranged from 79% to 92%, and the RMSE ranged from 0.014 to 0.027 cm3·cm−3. Detailed error analysis values are shown in Table 1. Soil hydraulic parameters were predicted based on the Rosetta model built into the HYDRUS-2D model. Soil particle composition (clay, silt, sand, volume percentage) and initial bulk density were used to predict soil hydraulic parameters. The 0–60 cm soil layer was divided into three layers, and the average value of each layer was considered. The soil hydraulic parameters, after calibration, are shown in Table 2.

3.2. Simulation of Soil Water Movement

Figure 4 shows that under different water treatments, with the increase of irrigation level, the surface soil moisture content kept rising. Most soil water content data under different water treatments were within the range of 1.5 IQR (interquartile distance). The width of the box reflects the fluctuation degree of the data to some extent. In Figure 4, it can be observed that irrigation made the water soil content of the 0–40 cm fluctuate greatly, and the width of the box of 20 cm soil layer was the largest, indicating that irrigation had a significant impact on the soil water content of the 0–20 cm layer. The water content of shallow soil was lower than that of deep soil under each water treatment, which was related to water absorption of tomato roots and evaporation of the surface soil. The water content of the deep soil was large and relatively stable, which was related to the low distribution of tomato roots and the redistribution of the soil water.
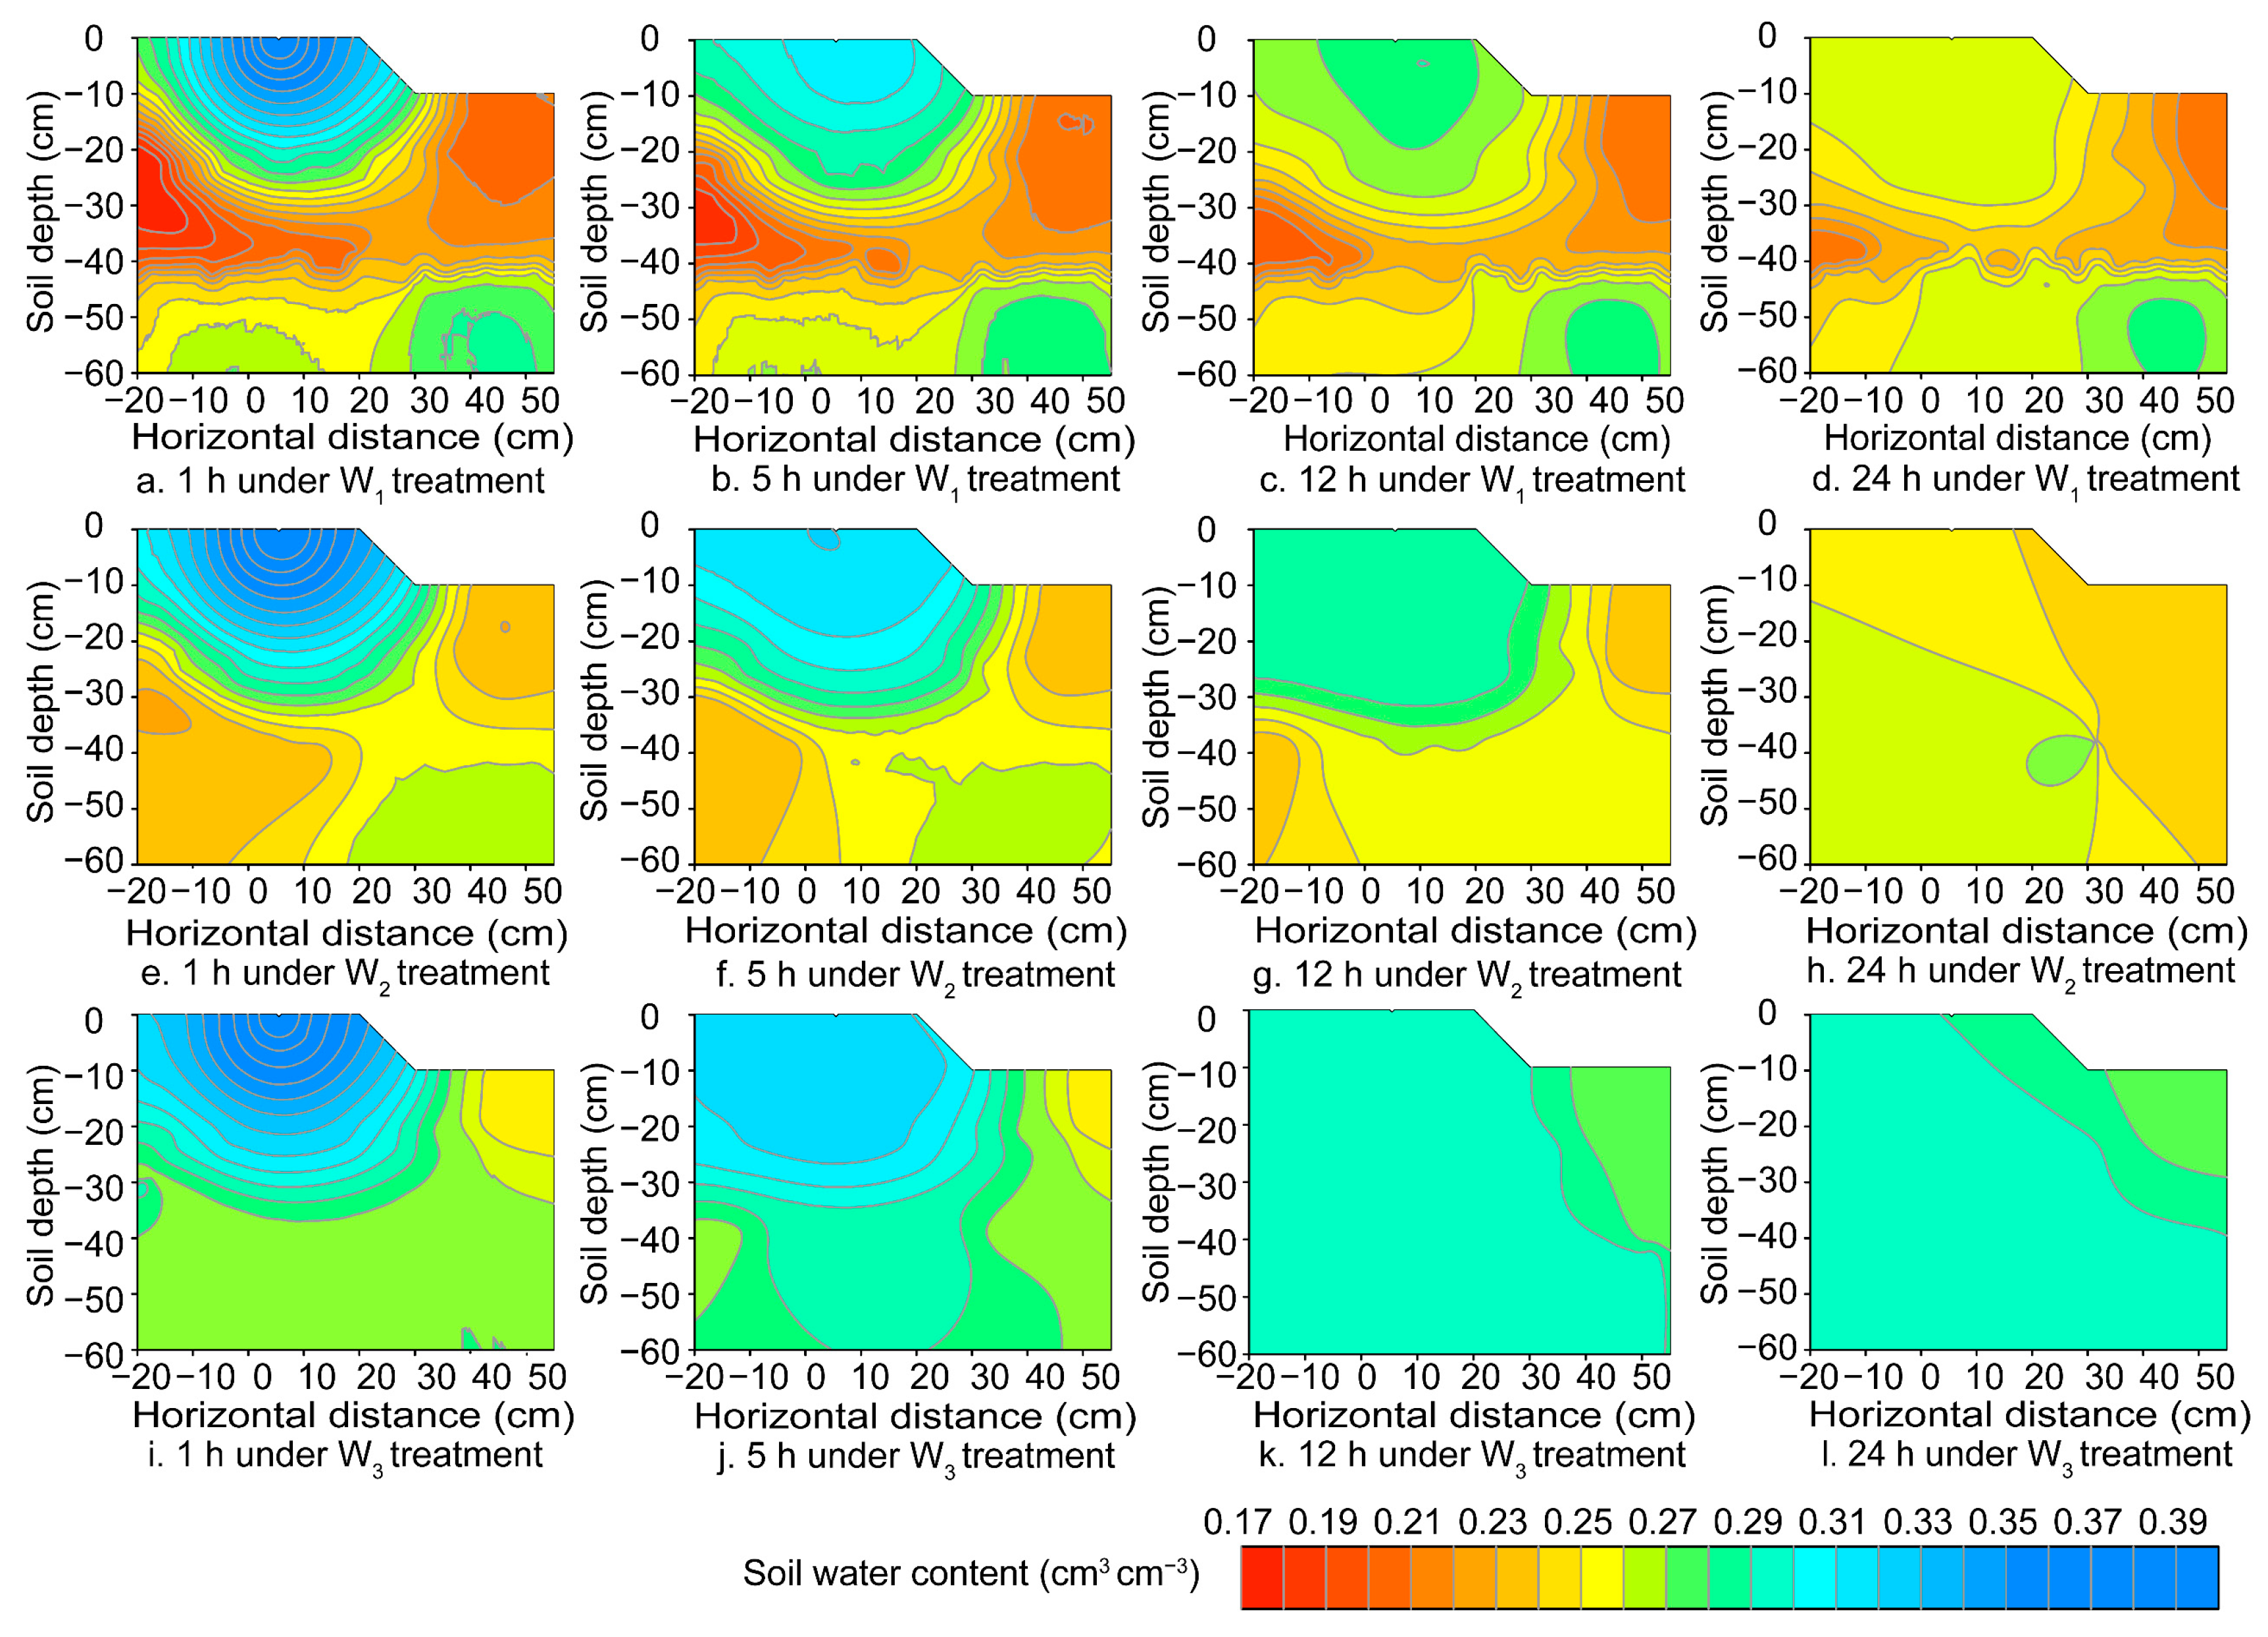
Figure 5 shows the soil water movement at 1 h, 5 h, 12 h, and 24 h after one irrigation, under three water treatments at flowering and fruiting stages. Figure 5 shows that the soil water migrated to 30 cm at 1h after irrigation began, indicating that water migrated fast in the vertical direction of the soil. At 5 h after irrigation began, the water movement of W1 treatment began to slow down. W2 and W3 treatments still had a downward trend, but W3 treatment had an obvious downward trend. At 12 h after irrigation began, the soil water under W1 and W2 treatments stopped moving downward, and the vertical depth reached about 35 cm and 40 cm, respectively. Due to the higher water content of W3 treatment, water continued to move at 12 h after irrigation began, which had an impact on the soil water content below 40 cm, indicating that adequate irrigation would make water leak into the deep layer, resulting in the waste of water resources. At 24 h after irrigation began, water movement under each treatment remained stable. It could be seen that the soil water content of each soil layer under W3 treatment was significantly higher than that under W1 and W2 treatment. At the depth of 0–20 cm, the average soil water content under W3 treatment was 16.2% and 8.5% higher than that under W1 and W2 treatment, 14.8% and 7.6% higher in the depth of 20–40 cm, and 10.9% and 6.1% higher in the depth of 40–60 cm during the whole growth period of tomatoes in 2020.

3.3. Simulation of Root Water Uptake

Figure 6 shows the root density of tomatoes in the 0–60 cm soil layer under three water treatments, in 2020 and 2021. It can be seen from Figure 6 that the distribution of root density in two years was consistent. Muller showed that at each stage of growth, the distribution of root density was similar regardless of treatment [38]. This study showed that the root density of tomatoes was mainly concentrated in the 0–20 cm soil layer under different water treatments, and 83–90% of the total root quantity of tomato was concentrated in the 0–20 cm soil layers under different water treatments. However, the root density under different water treatments varied greatly in different soil layers. In 2020, the root density at the depth of 0–20 cm under W1 treatment was 51.19% higher than that under W3 treatment, indicating that the higher the water deficit, the more concentrated the tomato roots would be in the surface soil. The root density under W1 treatment decreased approximately linearly after reaching the maximum value in the 0–10 cm soil layer, and the root density in the deep soil was less than that of adequate irrigation. It is worth noting that in the 50–60 cm soil layer, the root density under W1 treatment (0.53 cm3·cm−3) was slightly higher than that under W2 (0.46 cm3·cm−3) and W3 treatments (0.42 cm3·cm−3), which might be due to the water deficit in the surface soil caused by root water uptake and soil evaporation. At this point, the tomato roots extended deeper into the soil, absorbing water from the deeper soil to sustain their life activities. The experimental results also showed that the longest root under W1 treatment was about 58 cm, and was slightly higher than that under W2 and W1 treatments.
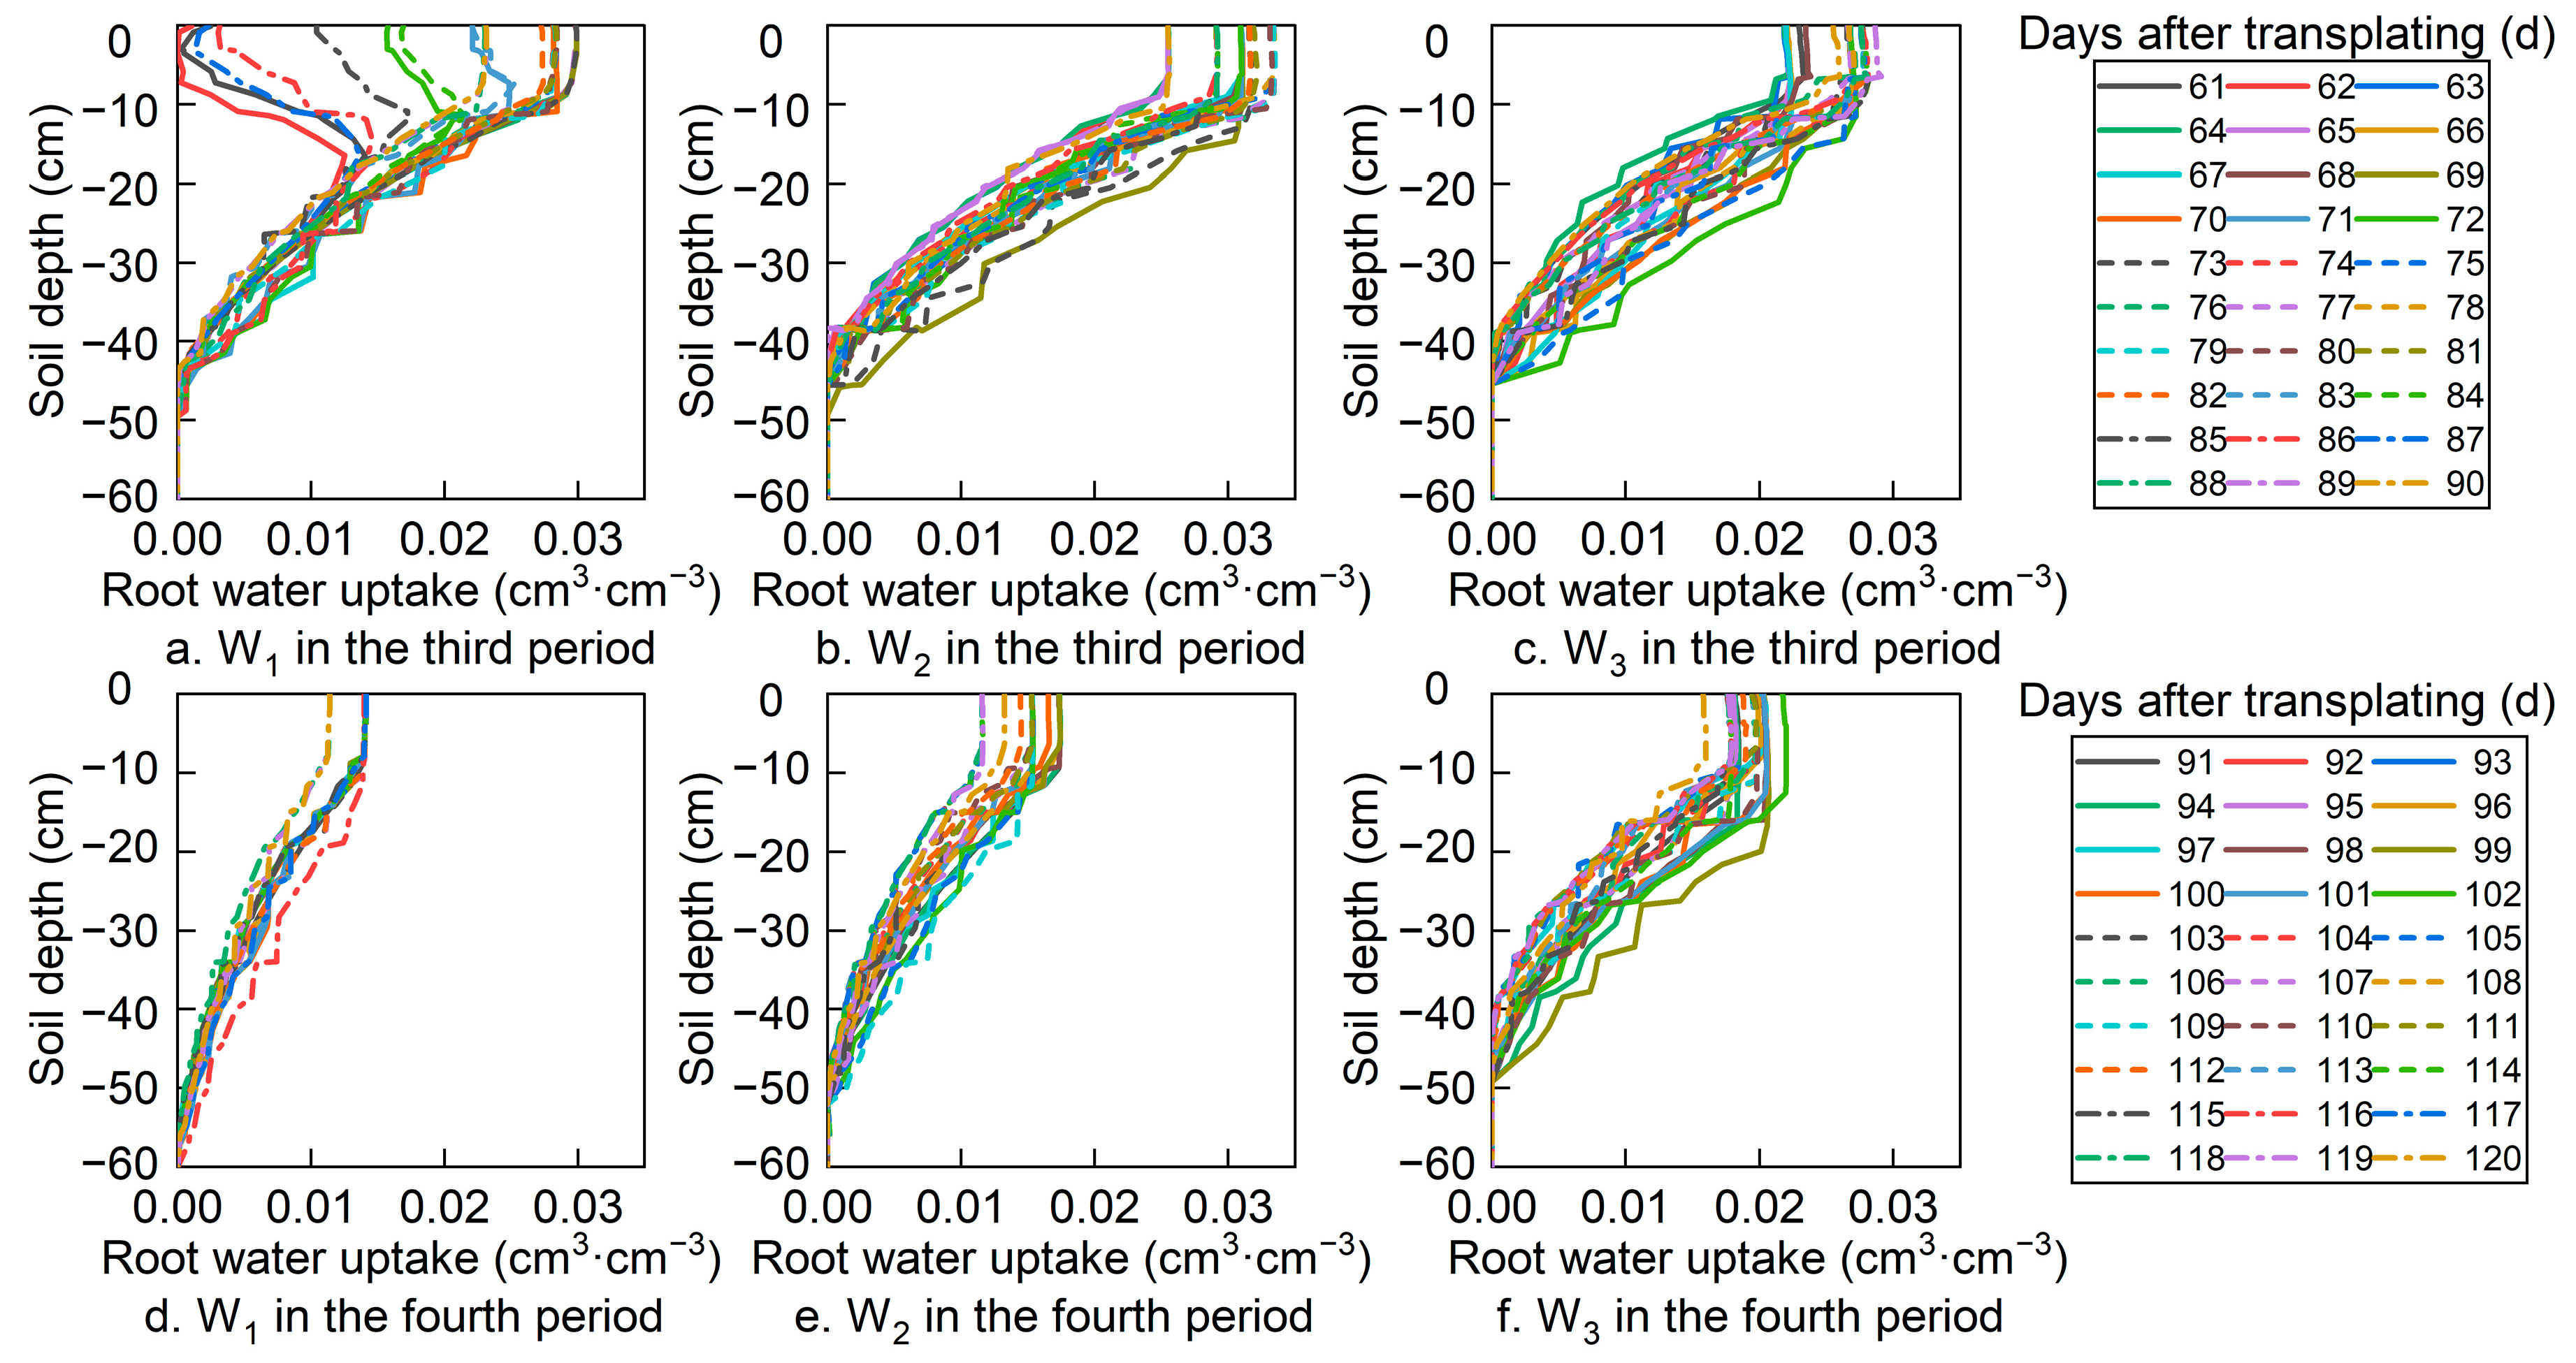
The blooming and setting stage (the third period) and the fruiting stage (the fourth period) of tomatoes were the periods when the roots were more active in water uptake. Figure 7 shows the root water uptake of tomatoes in the blooming and setting stage and fruiting stage in 2020. Under the same water treatment, the water absorption of roots in the blooming and setting stage was higher than that in the fruiting stage. This was because as the plants began to age in the later stage, the leaf appeared curled up, and the decrease of leaf area led to the decrease of plant transpiration, thus reducing the root water uptake. Under different water treatments in the blooming and setting stage and fruiting stage, the water absorption of tomato roots was mainly concentrated in the 0–20 cm layer. This was because the 0–20 cm soil layer was the area with the highest root density, so 0–20 cm was the main water uptake layer of tomatoes. W1 water treatment was irrigated on 16 May (the 63rd day of transplantation). One day before irrigation (the 62nd day of transplantation), the water absorption of tomato roots was mainly concentrated in the 10–30 cm soil layer, while the roots of the 0–10 cm soil layer did not absorb water at all. This was due to the decrease of soil water content caused by water uptake of surface roots and soil evaporation. Water deficit inhibited the water absorption of surface roots. At this time, tomatoes would absorb soil water through deep roots to maintain their life activities. Studies have shown that when the water content of the surface soil with high root density decreases, crops would increase the water absorption rate of the deep roots to compensate [18]. In the next irrigation, the water absorption rate of 0–10 cm roots reached 0.03 cm3·cm−3, indicating that water deficit promotes the water absorption of surface roots in the next irrigation to some extent.

3.4. Two-Dimensional Distribution of Soil Water Content

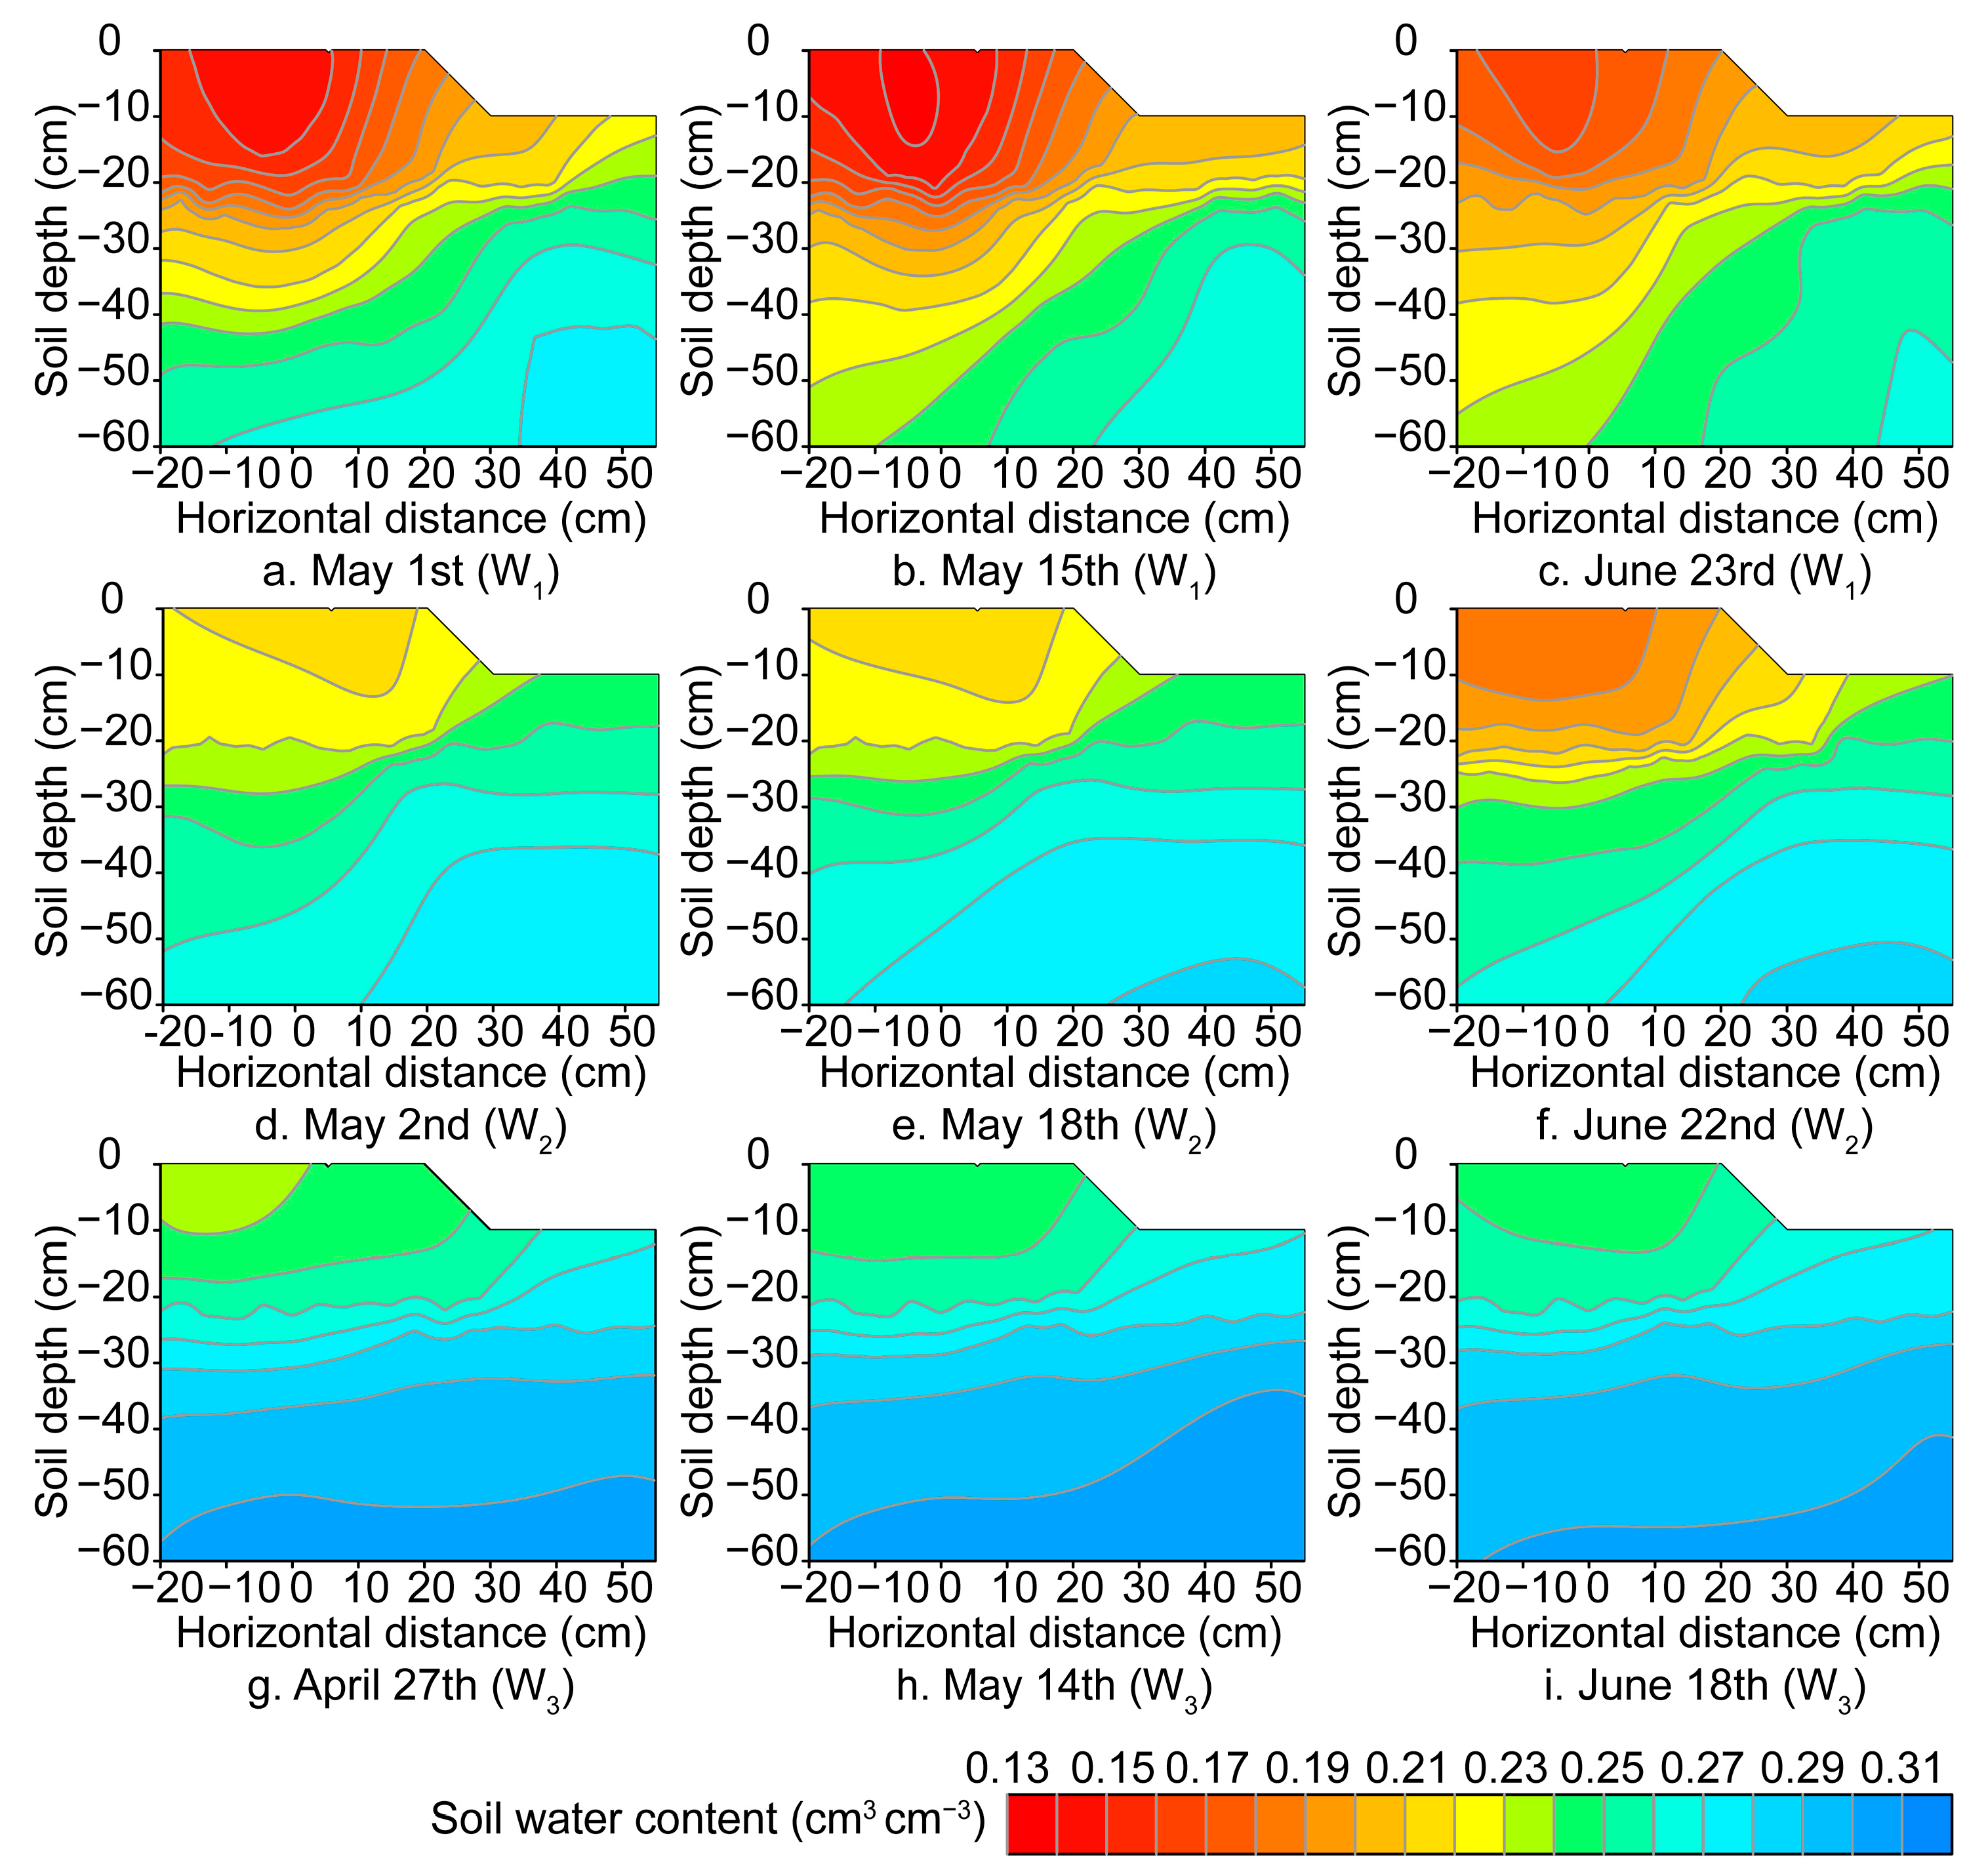
Since the variation trend of soil water content in two years was the same, the two-dimensional distribution characteristics of soil water content before the day of three irrigations were analyzed in 2020. Figure 8 shows the two-dimensional distribution of soil water content on the day before three irrigations, under different water treatments. As can be seen in Figure 8, soil water deficit and root distribution were highly consistent. Water deficit under different water treatments was mainly concentrated in the surface soil layer (0–20 cm), which was consistent with the main distribution layer of roots. Therefore, water deficit in surface soil was mainly affected by water absorption by roots. The deep soil almost always maintained a higher soil water content, because there were fewer tomato roots in the 40–60 cm soil layer, and water redistribution would recharge the water in the deep soil. The degree of soil water deficit and the main water-deficient area were different under different treatments. W1 treatment had the highest water deficit degree, with the main water-deficient area concentrated in 0–40 cm, while W2 treatment had a lower water deficit degree, with the main water-deficient layer area concentrated in 0–20 cm. There was almost no water deficit in W3 treatment.
Although the amount of water up to the withering point is theoretically considered to be effective water, the amount of water absorbed by crops decreases significantly before the withering point appears. When soil water content is very low, soil water is tightly bound to the surface of the soil, and soil water is difficult to be absorbed by crops. When the soil water content drops to a critical level, the water in the soil no longer flows rapidly to the roots to meet the transpiration needs of the crops, and the plants begin to face water stress [37]. According to the soil texture data given by the UNSODA database, the soil water content was about 0.21–0.24 cm3·cm−3 when water stress began to appear in the soil [25]. It can be seen that when the soil water content was lower than this value, the tomato roots were in a state of stress. Under W1 treatment, the soil-water-deficit areas on the day before three irrigations were 1848.67 cm2, 2209.37 cm2, and 2148.76 cm2. Under W2 treatment, the soil-water-deficit areas on the day before three irrigations were 903.65 cm2, 881.75 cm2, and 1200.73 cm2. W3-treated soil was almost always moist. Therefore, soil water distribution is greatly affected by water absorption by crop roots. Hence, it is of great significance to explore the laws of root water uptake and the characteristics of soil water movement for water-saving irrigation.

3.5. Sensitivity of Parameters

Parameter sensitivity analysis is the basis of soil water dynamic simulation. In this paper, the single-factor sensitivity analysis method was used to calculate the sensitivity coefficient (Ai) according to the simulation results. The ratings of parameter sensitivity are shown in Table 3.
It is well known that α is the intake value, and Ks and α have a good correlation. θs and θr can be determined accurately according to the measured maximum and minimum water content. However, the parameters α, n and Ks are determined with great uncertainty. Therefore, this paper focused on the analysis of the sensitivity of parameters α, n and Ks. The independent variables of the sensitivity analysis were parameters α, n and Ks in the three-layer soil, a total of nine parameters. The target function of sensitivity analysis was the water content of 20 cm, 40 cm, and 60 cm soil layers. In Table 4, the hydraulic parameters α, n and Ks of the three soil layers, were increased by −5%, −10%, −15%, −20%, 5%, 10%, 15%, and 20%, respectively, to obtain the average sensitivity coefficients of the water content of 20 cm, 40 cm, and 60 cm soil layers. Table 4 shows that parameter n had the highest sensitivity compared with parameters α and Ks, and the sensitivity coefficients of parameter n in three soil layers were more than 0.2, reaching the degree of sensitivity. In addition, parameter n of each soil layer had the highest sensitivity to water content of the corresponding soil layer. The sensitivity coefficient of parameter n1 was up to 0.098, and the sensitivity coefficients of n2 and n3 were both over 1, which was highly sensitive. However, the sensitivity of the parameters α and Ks to the soil water content of the three layers only reached moderate sensitivity.

4. Discussion

Mulching drip irrigation is an efficient water-saving irrigation technology that has been widely used in China’s agricultural production [39]. For drip irrigation, too much irrigation can lead to subsurface seepage and water loss. Too much or too little moisture in the soil is bad for the growth of crops [12,23], so it is particularly important to explore the laws of soil water movement. According to this study, under different water treatments, irrigation mainly affected the water content of the 0–40 cm soil layer, which significantly affected the 0–20 cm soil layer and had no effect on the 40–60 cm soil layer. The insignificant change in the water content of the 40–60 cm soil layer was related to the small distribution of the roots and water redistribution. This conclusion is similar to the conclusions of the soil moisture study by Li [40]. Shan [41] came to a similar conclusion when he explored the redistribution of soil water in the field environment of slope under drip-irrigation conditions. The results showed that the wetting circle extended to 18–20 cm in 24 h, and when water penetrated deeper into the soil, the adjacent wetting volume merged, and the wetting front disappeared before reaching 50 cm. This also proved that soil water mainly moved in 0–40 cm soil layer under drip irrigation.
Accurately quantifying root water uptake (RWU) and characterizing its temporal variation can help optimize irrigation planning and increase crop productivity for sustainable development [42]. Tomatoes are a kind of shallow-rooted crop. Under different water treatments, the water absorption of the roots mainly concentrated in the 0–20 cm soil layer, because the maximum root density of tomatoes is mainly concentrated in the 0–20 cm soil layer, and the root density of the soil below 20 cm decreased linearly. Muller’s study [38] showed that the root density of tomatoes increased sharply from the ground, with a depth of 5–12 cm and an average depth of 7 cm, and then decreased relatively linearly to the maximum root depth. The experiment found that the lower the irrigation level, the more the roots concentrated in the surface soil, which was similar to the experimental results of Muller [38]. Of the total root density of tomatoes, 83–90% was concentrated in the 0–20 cm soil layers under different water treatments. The maximum root length of tomatoes under W1 treatment were higher than that under W2 and W3 treatments, which was due to the less frequent irrigations. The water absorption of the surface roots and soil evaporation led to less water content in the surface soil, which made the upper roots subject to water stress. Tomatoes only maintained their life activities by growing downward and absorbing water from deep soil. This conclusion is similar to that of Thomas [18], Ge [43] and Shabbir et al. [44]. This characteristic of root growth was also shown in other crops. Li [45] also found that the root of jujube would spread deeper into the soil under the condition of deficit irrigation when he studied the root growth under drip irrigation. Studies showed that low irrigation levels could promote the water absorption rate of surface roots at the next irrigation, which was similar to Deb [46].
Soil water distribution before irrigation under different treatments showed a high consistency between soil water distribution and root distribution [45]. Muller [38] also showed that when plants were subjected to water stress, root growth would adapt to the water changes, reflecting the adaptation of roots to high-soil-moisture areas. Nazari’s research [22] showed that the root density and soil water content were two important factors that determined the water absorption of roots, and they had an interactive effect. On the day before the irrigations, the surface soil under each treatment produced different degrees of water shortage, which was due to the root absorption of tomatoes and the evaporation of the surface soil, Malash [47] also said that on the day before irrigations, the surface soil (0–30 cm) water content would be low, which was related to surface soil evaporation and root water uptake. Therefore, it is of great significance to master the relationship between soil moisture and root water absorption for saving irrigation.
The sensitivity analysis of three parameters of the HYDRUS-2D model showed that n is the most sensitive parameter compared with α and Ks, and both of them are highly sensitive. Cheviron [48] also came to the same conclusion.

5. Conclusions

In this study, based on a two-year field experiment, models of soil water movement and root water uptake of greenhouse tomatoes under drip irrigation were established by the HYDRUS-2D model, in order to explore the characteristics of soil water movement and the laws of root water uptake under different water treatments, and finally reveal the relationships between soil, water and plants under water-saving irrigations in a greenhouse. It provided the theoretical basis for formulating the strategy of precise drip irrigation in a solar greenhouse. This article drew the following conclusions through research: (1) The HYDRUS-2D model can be used to investigate the soil water movement of tomatoes under drip irrigation in solar greenhouse. The MRE of each treatment in two years ranged from 0.062 to 0.126, the R2 ranged from 79% to 92%, and the RMSE ranged from 0.014 to 0.027. (2) Under different treatments, irrigation mainly affected the water content of 0–40 cm soil, and significantly affected the water content of 0–20 cm soil, but had almost no effect on the soil layer of 40–60 cm. At 12 h after irrigation began, water stopped moving under W1 and W2 treatments, and water moved to about 35 cm and 40 cm in the vertical direction, respectively. At 24 h after irrigation began, water movement tended to be stable. (3) The results showed that 83–90% of total root quantity of tomato was concentrated in the 0–20 cm soil layers under different water treatments, and the higher the water deficit, the more concentrated the roots were on the surface soil. A certain degree of water stress would inhibit the water absorption of surface roots. In this case, the roots would extend downward and maintain life activities by absorbing deep-soil water. Certain water stress could promote the water absorption rate of 0–10 cm root in the next irrigation, and the maximum was up to 0.03 cm3·cm−3. (4) There was a high consistency between soil water distribution and root distribution. On the day before irrigations, different degrees of water deficit appeared in the surface soil under different treatments, and the main deficit area was concentrated in the surface soil (0–20 cm). The average area of soil water shortage in W1 was 2.08 times that in W2. W3 treatment hardly suffered from water stress. (5) In the model, parameter n had the highest sensitivity compared with parameters α and Ks, and sensitivity ranking was n > Ks > α.

Author Contributions

Conceptualization, B.L. and M.Y.; Data curation, B.L., M.Z. and H.N.; Formal analysis, L.S., M.Y., L.M., H.N. and Z.X.; Funding acquisition, M.Y.; Investigation, M.Z. and H.N.; Methodology, L.S.; Project administration, B.L., M.Y. and T.W.; Resources, B.L., M.Y. and T.W.; Software, L.S.; Supervision, B.L., M.Y., L.M. and T.W.; Validation, L.S., B.L., M.Y., L.M., Z.X. and J.W.; Writing—original draft, L.S.; Writing—review and editing, L.S., B.L. and M.Y. All authors have read and agreed to the published version of the manuscript.

Funding

This study was funded by the China Postdoctoral Science Foundation (2019M661128).

Data Availability Statement

The data are not publicly available due to the privacy restriction.

Conflicts of Interest

The authors declare no conflict of interest.

References

  1. Zhao, Y.M.; Lv, H.F.; Qasim, W.; Wan, L.; Wang, Y.F.; Lian, X.J.; Liu, Y.N.; Hu, J.; Wang, Z.X.; Li, G.Y.; et al. Drip fertigation with straw incorporation significantly reduces N2O emission and N leaching while maintaining high vegetable yields in solar greenhouse production. Environ. Pollut. 2021, 273, 116521. [Google Scholar] [CrossRef] [PubMed]
  2. Hong, M.; Zhang, Z.Y.; Fu, Q.P.; Liu, Y.P. Water Requirement of Solar Greenhouse Tomatoes with Drip Irrigation under Mulch in the Southwest of the Taklimakan Desert. Water 2022, 14, 3050. [Google Scholar] [CrossRef]
  3. Liu, H.J.; Yuan, B.Z.; Hu, X.D.; Yin, C.Y. Drip irrigation enhances water use efficiency without losses in cucumber yield and economic benefits in greenhouses in North China. Irrig. Sci. 2022, 40, 135–149. [Google Scholar] [CrossRef]
  4. Maureira, F.; Rajagopalan, K.; Stockle, C.O. Evaluating tomato production in open-field and high-tech greenhouse systems. J. Clean. Prod. 2022, 337, 130459. [Google Scholar] [CrossRef]
  5. Zapata-Sierra, A.J.; Moreno-Perez, M.F.; Reyes-Requena, R.; Manzano-Agugliaro, F. Root distribution with the use of drip irrigation on layered soils at greenhouses crops. Sci. Total Environ. 2021, 768, 144944. [Google Scholar] [CrossRef] [PubMed]
  6. Chen, J.L.; Kang, S.Z.; Du, T.S.; Qiu, R.J.; Guo, P.; Chen, R.Q. Quantitative response of greenhouse tomato yield and quality to water deficit at different growth stages. Agric. Water Manag. 2013, 129, 152–162. [Google Scholar] [CrossRef]
  7. Testa, R.; di Trapani, A.M.; Sgroi, F.; Tudisca, S. Economic Sustainability of Italian Greenhouse Cherry Tomato. Sustainability 2014, 6, 7967–7981. [Google Scholar] [CrossRef] [Green Version]
  8. Li, B.; Shukla, M.K.; Du, T.S. Combined environmental stresses induced by drip irrigation positively affect most solar greenhouse grown tomato fruit quality. Sci. Hortic. 2021, 288, 110334. [Google Scholar] [CrossRef]
  9. Wu, Y.; Yan, S.C.; Fan, J.L.; Zhang, F.C.; Zhao, W.J.; Zheng, J.; Guo, J.J.; Xiang, Y.Z.; Wu, L.F. Combined effects of irrigation level and fertilization practice on yield, economic benefit and water-nitrogen use efficiency of drip-irrigated greenhouse tomato. Agric. Water Manag. 2022, 262, 107401. [Google Scholar] [CrossRef]
  10. Gercek, S.; Demirkaya, M.; Isik, D. Water pillow irrigation versus drip irrigation with regard to growth and yield of tomato grown under greenhouse conditions in a semi-arid region. Agric. Water Manag. 2017, 180, 172–177. [Google Scholar] [CrossRef]
  11. Gercek, S.; Demirkaya, M. Impact of colored water pillows on yield and water productivity of pepper under greenhouse conditions. Agric. Water Manag. 2021, 250, 106835. [Google Scholar] [CrossRef]
  12. Li, Y.K.; Xue, X.Z.; Xu, F.; Guo, W.Z.; Duan, M.J.; Lin, S.; Li, Y.L.; Wang, Z. Negative-pressure irrigation improves water and fertilizer use efficiencies and fruit yield of greenhouse tomato on the North China Plain*. Irrig. Drain. 2021, 70, 1027–1038. [Google Scholar] [CrossRef]
  13. Zotarelli, L.; Scholberg, J.M.; Dukes, M.D.; Munoz-Carpena, R.; Icerman, J. Tomato yield, biomass accumulation, root distribution and irrigation water use efficiency on a sandy soil, as affected by nitrogen rate and irrigation scheduling. Agric. Water Manag. 2009, 96, 23–34. [Google Scholar] [CrossRef]
  14. Ge, J.K.; Zhao, L.F.; Gong, X.W.; Lai, Z.Q.; Traore, S.; Li, Y.B.; Long, H.; Zhang, L. Combined Effects of Ventilation and Irrigation on Temperature, Humidity, Tomato Yield, and Quality in the Greenhouse. Hortscience 2021, 56, 1080–1088. [Google Scholar] [CrossRef]
  15. Bandte, M.; Rodriguez, M.H.; Schuch, I.; Schmidt, U.; Buettner, C. Plant viruses in irrigation water: Reduced dispersal of viruses using sensor-based disinfection. Irrig. Sci. 2016, 34, 221–229. [Google Scholar] [CrossRef]
  16. Vanderborght, J.; Couvreur, V.; Meunier, F.; Schnepf, A.; Vereecken, H.; Bouda, M.; Javaux, M. From hydraulic root architecture models to macroscopic representations of root hydraulics in soil water flow and land surface models. Hydrol. Earth Syst. Sci. 2021, 25, 4835–4860. [Google Scholar] [CrossRef]
  17. Besharat, S.; Nazemi, A.H.; Sadraddini, A.A. Parametric modeling of root length density and root water uptake in unsaturated soil. Turk. J. Agric. For. 2010, 34, 439–449. [Google Scholar] [CrossRef]
  18. Thomas, A.; Yadav, B.K.; Simunek, J. Root water uptake under heterogeneous soil moisture conditions: An experimental study for unraveling compensatory root water uptake and hydraulic redistribution. Plant Soil 2020, 457, 421–435. [Google Scholar] [CrossRef]
  19. Angaleeswari, M.; Ravikumar, V. Estimating evapotranspiration parameters by inverse modelling and non-linear optimization. Agric. Water Manag. 2019, 223, 105681. [Google Scholar] [CrossRef]
  20. Maharjan, G.R.; Prescher, A.K.; Nendel, C.; Ewert, F.; Mboh, C.M.; Gaiser, T.; Seidel, S.J. Approaches to model the impact of tillage implements on soil physical and nutrient properties in different agro-ecosystem models. Soil Tillage Res. 2018, 180, 210–221. [Google Scholar] [CrossRef]
  21. Tenreiro, T.R.; Garcia-Vila, M.; Gomez, J.A.; Jimenez-Berni, J.A.; Fereres, E. Water modelling approaches and opportunities to simulate spatial water variations at crop field level. Agric. Water Manag. 2020, 240, 106254. [Google Scholar] [CrossRef]
  22. Nazari, E.; Besharat, S.; Zeinalzadeh, K.; Mohammadi, A. Measurement and simulation of the water flow and root uptake in soil under subsurface drip irrigation of apple tree. Agric. Water Manag. 2021, 255, 106972. [Google Scholar] [CrossRef]
  23. Geng, L.; Li, L.; Li, W.; Yang, C.F.; Meng, F.J. HYDRUS-2D simulations of water movement in a drip irrigation system under soilless substrate. Int. J. Agric. Biol. Eng. 2022, 15, 210–216. [Google Scholar] [CrossRef]
  24. Karandish, F.; Simunek, J. A field-modeling study for assessing temporal variations of soil-water-crop interactions under water-saving irrigation strategies. Agric. Water Manag. 2016, 178, 291–303. [Google Scholar] [CrossRef] [Green Version]
  25. Li, X.Y.; Shi, H.B.; Simunek, J.; Gong, X.W.; Peng, Z.Y. Modeling soil water dynamics in a drip-irrigated intercropping field under plastic mulch. Irrig. Sci. 2015, 33, 289–302. [Google Scholar] [CrossRef] [Green Version]
  26. Bufon, V.B.; Lascano, R.J.; Bednarz, C.; Booker, J.D.; Gitz, D.C. Soil water content on drip irrigated cotton: Comparison of measured and simulated values obtained with the Hydrus 2-D model. Irrig. Sci. 2012, 30, 259–273. [Google Scholar] [CrossRef]
  27. He, Q.; Li, S.; Kang, S.; Yang, H.; Qin, S. Simulation of water balance in a maize field under film-mulching drip irrigation. Agric. Water Manag. 2018, 210, 252–260. [Google Scholar] [CrossRef]
  28. Li, Y.; Simunek, J.; Jing, L.; Zhang, Z.; Ni, L. Evaluation of water movement and water losses in a direct-seeded-rice field experiment using Hydrus-1D. Agric. Water Manag. 2014, 142, 38–46. [Google Scholar] [CrossRef] [Green Version]
  29. Tafteh, A.; Sepaskhah, A.R. Application of HYDRUS-1D model for simulating water and nitrate leaching from continuous and alternate furrow irrigated rapeseed and maize fields. Agric. Water Manag. 2022, 272, 107879. [Google Scholar] [CrossRef]
  30. Simunek, J.; van Genuchten, M.T.; Sejna, M. Recent Developments and Applications of the HYDRUS Computer Software Packages. Vadose Zone J. 2016, 15, 1–25. [Google Scholar] [CrossRef] [Green Version]
  31. van Genuchten, M.T. A Closed-form Equation for Predicting the Hydraulic Conductivity of Unsaturated Soils. Soil Sci. Soc. Am. J. 1980, 44, 892–898. [Google Scholar] [CrossRef] [Green Version]
  32. Mualem, Y. A new model for predicting the hydraulic conductivity of unsaturated porous media. Water Resour. Res. 1976, 12, 513–522. [Google Scholar] [CrossRef] [Green Version]
  33. Han, M.; Zhao, C.; Feng, G.; Yan, Y.; Sheng, Y. Evaluating the Effects of Mulch and Irrigation Amount on Soil Water Distribution and Root Zone Water Balance Using HYDRUS-2D. Water 2015, 7, 2622–2640. [Google Scholar] [CrossRef] [Green Version]
  34. Feddes, R.A.; Kowalik, P.J.; Zaradny, H. Simulation of Field Water Use and Crop Yield; John Wiley & Sons: New York, NY, USA, 1978; Available online: https://lib.ugent.be/catalog/rug01:000032129 (accessed on 5 July 2021).
  35. Wesseling, J.G.; Brandyk, T. Introduction of the Occurrence of High Groundwater Levels and Surface Water Storage in Computer Program SWATRE; Institute for Land and Water Management Research (ICW): Wageningen, UK, 1985; 46p, Available online: https://edepot.wur.nl/214032 (accessed on 12 July 2021).
  36. Gong, X.W.; Liu, H.; Sun, J.S.; Gao, Y.; Zhang, H. Comparison of Shuttleworth-Wallace model and dual crop coefficient method for estimating evapotranspiration of tomato cultivated in a solar greenhouse. Agric. Water Manag. 2019, 217, 141–153. [Google Scholar] [CrossRef]
  37. Allen, R.G.; Pereira, L.S.; Raes, D.; Smith, M. Crop Evapotranspiration–Guidelines for Computing Crop Water Requirements–FAO Irrigation and Drainage Paper 56; Food and Agriculture Organization of the United Nations: Rome, Italy, 1998; Available online: https://www.fao.org/3/X0490E/x0490e00.htm (accessed on 25 May 2021).
  38. Muller, T.; Bouleau, C.R.; Perona, P. Optimizing drip irrigation for eggplant crops in semi-arid zones using evolving thresholds. Agric. Water Manag. 2016, 177, 54–65. [Google Scholar] [CrossRef] [Green Version]
  39. Wang, J.W.; Du, Y.D.; Niu, W.Q.; Han, J.X.; Li, Y.; Yang, P.G. Drip irrigation mode affects tomato yield by regulating root-soil-microbe interactions. Agric. Water Manag. 2022, 260, 107188. [Google Scholar] [CrossRef]
  40. Li, X.Y.; Simunek, J.; Shi, H.B.; Yan, J.W.; Peng, Z.Y.; Gong, X.W. Spatial distribution of soil water, soil temperature, and plant roots in a drip-irrigated intercropping field with plastic mulch. Eur. J. Agron. 2017, 83, 47–56. [Google Scholar] [CrossRef] [Green Version]
  41. Shan, G.L.; Sun, Y.R.; Zhou, H.Y.; Lammers, P.S.; Grantz, D.A.; Xue, X.Z.; Wang, Z.Y. A horizontal mobile dielectric sensor to assess dynamic soil water content and flows: Direct measurements under drip irrigation compared with HYDRUS-2D model simulation. Biosyst. Eng. 2019, 179, 13–21. [Google Scholar] [CrossRef]
  42. Peddinti, S.R.; Kambhammettu, B.; Lad, R.S.; Simunek, J.; Gade, R.M.; Adinarayana, J. A macroscopic soil-water transport model to simulate root water uptake in the presence of water and disease stress. J. Hydrol. 2020, 587, 124940. [Google Scholar] [CrossRef]
  43. Ge, J.K.; Gong, X.W.; Liu, Y.F.; Chen, H.R.; Sun, H.W.; Traore, S.; Zhang, L. The potential effects of drip irrigation on soil environment, root distribution and yield of greenhouse tomato. Eur. J. Hortic. Sci. 2022, 87, 11. [Google Scholar] [CrossRef]
  44. Shabbir, A.; Mao, H.P.; Ullah, I.; Buttar, N.A.; Ajmal, M.; Solangi, K.A. Improving Water Use Efficiency by Optimizing the Root Distribution Patterns under Varying Drip Emitter Density and Drought Stress for Cherry Tomato. Agronomy 2021, 11, 3. [Google Scholar] [CrossRef]
  45. Li, Z.Y.; Zong, R.; Wang, T.Y.; Wang, Z.H.; Zhang, J.Z. Adapting Root Distribution and Improving Water Use Efficiency via Drip Irrigation in a Jujube (Zizyphus jujube Mill.) Orchard after Long-Term Flood Irrigation. Agriculture 2021, 11, 1184. [Google Scholar] [CrossRef]
  46. Deb, S.K.; Shukla, M.K.; Mexal, J.G. Numerical Modeling of Water Fluxes in the Root Zone of a Mature Pecan Orchard. Soil Sci. Soc. Am. J. 2011, 75, 1667–1680. [Google Scholar] [CrossRef]
  47. Malash, N.M.; Flowers, T.J.; Ragab, R. Plant Water Relations Growth and Productivity of Tomato Irrigated by Different Methods with Saline and Non-Saline Water. Irrig. Drain. 2011, 60, 446–453. [Google Scholar] [CrossRef]
  48. Cheviron, B.; Coquet, Y. Sensitivity Analysis of Transient-MIM HYDRUS-1D: Case Study Related to Pesticide Fate in Soils. Vadose Zone J. 2009, 8, 1064–1079. [Google Scholar] [CrossRef]
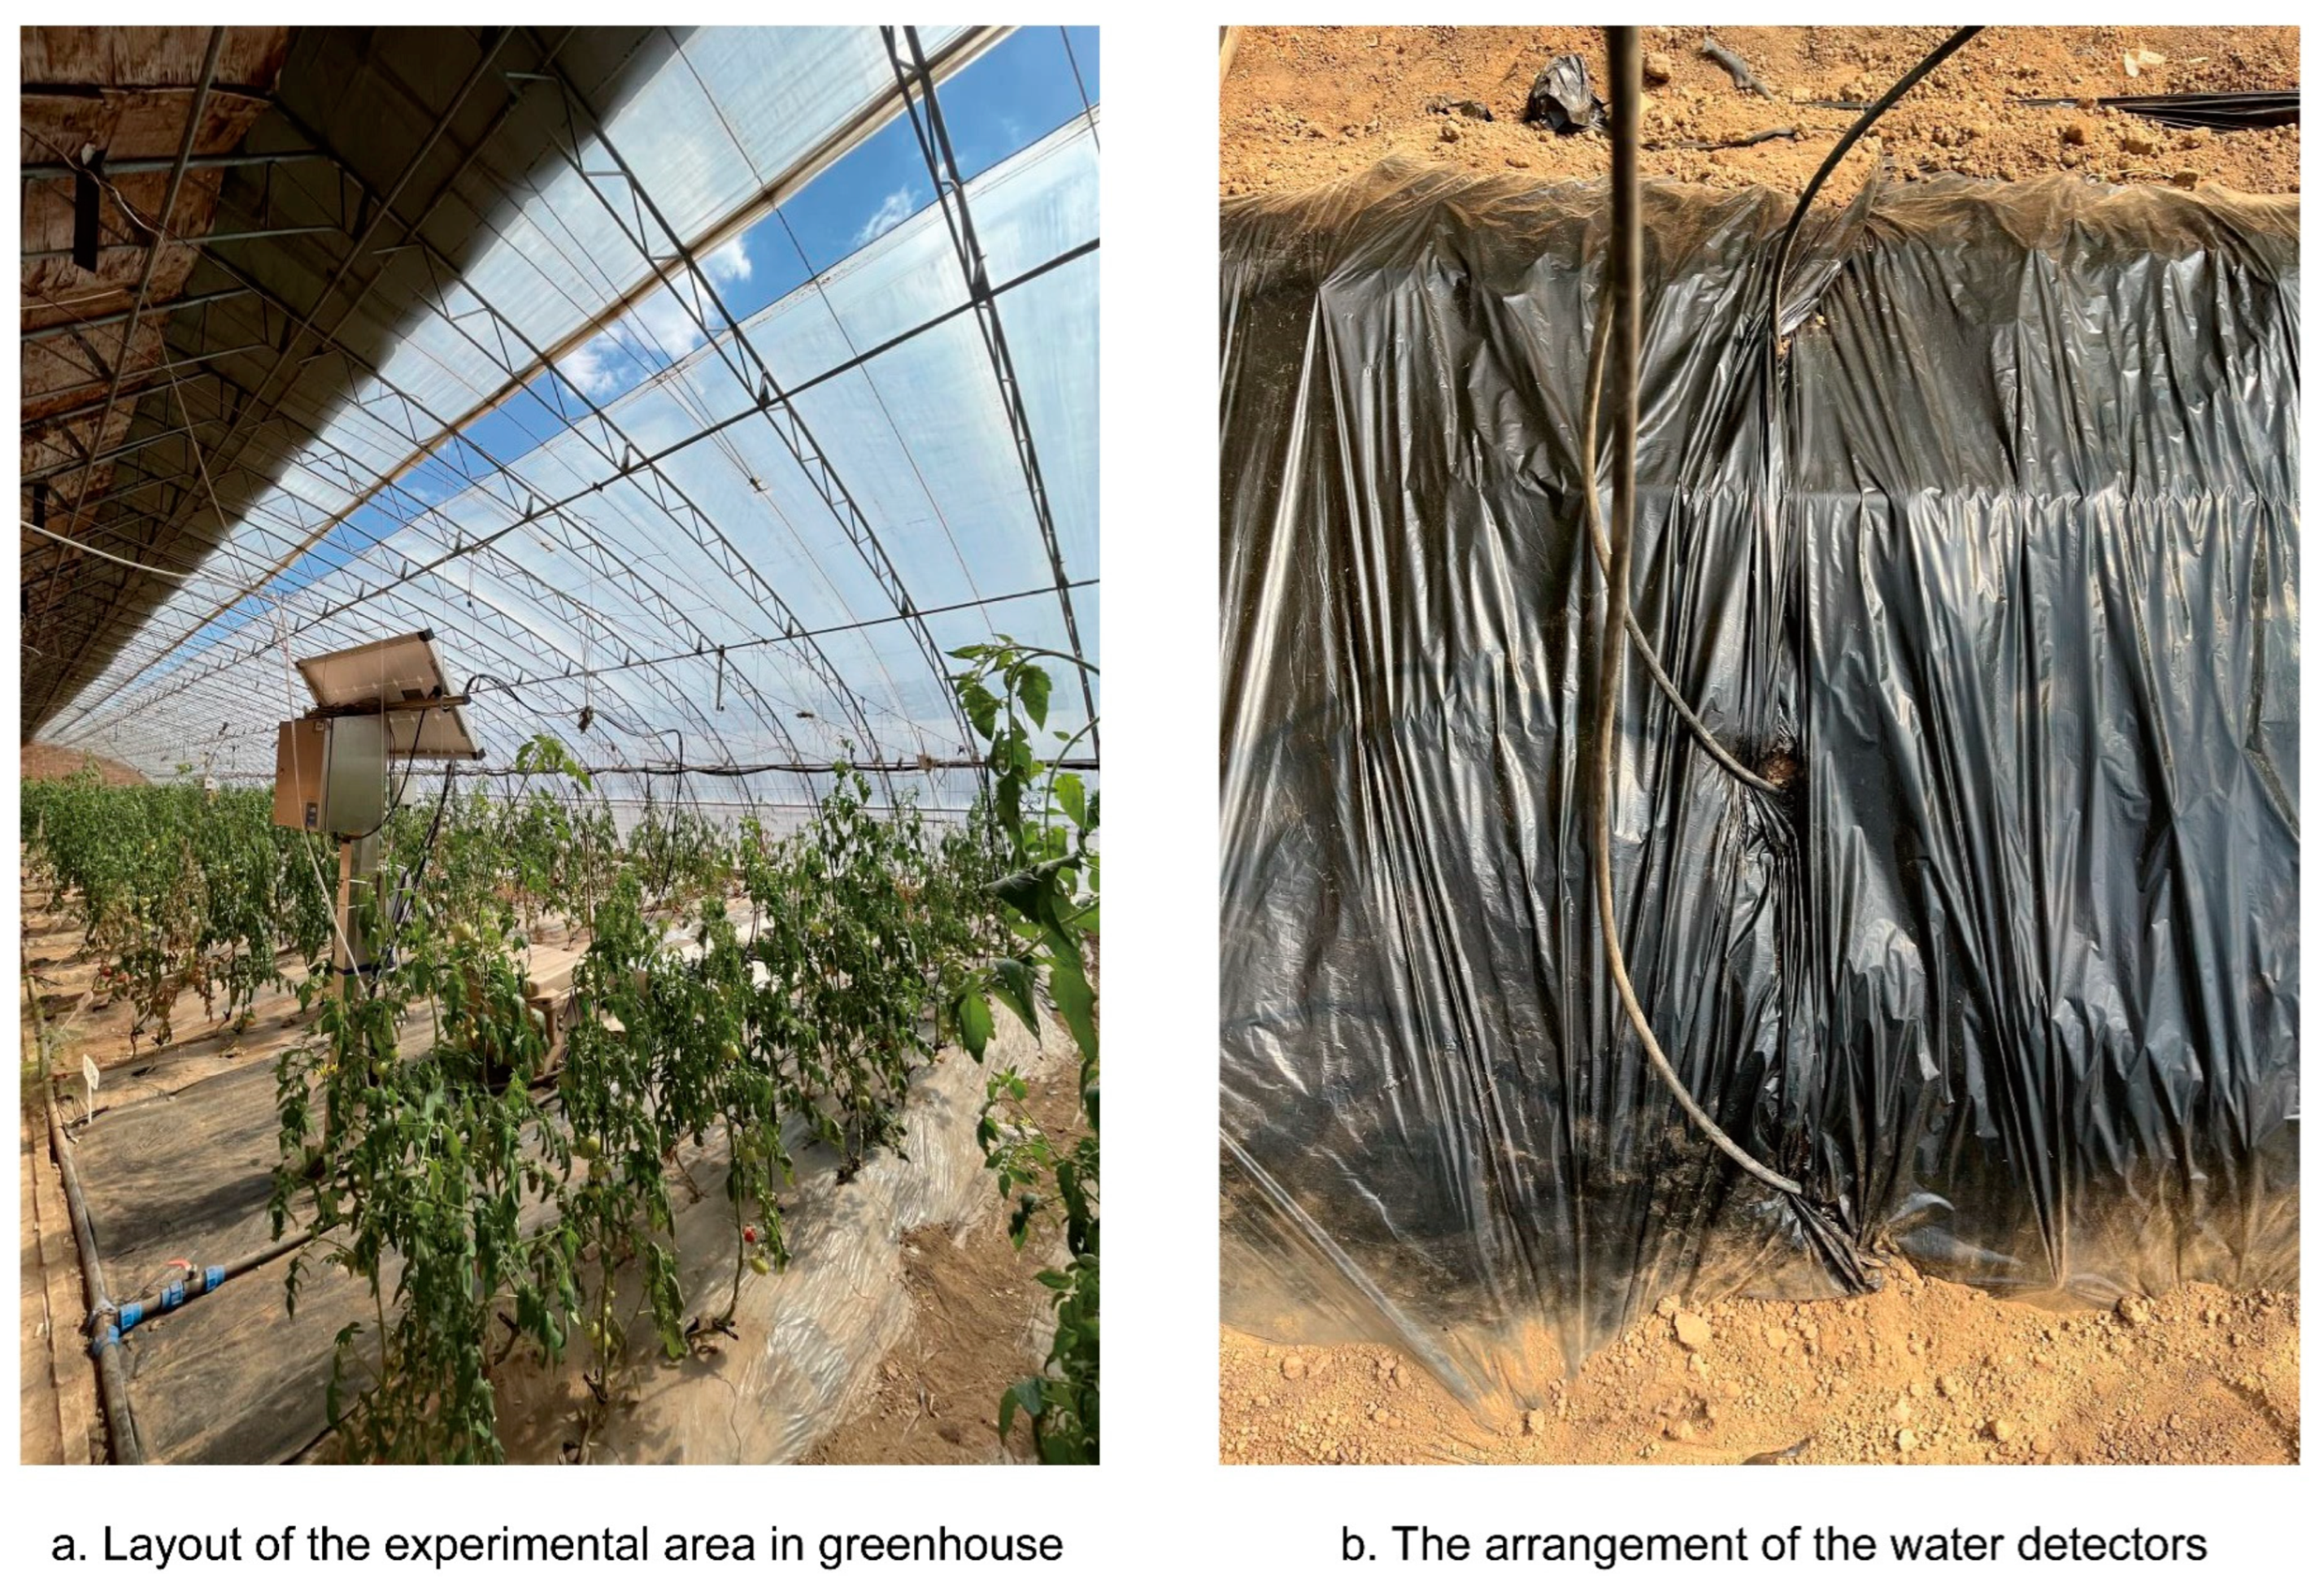
Figure 1. The arrangement of the experimental area in the greenhouse.
Water 15 01282 g001
Figure 2. Arrangement of observation points and setting of boundary conditions in HYDRUS-2D.
Water 15 01282 g002
Figure 3. Coefficient of determination (R2) between simulated and measured soil water content (cm3·cm−3) under different water treatments, in 2020 and 2021.
Water 15 01282 g003
Figure 4. Soil water content (cm3·cm−3) of 20 cm, 40 cm, and 60 cm soil layer under different treatments, in 2020 and 2021.
Water 15 01282 g004
Figure 5. Soil water movement (cm) at 1 h, 5 h, 12 h, and 24 h after irrigation began under different water treatments, in blooming and setting stage.
Water 15 01282 g005
Figure 6. Root density (cm3·cm−3) of tomatoes in the 0–60 cm soil layer under different water treatments, in 2020 and 2021.
Water 15 01282 g006
Figure 7. Water absorption of tomato roots (cm3·cm−3) in the 0–60 cm soil layer under different water treatments in blooming and setting stage and fruiting stage, in 2020.
Water 15 01282 g007
Figure 8. Distribution of soil water content (cm3·cm−3) on the day before three irrigations under different water treatments, in 2020.
Water 15 01282 g008
Table 1. Statistical indicators to evaluate the accuracy of the HYDRUS-2D model in the estimation of soil water content (cm3·cm−3) under different water treatments.
YearMoisture TreatmentR2MRE (cm3·cm−3)RMSE (cm3·cm−3)
2020W10.860.12600.0230
W20.790.10400.0270
W30.890.06200.0140
2021W10.870.08400.0170
W20.890.07900.0160
W30.920.08200.0160
Notes: MRE represents the mean relative error, R2 represents the determination coefficient and RMSE represents the root mean square error.
Table 2. Soil hydraulic parameters of different soil layers.
IndexSoil Layer (cm)
0–2020–4040–60
Residual soil moisture
(cm3·cm−3)
0.090.080.07
Saturated soil moisture
(cm3·cm−3)
0.420.400.38
Shape parameter
(cm−1)
0.00700.00700.0050
Parameter n1.681.481.48
Saturated hydraulic conductivity
(cm·d−1)
10.451.431.20
l0.500.500.50
Table 3. Rating of parameter sensitivity.
LevelThe Range of Ai ValueSensitivity Characterization
≥1Highly sensitive
II[0.2, 1)Sensitive
III[0.05, 0.2)Moderate sensitivity
IV[0, 0.05)Insensitive
Note: Ai represents sensitivity coefficient.
Table 4. Sensitivity analysis of parameters α, n and Ks to water content of 20 cm, 40 cm, and 60 cm soil layer.
Independent VariableSensitivity Coefficient
θ 20cm θ 40cm θ 60cm
α1−0.0980.0410.058
n1−0.918 *0.1280.233 *
KS1−0.033−0.0430.022
α20.114−0.255 *−0.058
n20.098−1.404 *0.291 *
KS2−0.033−0.0430.012
α30.066 0.128−0.116
n30.0330.128−1.279 *
KS3−0.033−0.085−0.116
Notes: * indicate that the absolute value of sensitivity coefficient is greater than 0.2. θ20cm represents the average sensitivity coefficient of water content in the 20 cm soil layer to different independent variable, and the others are the same. Ai > 0 indicates that the independent variable corresponds to a positive influence, and vice versa, an inverse influence.
Disclaimer/Publisher’s Note: The statements, opinions and data contained in all publications are solely those of the individual author(s) and contributor(s) and not of MDPI and/or the editor(s). MDPI and/or the editor(s) disclaim responsibility for any injury to people or property resulting from any ideas, methods, instructions or products referred to in the content.