


Assessment of the Breaching Event, Breach Parameters and Failure Mechanisms of the Spillway Collapse in the Swa Dam, Myanmar


Abstract
:1. Introduction
2. Materials and Methods
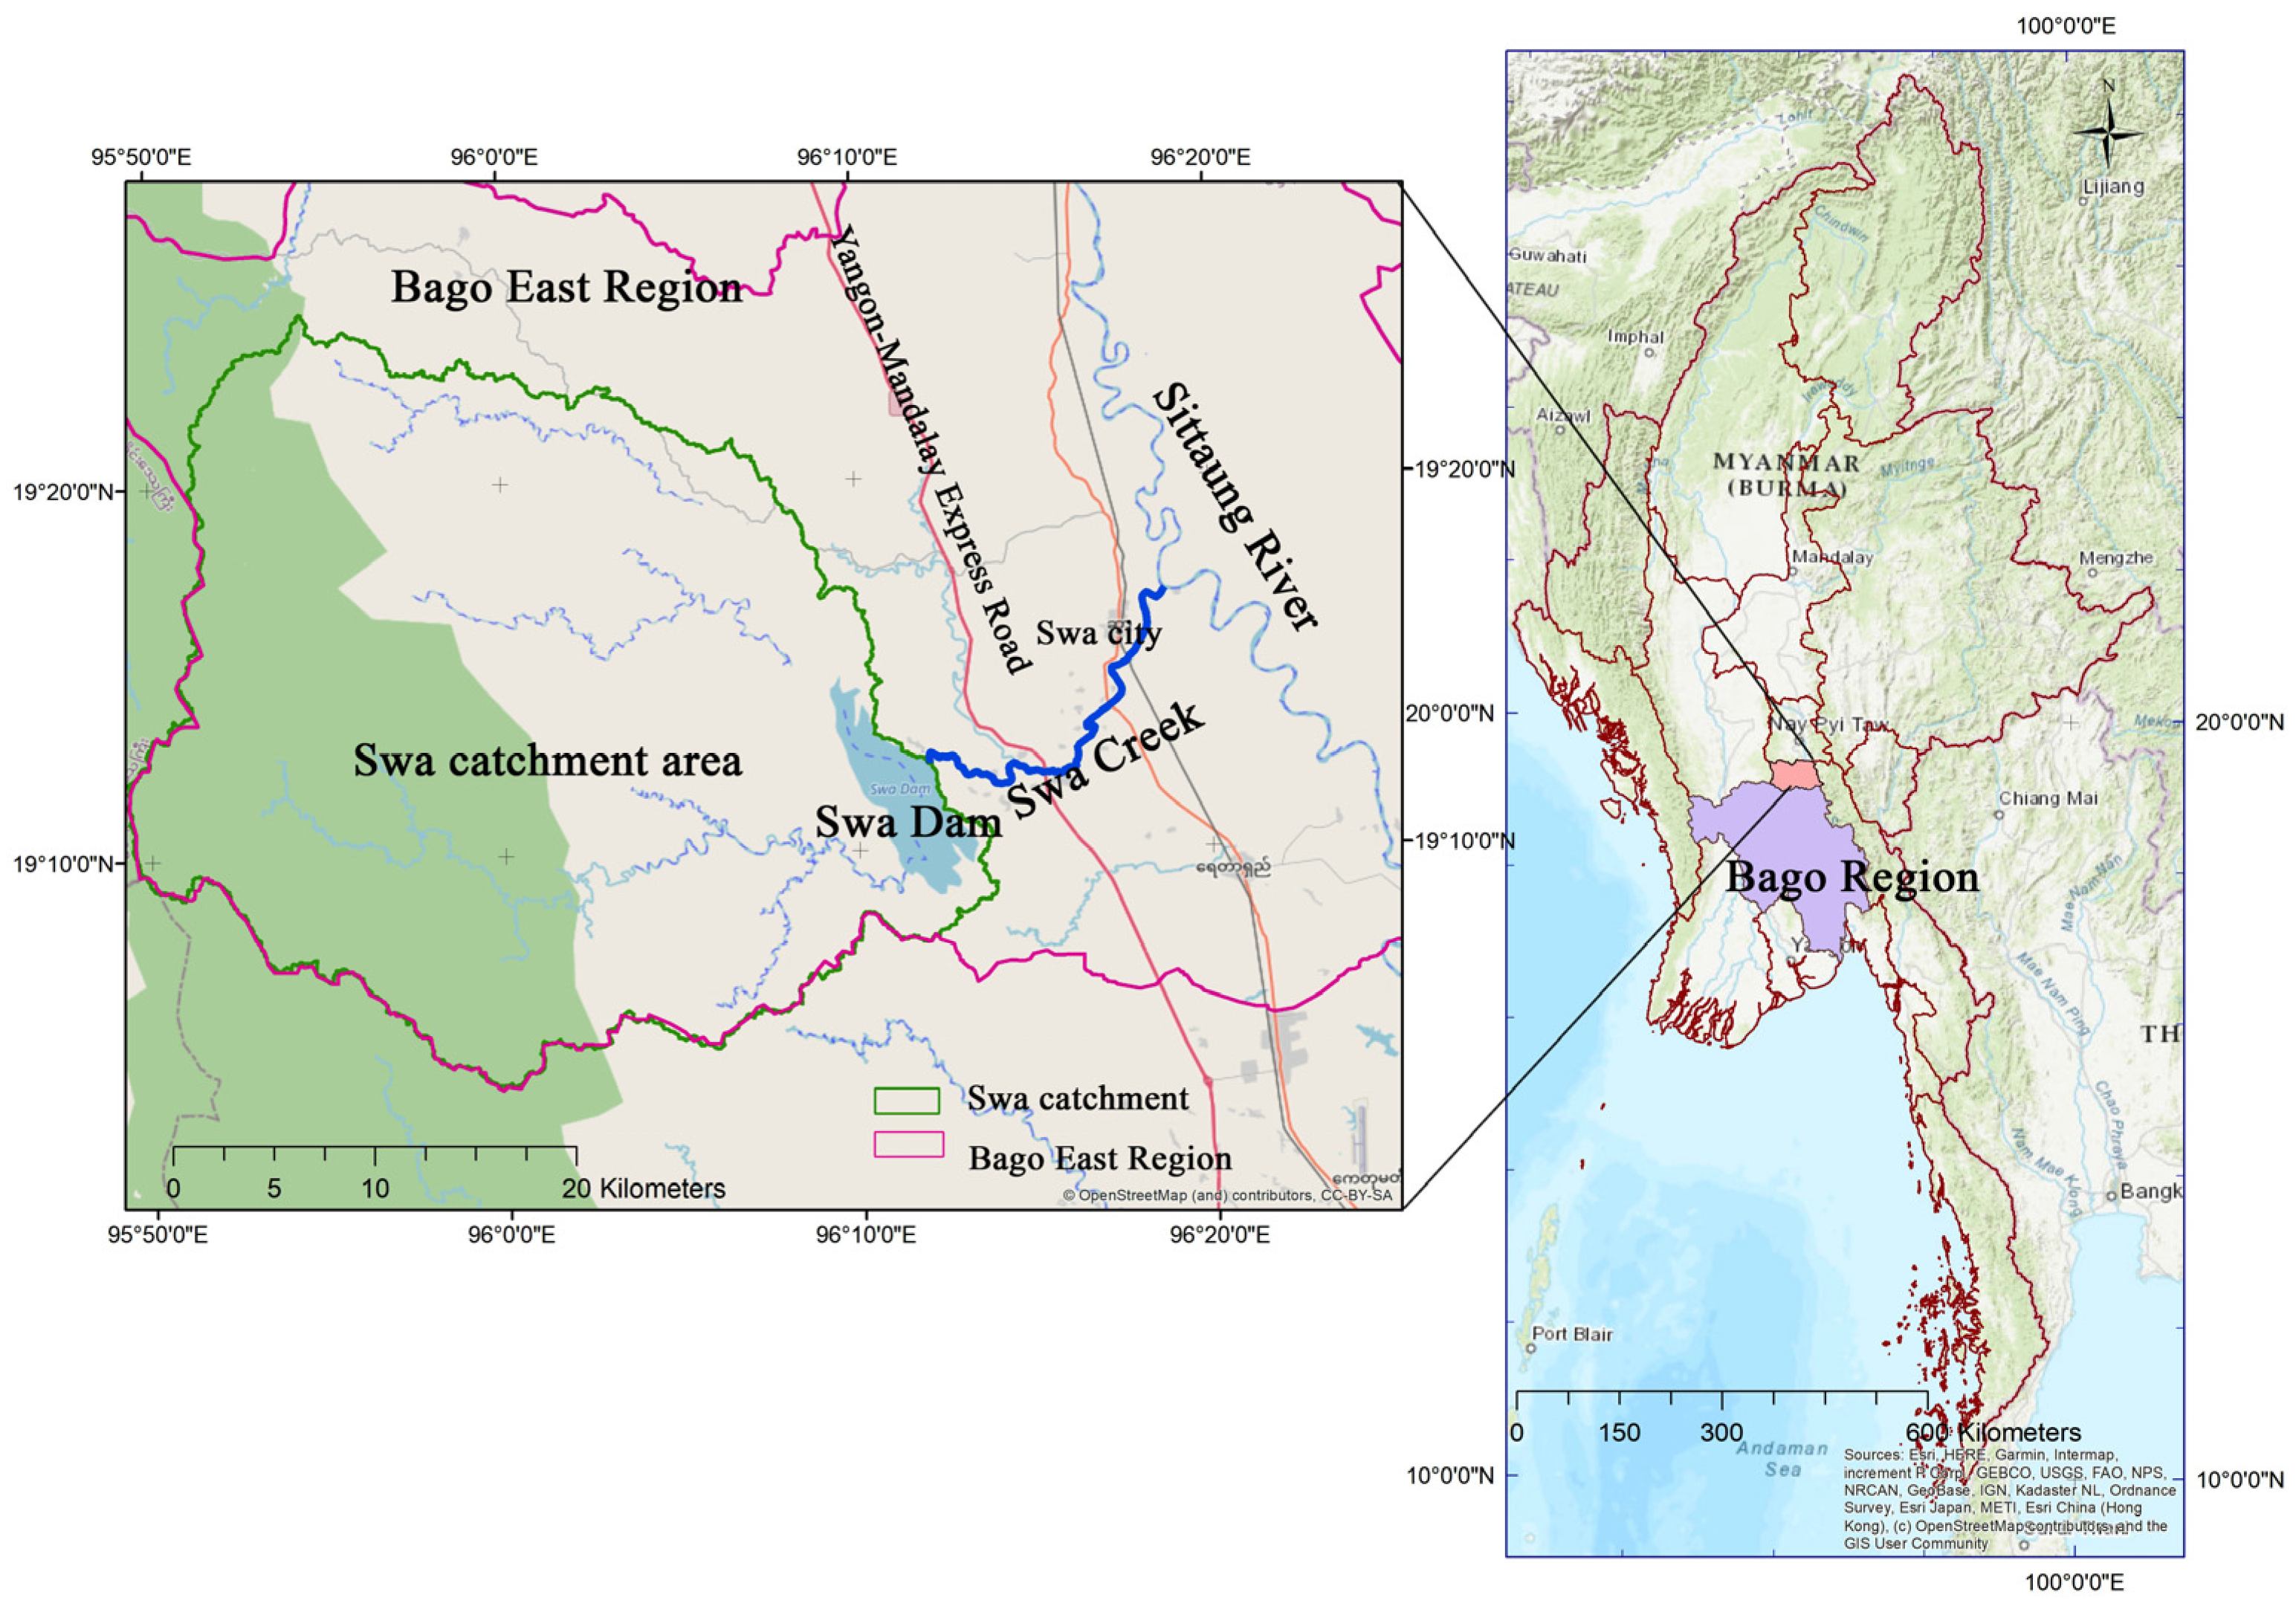
2.1. Study Area
2.2. Meteorological and Hydrological Conditions of the Study Site
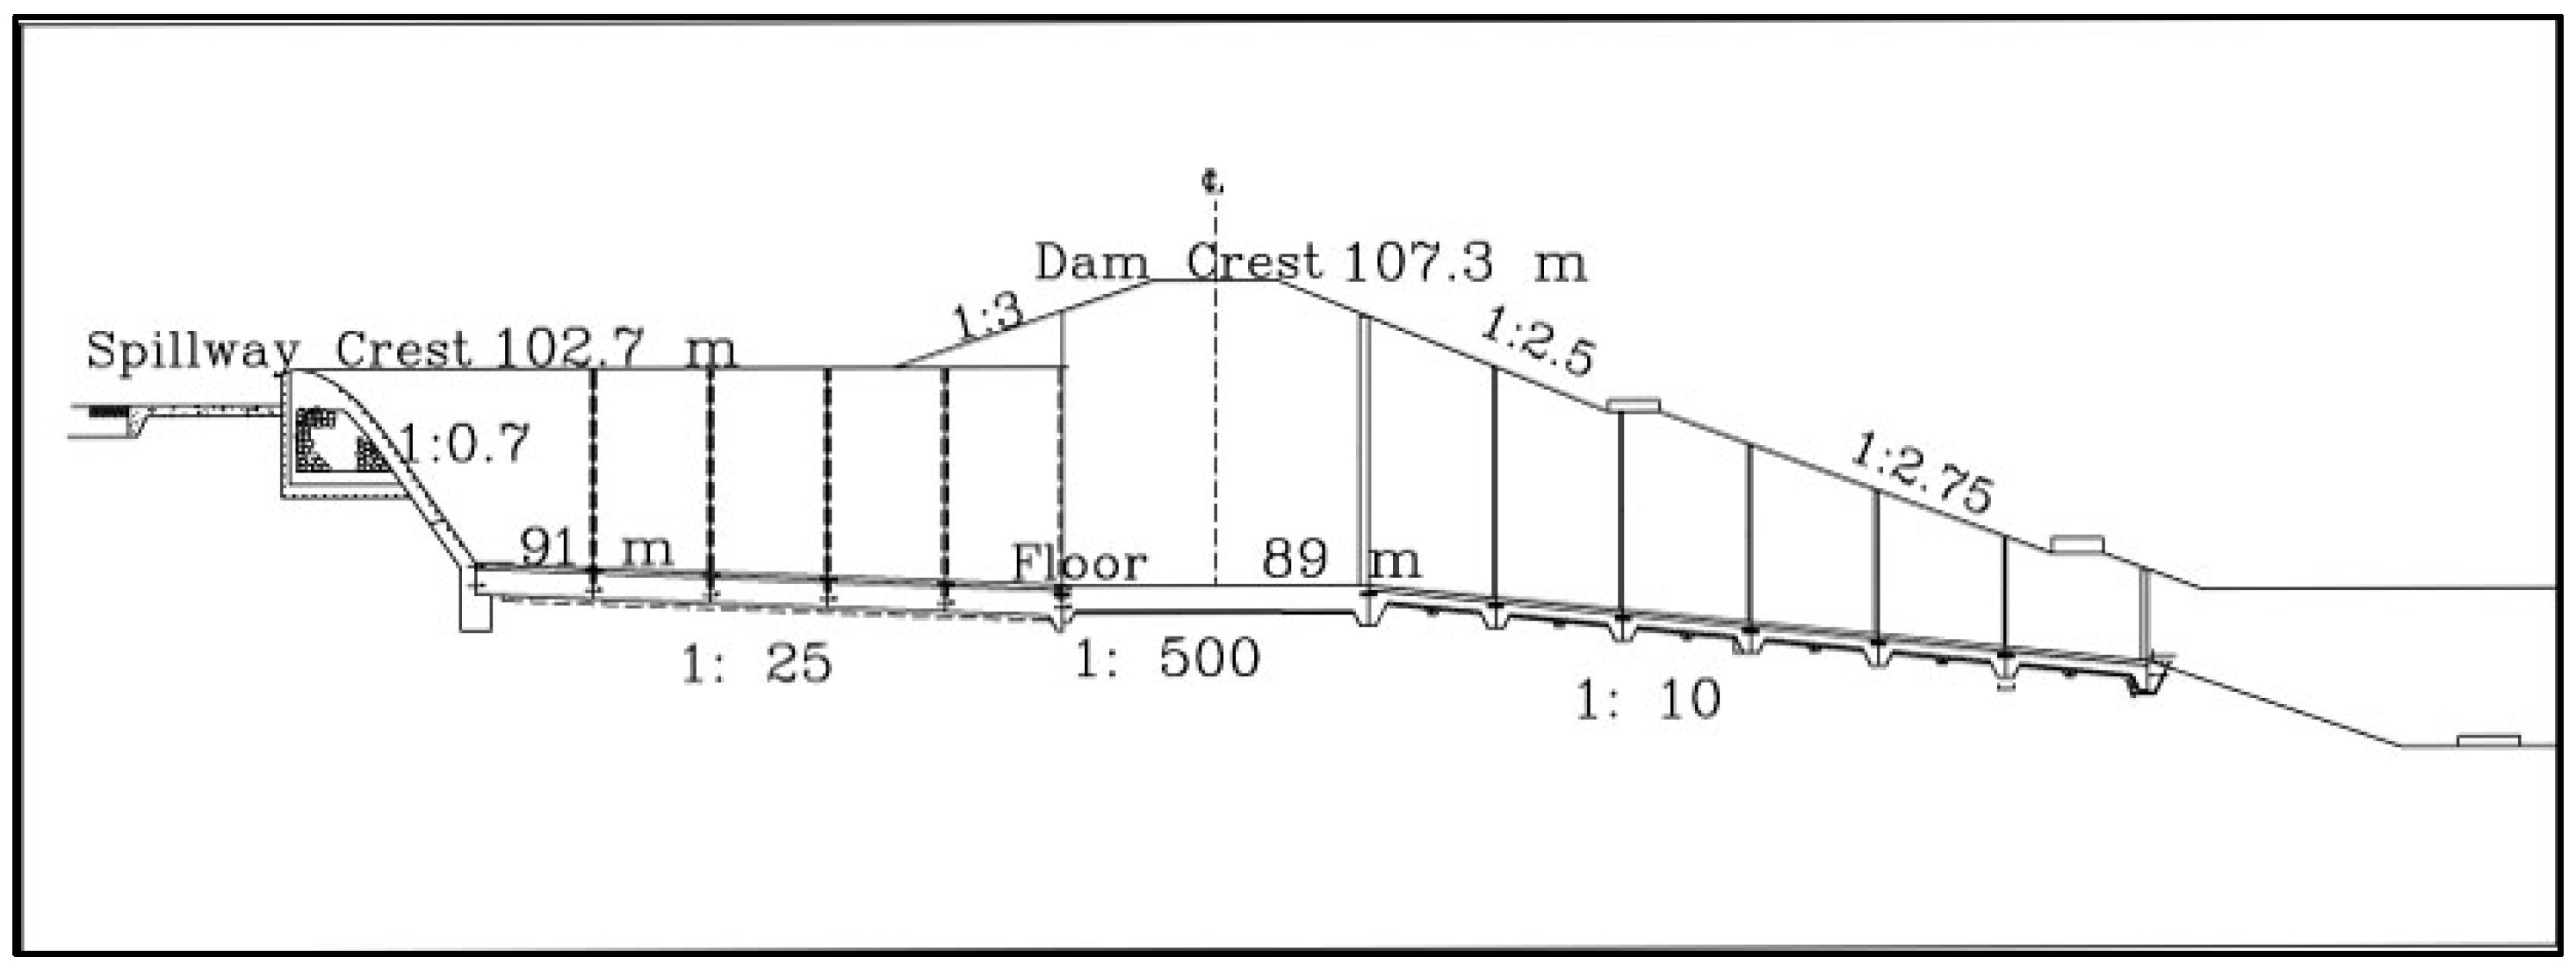
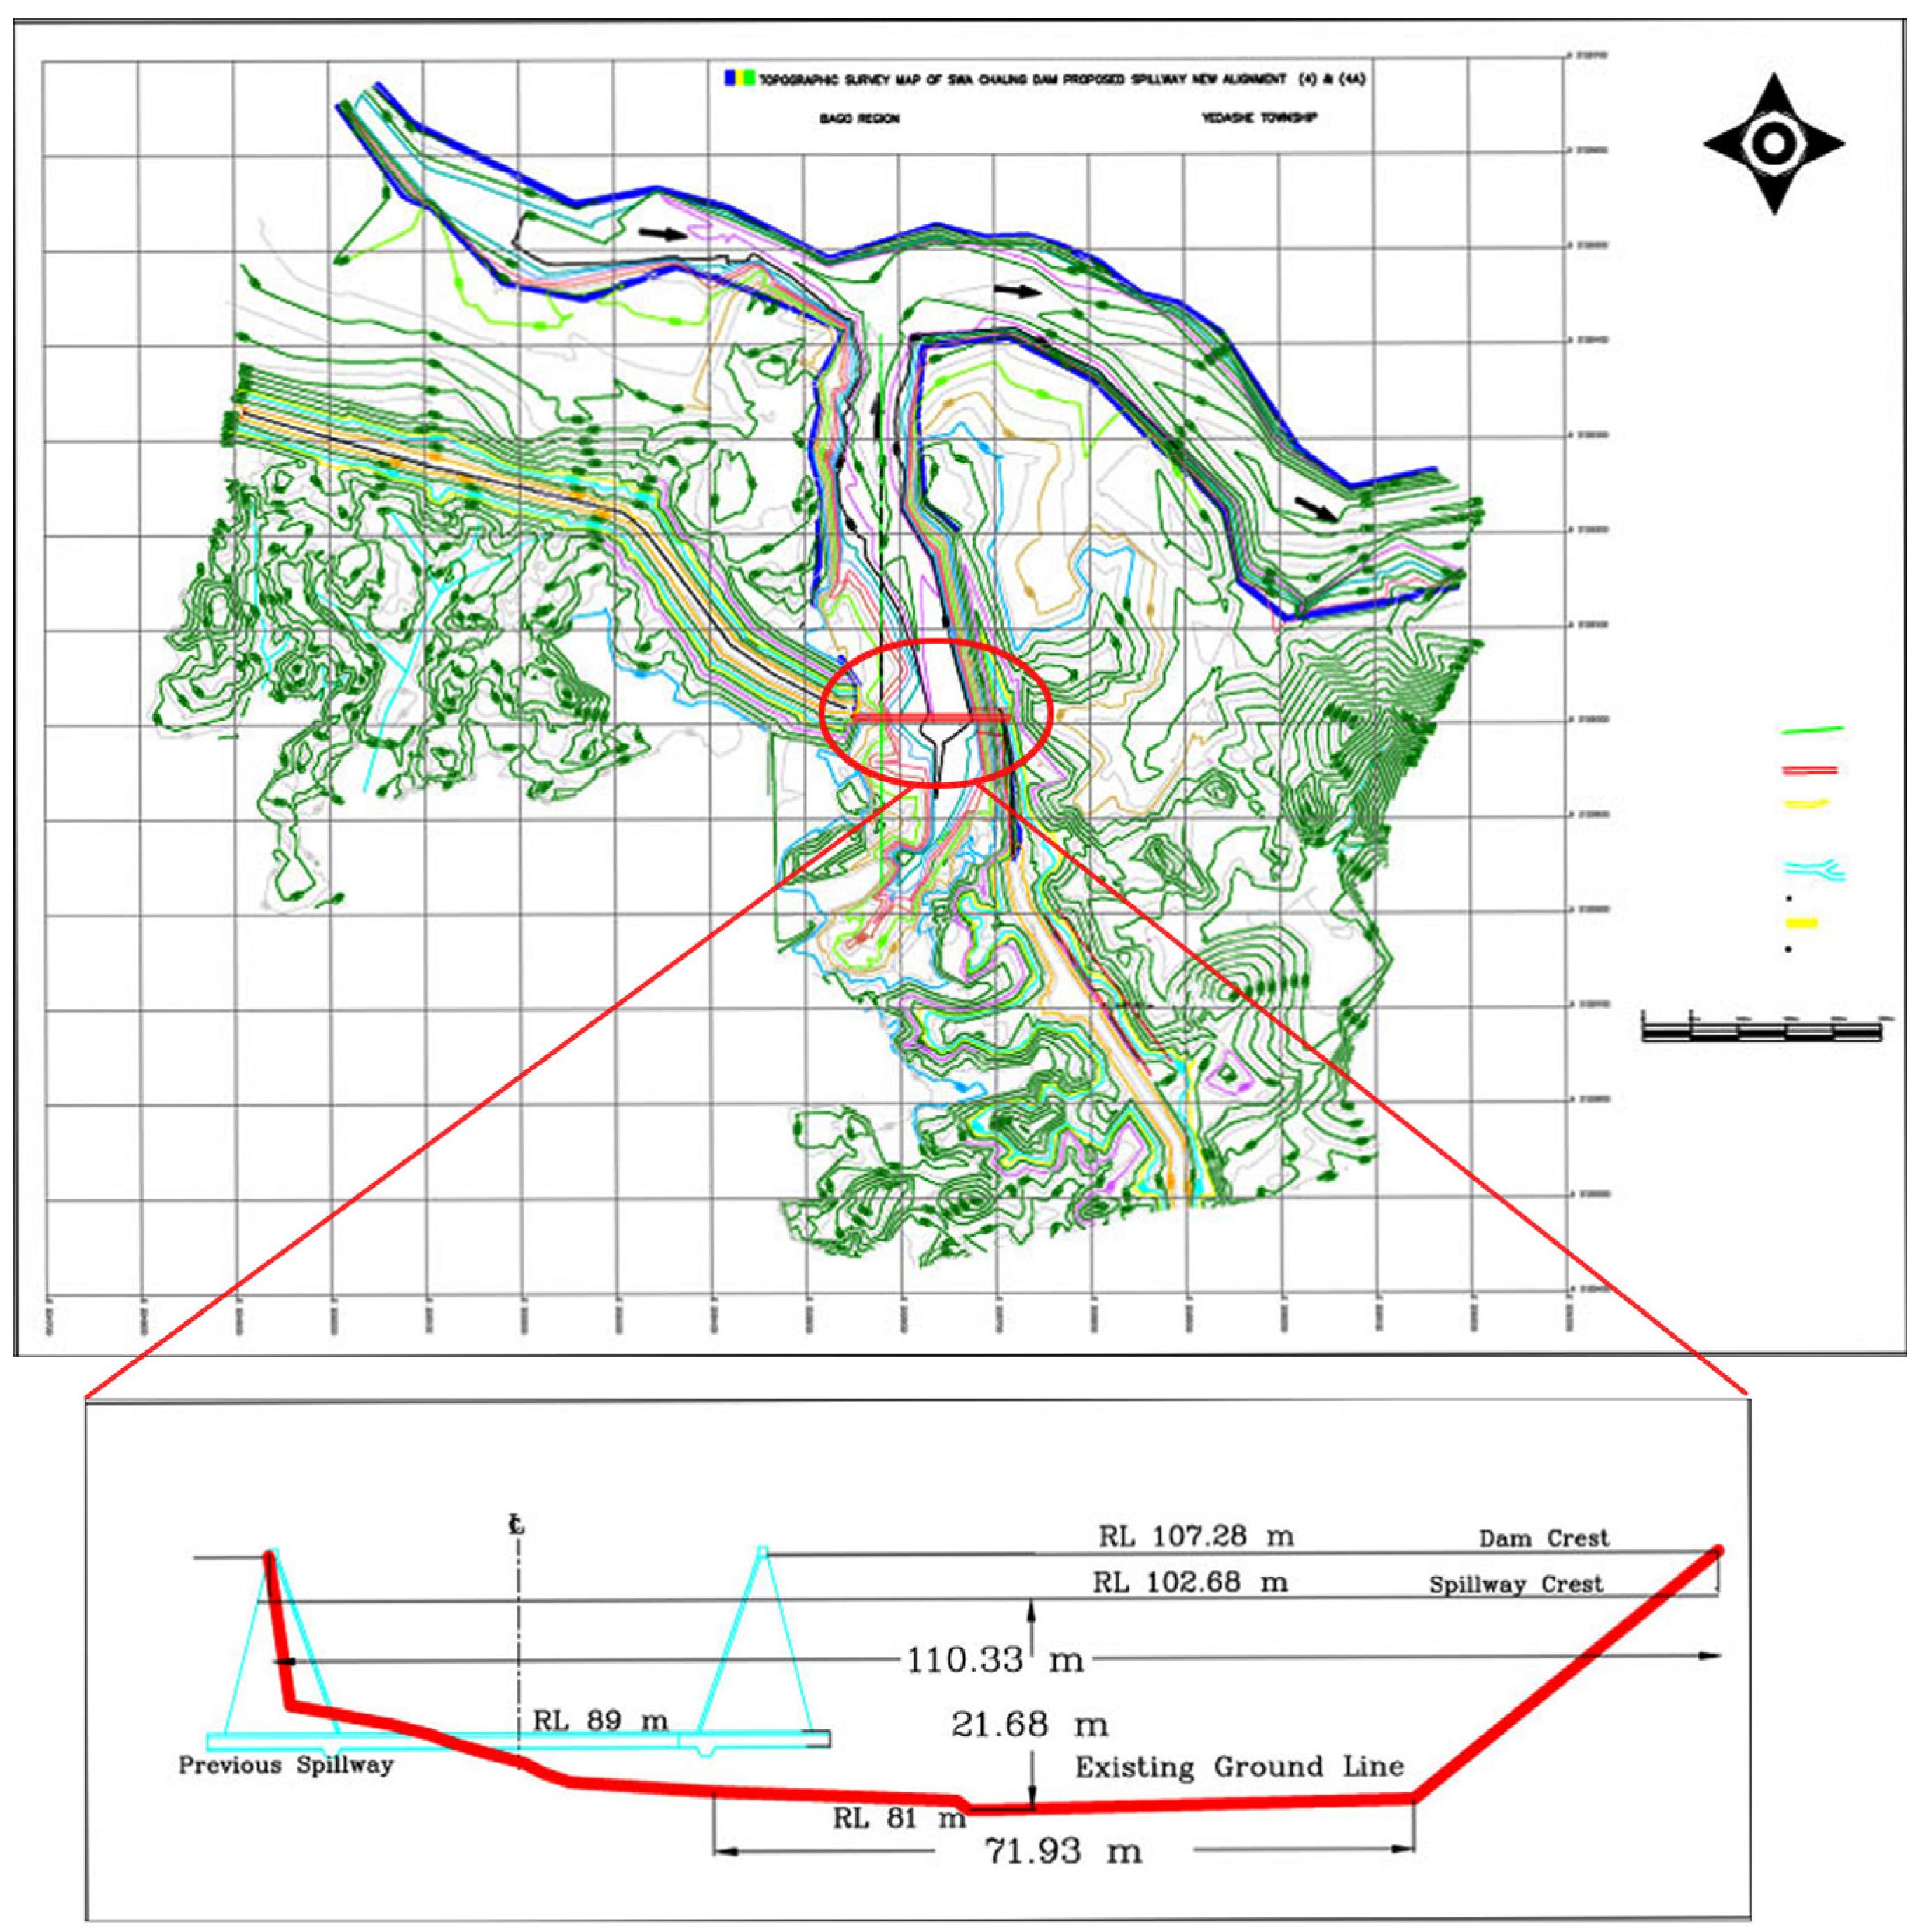
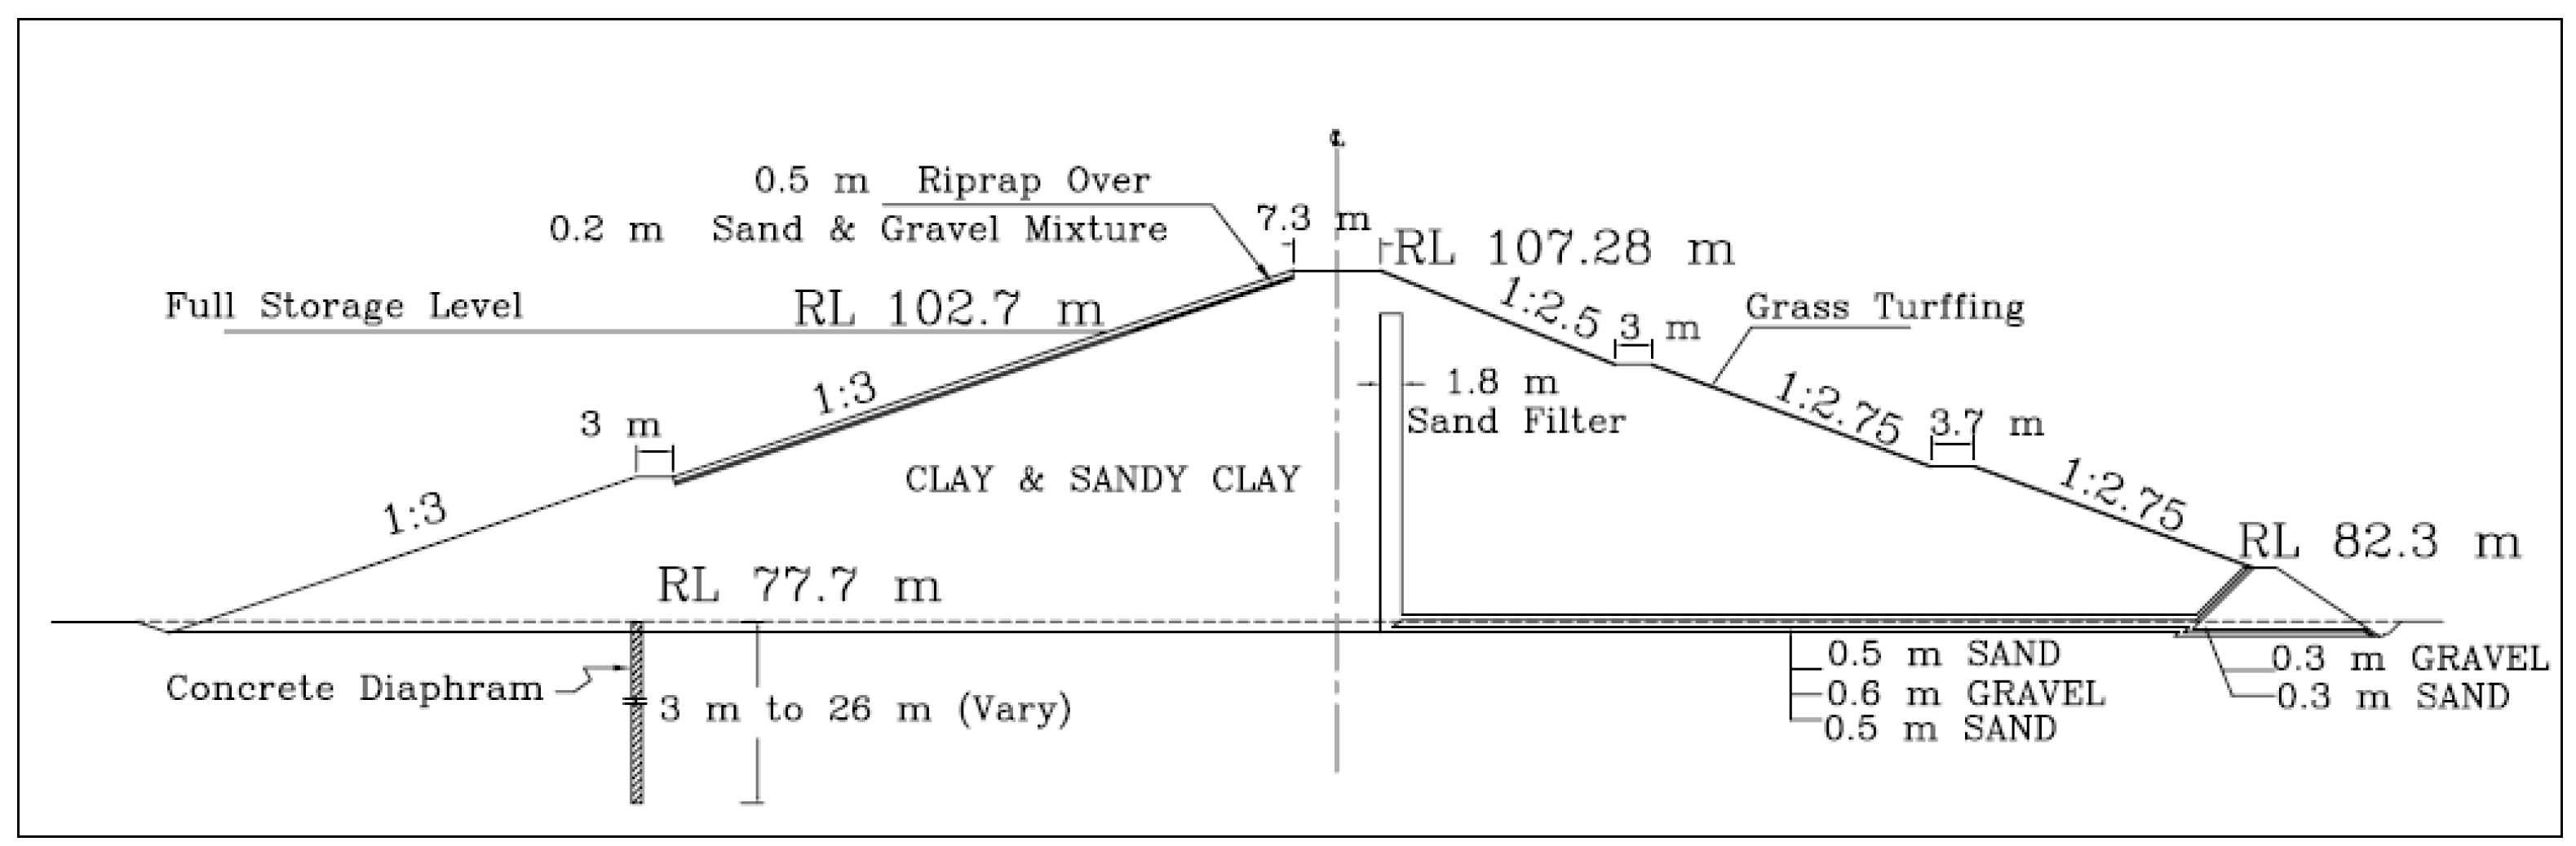
2.3. Swa Dam
2.4. Spillway Description
2.5. Breach Event Description
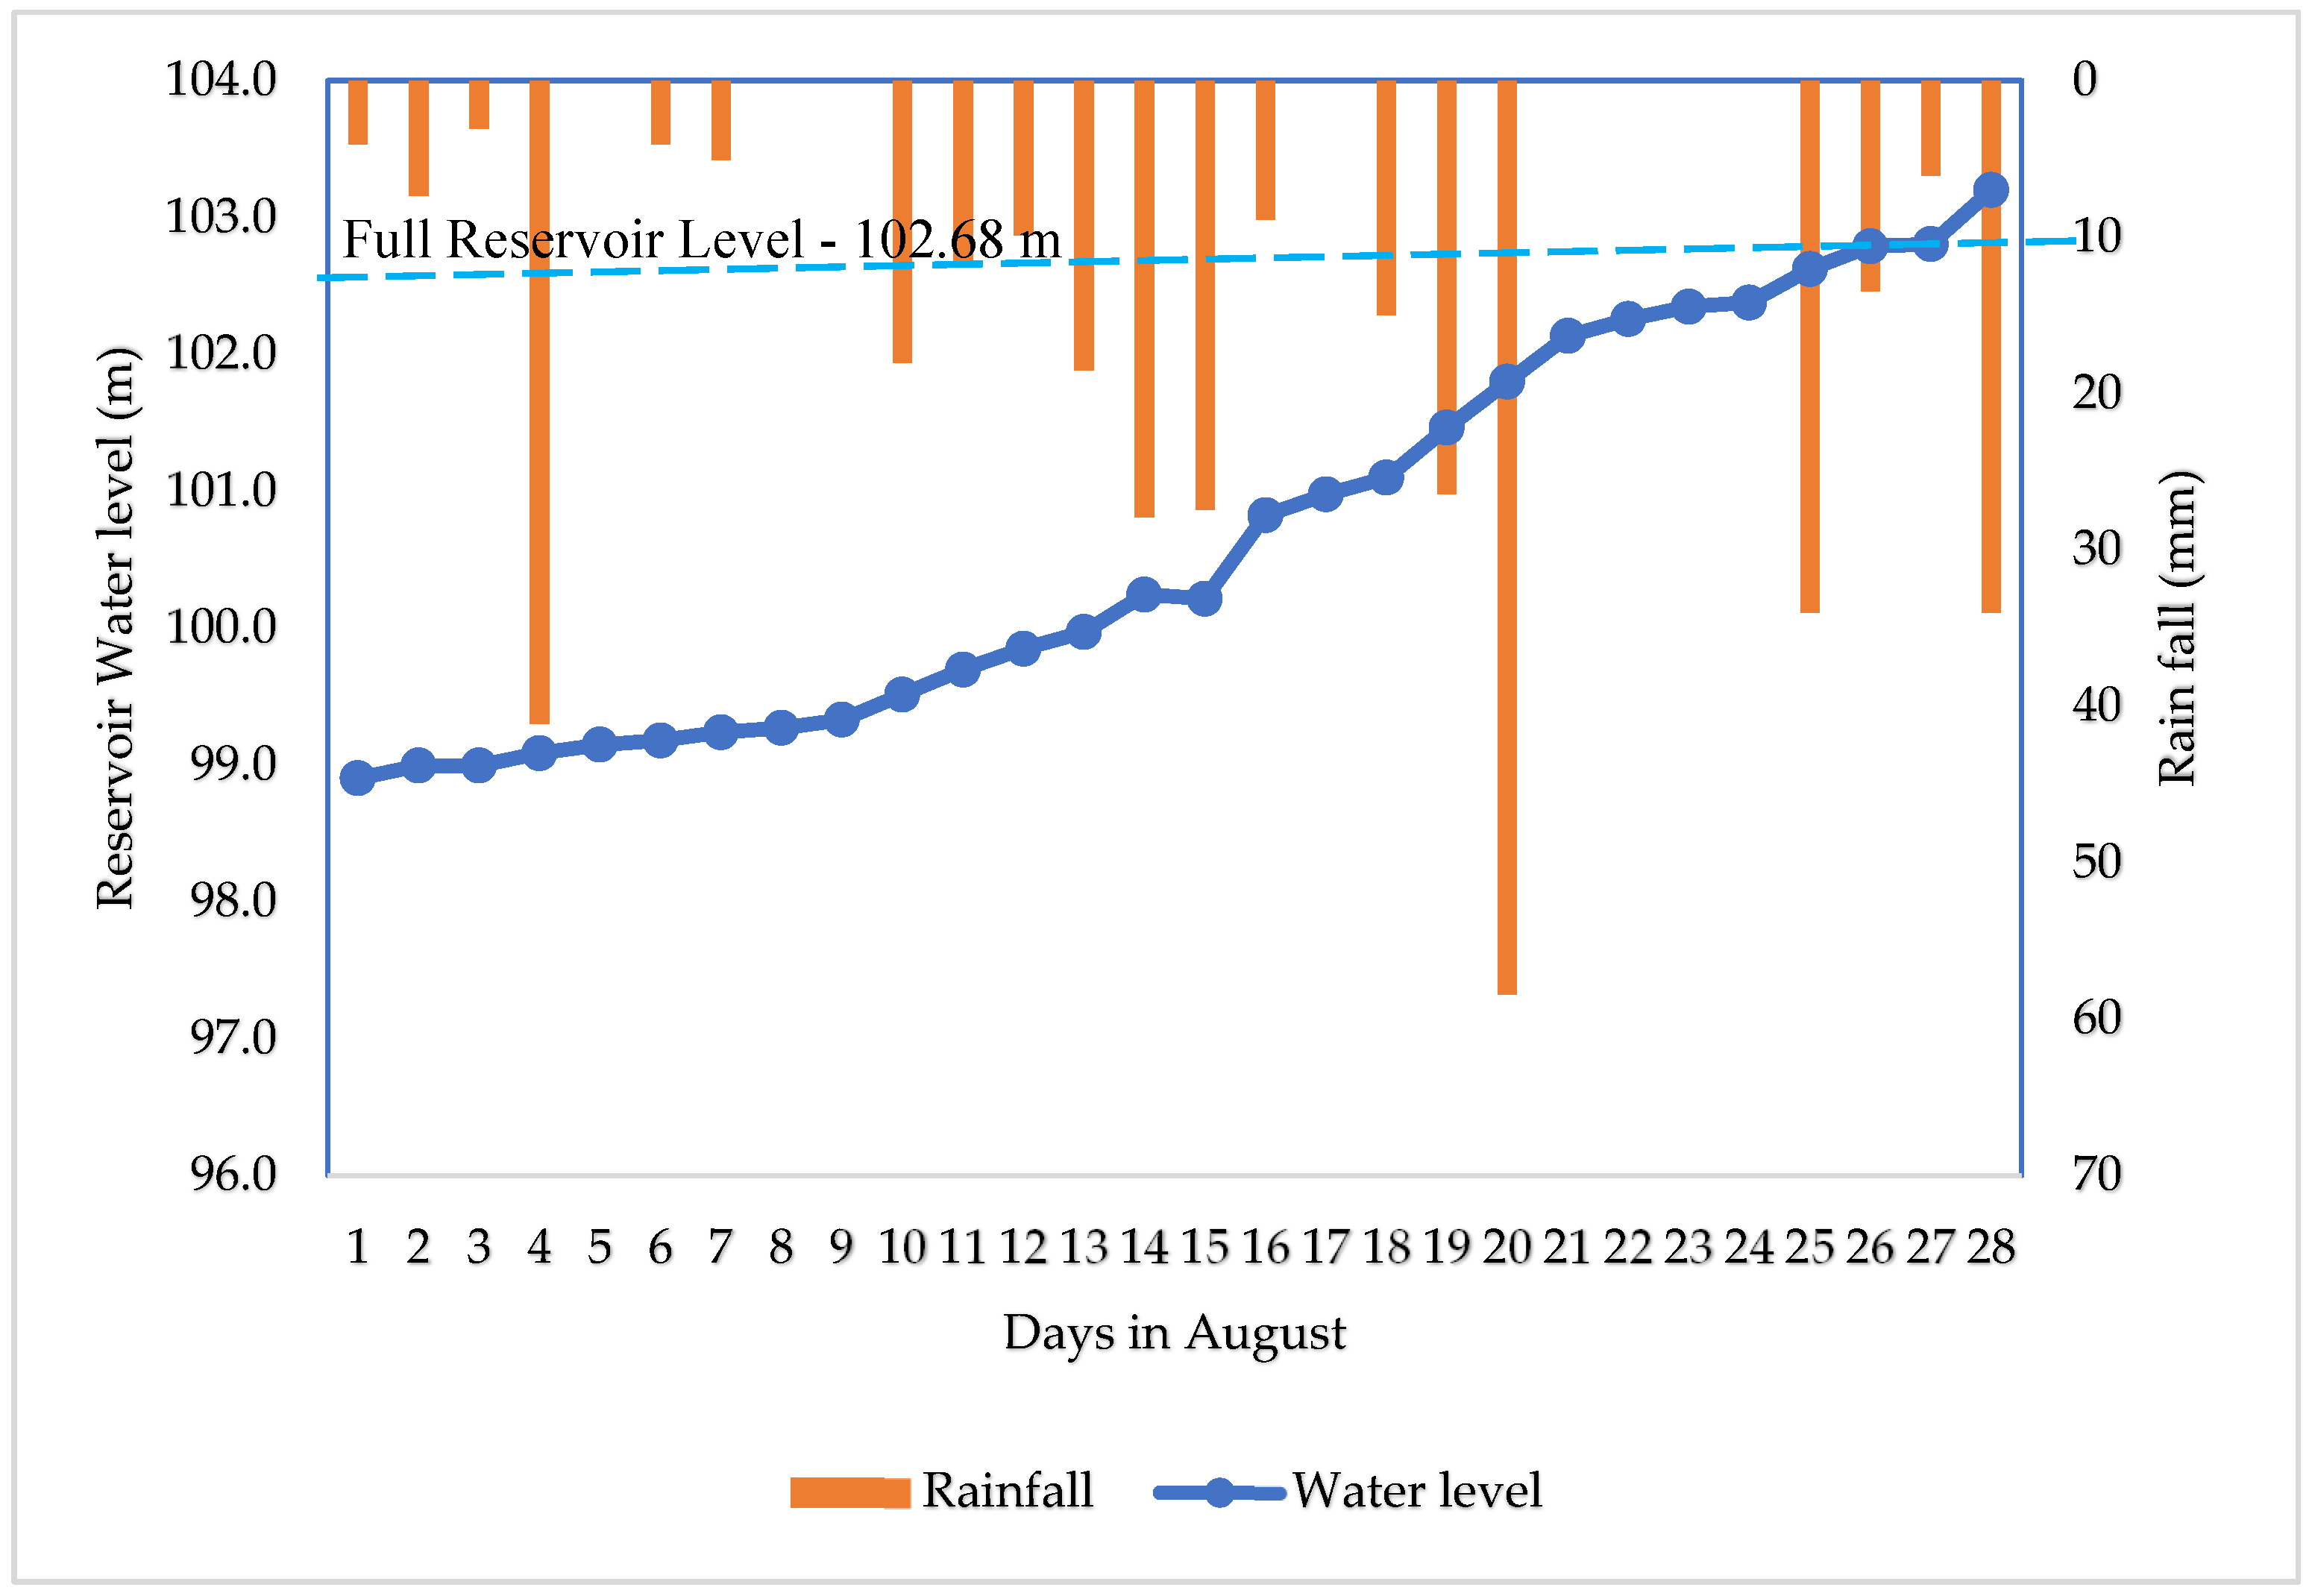
2.5.1. Hydrological Conditions before the Breach Event
2.5.2. Failure Event and Consequences Downstream
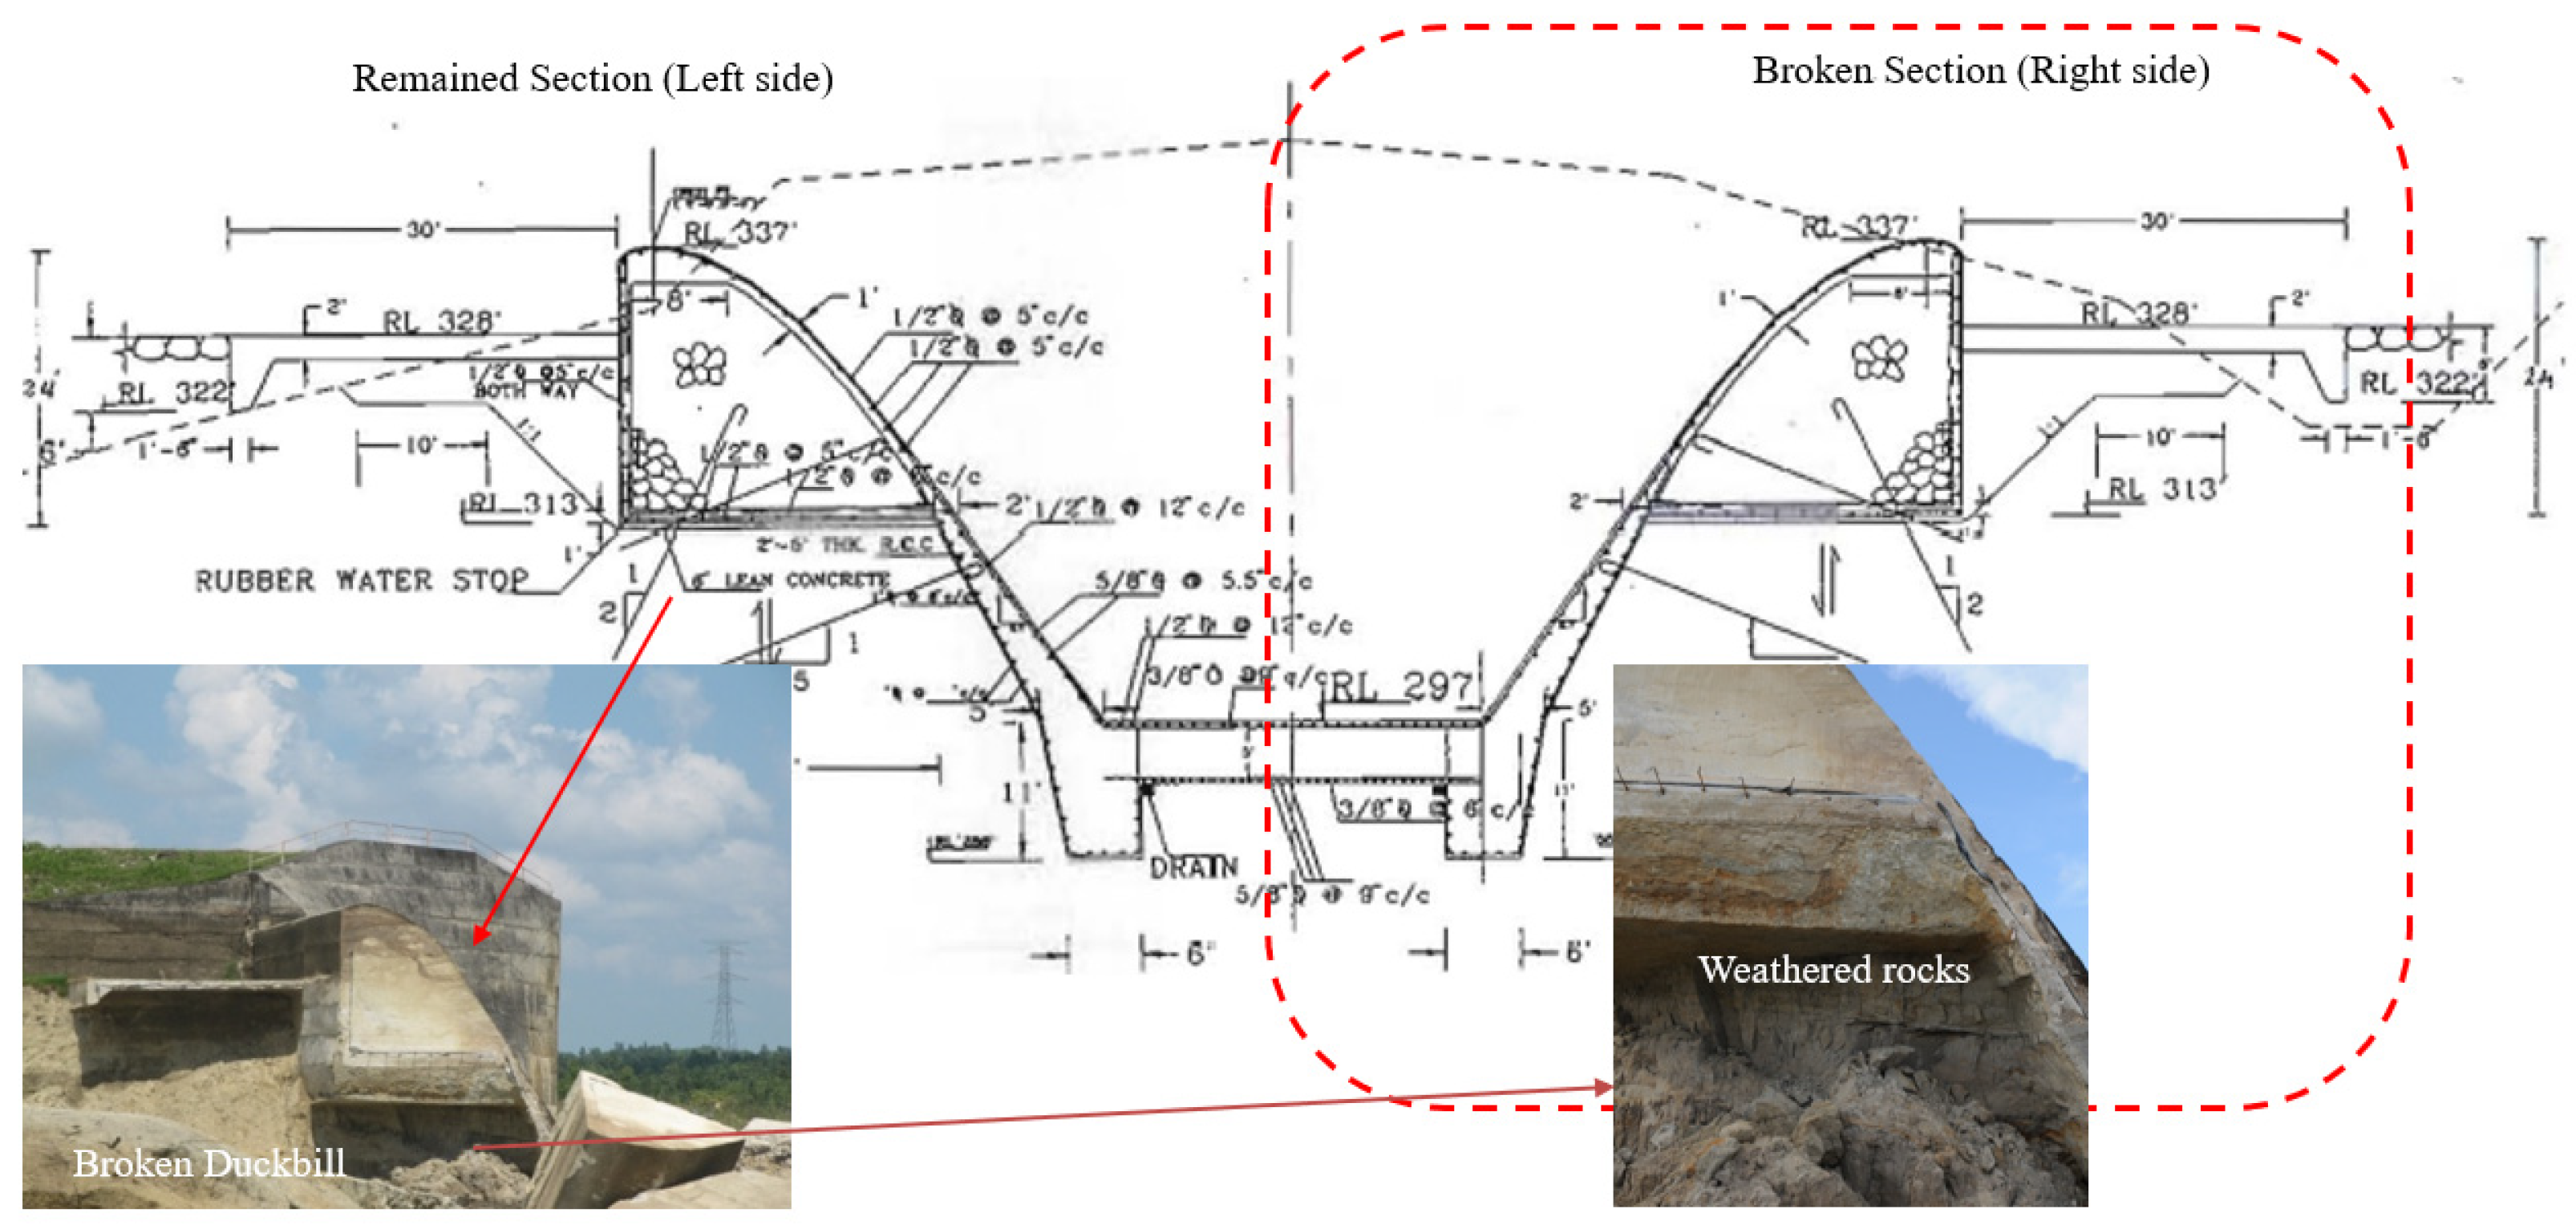
2.5.3. Field Observation and Causes of Failure
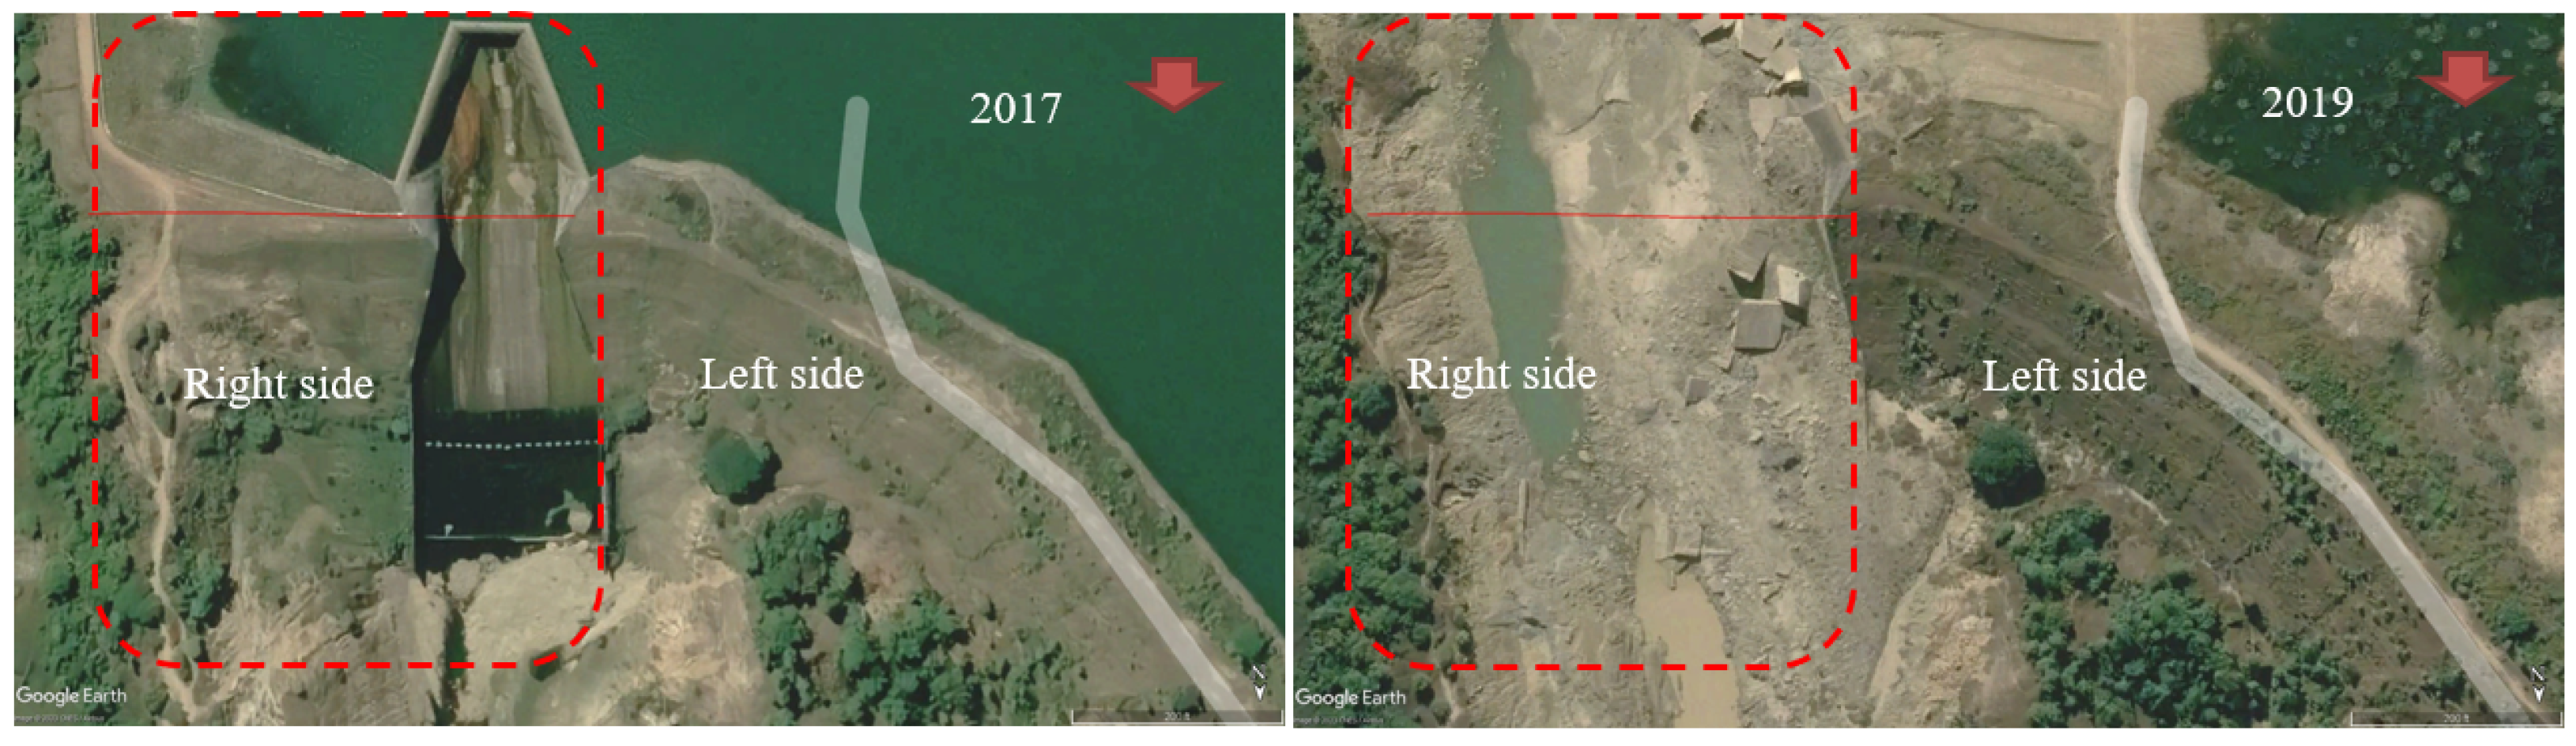
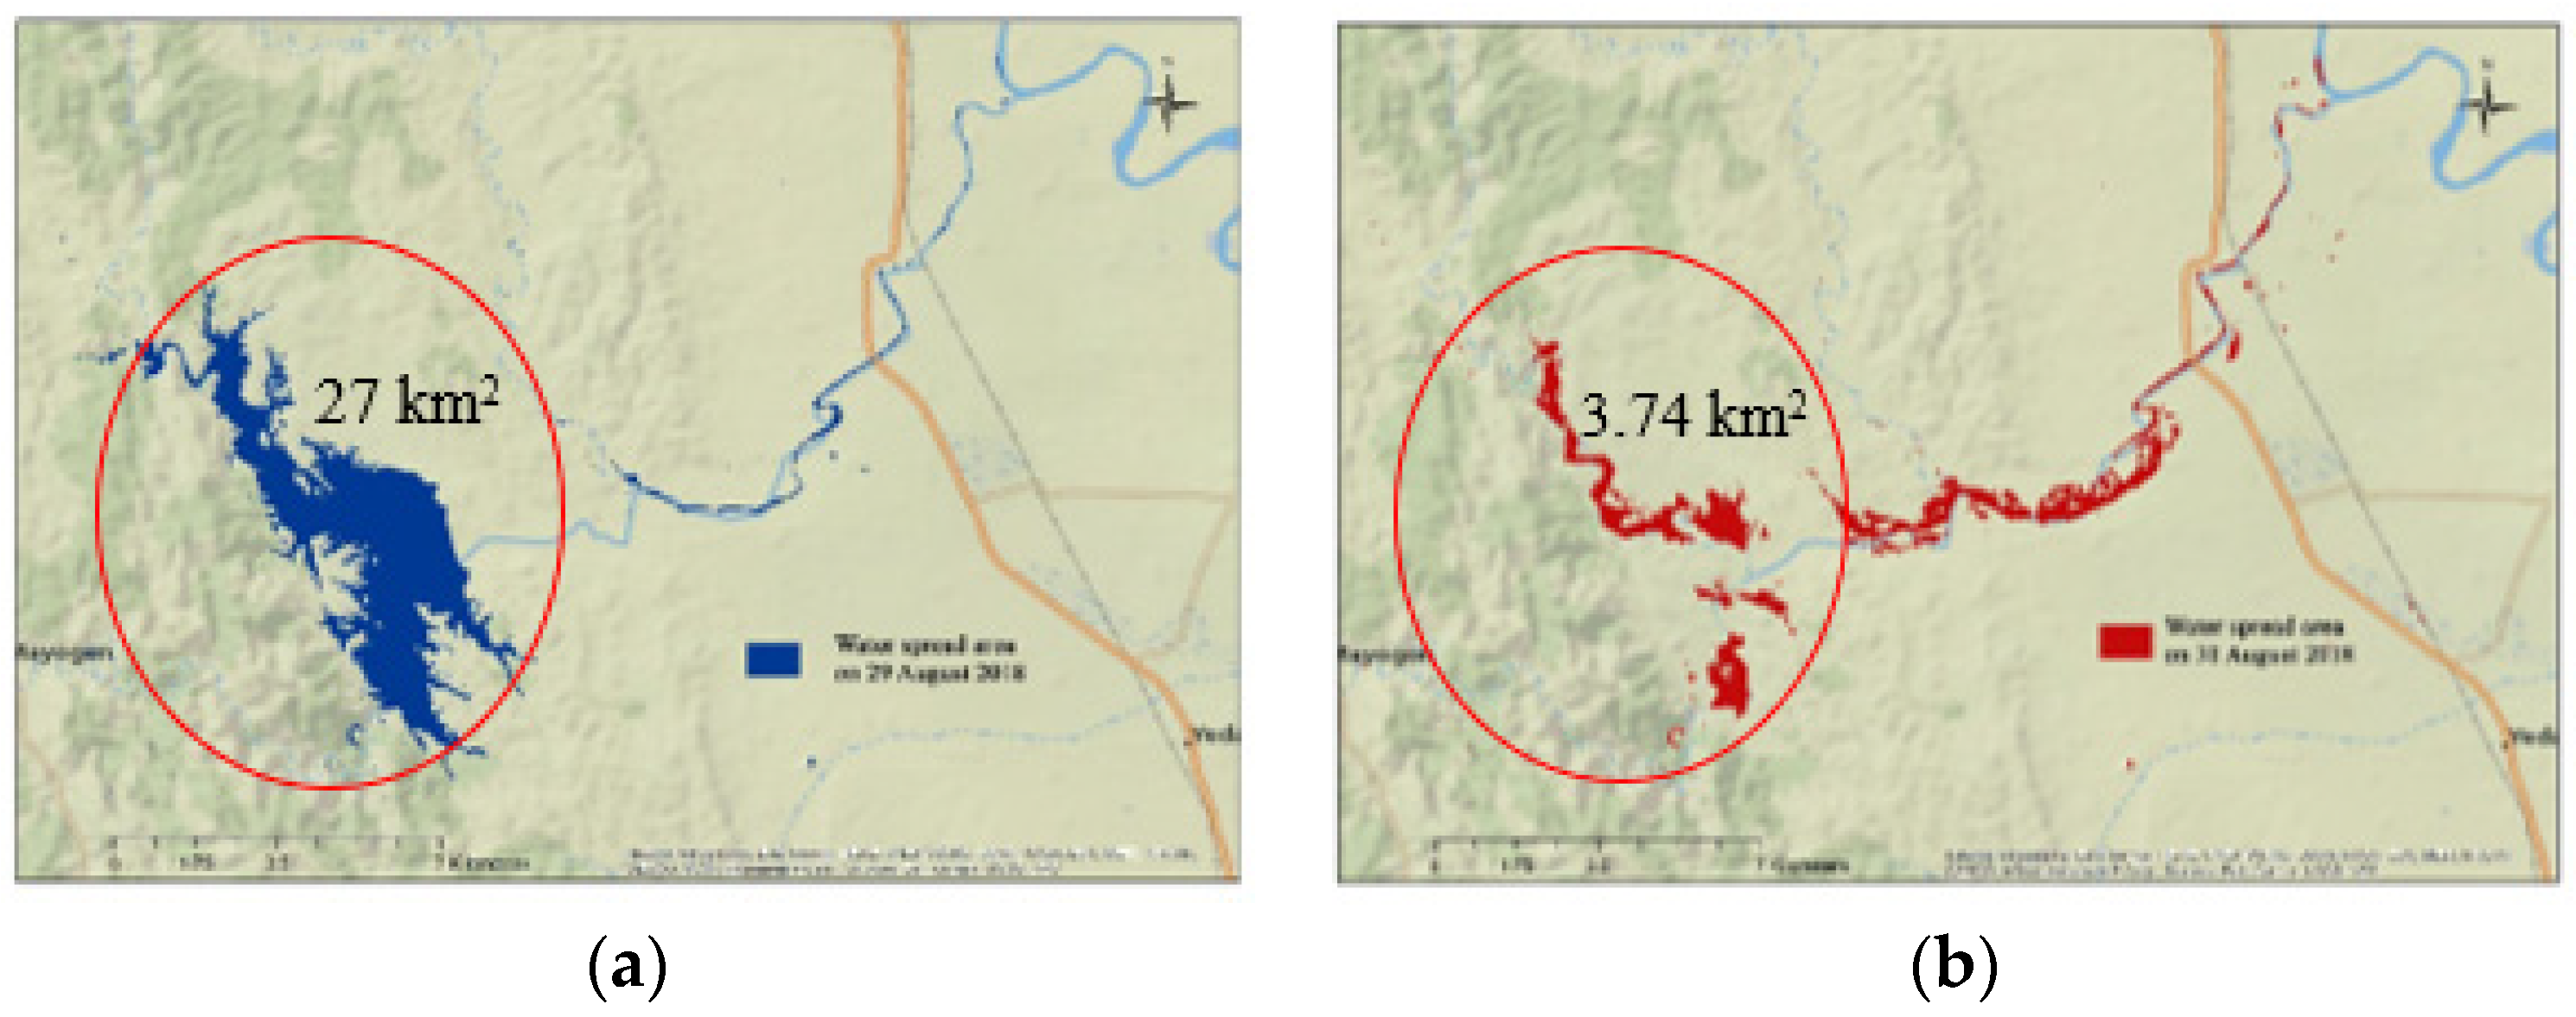
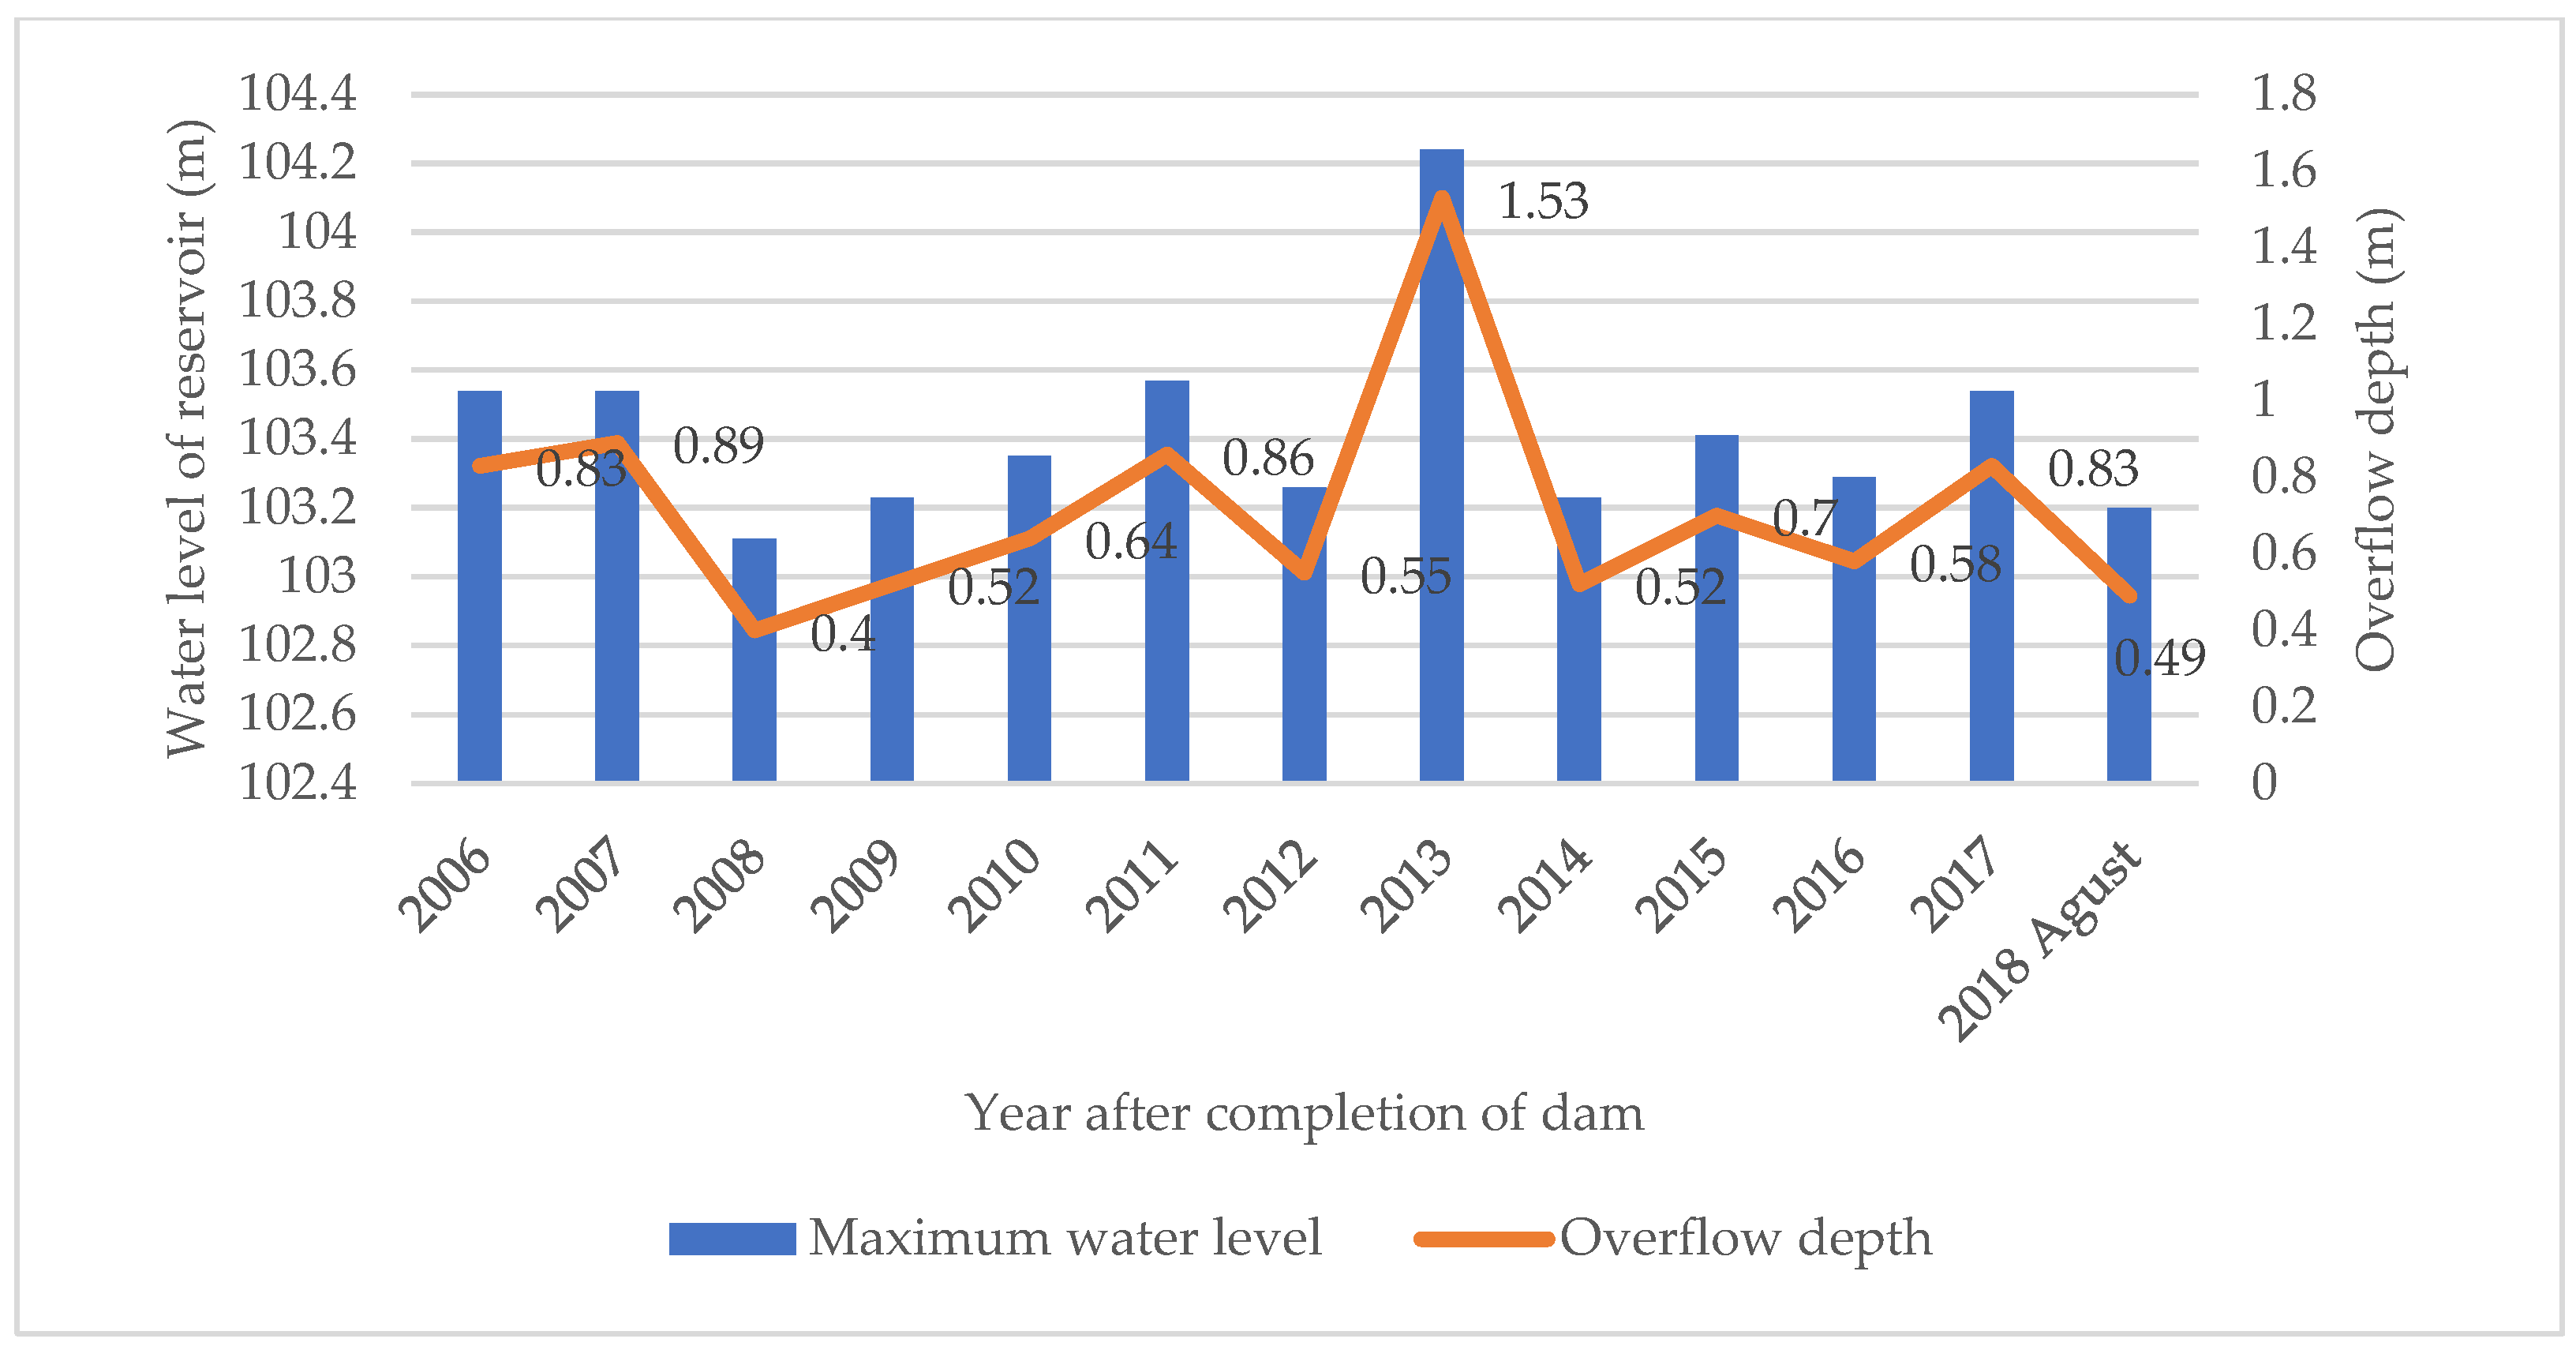
2.6. Changes in the Study Site before and after the Dam Breach
2.7. Water Discharge Condition
2.7.1. Total Outflow Volume by Satellite Data
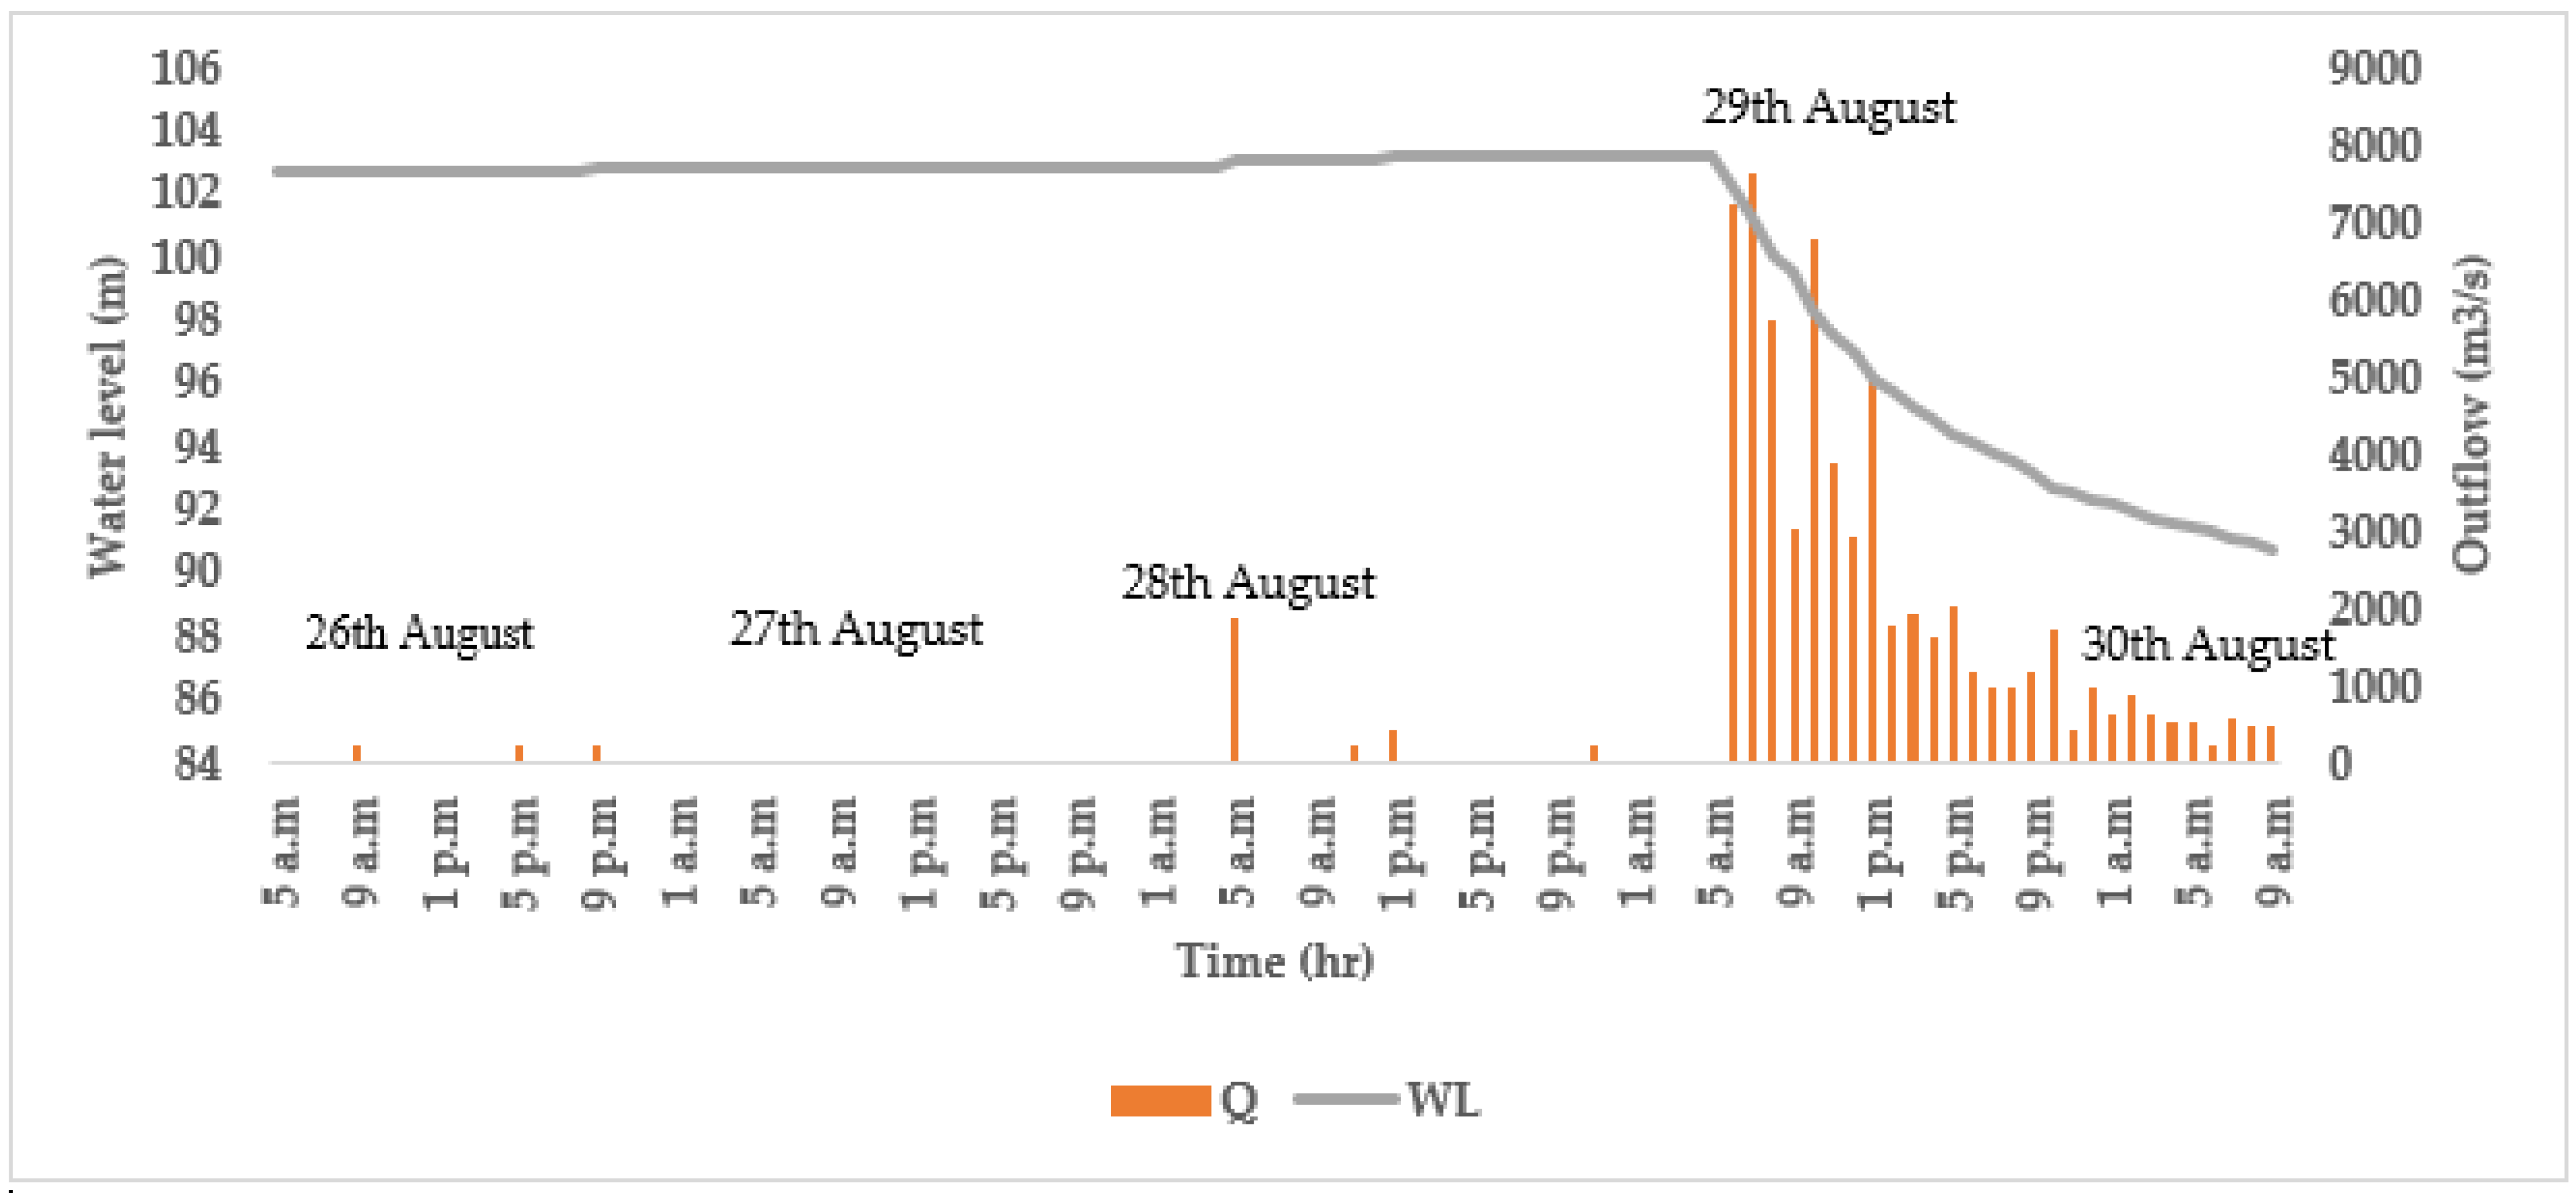
2.7.2. Calculated Outflow Using Water Level Records during the Event
2.8. Comparisons with Previous Dam Breach Events
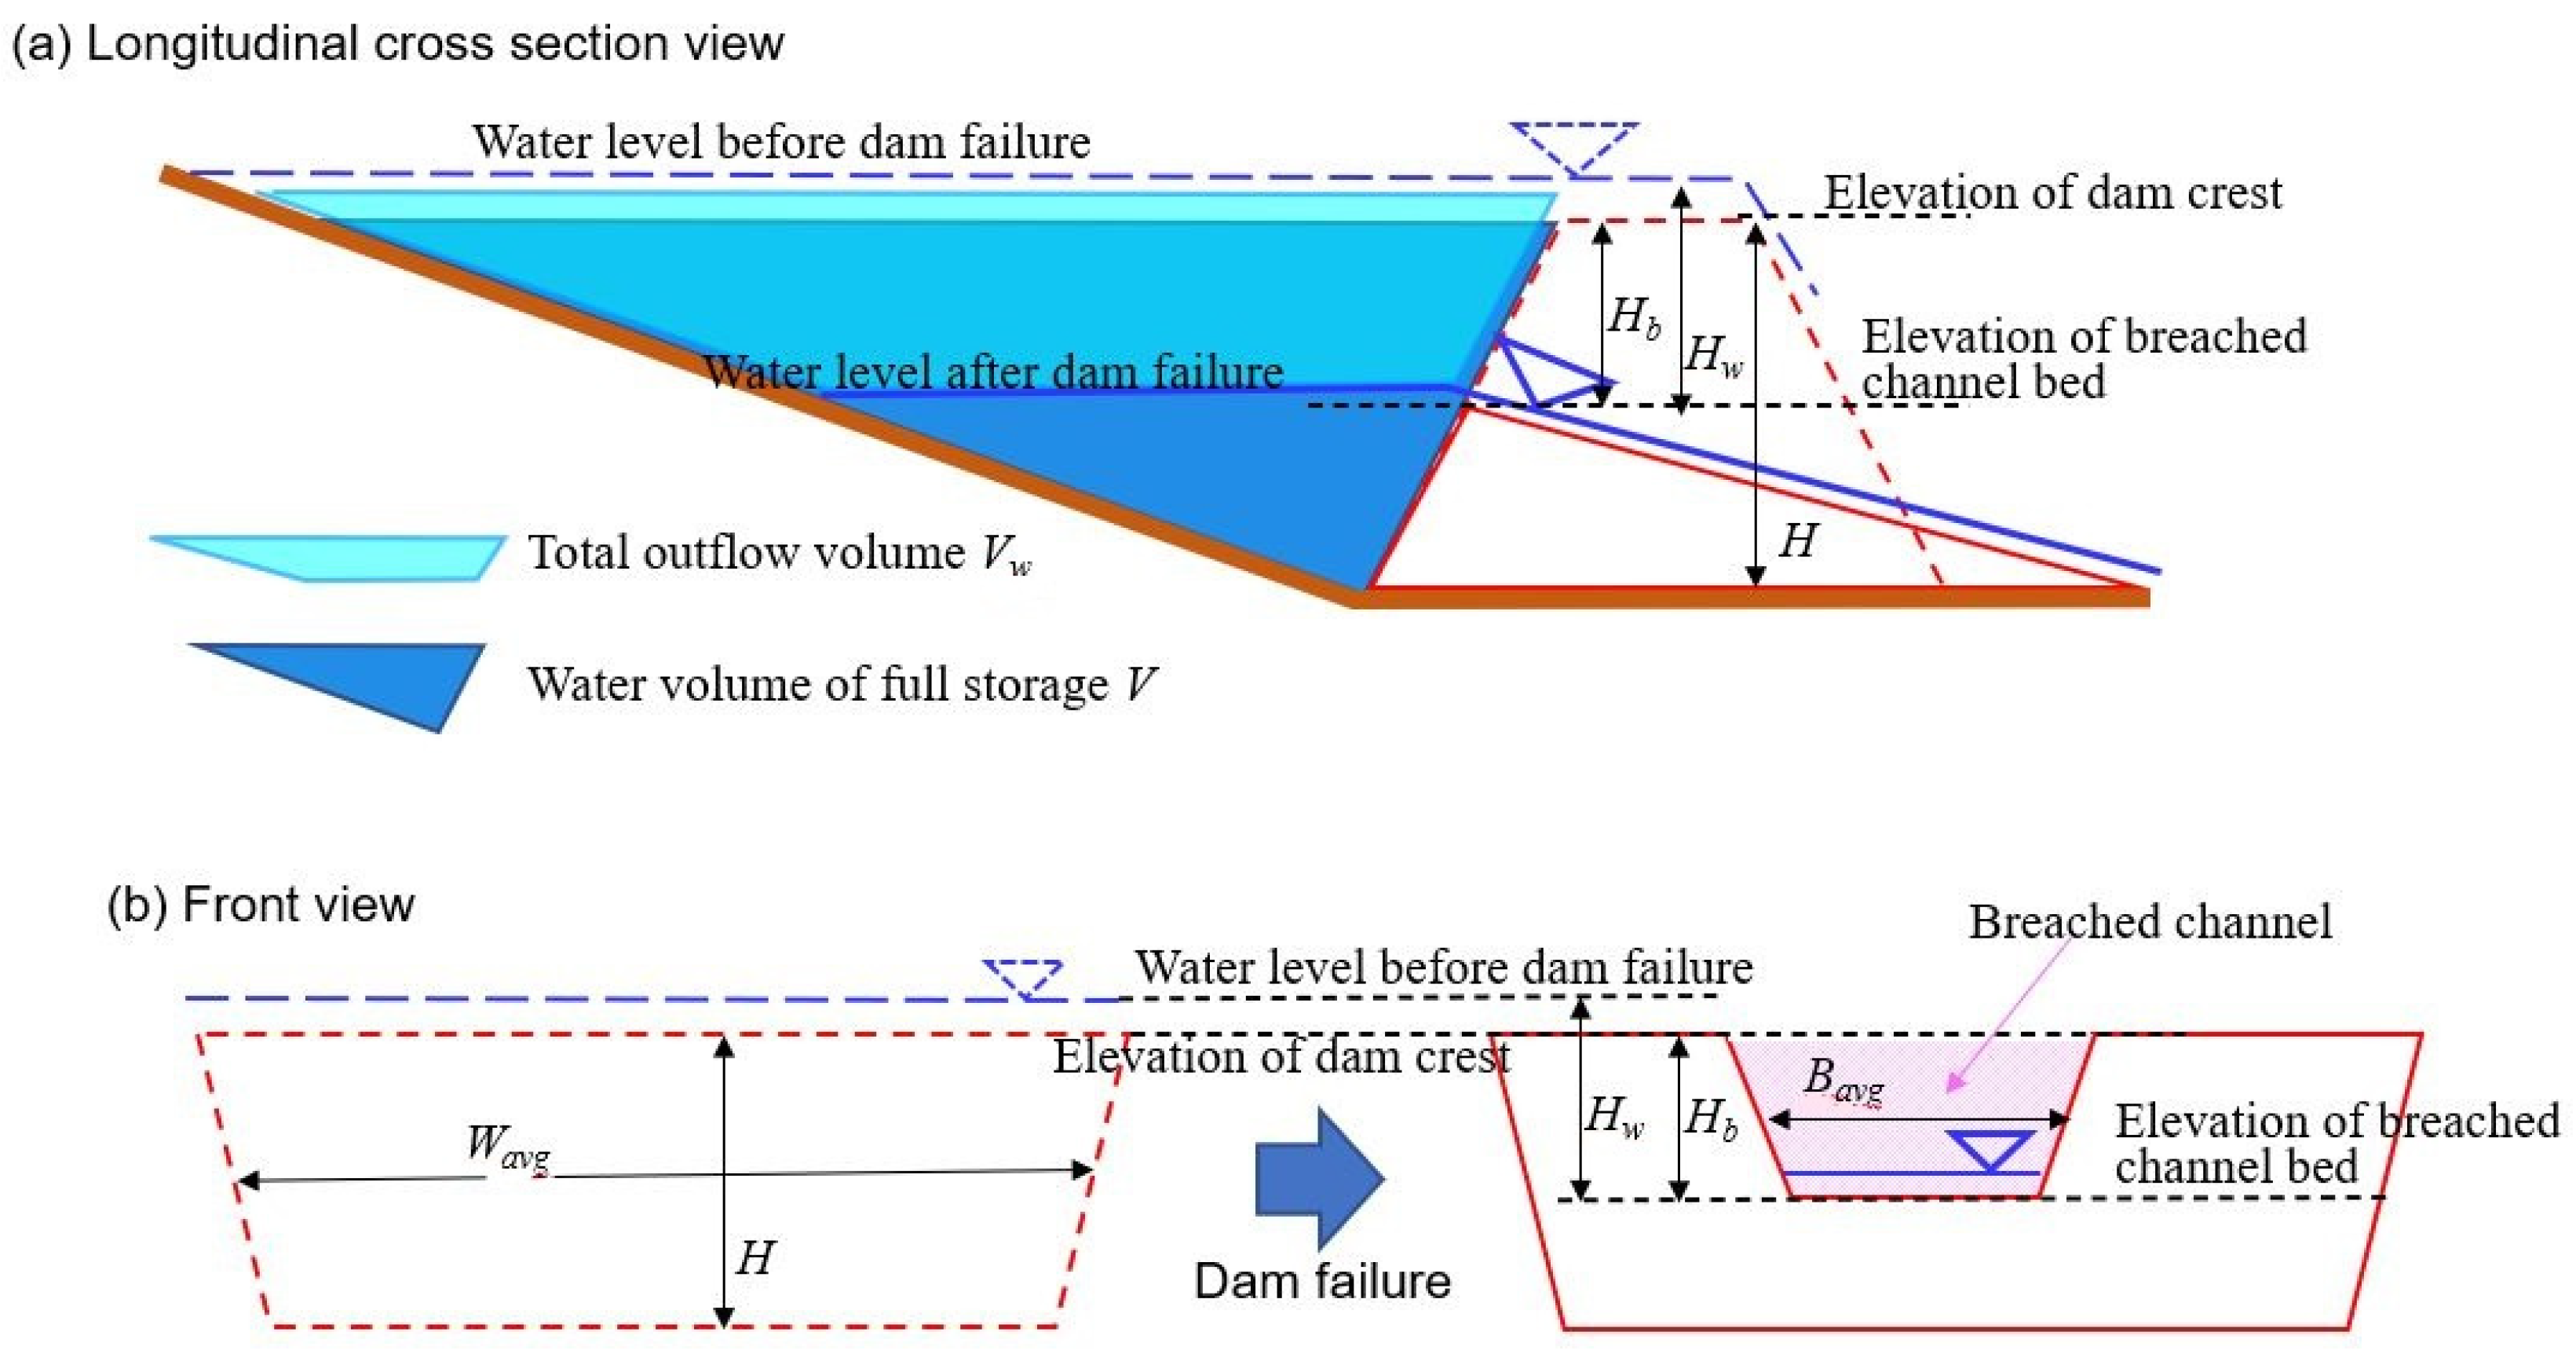
2.8.1. Dam Breaching Parameters
- Breach parameters for the breach channel:
- 2.
- Breach parameters for water discharge:
2.8.2. Empirical Equations from Previous Studies
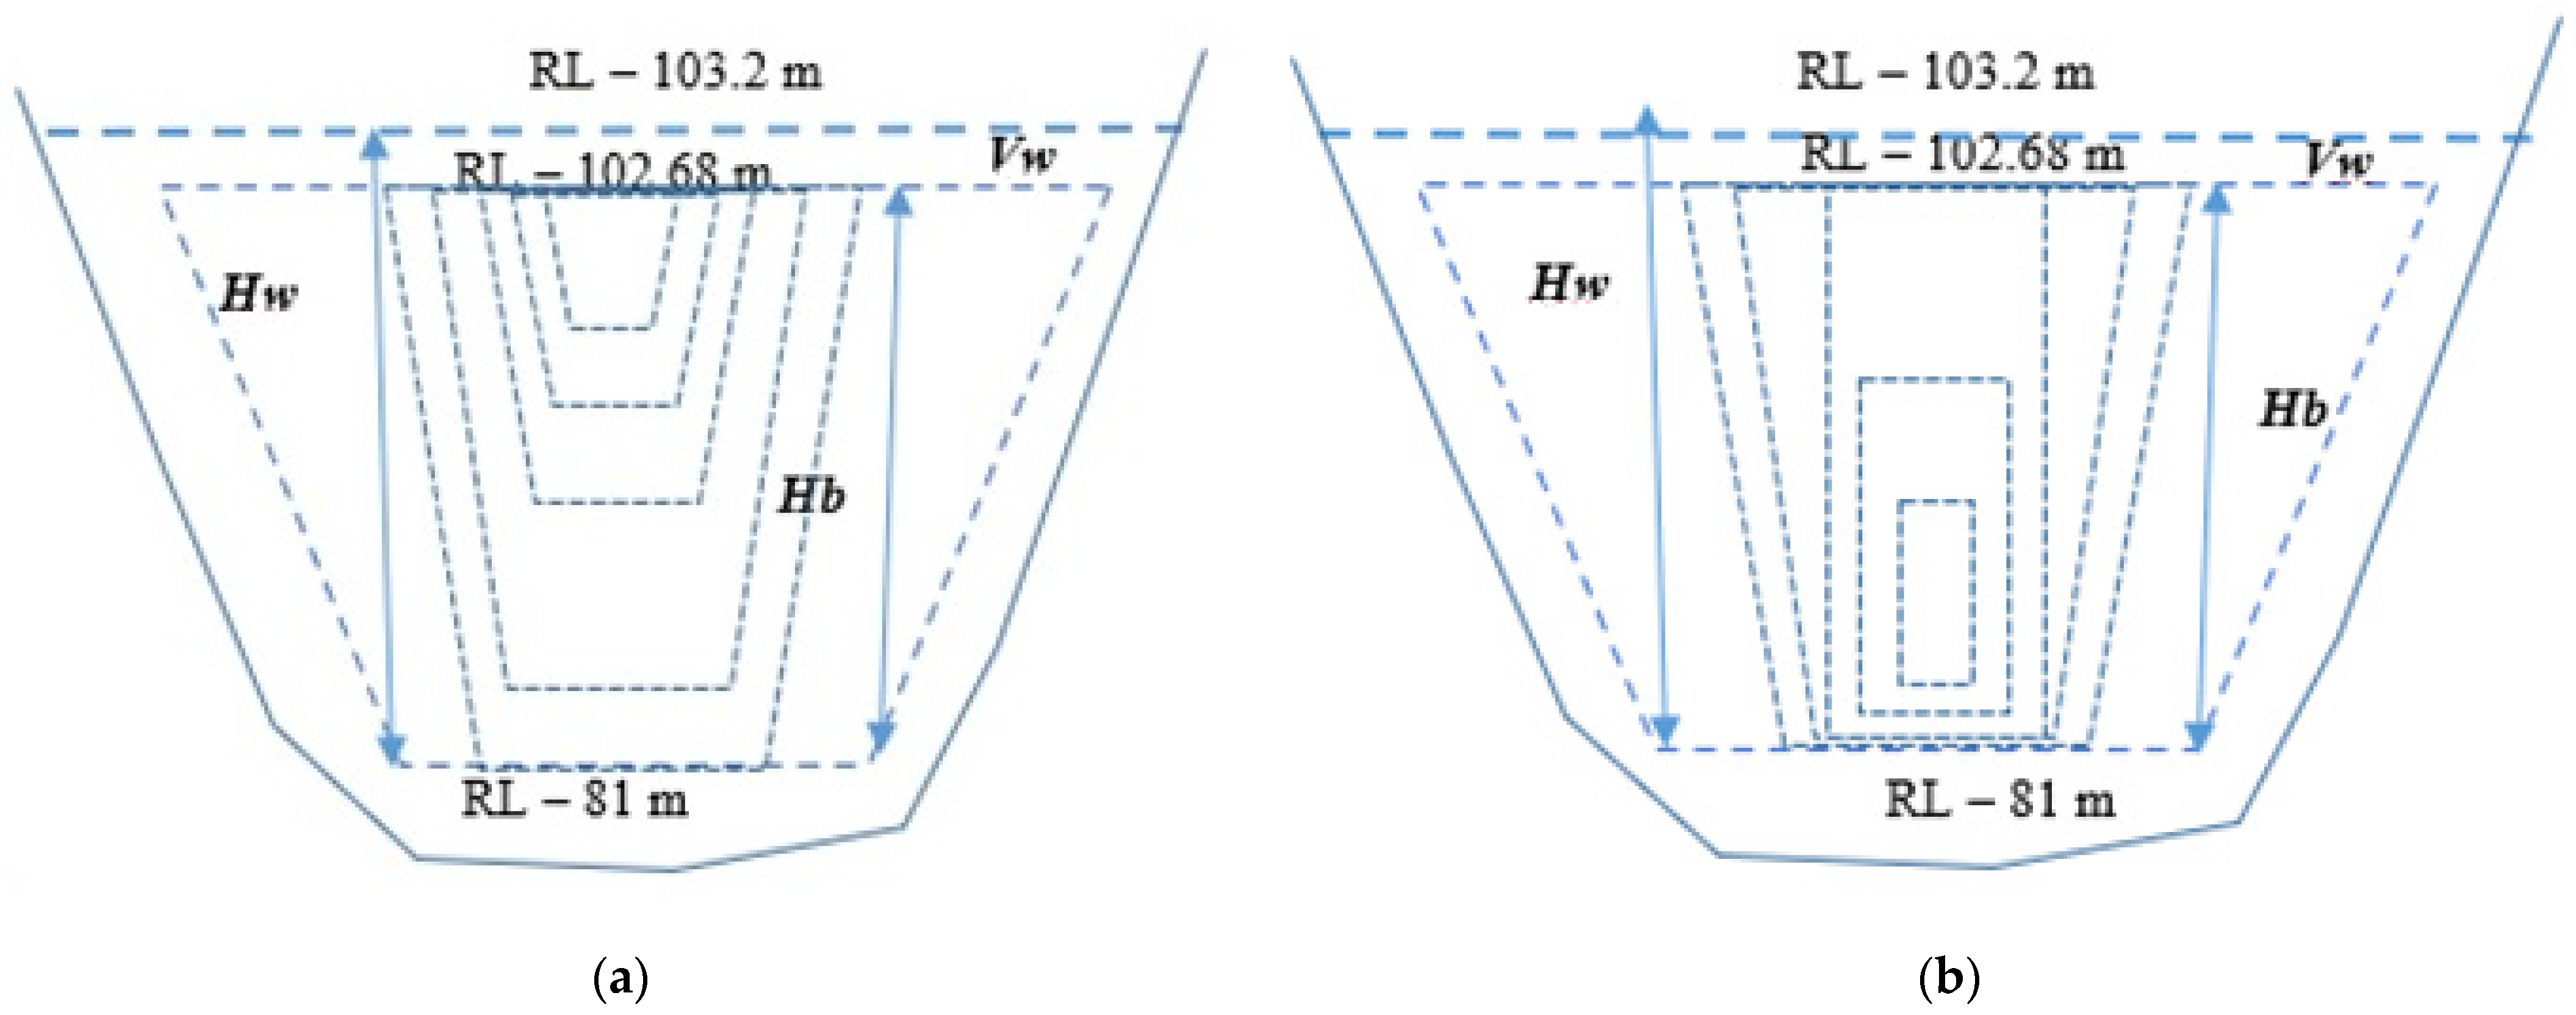
2.8.3. Tested Scenarios for Failure Mechanisms
3. Results
3.1. Water Discharge Characteristics
3.2. Calculated Results Using Empirical Equations
3.2.1. Average Breach Width (Bavg)
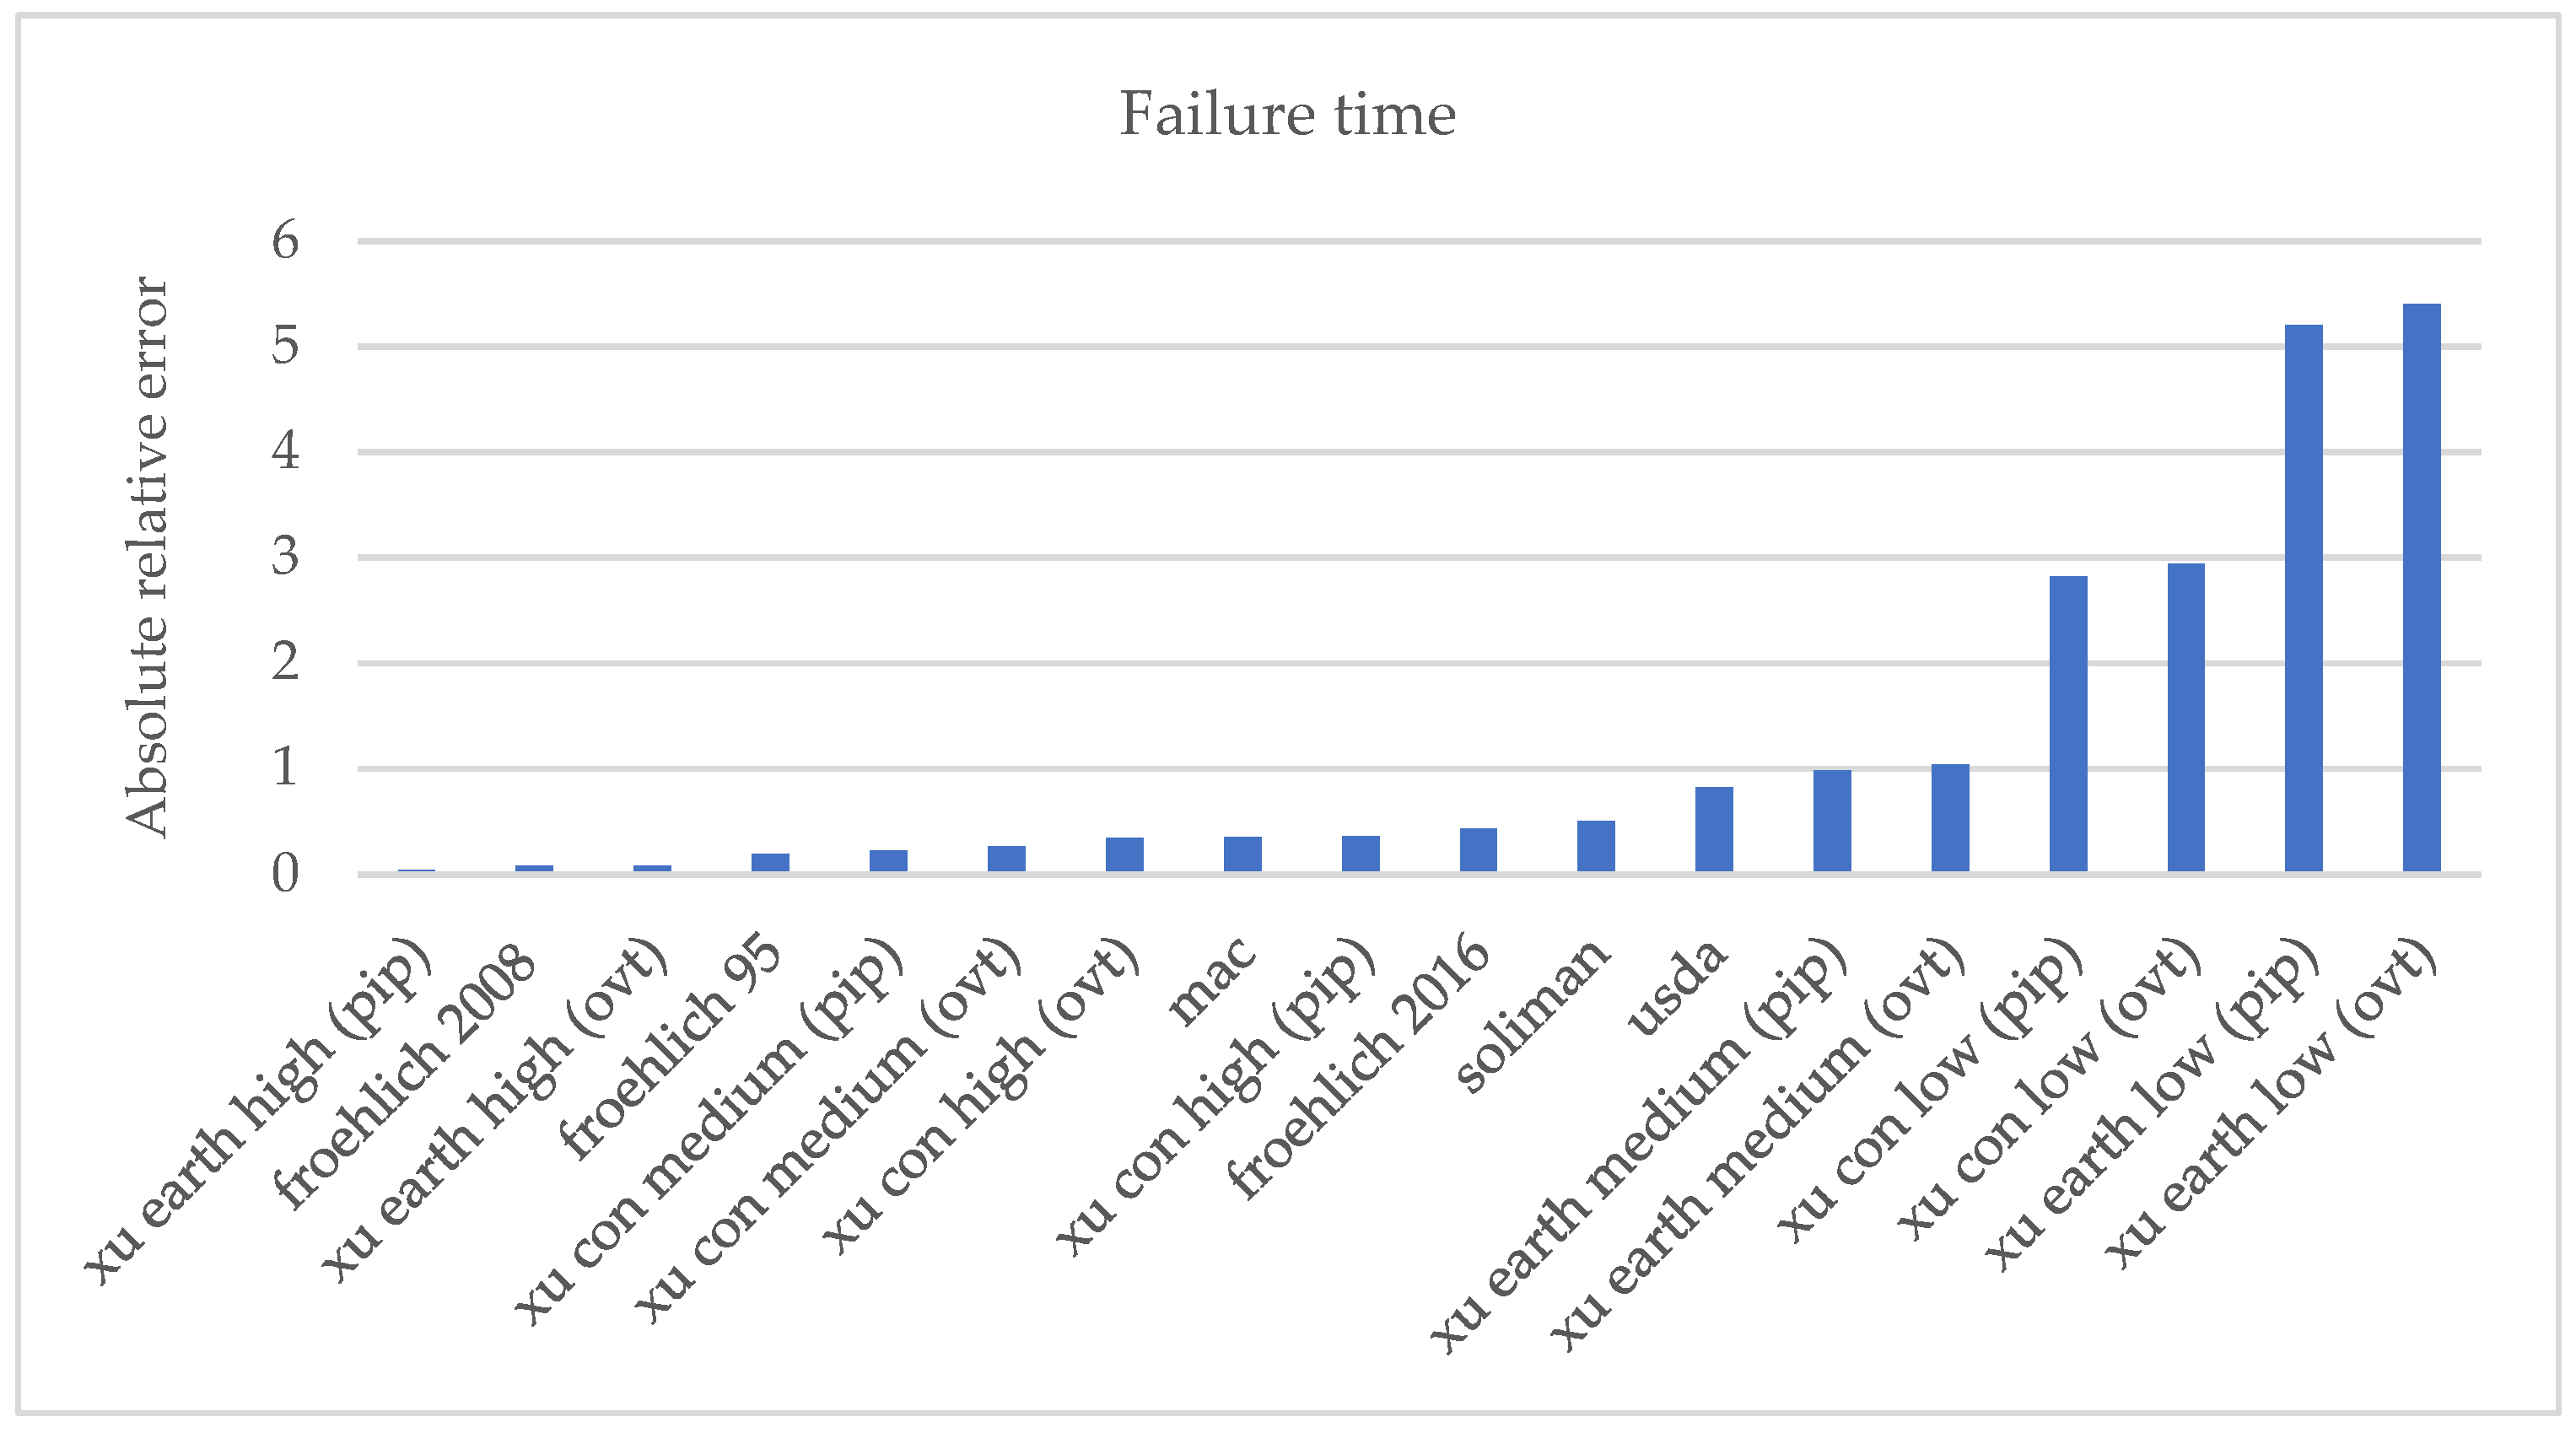
3.2.2. Failure Time (Tf)
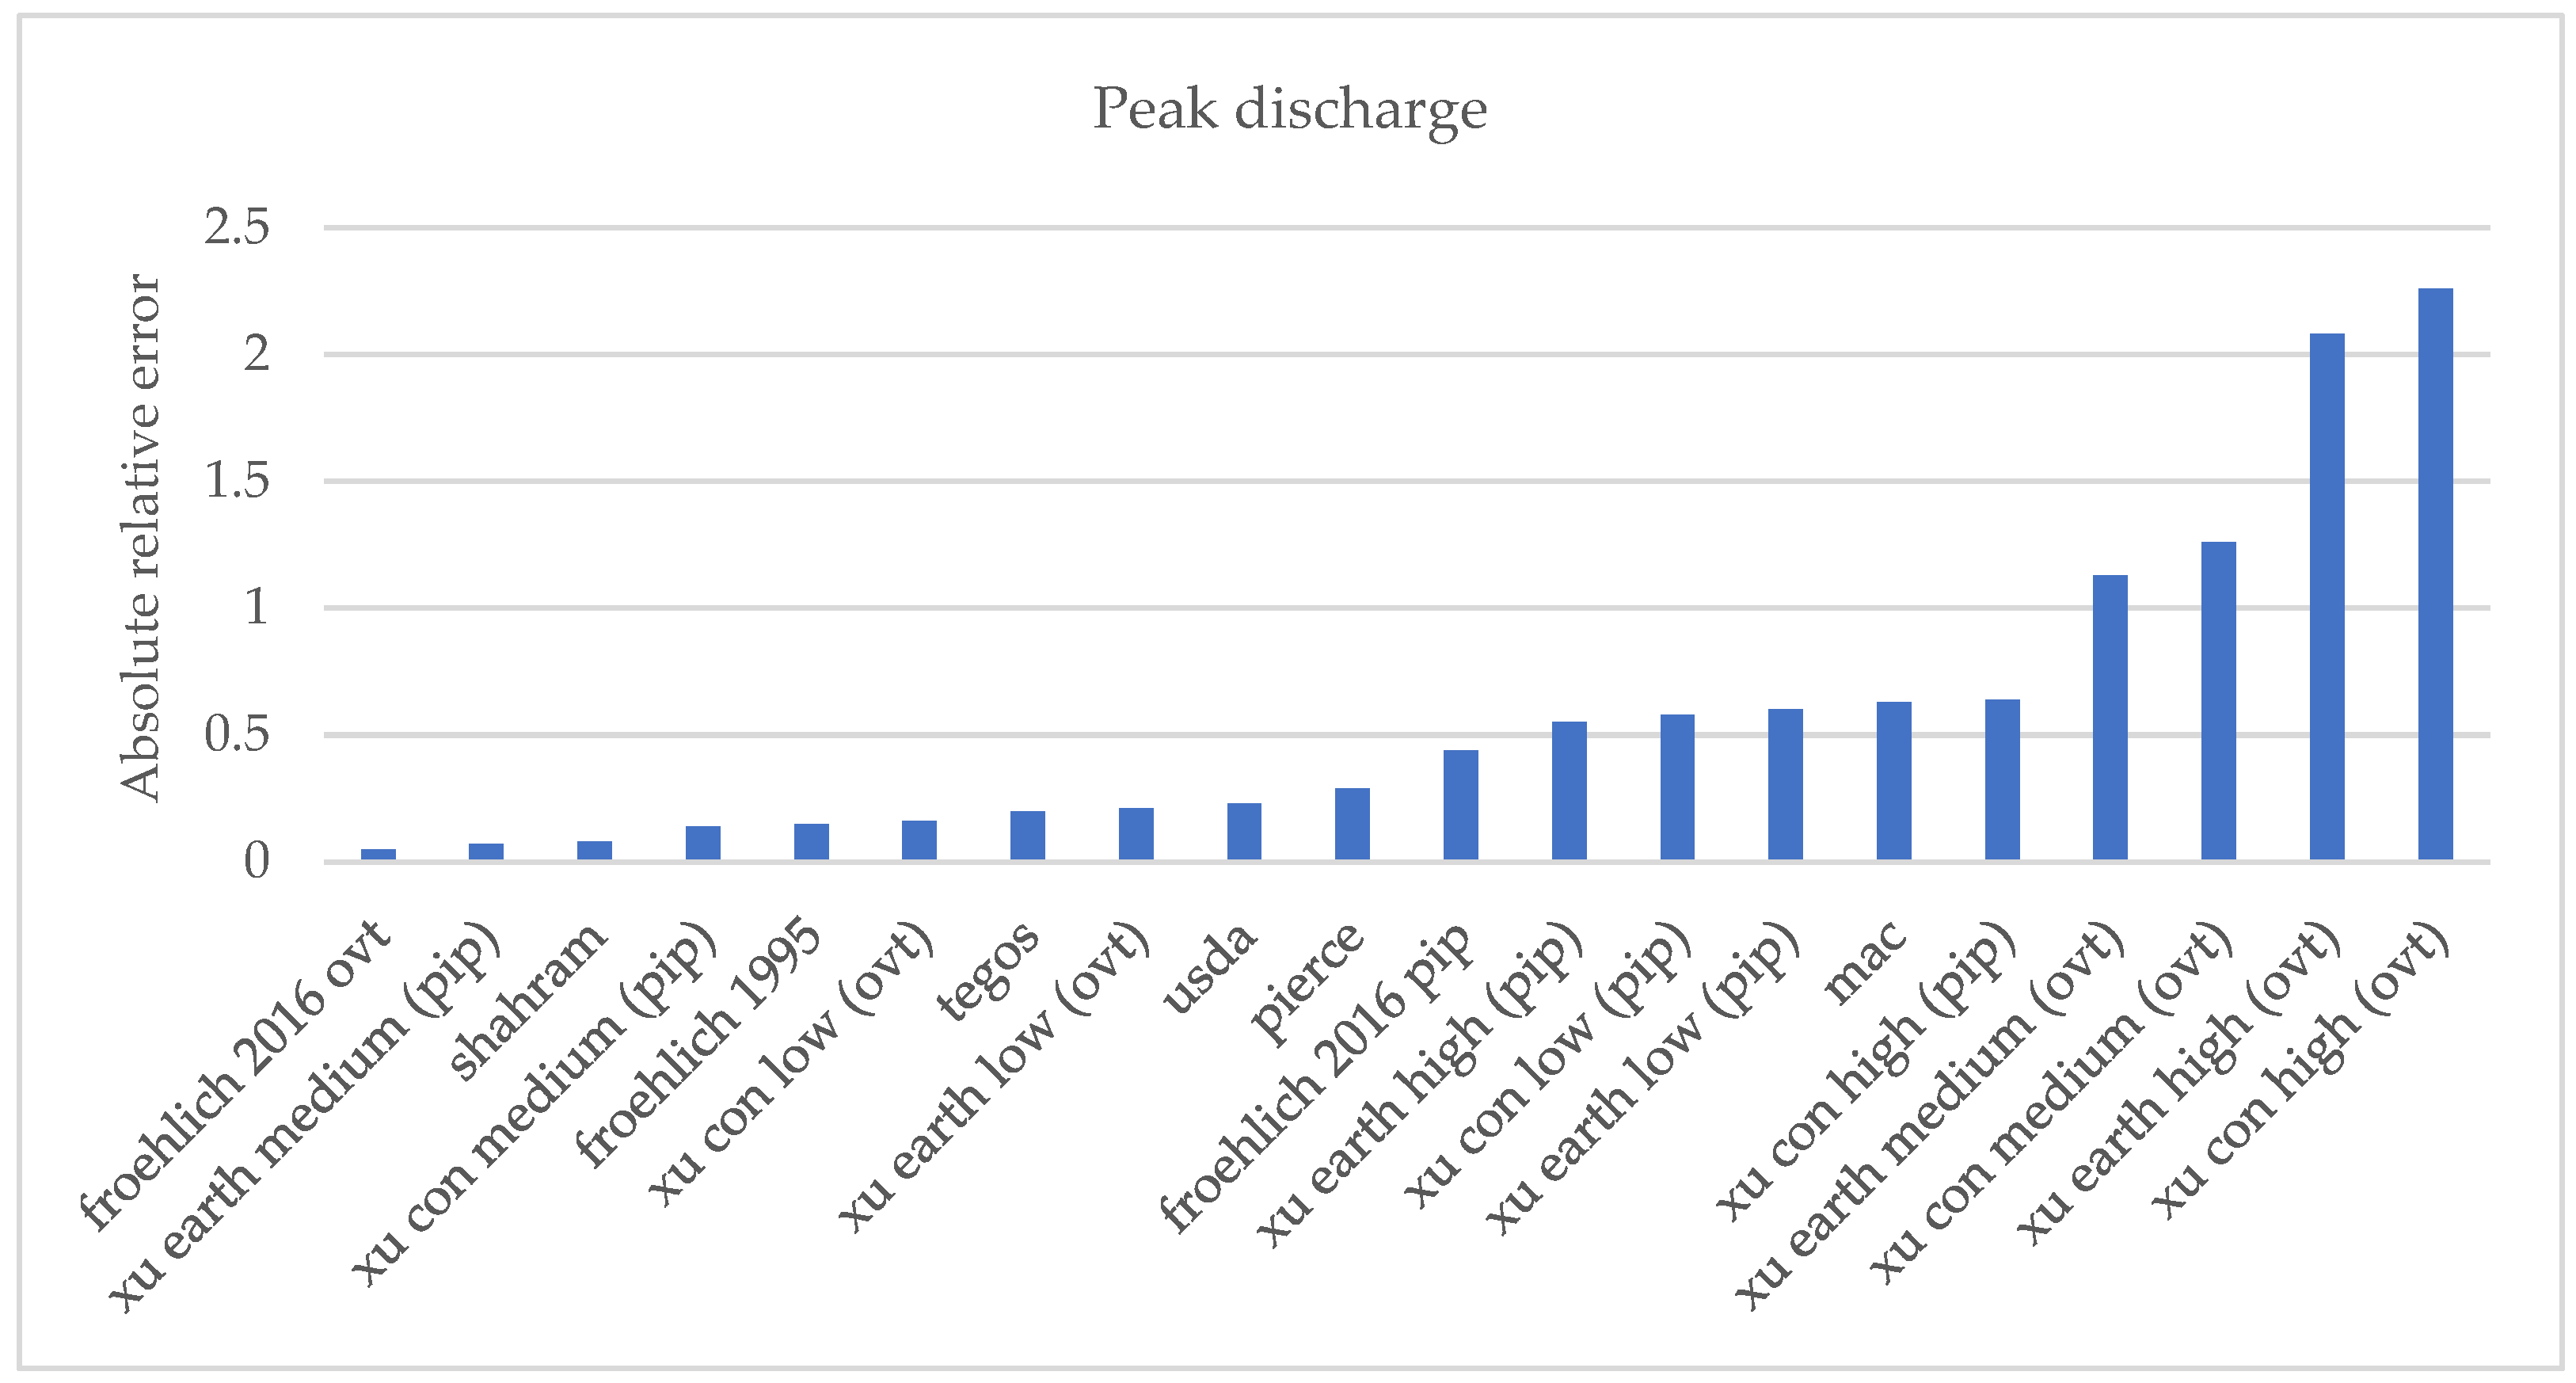
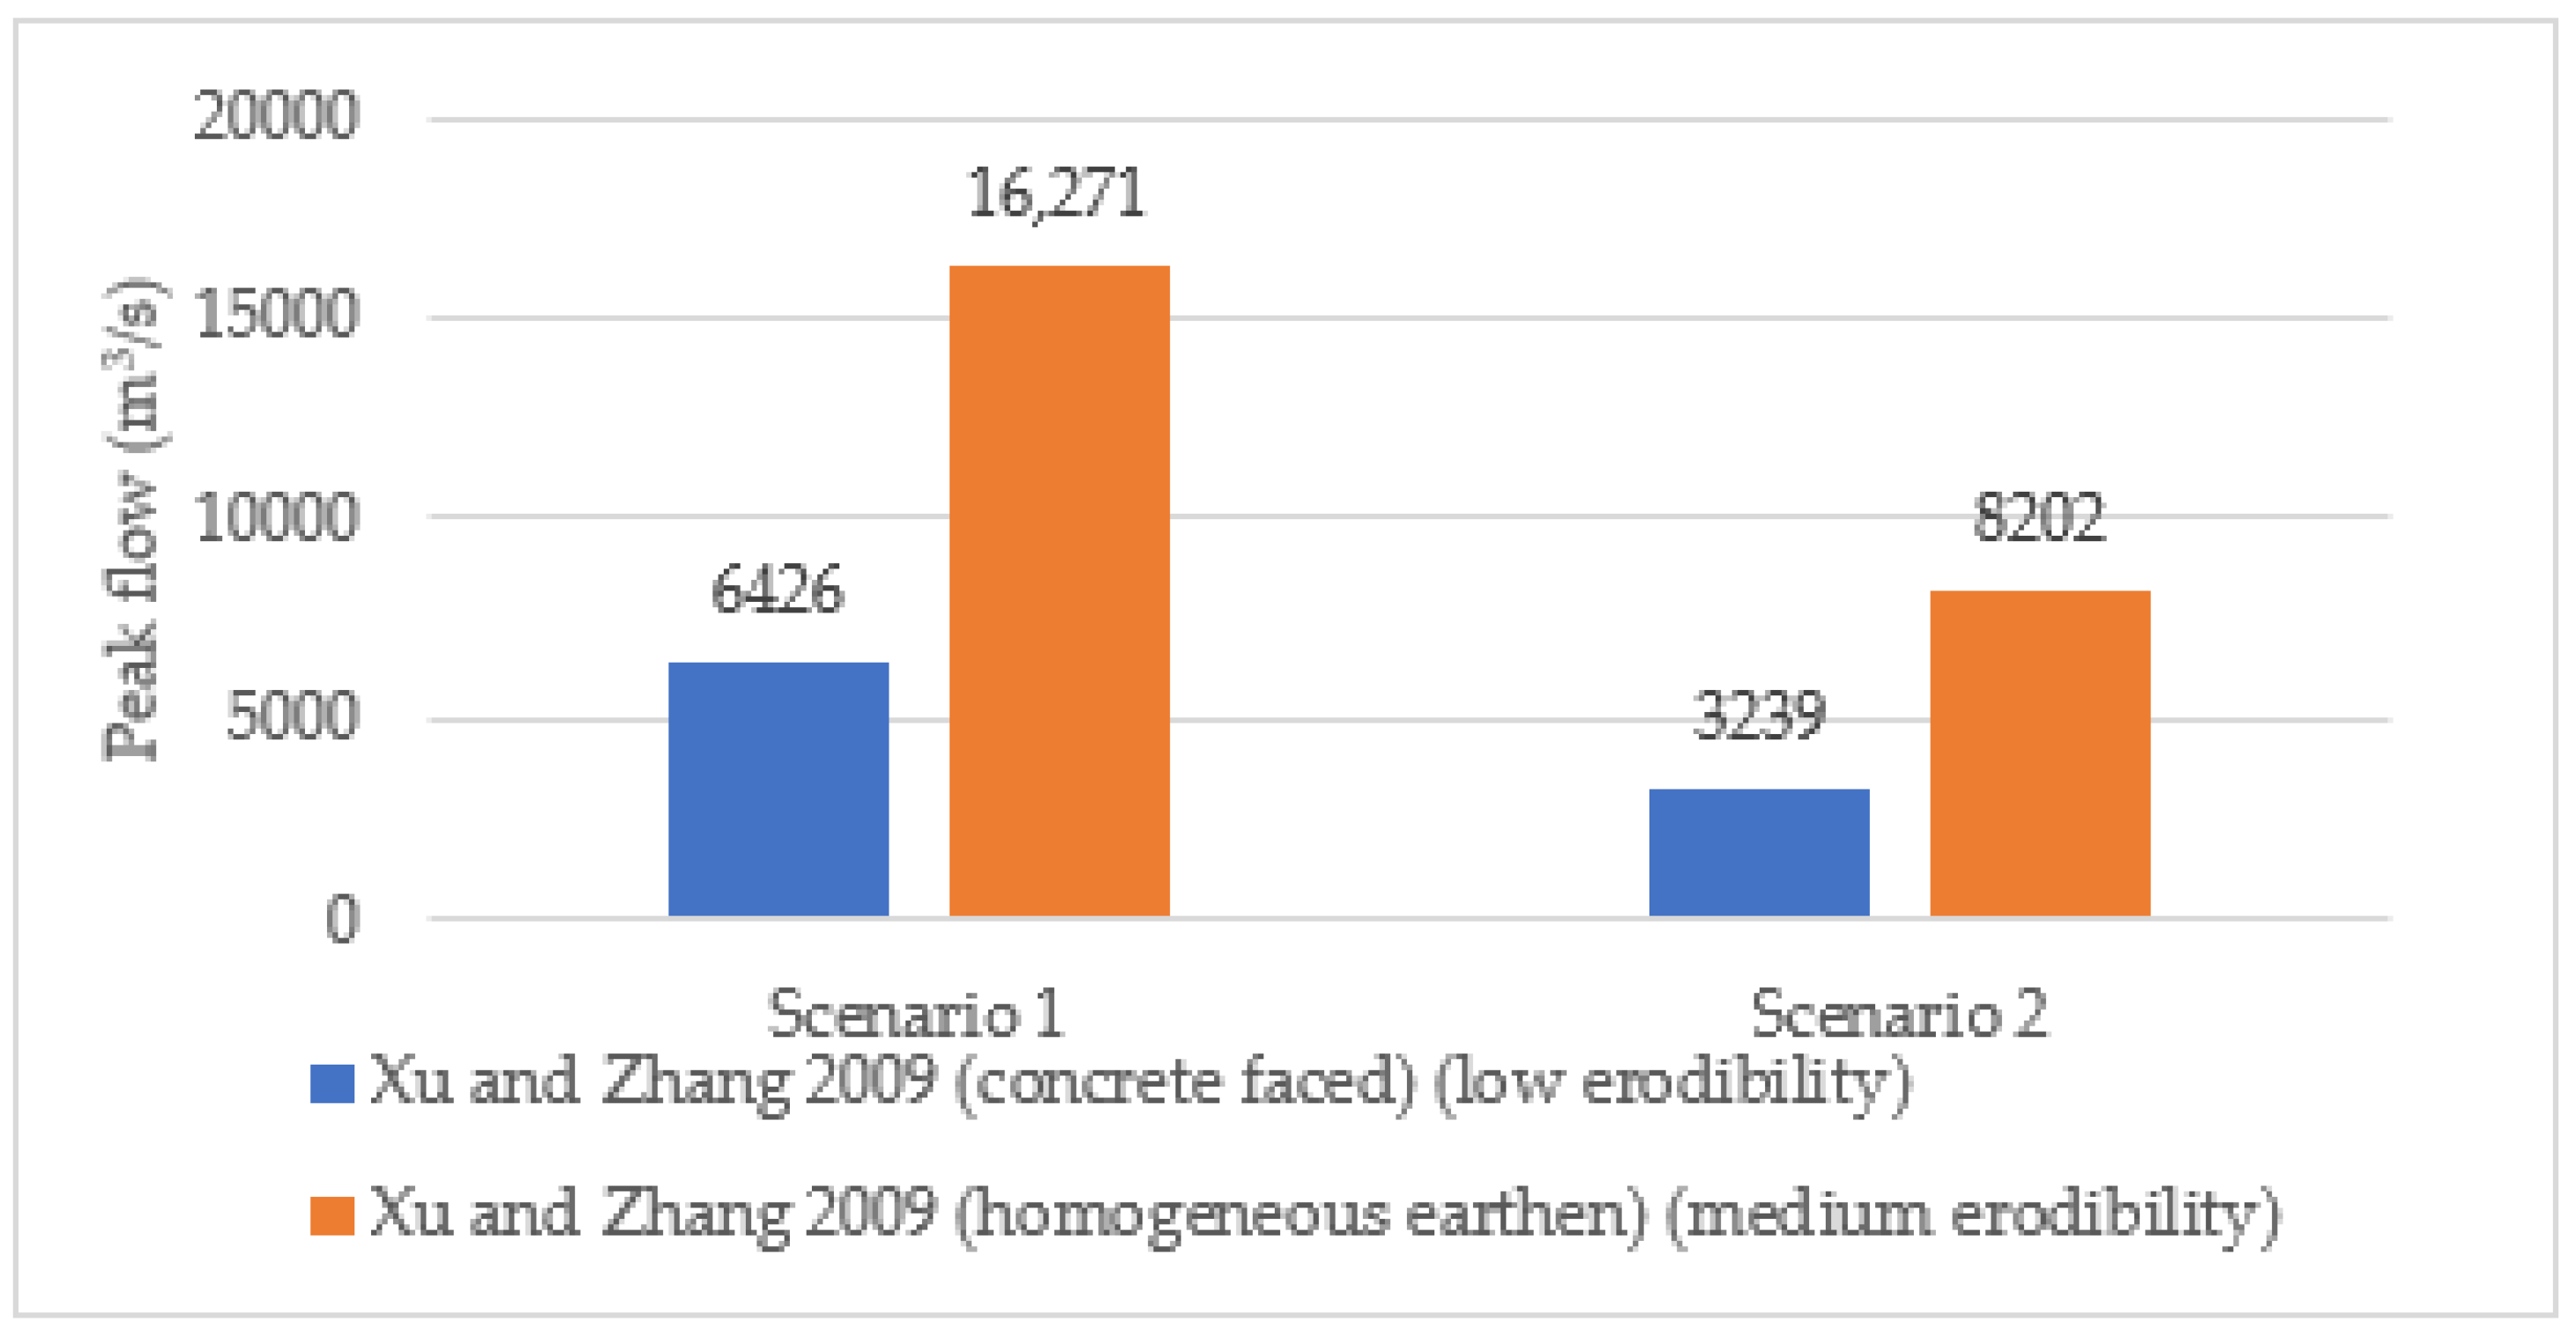
3.2.3. Peak Discharge (Qp)
4. Discussion
4.1. Occurrence of Spillway Breach
4.2. Erosion of the Spillway
The Effectiveness of the Presence of the Spillway
4.3. Lessons from the Disaster
5. Conclusions
Author Contributions
Funding
Data Availability Statement
Acknowledgments
Conflicts of Interest
Abbreviations
| Qp | peak outflow due to breach, m3/s. |
| Bavg | average breach width, m. |
| Tf | breach formation time, h. |
| Vw | volume of water at failure time, m3. |
| Hw | height of the water from the breach bottom, m. |
| Wavg | average width of the dam, m. |
| Hb | height of breach, m. |
| Ver | volume of material eroded from the dam, m3. |
| g | acceleration due to gravity (9.8 m/s2 in the SI units). |
| H | dam height, m. |
| V | volume of water stored in the dam, m3. |
| K0/Km | coefficient for failure mode (Froehlich’s equations). |
| Kh | coefficient of the size of the dam (Froehlich’s equations). |
| Hr | reference height (15 m) (Xu and Zhang’s equation). |
| Hs | reference height (6.1 m) (Froehlich’s equation). |
| Tr | reference time (1 h). |
| b3 | coefficient of dam type (Xu and Zhang’s equation). |
| b4 | coefficient of failure mode (Xu and Zhang’s equation). |
| b5 | coefficient of erodibility (Xu and Zhang’s equation). |
Appendix A

| Return Period (Year) | 1-Day Maximum Rainfall (mm) | Peak Flood (m3/s) |
|---|---|---|
| 20 | 176.5 | 1758 |
| 50 | 204.5 | 2105 |
| 100 | 225.6 | 2296 |
| 200 | 246.4 | 2693 |
| 500 | 274.3 | 3241 |
| 1000 | 294.9 | 3491 |
| Coefficients | Average Breach Width, Bavg | Failure Time, Tf | Peak Outflow, Qp |
|---|---|---|---|
| b3, Dam with core walls | −0.041 | −0.327 | −0.503 |
| b3, Concrete-faced dam | 0.026 | −0.674 | −0.591 |
| b3, Homogeneous/zoned earth fill dam | −0.226 | −0.189 | −0.649 |
| b4, Overtopping | 0.149 | −0.579 | −0.705 |
| b4, Piping | 0.389 | 0.611 | −1.039 |
| b5, Low erodibility | −0.391 | 0.579 | −1.362 |
| b5, Medium erodibility | −0.14 | −0.564 | −0.375 |
| b5, High erodibility | 0.291 | −1.205 | −0.007 |
Appendix B
| Time (Hour) | Water Level (m) | Outflow Rate (m3/s) | Volume in the Reservoir (Mm3) |
|---|---|---|---|
| 29 August, 5:00 a.m. | 103.2 | 0.0 | 279.1 |
| 6:00 a.m. | 102.2 | 7217.9 | 253.1 |
| 7:00 a.m. | 101.1 | 7642.8 | 226.4 |
| 8:00 a.m. | 100.1 | 5756.2 | 203.0 |
| 9:00 a.m. | 99.5 | 3047.4 | 179.8 |
| 10:00 a.m. | 98.3 | 6771.8 | 167.7 |
| 11:00 a.m. | 97.6 | 3893.7 | 153.6 |
| 12:00 p.m. | 97.0 | 2945.3 | 143.0 |
| 1:00 p.m. | 96.1 | 4938.7 | 129.2 |
| 2:00 p.m. | 95.7 | 1783.4 | 122.8 |
| 3:00 p.m. | 95.3 | 1920.8 | 115.9 |
| 4:00 p.m. | 94.9 | 1646.0 | 109.9 |
| 5:00 p.m. | 94.5 | 2030.1 | 102.6 |
| 6:00 p.m. | 94.1 | 1203.7 | 98.3 |
| 7:00 p.m. | 93.8 | 984.4 | 94.8 |
| 8:00 p.m. | 93.6 | 984.7 | 91.2 |
| 9:00 p.m. | 93.2 | 1203.3 | 86.9 |
| 10:00 p.m. | 92.7 | 1750.5 | 82.6 |
| 11:00 p.m. | 92.6 | 437.5 | 79.0 |
| 12:00 a.m. | 92.3 | 984.7 | 75.5 |
| 30 August, 1:00 a.m. | 92.2 | 656.5 | 73.1 |
| 2:00 a.m. | 91.9 | 875.1 | 69.9 |
| 3:00 a.m. | 91.7 | 656.5 | 67.6 |
| 4:00 a.m. | 91.6 | 547.2 | 65.6 |
| 5:00 a.m. | 91.4 | 546.8 | 63.6 |
| 6:00 a.m. | 91.3 | 240.9 | 62.8 |
| 7:00 a.m. | 91.1 | 561.9 | 60.8 |
| 8:00 a.m. | 90.9 | 481.7 | 59.0 |
| 9:00 a.m. | 90.7 | 481.7 | 57.0 |
| Scenario 1 (Spillway Breach by Overtopping) | Scenario 2 (Spillway Breach by Piping) | |
|---|---|---|
| Spillway crest level (m) | 102.68 | 102.68 |
| Breach bottom level (m) | 81 | 81 |
| Water surface level (m) | 103.2 | 103.2 |
| Breach height, Hb (m) | 21.68 | 21.68 |
| Height of water at failure time, Hw (m) | 22.2 | 22.2 |
| Dam height, H (m) | 29.6 | 29.6 |
| Average dam width, Wavg (m) | 170.7 | 170.7 |
| Water volume at failure time, Vw (m3) | 276,207,009 | 276,207,009 |
| Storage of the Swa Dam, V (m3) | 266,863,398 | 266,863,398 |


References
- Zhang, L.; Xu, Y.; Jia, J. Analysis of earth dam failures: A database approach. Georisk Assess. Manag. Risk Eng. Syst. Geohazards 2009, 3, 184–189. [Google Scholar] [CrossRef] [Green Version]
- Aureli, F.; Maranzoni, A.; Petaccia, G. Review of Historical Dam-Break Events and Laboratory Tests on Real Topography for the Validation of Numerical Models. Water 2021, 13, 1968. [Google Scholar] [CrossRef]
- Singh, K.P.; Snorrason, A. Sensitivity of outflow peaks and flood stages to the selection of dam breach parameters and simulation models. J. Hydrol. 1984, 68, 295–310. [Google Scholar] [CrossRef]
- Castorani, A.; Moramarco, T. Selecting the optimal design flood. Int. J. Hydropower Dams 1995, 2, 74–80. [Google Scholar]
- Morris, M.; Hassan, M.; Vaskinn, K. Breach formation: Field test and laboratory experiments. J. Hydraul. Res. 2007, 45 (Suppl. S1), 9–17. [Google Scholar] [CrossRef]
- Greenbaum, N. Assessment of dam failure flood and a natural, high-magnitude flood in a hyperarid region using paleoflood hydrology, Nahal Ashalim catchment, Dead Sea, Israel. Water Resour. Res. 2007, 43, W02401. [Google Scholar] [CrossRef] [Green Version]
- Stevens, M.; Linard, J. The safest dam. J. Hydraul. Eng. 2002, 128, 139–142. [Google Scholar] [CrossRef]
- Schmocker, L. Book review: The failure of embankment dams due to overtopping. J. Hydraul. Res. 2009, 47, 288. [Google Scholar] [CrossRef]
- Jandora, J.; Ríha, J. The Failure of Embankment Dams due to Overtopping; Vutium Press: Brno, Czech Republic, 2008. [Google Scholar]
- Valiani, A.; Caleffi, V.; Zanni, A. Case Study: Malpasset Dam-Break Simulation using a Two-Dimensional Finite Volume Method. J. Hydraul. Eng. 2002, 128, 460–472. [Google Scholar] [CrossRef]
- Si, Y.; Qing, D. The world’s most catastrophic dam failures: The August 1975 collapse of the Banqiao and Shimantan Dams. In The River Dragon Has Come; Routledge: Abingdon, UK, 1998; pp. 25–38. [Google Scholar]
- ICOLD (International Commission on Large Dams). Lessons from Dam Incidents; ICOLD: Paris, France, 1973; p. 1069. [Google Scholar]
- Evans, J.E.; Mackey, S.D.; Gottgens, J.F.; Gill, W.M. Lessons from a dam failure. Ohio J. Sci. 2000, 100, 121–131. [Google Scholar]
- Deangeli, C.; Giani, G.P.; Chiaia, B.; Fantilli, A.P. Dam Failures. In WIT Transactions on State-of-the-Art in Science and Engineering; WIT Press: Southampton, UK, 2009. [Google Scholar]
- Demissie, M.; Tsihrintzis, V.A.; Bogner, W.C.; Bhowmik, N.G. Scour Channel Development After Spillway Failure. J. Hydraul. Eng. 1988, 114, 844–860. [Google Scholar] [CrossRef]
- Koskinas, A.; Tegos, A.; Tsira, P.; Dimitriadis, P.; Iliopoulou, T.; Papanicolaou, P.; Koutsoyiannis, D.; Williamson, T. Insights into the Oroville Dam 2017 Spillway Incident. Geosciences 2019, 9, 37. [Google Scholar] [CrossRef] [Green Version]
- United States Bureau of Reclamation (Reclamation) (USBR). Guidelines for Defining Inundated Areas Downstream from Bureau of Reclamation Dams; Reclamation Planning Instruction No. 82-11; USBR: Washington, DC, USA, 1982.
- MacDonald, T.C.; Langridge-Monopolis, J. Breaching characteristics of dam failures. J. Hydraul. Eng. 1984, 110, 567–586. [Google Scholar] [CrossRef]
- Pierce, M.W.; Thornton, C.I.; Abt, S.R. Predicting peak outflow from breached embankment dams. J. Hydrol. Eng. 2010, 15, 338–349. [Google Scholar] [CrossRef] [Green Version]
- Soliman, A.; Bekhit, H.; Hamed, K.; El Zawahry, A. Prediction of dam breach parameters and their uncertainties. J. Eng. Appl. Sci. 2014, 61, 269–290. [Google Scholar]
- Nourani, V.; Mousavi, S. Evaluation of Earthen Dam-Breach Parameters and Resulting Flood Routing Case Study: Aidoghmosh Dam. Int. J. Agric. Innov. Res. 2013, 1, 109–115. [Google Scholar]
- Tegos, A.; Dooley, B.; Dimitriadis, P.; Raybould, M. Predictive empirical dam breach peak outflows—A global analysis and proposed updates. In Proceedings of the 21st BDS Conference on Dams and Reservoirs in a Climate Change, Nottingham, UK, 14–17 September 2022. [Google Scholar]
- Froehlich, D.C. Embankment dam breach parameters revisited. In Proceedings of the Conference on Water Resources Engineering, San Antonio, TX, USA, 14–18 August 1995; pp. 887–891. [Google Scholar]
- Froehlich, D.C. Embankment Dam Breach Parameters and Their Uncertainties. J. Hydraul. Eng. 2008, 134, 1708–1721. [Google Scholar] [CrossRef]
- Froehlich, D. Empirical model of embankment dam breaching. In Proceedings of the International Conference on Fluvial Hydraulics (River Flow 2016), St. Louis, MO, USA, 11–14 July 2016; pp. 1821–1829. [Google Scholar] [CrossRef]
- Xu, Y.; Zhang, L.M. Breaching Parameters for Earth and Rockfill Dams. J. Geotech. Geoenviron. Eng. 2009, 135, 1957–1970. [Google Scholar] [CrossRef]
- Moramarco, T.; Barbetta, S.; Pandolfo, C.; Tarpanelli, A.; Berni, N.; Morbidelli, R. Spillway Collapse of the Montedoglio Dam on the Tiber River, Central Italy: Data Collection and Event Analysis. J. Hydrol. Eng. 2014, 19, 1264–1270. [Google Scholar] [CrossRef]
- France, J.W.; Alvi, I.A.; Dickson, P.A.; Falvey, H.T.; Rigbey, S.J.; Trojanowski, J. Independent Forensic Team Report: Oroville Dam Spillway Incident; ASDSO and USSD: Lexington, KY, USA, 2018; pp. 1–584. [Google Scholar]
- Heidarzadeh, M. Whaley Bridge Dam Collapse Is a Wake-Up Call: Concrete Infrastructure Will Not Last Forever without Care, 2019. The Conversation. Available online: https://theconversation.com/whaley-bridge-dam-collapse-is-a-wake-up-call-concrete-infrastructure-will-not-last-forever-without-care-121423 (accessed on 28 December 2022).
- Balmforth, D. Toddbrook Reservoir Independent Review Report, 2020, 89 Pages. Available online: https://www.gov.uk/government/publications/toddbrookreservoir-incident-2019-independent-review (accessed on 28 December 2020).
- Hughes, A. Report on the Nature and Root Cause of the Toddbrook Reservoir Auxiliary Spillway Failure on 1st August 2019, 2020, p. 77. Available online: https://canalrivertrust.org.uk/refresh/media/thumbnail/41505-report-on-toddbrook-reservoir-by-dy-andrew-hughes.pdf (accessed on 30 December 2022).
- Mason, P.J. Toddbrook: The independent government review a forensic approach to causality. Dams Reserv. 2020, 30, 153–164. [Google Scholar] [CrossRef]
- Mehta, A.M.; Weeks, C.S.; Tyquin, E. Towards preparedness for dam failure: An evidence base for risk communication for downstream communities. Int. J. Disaster Risk Reduct. 2020, 50, 101820. [Google Scholar] [CrossRef]
- Allman, C.; Mould, D.J.; Bennett, N.; Rebollo, D.; Robson, R. Toddbrook Reservoir: A case study quantifying the importance of maintaining bywashes. Dams Reserv. 2020, 30, 173–180. [Google Scholar] [CrossRef]
- Lewis, R.; Scott, D.; Lockett, S. Toddbrook Reservoir event 6 July 2020. Dams Reserv. 2020, 30, 132–136. [Google Scholar] [CrossRef]
- Heidarzadeh, M.; Feizi, S. A cascading risk model for the failure of the concrete spillway of the Toddbrook dam, England during the August 2019 flooding. Int. J. Disaster Risk Reduct. 2022, 80, 103214. [Google Scholar] [CrossRef]
- Media Report on Swa Chaung Spillway Breech (August to October 2018). October 2018. pp. 1–20. Available online: https://www.google.com/url?sa=t&rct=j&q=&esrc=s&source=web&cd=&ved=2ahUKEwiNqYLgn6T-AhWagVYBHdDVCe0QFnoECAgQAQ&url=https%3A%2F%2Fwww.researchgate.net%2Fprofile%2FSandar-Tin-Shwe%2Fproject%2FMyanmar-Agriculture-Development-Support-Project%2Fattachment%2F5cc011283843b01b9b9c2c40%2FAS%3A751114987257857%401556091176286%2Fdownload%2FMedia%2Beport%2Bon%2BSwa%2BSpillway%2BBreech.pdf%3Fcontext%3DProjectUpdatesLog&usg=AOvVaw1GRmvU8TRRuU7zz9RH0q-W (accessed on 18 August 2022).
- Japan Aerospace Exploration Agency. ALOS World 3D 30 meter DEM. V3.2, January 2021. Distributed by Open Topogra-Phy. 2021. Available online: https://doi.org/10.5069/G94M92HB (accessed on 22 May 2022).
- Available online: https://asf.alaska.edu/data-sets/sar-data-sets/sentinel-1/ (accessed on 24 May 2022).
- Available online: https://opengislab.com/blog/2018/5/14/flood-mapping-with-sentinel-1-data-using-snap-and-qgis (accessed on 25 May 2022).
- Available online: https://step.esa.int/main/snap-8-0-released/ (accessed on 25 May 2022).
- Wahl, T.L. Evaluation of Erodibility-Based Embankment Dam Breach Equations. June 2014. pp. 1–99. Available online: https://www.usbr.gov/tsc/techreferences/hydraulics_lab/pubs/HL/HL-2014-02.pdf (accessed on 18 August 2022).
- Wahl, T.L. Prediction of Embankment Dam Breach Parameters—A Literature Review and Needs Assesment. Water Resources Research, DSO-98-004 (July). 1998. p. 67. Available online: http://www.usbr.gov/pmts/hydraulics_lab/pubs/DSO/DSO-98-004.pdf (accessed on 18 August 2022).
- Wahl, T.; Bureau, U.S. Breach Parameter Prediction Methods and the Need for and Potential Benefits of Improved Breach Models. In Proceedings of the International Dam Breach Processes Workshop, Agricultural Research Service, Stillwater, OK, USA, 10–11 March 1998. [Google Scholar]
- USBR. Prediction of Embankment Dam Breach Parameters a Literature Review and Needs Assessment; Dam Safety Research Report; Bureau of Reclamation Dam Safety Office: Denver, CO, USA, 1998.
- Kostecki, S.; Banasiak, R. The Catastrophe of the Niedów Dam—The Causes of the Dam’s Breach, Its Development, and Consequences. Water 2021, 13, 3254. [Google Scholar] [CrossRef]
- Mao, J.; Wang, S.; Ni, J.; Xi, C.; Wang, J. Management System for Dam-Break Hazard Mapping in a Complex Basin Environment. ISPRS Int. J. Geo-Inf. 2017, 6, 162. [Google Scholar] [CrossRef] [Green Version]
- Yudianto, D.; Ginting, B.; Sanjaya, S.; Rusli, S.; Wicaksono, A. A Framework of Dam-Break Hazard Risk Mapping for a Data-Sparse Region in Indonesia. ISPRS Int. J. Geo-Inf. 2021, 10, 110. [Google Scholar] [CrossRef]
- Wahl, T.L. Uncertainty of Predictions of Embankment Dam Breach Parameters. J. Hydraul. Eng. 2004, 130, 389–397. [Google Scholar] [CrossRef]
- Prediction of Dam Leakage Using Machine Learning. Available online: https://repository.dl.itc.u-tokyo.ac.jp/record/54668/files/0057_202007081617.pdf (accessed on 30 December 2022).
- Ferdowsi, A.; Nemati, M.; Farzin, S. Development of Dam-Break Model Considering Real Case Studies with Asym-metric Reservoirs. Comput. Eng. Phys. Model. 2021, 4, 39–63. [Google Scholar] [CrossRef]


| Equation Developer | Average Breach Width (m) | Failure Time (h) | Peak Outflow(m3/s) |
|---|---|---|---|
| Bureau of reclamation (1982) [17] | Bavg = 3 Hw | Tf = 0.011 Bavg | Qp = 19.1 (Hw)1.85 |
| MacDonald et al. (1984) [18] | Bavg = Ver/(Wavg Hb) | Tf = 0.0179 Ver0.364 | Qp = 1.154 (VwHw)0.412 |
| Ver = 0.0261(Vw Hw)0.769 | |||
| Pierce et al. (2010) [19] | Qp = 0.863 Vw0.335 Hb1.833 Wavg−0.663 | ||
| Soliman (2015) [20] | Bavg = 48.644 V0.275 Wavg−0.086 | Tf = 0.15 + 1.865 H−0.675 V0.408 | |
| Shahram et al. (2013) [21] | Bavg = 2.2839 Vw0.0635 Hb0.8481 | Qp = 0.06577 g0.5 Vw0.2649 Hw1.7053 | |
| Tegos et al. (2022) [22] | Qp = (H/0.011) 0.706 (Bavg/3.321)0.332 (V/0.048) 0.229 |
| Equation Developer | Average Breach Width | Failure Time | Peak Outflow |
|---|---|---|---|
| Froehlich (1995) [23] | Bavg = 0.1803 K0 Vw 0.32 Hb0.19 | Tf = 0.00254 Vw 0.53 Hb−0.9 | Qp = 0.607 × Vw 0.295 Hw1.24 |
| Froehlich (2008) [24] | Bavg = 0.27 K0 Vw 0.32 Hb0.04 | Tf = 63.2 √ Vw/gHb2 | |
| Froehlich (2016) [25] | Bavg = 0.28 Km Kh Vw1/3 Wavg−1/6 Hb1/6 | Tf = 50√Vw/gHb2 Wavg/Hb1/4 | Qp = 0.0175 Km Kh (gVw Hb2 Hw/Wavg)0.5 |
| Xu and Zhang (2009) [26] | Bavg/Hb = 0.787(H/Hr)0.133(Vw 1/3/Hw)0.652 eb3+b4+b5 | Tf/Tr = 0.304(H/Hr)0.707(Vw 1/3/Hw)1.228 eb3+b4+b5 | Qp/√Vw5/3g = 0.175(H/Hr)0.199(Vw1/3/Hw)−1.274 eb3+b4+b5 |
| Investigator | Average Breach Width, Bavg (m) | Failure Time, Tf (h) | Peak Outflow, Qp (m3/s) | |||
|---|---|---|---|---|---|---|
| Scenario 1 | Scenario 2 | Scenario 1 | Scenario 2 | Scenario 1 | Scenario 2 | |
| Bureau of Reclamation (1982) [17] | 66.6 | 0.73 | 5913 | |||
| MacDonald et al. (1984) [18] | 236.7 | 2.61 | 12,436 | |||
| Pierce et al. (2010) [19] | 5406 | |||||
| Soliman (2015) [20] | 145.3 | 2.0 | ||||
| Shahram et al. (2013) [21] | 106.6 | 7009 | ||||
| Tegos et al. (2022) [22] | 6094 | |||||
| Froehlich (1995) [23] | 211.34 | 162.57 | 4.74 | 8767 | ||
| Froehlich (2008) [24] | 214.85 | 153.46 | 4.3 | |||
| Froehlich (2016) [25] | 193.92 | 129.24 | 5.7 | 7988 | 4318 | |
| Xu and Zhang (2009) [26] (concrete-faced, low erodibility) | 135.6 | 79.28 | 15.75 | 15.26 | 6426 | 3239 |
| Xu and Zhang (2009) [26] (concrete-faced, medium erodibility) | 174.3 | 101.89 | 5.02 | 4.86 | 17,242 | 8692 |
| Xu and Zhang (2009) [26] (concrete-faced, high erodibility) | 268.3 | 156.79 | 2.65 | 2.56 | 24,912 | 12,558 |
| Xu and Zhang (2009) [26] (homogeneous earthen, low erodibility) | 105.4 | 61.62 | 25.59 | 24.78 | 6064 | 3057 |
| Xu and Zhang (2009) [26] (homogeneous earthen, medium erodibility) | 135.5 | 79.1 | 8.16 | 7.9 | 16,271 | 8202 |
| Xu and Zhang (2009) [26] (homogeneous earthen, high erodibility) | 208.5 | 121.87 | 4.3 | 4.16 | 23,509 | 11,850 |
| Swa dam | 110.33 | 4.0 | 7642.8 | |||
Disclaimer/Publisher’s Note: The statements, opinions and data contained in all publications are solely those of the individual author(s) and contributor(s) and not of MDPI and/or the editor(s). MDPI and/or the editor(s) disclaim responsibility for any injury to people or property resulting from any ideas, methods, instructions or products referred to in the content. |
© 2023 by the authors. Licensee MDPI, Basel, Switzerland. This article is an open access article distributed under the terms and conditions of the Creative Commons Attribution (CC BY) license (https://creativecommons.org/licenses/by/4.0/).
Share and Cite
Kyaw, P.P.S.S.; Uchida, T. Assessment of the Breaching Event, Breach Parameters and Failure Mechanisms of the Spillway Collapse in the Swa Dam, Myanmar. Water 2023, 15, 1513. https://doi.org/10.3390/w15081513
Kyaw PPSS, Uchida T. Assessment of the Breaching Event, Breach Parameters and Failure Mechanisms of the Spillway Collapse in the Swa Dam, Myanmar. Water. 2023; 15(8):1513. https://doi.org/10.3390/w15081513
Chicago/Turabian StyleKyaw, Pa Pa Shwe Sin, and Taro Uchida. 2023. "Assessment of the Breaching Event, Breach Parameters and Failure Mechanisms of the Spillway Collapse in the Swa Dam, Myanmar" Water 15, no. 8: 1513. https://doi.org/10.3390/w15081513
APA StyleKyaw, P. P. S. S., & Uchida, T. (2023). Assessment of the Breaching Event, Breach Parameters and Failure Mechanisms of the Spillway Collapse in the Swa Dam, Myanmar. Water, 15(8), 1513. https://doi.org/10.3390/w15081513