Article

Spatiotemporal Variability and Impact Factors of Domestic Water Prices in China

1
Center of Water Resources and Environment, School of Civil Engineering, Sun Yat-sen University, Guangzhou 510275, China
2
Center of Water Security Engineering and Technology in Southern China of Guangdong, Guangzhou 510275, China
3
Guangdong Laboratory of Southern Ocean Science and Engineering, Zhuhai 519000, China
4
Department of Biological and Agricultural Engineering, Texas A&M University, 2117 TAMU, College Station, TX 77843, USA
5
Zachry Department of Civil & Environmental Engineering, Texas A&M University, 2117 TAMU, College Station, TX 77843, USA
6
National Water & Energy Center, UAE University, Al Ain P.O. Box 15551, United Arab Emirates
7
Shenzhen Branch of Guangdong Hehai Engineering Consulting Limited Company, Shenzhen 518000, China
*
Author to whom correspondence should be addressed.
Water 2024, 16(1), 115; https://doi.org/10.3390/w16010115
Submission received: 27 October 2023 / Revised: 13 December 2023 / Accepted: 26 December 2023 / Published: 28 December 2023
(This article belongs to the Topic Hydrology and Water Resources Management)

Abstract

:
Given China’s status as one of the most water-scarce countries globally, its rapid development of urbanization and sustained economic growth have led to increasing pressure on the urban water supply. Water pricing is also receiving increasing attention as an important tool for water resource management. This study analyzes the spatial and temporal characteristics of domestic water prices in China and their drivers. To this end, domestic water price data from 285 cities in China were collected. Spatial statistical analysis and geodetector were used to examine the spatial distribution and temporal patterns of domestic water prices from 2007 to 2020, as well as to identify the primary factors influencing these prices. The following results are noted: (1) The national average domestic water price has increased from 2 RMB/m3 to 3.12 RMB/m3, where the northeast and eastern regions have higher prices than the national average, while the central and western regions have lower prices. (2) The spatial distribution of urban domestic water prices presents clear differences characteristic of north–south and spatial agglomeration effects; the high-value area of domestic water prices is mainly concentrated in Beijing–Tianjin–Hebei. (3) On a national and regional scale, the price of domestic water is closely related to economic development, water resources, and resident’s income level. Furthermore, this study revealed that the interaction between pairwise factors played a more significant role in influencing domestic water prices compared with the individual impact of each factor. This finding contributes to a deeper understanding of the spatiotemporal heterogeneity in domestic water pricing and offers valuable insights and guidance for water pricing reform in China.

1. Introduction

Water is a vital resource for human survival and socio-economic development, but increasing demand and overexploitation present significant challenges to its sustainable management [1,2]. Especially in China, where the amount of available water per capita is only a quarter of the world average [3,4], water scarcity poses a significant threat to sustainable development [5]. At the same time, the uneven distribution and pollution of water resources pose challenges to the quality and quantity of the urban water supply [6,7]. As a result, ensuring a reliable supply of safe and affordable water to urban residents has become a top priority for Chinese policymakers [8]. Pricing is widely regarded as a crucial tool to achieve this goal [9]. However, determining the appropriate pricing of water resources is a complex and controversial issue, as it involves balancing economic, social, and environmental factors [10,11,12]. Therefore, understanding changes and potential drivers of domestic water prices will be of benefit in the task of promoting sustainable water use and management, which is essential for achieving China’s long-term economic and environmental goals [13].
Managing water as an economic good is pivotal for promoting effective and equitable utilization, as well as encouraging conservation [14,15]. There are heterogeneous responses to prices among different water users [16]. Water pricing serves not just as a revenue source but also as a means to signify the scarcity of water resources [17]. However, it is vital to balance this with affordability for residents, given water’s essential role in human survival. Without this balance, higher water prices may face resistance from both the government and the public, diminishing their effectiveness [18]. Generating sufficient revenue is essential for meeting the goals of water-pricing policies and sustainable development [19]. Moreover, if water is regarded as a public good and water services as a public service, efforts to improve enterprise efficiency must be paired with equity considerations for local residents [20]. Recent years have seen factors like climate change [21], water accessibility [22], and hydrologic information [23] become increasingly incorporated into the water pricing framework. Yet, the drivers of water price variability across cities have received limited attention.
In China, a comprehensive and advanced policy framework has been established for water management [24]. The evolution of China’s water pricing mechanism has progressed through various stages: initially offering free water for public welfare, then transitioning to a policy-driven low-priced water supply, followed by charges based on water supply costs, and ultimately adopting a commodity water supply price management system [25]. The 2021 Measures for the Administration of Urban Water Supply Prices mandate cost monitoring as the foundation for setting permitted revenues. This is achieved by approving costs, regulating returns, and determining water supply prices based on the approved volume of water supplied. These prices also take into account factors such as the local water supply business’s development needs, water conservation promotion, community affordability, and service quality.
An Increasing Block Rate (IBR) price structure is used in China, where the first block water price is principally based on compensation cost levels and considers the current period production capacity utilization [26]. Although these policies have been somewhat effective in fulfilling their objectives, challenges persist in their implementation and compliance [27]. In China, domestic water prices are independently set by pricing regulators in each city, leading to significant disparities in water prices across various prefecture-level cities. The factors contributing to these differences have not been extensively explored.
To evaluate whether the current water pricing is appropriately determined, it is necessary to understand the key driving factors behind the formulation of water prices [20]. However, little is known about the spatial and temporal dynamics of domestic water prices in Chinese cities and the underlying factors that drive these changes. When examining the relationship between water prices and their driving factors, correlation analysis methods are commonly used [28,29,30] and spatial autoregressive estimation [18] are frequently utilized. However, these methods are rarely used to explore the interaction characteristics among variables [31]. Geodetector is a novel statistical method whose core idea is to detect the consistency in the spatial pattern distribution between independent and dependent variables based on spatial heterogeneity, which avoids the problem of multicollinearity [32]. The geodetector method can detect both the global drivers [33] and the local drivers [34] in different regions, as well as temporal variations in these drivers [35,36,37]. Because of its distinct advantages, this method has been widely applied in various fields such as disaster and health risk assessments [38,39], environmental protection [33,40,41,42], and residential land prices [43] to investigate the impact mechanisms and interactions of driving factors.
The main research questions addressed in this study are as follows: (1) What are the spatial and temporal patterns of domestic water prices in Chinese cities? (2) What are the main drivers of changes in domestic water prices across locations? (3) How do socioeconomic and environmental factors affect domestic water prices in different regions of China? Effective water resource management requires evidence-based policymaking that takes into account the complex interactions between water prices, environmental factors, and socioeconomic factors. Studying the spatial and temporal patterns in water prices and the underlying driving factors can provide valuable insights into the effectiveness of current policies and the need for implementing new policy measures to improve water resource management in Chinese cities.

2. Data and Methodology

2.1. Study Areas and Data

For this study, data from 285 prefecture-level cities in mainland China were utilized (Figure 1) from 2007 to 2020. Hong Kong, Macau, Taiwan, and other cities, particularly in western China, were excluded due to the unavailability of relevant data. In this paper, “cities” refers to prefecture-level cities in China. They constitute the second level of administrative structure, located below the province and above the county level. Prefecture-level cities consist of multiple districts, county-level cities, and counties. In 2007, there were 285 prefecture-level cities in China. To maintain consistency, this study used 285 cities in 2007.
In the present study, data for six statistical indicators were selected, which involved cost compensation, affordability, and other objectives that are mainly considered in the formulation of water prices, and thus can better reflect or affect the domestic water prices in various cities in China and establish a corresponding statistical indicator body. These 6 statistical indicators, respectively, include regional water resources conditions, water demand, economic development level, and water supply capacity. Noteworthy, the influencing factors of domestic water prices are complicated. The indicators selected in this paper are not all the influencing factors of water price, but the first factors we consider. Table 1 summarizes the descriptive statistics of the above variables.
Data on urban residential water prices were collected from China Water Net (https://www.h2o-china.com/) and the official websites of each city’s government. The data were verified by examining available government documents on domestic water price adjustments. Information on the water resources of prefecture-level cities, GDP of prefecture-level cities, and urban population were obtained from the China Statistical Yearbook. City-level characteristics, including urban water supply and annual urban domestic water consumption, were acquired from the China Urban Statistical Yearbook and the China Urban Construction Statistical Yearbook. Data on urban household disposable income per capita were obtained from the Provincial Statistical Yearbooks. Since the water prices set by a municipality mainly concern the urban water companies that supply water to the urban center, the water price data we used in our analysis were urban center data.

2.2. Spatial Autocorrelation Model

Spatial dependence refers to a phenomenon where observations in space are not completely isolated but exhibit some level of correlation with neighboring spatial units [44]. Moran’s I [45] is the most common index in spatial analysis.
Global Moran’s I is the most commonly used statistical measure for testing whether there is spatial dependence in the observed data. Moran’s I takes the range [−1, 1], where “−1” indicates a complete negative autocorrelation, “1” indicates a complete positive autocorrelation, and “0” indicates perfect spatial randomness [46]. The p -value is considered as an index to determine the reliability of Moran’s I [47]. The formula for Moran’s I is as follows:
  I = i = 1 n j = 1 n ( Y i Y ¯ ) ( Y j Y ¯ ) S 2 i = 1 n j = 1 n w i j
S 2 = 1 n i = 1 n Y i Y ¯ 2
Y ¯ = 1 n i = 1 n Y i
where n is the total number of regions, Y indicates the value of the attribute, and w i j denotes the spatial weight matrix. If spatial cells i and j have common edges, then w i j = 1 ; otherwise, w i j = 0 . The z -value was used to assess the statistical significance of Moran’s I . The z -value of the statistic was computed as:
z = I Ε I V A R I
Ε I = 1 n 1
V A R I = Ε I 2 Ε I 2
Global Moran’s I cannot indicate whether the domestic water price of each city is correlated with that of its neighboring cities, so, to further explore the spatial aggregation and dispersion effects of domestic water prices, the local indicator of spatial association (LISA) [48] was computed using Equation (7):
I i = Y i Y ¯ i = 1 n Y i Y ¯ 2 j = 1 n w i j Y j Y ¯
where w i j   has the same meaning as above. The LISA spatial pattern consists of five cluster types: low–low (L-L), high–low (H-L), low–high (L-H), high–high (H-H), and insignificant. H-H and L-L indicate that a city with high (low) domestic water prices is located in areas with similarly high (low) prices. Meanwhile, H-L and L-H indicate that high (low) domestic water prices are in a low (high)-price neighborhood [49].

2.3. Geodetector Model

Geodetector is a statistical method that identifies spatial divergence and uncovers the drivers responsible for it [38]. The underlying idea is that, assuming the study area is divided into a number of sub-regions, spatial heterogeneity exists if the sum of the variances of the sub-regions is smaller than the total variance of the region; if the spatial distribution of the two variables converges, a statistical correlation exists between them [50]. In this paper, the geodetector method was used to analyze the factors influencing the spatial distribution of domestic water prices and to detect the interaction effects among these factors in 285 cities in China.
(1) The factor detection module detects the extent to which factor X influences the spatial differentiation in the Y attributes. It is calculated using the following equation [50]:
q = 1 h = 1 L i = 1 N h ( Y i h Y h ¯ ) 2 i = 1 N ( Y i Y ¯ ) 2 = 1 1 n σ 2 h = 1 L n h σ h 2 = 1 S S W S S T , q 0 , 1
S S T = i N ( Y i Y ¯ ) 2 = N σ 2 ,
S S W = h = 1 L i N h ( Y i h Y h ¯ ) 2 = h = 1 L N h σ h 2 ,
where h = 1 , 2 , , L is the strata of variable Y or factor X ; n stands for the number of units; σ represents the variance in Y in a study area; n h is the number of units; σ h is the variance in Y in the stratum; S S W is the within sum of squares; S S T is the total sum of squares; and q indicates that X explains 100% × q of Y . The scope of q is [0,1], where a larger value of q indicates a stronger explanatory power of the independent variable X on the attribute Y , and a smaller value of q suggests a weaker explanatory power. Generally, when q 0.3 , it indicates that there is a relatively strong explanatory power [51].
(2) The interaction detection module in geodetector determines whether there is an interaction between two factors and assesses the strength, direction, linearity, or nonlinearity of the interaction. This is performed by calculating and comparing the q -values of each single factor and the q -values of the two factors superimposed separately. By analyzing these values, geodetector can identify the presence and characteristics of interactions between factors [50].
The strata of Y are the division of Y itself or an explanatory variable X , which is a categorical variable. X should be stratified if it is a numerical variable, and the number of strata L might be 2–10 or more, depending on prior knowledge or a categorization algorithm [50]. In this study, the optimal parameter-based geographical detector (OPGD) model developed by Song et al. [52] was used to optimize the spatial data discretization process instead of relying on subjective experience. The OPGD model selects the optimal combination of the discretization method and the number of breakpoints as optimal discretization parameters for each geographically continuous variable using the highest q -value computed with the factor detector [52].

3. Results

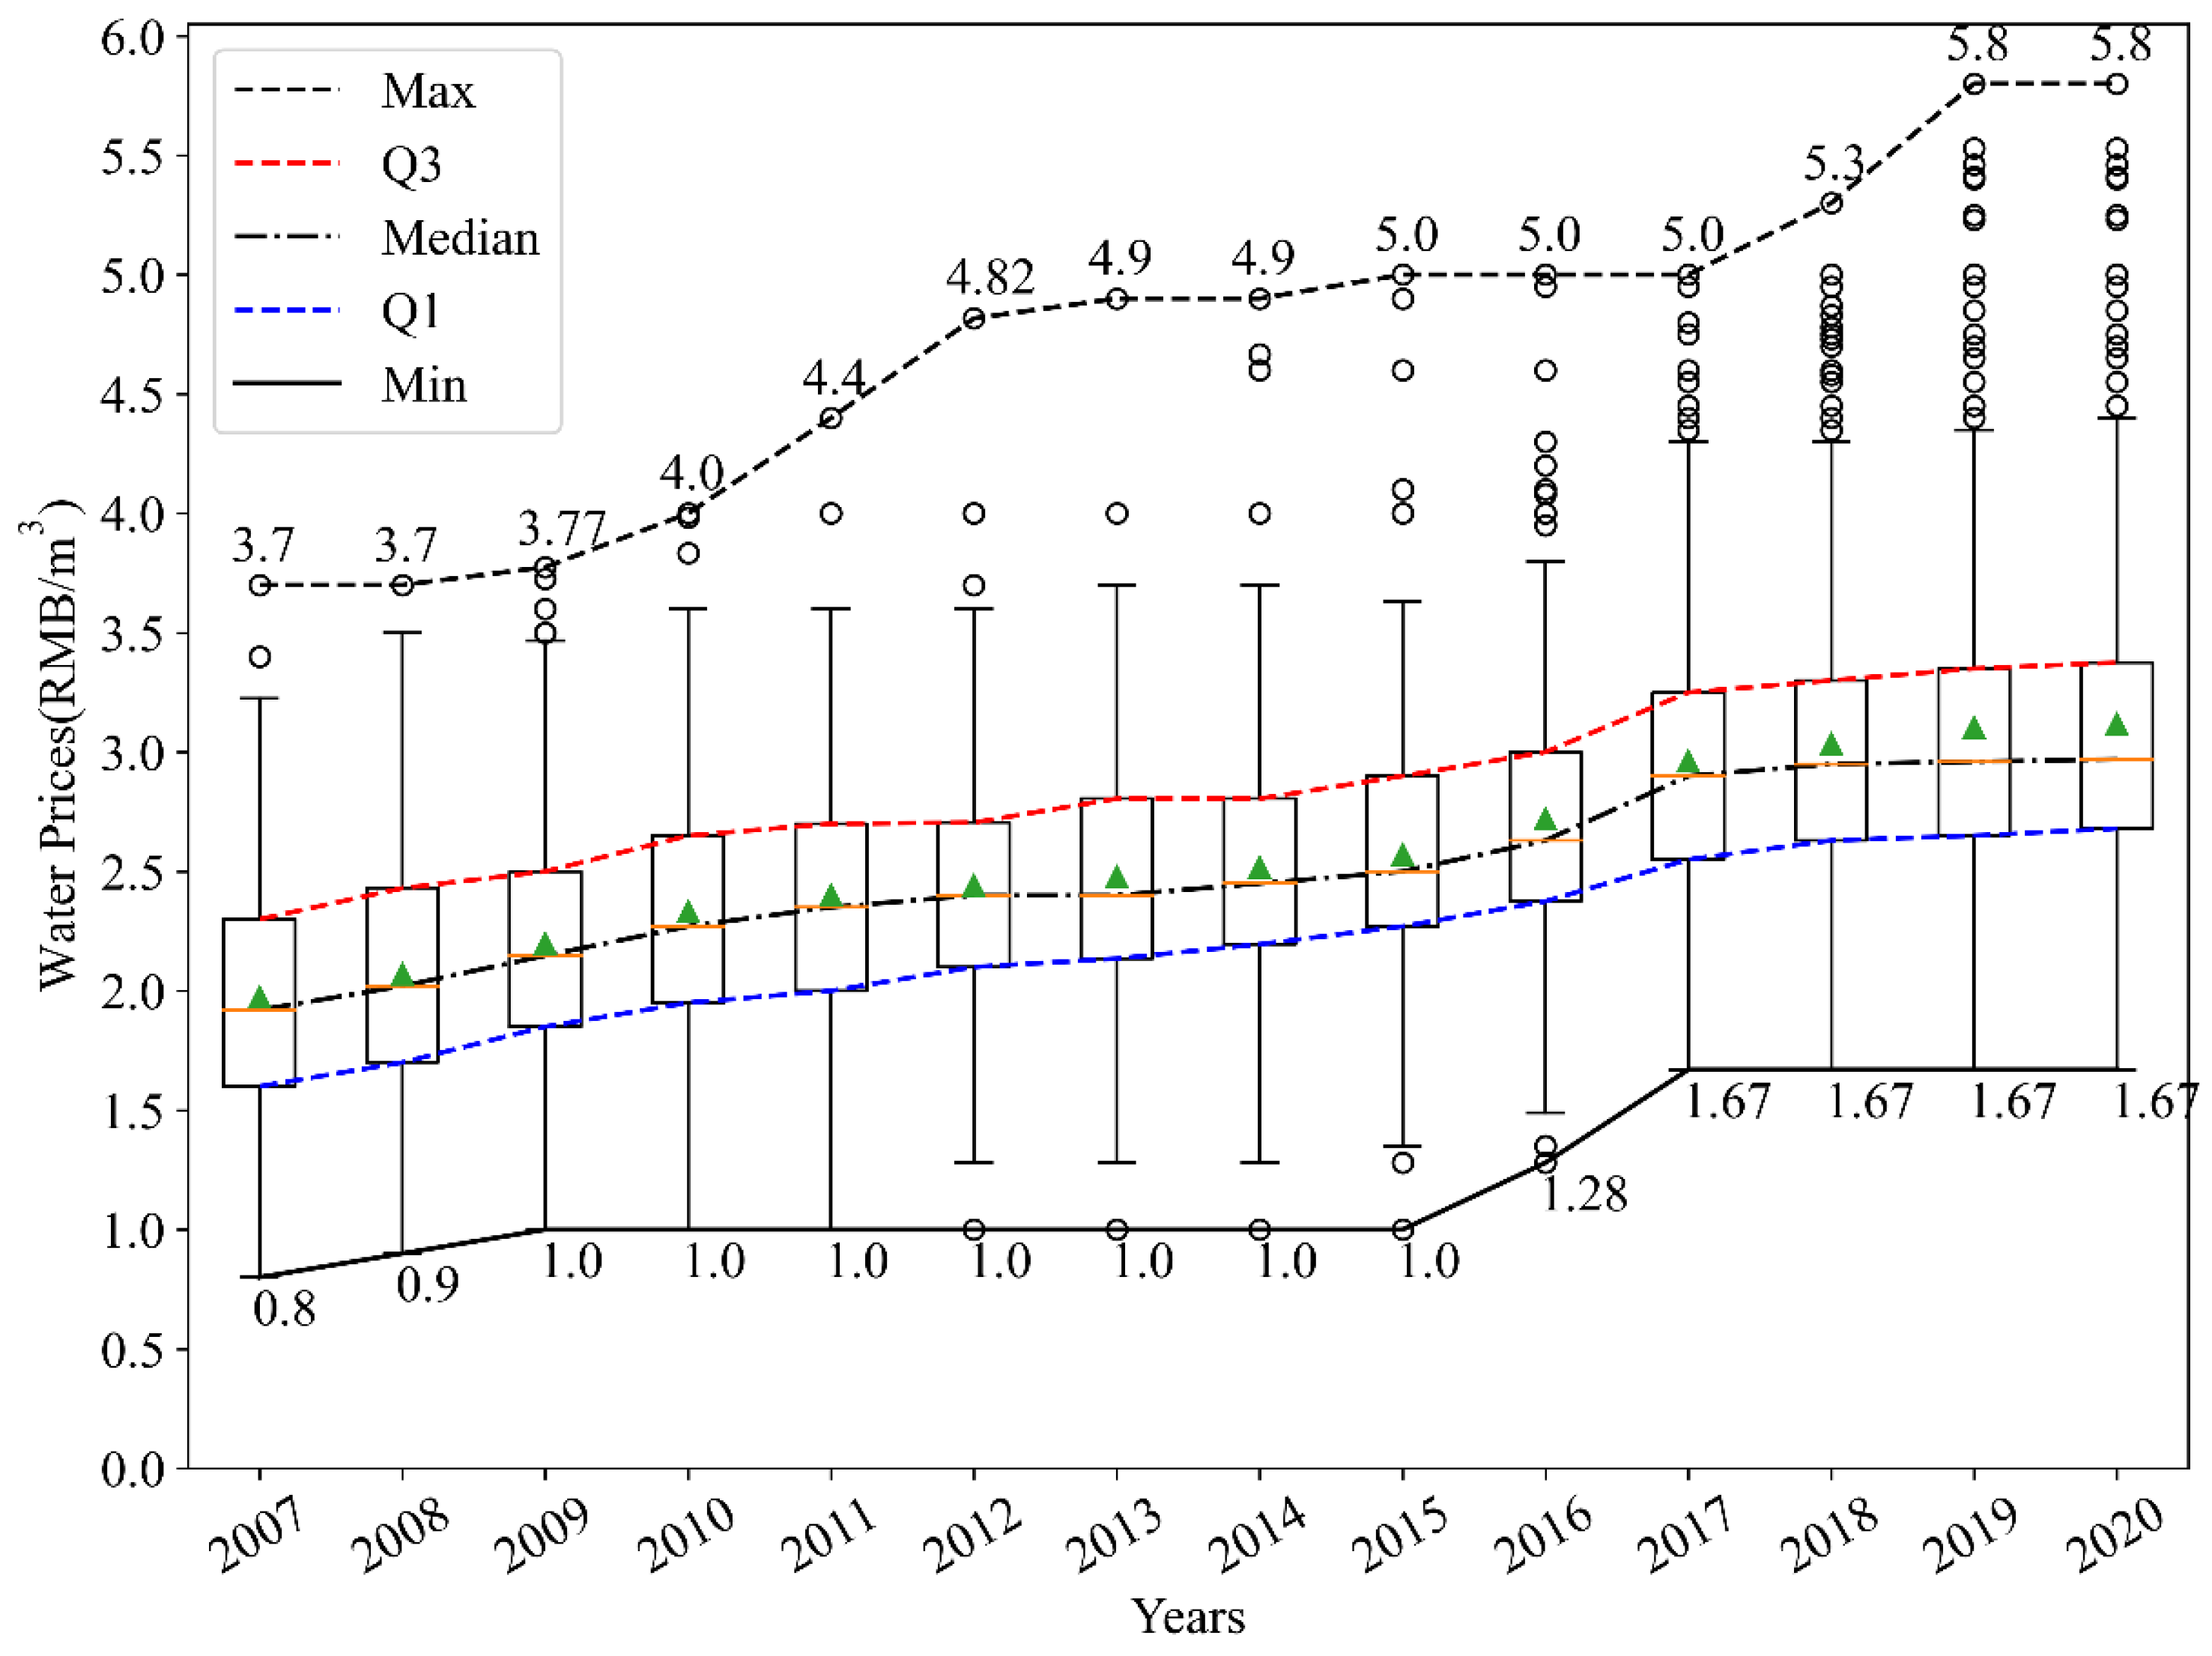
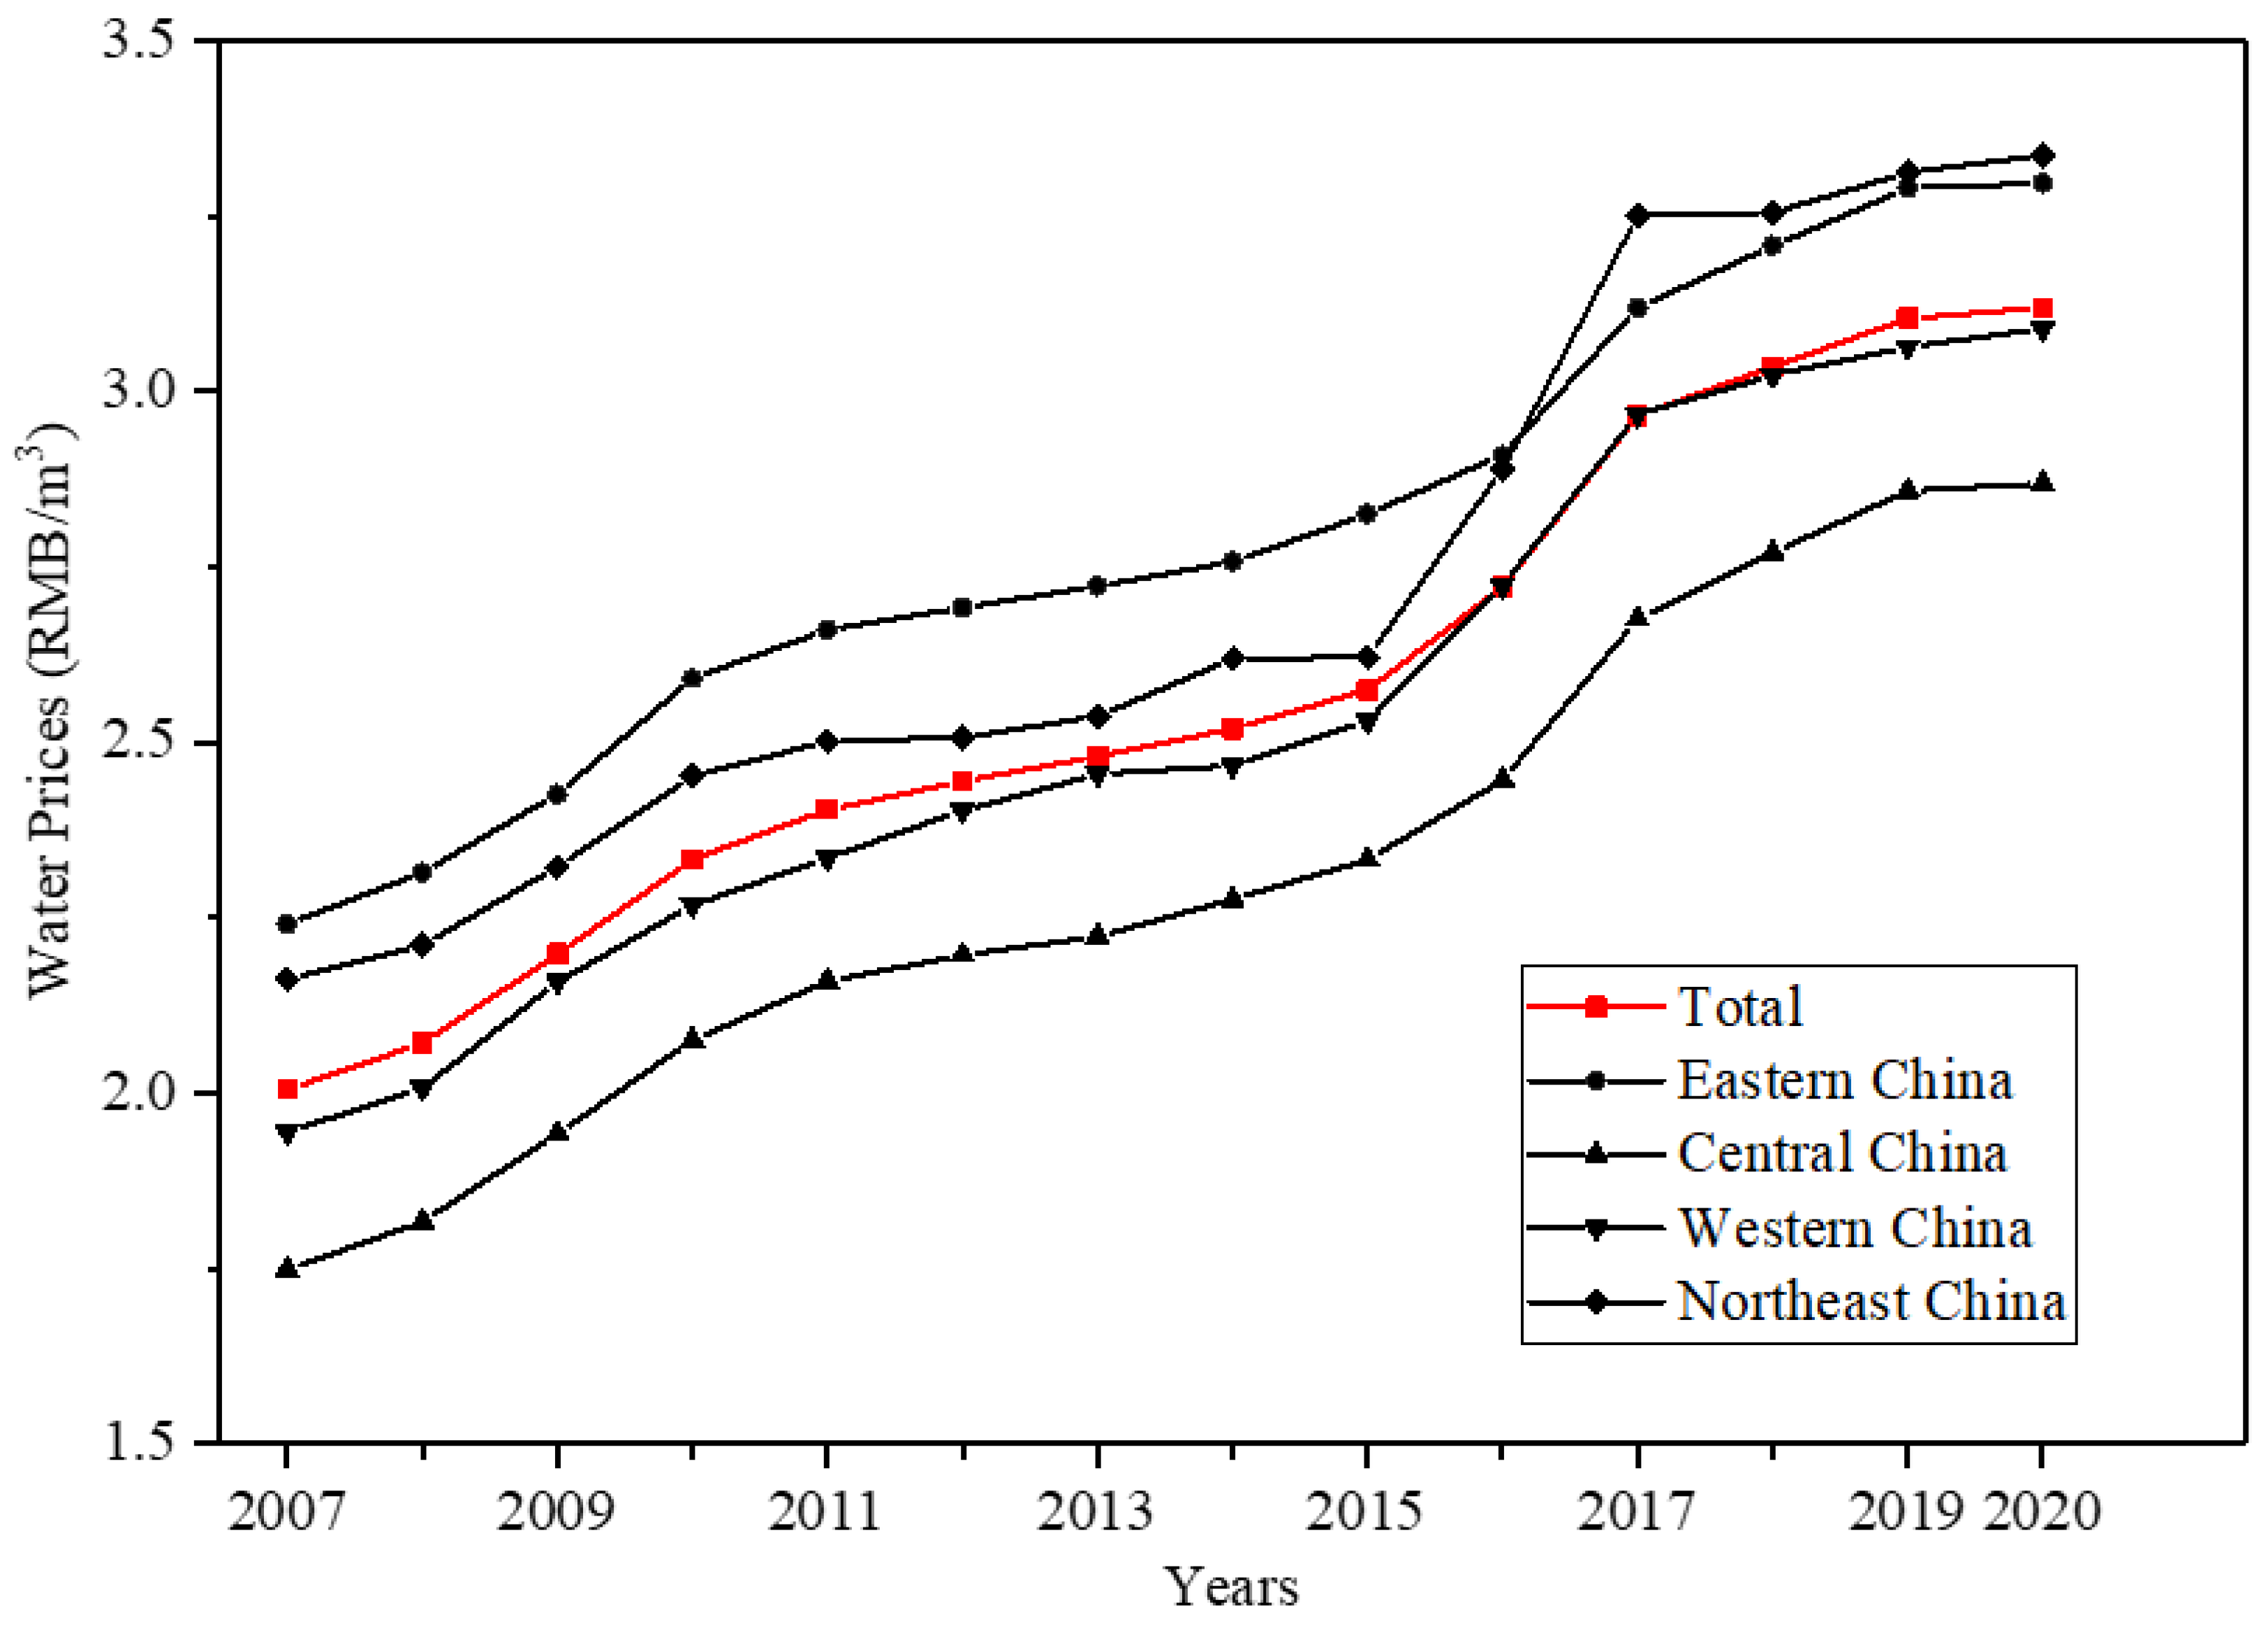
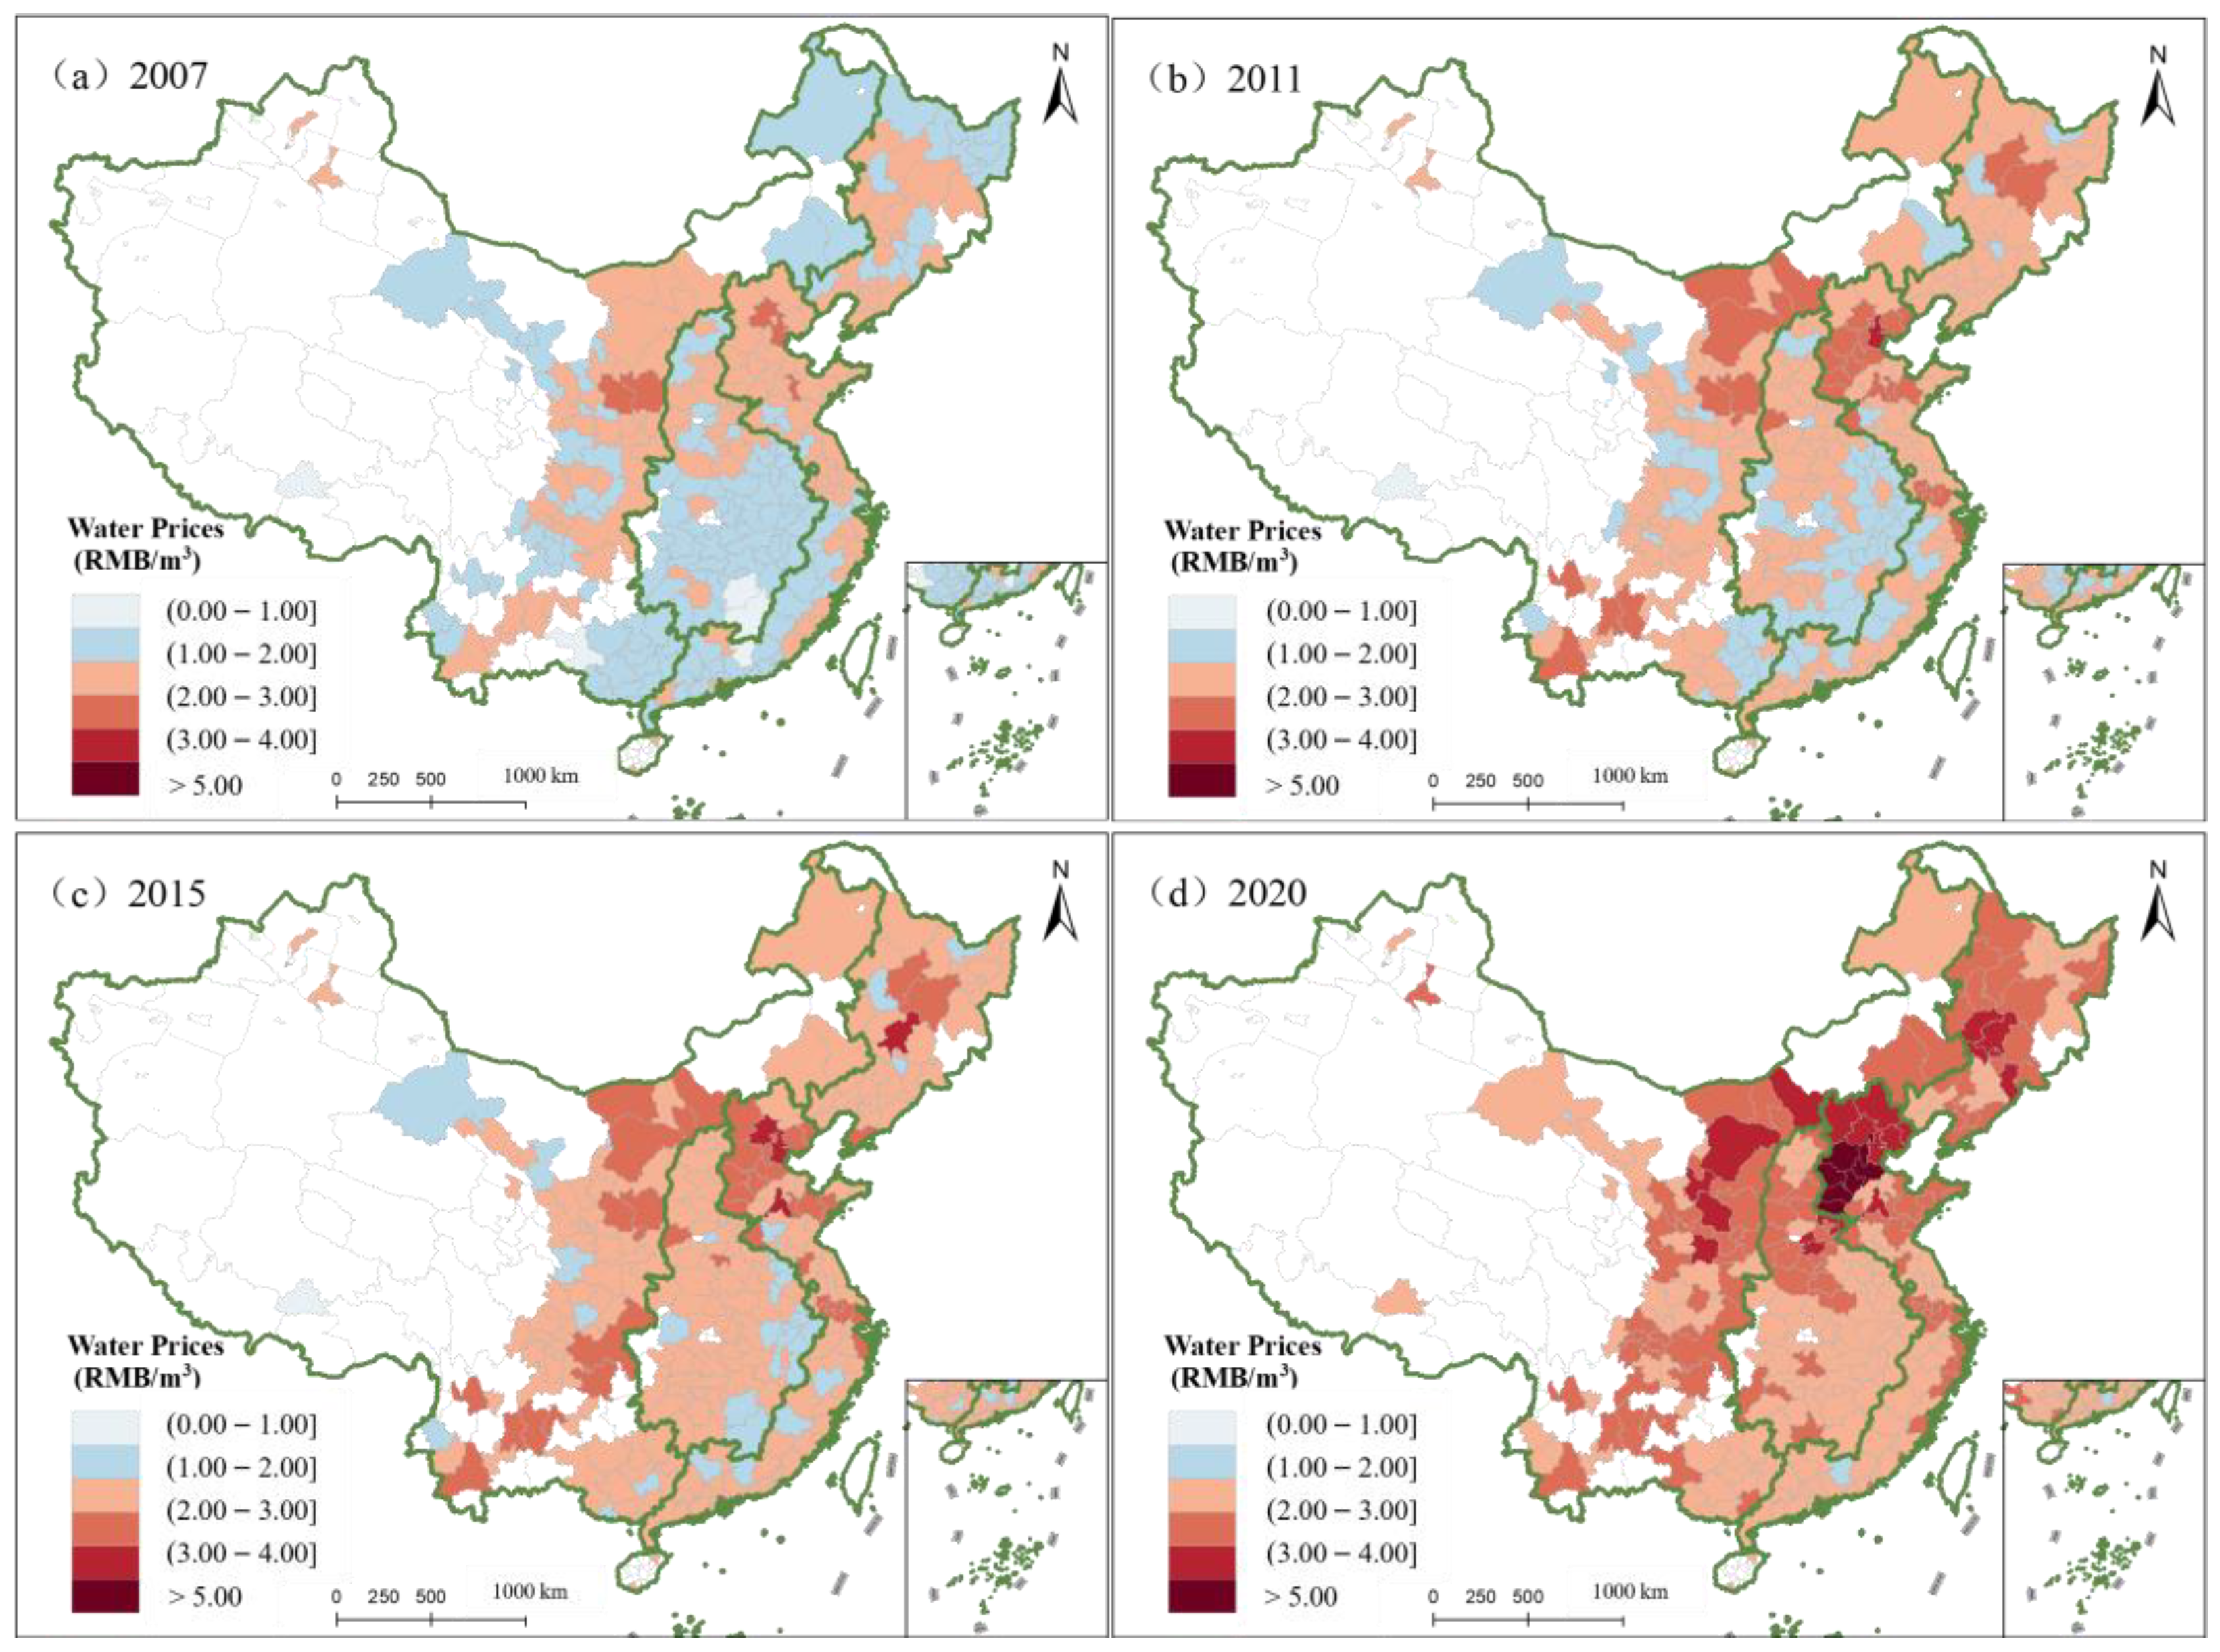
3.1. Spatial-Temporal Changes in Domestic Water Prices

To further explore the temporal dynamics in domestic water prices, this research analyzed the yearly variations in domestic water prices of the 285 prefecture cities with boxplots (Figure 2). China’s urban domestic water prices rose steadily from 2007 to 2020, with an average annual growth rate of 3.5%. At the end of 2020, the minimum domestic water price in cities nationwide was 1.67 RMB/m3, an increase of 109% compared to 2007. The average domestic water prices of urban residents also increased from 2 RMB/m3 in 2007 to 3.12 RMB/m3 in 2020, a rise of 55.54%. Furthermore, after 2016, the outliers were mainly concentrated on the larger side, and the distribution of water prices showed a right-skewed state.
All prefecture-level cities were divided into four areas based on their location. The trends in the average value of domestic water prices in different regions are illustrated in Figure 3, which shows that the average domestic water prices in the central and northeastern regions over the years were higher than the average for the country, while the central region had the lowest prices. There existed a phenomenon in which domestic water prices had significant spatial disparities among different regions. A noticeable increase in urban water prices across various regions was observed from 2015 to 2017. This surge can be attributed to the Chinese government’s directive in 2015, which mandated that, in principle, the municipal sewage treatment charge standard should be adjusted to not less than 0.95 RMB/m3 for urban residents by the end of 2016. The analysis reveals a close correlation between residential water prices and national policy regulation.
During the study period, water price adjustments were made in a total of 284 cities, with Zibo being the sole exception. Figure 4 shows the number of cities that adjusted their water prices each year. Urban residential water price adjustments were most active in 2008–2010 and 2016–2017. It can be seen that each city also actively adjusted domestic water prices to customize them more reasonably in line with the characteristics of the city. At the same time, the differences in the degree of activity of domestic water prices adjustment and the large differences in domestic water prices between cities reflect the unevenness of water price-collection standards in each region, so studying the laws of change and the factors affecting the differences is conducive to the development of better water pricing policies.
Variations in water pricing policies, water resources, and environmental conditions, as well as economic development levels across different regions, have led to significant regional disparities in China’s water pricing standards. Figure 5 shows the distribution of domestic water prices in 2007, 2011, 2015, and 2020. It shows that in 2007, the water prices in China were generally low in 2007, with only four cities (Beijing, Tianjin, Yan’an, and Zibo) having domestic water prices higher than RMB 3 per cubic meter, all of which were located in the north. However, there were still five cities (Ji’an, Baise, Heyuan, Lhasa and Anqing) whose water prices were lower than RMB 1 per cubic meter. After 2011, the majority of domestic water prices in most cities ranged from RMB 2 to 4 per cubic meter, indicating a generally low level of pricing. By 2020, the annual average water prices in the 285 cities exceeded RMB 3.12 per cubic meter. It is evident that city-level water prices generally decreased from north to south, with the top ten cities with the highest water prices in 2020 being located in northern China regions, such as Cangzhou (5.80), Baoding (5.53), Handan (5.46), Shijiazhuang (5.23), and Beijing (5.00). In contrast, municipalities characterized by lower domestic water prices were predominantly found in underdeveloped regions or areas with ample water resources, encompassing cities located in the southern, northwestern, and southwestern parts of China. The spatial distribution of domestic water prices is closely associated with regional development patterns and water resources. Overall, the price of water in northern cities is higher than that in southern cities, indicating a regional concentration phenomenon.
Furthermore, this study spatially visualized the absolute increase in domestic water prices from 2007 to 2020, as shown in Figure 6. The results show that nearly 95% of the cities did not increase their water prices by more than RMB 2, compared with only two cities that increased their prices by more than RMB 3. Overall, domestic water prices were increasing at a moderate rate in most cities in China, where Hebei Province experienced the largest price increases due to rising raw water fees from south-to-north water transfer, and most cities in the eastern region experienced slowed growth due to their large base.

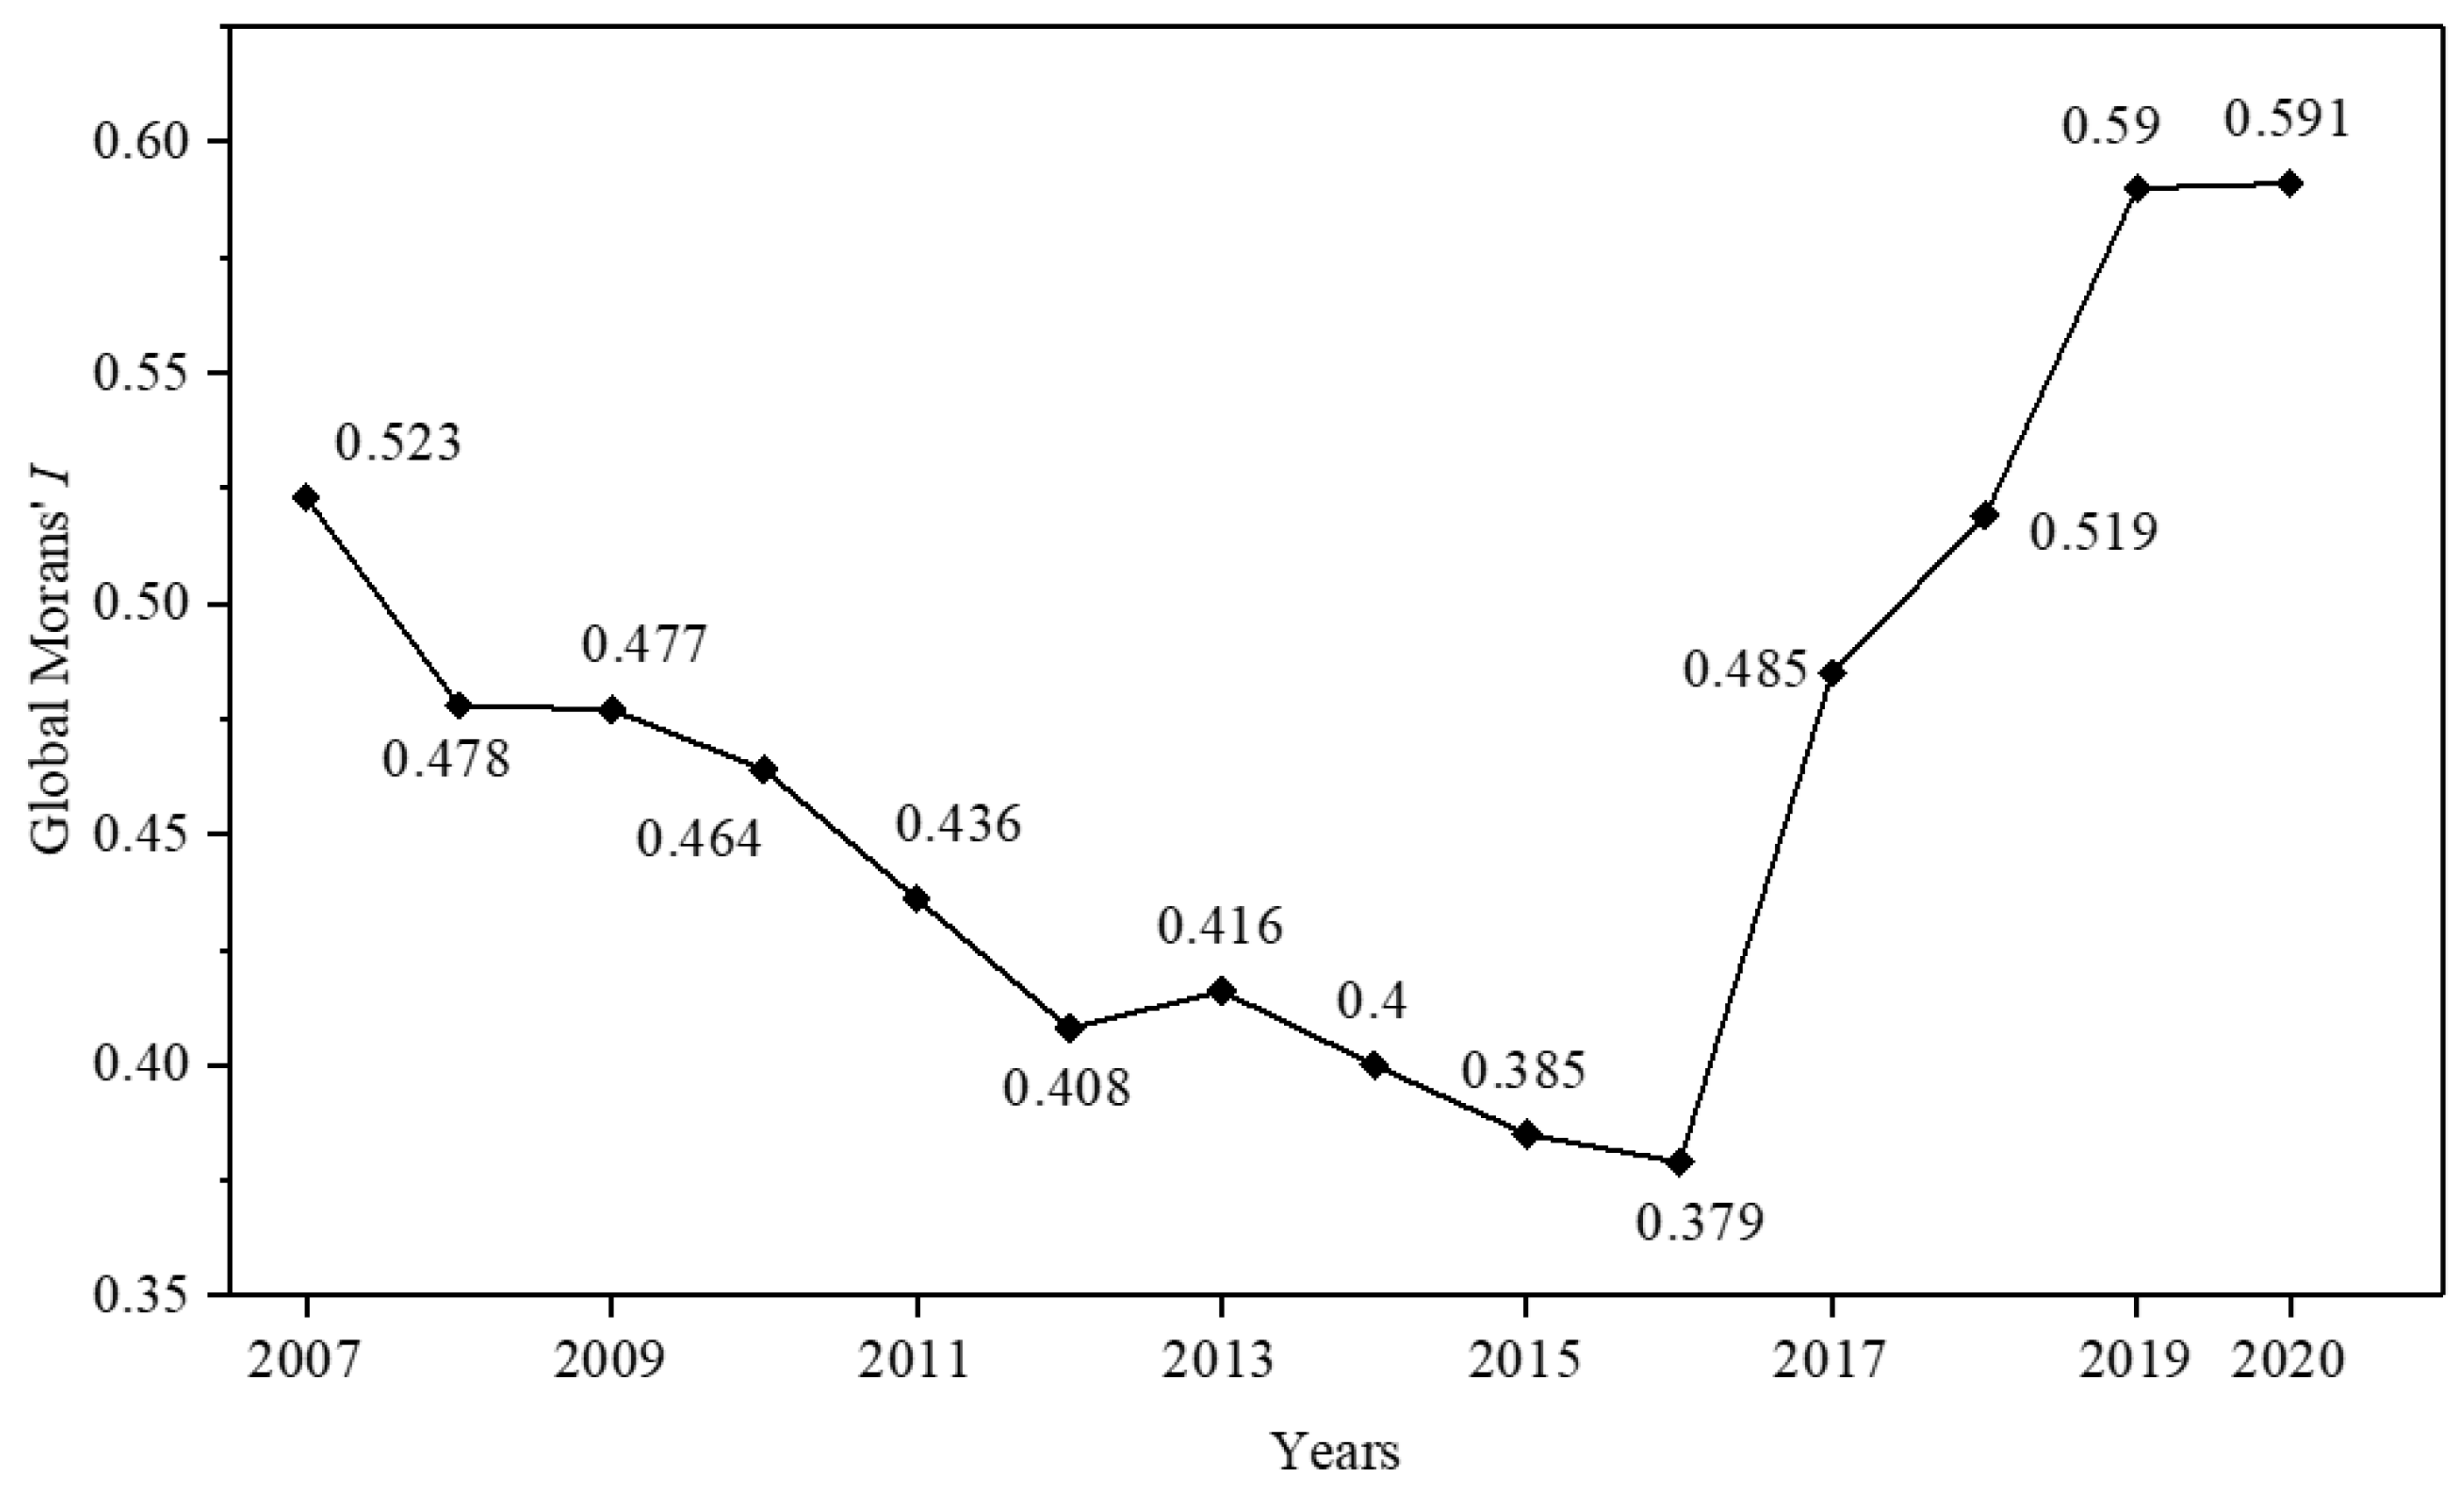
3.2. Spatial Autocorrelation Analysis of Domestic Water Price

Moran’s I is a statistical measure of spatial autocorrelation that evaluates whether features in a dataset are clustered or dispersed across space. It compares each feature’s attribute value with the mean attribute value of its neighboring features, taking into account both the distance between features and the strength of the correlation between them. The global Moran’s I of water prices of 285 Chinese prefecture-level cities from 2007 to 2020 are shown in Figure 7, which shows that there was a significant positive spatial autocorrelation (p < 0.01) for water prices in China. It indicates that domestic water prices in a city were not only affected but also affected by surrounding cities. Regions with high domestic water prices agglomerated as did those with low domestic water prices. The global Moran’s I index exhibited significant fluctuations across a wide range of values. The positive spatial effect of domestic water prices initially decreased and then increased, indicating a statistically significant increase in the trend of spatial clustering.
The global Moran’s I value can provide insights into overall regional differences in domestic water prices among Chinese cities. However, it does not provide detailed information about the specific characteristics or features of spatial clusters. To further investigate spatial agglomeration and regional differences in water prices in China, LISA analysis was performed, and the results are presented in Figure 8. The LISA clustering maps use Moran’s I to calculate LISA for each feature, which measures the extent to which a feature’s value is similar or dissimilar to its neighboring features. The results reveal that a stable and distinct H-H (high–high) spatial cluster of domestic water prices exists in north and northeast China, particularly in the Beijing–Tianjin–Hebei and surrounding areas. The region’s water resources are scarce, with less than 300 cubic meters of water available per capita per year, which is one-seventh of the national average, leading to reliance on water transfers from outside the region and consequently, increasing the cost of the water supply. Conversely, L-L (low–low) areas mainly encompass cities in south China, including Hunan, Jiangxi, and Guangxi provinces, which are rich in water resources and economically underdeveloped and have water prices that are relatively low for residents. However, the number of L-L cities significantly decreased in 2020, while the number of L-H and H-L outliers increased. This trend could be attributed to a rise in water prices in these areas over the past few decades, with varying increases, resulting in a significant price gap. These findings indicate that the spatial distribution of domestic water prices is not randomly distributed but rather exhibits a significant spatial aggregation and dependence.

3.3. Driving Factors of Domestic Water Prices

3.3.1. Detection of Key Factors and Impacts on Water Prices

To gain a deeper understanding of the primary factors influencing domestic water prices in different regions of China, factor analysis was used to identify the main factors impacting domestic water prices in four specific regions of the country (Table 2). The analysis revealed that the primary determinant of domestic water prices in the 285 prefecture-level cities across China was the level of disposable income per capita ( X 5 , q = 0.2654 ), which implies that disposable income per capita had a remarkably prominent impact on domestic water prices. The q -values of GDP per capita ( X 4 ) and water resources per capita ( X 3 ) were 0.1179 and 0.1529, which also means that they influenced domestic water prices to some extent. The q -values of other factors (daily domestic water consumption per capita ( X 1 ), population density ( X 2 ), and water supply capacity ( X 6 )) ranged from 0.0233 to 0.1171, which suggested that the explanatory power of these factors had weaker explanatory power. These findings suggest that household income, economic development, and natural resource conditions play crucial roles in shaping water pricing policies at the local level and underscore the importance of considering these factors when designing sustainable and equitable water management strategies.
The dominant driving force of domestic water prices varied across different regions of China. The GDP per capita ( X 4 ) had the strongest effect on domestic water prices, with a q-value of 0.3372, expressing the strongest association with domestic water prices. Water resources per capita (0.1043) and disposable income per capita (0.1737) also affected domestic water prices. In the central and western regions of China, disposable income per capita and water resources had a relatively large impact on domestic water prices, with q -values of 0.3220 and 0.3147, respectively. GDP per capita (0.0756) had a relatively weak explanatory power. For the northeast, only disposable income per capita largely explained the spatial variation in domestic water prices, with a q-value of 0.3013. The effects of other influencing factors on domestic water prices were small and less than 0.1. This may be related to the economic and water resource conditions in the northeast, central, west, and east regions of China. The findings indicate that the east region is relatively economically developed with a higher GDP per capita, which means people may be more financially capable and willing to pay higher prices for domestic water. At the same time, disposable income per capita is also higher in the east region, indicating that residents have more financial resources to pay for higher domestic water prices. In the northeast, central, and west regions, the level of economic development and disposable income per capita are relatively low. This implies that residents may not be able to afford higher domestic water prices; therefore, more consideration needs to be given to affordability for residents when setting water prices. Additionally, these areas should also take into account the amount of available water resources, as scarcity can drive up the price of water.

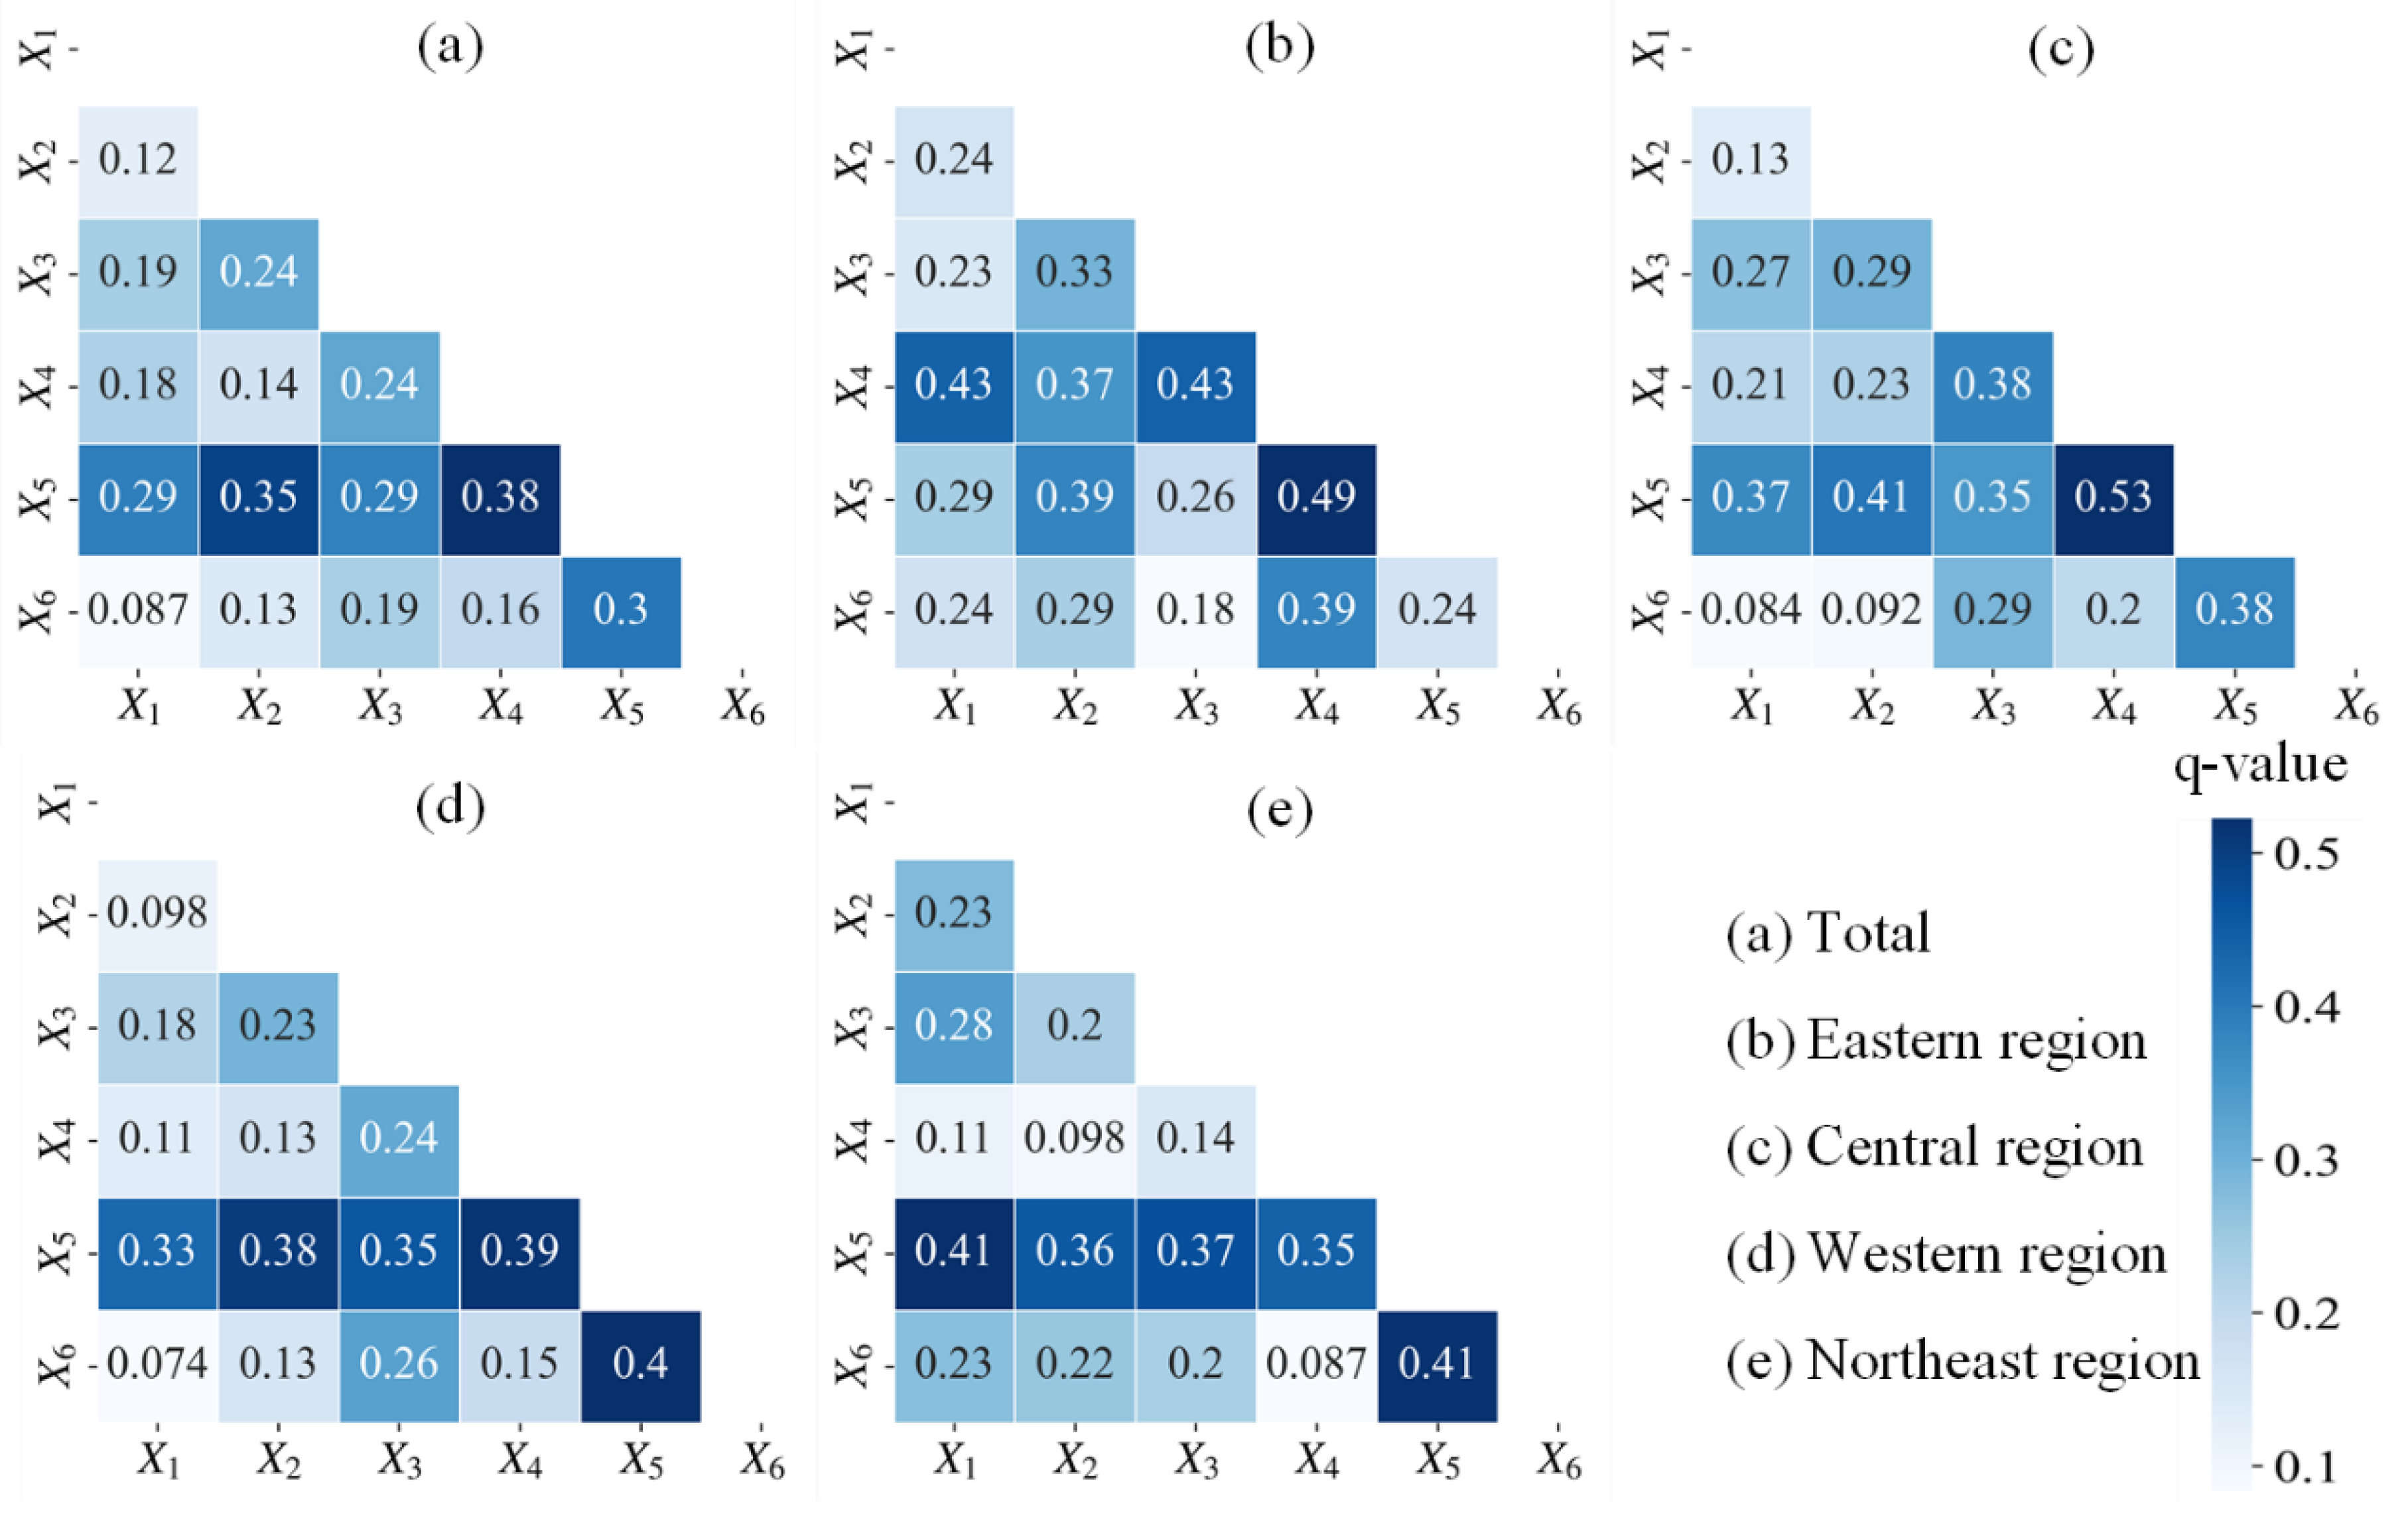
3.3.2. Interaction Detection of Multi-Factors Influencing Water Price

To account for the complex nature of urban domestic water prices, which are typically influenced by multiple factors, an interaction detector was used to examine the impact of two variables interacting with each other on domestic water prices. This approach allows for a more comprehensive understanding of the combined effects of these variables on domestic water prices. The analysis results in Figure 9 show that, in the entire cities, the superposition of the two factors can strengthen the explanatory power of a single factor. The greatest enhancement occurs when per capita GDP and per capita disposable income are combined (0.38), further demonstrating that the socioeconomic level had a direct impact on water prices. The effects of water consumption per capita, water supply capacity, and population density on the spatial differences in water prices are relatively weak, but when coupled with disposable income per capita, their explanatory power is greatly enhanced. Similarly, the strongest synergistic effects of disposable income per capita and GDP per capita are found in the eastern, western, and central regions with q -values of 0.49, 0.53, and 0.39, respectively. In the northeast, the combination of disposable income per capita with water consumption per capita and water supply capacity has the largest explanatory power for spatial differences in domestic water prices. In the factor detection analysis, water consumption per capita and water supply capacity were found to have relatively weaker influences compared with the other factors. In contrast to the other regions, GDP per capita is relatively weak in the factor interaction test analysis, and the synergistic effects of all influencing factors and GDP per capita are weak, except for disposable income per capita.
Although, the individual influences of domestic water prices were relatively minor, after associating with disposable income per capita, their joint influences greatly increased. Thus, the development of domestic water price policies must take into account the combined effects of multiple factors. For different regions, the interaction effect between the impact factors varied. Therefore, each region should fully consider its unique characteristics in the development of water prices.

4. Discussion

Zetland and Gasson [30] analyzed the impact of specific environmental and institutional factors on water prices across 308 countries worldwide. Their findings revealed that higher water prices were associated with lower per capita consumption and smaller local populations, among other factors. Carlos et al. [53] further confirmed these findings with a statistical analysis of water price differences in 493 water districts in the Philippines, highlighting the direct influence of factors such as location, water source, and service efficiency on water prices. McIlwaine and Ouda [54] provided a comprehensive discussion of the factors considered in determining water prices in the literature and analyzed the driving factors behind water price reforms in Saudi Arabia. When investigating the determination of water prices in Chinese cities, Jiang et al. [18] discovered that the water price level of cities at the same level of development had a significant impact, with per capita GDP and population density showing a negative correlation with water prices. Therefore, when analyzing the factors influencing the differences in water prices among Chinese cities, spatial analysis must be introduced to consider the impact of geographical spatial differences.
This study tested the hypothesis that various factors contribute to the regional variability in the spatial distribution of domestic water prices. The geodetector method, known for detecting spatial stratified heterogeneity [55], was utilized for its ability to handle non-linearity and avoid multicollinearity, accurately reflecting spatial distribution characteristics. Extensive experimentation in this study led to the identification of the optimal discretization method and category numbering for each factor, offering a more precise and reliable approach than traditional single discretization methods and effectively capturing the variability in the spatial stratification [56].
Notably, the significant differences in water prices between Chinese cities can be effectively analyzed with geodetector to identify key influencing factors. Spatiotemporal analyses enable the identification of temporal trends and spatial patterns in water prices, aiding in predictions of future price changes and providing valuable insights for water resource planning and management. By elucidating the spatial and temporal patterns and regional differences in domestic water prices from a spatiotemporal evolution perspective, this study assists local governments in developing region-specific water management and pricing strategies. In the future, geodetector will play a more significant role in water price detection, providing decision-makers with more accurate and comprehensive data support and promoting the scientific and effective management of water resources.
Tariff design for water resources is a complex and nuanced task, influenced by various factors, with cost recovery recognized as a pivotal policy objective [53]. Achieving cost recovery is fundamental for ensuring the long-term sustainability of water utilities, as highlighted in various studies [57]. Maintaining a lower water price level can save expenses for residents and reflect the public welfare nature of the water supply industry. However, lower water prices are not conducive to water utility companies recovering costs, which may lead to long-term operating losses. In order to guarantee water supply services, the government needs to further increase financial subsidies [58]. The majority of cities in China provide subsidies to water supply enterprises, including direct subsidies and operational subsidies. From Table 3, it can be seen that there are differences in the financial support for water supply enterprises in different cities, with Shenzhen Water Affairs having the highest level of marketization and operating at a self-sustaining level. Government subsidies are mainly to provide disposable water prices, but this does not mean that the larger the scale of subsidies, the lower the price of water. For example, Beijing receives a significant amount of government subsidies every year, yet its water price remains high, which is closely related to the extreme scarcity of water resources in Beijing. Overall, water utility companies lack incentives to provide high-quality water supply services, resulting in low operational efficiency and a heavy financial burden. The government should distinguish between the operational and public welfare aspects of water supply prices and flexibly reflect market demand. In addition, setting water prices also requires consideration of the balance between water supply and demand, environmental protection, and social equity [59]. There have been several successful initiatives to integrate social factors into water price design, yielding many positive experiences [60].
The findings of this study have crucial implications for both policymakers and researchers. They strongly indicate that water price reforms in China should be carefully tailored to the unique characteristics of each region, taking into account factors like economic development, water supply, and population growth. In economically advanced regions, a gradual shift toward market mechanisms for water resource allocation could be effective. In contrast, regions experiencing water scarcity should prioritize ensuring a stable water supply, potentially using modest increases in water prices to encourage conservation. The importance of social equity must be upheld throughout these reforms. To mitigate disparities, it is recommended to implement special water price subsidy policies, ensuring that residents in less affluent areas maintain access to adequate water supplies. Ultimately, the success of water price reforms depends on their context-specific application, necessitating a balanced approach that combines market-oriented and government-guided strategies to foster rational and sustainable water use and conservation. This approach promotes a more scientific and rigorous pathway toward achieving water security and environmental stability in China.

5. Conclusions

This study delved into the spatiotemporal characteristics and regional disparities in domestic water prices using Moran’s I and examined the driving forces behind these variations with a geographic detector model. The primary conclusions are as follows:
1. Spatiotemporal heterogeneity in China’s domestic water prices: There is a notable spatiotemporal heterogeneity in China’s domestic water prices. From a temporal viewpoint, the national average for urban domestic water prices in China exhibited an increasing trend. Spatially, the distribution of domestic water prices showed a pattern of being higher in the northern regions and lower in the southern regions.
2. Spatial dependence and regional patterns: This study identified a distinct spatial dependence and regional patterning in China’s domestic water prices at the prefecture level. The analysis of regional domestic water price concentrations uncovered significant global and local spatial autocorrelations. Cities in the Beijing–Tianjin–Hebei region with high domestic water prices were located in areas with equally high prices, while low–low prices clusters were observed in the Guangxi–Jiangxi–Anhui region.
3. Influences of multiple factors: Domestic water prices were found to be influenced by a myriad of factors that interact in complex ways. These prices are correlated with economic development, water resource availability, and residents’ income levels at both national and regional scales. Furthermore, the interaction between these factors revealed enhanced explanatory power for domestic water prices, suggesting that the influences on these prices are multifaceted and are more comprehensively understood with interaction detection.

Author Contributions

X.X.: calculation, analysis, and writing; X.T.: idea, conception, analysis, and writing; J.Z.: discussion and writing; V.P.S.: discussion and writing; Y.C.: discussion and writing. All authors have read and agreed to the published version of the manuscript.

Funding

The research was supported by the National Natural Science Foundation of China (52279032) and the National Key Research and Development Program of China (2022YFC3002900).

Data Availability Statement

The data that support the findings of this study are available from the corresponding author upon reasonable request.

Conflicts of Interest

Author Yuanyuan Chai was employed by the company Shenzhen Branch of Guangdong Hehai Engineering Consulting Limited Company. The remaining authors declare that the research was conducted in the absence of any commercial or financial relationships that could be construed as a potential conflict of interest.

References

  1. Cosgrove, W.J.; Loucks, D.P. Water management: Current and future challenges and research directions. Water Resour. Res. 2015, 51, 4823–4839. [Google Scholar] [CrossRef]
  2. Frappart, F. Water and life. Nat. Geosci. 2013, 6, 17. [Google Scholar] [CrossRef]
  3. Jia, Z.; Cai, Y.; Chen, Y.; Zeng, W. Regionalization of water environmental carrying capacity for supporting the sustainable water resources management and development in China. Resour. Conserv. Recycl. 2018, 134, 282–293. [Google Scholar] [CrossRef]
  4. Chen, J.; Xia, J. Facing the challenge: Barriers to sustainable water resources development in China. Hydrol. Sci. J. 1999, 44, 507–516. [Google Scholar] [CrossRef]
  5. Li, P.; Qian, H. Water resources research to support a sustainable China. Int. J. Water Resour. Dev. 2018, 34, 327–336. [Google Scholar] [CrossRef]
  6. He, C.; Liu, Z.; Wu, J.; Pan, X.; Fang, Z.; Li, J.; Bryan, B.A. Future global urban water scarcity and potential solutions. Nat. Commun. 2021, 12, 4667. [Google Scholar] [CrossRef]
  7. Zhang, Y.; Khan, S.U.; Swallow, B.; Liu, W.; Zhao, M. Coupling coordination analysis of China’s water resources utilization efficiency and economic development level. J. Clean. Prod. 2022, 373, 133874. [Google Scholar] [CrossRef]
  8. Reddy, V.R.; Shen, D. Water pricing in China and India: A comparative analysis. Water Policy 2016, 18, 103–121. [Google Scholar] [CrossRef]
  9. Zhang, B.; Fang, K.H.; Baerenklau, K.A. Have Chinese water pricing reforms reduced urban residential water demand? Water Resour. Res. 2017, 53, 5057–5069. [Google Scholar] [CrossRef]
  10. Martínez-Dalmau, J.; Gutiérrez-Martín, C.; Expósito, A.; Berbel, J. Analysis of Water Pricing Policy Effects in a Mediterranean Basin Through a Hydroeconomic Model. Water Resour. Manag. 2023, 37, 1599–1618. [Google Scholar] [CrossRef]
  11. Molinos-Senante, M.; Donoso, G. Water scarcity and affordability in urban water pricing: A case study of Chile. Util. Policy 2016, 43, 107–116. [Google Scholar] [CrossRef]
  12. Zhao, J.; Ni, H.; Peng, X.; Li, J.; Chen, G.; Liu, J. Impact of water price reform on water conservation and economic growth in China. Econ. Anal. Policy 2016, 51, 90–103. [Google Scholar] [CrossRef]
  13. Ouyang, R.; Mu, E.; Yu, Y.; Chen, Y.; Hu, J.; Tong, H.; Cheng, Z. Assessing the effectiveness and function of the water resources tax policy pilot in China. Environ. Dev. Sustain. 2022. [Google Scholar] [CrossRef]
  14. Rey, D.; Pérez-Blanco, C.D.; Escriva-Bou, A.; Girard, C.; Veldkamp, T.I.E. Role of economic instruments in water allocation reform: Lessons from Europe. Int. J. Water Resour. Dev. 2018, 35, 206–239. [Google Scholar] [CrossRef]
  15. Zetland, D. The role of prices in managing water scarcity. Water Secur. 2020, 12, 100081. [Google Scholar] [CrossRef]
  16. El-Khattabi, A.R.; Eskaf, S.; Isnard, J.P.; Lin, L.; McManus, B.; Yates, A.J. Heterogeneous responses to price: Evidence from residential water consumers. J. Environ. Econ. Manag. 2021, 107, 102430. [Google Scholar] [CrossRef]
  17. García-López, M.; Montano, B.; Melgarejo, J. Alternative tariff structures and household composition: Evidence from Spain’s Valencia region. Util. Policy 2022, 79, 101433. [Google Scholar] [CrossRef]
  18. Jiang, Y.; Calub, R.A.T.; Zheng, X. Water tariff setting and its welfare implications: Evidence from Chinese cities. Water Resour. Econ. 2022, 38, 100199. [Google Scholar] [CrossRef]
  19. Al-Saidi, M.; Dehnavi, S. Comparative Scorecard Assessment of Urban Water Pricing Policies—The Case of Jordan and Iran. Water 2019, 11, 704. [Google Scholar] [CrossRef]
  20. Rogers, P.; Silva, R.d.; Bhatia, R. Water is an economic good: How to use prices to promote equity, efficiency, and sustainability. Water Policy 2002, 4, 1–17. [Google Scholar] [CrossRef]
  21. Pinto, F.S.; de Carvalho, B.; Marques, R.C. Adapting water tariffs to climate change: Linking resource availability, costs, demand, and tariff design flexibility. J. Clean. Prod. 2021, 290, 125803. [Google Scholar] [CrossRef]
  22. Xu, L.; Tu, Z.; Yang, J.; Zhang, C.; Chen, X.; Gu, Y.; Yu, G. A water pricing model for urban areas based on water accessibility. J. Environ. Manag. 2023, 327, 116880. [Google Scholar] [CrossRef] [PubMed]
  23. Portoghese, I.; Giannoccaro, G.; Giordano, R.; Pagano, A. Modeling the impacts of volumetric water pricing in irrigation districts with conjunctive use of surface and groundwater resources. Agric. Water Manag. 2021, 244, 106561. [Google Scholar] [CrossRef]
  24. Zhong, L.; Mol, A.P.J. Water Price Reforms in China: Policy-Making and Implementation. Water Resour. Manag. 2010, 24, 377–396. [Google Scholar] [CrossRef]
  25. Deng, L.; Guo, S.; Yin, J.; Zeng, Y.; Chen, K. Multi-objective optimization of water resources allocation in Han River basin (China) integrating efficiency, equity and sustainability. Sci. Rep. 2022, 12, 798. [Google Scholar] [CrossRef]
  26. Moore, S.; Yu, W. Environmental politics and policy adaptation in China: The case of water sector reform. Water Policy 2020, 22, 850–866. [Google Scholar] [CrossRef]
  27. Shen, D.; Wu, J. State of the Art Review: Water pricing reform in China. Int. J. Water Resour. Dev. 2017, 33, 198–232. [Google Scholar] [CrossRef]
  28. Luby, I.H.; Polasky, S.; Swackhamer, D.L.U.S. Urban Water Prices: Cheaper When Drier. Water Resour. Res. 2018, 54, 6126–6132. [Google Scholar] [CrossRef]
  29. Moncur, J.E.T. Urban water pricing and drought management. Water Resour. Res. 1987, 23, 393–398. [Google Scholar] [CrossRef]
  30. Zetland, D.; Gasson, C. A global survey of urban water tariffs: Are they sustainable, efficient and fair? Int. J. Water Resour. Dev. 2013, 29, 327–342. [Google Scholar] [CrossRef]
  31. Chen, J.; Wang, D.; Li, G.; Sun, Z.; Wang, X.; Zhang, X.; Zhang, W. Spatial and Temporal Heterogeneity Analysis of Water Conservation in Beijing-Tianjin-Hebei Urban Agglomeration Based on the Geodetector and Spatial Elastic Coefficient Trajectory Models. GeoHealth 2020, 4, e2020GH000248. [Google Scholar] [CrossRef] [PubMed]
  32. Wang, J.-F.; Hu, Y. Environmental health risk detection with GeogDetector. Environ. Model. Softw. 2012, 33, 114–115. [Google Scholar] [CrossRef]
  33. Zhou, C.; Chen, J.; Wang, S. Examining the effects of socioeconomic development on fine particulate matter (PM2.5) in China’s cities using spatial regression and the geographical detector technique. Sci. Total Environ. 2018, 619–620, 436–445. [Google Scholar] [CrossRef]
  34. Li, Z.; Zhou, Y.; Zhang, H.; Cai, Y.; Yang, Z. Driving factors and their interactions of takeaway packaging waste generation in China. Resour. Conserv. Recycl. 2022, 185, 106467. [Google Scholar] [CrossRef]
  35. Chen, Y.; Zhou, Y.; NixiaCiren; Zhang, H.; Wang, C.; GesangDeji; Wang, X. Spatiotemporal variations of surface ozone and its influencing factors across Tibet: A Geodetector-based study. Sci. Total Environ. 2022, 813, 152651. [Google Scholar] [CrossRef] [PubMed]
  36. Ren, Z.; Tian, Z.; Wei, H.; Liu, Y.; Yu, Y. Spatiotemporal evolution and driving mechanisms of vegetation in the Yellow River Basin, China during 2000–2020. Ecol. Indicat. 2022, 138, 108832. [Google Scholar] [CrossRef]
  37. Xia, H.; Yuan, S.; Prishchepov, A.V. Spatial-temporal heterogeneity of ecosystem service interactions and their social-ecological drivers: Implications for spatial planning and management. Resour. Conserv. Recycl. 2023, 189, 106767. [Google Scholar] [CrossRef]
  38. Wang, J.; Li, X.; Christakos, G.; Liao, Y.; Zhang, T.; Gu, X.; Zheng, X. Geographical Detectors-Based Health Risk Assessment and its Application in the Neural Tube Defects Study of the Heshun Region, China. Int. J. Geogr. Inf. Sci. 2010, 24, 107–127. [Google Scholar] [CrossRef]
  39. Xie, Z.; Qin, Y.; Li, Y.; Shen, W.; Zheng, Z.; Liu, S. Spatial and temporal differentiation of COVID-19 epidemic spread in mainland China and its influencing factors. Sci. Total Environ. 2020, 744, 140929. [Google Scholar] [CrossRef]
  40. Wei, W.; Zhang, X.; Zhou, L.; Xie, B.; Zhou, J.; Li, C. How does spatiotemporal variations and impact factors in CO2 emissions differ across cities in China? Investigation on grid scale and geographic detection method. J. Clean. Prod. 2021, 321, 128933. [Google Scholar] [CrossRef]
  41. Yun, G.; He, Y.; Jiang, Y.; Dou, P.; Dai, S. PM2.5 Spatiotemporal Evolution and Drivers in the Yangtze River Delta between 2005 and 2015. Atmosphere 2019, 10, 55. [Google Scholar] [CrossRef]
  42. Zuo, Y.; Li, Y.; He, K.; Wen, Y. Temporal and spatial variation characteristics of vegetation coverage and quantitative analysis of its potential driving forces in the Qilian Mountains, China, 2000–2020. Ecol. Indicat. 2022, 143, 109429. [Google Scholar] [CrossRef]
  43. Yang, S.; Hu, S.; Li, W.; Zhang, C.; Torres, J. Spatiotemporal Effects of Main Impact Factors on Residential Land Price in Major Cities of China. Sustainability 2017, 9, 2050. [Google Scholar] [CrossRef]
  44. Wei, W.; Guo, Z.; Zhou, L.; Xie, B.; Zhou, J. Assessing environmental interference in northern China using a spatial distance model: From the perspective of geographic detection. Sci. Total Environ. 2020, 709, 136170. [Google Scholar] [CrossRef]
  45. Moran, P.a.J.B. Notes on continuous stochastic phenomena. Biometrika 1950, 37, 17–23. [Google Scholar] [CrossRef]
  46. Cliff, A.D.; Ord, K. Spatial Autocorrelation: A Review of Existing and New Measures with Applications. Econ. Geogr. 1970, 46, 269–292. [Google Scholar] [CrossRef]
  47. Li, L.; Tang, H.; Lei, J.; Song, X. Spatial autocorrelation in land use type and ecosystem service value in Hainan Tropical Rain Forest National Park. Ecol. Indicat. 2022, 137, 108727. [Google Scholar] [CrossRef]
  48. Anselin, L. Local Indicators of Spatial Association—LISA. Geogr. Anal. 1995, 27, 93–115. [Google Scholar] [CrossRef]
  49. Wang, S.; Shi, C.; Fang, C.; Feng, K. Examining the spatial variations of determinants of energy-related CO2 emissions in China at the city level using Geographically Weighted Regression Model. Appl. Energy 2019, 235, 95–105. [Google Scholar] [CrossRef]
  50. Wang, J.-F.; Zhang, T.-L.; Fu, B.-J. A measure of spatial stratified heterogeneity. Ecol. Indicat. 2016, 67, 250–256. [Google Scholar] [CrossRef]
  51. Xu, L.; Du, H.; Zhang, X. Driving forces of carbon dioxide emissions in China’s cities: An empirical analysis based on the geodetector method. J. Clean. Prod. 2021, 287, 125169. [Google Scholar] [CrossRef]
  52. Song, Y.; Wang, J.; Ge, Y.; Xu, C. An optimal parameters-based geographical detector model enhances geographic characteristics of explanatory variables for spatial heterogeneity analysis: Cases with different types of spatial data. GIsci. Remote Sens. 2020, 57, 593–610. [Google Scholar] [CrossRef]
  53. David, C.P.C.; Cayton, P.J.A.; Lorenzo, T.E.; Santos, E.C. Statistical analysis of Philippine water district characteristics and how these affect water tariffs. Water Int. 2013, 39, 1–9. [Google Scholar] [CrossRef]
  54. McIlwaine, S.J.; Ouda, O.K.M. Drivers and challenges to water tariff reform in Saudi Arabia. Int. J. Water Resour. Dev. 2020, 36, 1014–1030. [Google Scholar] [CrossRef]
  55. Comber, A.; Chi, K.; Huy, M.Q.; Nguyen, Q.; Lu, B.; Phe, H.H.; Harris, P. Distance metric choice can both reduce and induce collinearity in geographically weighted regression. Environ. Plan. B Urban. Anal. City Sci. 2018, 47, 489–507. [Google Scholar] [CrossRef]
  56. Lu, Y.; Yang, X.; Bian, D.; Chen, Y.; Li, Y.; Yuan, Z.; Wang, K. A novel approach for quantifying water resource spatial equilibrium based on the regional evaluation, spatiotemporal heterogeneity and geodetector analysis integrated model. J. Clean. Prod. 2023, 424, 138791. [Google Scholar] [CrossRef]
  57. Barraqué, B. Full cost recovery of water services and the 3 T’s of OECD. Util. Policy 2020, 62, 100981. [Google Scholar] [CrossRef]
  58. Yuan, J. Research on the Formation Mechanism of Water Supply Prices for Urban Residents in China. City 2021, 36–43. [Google Scholar] [CrossRef]
  59. Ben Amor, T.; Mellah, T. Cost efficiency of Tunisian water utility districts: Does heterogeneity matter? Util. Policy 2023, 84, 101616. [Google Scholar] [CrossRef]
  60. Massarutto, A. Servant of too many masters: Residential water pricing and the challenge of sustainability. Util. Policy 2020, 63, 101018. [Google Scholar] [CrossRef]
Figure 1. Distribution of China’s prefecture-level cities.
Water 16 00115 g001
Figure 2. Boxplots showing urban residents’ domestic water prices from 2007 to 2020.
Water 16 00115 g002
Figure 3. Interannual variation in yearly average domestic water prices in different regions for 2007–2020.
Water 16 00115 g003
Figure 4. Number of cities with price adjustment over the years.
Water 16 00115 g004
Figure 5. The spatial distribution of average domestic water prices for urban residents.
Water 16 00115 g005
Figure 6. The absolute increase in domestic water prices from 2007 to 2020.
Water 16 00115 g006
Figure 7. The temporal dynamics of global Moran’s I .
Water 16 00115 g007
Figure 8. LISA agglomeration of China’s urban domestic water prices from 2007 to 2020.
Water 16 00115 g008
Figure 9. Power of determinants in interaction in different regions in China.
Water 16 00115 g009
Table 1. Description of variables.
Variable Factor DescriptionUnit
X 1 Domestic water consumptionIncluding water for public services and residentialLiters per capita per day
X 2 Population densityThe city population per square kilometerPeople/sq km
X 3 GDP per capitaTotal GDP/populationRMB
X 4 Water resources per capitaTotal water resources/populationCubic meters
X 5 Disposable income per capitaThe part of the urban households’ income that can be used by the urban households themselvesRMB
X 6 Water supply capacityA comprehensive capacity based on the design capacity of components of the process104 cubic meters
Table 2. The q -values of factors influencing domestic water prices in different regions in China.
Driving Factorsq-Value
TotalEastern RegionCentral RegionWestern RegionNortheast Region
X 1 0.0492 ***0.1302 ***0.0631 ***0.02230.0641 ***
X 2 0.0414 ***0.1171 ***0.0532 ***0.0538 ***0.0708 ***
X 3 0.1529 ***0.1043 ***0.2118 ***0.1497 ***0.0817 ***
X 4 0.1179 ***0.3372 ***0.1644 ***0.0756 ***0.0141
X 5 0.2654 ***0.1737 ***0.3220 ***0.3147 ***0.3013 ***
X 6 0.0446 ***0.0894 ***0.0215 ***0.0547 ***0.0498 ***
Note: *** denote passing the significance test at the 10%, 5%, and 1% levels, respectively.
Table 3. Table of financial support for major urban water supply enterprises in China.
CityDomestic Water Prices Amount of Financial Support
Beijing5.00Direct subsidy of RMB 1 billion; 50% financial support for water plants and pipeline networks.
Shanghai3.62Direct subsidy: deep-water treatment plants at a rate of 420 RMB/m3.
Guangzhou2.93Due to the increase in water resource fees from 2016 to 2019, subsidies amounted to approximately RMB 564 million.
Qingdao3.5The municipal government has provided an annual subsidy of approximately RMB 600 million over the past three years.
Shenzhen3.57No direct subsidies are provided. Water plant investments are resolved independently by the enterprises, while the government and enterprises jointly invest in municipal pipeline networks and secondary water supply system renovations.
Disclaimer/Publisher’s Note: The statements, opinions and data contained in all publications are solely those of the individual author(s) and contributor(s) and not of MDPI and/or the editor(s). MDPI and/or the editor(s) disclaim responsibility for any injury to people or property resulting from any ideas, methods, instructions or products referred to in the content.

