Abstract
Phnom Penh, the capital of Cambodia, as with many other world megacities, is exposed to multiple major ecological and environmental hazards. Without a proper wastewater treatment facility, it is difficult for local residents to obtain a health-compliant water supply. In this study, a hybrid aggregation method using principal component analysis (PCA) and weighted means was used to calculate a water quality index (WQI) to map the water quality of the entire Boeung Cheung Ek (BCE) wetland region. We used Universal Kriging to map eight water quality parameters: DO, pH, TDS, F, Cl, NO3−, PO43−, and NH4+. The restricted maximum likelihood method was used for model fitting. Data were collected from groundwater and surface water for different rainfall seasons between March 2017 and February 2018. The principal component analysis (PCA) used to compute a water quality index (WQI) is based on the resulting dimensions of the highest variation among all water quality parameters. The results show that the northern part of the study area has a worse water quality than the southern region, which is caused by the discharge of municipal wastewater directly into the BCE wetland area. The results for different rainfall seasons also show that groundwater has a relatively better quality than surface water. The results of this analysis can serve as a supplementary study to support sustainable development goals because they might confirm the need for a wastewater treatment facility being under construction at the time of writing this article with funding from the Japan International Cooperation Agency (JICA).
1. Introduction
Water is an indispensable resource for all living creatures. The World Health Organization (WHO) addresses the importance of safe drinking water not only for human consumption but also for domestic purposes, such as food preparation, personal hygiene, drinking water, and sanitation needs [1]. Cambodia, one of the least developed countries in Southeast Asia, has approximately 25% inequalities between urban and rural areas in basic drinking water service, and the disparity between the proportion of population using improved water supplies in urban and rural areas is up to approximately 39% [2]. Phnom Penh, the capital of Cambodia, is exposed to multiple major ecological hazards and constraints, such as flooding, poor water drainage, and geological movements [3]. Along with ecological constraints, the rapid urbanization of Cambodia creates a considerable number of difficulties for local governments in providing safe and sufficient basic public services, as the water demand grows with the influx of the labor force into urban areas. Therefore, access to safe and clean drinking water is one of the significant obstacles facing the city of Phnom Penh.
The water supply of Phnom Penh city relies heavily on three main natural water bodies: the Mekong River, Tonle Sap, and Tonle Bassac. However, there was no central wastewater treatment plant until 2021. In 2022, the Choeung Ek Sewage Treatment Plant was built, and its construction was finished in November 2023 (link: http://www.khmertimeskh.com/501029750/construction-of-choeung-ek-sewage-treatment-plant-begins-today/, accessed on 15 October 2023). Normally, natural lakes or wetlands are used as a natural treatment process, and without proper treatment for municipal waste, natural degradation of contaminants in untreated water would take a long time. Nonetheless, the ability of natural degradation is decreasing as the wetlands are being filled in, and, as of 2021, most of the wetland has been developed and urbanized. Poor wastewater management results in water quality degradation, which increases human exposure to harmful substances and impacts ecosystem health [4].
Boeung Cheung Ek (BCE), a natural wetland that receives untreated city sewage discharges, takes a heavy load from two wastewater pumping stations for wastewater treatment. BCE has been shown to be effective at changing the concentrations of nitrate, ammonium, phosphate, total suspended solids (TSS), total dissolved solids (TDS), dissolved oxygen (DO), chromium (Cr), detergents, and E. coli to acceptable levels at outlet streams connected to the Bassac River [5,6,7,8]. Nevertheless, the water quality near pumping stations is extremely poor, having nearly zero dissolved oxygen and high levels of ammonium and phosphate, which are above the Cambodian water quality standards for public sewer areas [8]. The contamination poses a risk to the residents’ health within and around the wetland.
In November 2019, the Japan International Cooperation Agency (JICA) signed a grant agreement with the Royal Government of Cambodia in Phnom Penh to provide grant aid of up to 2.78 billion JPY (25.9 million USD) for the project for sewerage system development in Phnom Penh. This would relieve the burden of natural sanitary processes and contribute to the sustainable development of the urban environment by developing the sewerage system in the surrounding area of Cheung Aek Lake [9]. The construction of the wastewater treatment facility started in February 2022 and is designed to treat 5000 m3/s of wastewater per day [10]. The main objective of this study is to understand the variability of water quality parameters across the BCE wetland area before the wastewater treatment facility is built and assess the BCE wetland area’s capability as a natural waste treatment unit. We used a hybrid method using Principal Components Analysis (PCA) derived weights and a weighted mean function to characterize water quality across the study region in this study. The results of this study can serve as a supplementary study for the JICA’s sustainable development goals because they might confirm the need for the construction of a wastewater treatment facility.
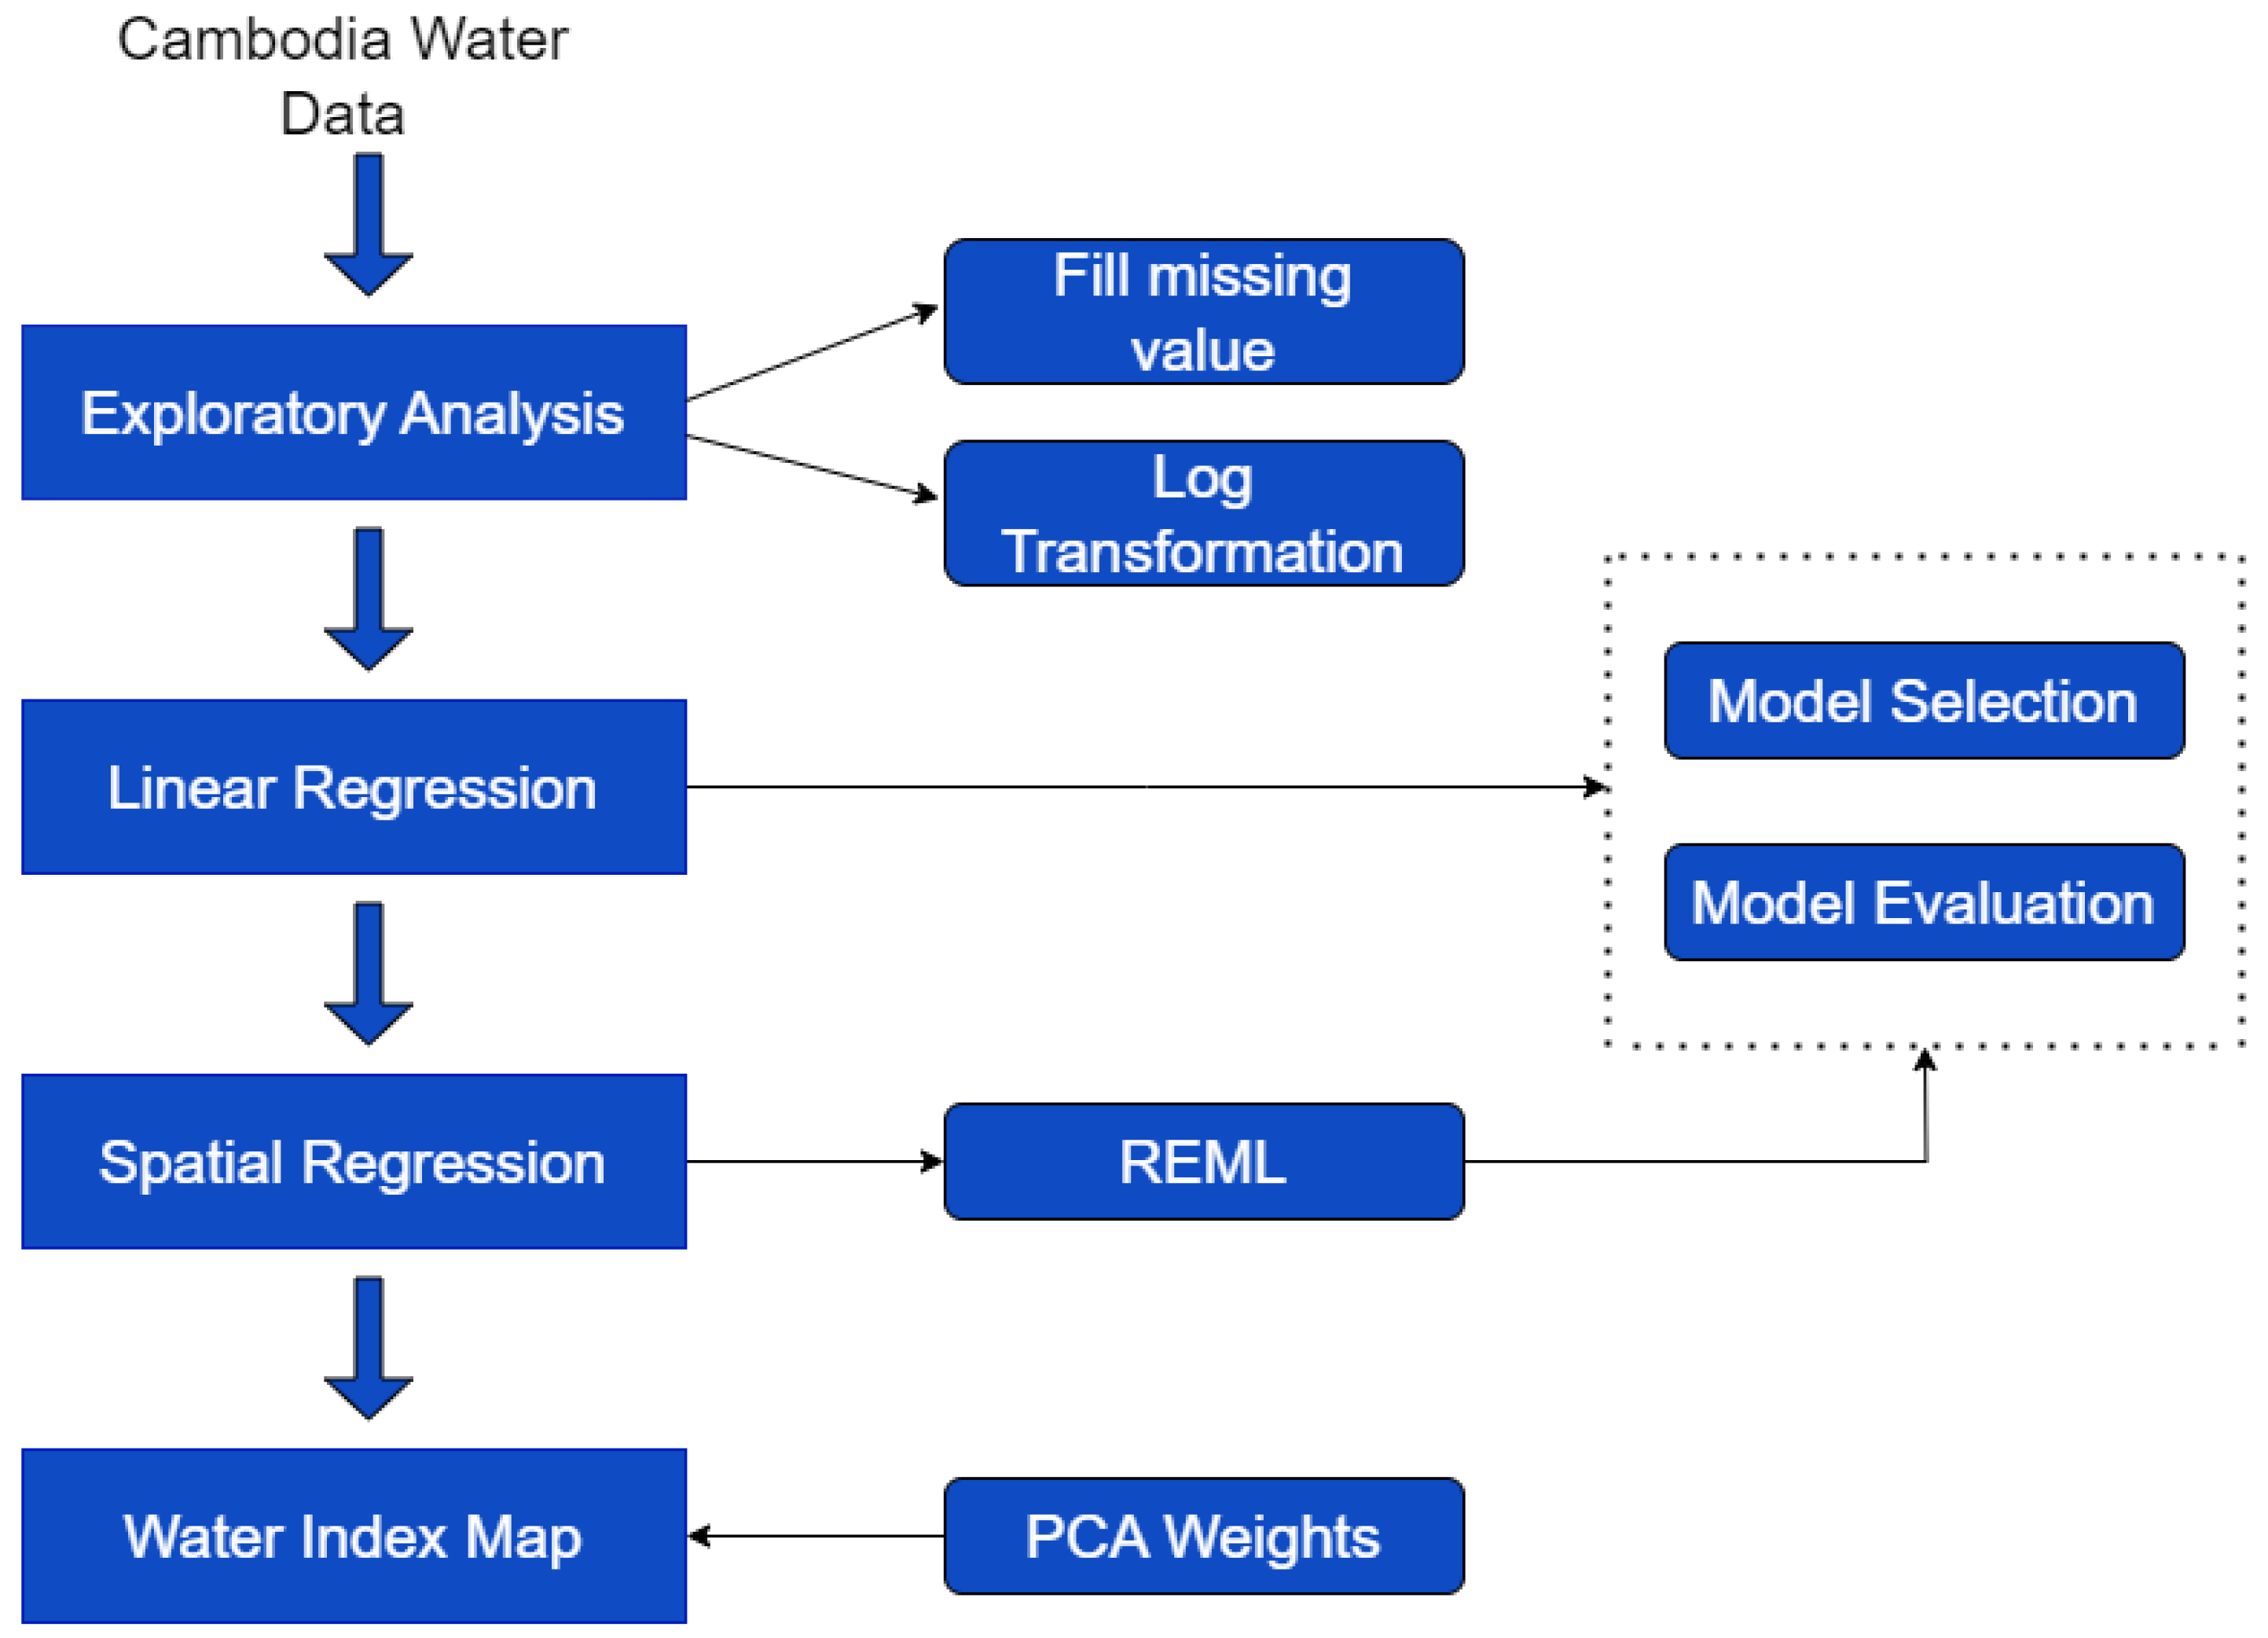
The paper is structured as follows. In Section 2, we describe the study region and data collection methods. In Section 3, we present an exploratory data analysis of the main physicochemical water quality parameters, synthesizing their spatial behavior and variations between the water source, such as differentiating groundwater (GW) from surface water (SW), and the different sampling seasons (STs). A spatial regression approach was used to predict the water quality parameters across the study region, accounting for the potential effects of the water source and STs and the presence of data outliers. This methodology is described in Section 4. These predictions were used to build a water quality index across the entire study region using PCA. Finally, in Section 5, we discuss the results and present some conclusions. The structure of this paper is described in Figure 1.

Figure 1.
Flow chart representing the data analysis steps.
2. Description of the Study Area and Data Collection
2.1. Study Area
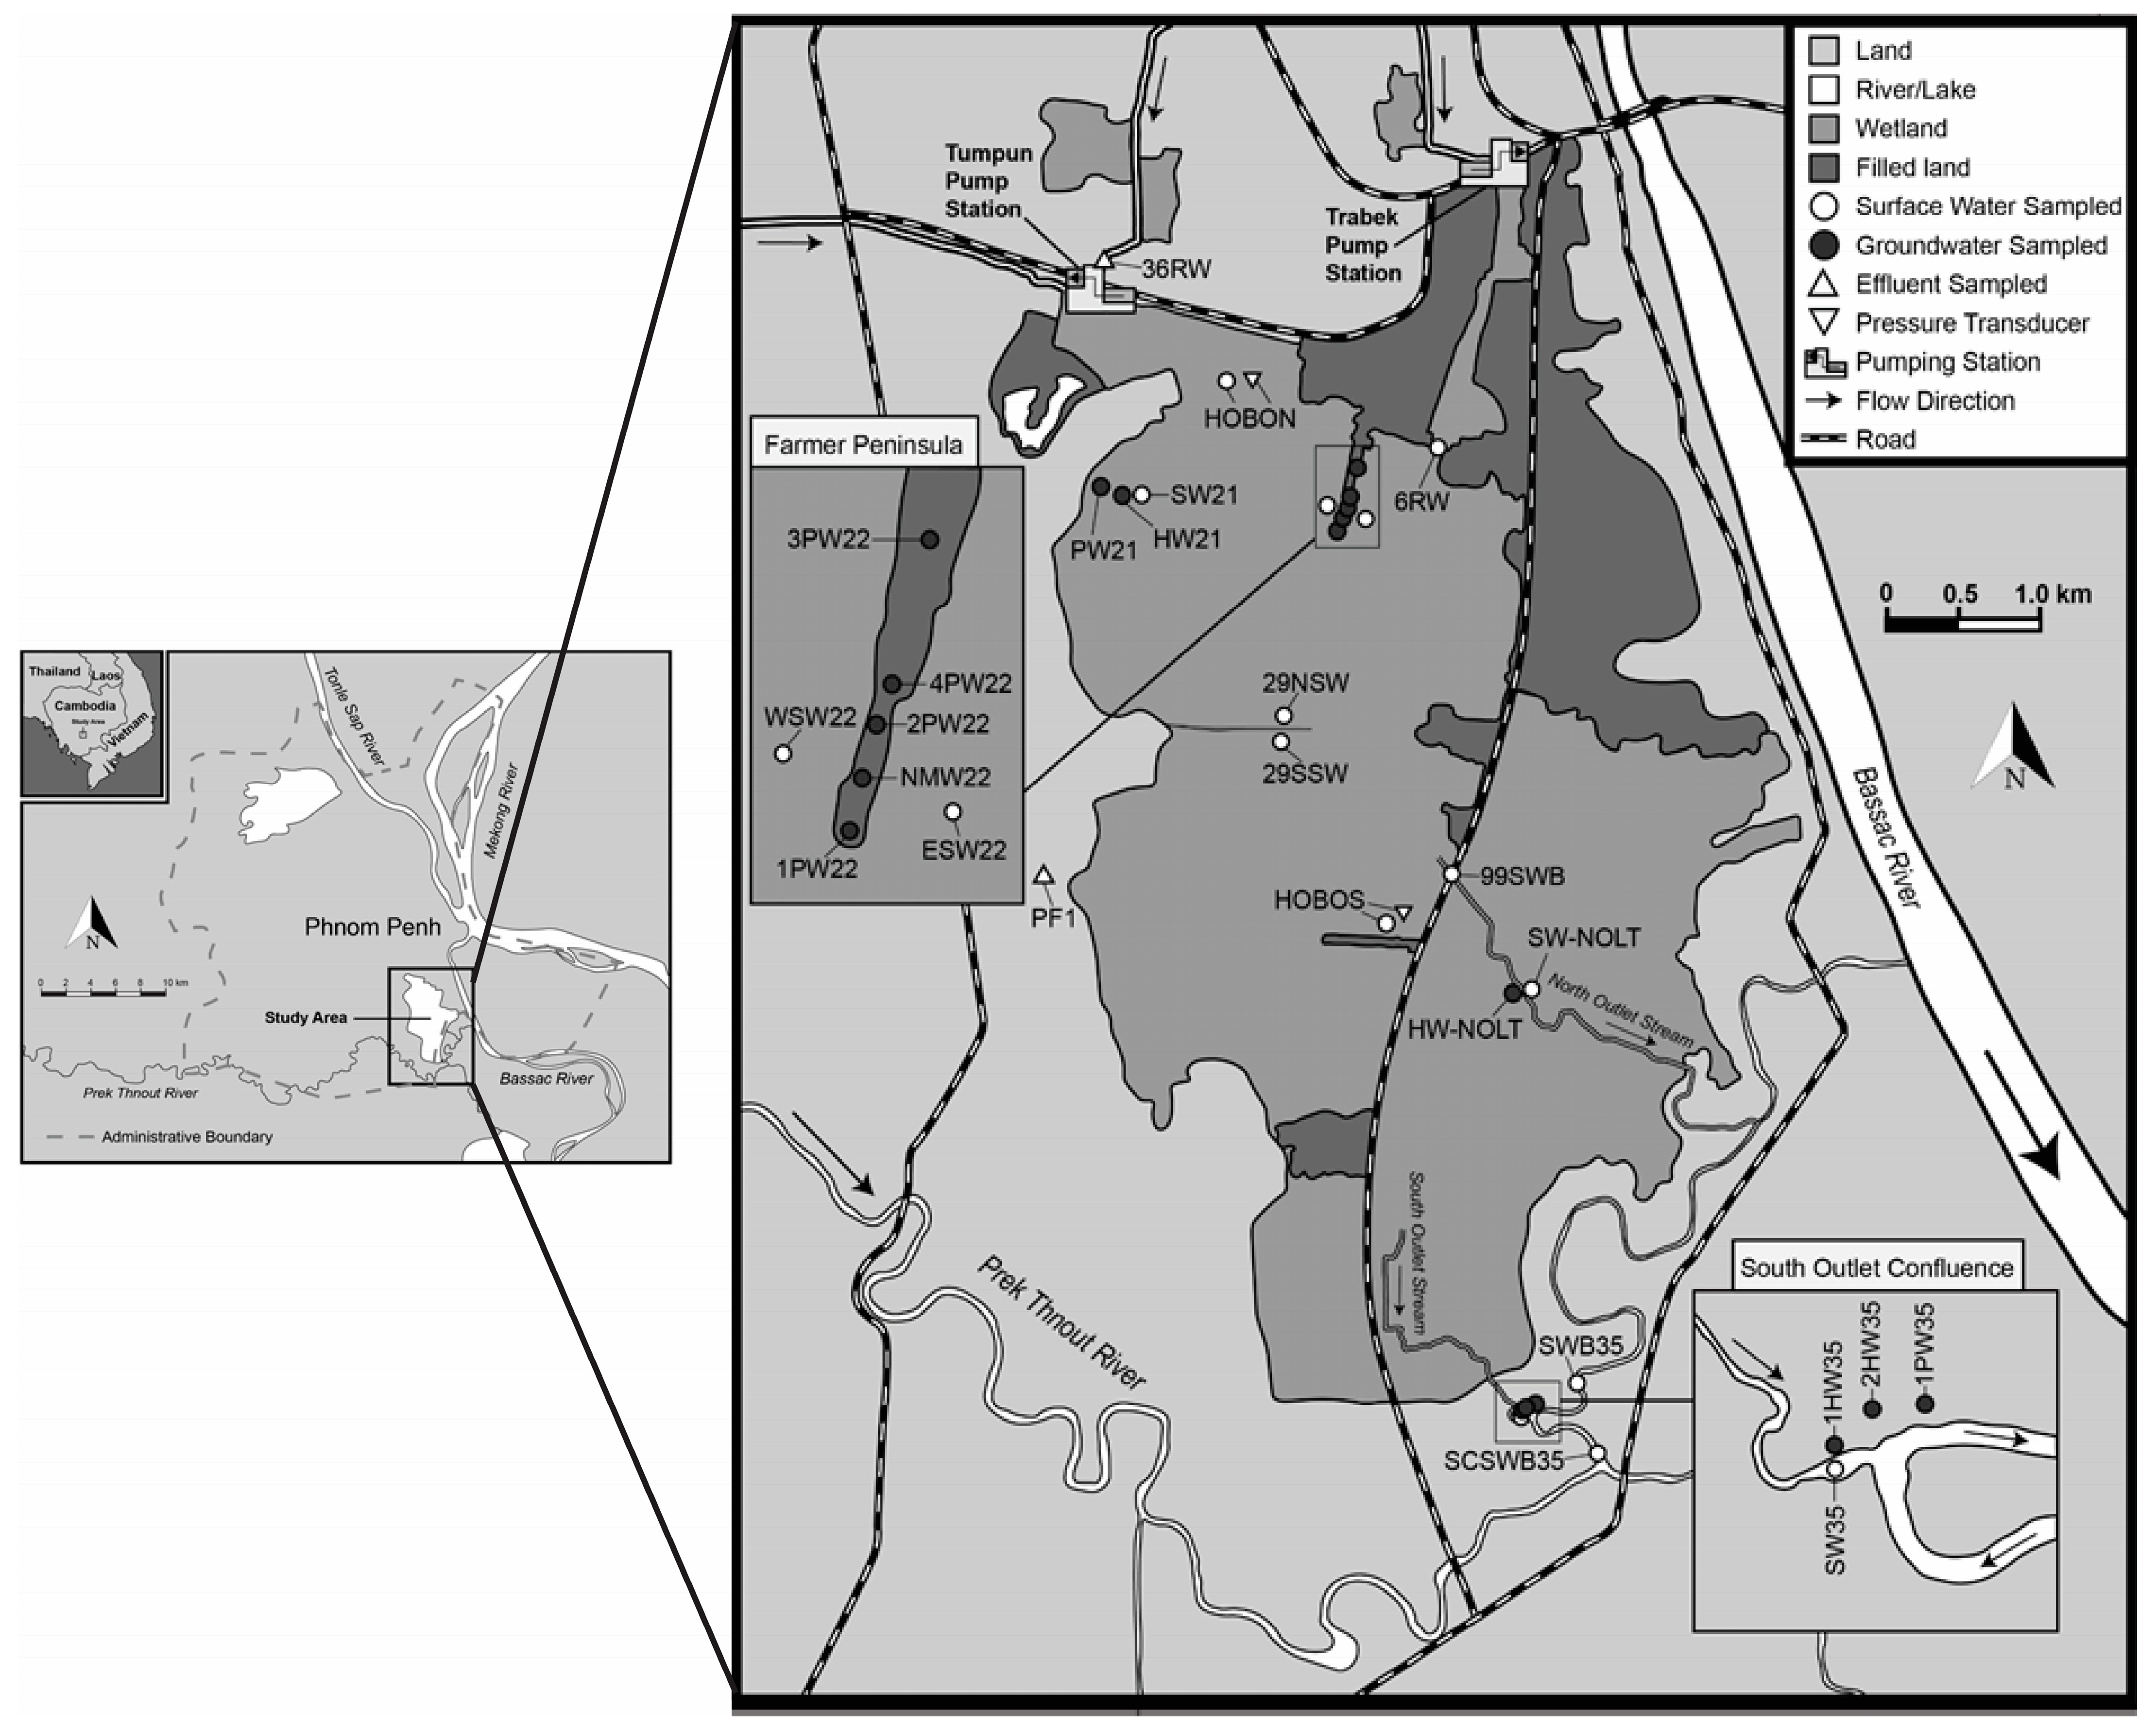
Phnom Penh is located on the Mekong River flood plain and lies at the confluence of the Mekong, Tonle Sap, and Bassac Rivers in south-central Cambodia (Figure 2). The center of the capital is surrounded by natural wetlands and lakes such as Cheung Aek Lake, Boeng Kok Lake, and Poung Peay Lake. However, with the expansion of Phnom Phen, most lakes/wetlands have been reclaimed and are under high pressure due to anthropogenic activities. Natural wetland resources are also facing threats such as intensive cultivation/agriculture, infrastructure development, pollution and nutrient inputs, decreasing biodiversity, and a compromise in their natural filtering capabilities [11].

Figure 2.
Map of the study area (the Tumpun and Trabek pump stations are locations of raw sewage input into BCE).
Approximately 10% of the city’s waste is directly discharged into the Mekong River; the remaining 90% is diverted to four wetlands around the city for natural treatment. Effluents from the two wetlands together with industrial waste are then pumped at 15 m3/s from Tumpun (47.5 ha surface area) and 8 m3/s from Trabek (35 ha surface area) to BCE (1300 ha surface area). Water flows out of BCE along two outlet streams, which we refer to as the north outlet stream and the south outlet stream. Both outlet streams drain into the Prek Thnout River, which eventually drains into the Bassac River. During the wet season, flow reverses on the south outlet stream, directing freshwater back into the wetland in a manner similar to the Tonle Sap River reversal [7]. Thus, mapping out how water quality changes in the study region would provide a better understanding for future construction projects.
2.2. Data Collection
Within the study area, sampling points were selected based on the accessibility of physical locations. For each sampling point, physicochemical variables related to water quality were measured and recorded. There were 11 sampling points for surface water, which were collected either from a small, traditional wooden paddle boat or from the wetland shoreline. Groundwater samples were collected from 15 sampling points resulting from a mixture of household tube wells, community hand-pump tube wells, and tube wells with electronic pumps. The physicochemical properties of the sampled water were determined immediately on-site. There are 8 physicochemical variables that characterize the water quality: dissolved oxygen (DO), pH, total dissolved solids (TDS), fluoride (F), chloride (Cl), nitrate (NO3−), phosphate (PO4), and ammonia (NH4+). Samples were also collected for E. coli (Escherichia coli), which is an indicator microorganism for fecal pollution. Data were collected during four sampling campaigns denoted ST1 to ST4 between March 2017 and February 2018. ST1 measurements were not included in the final analysis because of the high proportion of missing observations.
2.3. Sampling Seasons
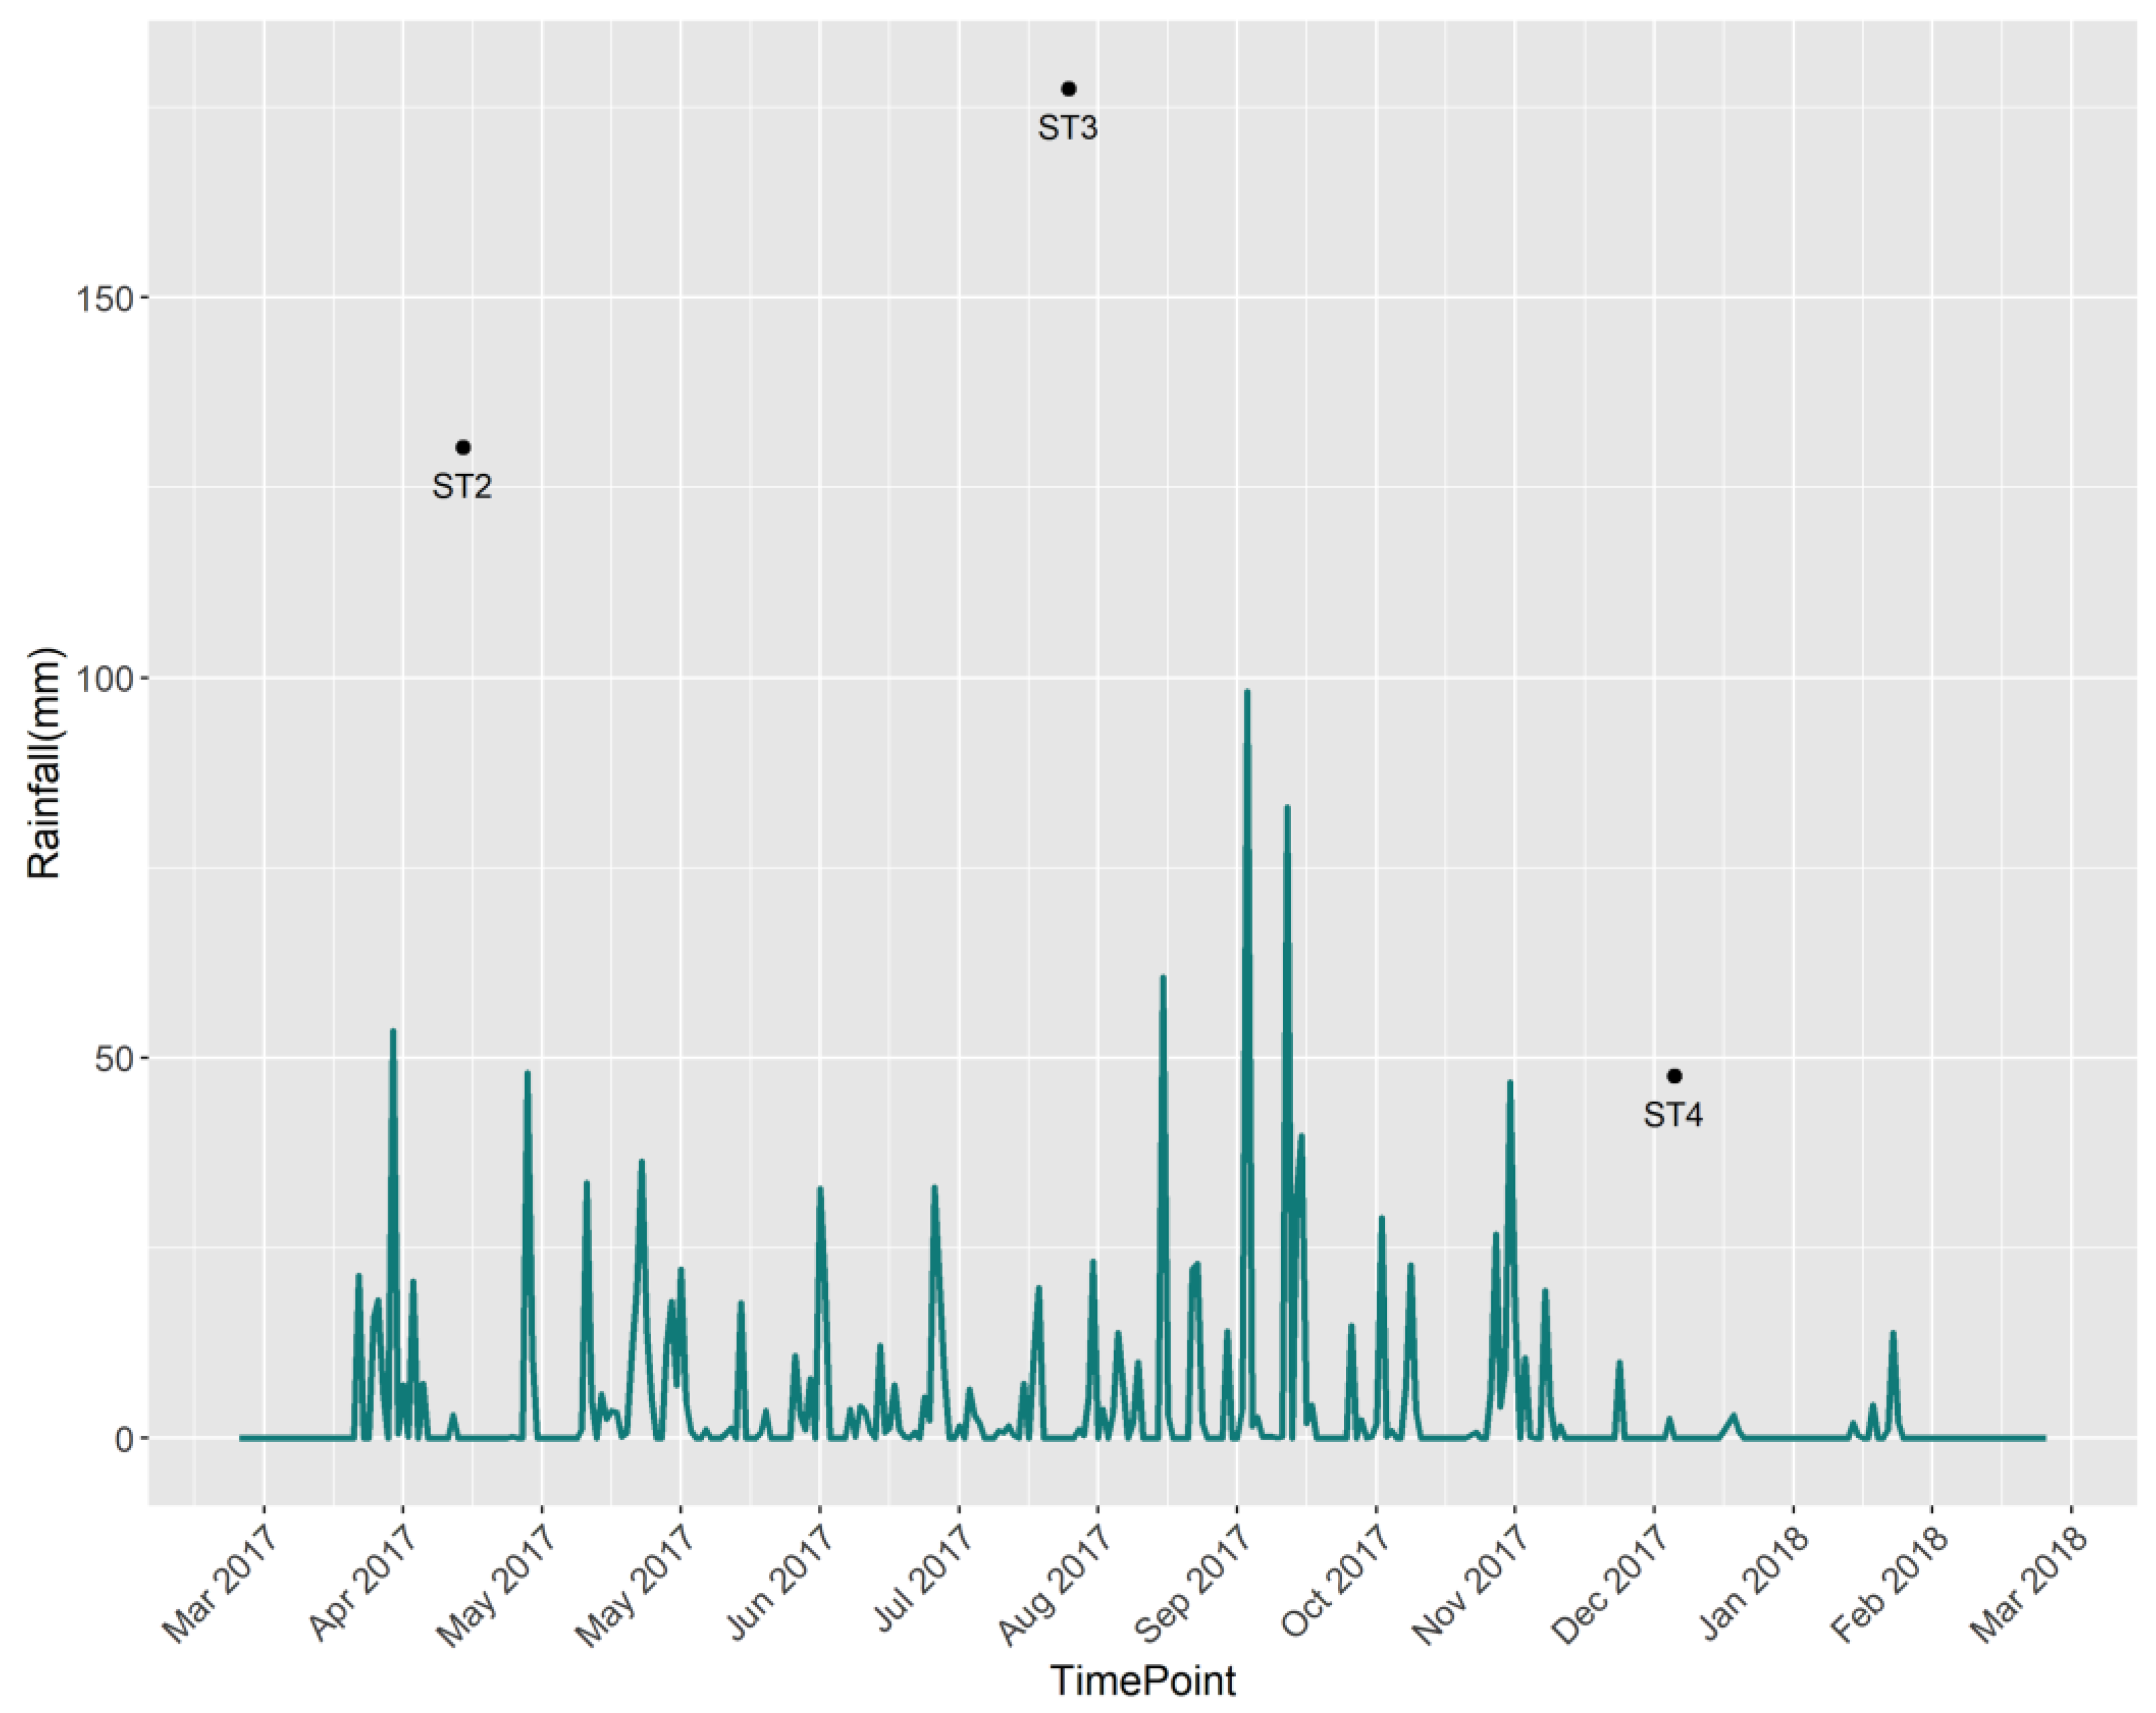
Having a typical tropical climate, Cambodia experiences high air temperatures throughout the year and two distinct rainfall seasons: wet and dry [12]. The data collection process was conducted in three different sampling seasons or campaigns, which were labeled ST2, ST3, and ST4. Measurements from season ST1 were discarded from the analysis because of the large number of missing observations. ST2 starts from March 2017 to June 2017; it covers the beginning of the rainy season, with a lower rainfall amount than season ST3. ST3 represents the rainy season and covers data samples from July 2017 to October 2017. It has the highest average rainfall amount compared with the other two seasons, and September is deemed the wettest month due to its high long-term monthly averages. ST4 starts from November 2017 to February 2018 and coincides with the dry season with the lowest average rainfall amount. The change and trend in rainfall in different seasons are shown in Figure 3. Flooded areas in the wetland basin cycle seasonally between 20 km2 and 13 km2 during the wet and dry seasons, respectively. Thus, the contrasting rainfall amounts in different seasons could affect the water quality in the region, and this variable was included in the analysis as a categorical explanatory variable.
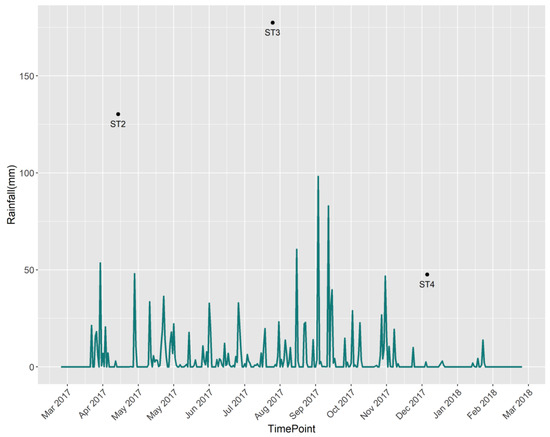
Figure 3.
Daily rainfall (mm) over the study region.
3. Exploratory Data Analysis
3.1. Variable Description
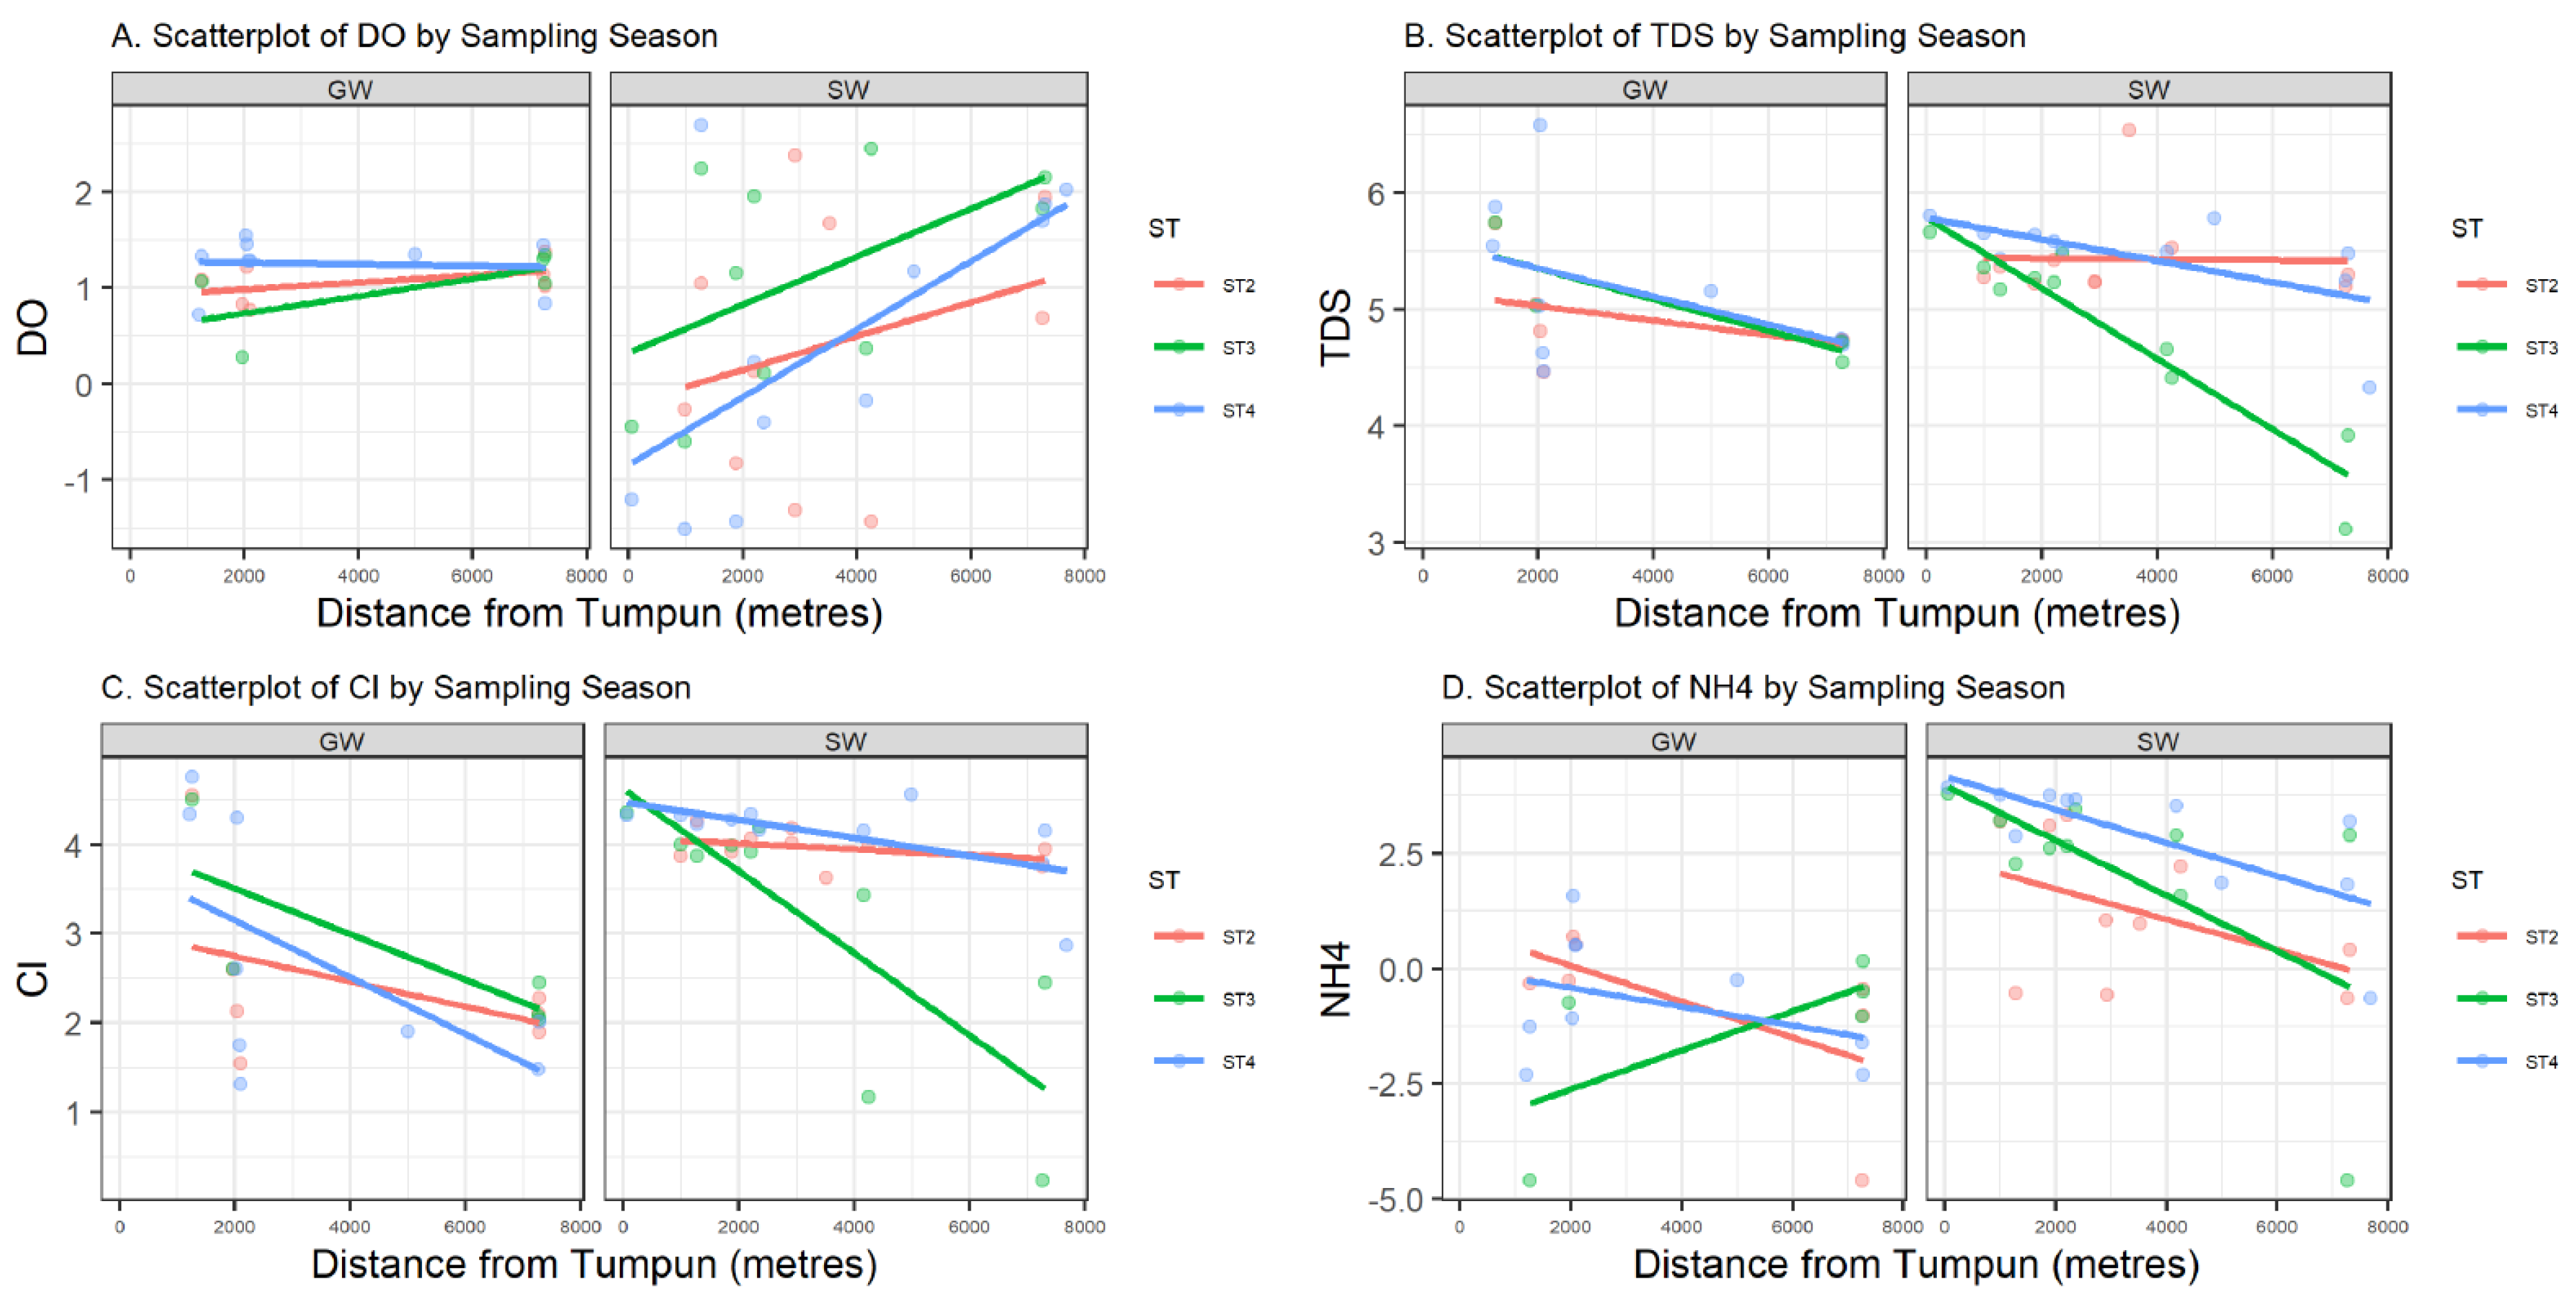
Data in this research were collected from the field and summarized by water source, either from groundwater (GW) or surface water (SW). Summary statistics on the numerical parameters are shown in Table 1 by water source. Most variables have a non-symmetric distribution with positive or negative skewness, and a Shapiro–Wilk normality test is rejected for all parameters except pH. Figure 4 represents the sample values of four log-transformed water quality parameters (DO, TDS, Cl, and NH4+) versus the distance from the Tumpun pumping station for the two different water sources (groundwater (GW) and surface water (SW)) and sampling seasons (ST2, ST3, and ST4). Figure 5 represents bubble plots of the sample values of each water quality parameter at each sample location for the four variables (DO, TDS, Cl, and NH4+). Scatterplots and bubble plots for the remaining variables are presented in Figure A1, Figure A2, Figure A3, Figure A4, Figure A5, Figure A6, Figure A7 and Figure A8 in Appendix A. Each variable has two panels for the two different water sources (groundwater (GW) and surface water (SW)).

Table 1.
Descriptive analysis table for numerical variables.
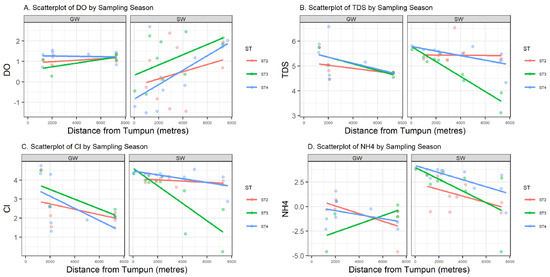
Figure 4.
Scatter plots (mg/L) of log-transformed DO (A), TDS (B), Cl (C), and NH4+ (D) versus distance to the Tumpum station (in meters) for groundwater (GW) (left) and surface water (SW) (right) by sampling season ST. Least-squares linear regression lines are also included.

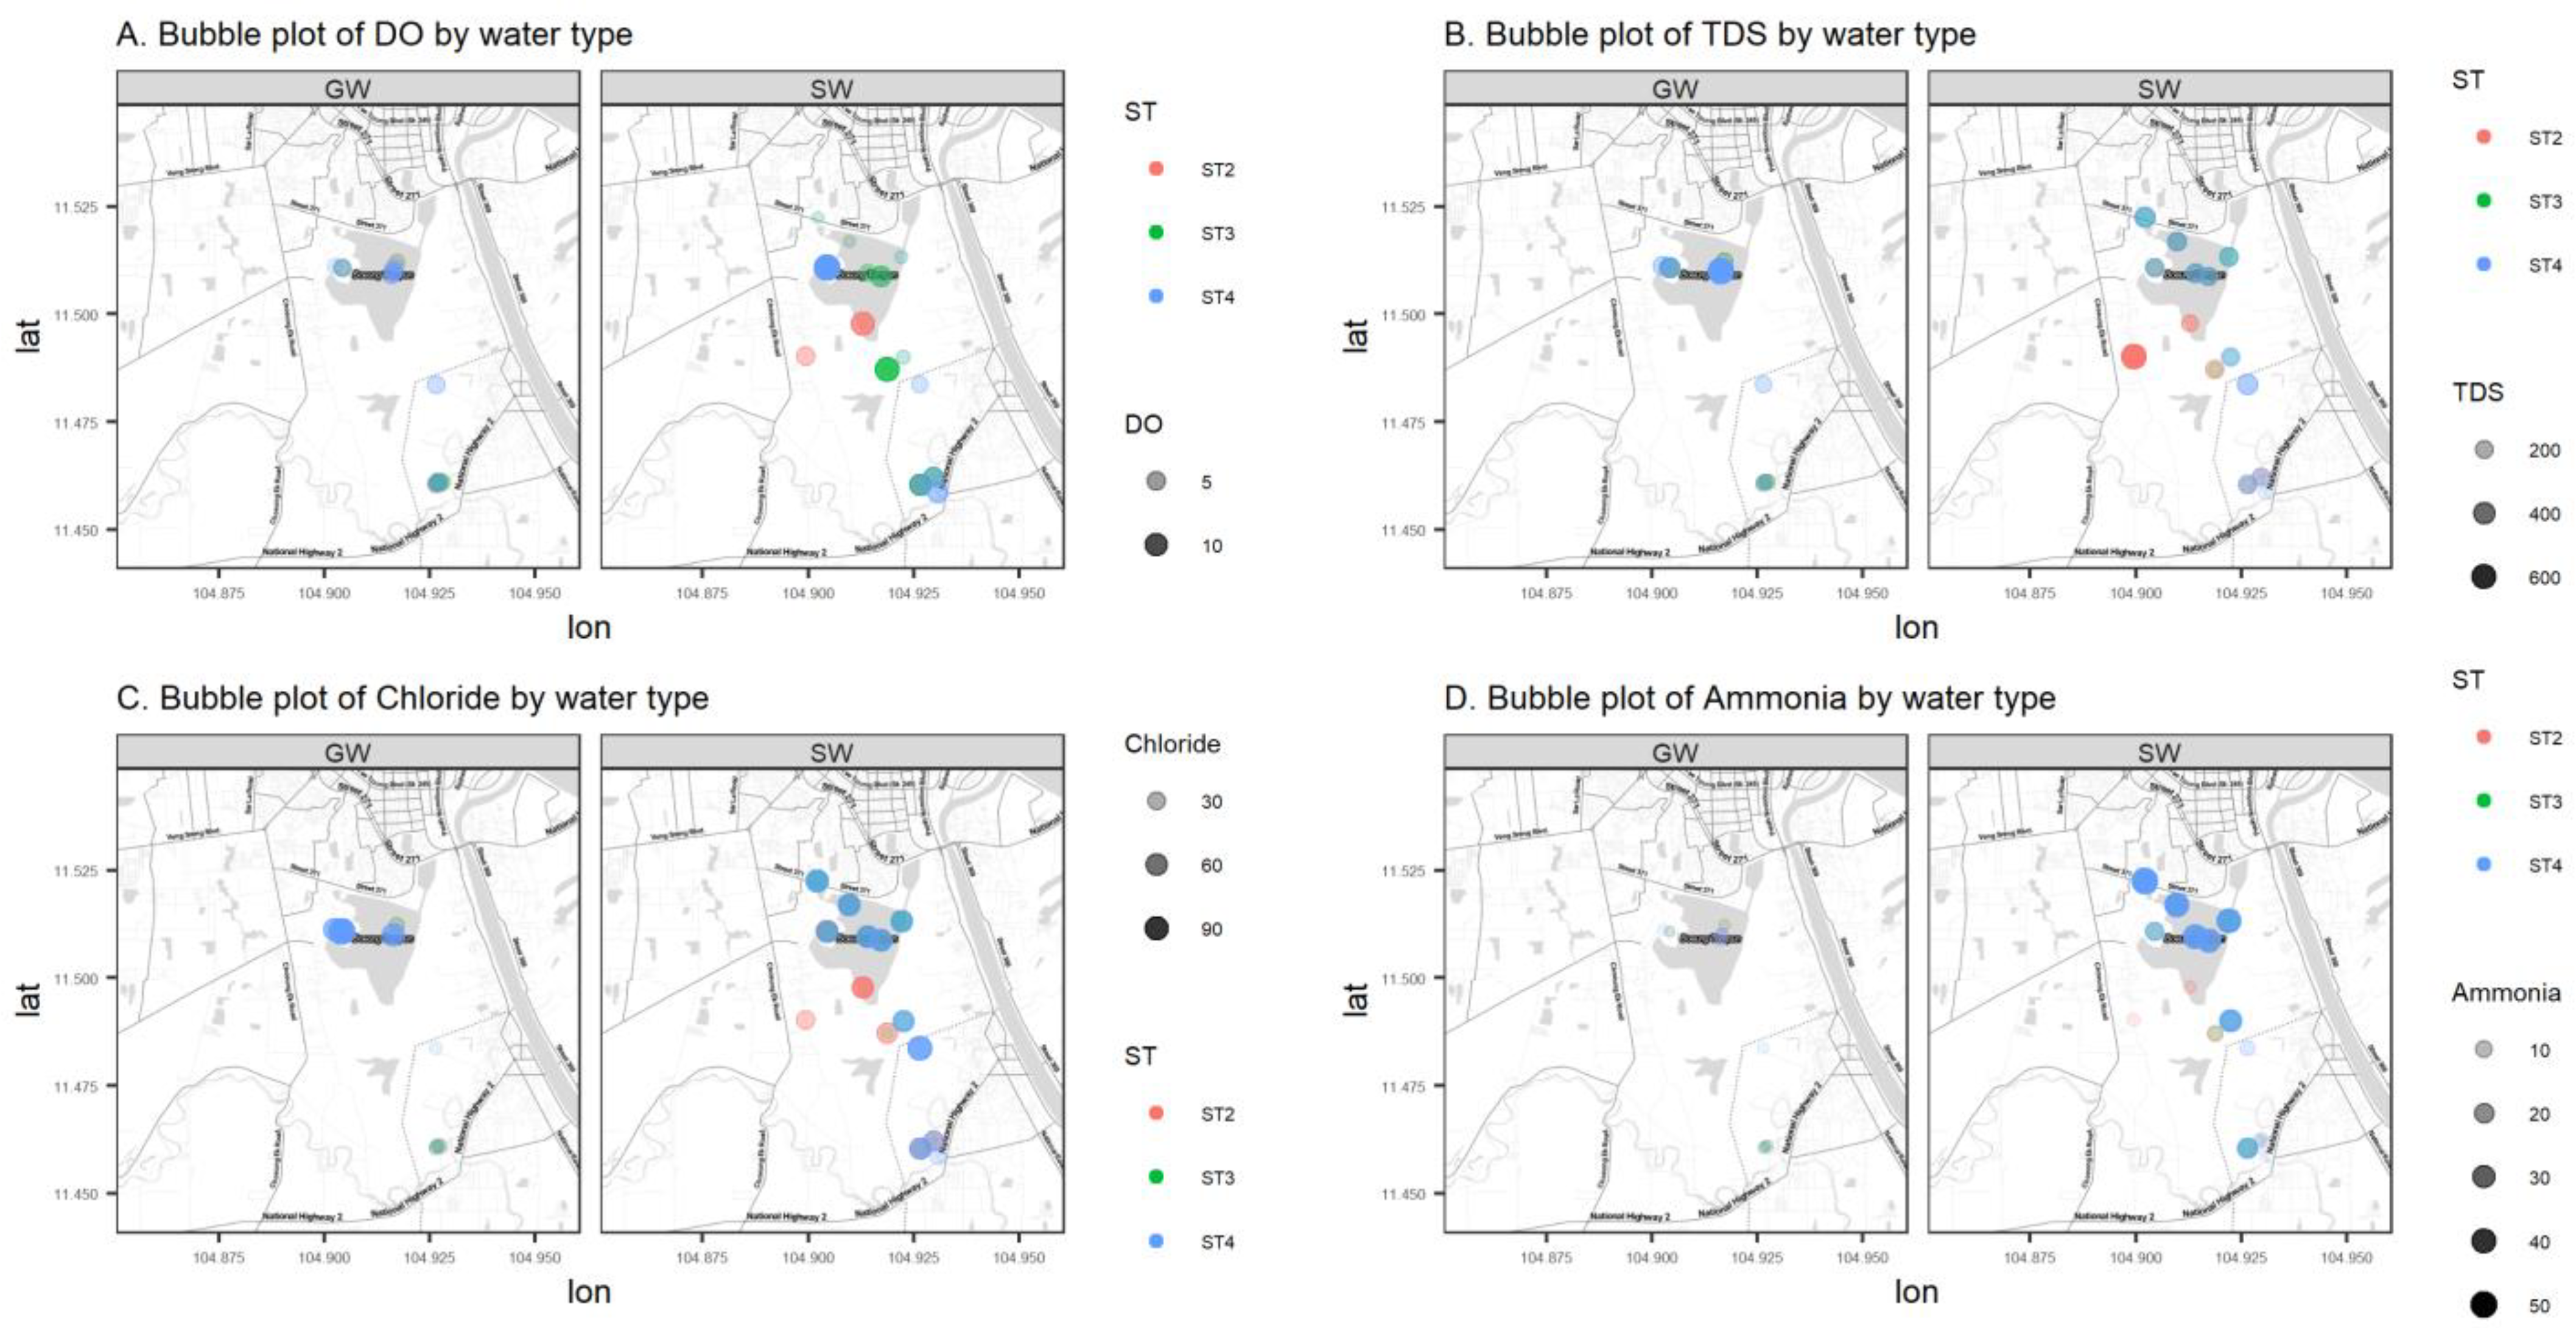
Figure 5.
Bubble plots (mg/L) of DO (A), TDS (B), Cl (C), and NH4+ (D) of groundwater (GW) (left) and surface water (SW) (right) in the study area.
Dissolved oxygen (DO) is the concentration of oxygen in the gaseous phase dissolved in water [13]. In Figure 4 and Figure 5, surface water DO shows a clear pattern: values are lower in the northern part of the study area, which is lower than the water quality standard (WQS) for Cambodia (2 mg/L) [14]. A lower DO value indicates that the water body lacks the ability to decompose or clean contaminants, which corresponds to what is expected. This phenomenon is due to the discharge of the city (northern part of the study area) waste effluent. In contrast, DO in groundwater is relatively stable across the study region. The surface water sampling points ESW22 and WSW22 have higher DO compared with other points, and they are very close to the groundwater sampling points 2PW22 and 1PW22 (locations refer to the labels in Figure 2). This might be an indication of the existing outflow from groundwater to surface water.
The role of pH in modulating most chemical and biological processes in water, is well known [15].
Total dissolved solids (TDS) measure the total dissolved inorganic salts, such as calcium, magnesium, potassium, and sodium, and organic substances [16]. As shown in Figure 4, we can see a relatively higher level of TDS in the northern area and a relatively lower level of TDS in the central area and at the southern outlet. In contrast, variations in TDS in groundwater are unnoticeable.
Nutrients such as nitrate and phosphorous are essential for water-dwelling plants [17]. Cambodia’s WQS has a standard value for total nitrogen, which is below 0.6 mg/L for lakes/reservoirs, whereas for total phosphate it is between 0.005 and 0.05 mg/L for lakes/reservoirs [14]. NO3− in surface water has a maximum value of 34.6 mg/L. This location is downstream of where the southern outlet stream meets the Prek Thnout River during the dry season and the south outlet stream drains the wetland. The highest nitrate NO3− content in our study was found on the Prek Thnout River at SWB35. It represents the mixing between the southern outlet stream and the Prek Thnout river water. PO4 in surface water also exceeds the higher bound of the standard, with a maximum value of 20.6 mg/L. Phosphate is more concentrated in the northern to central areas, where the incoming municipal wastewater comes from (Figure A4). The amount of phosphate in water may lead to excessive algae growth and degrade the water quality. Phosphate is known to bind to soil because of its high adsorption coefficient, which explains the complete absence of phosphate (dissolved phase) in groundwater [18]. Sources of nitrate and phosphate may include septic systems, agricultural fertilizers from the farmer peninsula near sample location 2PW22, and garbage dumps.
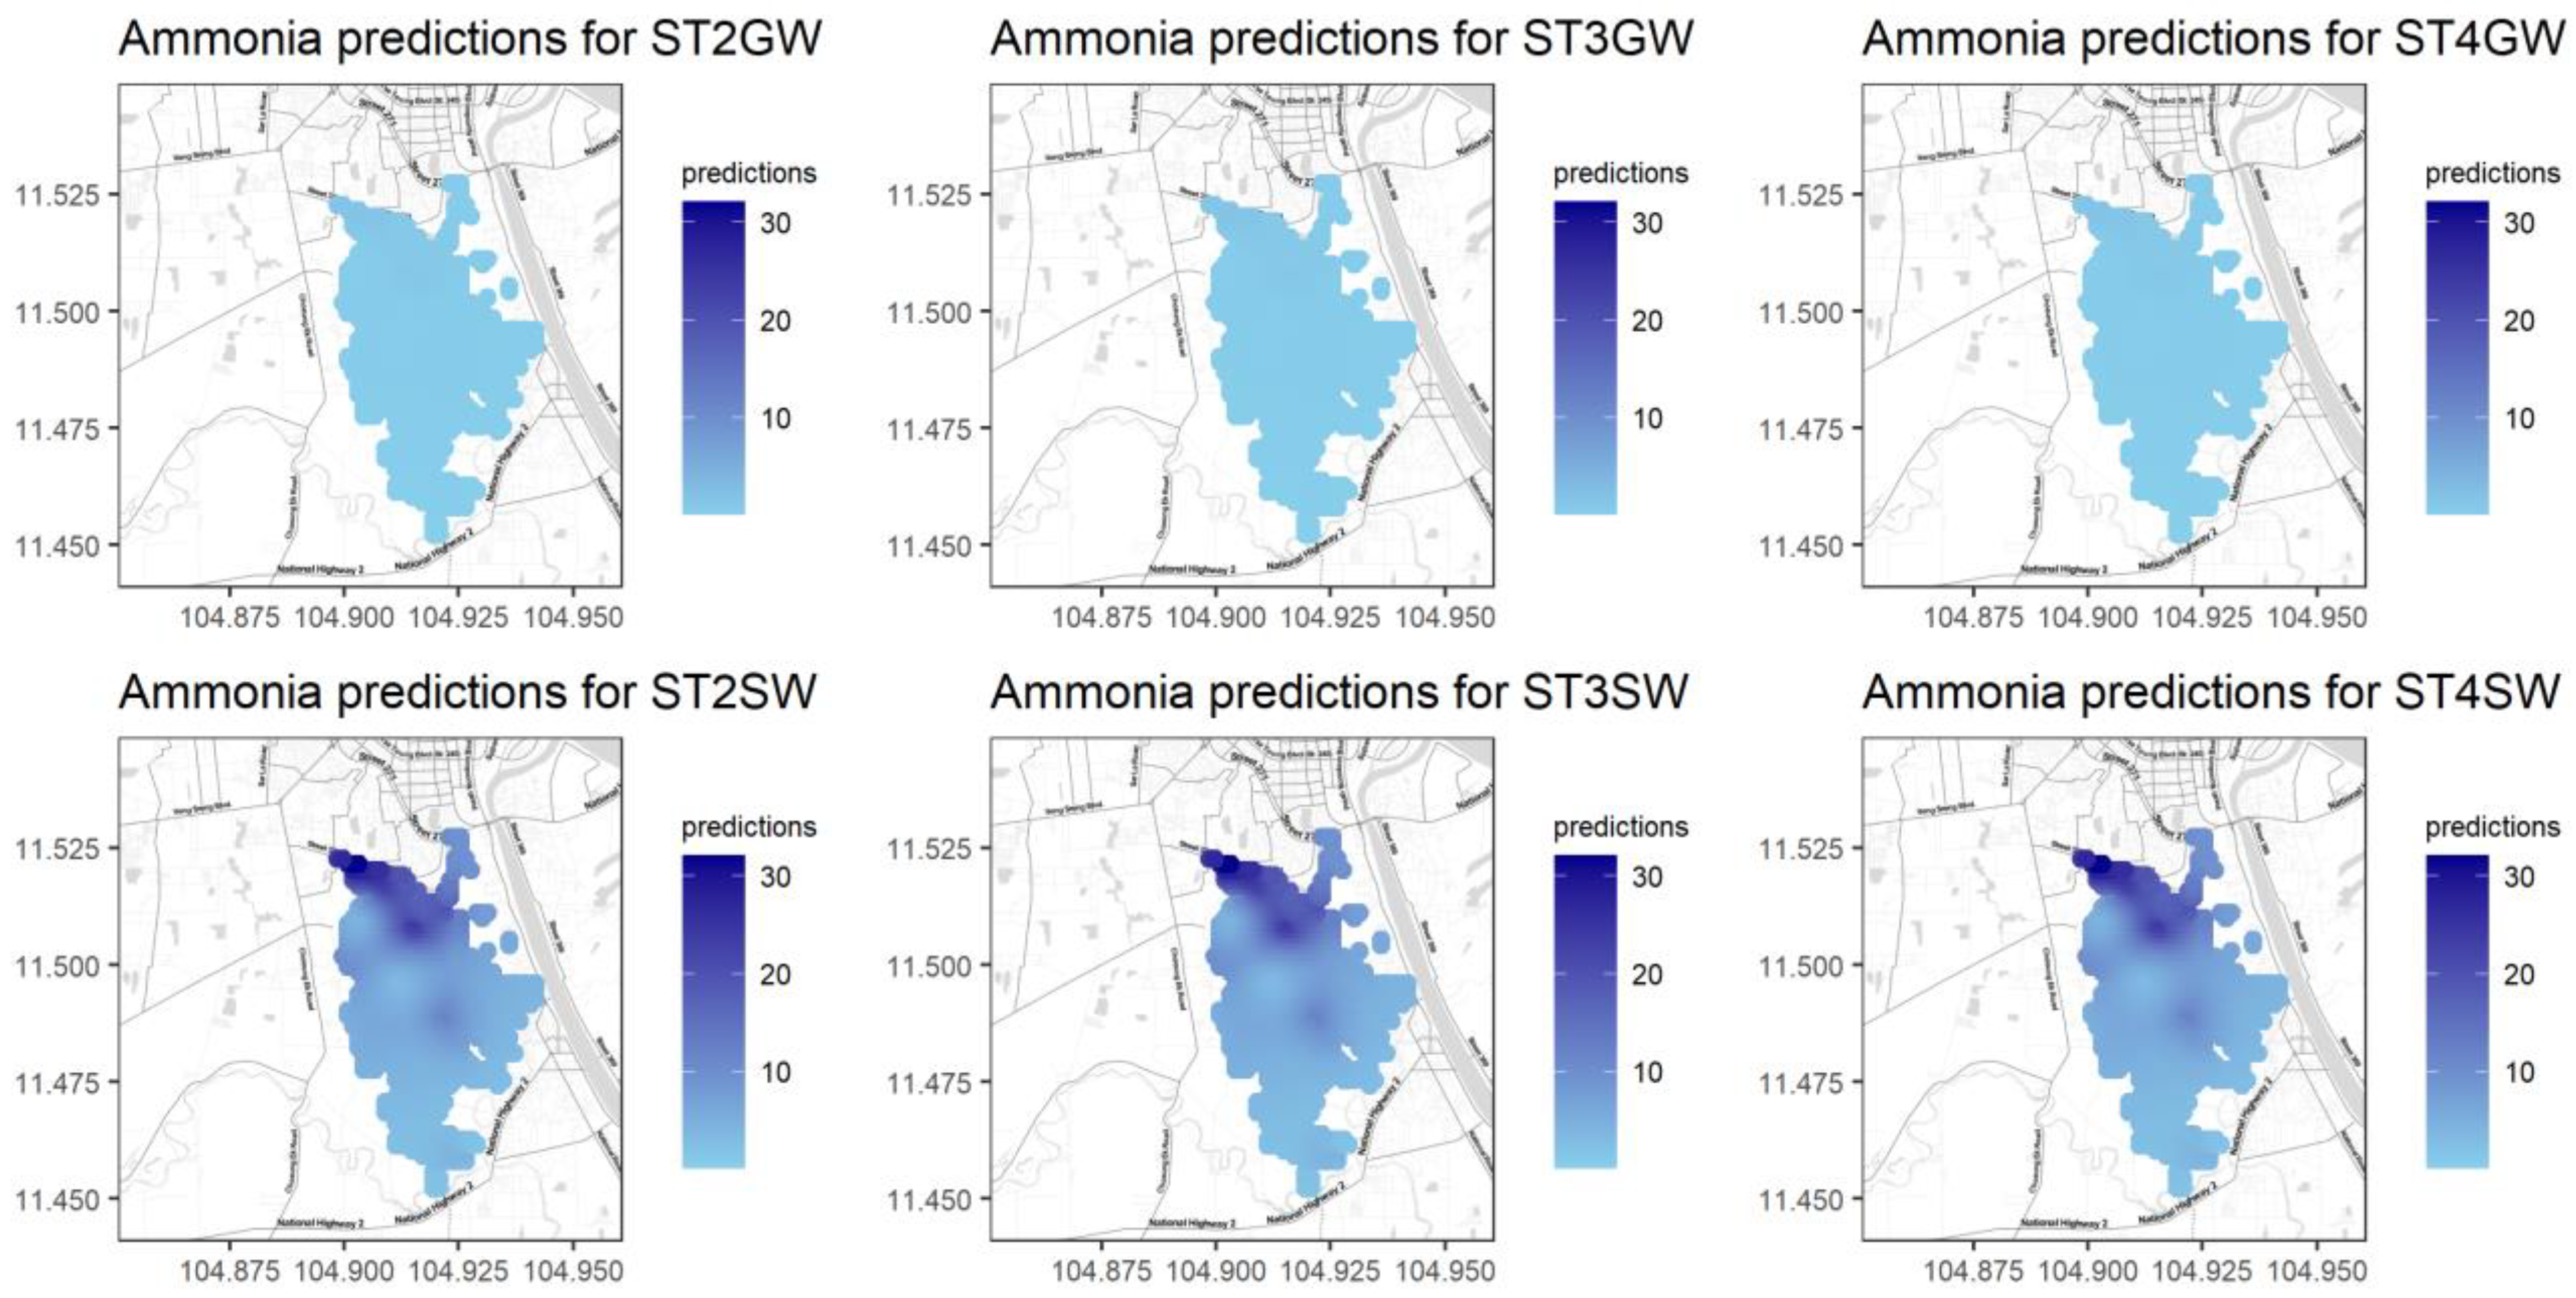
Ammonia (NH4+) is a naturally occurring chemical derived from decomposed animal and plant matter. Ammonia is used in small concentrations to disinfect drinking water. However, too much ammonia in water is harmful to humans and wildlife. The EPA’s most recent guidance from 2013 recommends no more than 17 mg of total ammonia nitrogen (TAN) per liter at pH 7 and 20 °C for a one-hour average duration more than once on average during a three-year period. NH4+ levels are as high as 50.61 mg/L at location 36RW (Figure 2) near the Tumpun pump station. Its concentration decreases with distance from this point and has a more drastic decline in the rainy and post-rainy seasons than in the dry season.
From the descriptive analysis shown in Table 1, it is evident that most water quality indicators show a high degree of skewness. This lack of symmetry suggests the need for a response transformation, except for the variable pH. Logarithmic transformation is widely used as a special case of the Box–Cox transformation family to reduce data variability and normalize the response for accomplishing statistical model assumptions. In this study, log transformation was used as a normalizing and stabilizing variance transformation for all variables except pH.
3.2. Principal Component Analysis
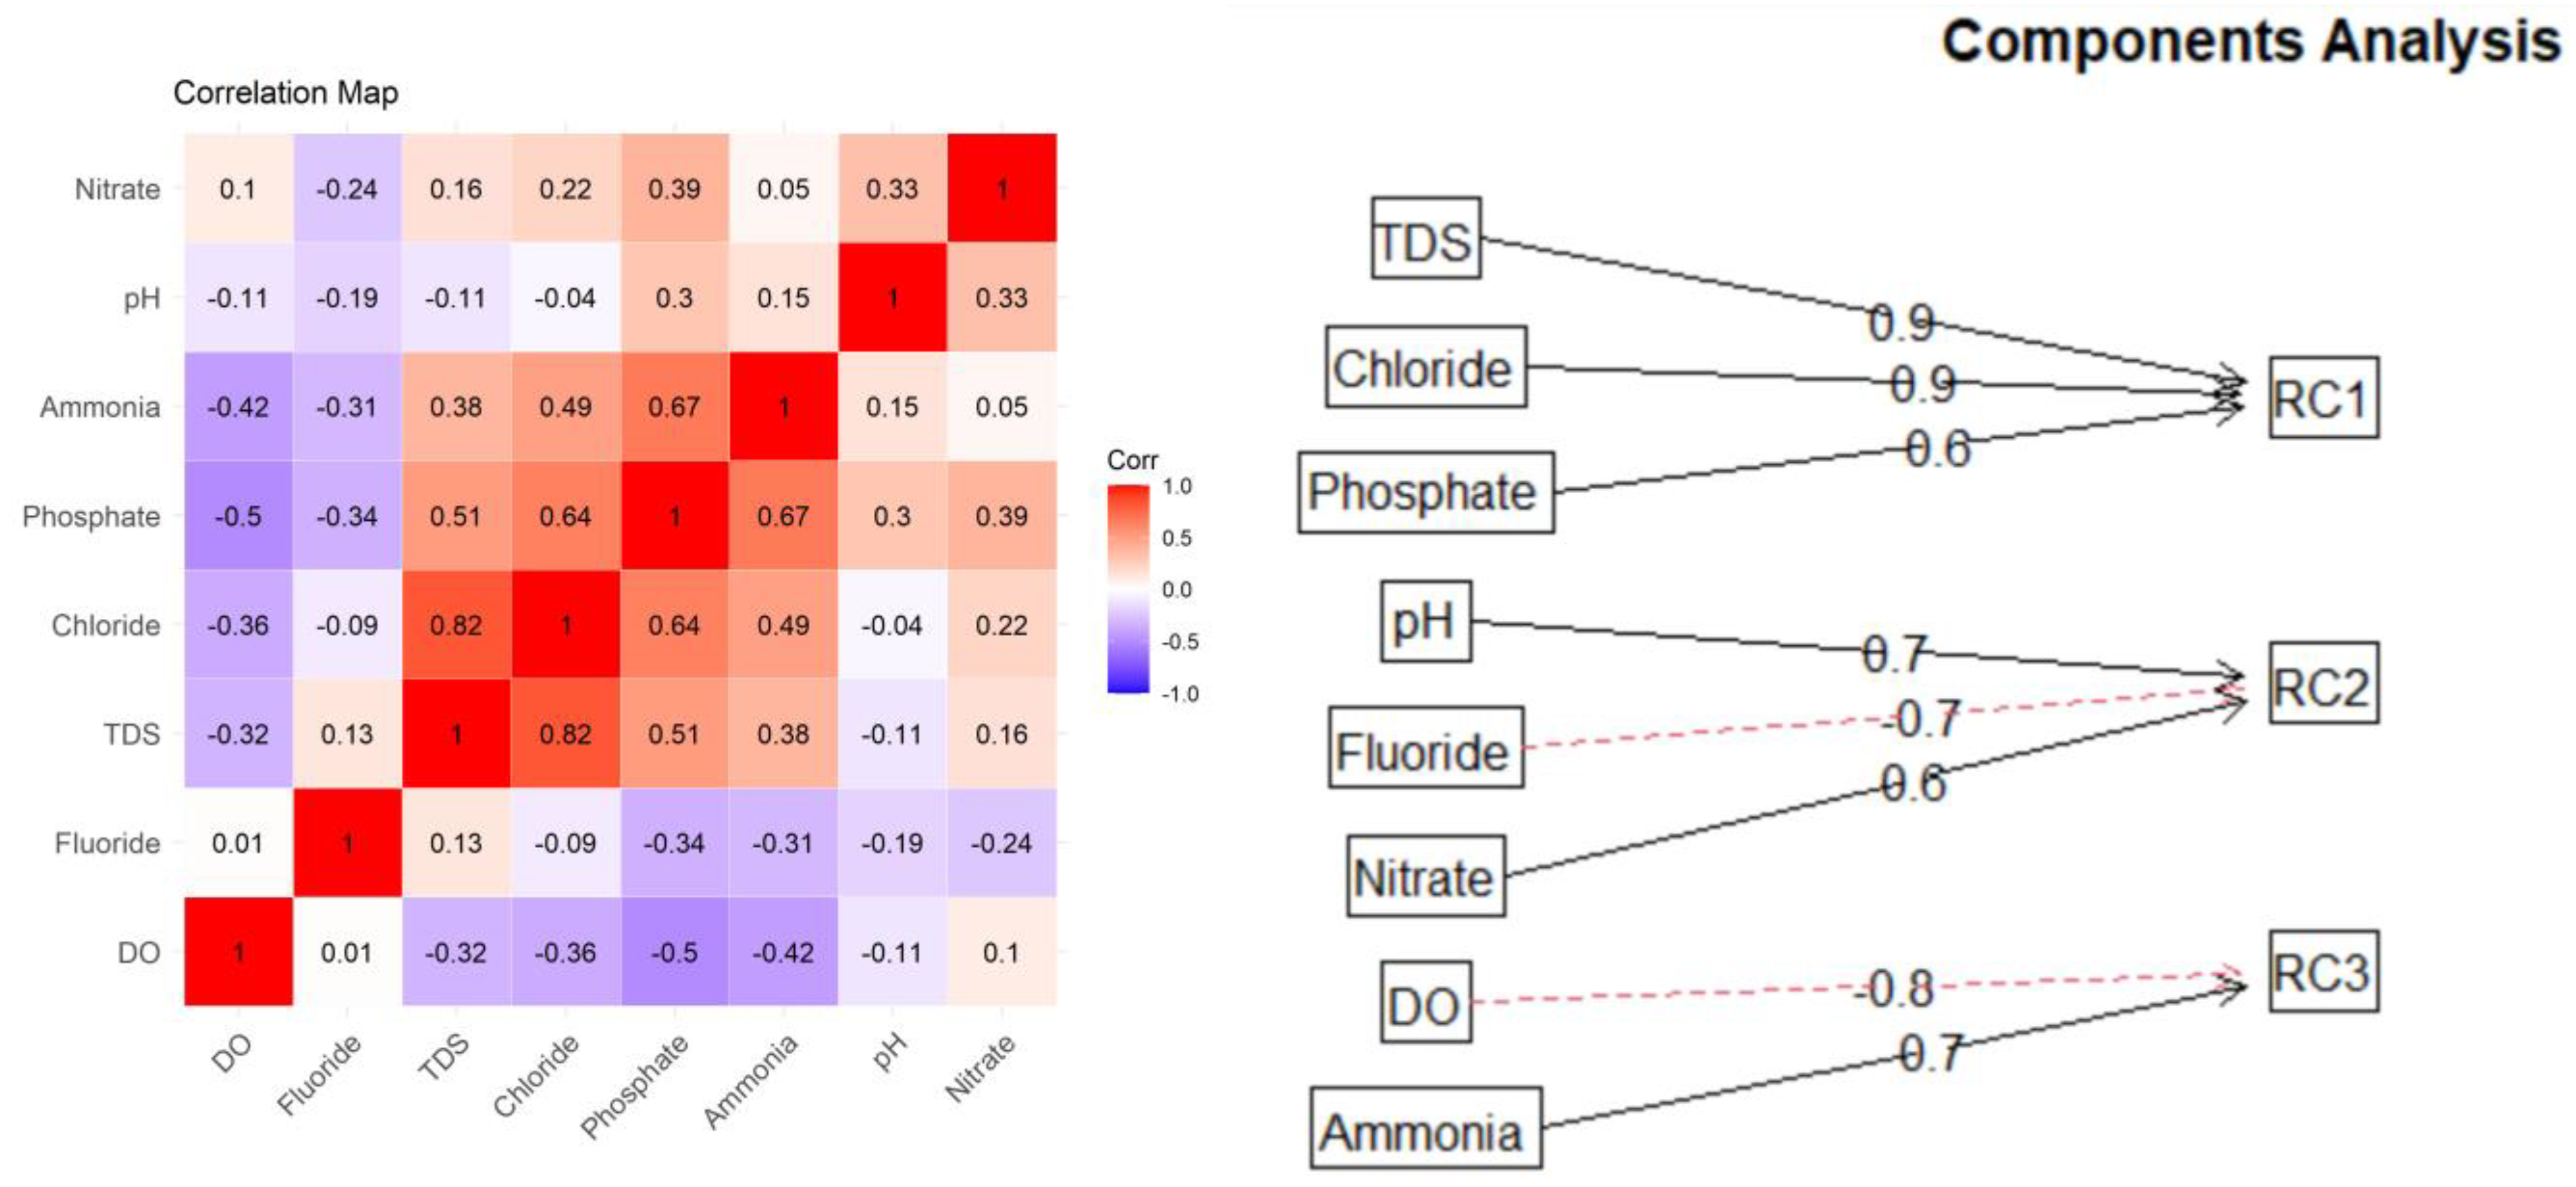
Principal component analysis (PCA) is a well-known multivariate analysis technique used to reduce the dimensionality of a data set, i.e., to find the dimensions of highest variation from a multivariate population. The goal is to explain most of the variation in the original variables with a small set of uncorrelated variables/components, where the new variables/components are linear combinations of the original variables that are highly correlated. The first principal component would account for the highest variation among the original variables; the second and subsequent components would account for most of the remaining variation. Due to the complex mechanisms originating mostly from the chemistry and biological reactions in the water quality parameters, PCA was introduced as a tool to build a water quality index from the new uncorrelated variables/components. Because the water quality assessment problem is high-dimensional in nature and many variables from the original dataset are correlated (Figure 6 (left)), PCA is a convenient way to account for most of the variation in the original dataset.
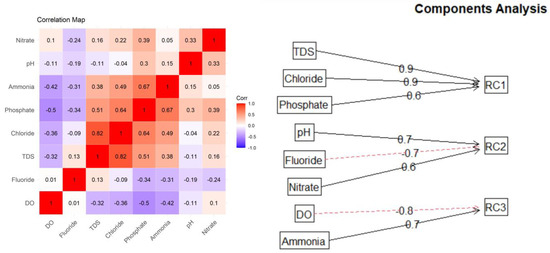
Figure 6.
Correlation matrix (left) and rotated PCA diagram (right) for water quality data using Varimax rotation.
We used the scree plot and parallel analysis to determine the number of significant components that explain most of the data variation. The three components are sufficient to explain most of the variation observed in the data from this study. Different rotation methods, including orthogonal and oblique rotation, were tested. The Promax rotation was chosen because it first performs an orthogonal Varimax rotation and then relaxes the assumption of independence and allows for correlations between the factors to improve the fit [19]. In the rotated PCAs called RCs, the first component (RC1) explains 41.2% of the total variation, the second component explains 30.6% of the total variation, and the last component explains 28% of the total variation (Table 2).
Table 2.
Squared loading factors for Cambodia’s water quality data based on 3 rotated PCs (RCs). (Highest loadings for each variable in bold).
The first rotated component (RC1) relies mainly on inorganic solids (TDS, phosphate, and chloride). Meanwhile, RC2 has larger weights mostly from pH and nitrate parameters and has a negative contribution from F.
4. Methodology
4.1. Trend Surface Analysis
As a first attempt to understand the spatial and temporal variability in the water quality indicators, we used linear regression models under the assumption of a linear relationship between physicochemical responses and several spatially related predictors, such as longitude, latitude, and distance to the Tumpun pumping station. To combine all the data for the different water sources and sampling seasons, two categorical predictors as indicators of water source and sampling seasons were included in the trend model as dummy variables. A linear regression model was fitted to each water quality parameter separately using R software v4.3.2 [20]. The full model for each parameter can be summarized as (using standard R notation)
where P is the response or dependent variable of interest, I(RainfallSeason) is the sampling season factor including levels ST2, ST3, and ST4 (three levels), I(WaterSource) includes two water sources (surface water (SW) and groundwater (GW)), and DistTumpun is the Euclidean distance to the Tumpun pumping station from each sampling point. Other spatial variables such as latitude and longitude are highly correlated with this variable and were excluded from the model. Using the stepwise selection method with the Akaike information criterion (AIC) for model comparison, the model with the smallest AIC value was selected to predict each physicochemical response for the entire study region. The main assumption in this approach is that a linear relationship exists between the response and the predictors, with independent observations for the different locations, and all model errors are independent, homoscedastic (constant variance), and normally distributed.
4.2. Spatial Regression
Due to the lateral and vertical water transport processes of fluid dynamics, the assumption of independence from the standard classical linear regression model might not be valid, and a geostatistical approach such as Kriging is required. As described in the previous section, the aim of the analysis was to use the point measurements from sampling locations within the study area to obtain water quality estimates for the entire region. Kriging is the most common interpolation methodology used to predict variables of interest at locations where no measurements have been made because of physical/logistic constraints or limited resources. It gives the best, linear, unbiased prediction at an unsampled location s0 by finding the value c such that , where λi0 is the weight associated with each data point for i = 1, 2, … n.
Universal Kriging, which relaxes the assumption of a constant mean across the spatial field (to allow the mean of the process to vary in different locations), was used in this study. We considered spatially indexed observations P(si) for i = 1, 2, … n, where si are the point locations defined by longitude xi and latitude yi (si = (xi, yi)) and Pi = P(si) is the data measurement for the variable of interest.
The spatial model can be expressed as
where M(Si) is a large-scale trend and Zi = Z(si) is a random vector defined at known locations si ∈ D of a given domain of interest D ⊂ R2, i = 1, 2, …n, with the mean equal to the zero vector 0 and variance–covariance matrix Σ(θ), where θ is a parameter vector describing Σ. ε(si) is a zero mean independent error term with variance τ2 normally known as the nugget effect. M(si) follows an additive linear model of the previously mentioned predictors representing the spatial trend: I(WaterType) + I(RainySeason) + DistTumpun. The diagonal entries of the variance–covariance matrix are σ2 = Var(Z(si)), and the off-diagonal entries are defined by the covariance function = C(h) = Cov(Z(si), Z(sj)), which captures the spatial association between locations si and sj, where h =∥ si − sj ∥ is the Euclidean distance between locations si and sj. Here, h is assumed to be the Euclidean norm ∥ h ∥, so the covariance function C(h) is isotropic, which removes the direction dependence from the spatial analysis. In other words, the covariance function C(h) depends only on the distance between any two locations, excluding directional dependence.
We considered the observed points Pi as realizations from an underlying Gaussian stochastic process for the entire region. Under the assumed model, the mean of the process E[P(si)] = is a linear combination of the explanatory variables fj, which describes the underlying spatial trend or large-scale variations. The variance–covariance matrix is Σ(θ) + τ2I, where I is the identity matrix. In practice, the semivariogram γ(h) is used instead of the spatial covariance function when interpolating geostatistical data. Recall that we have γ(h) = 1/2Var[Z(si) − Z(si+h)] = 1/2E[(Z(si) − Z(si+h)2].
4.3. Cross-Validation
To assess the model prediction performance, a 10-fold cross-validation methodology was implemented. The complete dataset was randomly partitioned into 10 subsets of samples (referred to as 10-folds). Among the ten-folds, nine-folds were used as the training data set, while one-fold was used as the testing data set. The models were fitted using the training sets, and all predictions were computed using two different methods: linear trend surface analysis and a spatial regression model with REML estimation.
Finally, the overall prediction error was computed as the average prediction error by repeating the above process for each data fold. In this study, the root mean square error (RMSE) was used to evaluate the linear trend model and the spatial regression model predictability performance. The RMSE is calculated using the following equation:
where P∗i is the linear model/Kriging prediction and Pi is the original/true measured value. The smaller the value of the RMSE, the better the model predictive performance.
4.4. Water Quality Index
The water quality index (WQI) is a composite index that quantifies the overall water quality of a study region, turning highly dimensional complex water quality measures into one single quantity, which helps in communicating information to policy makers and assisting in the design of environmental policies [21]. Many methods are used for calculating water quality indices, mostly involving the transformation of multiple water parameter measurements. These methods mainly fall into two categories: mean function and minimum operator, where the mean function can include several statistics such as geometric mean, arithmetic mean, and harmonic mean [22]. Normalization or standardization is usually used in most water quality index studies, followed by a weight/rank assignment to the water parameters according to their importance. Thus, a water quality index can be viewed as a weighted average/sum of several water quality parameters. Different weighting/ranking methods have been used in various studies and were comprehensibly summarized in the 2007 United Nations Environment Programme (UNEP) report [23]. Since there is not a universally accepted or regulated water quality index, the index number can fall within the range of 0–100 (unitless, with a lower number indicating a poorer quality of the water body) [23,24], or it might exceed 100 when using other methods [25,26].
In this study, we used the modified hybrid aggregation method of weighted arithmetic and weighted harmonic mean as proposed by Tripathi et al. [27]. As discussed in Section 4, PCA is a commonly used method to identify the main dimensions or components of the total variation among a set of variables. It can also be used to determine the optimal weighting factors in the WQI calculation. Instead of relying on experts or technicians to provide weights for each water parameter subjectively, a statistical tool is preferred because it reveals the relative contributions of the original variables to the new components.
The squared factor loadings for each water parameter are summarized in Table 2. The largest values (in bold) for each parameter across all components are used to identify the parameter associated with each component. Each squared loading measures the proportion of variability in each parameter captured by each principal component (as a percentage). For parameter DO, for example, 61% of its variability is captured by Component 3. There are three parameters with maximum variance accounted for by component 1: TDS, Cl, and PO4. Each parameter’s variance or squared loading was then scaled to the sum of the maximum variances and is listed as Scaled in the table. Finally, the calculated weight for each parameter is the scaled variance multiplied by the proportion of the total variability explained by each principal component (0.41 for Component 1, 0.31 for Component 2 and 0.28 for Component 3). In this way, we can assure that all weights add up to 1.
For a given water quality parameter Pi, assume that λ2ij is the squared loading of parameter Pi on the component RCj with i = 1, … P, j = 1, 2, 3. The WQI weight (Wi) for parameter Pi is calculated as follows:
We use dissolved oxygen (DO) as an example. The weight is calculated by first finding the rotated component that has the highest squared loading for this variable, i.e., RC3 (0.61). Now, we highlight the variables for which this RC has the highest squared loading, which includes NH4+. We consider RC3 to be composed of only these two variables. Thus, the scaled weights are calculated as the fraction of the squared loading of each variable from the sum of these squared loadings. Thus, DO obtains 0.57 and NH4+ obtains 0.43 (note that their sum is 1). Finally, the weights are calculated by multiplying the scaled loading by the proportion of variation explained by the corresponding RC. For DO, it is RC3, which explains 0.28 of the total variation. Thus, the final weight WDO = 0.28 ∗ 0.57 = 0.16.
The WQI provides an assessment of BCE. It indicates that DO and NH4+ are the main issues that impact the water quality. This shows that DO is being used during the treatment of the sewage along BCE, thus improving the quality before it discharges into the Bassac River. This shows that even with the filling-in of BCE there is still treatment of the sewage. The NH4+ is also changing throughout and indicating that the nitrogen cycle is at full force throughout BCE. Again, this indicates that BCE is treating the sewage. With the continued filling-in of BCE due to urbanization, this might impact the function of BCE to treat waste.
5. Results and Discussion
In this section, we present the main results from fitting a multiple linear regression model to each water quality parameter as a function of location-dependent covariates including categorical predictors such as the water source (groundwater and surface water) and the sampling seasons (ST2, ST3, ST4). Next, we present the results of fitting a spatial regression model using Kriging to account for potential spatial correlations among observations from different locations. A 10-fold cross-validation approach was used to assess the prediction accuracy among the two different methods used: linear regression and kriging with REML variogram estimation. Finally, a spatial water quality index (WQI) was calculated from the spatial predictions at each location using appropriate weights and admissibility values for each water quality parameter.
5.1. Linear Regression
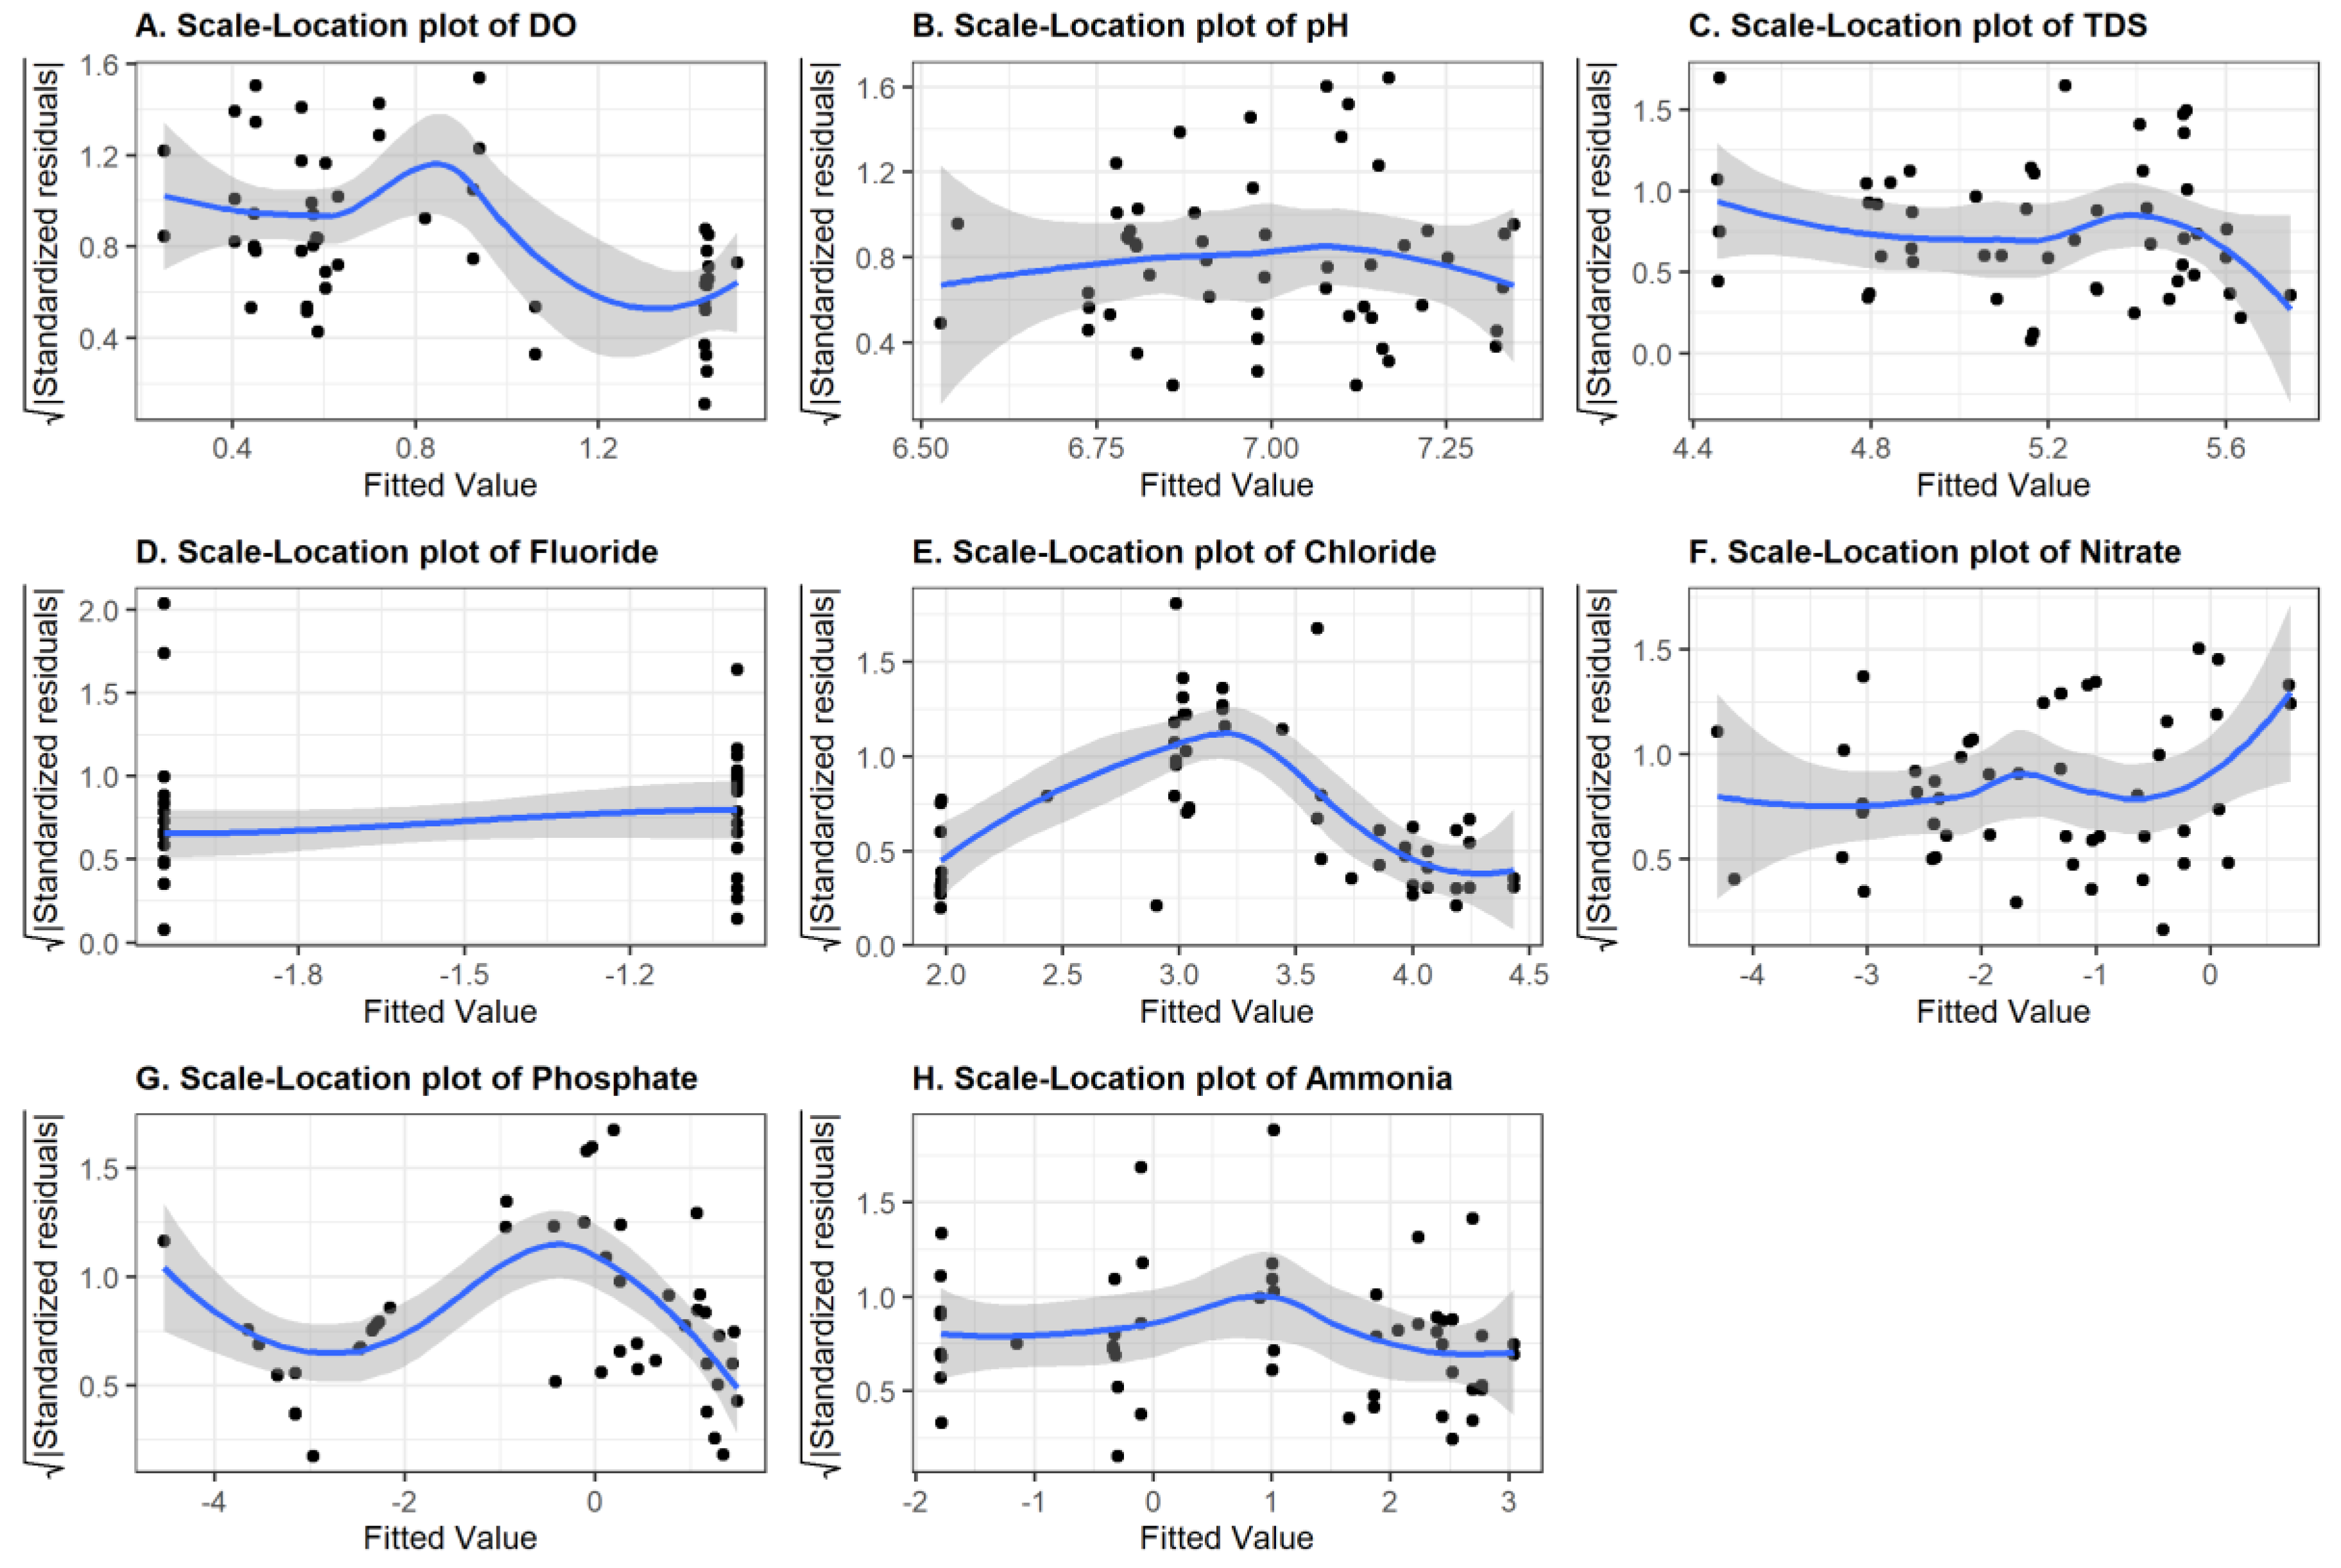
Multiple linear regression models with log-transformations of the response variables were fitted using least-squares estimation. Model selection using backward elimination with the Akaike information criterion (AIC) was used to identify the best predictors. Figure 7 shows plots of the squared root of the standardized residuals (in absolute values) for each water quality parameter against the fitted values. There are signs of violations in the assumption of linearity and constant variance (homoscedasticity). When we tested whether that was indeed the case using the Breusch–Pagan test, we obtained the results summarized in Table 3. A p-value of less than 0.05 implies that the variance is not constant (heteroscedasticity). This is the case for variables DO and PO4. The residual trend lines shown in Figure 7 are not constant for every plot, which suggests some violations of the linearity assumptions. An outlier test was performed for each model residual. The presence of outliers was detected in the data for variables F, Cl, and NH4+. Because we had only a couple of outliers, we decided to keep them because we had very few observations and removing these data points did not improve the prediction accuracy.

Figure 7.
Diagnostic plot (Scale-location plot) of DO (A), pH (B), TDS (C), F (D), Cl (E), NO3− (F), PO4 (G), and NH4+ (H).
Table 3.
Results for the Breusch–Pagan homoscedasticity test.
5.2. Spatial Regression
Kriging predictions were obtained in this study assuming a non-constant spatial trend (Universal Kriging). To solve the problem of duplicated locations, jittered values for duplicated coordinates were used by setting a maximum jittering distance of 0.001 between locations. The eight water parameters were predicted for the two water sources and three sampling seasons using a grid size of 10,000 location points covering the study region. Different spatial trend models were selected for each water parameter on the basis of the stepwise model selection method using the AIC information criteria. The AIC values before and after variable selection are shown in Table 4. Spatial trend models with the lowest AIC values were used in the Kriging model with a fitted variogram using the REML method. For the variables pH, NO3−, and PO4, the full linear regression model (including all predictors) was selected.
Table 4.
AIC backward selection results.
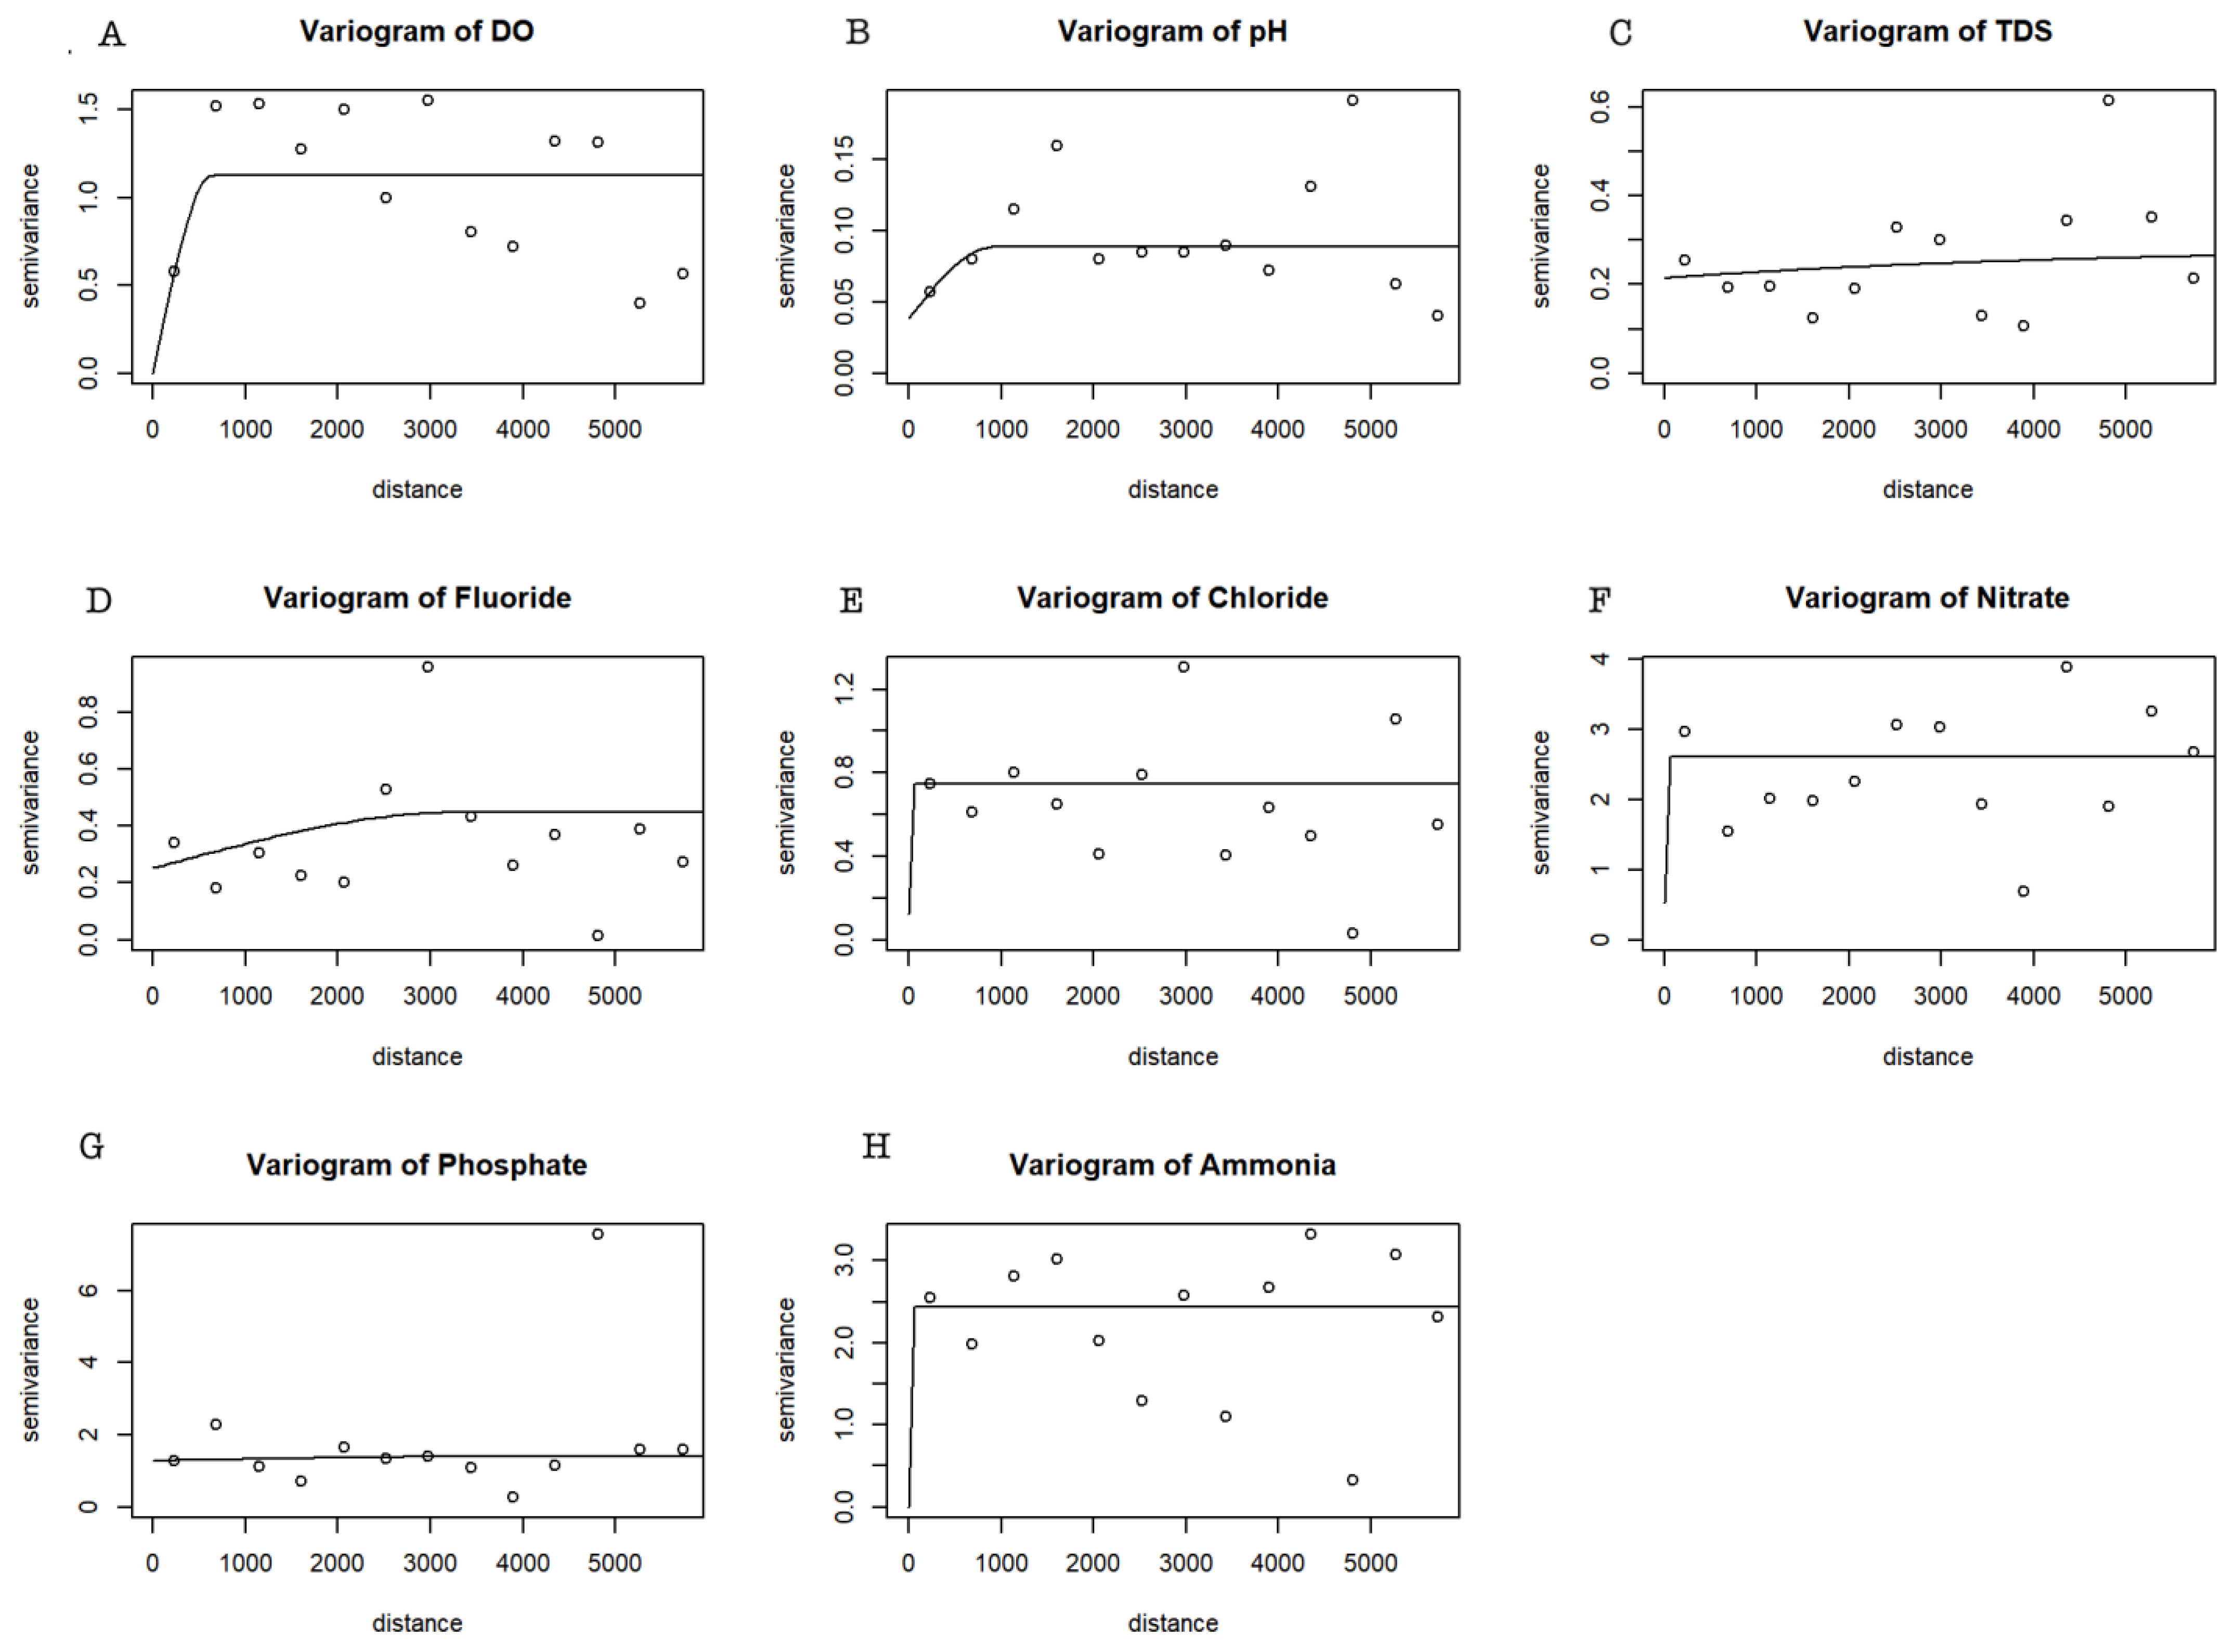
The variogram characterizes the spatial dependance of the data and local variability. It can also serve as a tool to examine the spatial correlation strength for the water quality variables. The fitted semivariogram models using REML are shown in Figure 8, and the estimated semivariogram parameters (nugget, sill, and range) are shown in Table 5.
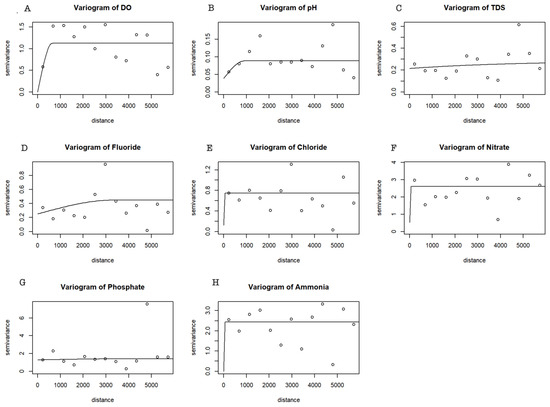
Figure 8.
Variogram plots for DO (A), pH (B), TDS (C), F (D), Cl (E), NO3− (F), PO43− (G), and NH4+ (H). The solid line represents the theoretical models fitted by REML and points represent empirical variogram estimations.
Table 5.
Variogram Fitting Results.
Spatial dependence levels are classified on the basis of the estimated nugget-to-sill ratio: when the nugget-to-sill ratio is greater than 0.75, there is a weak spatial dependence; when the nugget-to-sill ratio is between 0.25 and 0.75, it is redeemed, showing moderate spatial dependence; and when the nugget-to-sill ratio is less than 0.25, it is classified as a strong spatial dependence [28]. All variables show a weak spatial dependence, and one might consider ignoring the spatial dependance to make predictions of the water quality parameters at other locations; however, a closer predictive assessment was used to compare a linear regression approach with a Kriging model.
Spatial predictions using the linear regression model and the Kriging approach with REML were compared using the 10-fold cross-validation approach described in Section 4.3. Comparisons of the cross-validation RMSE for each regression method are shown in Table 6 for each water quality parameter. Spatial regression using Kriging shows a smaller RMSE in most cases when compared with the linear regression model for all water quality parameters. These results confirm the suitability of the Kriging approach over linear regression for water quality prediction.
Table 6.
RMSE results for linear regression (with cross-validation) and Kriging with REML estimation.
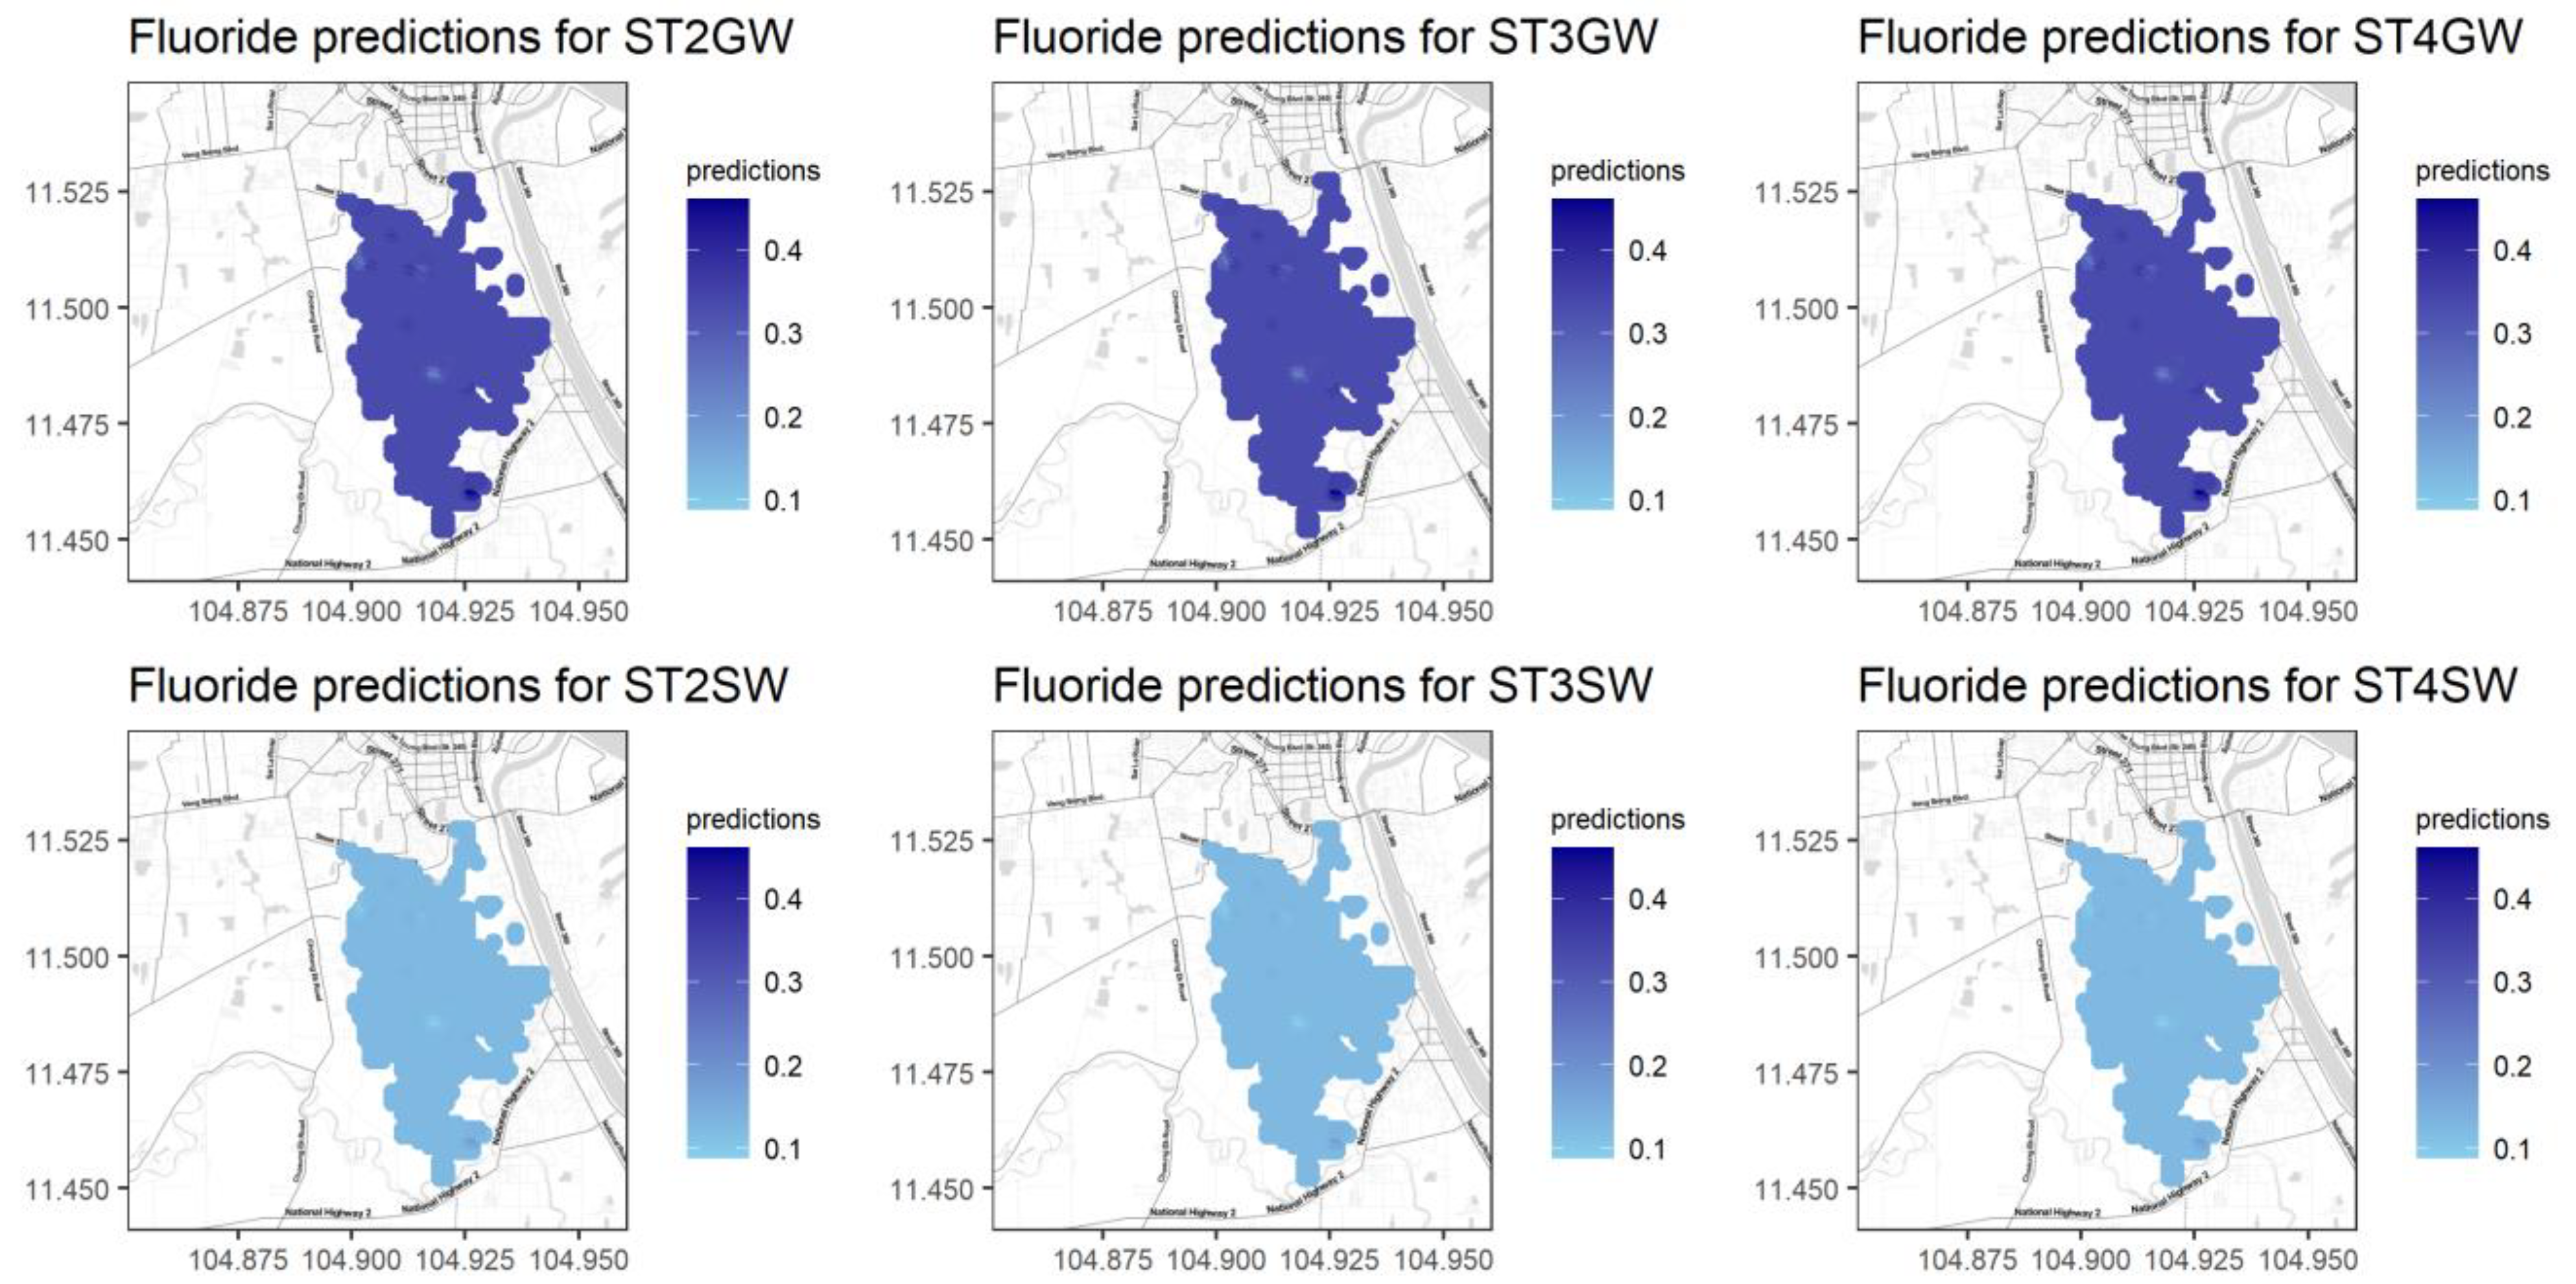
Figure 9 shows the Kriging results for variable F, which only has the water source as a significant predictor. The mapping results are not very different among seasons and at different locations, but they differ considerably between the two water sources. F has larger values (a darker color) for groundwater and lower values (a lighter color) for surface water. This spatial trend coincides with the higher concentrations of pollutants at the inlet of the water body, which are caused by the direct city wastewater discharge into the BCE wetland. The villages (Stueng Chrov, Cheung Aek, and Praek Ta Kong) [29] located near the boundary of the study region possibly contributed higher amounts to the Kriging results. Maps with the Kriging results for the remaining variables are presented in Figure A9, Figure A10, Figure A11, Figure A12, Figure A13, Figure A14 and Figure A15 in Appendix A.
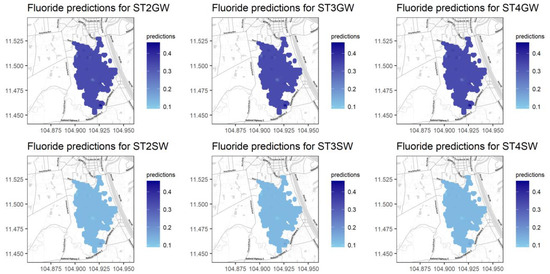
Figure 9.
Kriging results for the variable F with REML fitting.
5.3. Water Quality Index (WQI)
The Universal Kriging model with a linear trend was used to make spatial predictions for each water quality parameter, water source, and sampling season, resulting in 8 × 2 × 3 different maps (8 water quality parameters × 2 water sources × 3 sampling seasons). The water quality index was built from these predicted values using the modified weights (loadings) from the PCA. Once the index was built, the resulting maps of the water index were finally produced for the entire region.
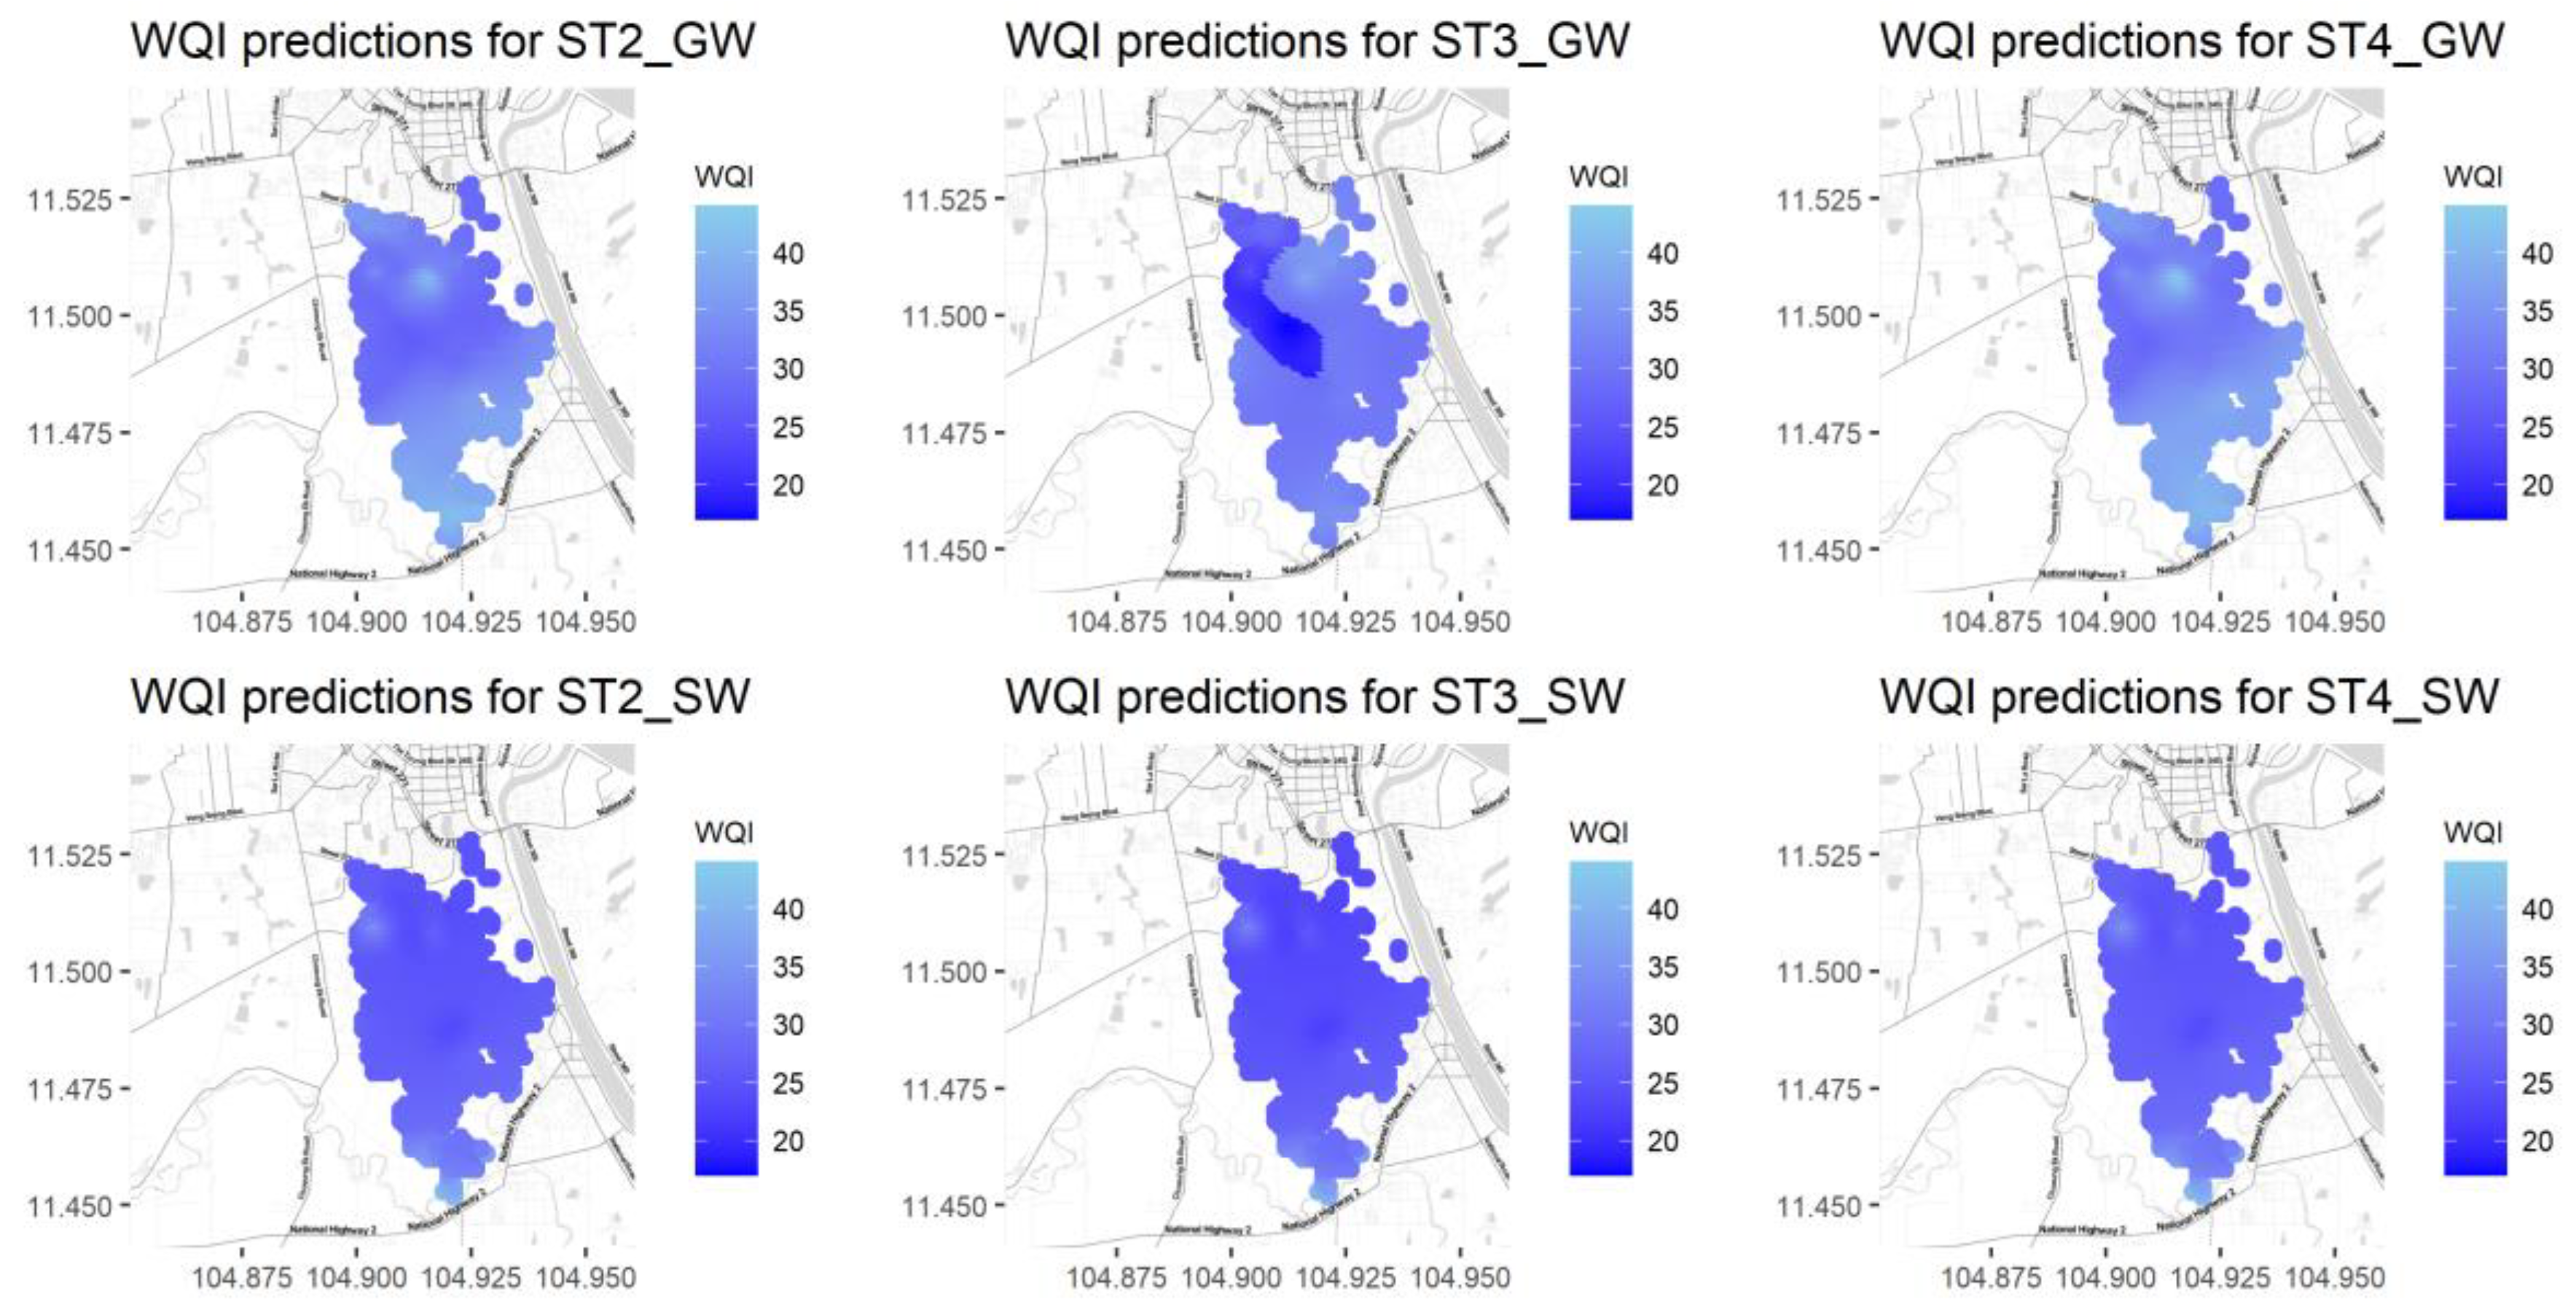
As previously mentioned, the WQI was calculated after first normalizing the water quality parameters and then multiplying their values by their corresponding weights. In this study, the water standards in Cambodia shown in Table 7 (Drinking Water Quality (CDWQ) standards) [29] were used as thresholds in the normalization process. In the case of variables DO, F, and PO4, US EPA standards [30] were used instead of Cambodian standards. Figure 10 shows the water quality index map over the study region for different seasons (ST2, ST3, and ST4) and water sources (SW and GW). Darker colors represent the worst water quality values (lower WQI values). The REML method results show a worse water quality condition during the rainy season (ST3) for groundwater compared with other seasons.
Table 7.
Water quality standards for water variables.
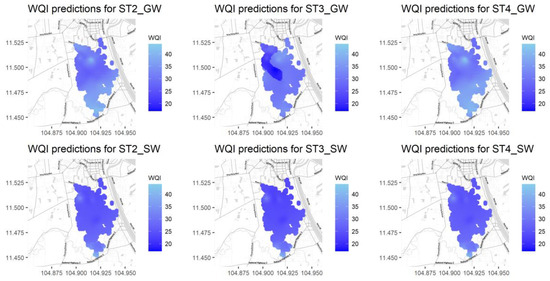
Figure 10.
Water quality maps for groundwater (top) and surface water (bottom) for the three rainfall seasons ST2, ST3, and ST4 from left to right.
In general, water quality values are worse for surface water than for ground water. In addition, the northern part of the study region also shows poor water quality for all seasons and both water types. This might be due to the problem caused by the municipal wastewater discharged from Phnom Penh city. The rainy season (ST3) water quality map shows a darker color when compared with the ST3 and ST4 results, meaning that water is also of a poorer quality and in worse condition during the rainy season when compared with season ST2 and the dry season (ST4). These results are in agreement with the physical processes occurring because of the mixing effect of rainfall over the wetland in the removal of contaminants across the region associated with infiltration, surface runoff, and lateral water transport processes.
6. Conclusions
Mapping the concentration of different water quality parameters has significant value in helping us to understand the spatial variability in water quality over a water body. This study is especially important in the complex environmental setting of Phnom Penh, where human activities resulting from urban areas, industry, and agriculture have a great impact on the water quality of a valuable wetland area such as the BCE study region. In the absence of proper water treatment, BCE works as a natural water treatment body for wastewater inflow from the two main outlet pumping stations in Phnom Penh. Knowing the extent of this filtering capability might also be a useful tool for the ecological valuation of this important wetland ecosystem.
The universal Kriging model for spatial prediction includes a trend surface component that accounts for the large-scale variability in water quality parameter concentrations, together with the small-scale variability associated with spatial correlation and local measurement errors. Given the limited number of sampling locations, the possibility of using the entire dataset to understand the overall spatial variability in each parameter among seasons and water types provides an effective use of the entire dataset. By taking the log transformation, each parameter’s skewness is reduced before applying the Kriging model. Variogram models were fitted to the empirical variogram to quantify the spatial dependence, and the spatial dependence strength was analyzed using the nugget-to-sill ratio. Even with a weak spatial dependence, the prediction accuracy results using cross-validation show that spatial regression including spatial dependence is a better fit for most parameters than the classical linear regression approach assuming independence. This suggests that universal Kriging is a useful tool for mapping the distribution of chemical concentrations over the study region.
The mapping results for all water quality parameters can be combined to produce a single water quality index. The results indicate that the water quality is poorer in the northern section of the study area compared with the southern region. This is due to municipal wastewater being released directly into the BCE wetland. The results also show that, across rainfall seasons, groundwater tends to have better quality versus surface water. These findings can support sustainable development efforts, as they potentially confirm the need for the wastewater treatment facility currently under construction using funding from the Japanese International Cooperation Agency (JICA). This product can be useful in assisting and communicating the water quality status of the study region to support any decision-making process on managing water resources and water quality control. It can also serve as an information tool in a decision-making process; for example, in supporting further actions to correct the situation previously mentioned, where no wastewater treatment plant in the surrounding area was available. This study further supports the implementation of informed sustainable wastewater management in the city.
Author Contributions
Conceptualization, S.V.M. and M.L.; methodology, S.V.M., M.L., L.B.d.G. and S.S.; software, L.B.d.G. and S.S.; formal analysis, S.V.M. and S.S.; investigation, M.L. and S.V.M.; resources, M.L. and L.B.d.G.; writing—original draft preparation, S.V.M. and S.S.; writing—review and editing, M.L. and L.B.d.G.; visualization, S.V.M., L.B.d.G. and S.S.; supervision, M.L.; funding acquisition, M.L. All authors have read and agreed to the published version of the manuscript.
Funding
This research received no external funding.
Data Availability Statement
The data presented in this study are available on request from the corresponding author.
Acknowledgments
The authors are very thankful to Jiaxing Li for her invaluable support in data processing and software development during the initial stages of the project. The authors would also like to thank the three reviewers of the paper who greatly improved the quality of the paper.
Conflicts of Interest
The authors declare no conflict of interest.
Appendix A. Scatter Plots, Bubble Plots, and Spatial Predictions of Remaining Water Quality Parameters
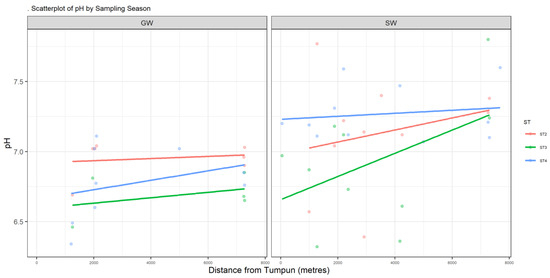
Figure A1.
Scatter plot of pH.
Figure A1.
Scatter plot of pH.
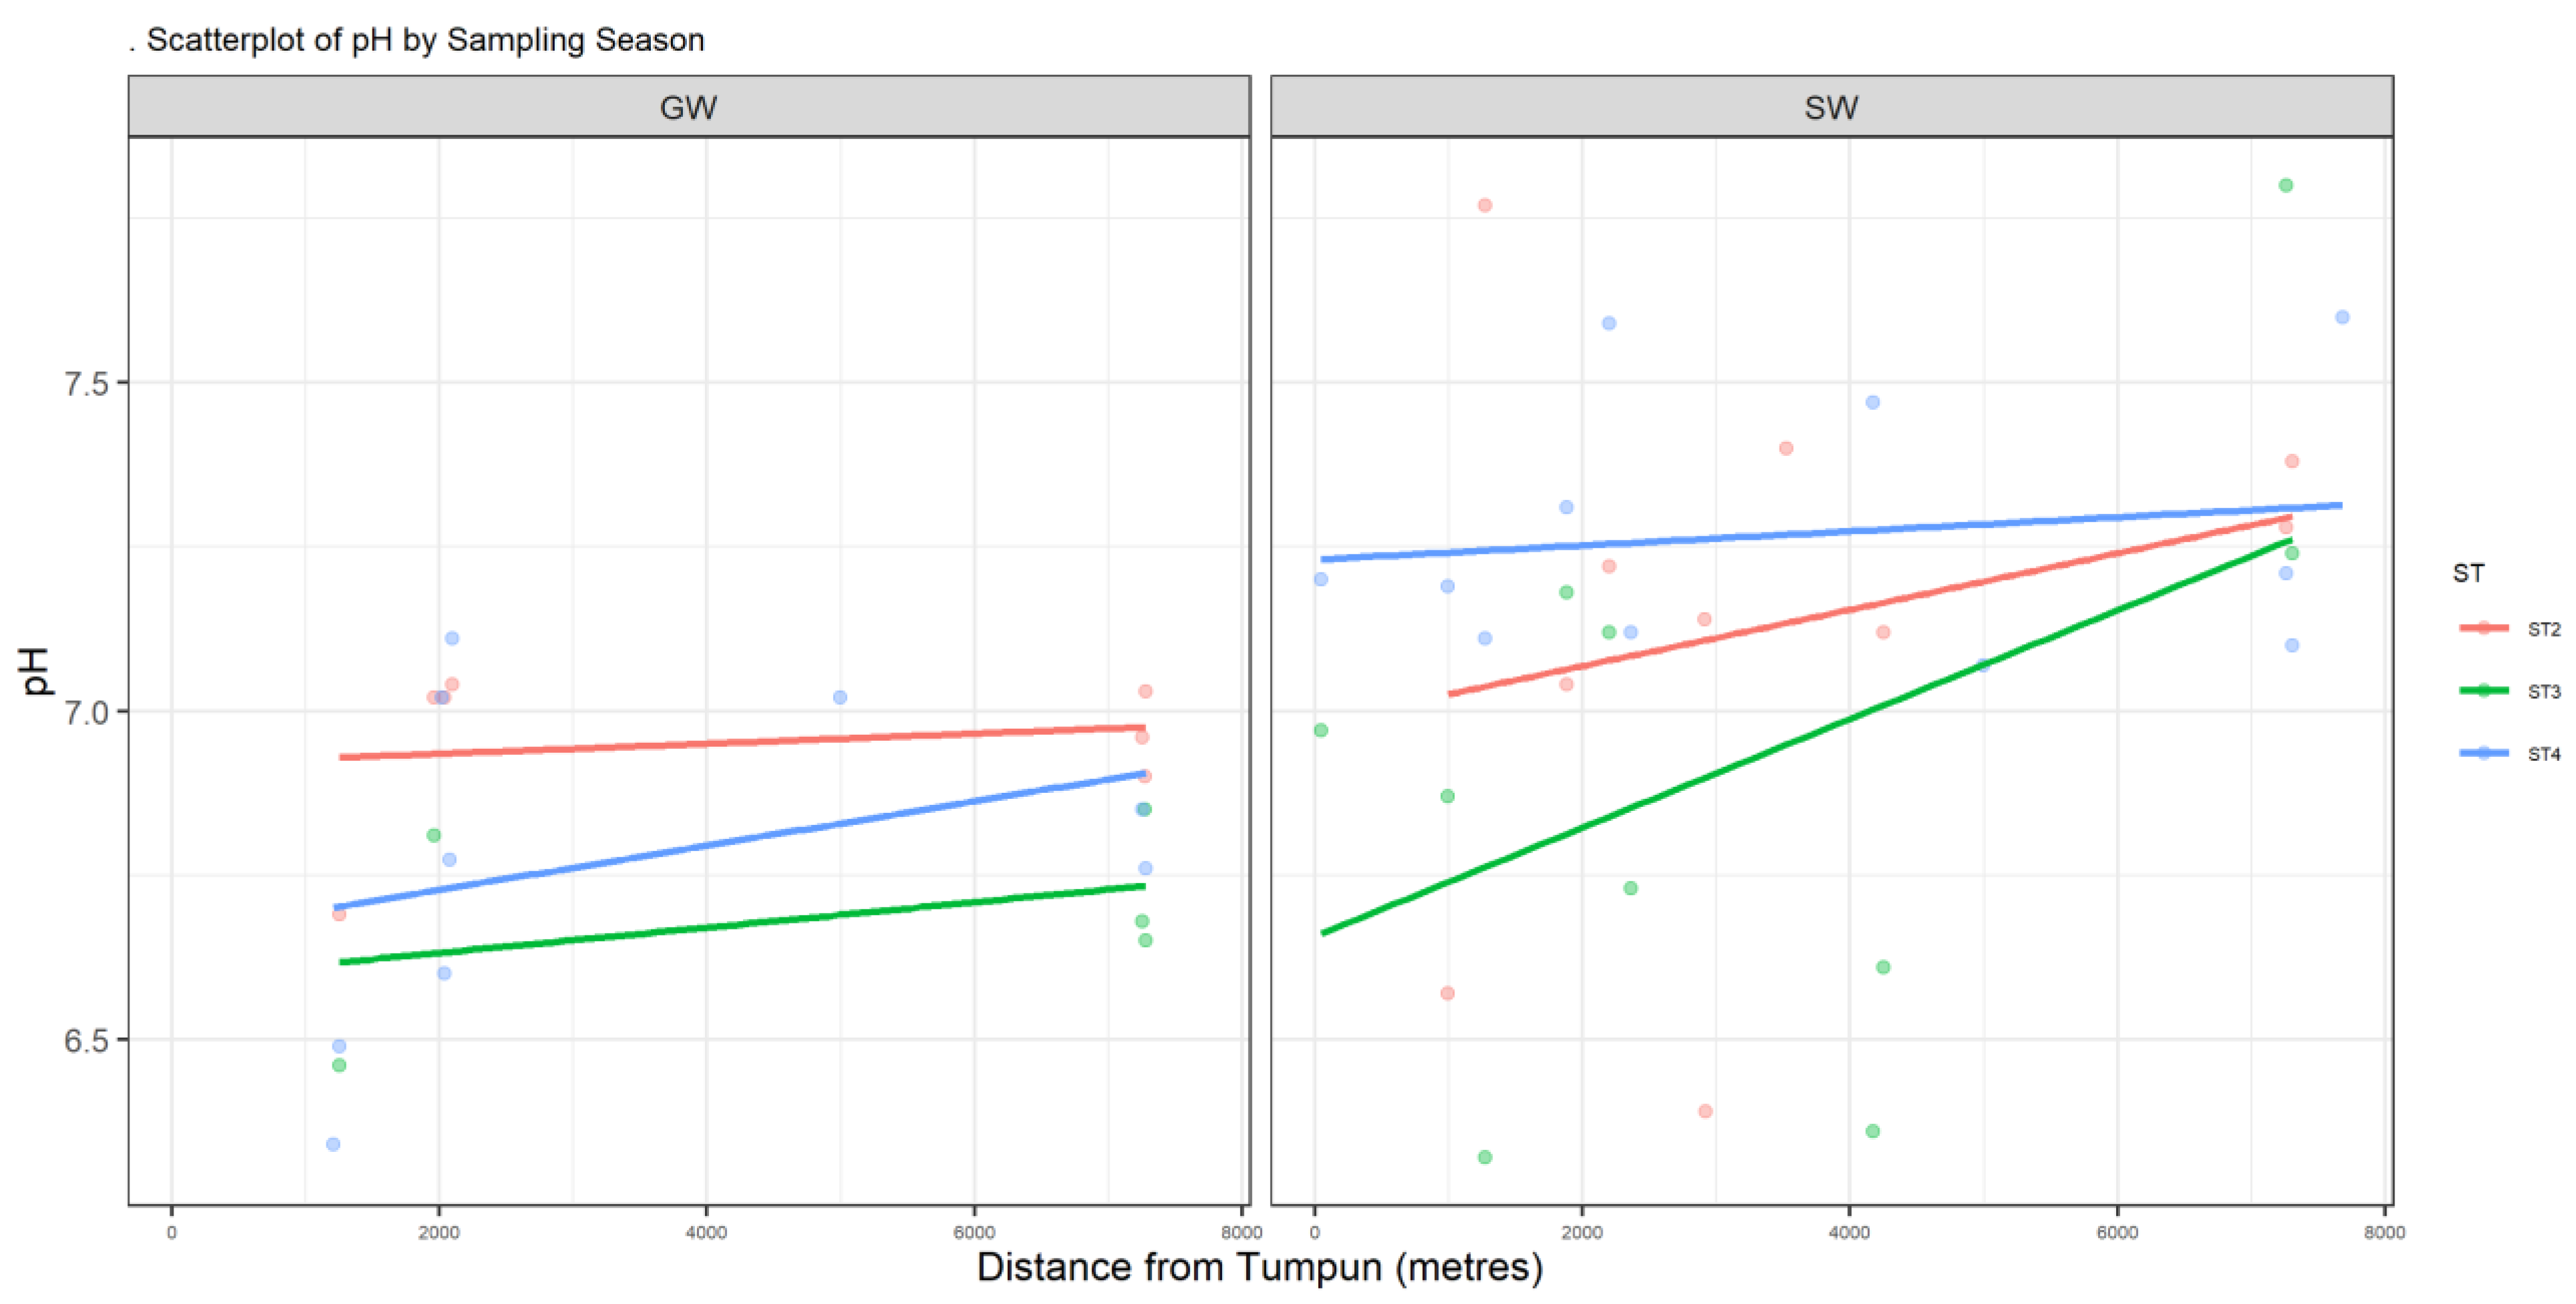
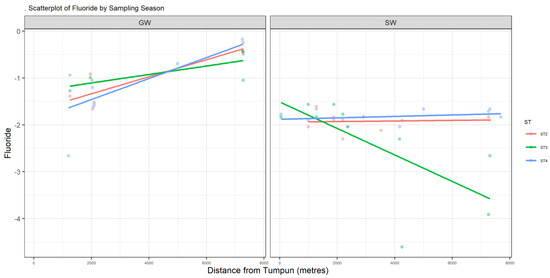
Figure A2.
Scatter plot of F.
Figure A2.
Scatter plot of F.
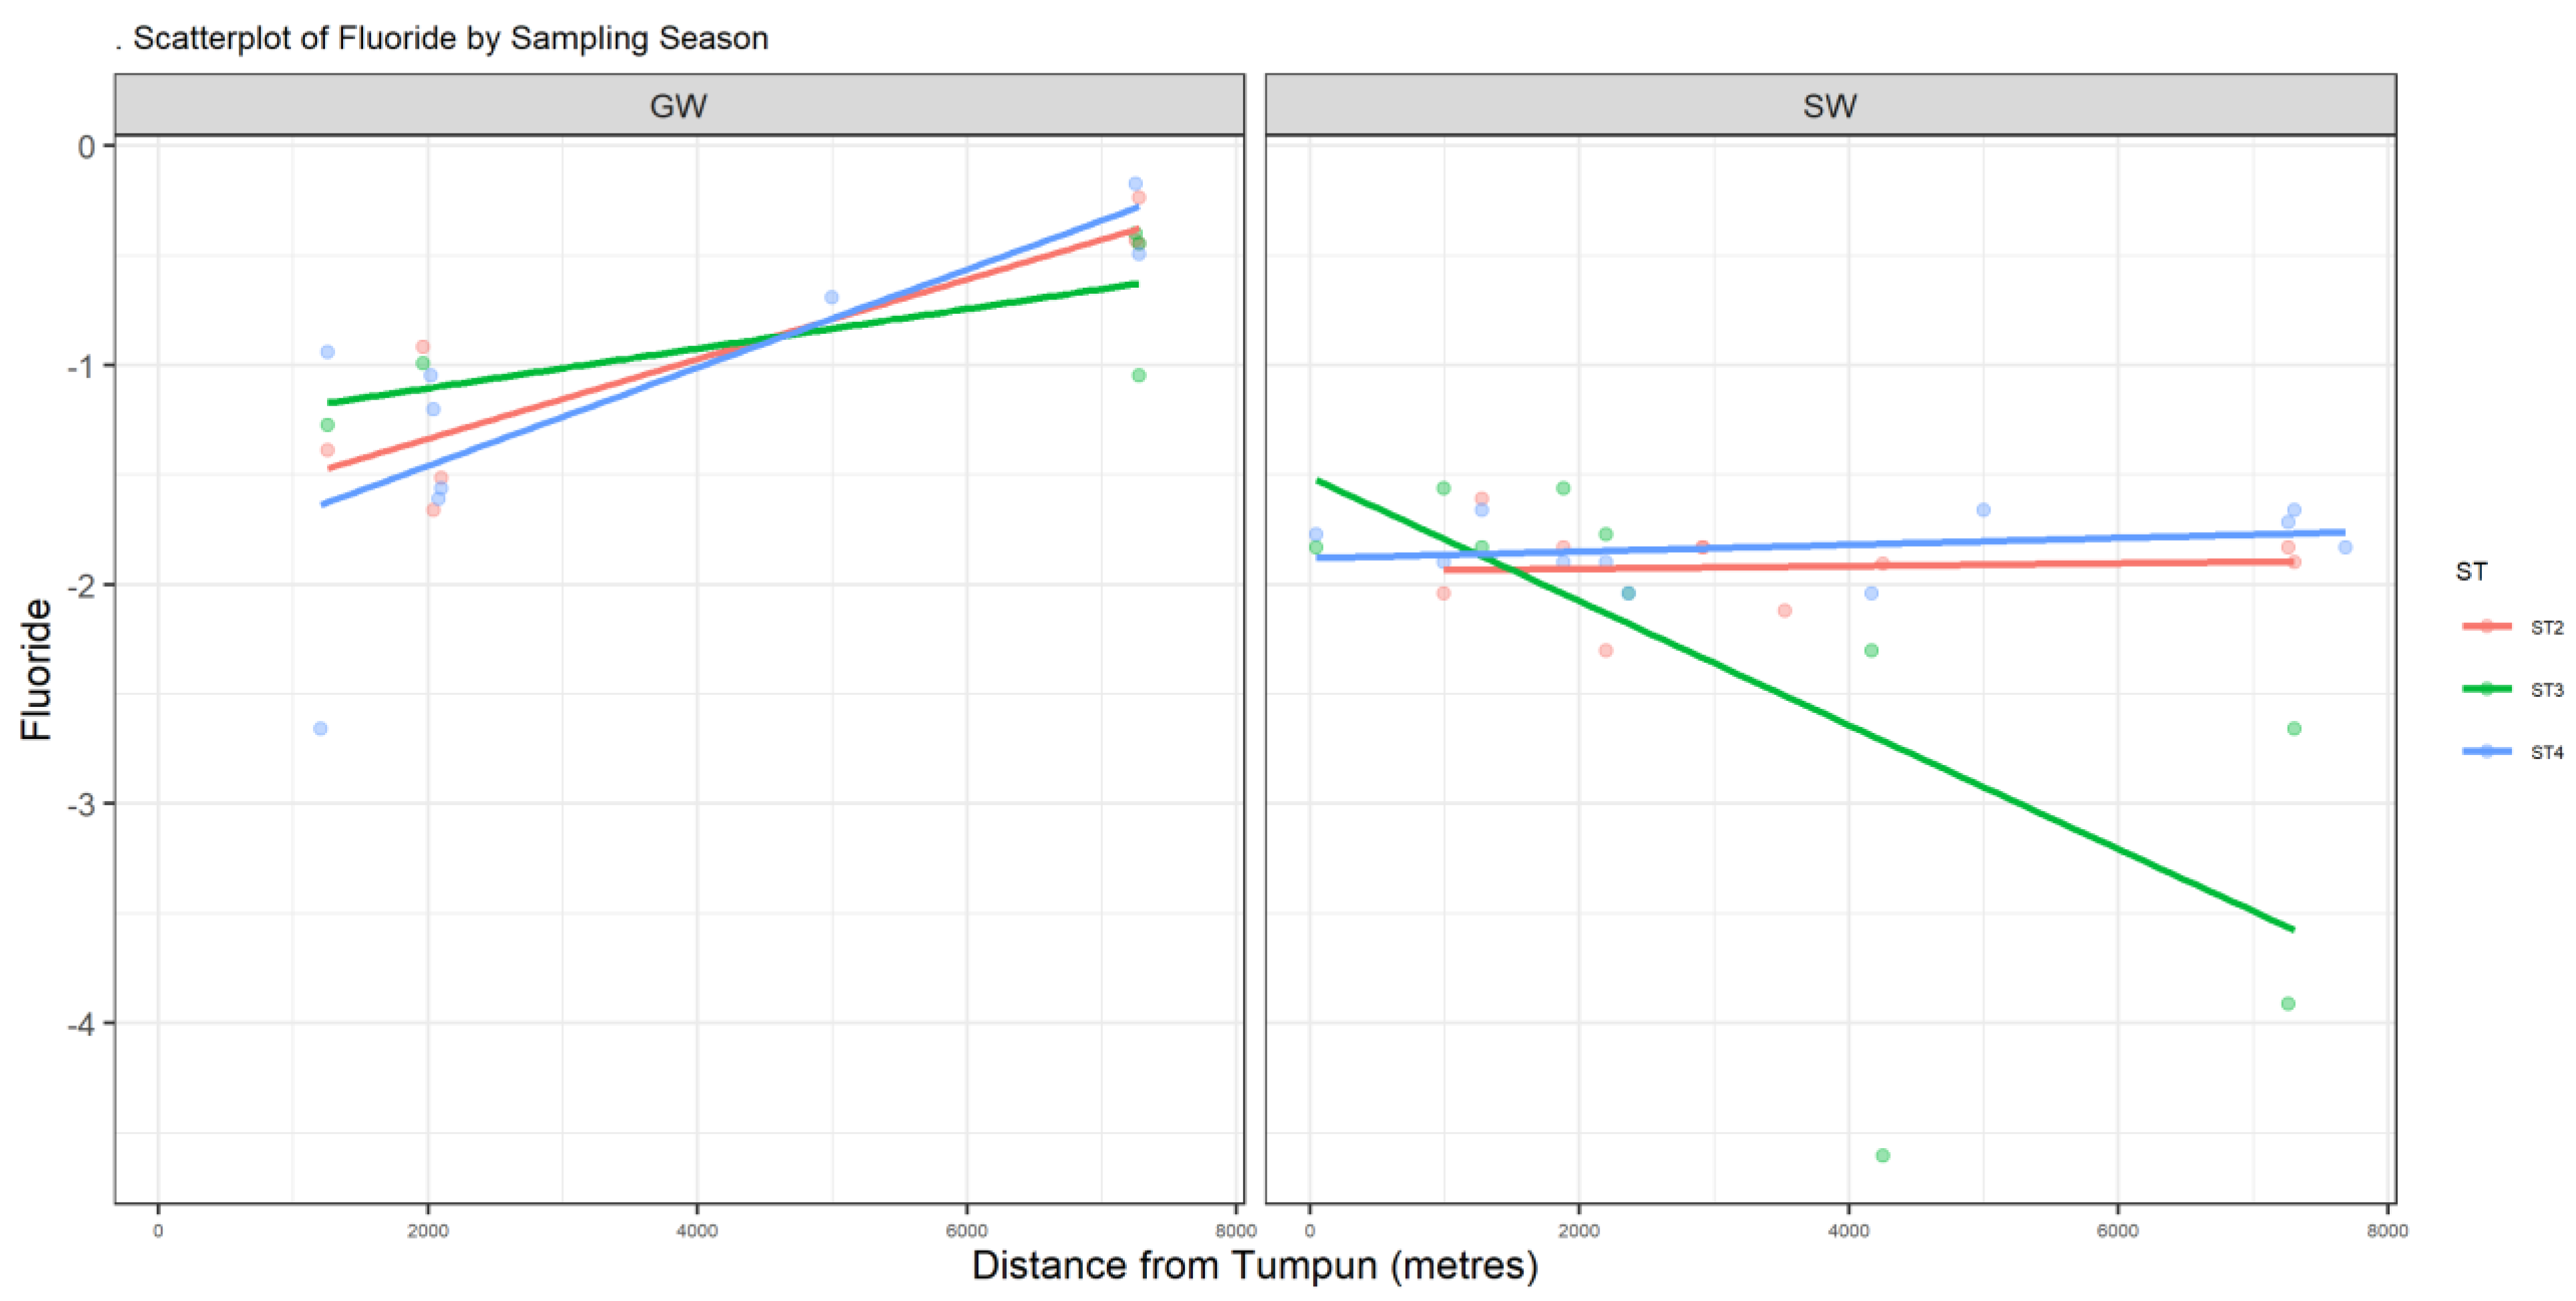
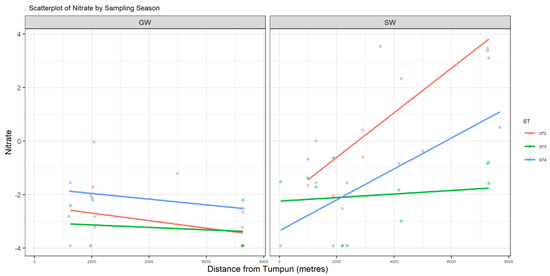
Figure A3.
Scatter plot of NO3−.
Figure A3.
Scatter plot of NO3−.
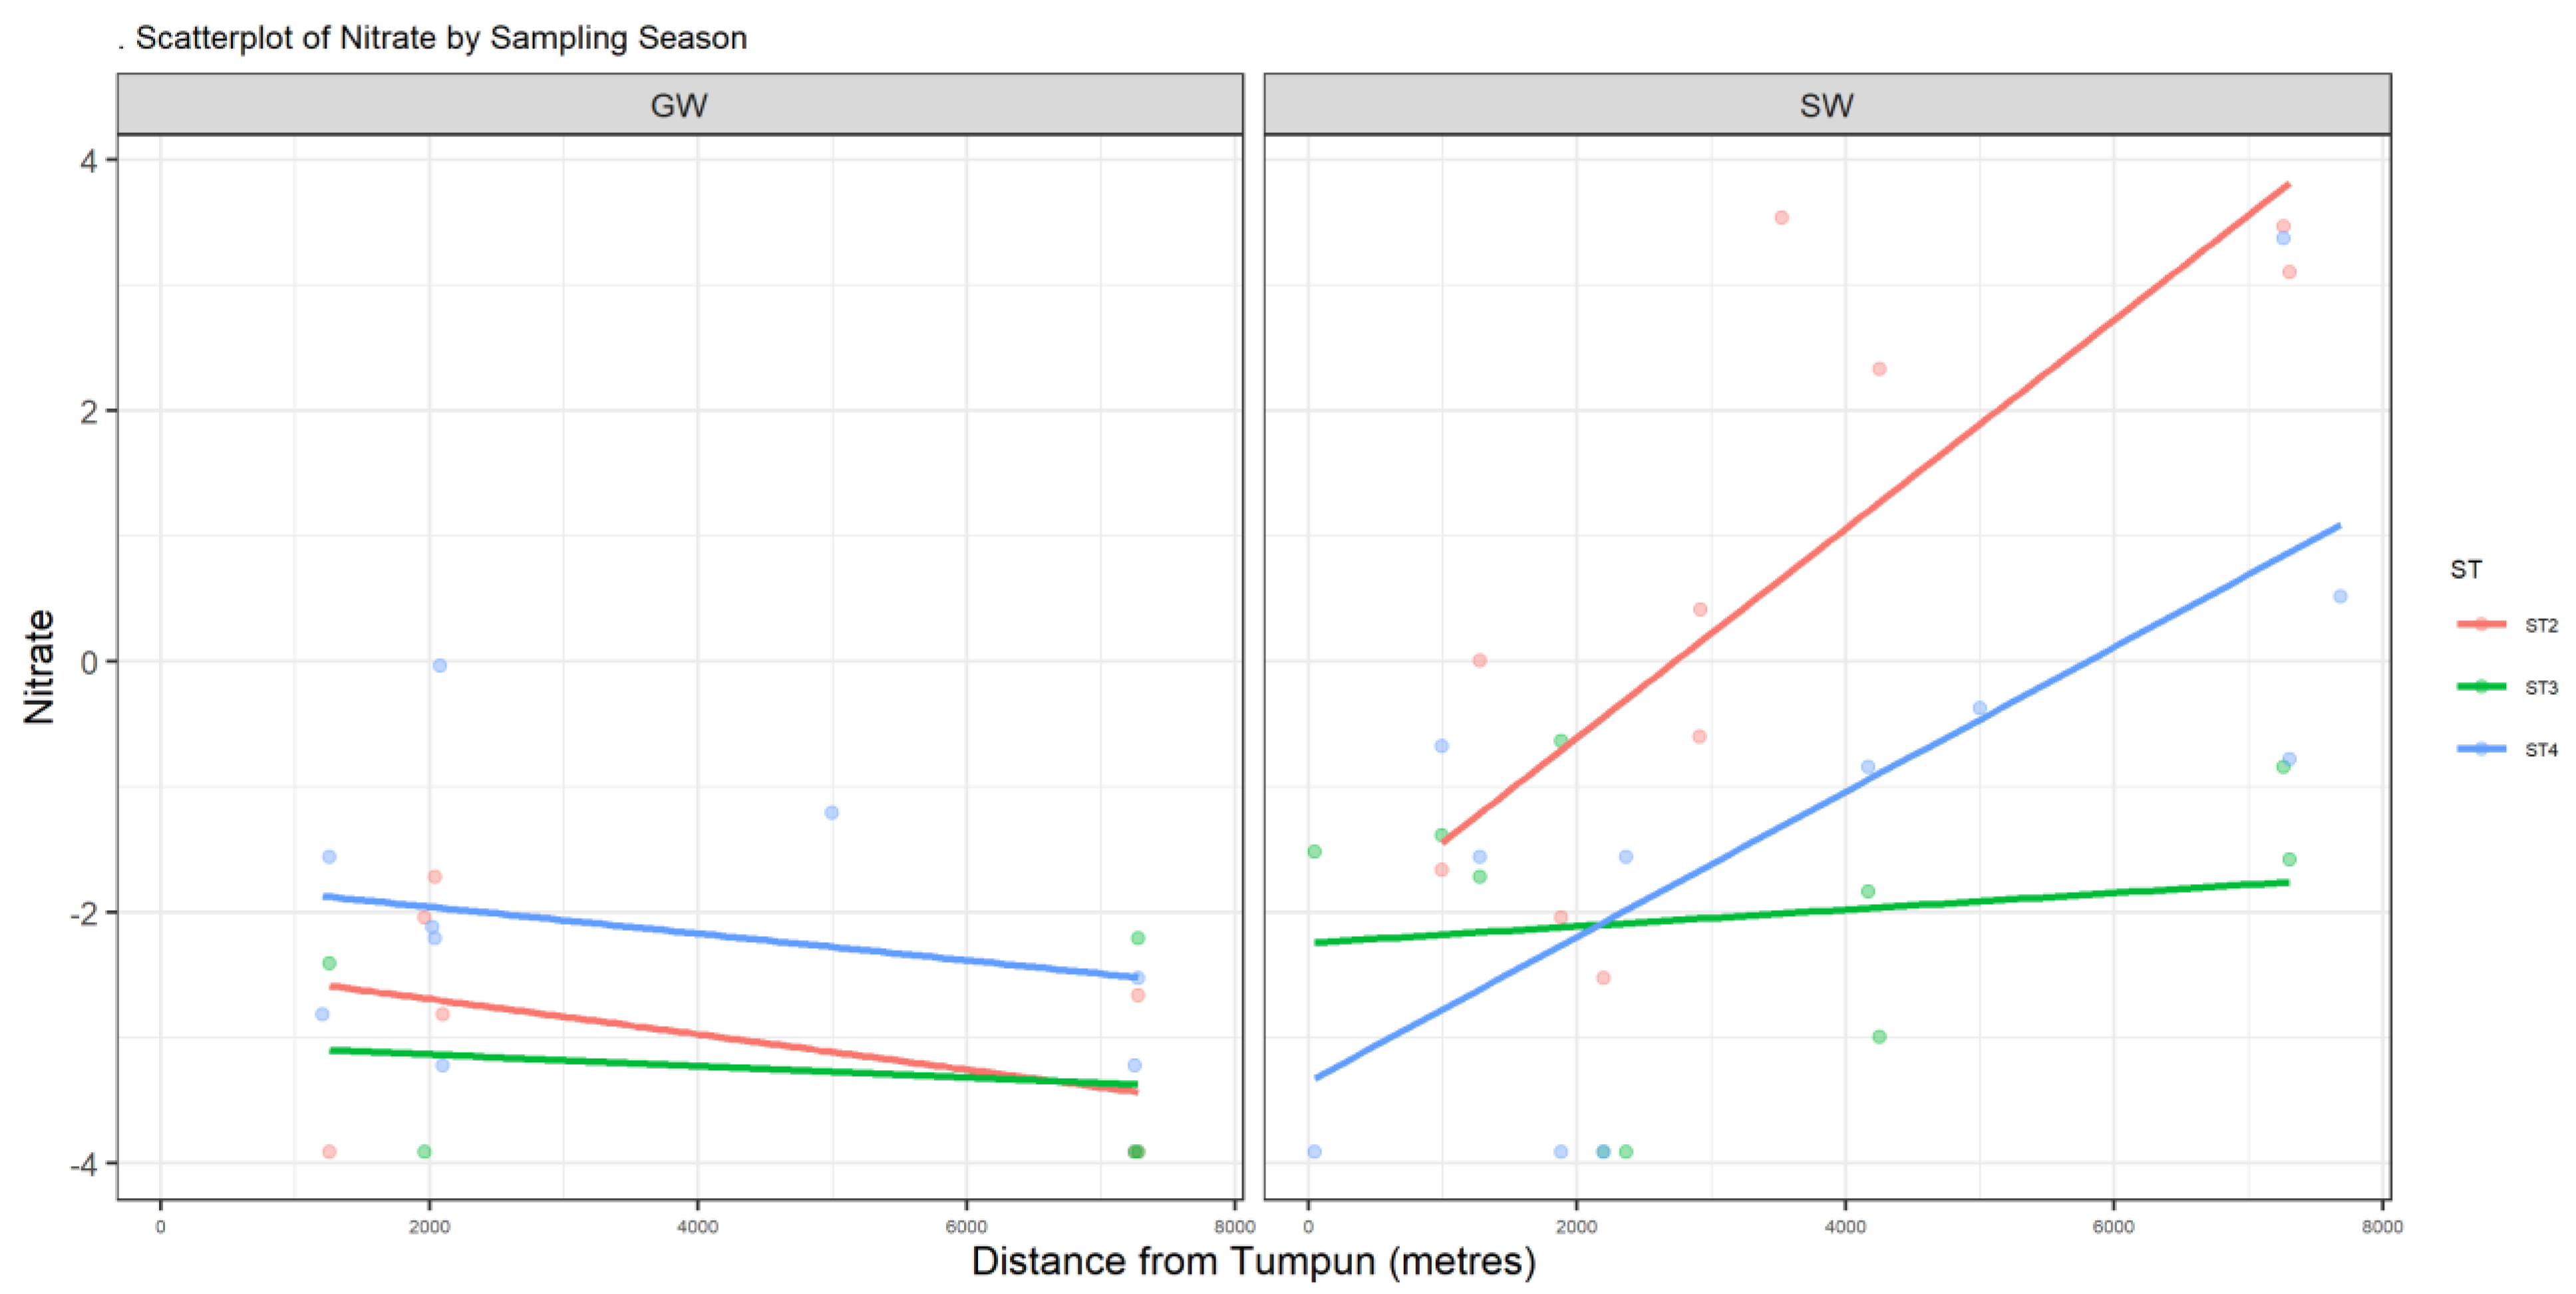
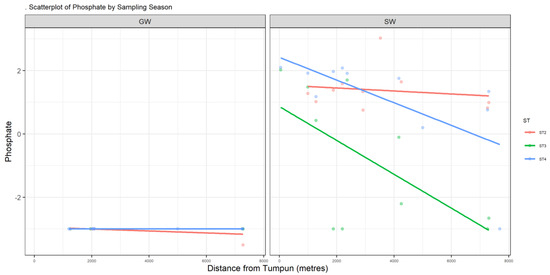
Figure A4.
Scatter plot of PO4.
Figure A4.
Scatter plot of PO4.
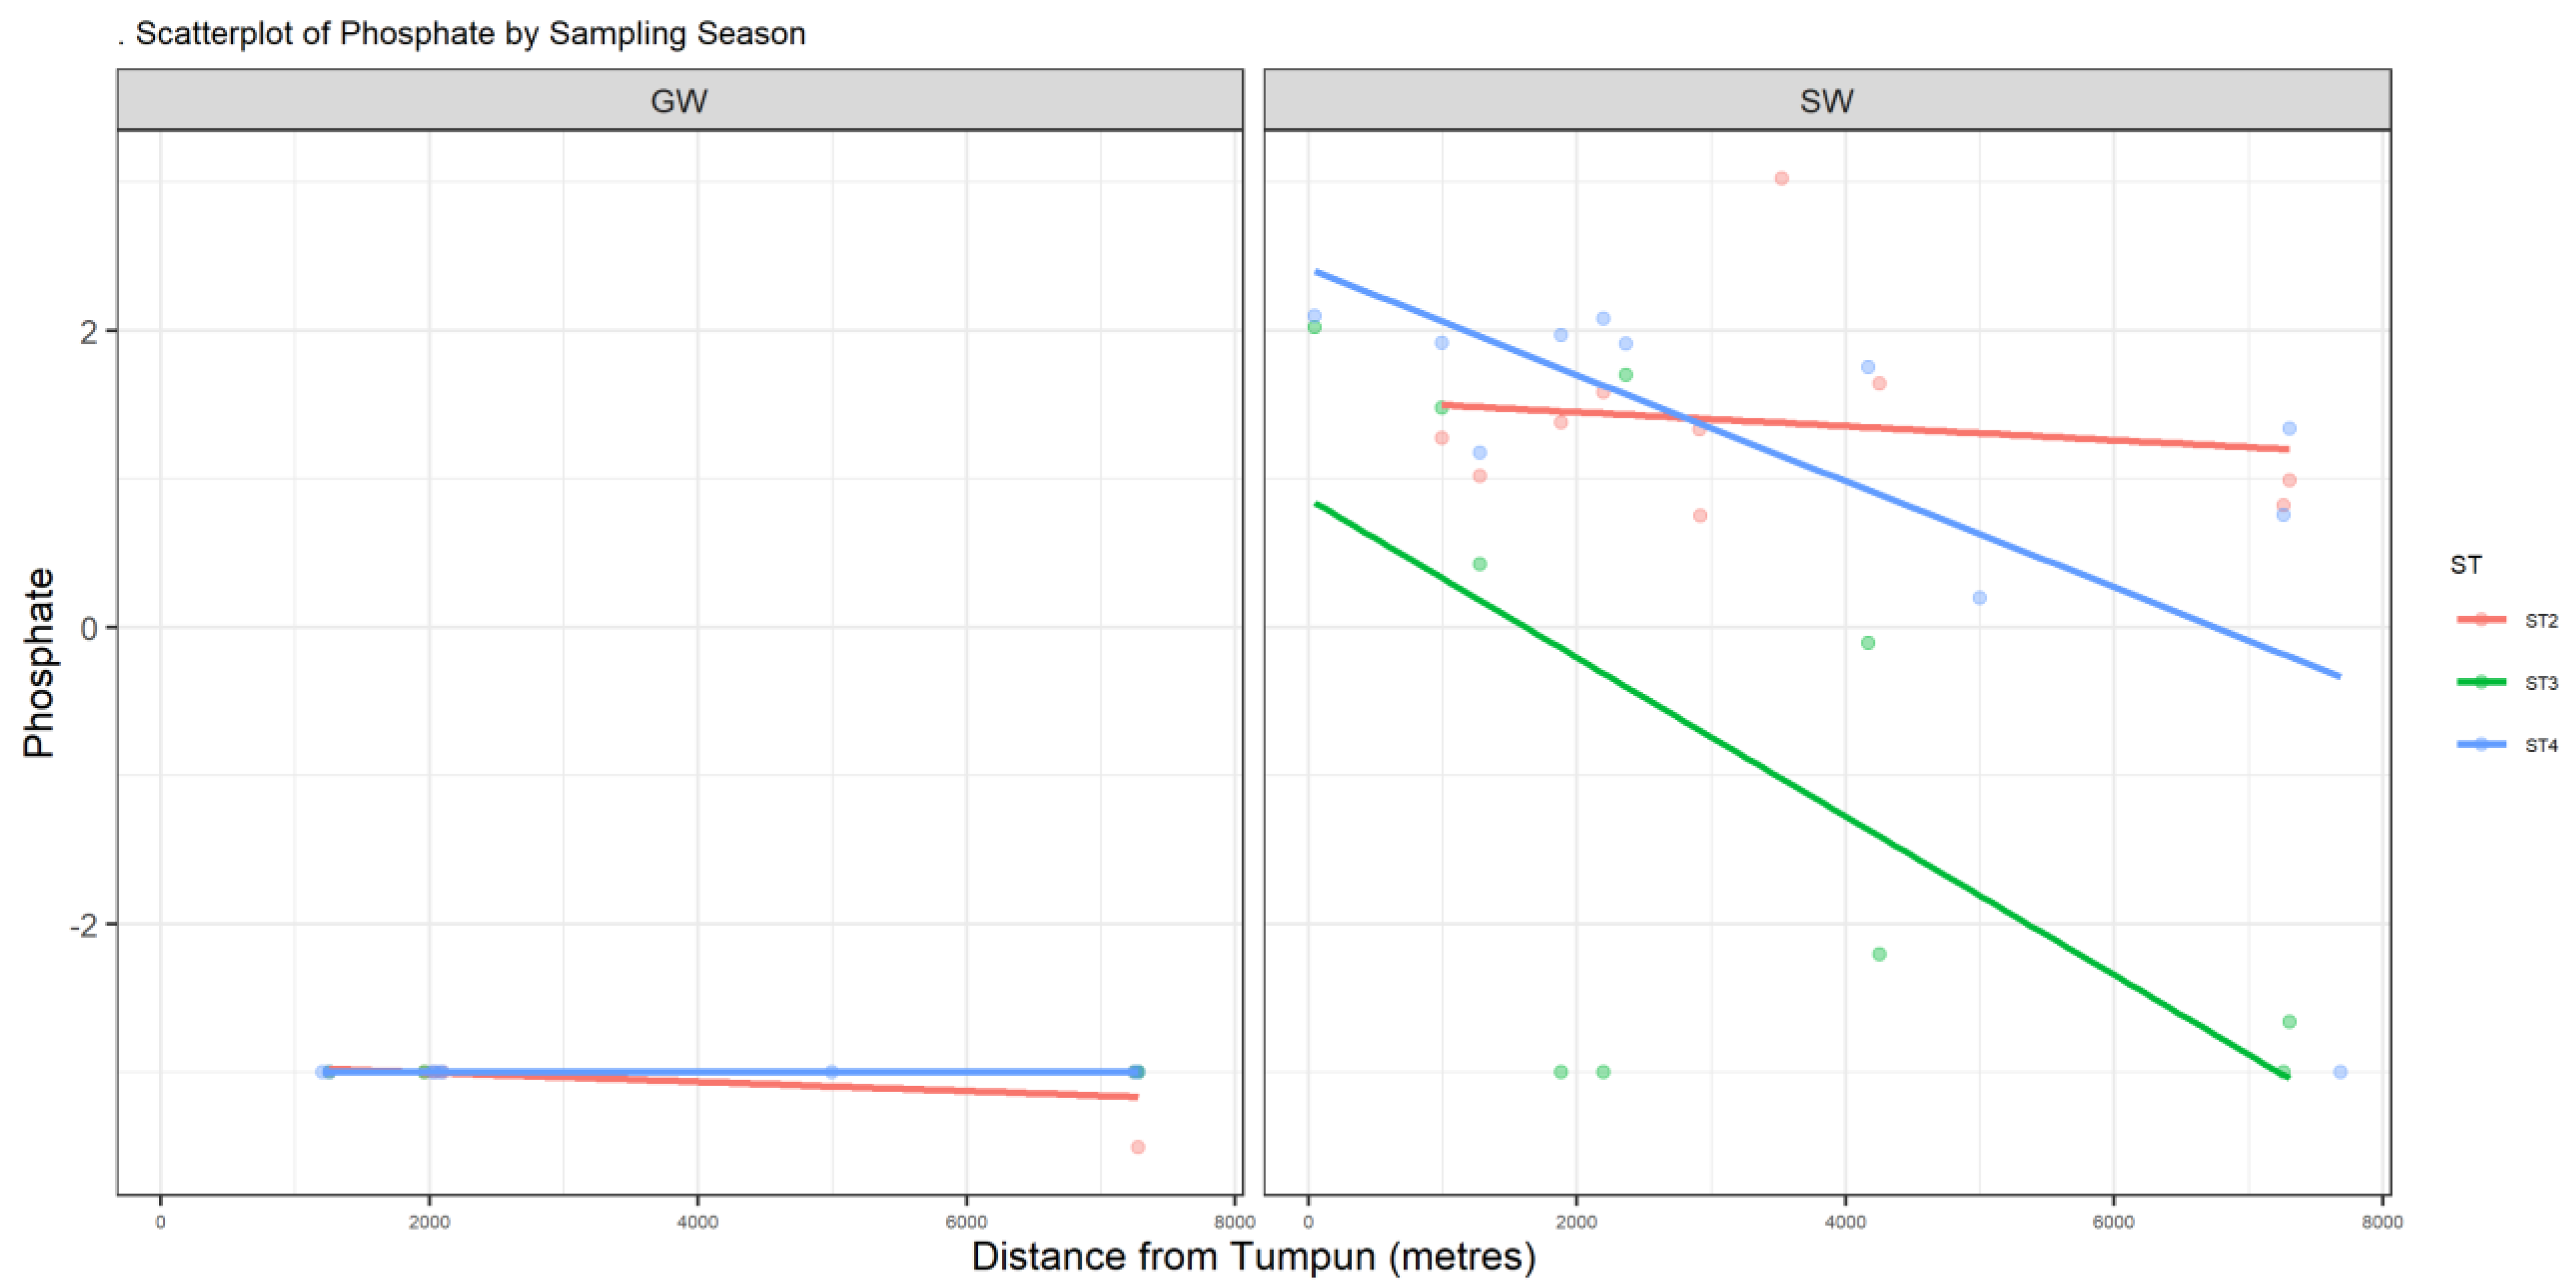
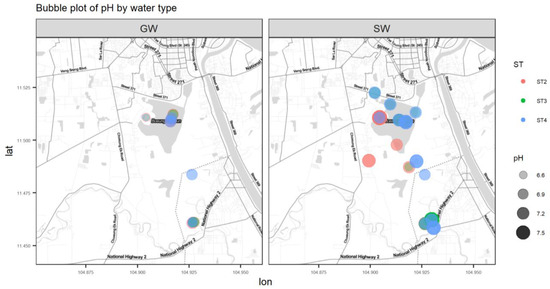
Figure A5.
Bubble plot of pH.
Figure A5.
Bubble plot of pH.

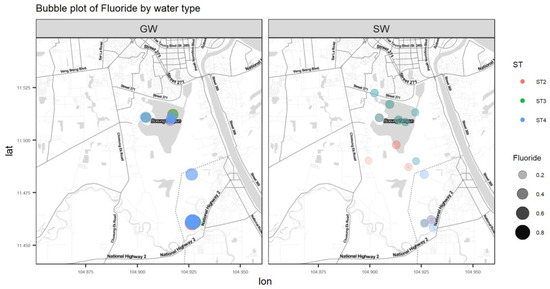
Figure A6.
Bubble plot of F.
Figure A6.
Bubble plot of F.
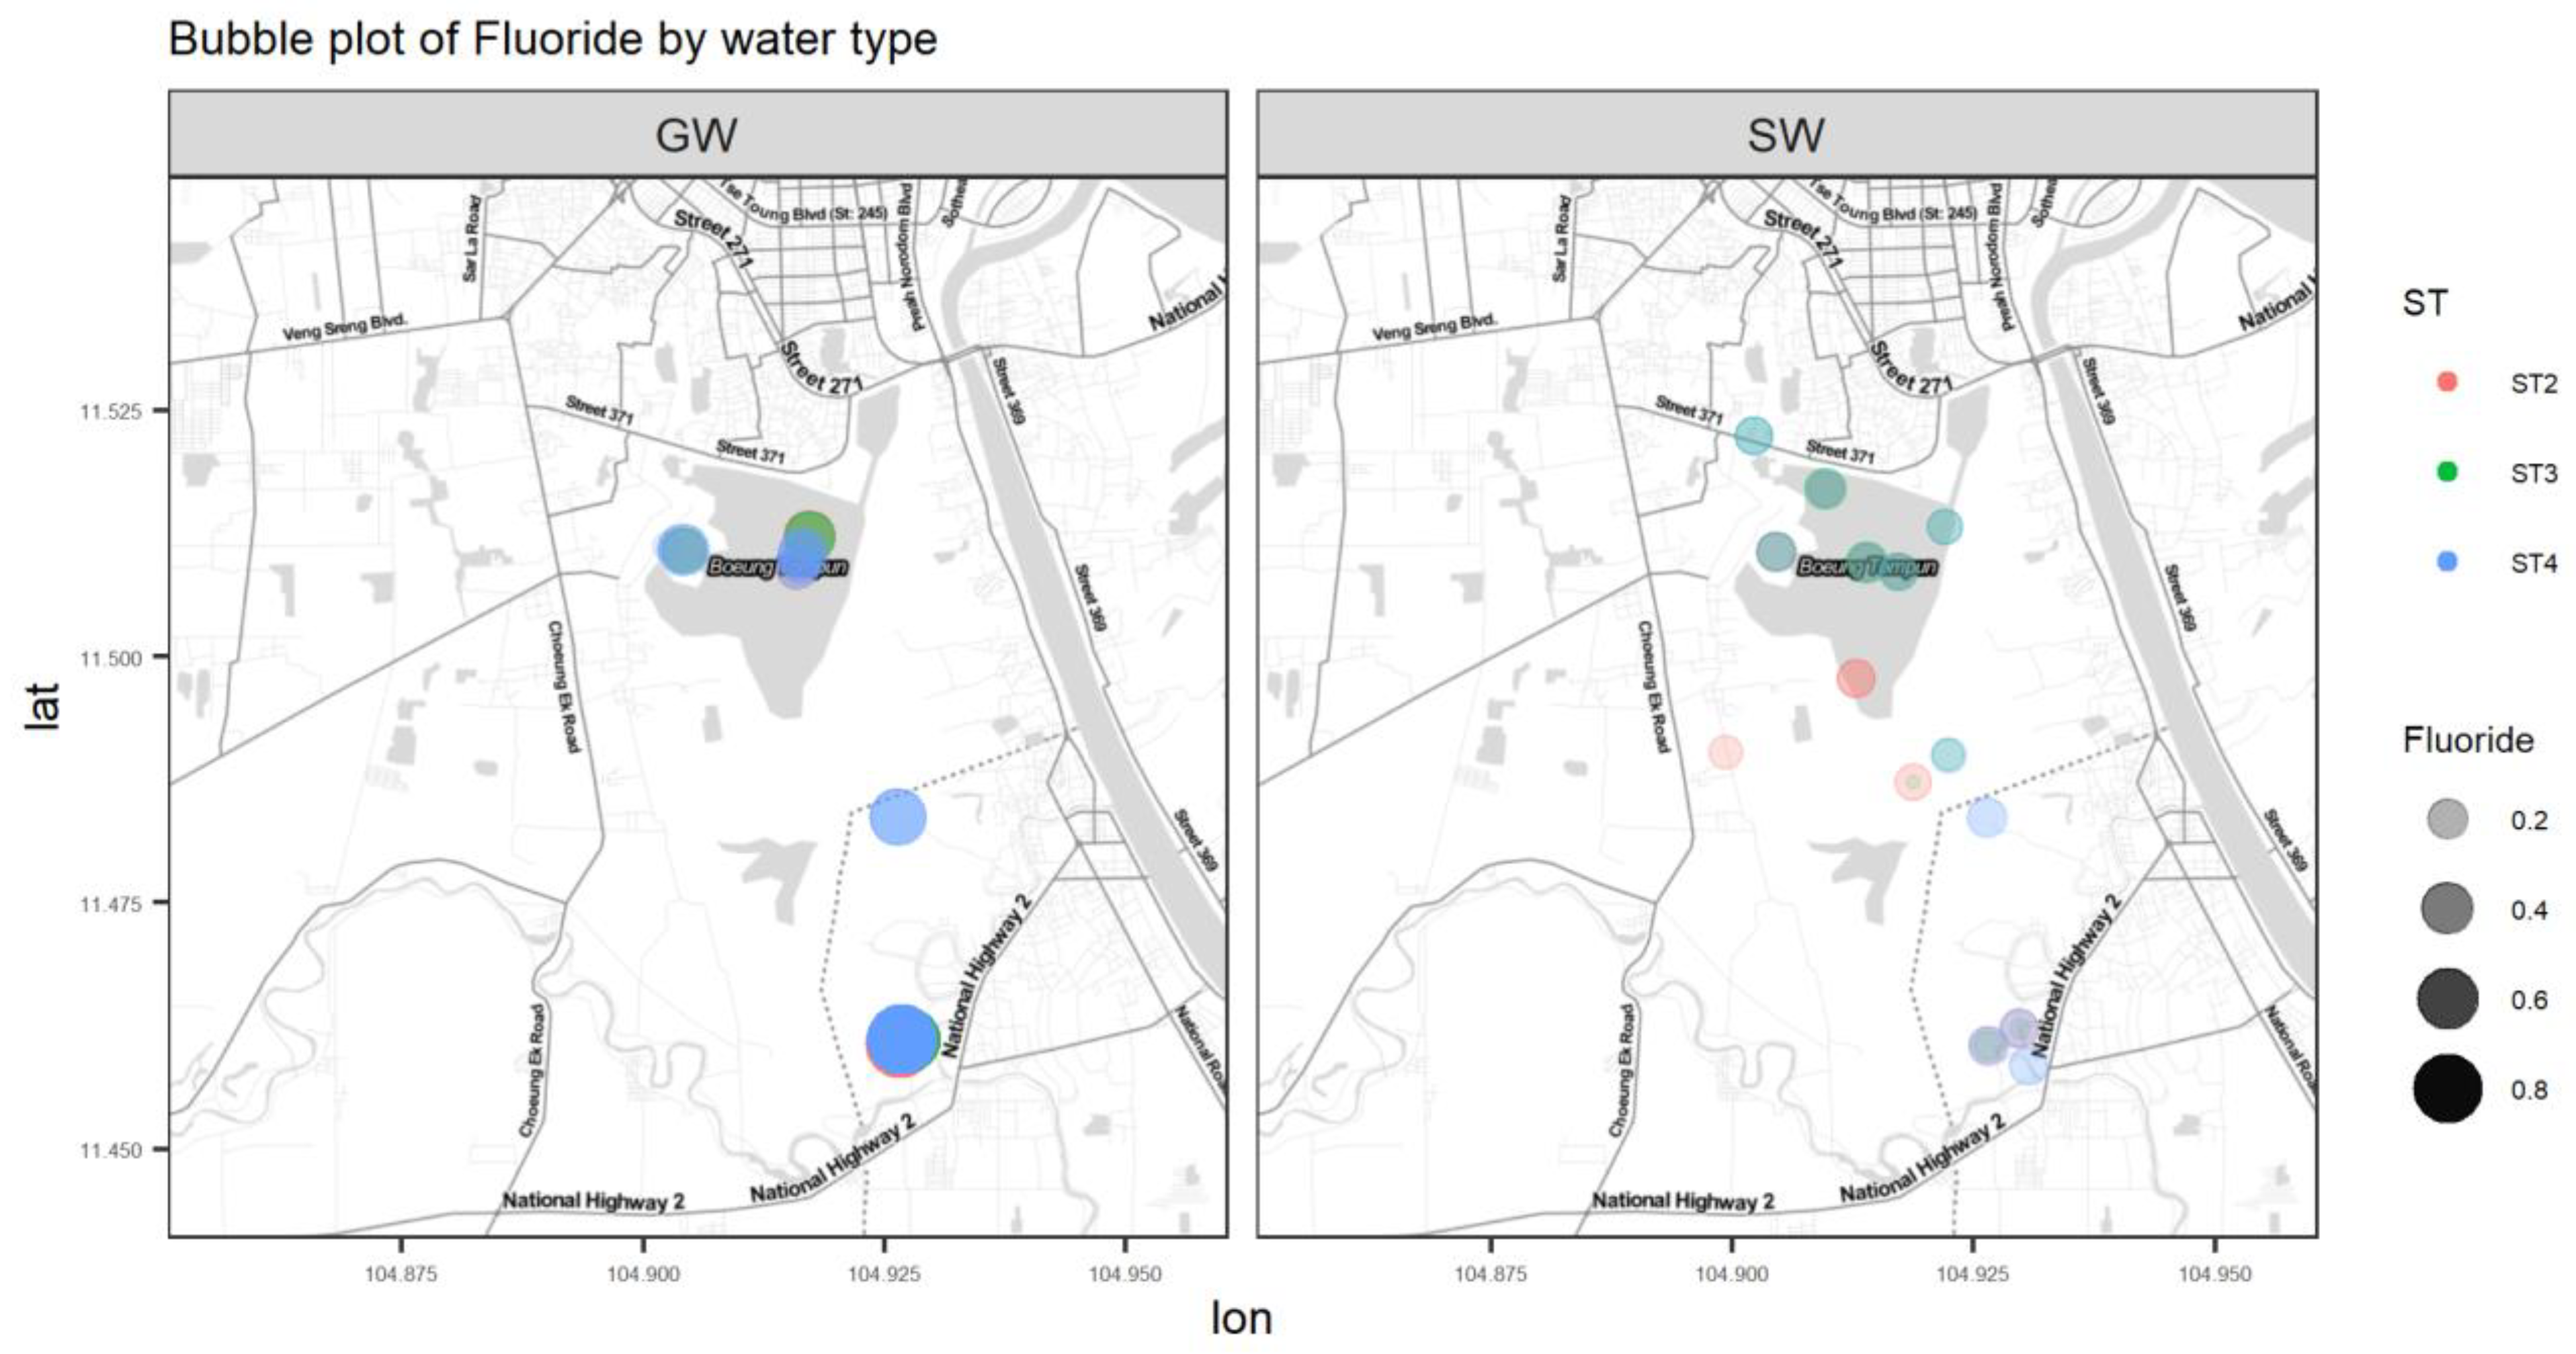

Figure A7.
Bubble plot of NO3−.
Figure A7.
Bubble plot of NO3−.
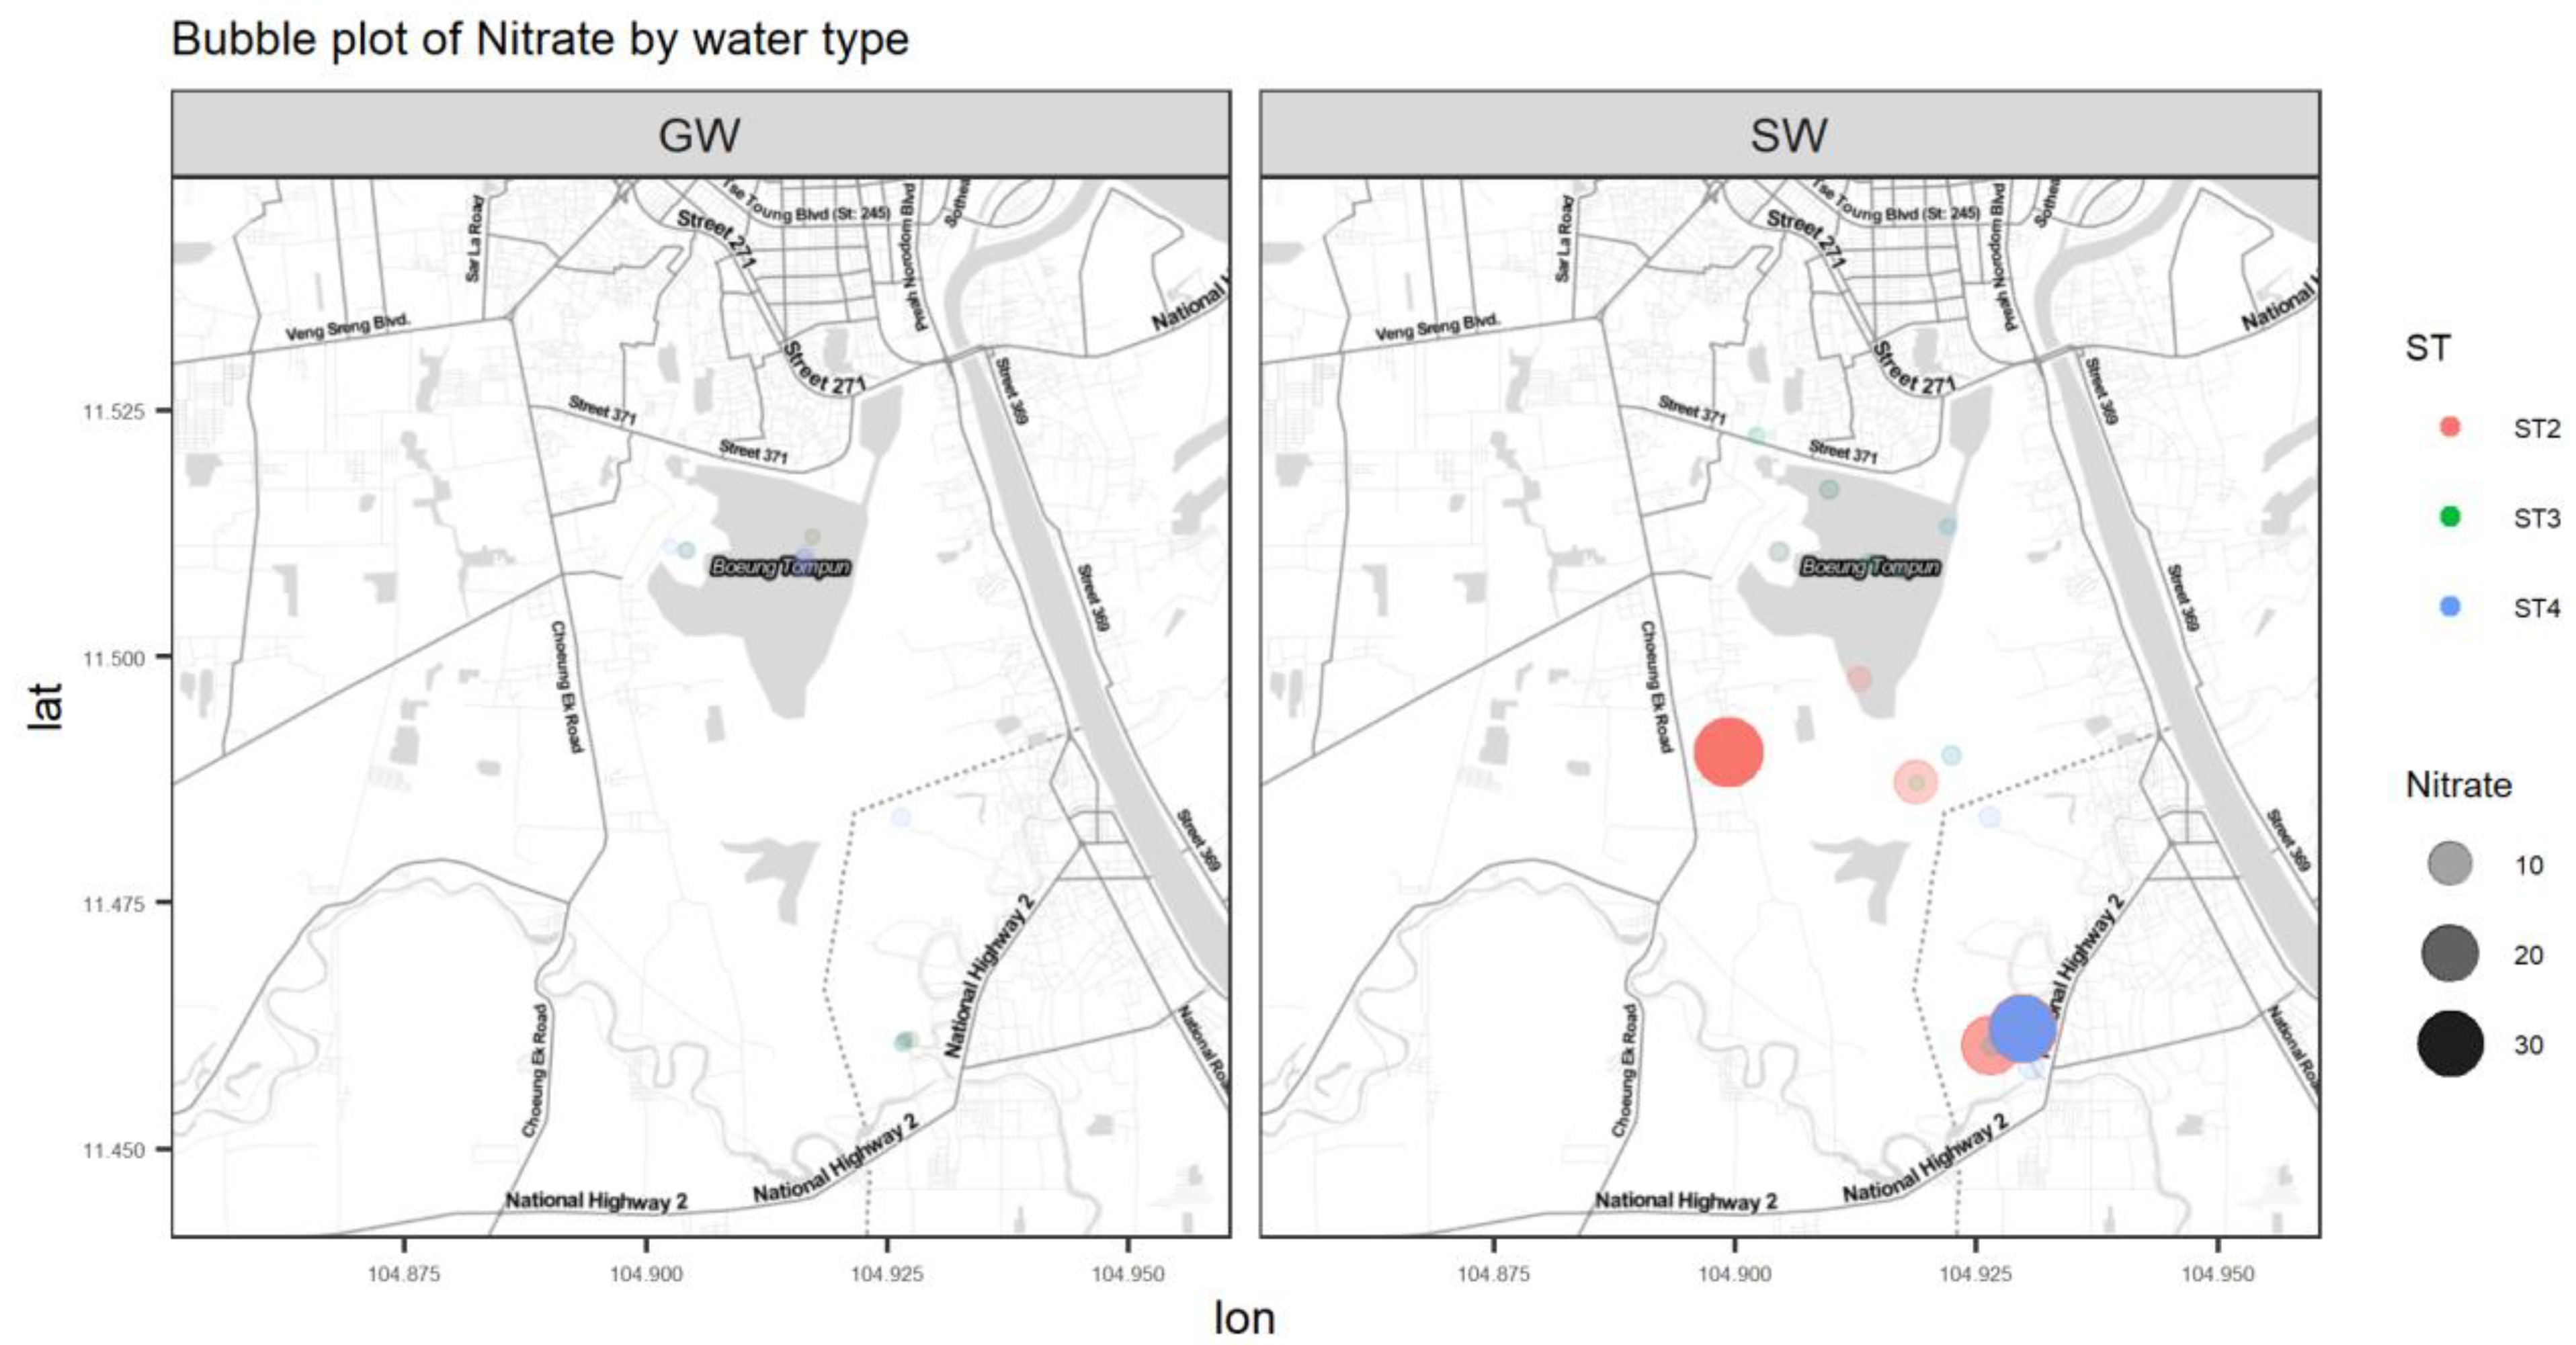

Figure A8.
Bubble plot of PO4.
Figure A8.
Bubble plot of PO4.
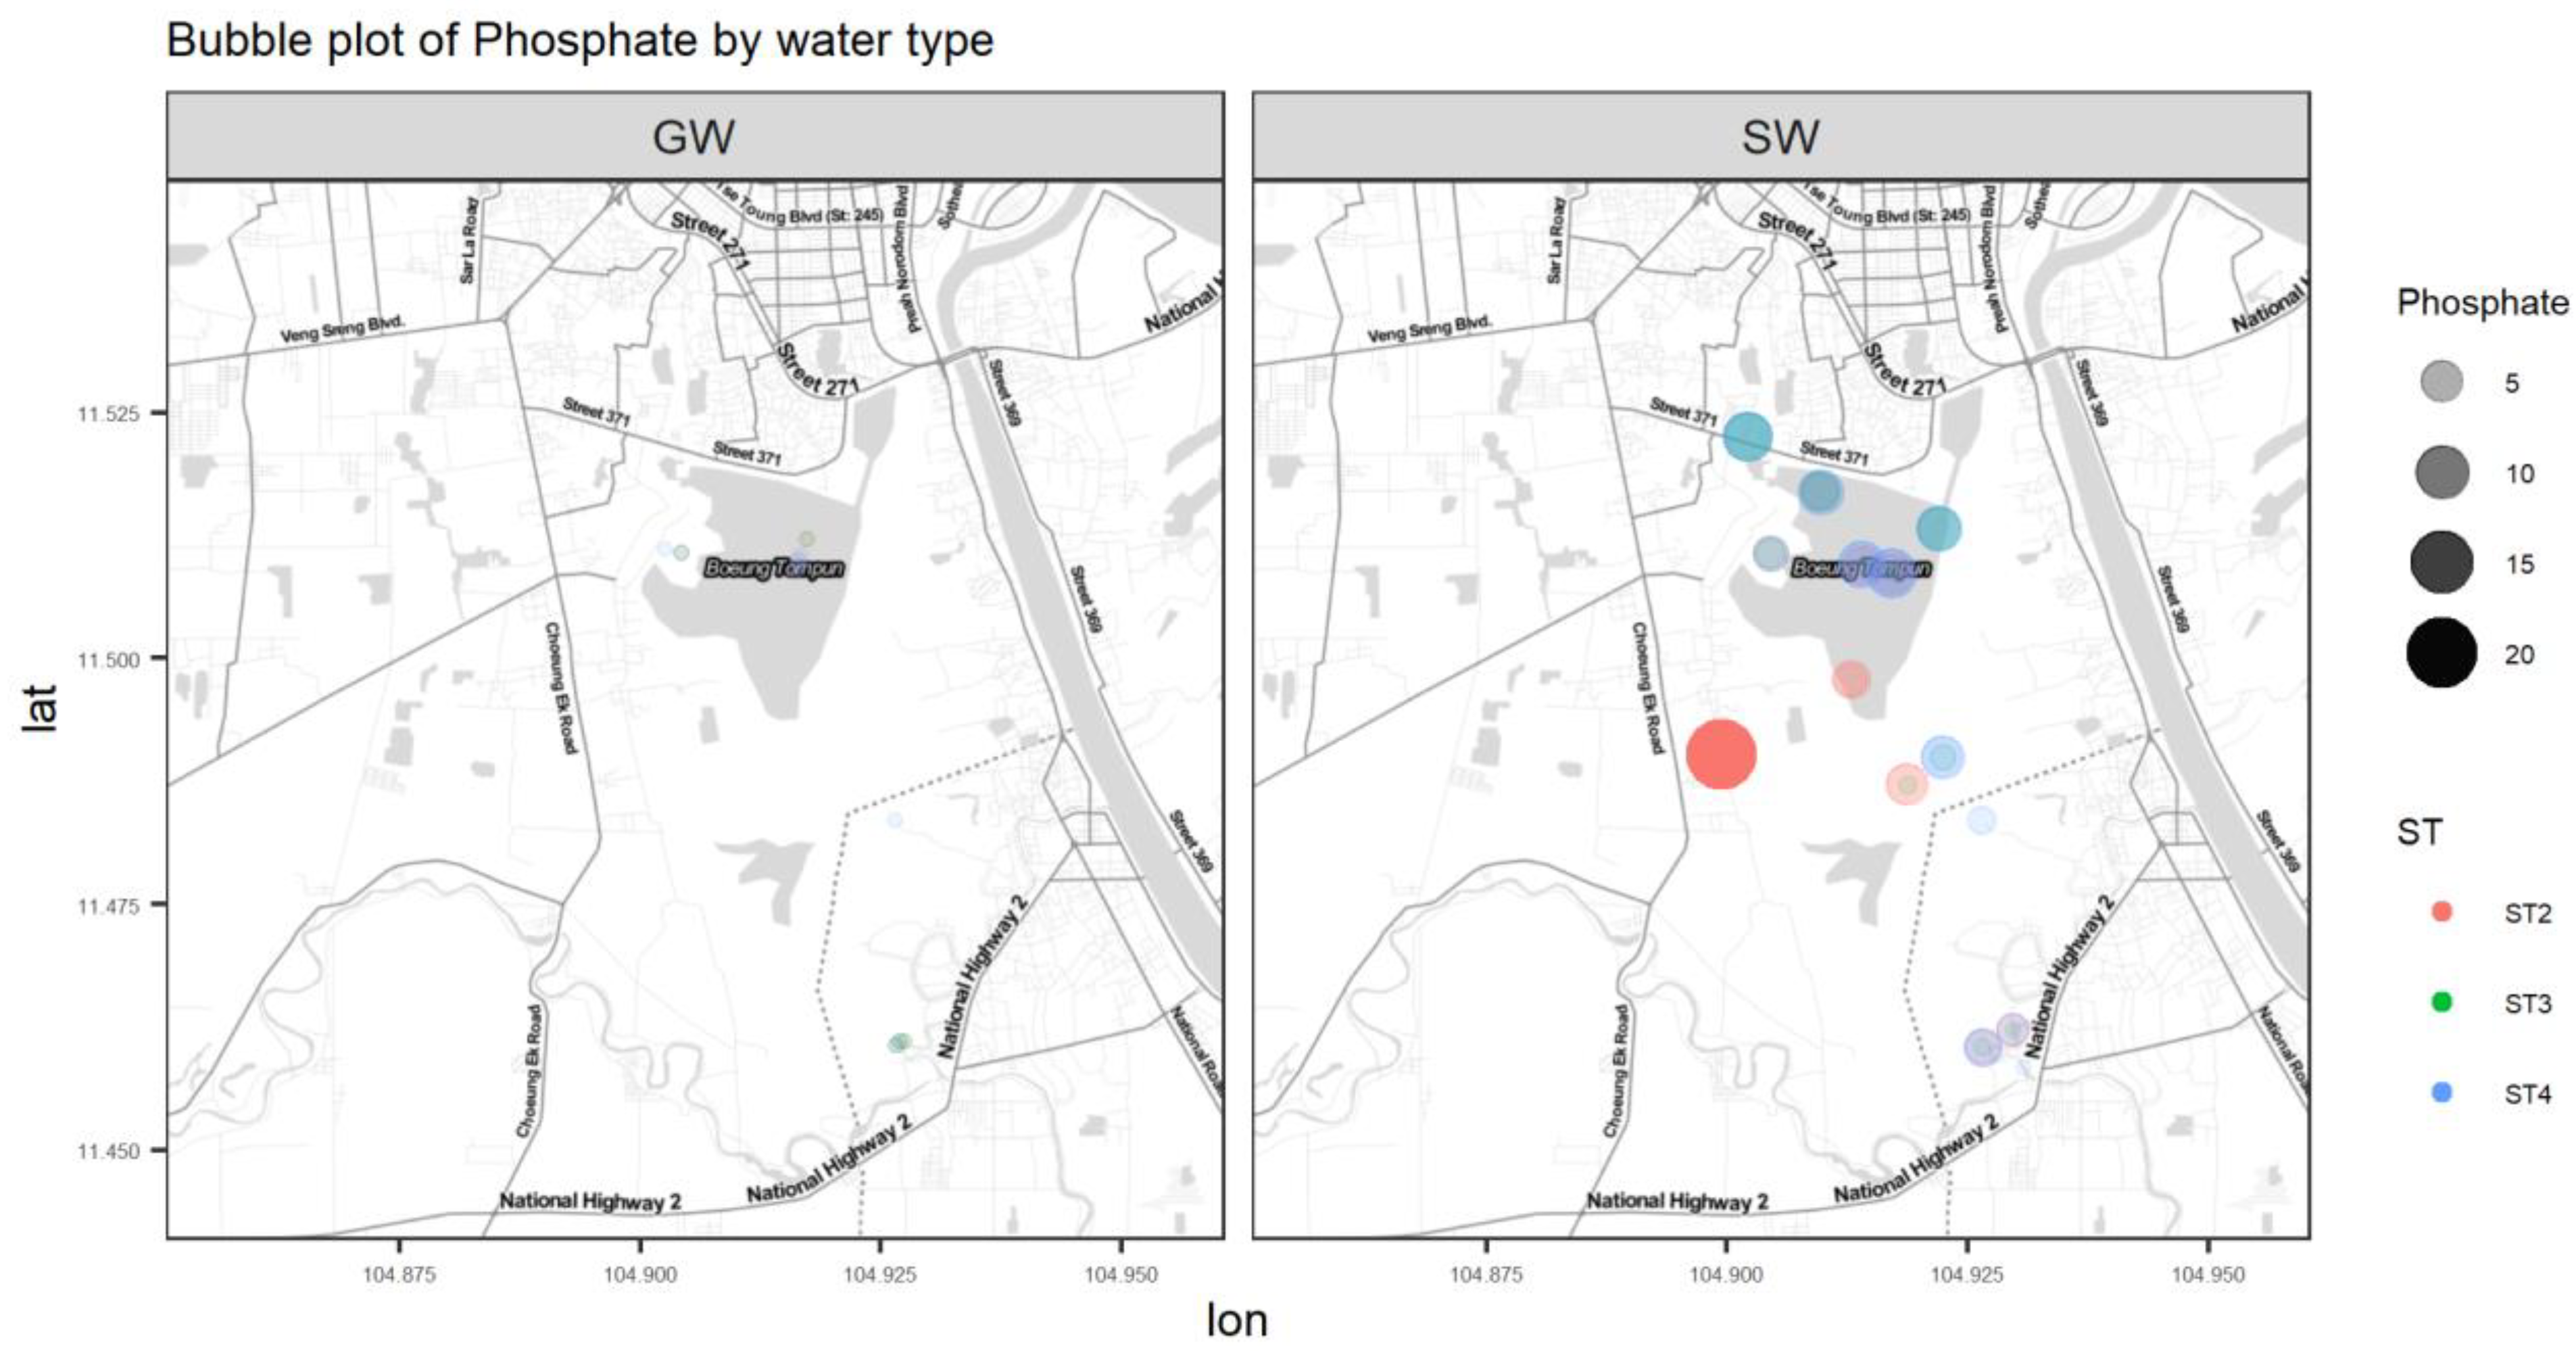
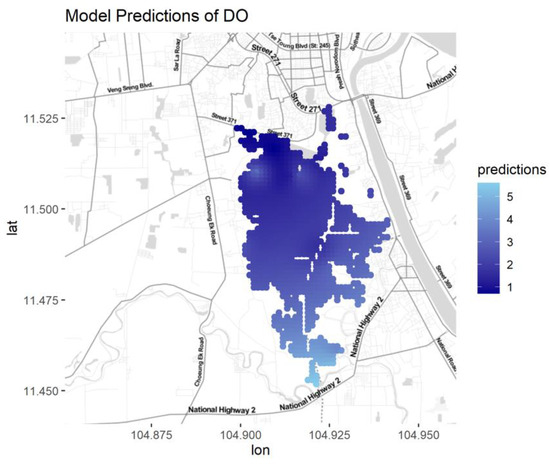
Figure A9.
Predictions for DO for different seasons and water types.
Figure A9.
Predictions for DO for different seasons and water types.

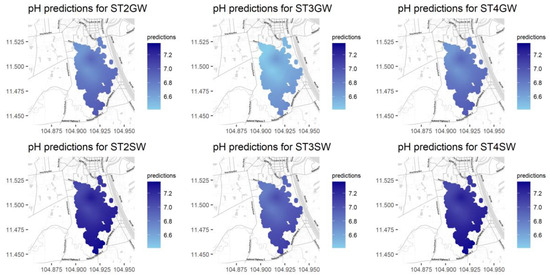
Figure A10.
Predictions for pH for different seasons and water types.
Figure A10.
Predictions for pH for different seasons and water types.
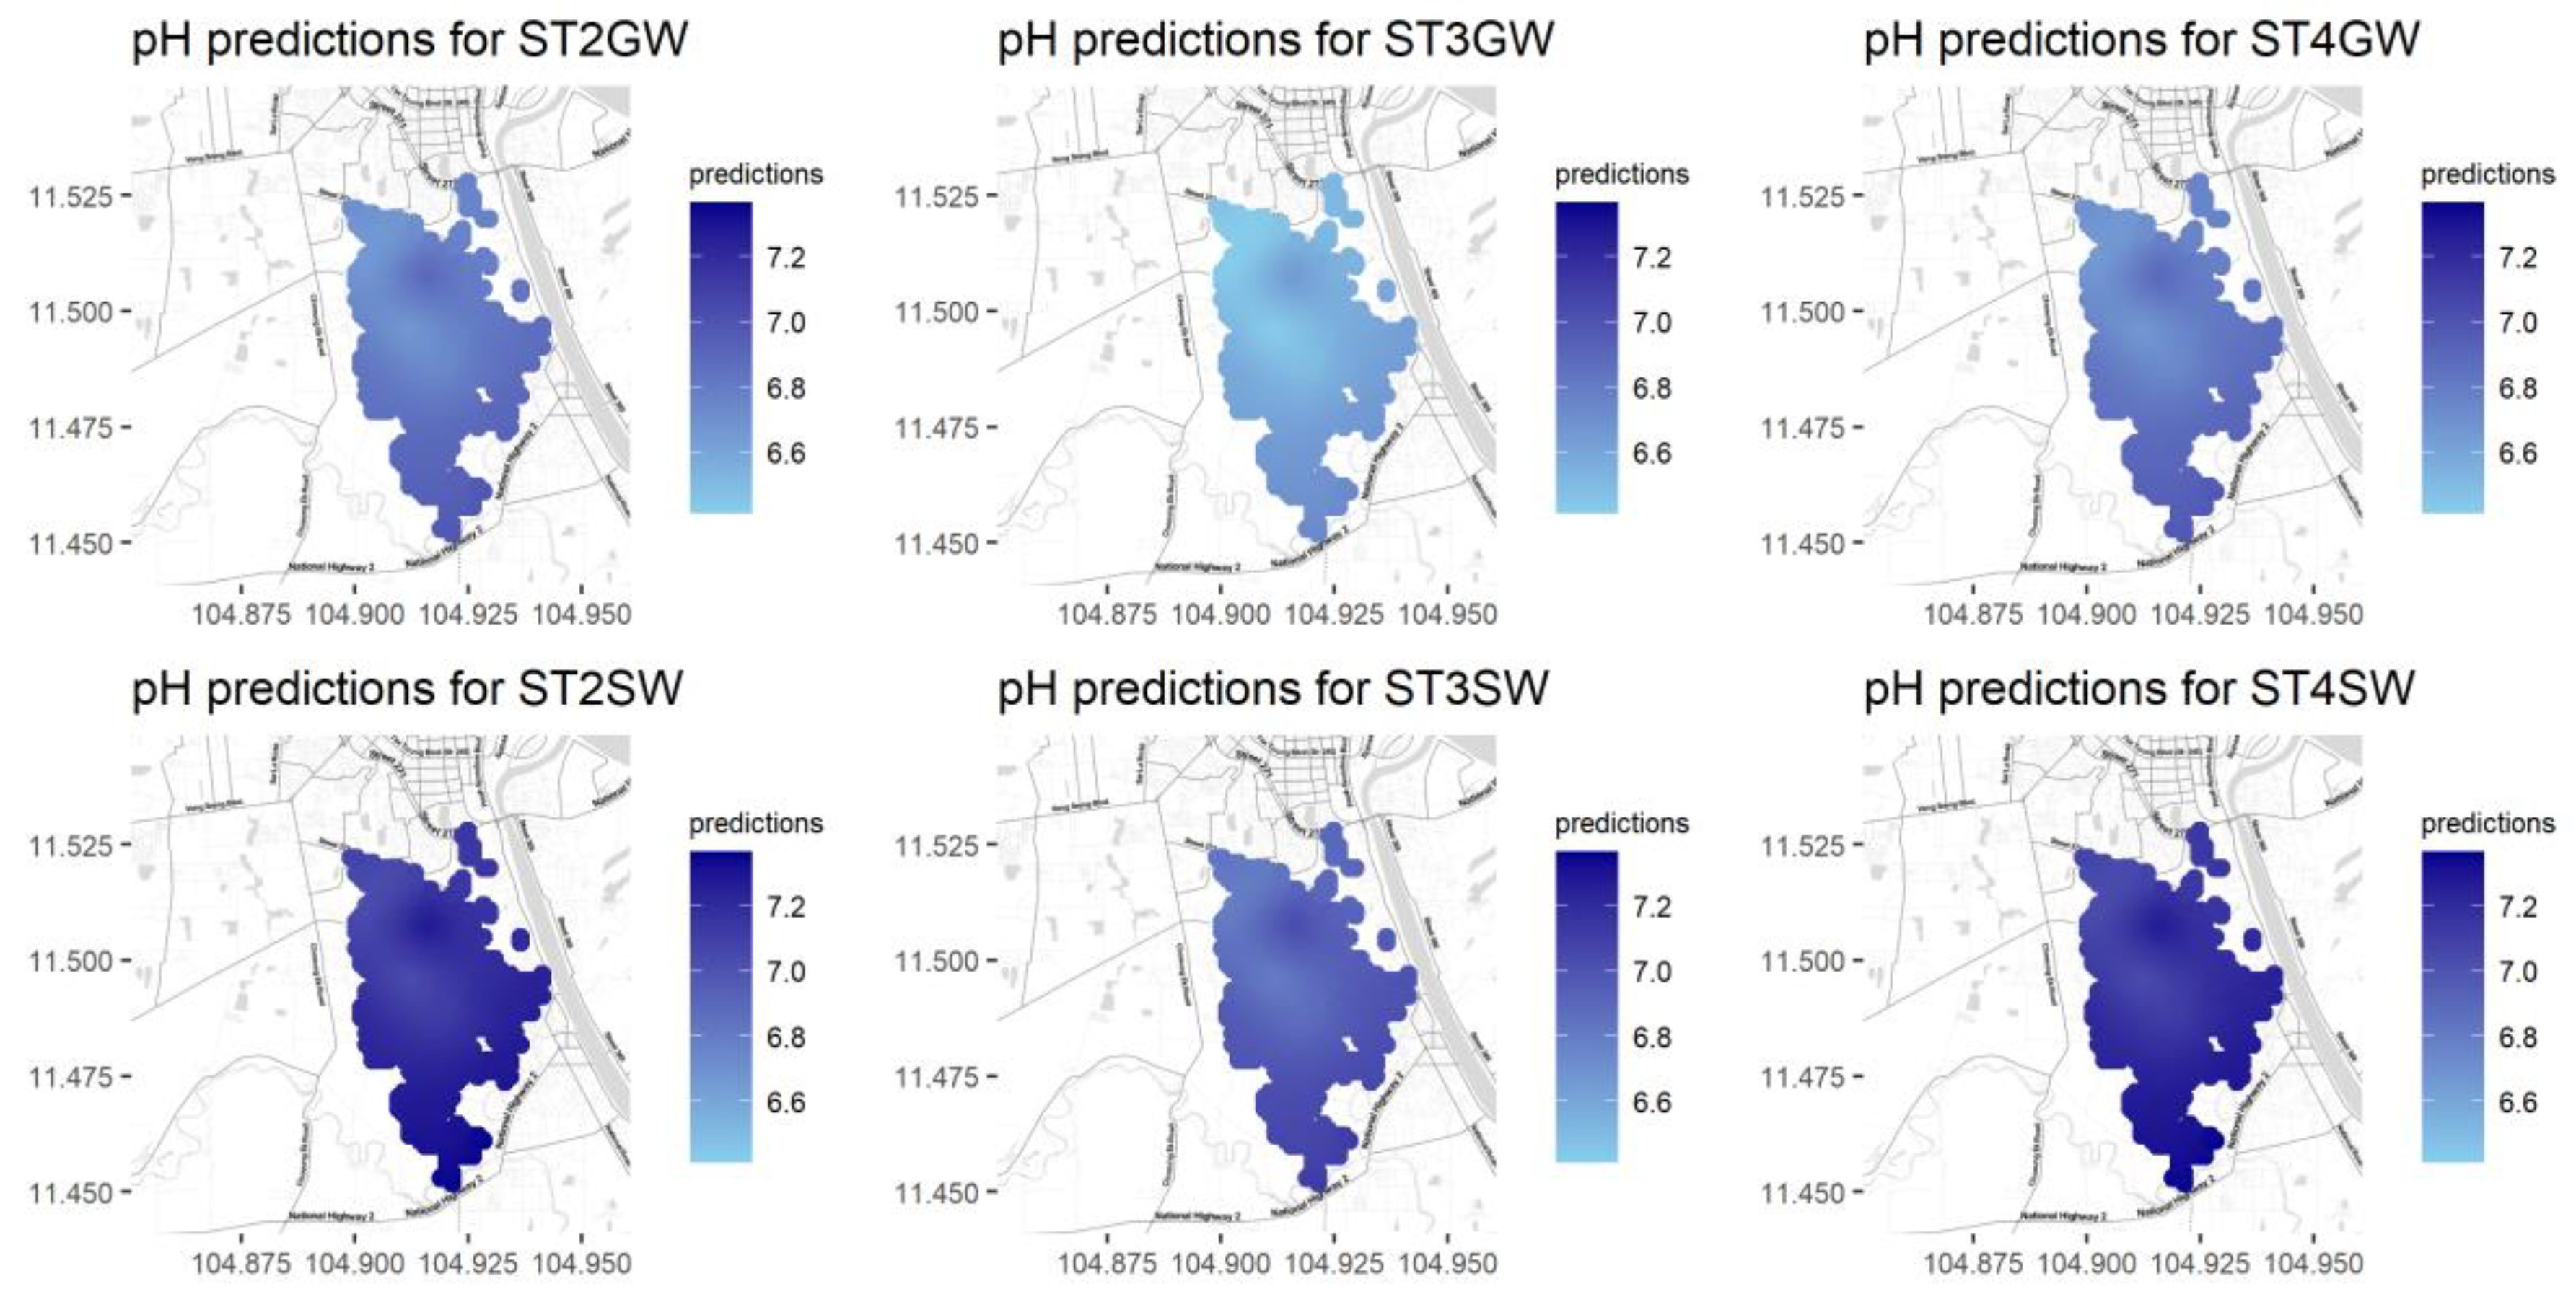
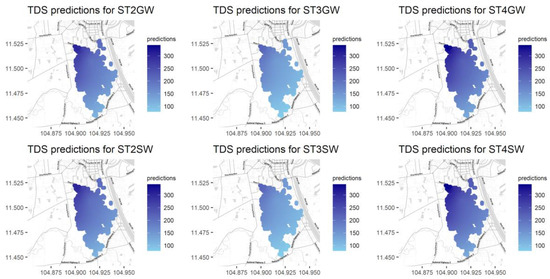
Figure A11.
Predictions for TDS for different seasons and water types.
Figure A11.
Predictions for TDS for different seasons and water types.
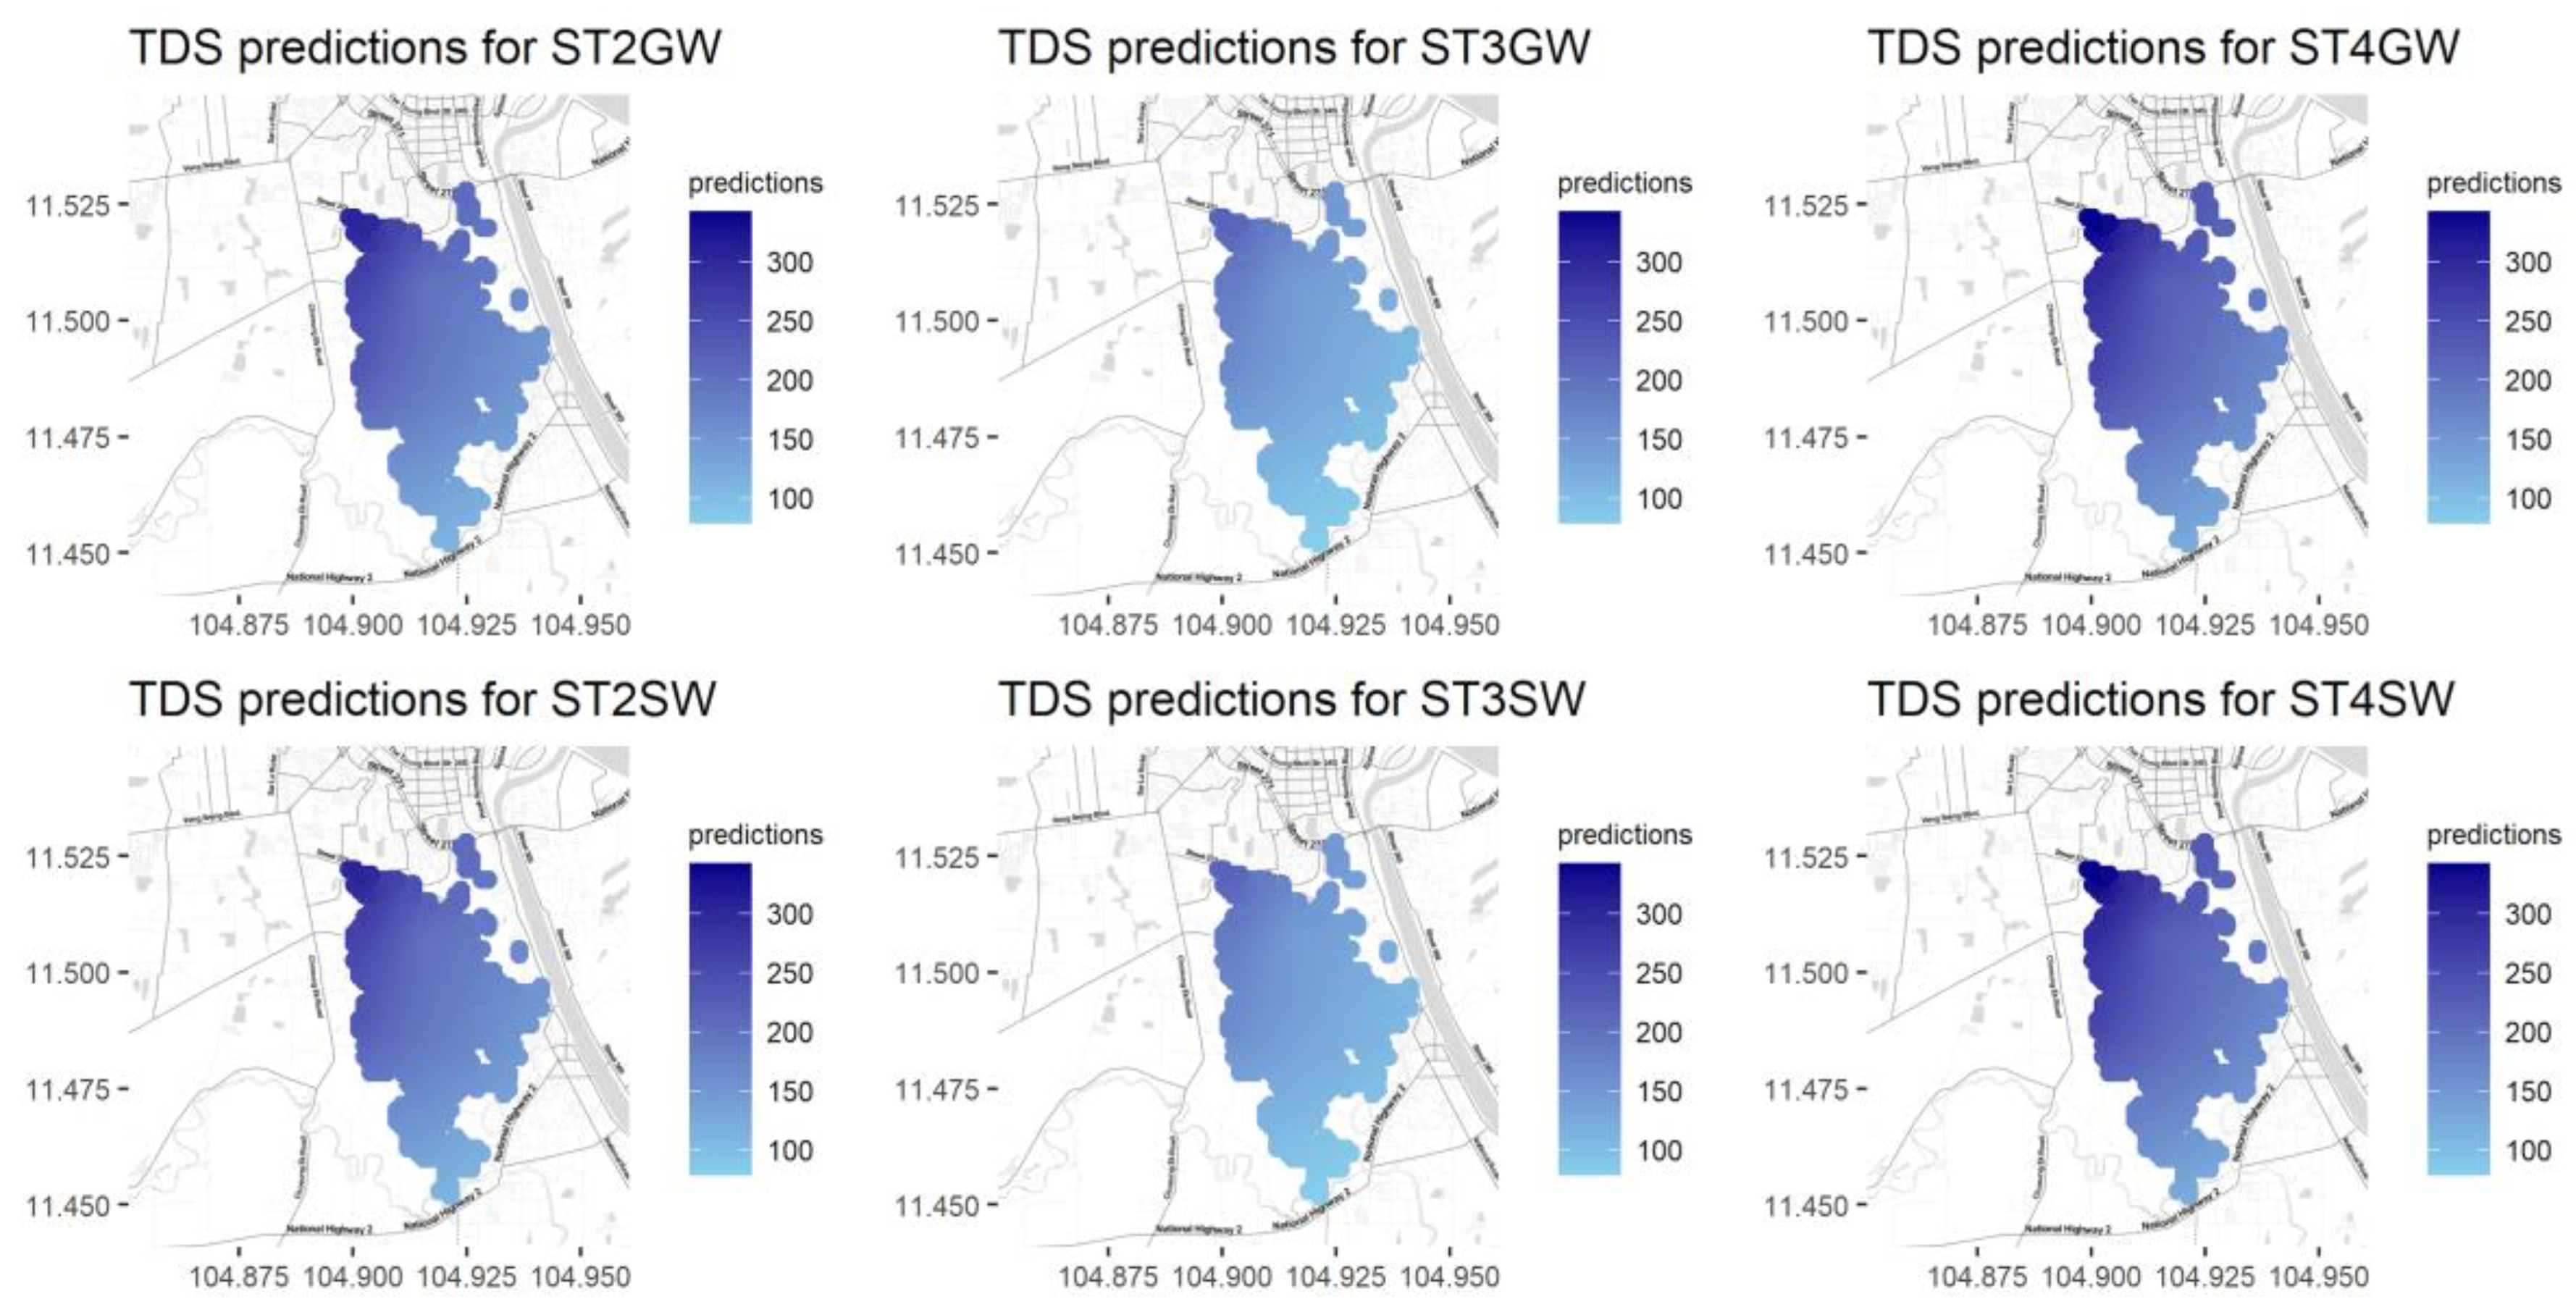
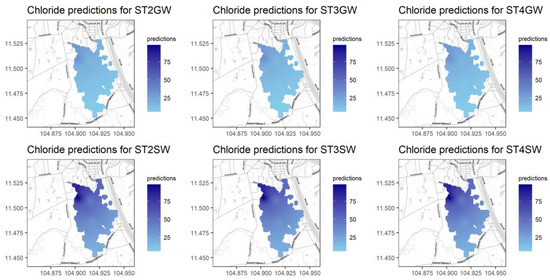
Figure A12.
Predictions for Cl for different seasons and water types.
Figure A12.
Predictions for Cl for different seasons and water types.
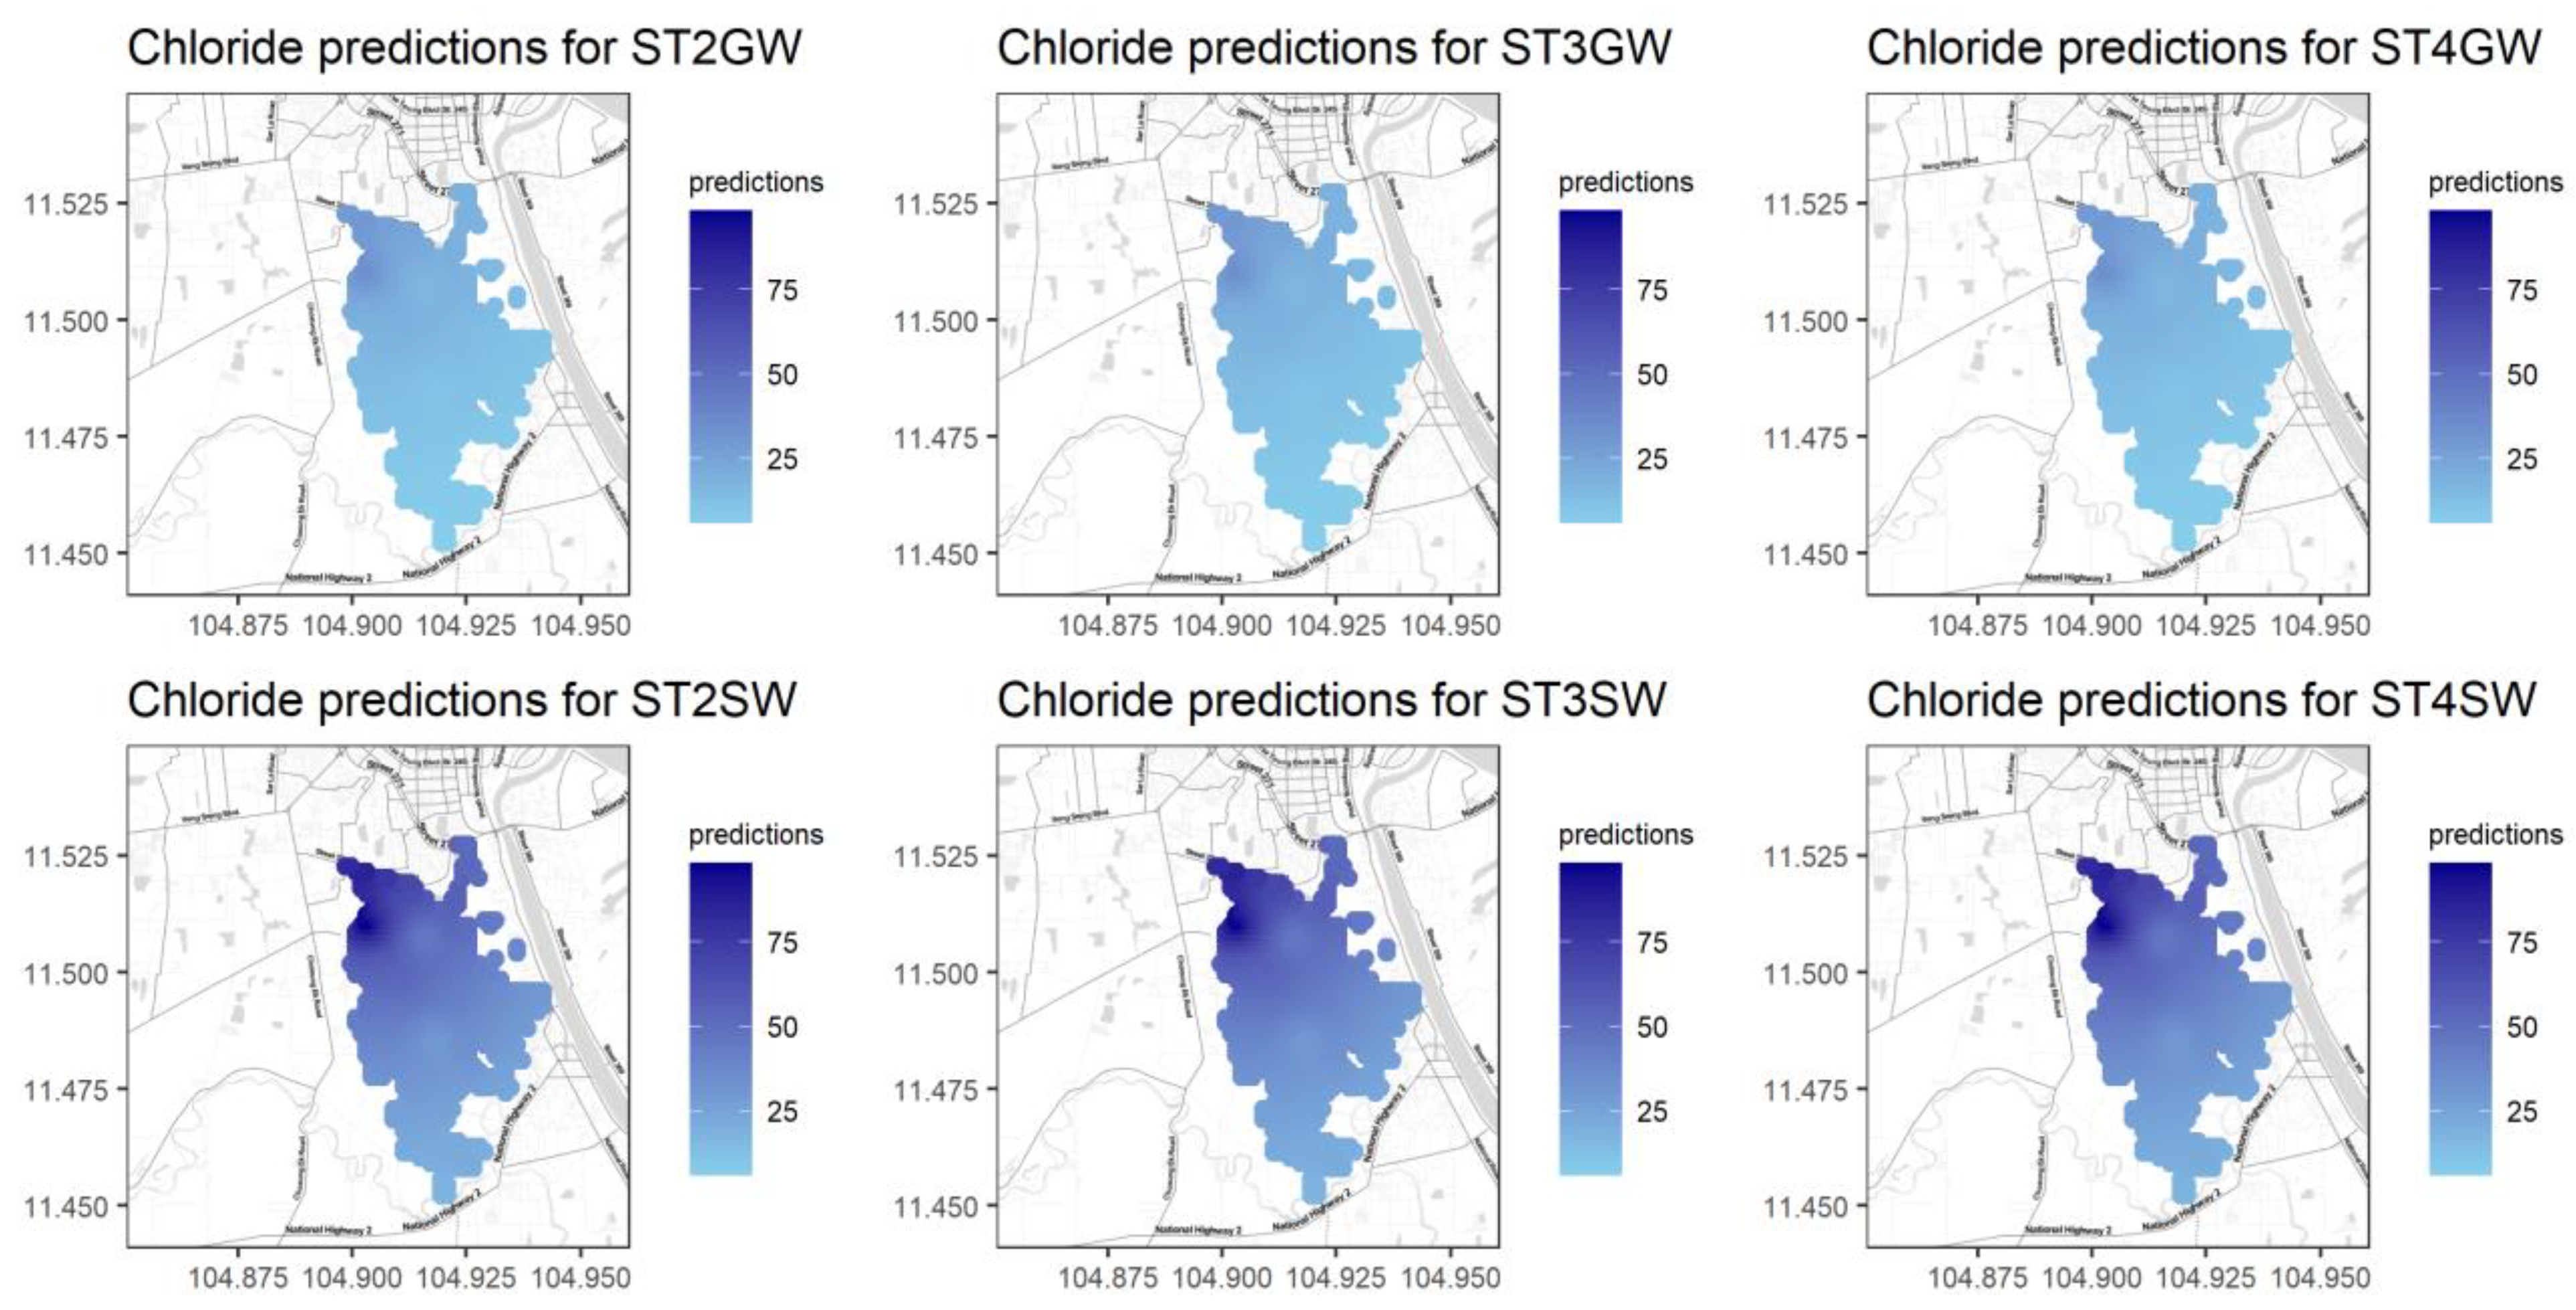
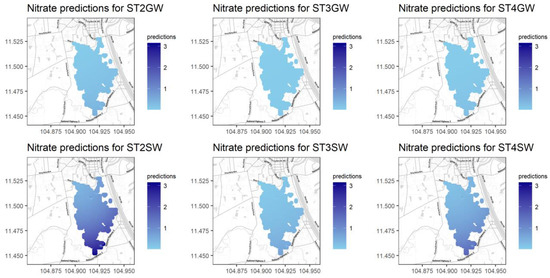
Figure A13.
Predictions for NO3− for different seasons and water types.
Figure A13.
Predictions for NO3− for different seasons and water types.
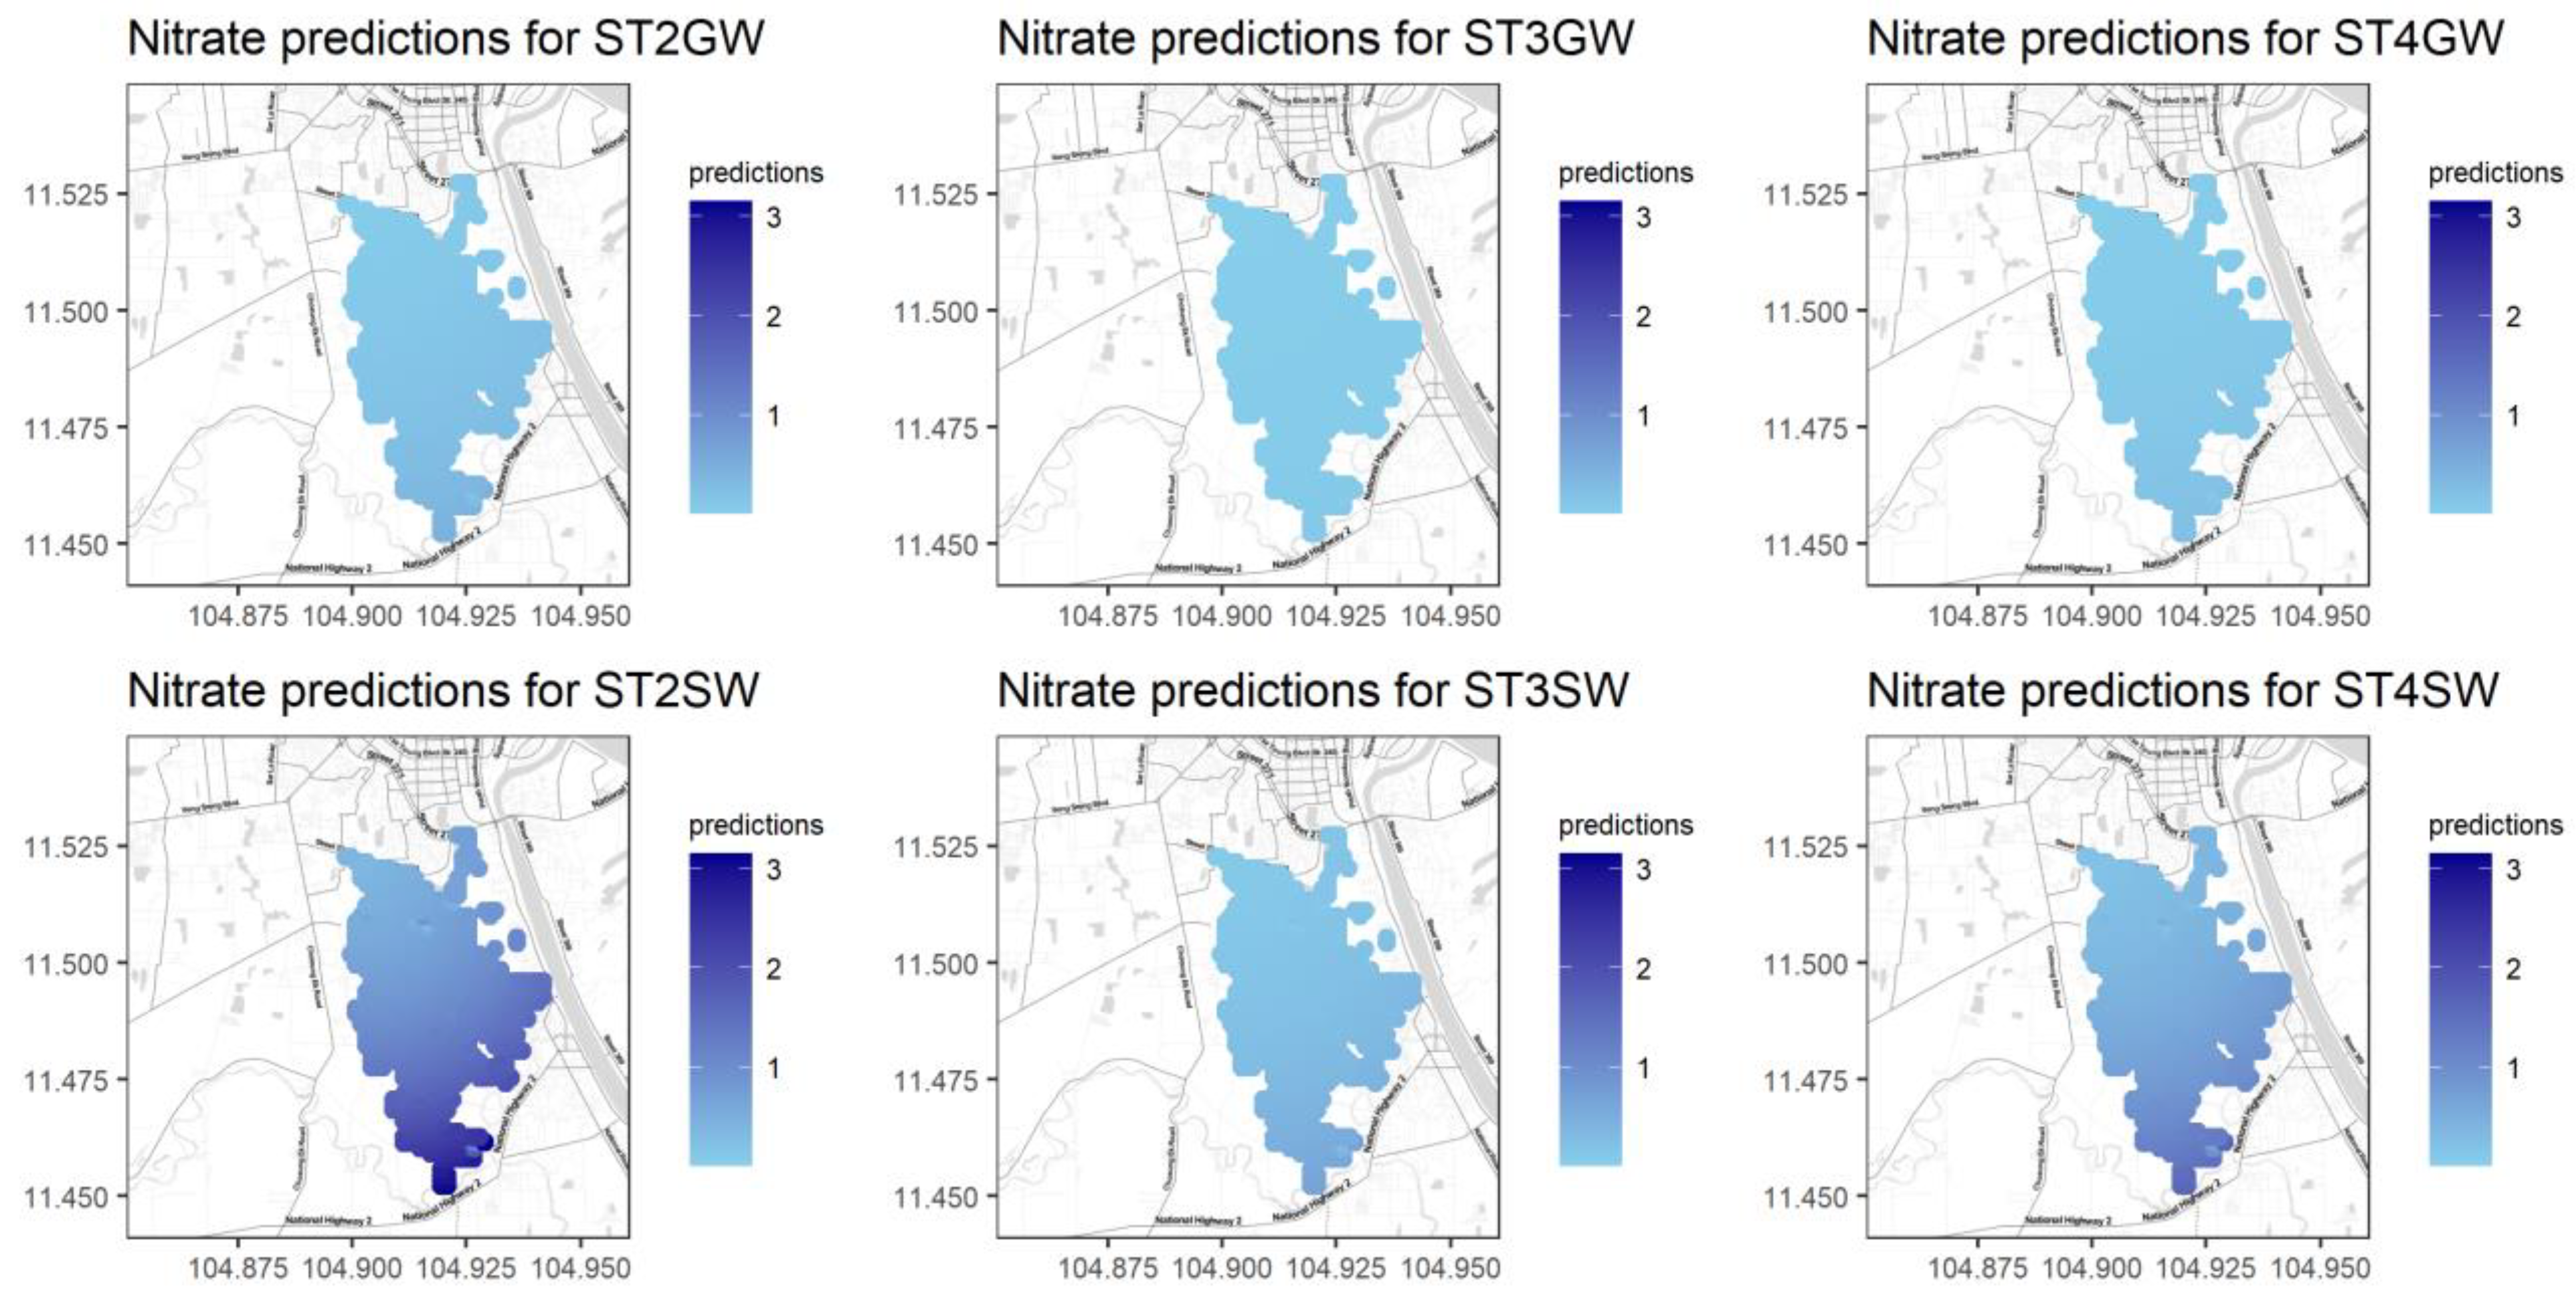
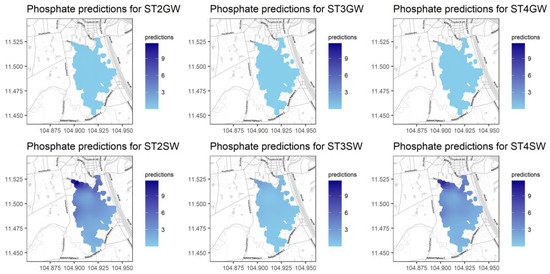
Figure A14.
Predictions for PO4 for different seasons and water types.
Figure A14.
Predictions for PO4 for different seasons and water types.
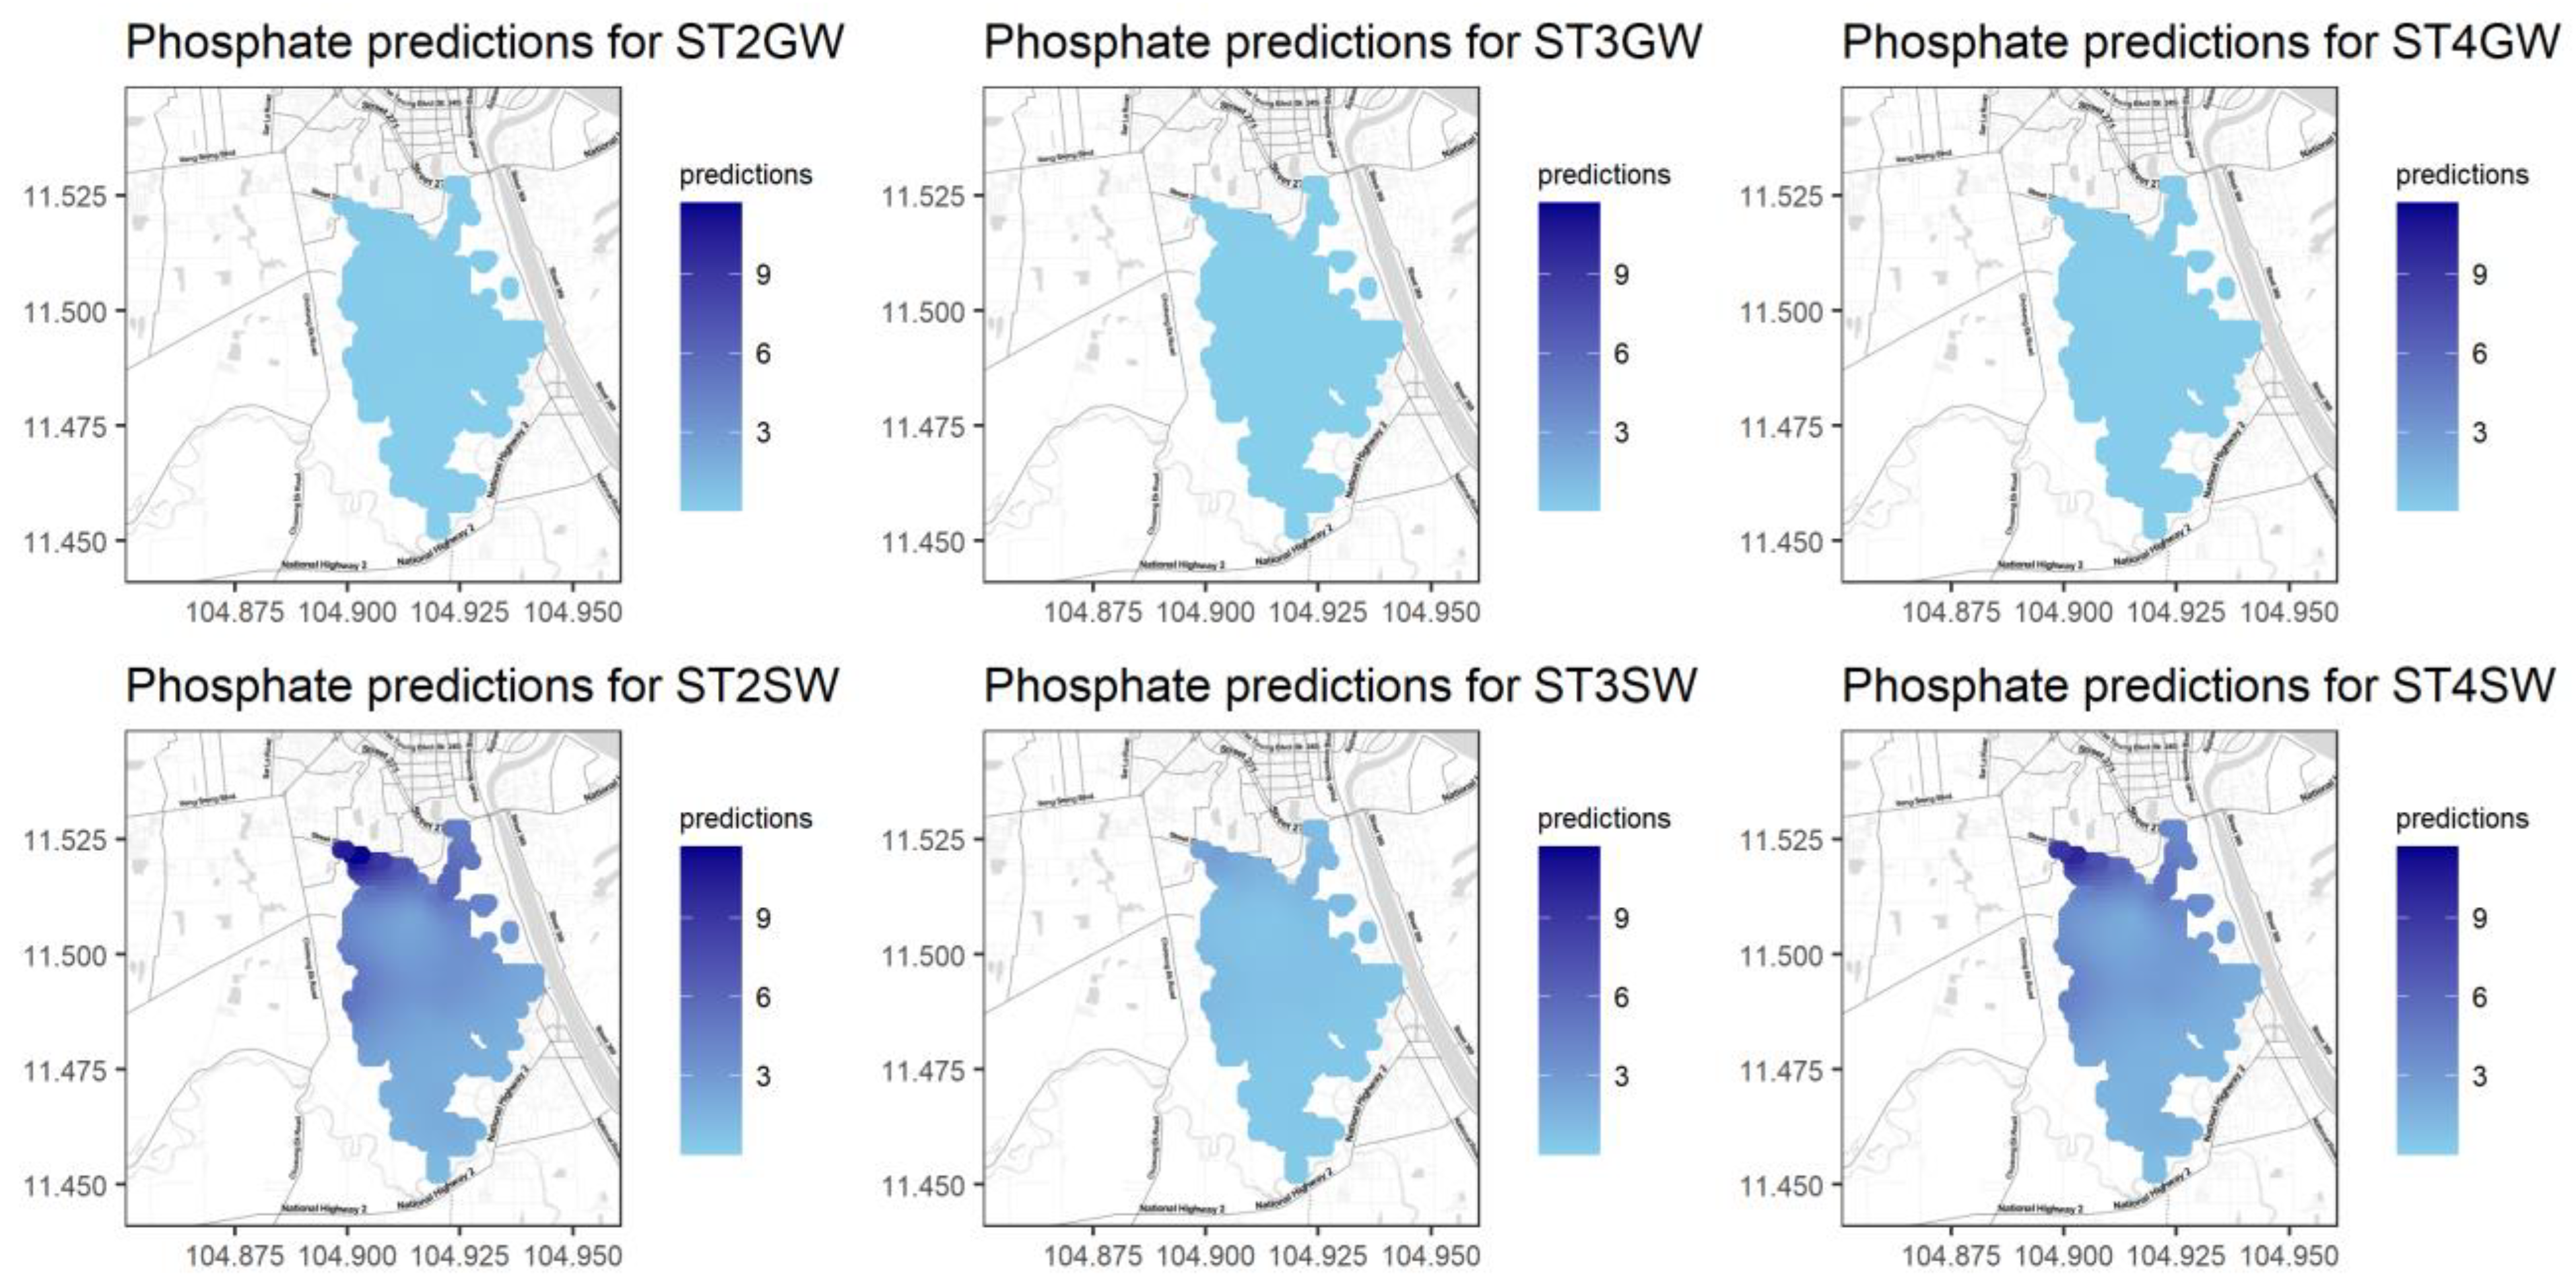
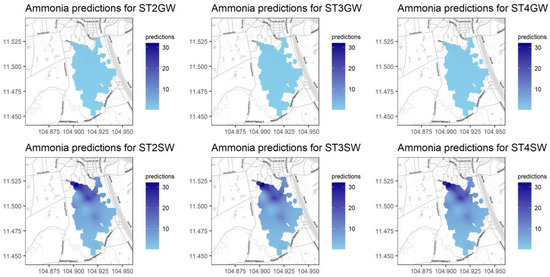
Figure A15.
Predictions for NH4+ for different seasons and water types.
Figure A15.
Predictions for NH4+ for different seasons and water types.
References
- World Health Organization. 1. Introduction. In Guidelines for Drinking-Water Quality, 4th ed.; Number Chapter 1; WHO: Geneva, Switzerland, 2017; pp. 1–24. [Google Scholar] [CrossRef]
- WHO/UNICEF. Progress on Household Drinking Water, Sanitation and Hygiene 2000–2020: Five Years into the SDGs; WHO: Geneva, Switzerland; UNICEF: New York, NY, USA, 2021. [Google Scholar]
- Thiel, F. Phnom Penh—Property and planning in a contested city. Disp. Plan. Rev. 2012, 47, 6–11. [Google Scholar] [CrossRef]
- Ministry of Environment, Kingdom of Cambodia. Cambodia Environment Outlook; Ministry of Environment, Kingdom of Cambodia: Phnom Penh, Cambodia, 2009; pp. 3–9. [Google Scholar]
- Takeuchi, T.; Takahashi, Y.; Sina, C. Sewage Water Quality of Phnom Penh City. J. Water Environ. Technol. 2005, 3, 133–143. [Google Scholar] [CrossRef]
- Irvine, K.N.; Sampson, M.; Visoth, T.; Yim, M.; Veasna, K.; Koottatep, T.; Rupp, J. Spatial patterns of E. coli and detergents in the Boeng Cheung Ek treatment wetland, Phnom Penh, Cambodia. In Proceedings of the 6th International Symposium on Southeast Asia Water Environment, Bandung, Indonesia, 29–31 October 2008; pp. 78–81. [Google Scholar]
- Visoth, T.; Yim, M.; Vathna, S.; Irvine, K.; Koottatep, T. Efficiency of Phnom Penh’s natural wetlands in treating wastewater discharges. Surf. Sub-Surf. Water Asia Issues Perspect. 2015, 7, 162–177. [Google Scholar] [CrossRef]
- JICA. The Study on Drainage and Sewerage Improvement Project in Phnom Penh Metropolitan Area. JICA Libr. 2016, 2, 16–132. [Google Scholar]
- JICA. Project for Sewerage System Development in Phnom Penh; JICA: Tokyo, Japan, 2019. [Google Scholar]
- Vanyuth, C. Wastewater Treatment Plans for Southern Phnom Penh. 2021. Available online: https://www.khmertimeskh.com/50814405/wastewater-treatment-plans-for-southern-phnom-penh/ (accessed on 11 December 2023).
- Sophal, M. Sustainable use and management of Cambodian Wetlands: Social and institutional challenges. In Wetlands Management in Cambodia: Socioeconomic, Ecological, and Policy Perspectives; World Fish Center Press: Penang, Malaysia, 2004; pp. 22–24. [Google Scholar]
- Group, W.B. Climate Change: Cambodia. Available online: https://dicf.unepgrid.ch/cambodia/climate-change (accessed on 11 December 2023).
- U.S. Environmental Protection Agency. National Aquatic Resource Surveys-Indicators: Dissolved Oxygen. Available online: https://www.epa.gov/national-aquatic-resource-surveys/indicators-dissolved-oxygen (accessed on 17 December 2023).
- Food and Agricultural Organization. Faolex data base. Kingdom of Cambodia. Water Pollution Control. Available online: https://faolex.fao.org/docs/texts/cam47646.doc (accessed on 17 December 2023).
- U.S. Environmental Protection Agency. CADDIS Volume 2: pH. Available online: https://www.epa.gov/caddis-vol2/ph (accessed on 17 December 2023).
- U.S. Environmental Protection Agency. Secondary Drinking Water Standards: Guidance for Nuisance Chemicals. Available online: https://protectyourwater.net/files/2019/09/EPA-secondary-drinking-water-Regs.pdf (accessed on 23 October 2023).
- U.S. Environmental Protection Agency. Nutrient Pollution. Available online: https://www.epa.gov/nutrientpollution (accessed on 17 December 2023).
- U.S. Environmental Protection Agency. Indicator: Phosphorus. Available online: https://www.epa.gov/national-aquatic-resource-surveys/indicators-phosphorus (accessed on 17 December 2023).
- Russell, D.W. In search of underlying dimensions: The use (and abuse) of factor analysis in Personality and Social Psychology Bulletin. Personal. Soc. Psychol. Bull. 2002, 28, 1629–1646. [Google Scholar] [CrossRef]
- R Core Team. R: A Language and Environment for Statistical Computing; R Foundation for Statistical Computing: Vienna, Austria, 2021; Available online: https://www.R-project.org/ (accessed on 23 October 2023).
- Hallock, D. A Water Quality Index for Ecology’s Stream Monitoring Program. Washington State Department of Ecology Publications. Technical Report 02-03-052. 2002. Available online: https://apps.ecology.wa.gov/publications/documents/0203052.pdf (accessed on 17 December 2023).
- Walsh, P.; Wheeler, W. Water Quality Index Aggregation and Cost Benefit Analysis National Center for Environmental Economics Water Quality Index Aggregation and Cost Benefit Analysis; U.S. Environmental Protection Agency: Washington, DC, USA, 2012; pp. 1–26. [Google Scholar]
- Rickwood, C.J.; Carr, G.M. Development and sensitivity analysis of a global drinking water quality index. Environ Monit. Assess 2009, 156, 73–90. [Google Scholar] [CrossRef] [PubMed]
- Wessel, M.R.; Leverone, J.R.; Beck, M.W.; Sherwood, E.T.; Hecker, J.; West, S.; Janicki, A. Developing a Water Quality Assessment Framework for Southwest Florida Tidal Creeks. Estuaries Coasts 2022, 45, 17–37. [Google Scholar] [CrossRef]
- Akoteyon, I.S.; Omotayo, A.O.; Soladoye, O.; Olaoye, H.O. Determination of water quality index and suitability of Urban River for municipal water supply in Lagos-Nigeria. Eur. J. Sci. Res. 2011, 54, 263–271. [Google Scholar]
- Ali, S.A.; Ahmad, A. Analysing water-borne diseases susceptibility in Kolkata Municipal Corporation using WQI and GIS based Kriging interpolation. GeoJournal 2020, 85, 1151–1174. [Google Scholar] [CrossRef]
- Tripathi, M.; Singal, S.K. Allocation of weights using factor analysis for development of a novel water quality index. Ecotoxicol. Environ. Saf. 2019, 183, 109510. [Google Scholar] [CrossRef] [PubMed]
- Mehrjardi, R.T.; Jahromi, M.Z.; Heidari, A. Spatial Distribution of Groundwater Quality with Geostatistics (Case Study: Yazd-Ardakan Plain). Appl. Sci. 2008, 4, 9–17. [Google Scholar]
- Ro, C.; Sovann, P.; Bun, D.; Yim, C.; Bun, T.; Yim, S.; Irvine, K. The economic value of peri-urban wetland ecosystem services in Phnom Penh, Cambodia. IOP Conf. Ser. Earth Environ. Sci. 2020, 561, 012013. [Google Scholar] [CrossRef]
- USEPA. Quality Criteria for Water 1986; Office of Water: Washington, DC, USA, 1986; p. 477. [Google Scholar]
Disclaimer/Publisher’s Note: The statements, opinions and data contained in all publications are solely those of the individual author(s) and contributor(s) and not of MDPI and/or the editor(s). MDPI and/or the editor(s) disclaim responsibility for any injury to people or property resulting from any ideas, methods, instructions or products referred to in the content. |
© 2023 by the authors. Licensee MDPI, Basel, Switzerland. This article is an open access article distributed under the terms and conditions of the Creative Commons Attribution (CC BY) license (https://creativecommons.org/licenses/by/4.0/).