
Research Progress on Identification and Suppression Methods for Monitoring the Cavitation State of Centrifugal Pumps

Abstract
:1. Introduction
- (1)
- The cavitation signal exhibits complexity, coupling, and uncertainty. The traditional energy method relies on a 3% centrifugal pump head drop as the basis for determining the initial occurrence of cavitation. However, this method suffers from significant hysteresis. Thus, it is crucial to establish the sensitivity of the centrifugal pump cavitation monitoring signals and identify values with higher sensitivity.
- (2)
- Differentiating between various cavitation states is challenging. Establishing an accurate threshold based on the mapping relationship between the cavitation states and eigenvalues proves difficult. Moreover, changes in working conditions or pump faults lead to variations in eigenvalues such as the head, sound level, and vibration level. Relying on a single eigenvalue to set the thresholds for cavitation identification can lead to miscalculations, posing significant challenges regarding feature extraction for the centrifugal pump’s cavitation state and pattern recognition.
- (3)
- Sensor monitoring data are susceptible to unpredictable perturbations due to environmental changes or external excitation. Sudden changes or missing raw data are unavoidable, necessitating robust anti-interference measures in the cavitation state identification method.
- (4)
- Cavitation in centrifugal pumps often coincides with other faults. Distinguishing between phenomena caused by a single fault or multiple concurrent faults poses another difficulty in the research.
2. Centrifugal Pump Cavitation Mechanism and Harm
2.1. Cavitation Mechanism
- (1)
- Incipient Stage: In this stage, cavitation bubbles form and collapse in the blade inlet region, causing pitting damage to the blade [11].
- (2)
- Weak Cavitation Stage: This stage encompasses the development of cavitation from its incipient state to the point of unstable cavitation occurrence [12]. Prolonged operation in a state of weak cavitation leads to surface damage in the overflow components, with the damage initiating on the blade inlet side and correlating with the length of the cavitation hole [11]. The scope of the weak cavitation stage can be determined through the analysis of the non-stationary dynamic properties.
- (3)
- Unstable Cavitation Stage: In this stage, the length of the cavitation zone reaches 65% of the width of the impeller channel, leading to alternating foliar cavitation on the working surface and back of the pump blade [13]. This type of instationary flow is characterized by interference between the leading edges of neighboring blades during cavitation instability [14].
2.2. Cavitation Pattern
2.3. Cavitation Hazard
- (1)
- Performance Degradation: Cavitation disrupts the medium’s continuity, resulting in a decline in the centrifugal pump head and efficiency. This leads to elevated power consumption and, in severe cases, may cause head breakage, significantly affecting the pump’s overall performance.
- (2)
- Mechanical Damage: Cavitation bubbles, upon reaching high-pressure regions, undergo collapse, releasing shock waves and micro-jets. The impingement of these on solid surfaces causes permanent damage, a phenomenon referred to as cavitation erosion. The occurrence of cavitation severely compromises the operational safety and reliability of centrifugal pumps.
- (3)
- Vibration and Noise: The continuous collapse of numerous vacuoles generates strong water shocks, leading to vibration and noise issues [23].
3. Centrifugal Pump Design Method and Numerical Calculation of Cavitation Flow
3.1. Design Methods for Centrifugal Pumps
3.1.1. Modeling Approach
3.1.2. Deformation Design Method
- (1)
- Modification of the diameter or shape of the water pipe to change the characteristics of the inlet flow;
- (2)
- Modification of the outer diameter of the rotor blades, the blade import and export angle blade wrap angle, and the number of blades to change the head of the pump;
- (3)
- Modification of the width of the front and back covers of the rotor and the thickness of the rotor to change the distribution of the flow characteristics of the internal flow field;
- (4)
- The worm shell of the outlet pipe, the tongue part of the modification, to change the internal flow characteristics of the worm shell.
3.1.3. Design Factor Method
3.2. Numerical Simulation of Cavitation Flow
3.2.1. Cavitation Models
3.2.2. Turbulence Modeling
4. Current State of Research on Monitoring Methods for Centrifugal Pump Cavitation
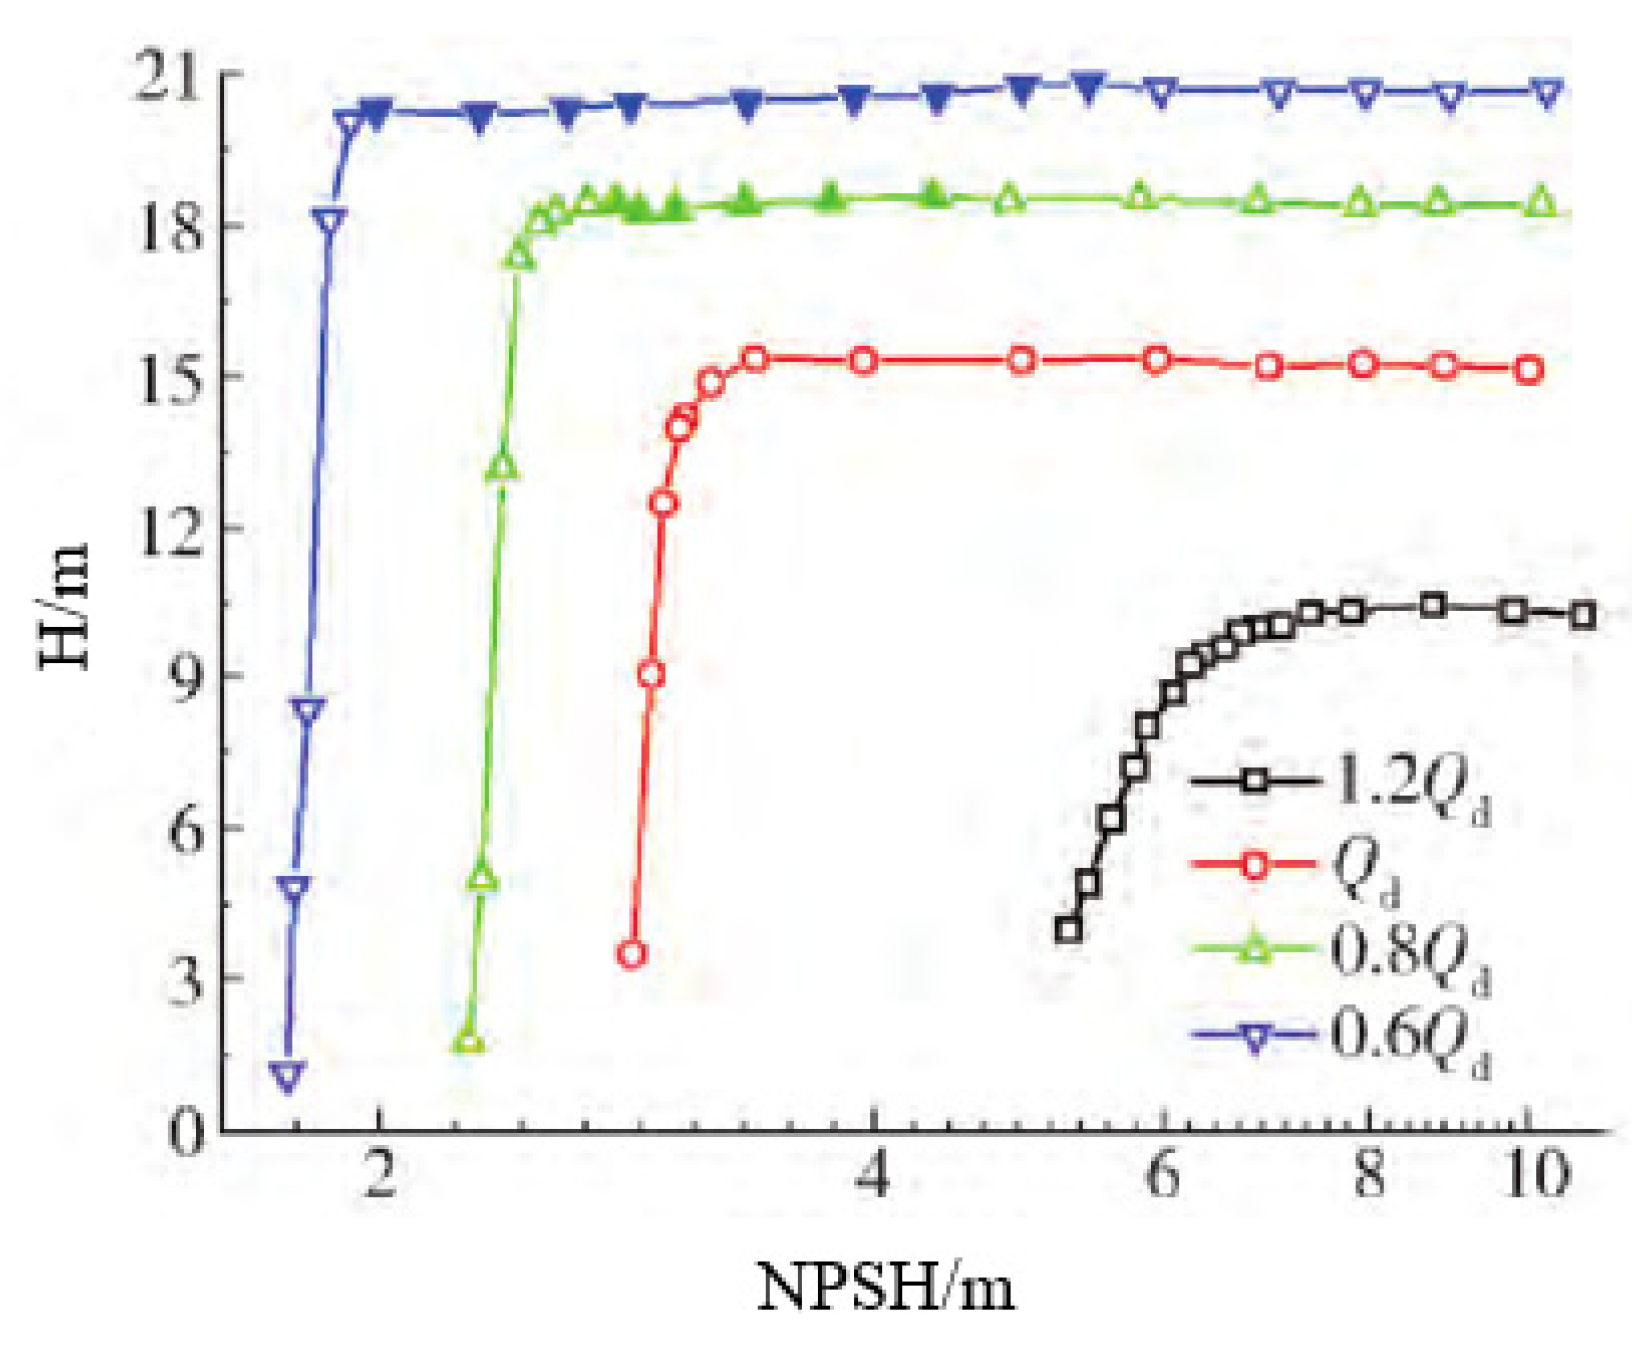
4.1. Flow-Head Method
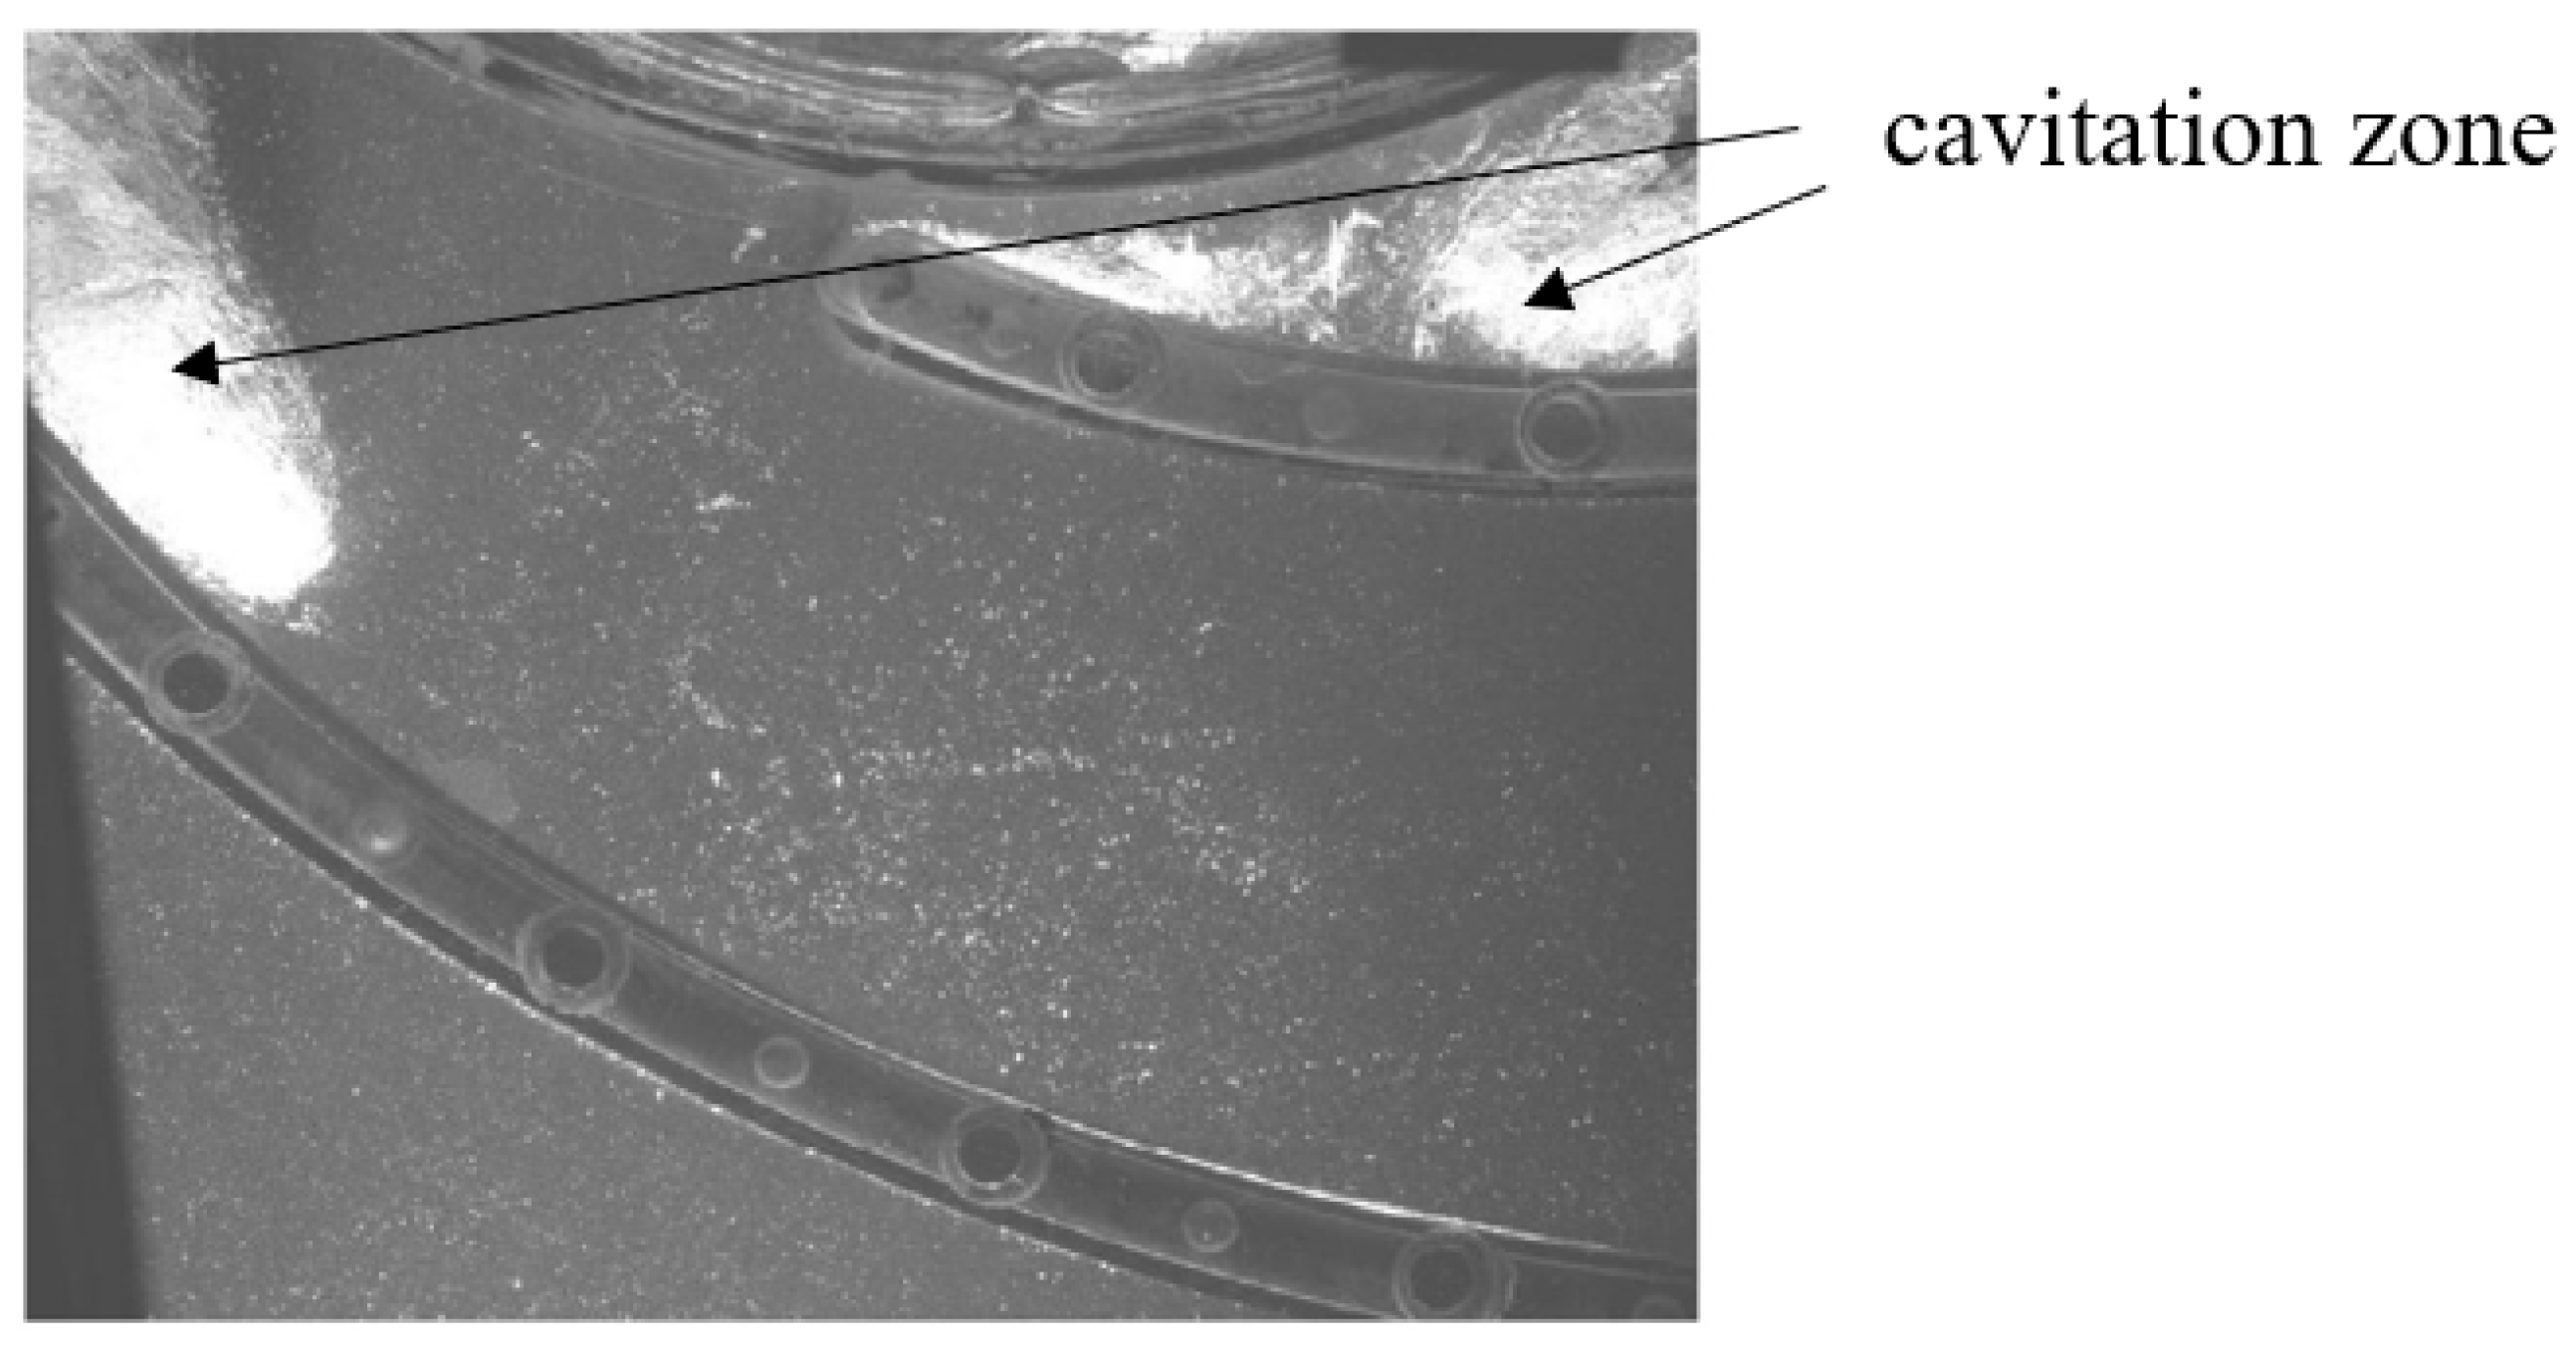
4.2. High-Speed Photography
4.3. Pressure Pulsation
4.4. Acoustic Emission Method
4.5. Vibration Method
5. Research Status of Signal Feature Extraction Methods for Centrifugal Pump Cavitation
5.1. Time-Domain Feature Extraction
5.2. Frequency-Domain Feature Extraction
5.3. Time–Frequency-Domain Feature Extraction
6. Current Research Status of Cavitation State Identification Methods
7. Current Status of Cavitation Suppression Research
7.1. Increase Inlet Pressure
7.2. Changing the Blade Structure
7.3. Optimization of Design Parameters
8. Summary and Outlook
8.1. Research Summary
8.2. Research Outlook
- (1)
- Diversified signal analysis methods can be employed to extract more comprehensive signal feature information. Techniques like wavelet analysis, envelope analysis, holographic spectral analysis, and others should be considered. Additionally, a variety of classification methods, such as genetic algorithms, particle swarm algorithms, artificial fish swarm algorithms, and others, could be explored. Utilizing multiple methods can strike a balance between recognition accuracy and efficiency.
- (2)
- Improvements in cavitation state identification methods are crucial. Currently, signal processing of cavitation vibration noise in multi-measurement points often involves wavelet noise reduction, wavelet packet decomposition, statistical feature extraction, principal component analysis, radial basis function-based neural networks (RBF), and evidence theory (Dempster–Shafer) information fusion methods for identification. Further research should focus on other signal processing methods for signal separation and extraction, such as singular value decomposition noise reduction, Empirical Mode Decomposition (EMD) for eigenvalue extraction, and the use of support vector machines (SVM) for pattern recognition, aiming to enhance the cavitation state recognition accuracy.
- (3)
- Regardless of whether it is centrifugal pumps or axial pumps, various cavitation states and stages exist, making accurate identification and classification, as well as real-time monitoring, crucial. Developing a new algorithm for recognizing and classifying images of different cavitation states, based on high-speed photography of these states, is essential. By creating a dataset and applying deep-learning methods for training, real-time monitoring and warning of different cavitation states can be achieved.
Author Contributions
Funding
Data Availability Statement
Conflicts of Interest
References
- Zhang, K.W. Principles of Fluid Mechanics. The First Book; Machinery Industry Press: Beijing, China, 2000. [Google Scholar]
- Kollek, W.; Kudźma, Z.; Stosiak, M.; Mackiewicz, J. Possibilities of diagnosing cavitation in hydraulic systems. Arch. Civ. Mech. Eng. 2007, 7, 61–73. [Google Scholar] [CrossRef]
- Karpenko, M.; Stosiak, M.; Šukevičius, Š.; Skačkauskas, P.; Urbanowicz, K.; Deptuła, A. Hydrodynamic Processes in Angular Fitting Connections of a Transport Machine’s Hydraulic Drive. Machines 2023, 11, 355. [Google Scholar] [CrossRef]
- Savar, M.; Kozmar, H.; Sutlovic, I. Improving centrifugal pump efficiency by impeller trimming. Desalination 2009, 249, 654–659. [Google Scholar] [CrossRef]
- Zhao, G.S. Research on Cavitation Flow Instability and Its Control in a Centrifugal Pump. Master’s Thesis, Lanzhou University of Technology, Lanzhou, China, 2018. [Google Scholar]
- Franc, J.P.; Michel, J.M. Fundamentals of Cavitation; Springer Science & Business Media: Berlin/Heidelberg, Germany, 2006. [Google Scholar] [CrossRef]
- Bouziad, Y.A. Physical Modeling of Leading Edge Cavitation: Computational Methodologies and Application to Hydraulic Machinery. Ph.D. Dissertation, École Polytechnique Fédérale de Lausanne (EPFL), Lausanne, Switzerland, 2005. [Google Scholar]
- Christopher, S.; Kumaraswamy, S. Identification of the critical net positive suction head from noise and vibration in a radial flow pump for different leading edge profiles of the vane. ASME J. Fluids Eng. 2013, 135, 121301. [Google Scholar] [CrossRef]
- Hofmann, M.; Stoffel, B. Experimental and numerical studies in a centrifugal pump with two-dimensional curved blades in cavitating condition. ASME J. Fluids Eng. 2003, 125, 970–978. [Google Scholar] [CrossRef]
- Li, X.J. Study on the Mechanism and Kinetic Characteristics of Non-Stationary Flow with Cavitation at the Leading Edge of a Centrifugal Pump Blade. Ph.D. Dissertation, Jiangsu University, Zhenjiang, China, 2013. [Google Scholar]
- Bachert, B.; Ludwig, G.; Stoffel, B. Experimental investigations concerning erosive aggressiveness of cavitation in a radial test pump with the aid of adhesive copper films. In Proceedings of the Fifth International Symposium on Cavitation, Osaka, Japan, 1–4 November 2003. [Google Scholar]
- Lu, J.X.; Yuan, S.Q.; Li, X.J.; Si, Q.R.; Luo, Y. Research on the characteristics of quasi-steady cavitation in a centrifugal pump. IOP Conf. Ser. Mater. Sci. Eng. 2015, 72, 032017. [Google Scholar] [CrossRef]
- Tsujimoto, Y. Simple rules for cavitation instabilities in turbomachinery. In Proceedings of the Fourth International Symposium on Cavitation, Pasadena, CA, USA, 20–23 June 2001. [Google Scholar]
- Kang, D.; Yonezawa, K.; Horiguchi, H.; Yutaka, K.; Yoshinobu, T. Cause of cavitation instabilities in three dimensional inducer. Int. J. Fluid Mach. Syst. 2009, 2, 206–214. [Google Scholar] [CrossRef]
- Friedrichs, J.; Kosyna, G. Unsteady PIV flow field analysis of a centrifugal pump impeller under rotating cavitation. In Proceedings of the Fifth International Symposium on Cavitation, Osaka, Japan, 1–4 November 2003; pp. 8–12. [Google Scholar]
- Pan, Z.Y.; Yuan, S.Q. Fundamentals of Pump Cavitation; Jiangsu University Press: Zhenjiang, China, 2013. [Google Scholar]
- Ji, B.; Luo, X.W.; Wu, Y.L.; Peng, X.X.; Duan, Y.L. Numerical analysis of unsteady cavitating turbulent flow and shedding horse-shoe vortex structure around a twisted hydrofoil. Int. J. Multiph. Flow 2013, 51, 33–43. [Google Scholar] [CrossRef]
- Roland, L.; Gerhard, R. Cavitation research at the Institute of Hydraulic Engineering and Water Resources Management. In Proceedings of the International Conference on Hydrodynamics, Wuxi, China, 30 October–3 November 1994; pp. 263–271. [Google Scholar]
- Oba, R.; Ikohagi, T.; Yasu, S. Supercavitating Cavity Observations by Means of Laser Velocimeter. J. Fluids Eng. 1980, 102, 433. [Google Scholar] [CrossRef]
- Hammitt, F.G. Cavitation Erosion: The State of the Art and Predicting Capability. Appl. Mech. Rev. 1979, 32, 665–675. [Google Scholar]
- Wu, K. Research and Implementation of Centrifugal Pump Cavitation State Identification Method. Master’s Thesis, Jiangsu University, Zhenjiang, China, 2019. [Google Scholar]
- Escaler, X.; Egusquiza, E.; Farhat, M.; Avellan, F.; Coussirat, M. Detection of cavitation in hydraulic turbines. Mech. Syst. Signal Process. 2006, 20, 984–1007. [Google Scholar] [CrossRef]
- Wang, J. Numerical Calculation and Experimental Research on Cavitation of the Hydraulic Device. Ph.D. Thesis, Jiangsu University, Zhenjiang, China, 2015. [Google Scholar]
- Lu, X.J. Research on Design and Numerical Optimization of Middle-Open Multistage Centrifugal Pump. Master’s Thesis, Jiangsu University, Zhenjiang, China, 2020. [Google Scholar] [CrossRef]
- Wang, W.; Zhang, H.; Jiang, X.; Yang, X. A high-order and efficient numerical technique for the nonlocal neutron diffusion equation representing neutron transport in a nuclear reactor. Ann. Nucl. Energy 2024, 195, 110163. [Google Scholar] [CrossRef]
- Zhou, Z.; Zhang, H.; Yang, X. H1-norm error analysis of a robust ADI method on graded mesh for three-dimensional subdiffusion problems. Numer. Algorithms 2023, 1–19. [Google Scholar] [CrossRef]
- Zhang, H.; Liu, Y.; Yang, X. An efficient ADI difference scheme for the nonlocal evolution problem in three-dimensional space. J. Appl. Math. Comput. 2023, 69, 651–674. [Google Scholar] [CrossRef]
- Tian, Q.; Yang, X.; Zhang, H.; Da, X. An implicit robust numerical scheme with graded meshes for the modified Burgers model with nonlocal dynamic properties. Comput. Appl. Math. 2023, 42, 246. [Google Scholar] [CrossRef]
- Zhang, H.; Yang, X.; Tang, Q.; Xu, D. A robust error analysis of the OSC method for a multi-term fourth-order sub-diffusion equation. Comput. Math. Appl. 2022, 109, 180–190. [Google Scholar] [CrossRef]
- Jiang, X.; Wang, J.; Wang, W.; Zhang, H. A Predictor–Corrector Compact Difference Scheme for a Nonlinear Fractional Differential Equation. Fractal Fract. 2023, 7, 521. [Google Scholar] [CrossRef]
- Peng, X.; Ji, B.; Cao, Y.; Xu, L.; Zhang, G.; Luo, X.; Long, X. Combined experimental observation and numerical simulation of the cloud cavitation with U-type flow structures on hydrofoils. Int. J. Multiph. Flow 2016, 79, 10–22. [Google Scholar] [CrossRef]
- Liu, H.L.; Wang, J.; Wang, Y.; Zhang, H.; Huang, H. Influence of the empirical coefficients of cavitation model on predicting cavitating flow in the centrifugal pump. Int. J. Nav. Archit. Ocean Eng. 2014, 6, 119–131. [Google Scholar] [CrossRef]
- Ji, B.; Luo, X.W.; Arndt, R.E.A.; Peng, X.X.; Wu, Y.L. Large Eddy Simulation and theoretical investigations of the transient cavitating vortical flow structure around a NACA66 hydrofoil. Int. J. Multiph. Flow 2015, 68, 121–134. [Google Scholar] [CrossRef]
- Singhal, A.K.; Athavale, M.M.; Li, H.; Jiang, Y. Mathematical Basis and Validation of the Full Cavitation Model. J. Fluids Eng. 2002, 124, 617–624. [Google Scholar] [CrossRef]
- Schnerr, G.H.; Sauer, J. Physical and numerical modelling of unsteady cavitation dynamics. In Proceedings of the 4th International Conference on Multiphase Flow, New Orleans, LA, USA, 27 May–1 June 2001. [Google Scholar]
- Zwart, P.J.; Gerber, A.G.; Belamri, T.A. Two-phase flow model for predicting cavitation dynamics. In Proceedings of the International Conference on Multiphase Flow, Yokohama, Japan, 30 May–3 June 2004. [Google Scholar]
- Dorji, U.; Ghomashchi, R. Hydro turbine failure mechanisms: An overview. Eng. Fail. Anal. 2014, 44, 136–147. [Google Scholar] [CrossRef]
- Xu, H.Q.; Shen, Z.P. Discussion of some problems in model cavitation and energy test of hydraulic turbine. Water Resour. Hydropower Technol. 1996, 4, 29–32. [Google Scholar]
- Wu, D.; Wang, L.; Hao, Z.; Li, Z.; Bao, Z. Experimental study on hydrodynamic performance of a cavitating centrifugal pump during transient operation. J. Mech. Sci. Technol. 2010, 24, 575–582. [Google Scholar] [CrossRef]
- Grekula, M.; Bark, G. Experimental Study of Cavitation in a Kaplan Model Turbine. Minerva Anestesiol. 2001. [Google Scholar]
- Wang, K.L. Research on Cavitation and Pressure Pulsation Characteristics of a Centrifugal Pump with High Specific Speed. Master’s Thesis, Jiangsu University, Zhenjiang, China, 2020. [Google Scholar]
- Cui, B.L.; Chen, J.; Li, X.J.; Lin, Z.; Cai, H.B.; Han, A.D. Visualization experiment and numerical simulation of cavitation development in high-speed induced wheel centrifugal pump. J. Agric. Mach. 2018, 49, 148–155. [Google Scholar]
- Zhang, D.S.; Gu, Q.; Zhou, Q.; Huang, Y.D.; Shi, W.D. Experimental study of unsteady cavitation during startup of mixed-flow pump. J. Vib. Shock 2021, 40, 135–141. [Google Scholar] [CrossRef]
- Zhang, D.S.; Gu, Q.; Chen, Z.H.; Shi, W.D. Numerical simulation and experimental study of transient cavitation characteristics during startup of a mixed-flow pump. In Proceedings of the 30th National Symposium on Hydrodynamics and the 15th National Symposium on Hydrodynamics, Hefei, China, 16–18 August 2019. [Google Scholar] [CrossRef]
- Kim, J.; Song, S.J. Measurement of thermal parameter and Reynolds number effects on cavitation instability onset in a turbopump inducer. J. Glob. Power Propuls. Soc. 2017, 1, 157–170. [Google Scholar] [CrossRef]
- Shen, X.; Zhang, D.S.; Liu, A.; Jin, Y.X.; Chen, J. Leakage vortex and vertical vortex cavitation characteristics of axial pump lobe top. J. Agric. Eng. 2018, 34, 87–94. [Google Scholar]
- Sun, Z.X. Characterization of Cavitation-Induced Vibration Noise of Single Vane Centrifugal Pump. Master’s Thesis, Jiangsu University, Zhenjiang, China, 2022. [Google Scholar] [CrossRef]
- Guo, Z.W.; Pan, J.Y.; Qian, Z.D.; Cheng, Q. Cavitation performance test of axial flow pump with adjustable front guide vane. J. Agric. Mach. 2017, 48, 115–120+188. [Google Scholar]
- Zhao, W.G.; Pan, X.W.; Lu, W.Q.; Xian, L.X. Unsteady cavitation characteristics of centrifugal pumps before and after perforation of vane inlet side. J. Lanzhou Univ. Technol. 2019, 45, 55–61. [Google Scholar]
- Zhao, W.G.; Wang, G.P.; Zhao, G.S.; Xiao, T. Nonconstant cavitation flow characteristics of centrifugal pumps with low specific speed. J. Lanzhou Univ. Sci. Technol. 2020, 46, 50–56. [Google Scholar]
- Wang, C.; Zhang, Y.X.; Ji, K.Z.; Xu, C.; Liu, M. Effect of cavitation on pressure pulsation in ultra-low specific rotation centrifugal pumps. J. Agric. Mach. 2020, 51, 122–129. [Google Scholar]
- Mou, J.G.; Chen, Y.; Gu, Y.Q.; Zheng, S.H.; Qian, X. Characterization of fluid-solid coupling of centrifugal pumps under different cavitation degrees. Vib. Shock 2016, 35, 203–208. [Google Scholar] [CrossRef]
- He, G.; Cao, Y.L.; Wang, S.C.; Ming, T.F.; Su, Y.S. Characterization of cavitation pressure pulsation in a centrifugal pump. J. Wuhan Univ. Technol. (Transp. Sci. Eng. Ed.) 2017, 41, 549–553. [Google Scholar]
- Wang, K.L.; Li, H.; Shen, Z.H. Pressure pulsation characteristics of high specific rotation centrifugal pumps under cavitation. J. Irrig. Drain. Mach. Eng. 2020, 38, 891–897. [Google Scholar]
- Wang, W.T.; Lu, H.; Wang, X. Transient cavitation flow pressure pulsation and vacuole morphology in a centrifugal pump. China Rural. Water Conserv. Hydropower 2017, 9, 202–206. [Google Scholar]
- Yang, J.J.; Li, X.J.; Pan, Z.Y.; He, S. Influence of cavitation flow on pressure pulsation characteristics at the tongue of a double-wormed centrifugal pump. J. Irrig. Drain. Mach. Eng. 2020, 38, 445–450. [Google Scholar]
- Lu, J.X. Research on Cavitation-Induced Non-Stationary Dynamic Characteristics of Centrifugal Pump and Its Mechanism. Ph.D. Thesis, Jiangsu University, Zhenjiang, China, 2017. [Google Scholar]
- Lu, J.X.; Yuan, S.Q.; Siva, P.; Yuan, J.P.; Ren, X.D.; Zhou, B.L. The characteristics investigation under the unsteady cavitation condition in a centrifugal pump. J. Mech. Sci. Technol. 2017, 31, 1213–1222. [Google Scholar] [CrossRef]
- Li, S.C. Cavitation of Hydraulic Machinery; Imperial College London Press: London, UK, 2000. [Google Scholar]
- Liu, Z.; Zou, S.Y.; Li, Z.P.; Ju, W. Wavelet energy characterization of acoustic emission signals under centrifugal pump cavitation. J. Agric. Eng. 2015, 31, 99–103. [Google Scholar]
- Dong, L.; Zhao, Y.Q.; Dai, C. Research on Cavitation Acoustic Characteristics of centrifugal Pump Based on Fluid-Acoustic field Coupling Method. Adv. Mech. Eng. 2018, 10, 1–13. [Google Scholar] [CrossRef]
- Alfayez, L.; Mba, D. Detection of incipient cavitation and determination of the best efficiency point for centrifugal pumps using acoustic emission. Proc. Inst. Mech. Eng. Part E J. Process Mech. Eng. 2005, 219, 327–344. [Google Scholar] [CrossRef]
- Su, Y.S.; Wang, Y.S.; Duan, X.Y. Research on the determination of cavitation monitoring threshold of the centrifugal pump. J. Agric. Mach. 2010, 41, 68–71. [Google Scholar]
- Su, Y.S.; Wang, Y.S.; Yan, F.; Duan, X.Y. Modulation characterization and extraction method of cavitation vibration signal. Vib. Test Diagn. 2010, 30, 570–572. [Google Scholar] [CrossRef]
- Zhao, Y.Q. Research on Centrifugal Pump Cavitation Judgment and Its Flow-Acoustic Characteristics. Master’s Thesis, Jiangsu University, Zhenjiang, China, 2018. [Google Scholar]
- Zeng, J.L. Experimental Study on Cavitation Vibration Noise Characteristics of the Centrifugal Pump. Master’s Thesis, Lanzhou University of Technology, Lanzhou, China, 2015. [Google Scholar] [CrossRef]
- Cao, Y.L.; Ming, T.F.; He, G.; Su, Y.S. Deep learning based cavitation state recognition of centrifugal pump. J. Xi’an Jiao Tong Univ. 2017, 51, 165–172. [Google Scholar]
- Zhang, S.; Li, Z.H.; Liang, X.; Wei, X.B.; Xiao, B.Y. Characterization of centrifugal pump cavitation vibration based on SPWVD. China Rural. Water Conserv. Hydropower 2020, 8, 97–101. [Google Scholar]
- Ye, Y.H.; Zhu, X.Y.; Sun, G.P.; Li, G.J. Evolution of vacuoles in centrifugal pumps and its effect on vibration. J. Agric. Mach. 2017, 48, 88–93. [Google Scholar]
- He, G.; Cao, Y.L.; Ming, T.F.; Su, Y.S. Identification of centrifugal pump cavitation state based on improved octave band features. J. Harbin Eng. Univ. 2017, 38, 1263–1267+1302. [Google Scholar]
- Ye, T.; Si, Q.R.; Shen, C.H.; Yang, S.; Yuan, S. Primary cavitation monitoring of centrifugal pumps based on support vector machine. J. Irrig. Drain. Mach. Eng. 2021, 39, 884–889. [Google Scholar]
- Farhat, M.; Bourdon, P.; Gagné, J. Improving hydro turbine profitability by monitoring cavitation aggressiveness. In Proceedings of the CEA Electricity’99 Conference and Exposition, Vancouver, BC, Canada, March 1999; Available online: https://www.researchgate.net/publication/37424257 (accessed on 18 December 2023).
- Yagi, Y.; Murase, M.; Sato, K.; Saito, Y. Preliminary study of detecting the occurrence of cavitation and evaluating TTS influence by an accelerometer mounted on a pipe. In Proceedings of the Fifth International Symposium on Cavitation, Osaka, Japan, 1–4 November 2003. [Google Scholar]
- Cernetic, J. The use of noise and vibration signals for detecting cavitation in kinetic pumps. Mech. Eng. Sci. 2009, 233, 1645–1655. [Google Scholar] [CrossRef]
- Tomaz, R.; Matevz, D.; Marko, H. An Investigation of the relationship between acoustic emission, vibration, noise, and cavitation structures on a Kaplan turbine. ASME J. Fluids Eng. 2007, 129, 1112–1122. [Google Scholar]
- Lee, W.G.; Lee, J.W.; Hong, M.S.; Nam, S.H.; Jeon, Y.; Lee, M.G. Failure Diagnosis System for a Ball-Screw by Using Vibration Signals. Shock Vib. 2015, 2015, 435870. [Google Scholar] [CrossRef]
- Buono, D.; Siano, D.; Frosina, E.; Senatore, A. Gerotor pump cavitation monitoring and fault diagnosis using vibration analysis through the employment of auto-regressive-moving-average technique. Simul. Model. Pract. Theory 2017, 71, 61–82. [Google Scholar] [CrossRef]
- Zhou, Y.L. Research on Centrifugal Pump Cavitation State Identification Based on Improved Kernel Limit Learning Machine. Master’s Thesis, Jiangsu University of Science and Technology, Zhenjiang, China, 2022. [Google Scholar] [CrossRef]
- Li, X.J. Research on the Mechanism of Cavitation Non-Constant Flow at the Leading Edge of Centrifugal Pump Blade and Kinetic Characteristics. Ph.D. Thesis, Jiangsu University, Zhenjiang, China, 2013. [Google Scholar]
- Duan, X.Y.; Wang, Y.S.; Su, Y.S. Application of vibration analysis in cavitation monitoring of centrifugal pumps. Vib. Shock 2011, 30, 161–165. [Google Scholar] [CrossRef]
- He, Y.; Shen, Z. Formant-Based Ultrasonic Cavitation State Identifying Method, Involves Collecting Signal Data and Frame Data, and Determining Cavitation Area to Be not in Cavitation State When Base Frequency Average Value Is less than Ultrasonic Frequency: China, CN102590338-B. 16 April 2014. Available online: http://en.cnki.com.cn/Article_en/CJFDTOTAL-ZDCJ201216010.htm (accessed on 18 December 2023).
- Qing, B.; Yu, B.; Lan, W.; Hu, J. Flow cavitation noise test of the centrifugal pump. J. Drain. Irrig. Mach. Eng. 2016, 34, 198–203. [Google Scholar]
- Dong, L.; Xiao, J.W.; Ming, J.Y.; Liu, Y.L. Numerical simulation and experimental study on cavitation characteristics of hydraulic reducer model. J. Irrig. Drain. Mach. Eng. 2017, 35, 1–5. [Google Scholar]
- Cudina, M. Detection of cavitation phenomenon in a centrifugal pump using audible sound. Mech. Syst. Signal Process. 2003, 17, 1335–1347. [Google Scholar] [CrossRef]
- Wang, J.J.; Pan, L.P.; Cao, S.L. Application of wavelet transform to detection of cavitation signal in hydraulic turbine. J. Hydropower Gener. 2013, 32, 215–220. [Google Scholar]
- Zhou, Y.L.; Liu, Y.Q.; Xue, G.X.; Chen, J. Centrifugal pump cavitation fault diagnosis based on EMD and marginal spectral band energy. J. Chem. Eng. 2012, 63, 545–550. [Google Scholar]
- Wang, D.W. Research on Cavitation Acoustic Response Characteristics and Cavitation Suppression Method of Centrifugal Pump. Ph.D. Thesis, Lanzhou University of Science and Technology, Lanzhou, China, 2022. [Google Scholar] [CrossRef]
- Song, J.C. EMD-Based Signal Processing Method of Cavitation Acoustic Emission from Hydraulic Turbine. Master’s Thesis, Changsha University of Science and Technology, Changsha, China, 2017. [Google Scholar]
- Zhou, Y.G. Feature Extraction and State Identification of Cavitation Acoustic Emission Signal of Hydraulic Turbine. Master’s Thesis, Changsha University of Science and Technology, Changsha, China, 2019. [Google Scholar] [CrossRef]
- Jin, L.C. Hydrodynamic Noise Signal Analysis and Cavitation Identification of Single Vane Centrifugal Pump Based on Support Vector Machine. Master’s Thesis, Jiangsu University, Zhenjiang, China, 2021. [Google Scholar] [CrossRef]
- Zhang, X.Y. Feature Extraction and State Identification of Cavitation Acoustic Emission Signal of the Centrifugal Pump. Master’s Thesis, Changsha University of Science and Technology, Changsha, China, 2020. [Google Scholar] [CrossRef]
- Kumar, A.; Kumar, R. Time-frequency analysis and support vector machine in automatic detection of defect from vibration signal of the centrifugal pump. Measurement 2017, 108, 119–133. [Google Scholar] [CrossRef]
- Shen, Z.H. Study on the Cavitation Characteristics of High Specific Speed Pump with Small Flow Rate and Optimization of Cavitation Performance. Ph.D. Thesis, Jiangsu University, Zhenjiang, China, 2021. [Google Scholar] [CrossRef]
- Han, W.; Zheng, H.; Wang, L.Q.; Zhang, Z.Z.; Su, M. Analysis of the effect of staggered vane arrangement on cavitation performance of double-suction pump. J. Agric. Mach. 2017, 48, 124–131+140. [Google Scholar]
- Deng, Y.X.; Li, R.N.; Han, W.; Yang, W.J.; Li, Z.G. Cavitation characteristics of return vortex in a spiral centrifugal pump. J. Agric. Eng. 2015, 31, 86–90. [Google Scholar]
- Agostino, L.; Torre, L.; Pasini, A. On the preliminary design and non cavitating performance prediction of tapered axial inducers. J. Fluids Eng. 2008, 130, 119–120. [Google Scholar]
- Okita, K.; Ugajin, H.; Matsumoto, Y. Numerical analysis of the influence of the tip clearance flow on the unsteady cavitating flows in a three-dimensional inducer. J. Hydrodyn. 2009, 21, 34–40. [Google Scholar] [CrossRef]
- Xue, Z.Y. Study on the Effect of the Slotted Vane on Cavitation Performance of Axial Flow Pump. Master’s Thesis, Lanzhou University of Science and Technology, Lanzhou, China, 2021. [Google Scholar] [CrossRef]
- Liu, Y.L. Influence of Vane Guide Grille on Cavitation and Fluid-Solid Coupling Characteristics of Axial Pump. Master’s Thesis, Xi’an University of Technology, Xi’an, China, 2021. [Google Scholar] [CrossRef]
- Xu, Z.X. Study on the Cavitation Inhibition Effect of the Roughness Zone on the Impeller Rear Cover of the Centrifugal Pump. Master’s Thesis, Lanzhou University of Science and Technology, Lanzhou, China, 2020. [Google Scholar] [CrossRef]
- Zhang, C.L. Research on the Inhibition of Cavitation of Axial Flow Pump by Obstacles. Master’s Thesis, Lanzhou University of Science and Technology, Lanzhou, China, 2022. [Google Scholar] [CrossRef]
- Zhao, W.G.; Zhu, C.J.; Xu, Z.X.; Xu, Y. Numerical simulation and test of the cavitation characteristics of centrifugal pump controlled by bypass device. Vib. Shock 2021, 40, 119–126. [Google Scholar] [CrossRef]
- Zhao, W.G.; Li, Q.H.; Kang, Y.D. Study on the cavitation inhibition effect of suction surface roughness zone of centrifugal pump blade. J. Agric. Mach. 2021, 52, 169–176+214. [Google Scholar]
- Zhao, W.G.; Pan, X.W.; Song, Q.C.; Li, S.S. Effect of vane inlet side perforation on the cavitation performance of centrifugal pumps. J. Irrig. Drain. Mach. Eng. 2019, 37, 461–469. [Google Scholar]
- Zhao, W.G.; Xian, L.X.; Zhao, G.S.; Pan, X.W. Numerical prediction of the effect of diverter vanes on the cavitation performance of centrifugal pump. J. Lanzhou Univ. Technol. 2019, 45, 56–62. [Google Scholar]
- Zhao, W.G.; Zhao, G.S.; Xian, L.X.; Han, X.D. Numerical simulation and experiment on inhibiting cavitation by arranging obstacles on the blade surface of the centrifugal pump. J. Agric. Mach. 2017, 48, 111–120. [Google Scholar]
- Liu, W.; Yuan, S.Q.; Li, X.J.; Pan, Z.Y. Influence of vane grooving on the internal flow of a low specific rotation centrifugal pump. J. Irrig. Drain. Mach. Eng. 2013, 31, 11–14. [Google Scholar]
- Zhao, W.G.; Zhai, L.J.; Xia, T.; Li, S.S. Numerical simulation of centrifugal pump blade grooving to inhibit cavitation. J. Agric. Mach. 2018, 49, 150–157. [Google Scholar]
- Hu, Z.A.; Wang, J.X.; Zhu, B.S.; Liu, X.B. Effect of centrifugal pump impeller perforation on cavitation performance. Therm. Power Eng. 2018, 33, 44–51. [Google Scholar] [CrossRef]
- Zhang, J.; Chen, X.P.; Su, C.M.; Zhao, Z. Study on the effect of vane inlet side opening on cavitation and turbulent energy in centrifugal pumps. Fluid Mach. 2021, 49, 14–19. [Google Scholar] [CrossRef]
- Luo, Y.X. Research on the Effect of Leading Edge Open Slit Vane on the Cavitation Performance of Centrifugal Pump. Master’s Thesis, Lanzhou University of Science and Technology, Lanzhou, China, 2022. [Google Scholar] [CrossRef]
- Li, J. Scale Analysis of Non-Constant Cavitation Flow and Bionic Control Mechanism of Winding Blade. Ph.D. Thesis, Jilin University, Changchun, China, 2022. [Google Scholar] [CrossRef]
- Zhao, C.S.; Li, C.; Li, P.Z. Influence of blade thickness on cavitation performance of water jet propulsion axial pump. Mar. Eng. 2021, 43, 61–66. [Google Scholar] [CrossRef]
- Wang, W.; Lu, P.B.; Wang, X.F.; Qin, G.X.; Wang, Y.M. Optimization of mixing pump blades and cavitation study based on equation of state model. J. Dalian Univ. Technol. 2013, 53, 29–35. [Google Scholar]
- Kang, J.Y.; Zhu, R.S.; Wang, X.L.; Liu, Y.; Zhong, W.Y. Influence of impeller geometry parameters on fracture cavitation performance of centrifugal pumps. J. Irrig. Drain. Mach. Eng. 2018, 36, 111–117. [Google Scholar]
- Zhang, Y.T.; Chen, H.; Xiang, L.; Chen, W.; Xu, K.F. Study on cavitation performance of induced wheel based on orthogonal optimization design. Propuls. Technol. 2020, 41, 343–352. [Google Scholar] [CrossRef]
- Yan, Z.C.; Shao, C.L. Optimized design of cavitation performance of cryogenic pump based on orthogonal test. Petrochem. Equip. 2019, 48, 1–7. [Google Scholar]
- Wang, Y.; Liu, H.L.; Liu, D.X.; Wang, J.; Wu, X.F. Influence of vane wrap angle on flow-induced vibration noise of centrifugal pump. J. Agric. Eng. 2013, 29, 72–77. [Google Scholar]
- Wang, Y.; Liu, H.L.; Yuan, S.Q.; Liu, D.X.; Wang, J. Cavitation vibration and noise characteristics of centrifugal pumps with different vane package angles. J. Irrig. Drain. Mach. Eng. 2013, 31, 390–393. [Google Scholar]
- Tan, M.G.; Wang, Y.; Liu, H.L.; Wu, X.F.; Wang, K. Influence of vane number on internal flow-induced vibration noise of centrifugal pump. J. Irrig. Drain. Mach. Eng. 2012, 30, 131–135. [Google Scholar]


| Research Methodology | Advantages | Drawbacks |
|---|---|---|
| Theoretical analysis | (1) Low computational cost and fast results. | (1) Can only provide qualitative or approximate results; (2) Difficulty in considering complex flow changes. |
| Pilot studies | (1) The ability to provide authentic and reliable experimental data; (2) The ability to verify the accuracy of theoretical analyses with a high degree of confidence. | (1) Time and resource consuming; (2) Not applicable to large-scale parameter changes; (3) Inability to directly observe internal flow field changes. |
| Numerical calculations (CFD) | (1) The ability to accurately predict a series of performance parameters, such as the cavitation flow, pressure, velocity, etc., of hydraulic machinery such as pumps and capture flow details in the flow field; (2) Fulfilment of research tasks that are difficult to achieve via experimental testing under extreme conditions; (3) Shorten the research and development time for hydro-mechanical products and save the research and development costs [31]. | (1) High-performance computing equipment is required, and parameter settings and model selection affect simulation results; (2) The need to verify the consistency of the simulation results with the actual situation. |
| Flow Condition | 0.8 Qd | 1.0 Qd | 1.2 Qd |
|---|---|---|---|
| Conventional cavitation point | 0.336 | 0.423 | 0.485 |
| High-speed photography of cavitation incipient points | 0.398 | 0.478 | 0.542 |
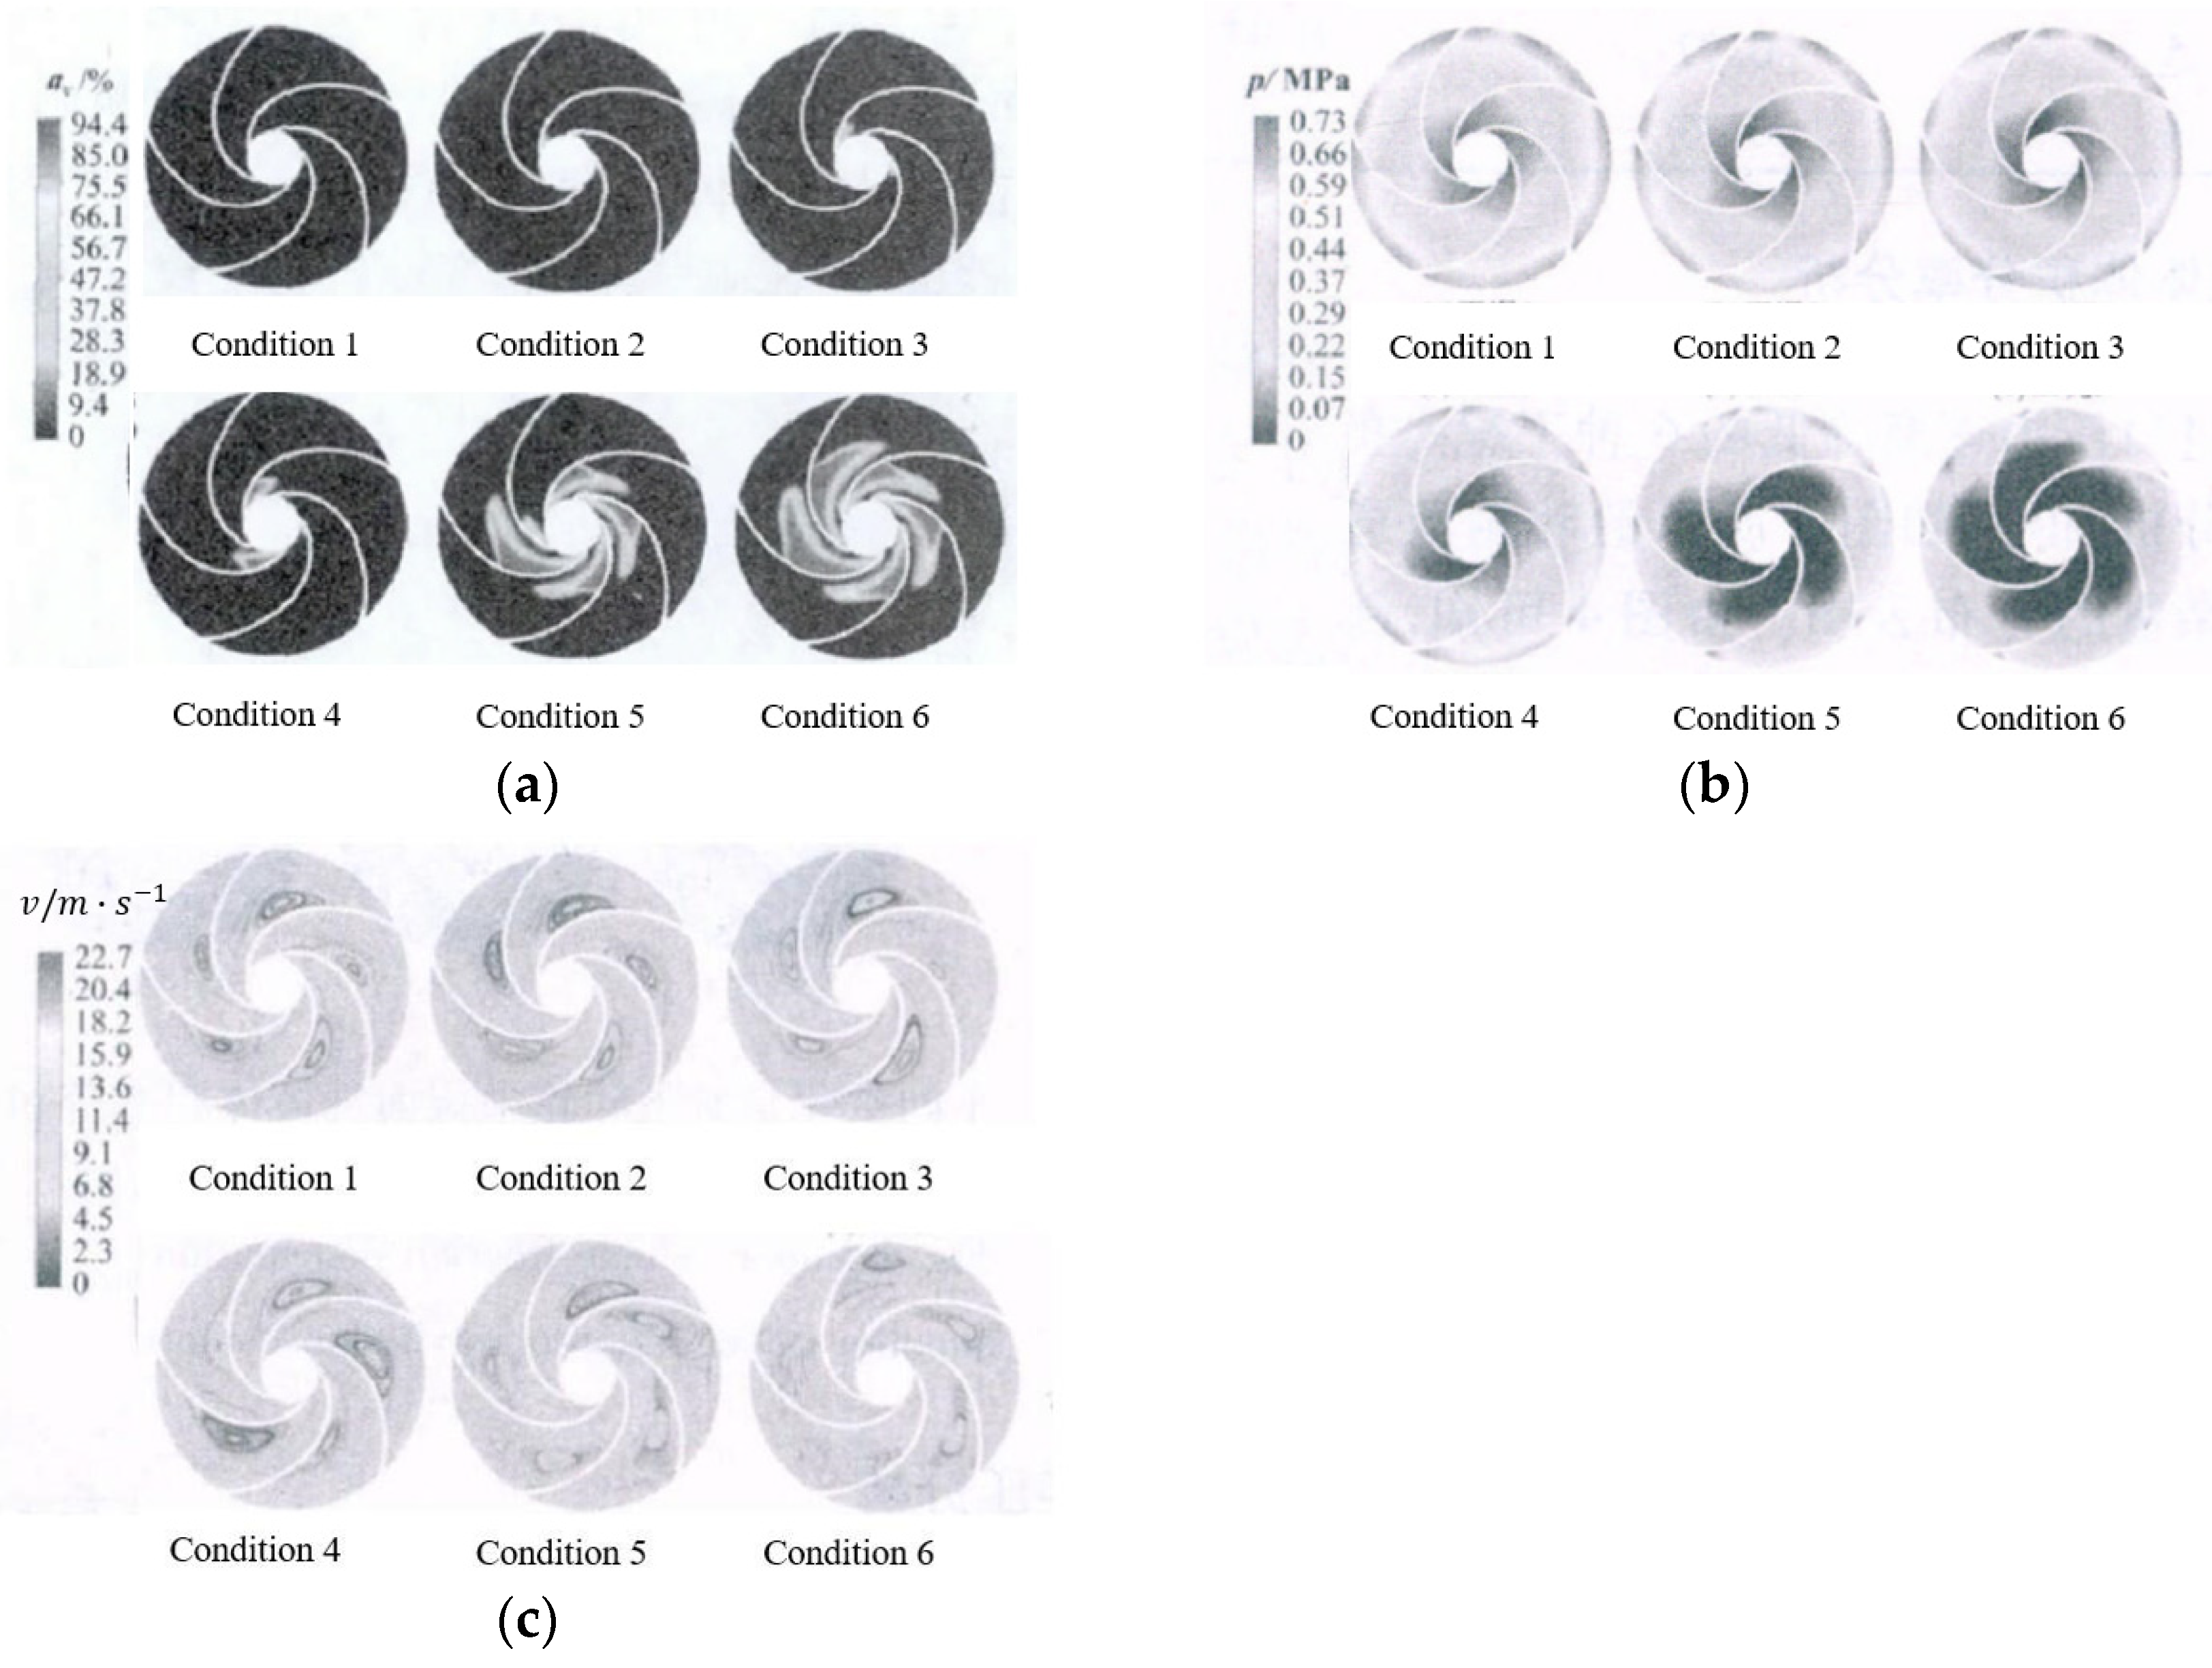
| Condition | p/MPa | NPSH/m |
|---|---|---|
| 1 | 0.81 | 4.52 |
| 2 | 0.80 | 3.43 |
| 3 | 0.79 | 3.19 |
| 4 | 0.78 | 2.24 |
| 5 | 0.77 | 0.97 |
| 6 | 0.73 | 0.91 |
| Bandwidth/Hz | n/() | /(%) | /(%) | Threshold/(%) |
|---|---|---|---|---|
| 10~50 | 1000 | 2.22 | 0.43 | 0.93 |
| 1450 | 1.75 | 0.31 | 0.82 | |
| 2000 | 1.82 | 0.35 | 0.77 | |
| 1000~3000 | 1000 | 1.60 | 0.19 | 1.03 |
| 1450 | 0.92 | 0.11 | 0.59 | |
| 2000 | 1.54 | 0.18 | 1.00 |
| Monitoring Methodology | Advantages | Drawbacks |
|---|---|---|
| Flow-head method | (1) Simple and easy to implement. | (1) Hysteresis. |
| High-speed photography | (1) High monitoring accuracy; | (1) Requirements for the use of objects and environmental conditions are demanding, and the cost of testing is high; |
| (2) Capable of capturing the state of cavitation development. | (2) Only applicable to transparent model machines and rare specific occasions. | |
| Pressure pulsation | (1) Higher precision. | (1) It is usually necessary to use the four-end network method to drill multiple holes in the pipeline or pump body, which can cause damage to the pump body or pipeline; |
| (2) The application is not convenient. | ||
| Acoustic emission method | (1) The ultrasonic wave emitted by the bubble collapse can be received when cavitation is just generated, and the judgment is more accurate and timely. | (1) Susceptible to environmental disturbances; |
| (2) Requires very sophisticated and expensive supporting facilities. | ||
| Vibration method | (1) Simple arrangement, without destroying the research object; | (1) In complex environments, the location and number of monitoring points have a direct impact on the accuracy of cavitation identification; |
| (2) Strong anti-interference and high signal sensitivity. | (2) It cannot meet the needs of certain remote real-time monitoring. |
| Programmatic | Lift/m | Upgrading Rate (%) |
|---|---|---|
| 1 1 mm holes | 43.85 | 1.39 |
| 1 2 mm holes | 44.18 | 2.15 |
| 1 3 mm holes | 44.75 | 3.47 |
| 4 1 mm holes | 44.73 | 3.42 |
| Cavitation Suppression Method | Steps | Advantages | Drawbacks |
|---|---|---|---|
| Increase inlet pressure | (1) Installation of guide wheels; (2) Incoming jet. | (1) Straightforward. | (1) Increased energy consumption; (2) System limiting pressure. |
| Changing the blade structure | (1) Arrangement of obstacles on the surface of the blade; (2) Slots and holes on the blade surface. | (1) Adjustment of blade structure to specific cavitation characteristics and flow conditions; (2) Direct, precise and efficient. | (1) Complex design; (2) Increase costs. |
| Optimization of design parameters | (1) Leaf apex shape, number of leaves; (2) Blade placement angle, inlet punching angle, blade wrapping angle. | (1) Comprehensive performance optimization; (2) A wide range of adaptability. | (1) Computationally intensive; (2) Running time. |
Disclaimer/Publisher’s Note: The statements, opinions and data contained in all publications are solely those of the individual author(s) and contributor(s) and not of MDPI and/or the editor(s). MDPI and/or the editor(s) disclaim responsibility for any injury to people or property resulting from any ideas, methods, instructions or products referred to in the content. |
© 2023 by the authors. Licensee MDPI, Basel, Switzerland. This article is an open access article distributed under the terms and conditions of the Creative Commons Attribution (CC BY) license (https://creativecommons.org/licenses/by/4.0/).
Share and Cite
Zhu, Y.; Zhou, L.; Lv, S.; Shi, W.; Ni, H.; Li, X.; Tao, C.; Hou, Z. Research Progress on Identification and Suppression Methods for Monitoring the Cavitation State of Centrifugal Pumps. Water 2024, 16, 52. https://doi.org/10.3390/w16010052
Zhu Y, Zhou L, Lv S, Shi W, Ni H, Li X, Tao C, Hou Z. Research Progress on Identification and Suppression Methods for Monitoring the Cavitation State of Centrifugal Pumps. Water. 2024; 16(1):52. https://doi.org/10.3390/w16010052
Chicago/Turabian StyleZhu, Yu, Lin Zhou, Shuaishuai Lv, Weidong Shi, Hongjun Ni, Xiaoyuan Li, Chuanzhen Tao, and Zhengjie Hou. 2024. "Research Progress on Identification and Suppression Methods for Monitoring the Cavitation State of Centrifugal Pumps" Water 16, no. 1: 52. https://doi.org/10.3390/w16010052