Article

Multi-Objective Performance of Detention Basins and Rainwater Harvesting Systems Using Real-Time Controls with Rainfall Forecasts

by
Margherita Altobelli
,
Margherita Evangelisti
and
Marco Maglionico
*
DICAM—Department of Civil, Chemical, Environmental and Materials Engineering, University of Bologna, Viale del Risorgimento 2, 40136 Bologna, Italy
*
Author to whom correspondence should be addressed.
Water 2024, 16(1), 71; https://doi.org/10.3390/w16010071
Submission received: 26 November 2023 / Revised: 21 December 2023 / Accepted: 22 December 2023 / Published: 24 December 2023
(This article belongs to the Special Issue Rainwater Harvesting and Treatment)

Abstract

:
Climate change and an increase in urbanization are severely testing urban drainage systems; at the same time, population growth is leading to an increase in demand for water resources, while climate change is more likely to reduce the amount of water that is available to meet this demand. The present study finds a solution to both problems by assuming a hybrid use of detention basins, i.e., providing a real-time control system (RTC) for the outfall discharge managed according to the rainfall forecast and the water level in the tank, to reuse rainwater for non-potable use and, at the same time, to guarantee the hydraulic protection of the downstream system. Twenty-seven scenarios were simulated using the numerical model SWMM 5.1, assuming different types of controls on the discharge. The simulations show a non-potable water-saving efficiency from a minimum of 32% to a maximum of 90%, and the reduction in volume discharged is between 11% and 31%, while the peak flow rate varies more significantly depending on the type of control used. These results highlight the detention basins’ potential deriving from the hybrid use of this system with rainwater harvesting systems.

Graphical Abstract

1. Introduction

In the mid-twentieth century, rapid urbanization produced a significant alteration in the natural hydrological balance by reducing the infiltration capacity of the soil [1,2]. The increase in impervious surfaces, a typical phenomenon of urban expansion, on the one hand reduced the volume of rainwater that naturally infiltrates the subsoil by limiting the recharge of the aquifers; on the other, it established an increase in velocity, reduced the initial and continuing losses in the rainfall-runoff process, and increased runoff volume [3], increasing the risk of urban flooding. Drainage systems have been implemented by engineers to accumulate and manage rainwater to reduce the problem of impervious surfaces [4]. The management of rainwater is therefore a priority for many cities, in order to mitigate the effects of the growing urbanization that impacts both the sewer systems and the receiving water bodies.
At the same time, climate changes cause precipitation increases in some places while reducing it in others [5], increasing the frequency of drought and flooding periods. Population growth, in conjunction with the onset of climate change, influences drinking water availability; therefore, it is necessary to safeguard water resources by favoring solutions to reuse water for non-drinking purposes [6]. In Italy, from the monitoring carried out during the activity of the AQUASAVE project (Life 97 ENV/IT/000106), an average consumption of potable water of about 106.35 L/p/d was recorded for eight apartments located in the same building in the city of Bologna, equipped with low consumption devices; the results of the project show consumption used for toilet flushing as 23% of total drinking water consumption, corresponding to 24.46 L/p/d [6].
The use of rainwater harvesting systems has a dual function: to reduce urban potable water demand, increasing the reuse of rainwater for non-drinking purposes, and to mitigate the quantity of stormwater runoff [7]. Efforts are increasingly being made to exploit the potential of rainwater management infrastructures, implementing the system with real-time controls to manage discharge to achieve multiple performance objectives such as (1) stormwater capture and mitigation efficiency, including volume and the peak flow reduction; (2) recovering and reusing rainwater for non-drinking purposes to reduce water consumption; (3) reducing pollutants transported to the receiving water bodies [8,9,10,11,12].
It is also important to underline that a combination of rainwater harvesting systems and green technologies, such as green roofs, can lead to further benefits, improving the quality of the collected water, filtered through the green roof and further reducing the impact of extreme weather events on the city’s sewage system [13,14,15,16].
Advances in information technology offer the opportunity to improve the performance of infrastructures that are conventionally used for the management of rainwater. Internet-accessible controller systems and wired or wireless communication have made real-time controls a low-cost solution for the dynamic management of stormwater infrastructures, making it easy to install on both new projects and existing facilities [17]. This technology is known as the Internet of Things (IoT), and it defines the network of physical objects embedded within electronics, software, sensors, and network connectivity, which enables these objects to collect and exchange data. This technology, applied to rainwater management infrastructures, uses weather forecasts to calculate the expected runoff volume of the rainfall event. The technology can communicate the calculated runoff volume and the level in the tank detected by the sensors: depending on the data obtained and the settings of the controls, it can manage the discharge in real time.
The methodology that provides real-time controls of stormwater facilities’ discharge, as a function of rainfall forecasting and according to the level recorded in the tank, is called the continuous monitoring and adaptive control (CMAC) approach [17,18,19]. Roman et al. (2017), for example, applies it to a rainwater harvesting system in New York to limit outflow in the sewer and, at the same time, to reduce the consumption of drinking water for irrigation purposes by exploiting the accumulated rainwater. This system is applied to an existing infrastructure equipped with level sensors in the tank, and it is connected to a weather forecasting system to minimize outflow and to maximize the detention capacity while improving the quality of the water directed to the downstream system. If CMAC technology is integrated with a civil infrastructure for rainwater management, the global system can improve the quality of the water sent to the downstream system and, at the same time, it can optimize discharge during precipitation events to prevent flooding [20].
Liang et al. [21] applies IoT technology to a rainwater harvesting system to evaluate the reduction in the peak flow and the volume discharged compared to a traditional configuration. In the literature cases, the outflow is managed by an actuated valve that controls the release rate: the opening and closing are regulated according to the level in the tank and the probability of precipitation in the following 24 h.
In the model proposed in this paper, different types of controls will be analyzed: the study seeks to evaluate the potential resources derived from the reuse of rainwater stored in a detention basin for toilet flushing in a real office building in Bologna (Italy). The real detention basin is assumed to have a hybrid function: in dry periods, it is used as a rainwater harvesting system; during significant rainfall events, it provides the release of water from the tank. In this case, the RTC system is connected to the weather forecast and to the level sensors in the tank: water in the system is released to the downstream system by a pump if precipitation is forecast in the following 24 h and the available storage volume in the detention basin is smaller than a set volume. Furthermore, during the precipitation, the real-time system can activate the discharge pump if the volume in the detention basin is smaller than what is set. In this way, the rainwater harvesting system will be fed not only by the roofs but also by the water washed out from outdoor areas, after treatment.
This study aims to evaluate the possibility of using the volume of a detention basin to store rainwater for reuse for non-drinking uses, optimizing the potential of this infrastructure to reduce discharge volume and overflow peak spilling into the downstream system. The use of the detention basin, temporarily accumulating water volumes deriving from rainfall events to return them to the downstream network or to the body of water with a reduced flow rate and compatible with them, make it possible to mitigate the effects deriving from urbanization and reducing the risk of urban flooding [22]. In the same way, the rainwater harvesting systems make it possible to reduce the demand for drinking water by using the rainwater resource for non-drinking uses such as toilet flushing and irrigation systems [23].
The RTC systems are more studied and used in the context of combined sewer systems to minimize outflow in terms of volume and pollutants conveyed to the receiving water bodies, maximizing the capacity of the network and improving the functioning of the wastewater treatment plants [24,25,26]; the use of real-time controls combined with infrastructure for the management of rainwater remains, to date, less studied or used.
In Section 2 of this paper, the study area and the input data used for the EPA SWMM 5.1 model, the hypothetical scenarios, and the types of controls implemented will be explained; Section 3 reports the results obtained and the discussion; the conclusions close the paper in Section 4.

2. Materials and Methods

A hydrologic and hydraulic model of the case study site was developed using the Environmental Protection Agency’s (EPA’s) Stormwater Management Model (SWMM) version 5.1; this is a dynamic rainfall-runoff simulation model, and it was chosen for its capability to effectively perform long-term (continuous) simulations by implementing complex logic controls.

2.1. Case Study Area

To apply the modeling study to a real situation, the paper was based on a real detention basin in the urban area of the city of Bologna (Italy). The detention basin storage volume is 700 m3. The dimensions of the basin are as follows: length = 10 m; width = 12 m; total height = 7.5 m; maximum water level = 5.8 m. It is designed to collect runoff from two types of subcatchments: the roofs of the buildings (3500 m2) and the outdoor areas (10,190 m2). The outdoor areas (streets, squares, and gardens) are 25% permeable. The tank discharges a maximum of 10.95 L/s into the nearby “Canale Reno ‘75”, which is an artificial channel.
Another important factor that influenced the choice of the case study area is the presence of a building with a dual water supply system with a flow meter for toilet flushing; the data were analyzed to determine the non-drinking water demand to be met for this use.
Figure 1 shows the case study area with an indication of the land use and the main existing hydraulic infrastructure.

2.2. Inputs

Input parameters of the model are described in the following sections.

2.2.1. Precipitation

Precipitation data with a fifteen-minute logging interval for a period of thirty years, from 1 January 1990 to 1 January 2020, were obtained from the ARPAE Dexter service: “https://simc.arpae.it/dext3r/” (accessed on 26 November 2023) from the rain gauge “Bologna Urbana” located approximately 2 km from the case study area. A summary of the data collected and the rainfall characteristics are represented in Figure 2, Figure 3 and Figure 4.
The general statistics for the period of record include the following:
  • Total precipitation: 22,790 mm;
  • Average annual rainfall: 760 mm/year;
  • Number of days with precipitation greater than 1 mm: 2340 days/30 years, about 80 days/year.
In order to represent the rain forecasting system within SWMM, the same time series of precipitation described above was adopted but anticipated by one day. In this way, the real-time controls introduced in SWMM could work based on the fact that the rain was to be expected in the following day.

2.2.2. Subcatchments and Rainwater Harvesting System

The site is characterized by two subcatchments: one represents the outdoor area with a size of 10,190 m2, which is 25% permeable; the other represents four building roofs with an area of 3500 m2; the total area is about 13,690 m2. The rainwater accumulated in the detention basin will be re-used for toilet flushing.
The detention basin has an overflow weir at a height of 2 m. The tank flow outfall has a maximum permissible flow rate of 8 L/s for each hectare of drained surface (local law), i.e., with a maximum flow rate of 10.95 L/s.

2.2.3. Water Demand for Non-Potable Use

The building near the detention basin presents a dual water supply system and a flow meter dedicated to toilet flushing. By analyzing the consumption of the building, intended for offices of about 400 workers, the daily consumption is about 10.13 m3. By calculating 5 days of work per week, the annual volume amounts to 2643 m3, which becomes 2653 m3 in the case of leap years. To model this water request in SWMM, a pump with a constant flow rate and a series of working days corresponding to the simulated period was used to control the pump shutdown periods on weekends.

2.3. System Configurations

To analyze the efficiency of the detention basin as a rainwater harvesting system implemented through rainfall forecasting, 27 scenarios have been hypothesized.
Description of the elements of the configurations in Figure 5:
  • Ac: subcatchment corresponding to the total drained area (about 1.369 hectares);
  • VR: RWH tank with different maximum volumes (named X);
  • VL: water volume in the detention basin (maximum value = 700 m3; maximum height = 2 m);
  • Pwd: pump dedicated to satisfying the water demand for non-potable purposes to be used for toilet flushing, corresponding to 10.13 m3/d and operating on workdays (from Monday to Friday);
  • P1: discharge pump connected to the rainfall forecast system and to the receiving water body;
  • P2: discharge pump during rain events connected to the receiving water body;
  • P3: replenishing pump, from the detention basin to the RWH storage, is activated when the volume VR is lower than its predetermined maximum while VL is greater than 0;
  • TpR: overflow threshold located 2 m from the bottom of the RWH tank toward the detention basin;
  • TpL: overflow threshold located 2 m from the bottom of the detention basin spilling toward the receiving water body.
The different case studies analyzed are the following:
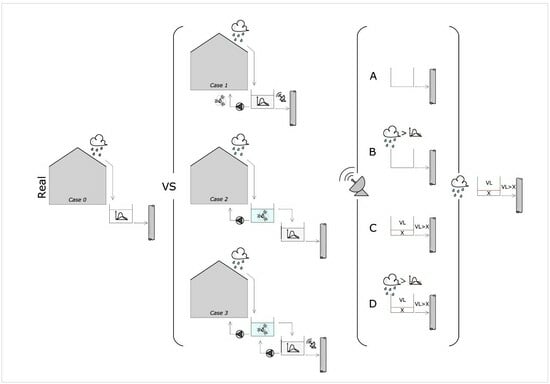
  • Case 0: the real case with a pump that is activated if there is a volume greater than 0 in the tank;
  • Case 1: the detention basin is equipped with an emptying system both in case of precipitation and if rain is expected; this scenario is implemented with a rainwater harvesting system, and the non-potable water is reused for toilet flushing;
  • Case 2: the subcatchment is connected to a rainwater harvesting system that discharges the excess water into the detention basin that, as in case 0, is equipped with a drain pump and an overflow weir;
  • Case 3: like case 2, the subcatchment is connected to a rainwater harvesting system, and any excess of water, with respect to the capacity of the tank, is delivered into the detention basin; the detention basin provides a control on the output so as to guarantee accumulation on dry days to restore the water inside the RWH tank; at the same time, it empties in case of rain and in a preventive way, thanks to a control system based on weather forecasts.
The size of the RWH tank was assumed to correspond to a percentage of the volume of the detention basin, which is equal to 3% (21 m3), 5% (35 m3), and 10% (70 m3). To evaluate the efficiency of the system subjected to a control on the outputs connected to the weather forecasts, in case 1 and case 3, four different types of control rules for the pumps have been hypothesized:
  • Type A: P1 status is on for 18 h to guarantee emptying of the tank when rain is expected; P2 status is on during the rainfall event if the volume VL is greater than a predetermined volume X; if P2 is active, then P1 goes off;
  • Type B: P1 status is on when rain is expected which generates a flow rate greater than 10.95 L/s, which is the maximum discharge flow rate; P2 status is on during the rainfall event if the volume VL is greater than a predetermined volume X; if P2 is active, then P1 goes off;
  • Type C: P1 status is on when rain is expected and the volume VL is greater than a predetermined volume X; P2 status is on during the rainfall event if the volume VL is greater than a predetermined volume X; if P2 is active, then P1 goes off;
  • Type D: P1 status is on when rain is expected, which generates a flow rate greater than 10.95 L/s, and the volume VL is greater than a predetermined volume X; P2 status is on during the rainfall event if the volume VL is greater than a predetermined volume X; if P2 is active, then P1 goes off.
Figure 6 shows the schematic representation of the different types of control rules for the pumps. The red line indicates the exceeding of the predetermined rainwater harvesting volume X or the maximum discharge into the receiving water body.
In conclusion, 27 different scenarios were generated according to the 4 case studies and the 4 types of control of the discharge in the detention basin.

2.4. Performance Assessment

Twenty-seven scenarios were modeled with SWMM 5.1, starting from Case 0, which represents the real operation of the detention basin, then changing the RWH storage volume (21, 35, 70 m3) in the different cases and implementing them (Case 1 and Case 3) with the different types of control rules based on rainfall forecast. In particular:
  • Case 0 was developed to simulate unmanaged discharge (real configuration) as a point of reference to compare the performance of the other scenarios;
  • Case 1 was modeled to evaluate the efficiency of the detention basin used at the same time as an RWH tank, managing the discharge using a rainfall forecasting system or during the event if the volume in the tank exceeds a determinate level. This case makes it possible to evaluate the reduction in the outflow volume as the storage capacity dedicated to the RWH system varies and according to the type of control on the discharge;
  • Case 2 was modeled to compare, for the same volume, the level of efficiency given by a RWH system compared to cases 1 and 3;
  • Case 3 was modeled to improve the detention basin with a RWH system, with a replenishing pump that connects the detention basin to the RWH tank to reintegrate the water.
Four different types of control rules were modeled to evaluate how they impact the detention basin in terms of discharged volume and peak reduction, with the same volume to be used for the RWH system.
For each modeled scenario, the efficiency of the RWH system was assessed in terms of the following:
  • Average efficiency of the system: E k ;
  • Reduction in the total volume discharged in 30 years: V k ;
  • Increase in peak flow discharged in 30 years: I k .
Efficiency means the ability of the system to meet water demand for non-drinking purposes. Efficiency was assessed annually to obtain an average value of thirty years of modeling using the following formula:
E i = Y i D i · 100   [ % ]
where Ei (%) is the non-potable water-saving efficiency of the system; Yi (m3) is the non-potable water supply; Di (m3) is non-potable water demand; all variables refer to the i-year. The average efficiency of the long-term simulation (30-year) was calculated for each modeled k-case, and it is calculated as follows:
E k = i = 1 30 E i 30 · 100   [ % ]
The reduction in the total volume discharged in 30 years V k compares the different scenarios with Case 0. V k is calculated as follows:
V k = V 0 V t o t   k V 0 · 100   [ % ]
where V0 is the total discharged volume from the system in Case 0, and V t o t   k is the total discharged volume from the system k.
The increase in peak flow discharged I k is calculated as the average of the percentage increase in the individual events i, which occurred in the 30 years, in total equal to n, weighed as a function of the discharge flow rate:
I k = i = 1 n I k i · O k i i = 1 n O k i   [ % ]
where I k i is the percentage variation of the i-event compared to Case 0, that is calculated as follows:
I k i = O k i O 0 i O 0 i · 100   [ % ]
where: O k i is the overflow of the i-event, referred to the case k, while O 0 i is the overflow in the Case 0 during the same event.

3. Results and Discussion

The modeling of the 27 scenarios leads to an assessment of the impact deriving from the implementation of the detention basin with a system for water recovery, with different control rules. Efficiency E, the reduction in the total volume discharged V, and the peak flow increase I are reported in Table 1.
The 27 modeled scenarios were classified according to the case analyzed, the type of control rules applied, and the volume dedicated to RWH; specifically, they have been coded as follows:
n T x x
where n is the case, T is the type of control rules for the pumps, and xx is the volume dedicated to RWH.
Table 1 shows the values relating to the following:
  • Efficiency: defined by Equation (2);
  • Discharge: the volume sent to the downstream system during the events;
  • Overflow: the volume sent to the downstream system through an overflow weir;
  • Pre-storm release: the volume sent to the downstream system before the rainfall event;
  • Volume reduction: defined by Equation (3);
  • Total overflow peak: the sum of the flow peaks discharged by the overflow weir;
  • Peak flow increase: defined by Equation (4).
Table 1 shows that efficiency E has a range from a minimum value equal to 32% to a maximum value of 90%; this means, for example, that 90% of the water demand for toilet flushing is satisfied from the rainwater recovered, while the remaining 10% is replenished from the water supply.
Figure 7 shows the efficiency of the modeled cases, calculated as indicated in Section 2.4, according to the volume dedicated to the storage of rainwater.
For each volume, the efficiency was reported for each case study analyzed, indicating the types of controls on the output adopted. For each volume, there are three subcategories related to the cases: Case 1 is the detention basin that acts as an RWH tank thanks to the discharge controls; Case 2 is the RWH system; and Case 3 is the RWH system with a replenishing pump from the detention basin to the tank to reintegrate the water.
Similarly, the discharged volume reduction results (Figure 8) and the peak flow increase results (Figure 9) are reported graphically.
The total volume discharged refers to the total volume sent to the downstream system over the 30 years, and it is given by the sum of the discharge that occurred during the precipitation plus the volume discharged from the overflow weir; when the system presents a rainfall forecasting system and related control rules on the discharge, then the emptying discharge of the detention basin, in a preventive manner, is also added.
By observing the percentages relating to the volume discharged V, it varies from a minimum of 11% to a maximum of 31%, i.e., always guaranteeing a reduction in the volume discharged compared to Case 0. This indicates a positive effect on the hydrological invariance of the detention basin in terms of maximum flow, connected to the RWH system. The hybrid use of a detention basin controlled by weather forecasts improves its performance by reducing the volume sent to the downstream system.
For the calculation of the increase in the peak flow rate, the events that make the volume of the detention basin insufficient, i.e., those that cause the activation of the overflow weir, simulated over the 30 years, were evaluated. Analyzing the modeling in detail, it emerges that, in the long-term simulation, only two events cause the discharge through the overflow pipe, both in Case 0 and in the other hypothesized configurations: they are the critical events of 5 October 1990 and 18 September of 2005. In fact, in Bologna, the heaviest events of the year occur in the months of September and October, and in general in the autumn months, as shown in Figure 2.
The return period (TR) for these critical events is represented in Figure 10, which shows a TR of 250 years for the 1990 event and a TR of 100 years for the 2005 event. These TR values are greater than the 50-year return period used for sizing detention basins.
By observing the graph in Figure 9, as the volume changes, Case 2 and Cases 1 and 3 that use the same type of control on discharge A, i.e., the complete emptying of the tank before the meteoric event, show negative values; for these configurations, there is a reduction in the output peak flow and an improvement from the hydraulic invariance. With the same volume, the peak flow increase remains constant for each type of control, excluding type A, up to a maximum of 24%.
From the comparison of the graphs, it can be seen that as the volume increases, the values of the three analyzed parameters E, V, and I also increase; in the case of efficiency and discharged volume reduction, there is an increase as the cases and types of control on the discharge vary: Case 1 is more similar to the respective E and V values of Case 2, while Case 3 has a further increase in the level of efficiency and a greater reduction in volume, except for the type of control A which in both Case 1 and Case 3 maintains a lower level of E and V. By comparing this result with the graph relating to the peak flow increase I, it can be seen that type A is closest to Case 0; in fact, there is a reduction in the peak equal to 0.2%.
Figure 11 shows the percentage of efficiency E in relation to the percentage of discharged volume reduction V for each modeled case study. The relationship between the two parameters follows a linear growth trend; Case 3 is the one with the highest level of efficiency and at the same time the greatest reduction in discharged volume for each volume destined for reuse and any type of discharge control (Table 2).
Table 2 shows the ranges of efficiency E and the discharged volume reduction V for each case study; the growth of both parameters E and V is evident as the cases vary.
Table 3 shows the ranges of E and V as the type of discharge control varies. Type A provides a complete draining of the detention basin if rain is expected; types of control B, C, and D, on the other hand, provide for, in the first case (B), the preventive emptying of the tank if rain is expected, which generates a flow greater than the maximum discharge allowed in the downstream system; in the second case (C), the preventive emptying of the tank until the volume assumed for reuse is reached; in the third case (D), the preventive emptying of the tank is tied to the flow rate generated by the rain as type B and until the pre-set volume for reuse is reached as type D. Analyzing the values shown in the table, it can be seen how, by modifying the control rules on the discharge, type A differs more from the others, while, for the other three types, the values of the parameters remain almost unchanged.
Analyzing the results obtained in terms of efficiency, Case 3, which provides for the combination of the RWH tank with the detention basin that acts as a means of reintegration, guarantees a high level of satisfaction of the water for non-potable uses; in fact, for the hypothesized volumes (21, 35, 70 m3), the efficiency level varies from a minimum of 58% to a maximum of 90%. This scenario involves the construction of a new reservoir to be added to the existing one; this risks having a greater impact on the environment. In fact, from the study carried out on the life cycle assessment (LCA) in a cradle-to-grave perspective, the rainwater harvesting system displays poor environmental performance during the production phase because the impact results grow together with the storage volume [27,28]. Case 1, i.e., the one that involves the hybrid use of the detention basin with a control on the outlet to accumulate the water to be used for toilet flushing, is the one most in line with the behavior of the traditional RWH system, represented by Case 2. This case ensures a good level of efficiency (32 ÷ 76%), and it is able to reduce the volume sent to the downstream system. The reduction in the volume sent to the body of water, or to the downstream system in the case of combined sewers, also has an important effect in terms of pollutants released into the environment.
Analyzing the results by focusing attention on the types of control, it can be highlighted that, for the most intense events, lower volume availability, prompted by the desire to guarantee a volume to be used for recovery, can lead to an increase in the peak of maximum flow spilling into the downstream system; the exception is type A, which guarantees a modest reduction in the peak flow rate, as it is the only control that does not guarantee a minimum stored volume but provides for the complete emptying of the tank. Nevertheless, from the continuous simulation of the last 30 years of rain, there remain only two events that cause the activation of the overflow pipe, regardless of the case: the volume dedicated to reuse and the type of control.
The case study refers to an area in the city of Bologna in order to look more closely at the feasibility and the ability of this system to respond to problems related to climate change and urbanization; it is possible to hypothesize a more in-depth study by extending it to different contexts both in terms of water for non-potable uses and of climatological characteristics. Similarly, the use of green technologies, like green roofs, combined with the technology presented in this study could lead to more extensive assessments that improve the water quality collected and mitigate urban flooding.

4. Conclusions

The analyzed system represents a potential technological solution capable of exploiting existing systems to meet multiple objectives in response to climate change and increasing urbanization. The results obtained highlight the system’s potential in ensuring a supply of water so as to satisfy a large part of the demand for water for non-drinking purposes, reducing at the same time the volume of rainwater introduced into the downstream system. The limit of this approach lies in the ability to have sufficiently reliable weather forecasts; however, the rapid growth of technological systems for forecasting events and control devices for real-time management makes it an increasingly viable solution.

Author Contributions

All authors conceived, designed, and performed the experiments, and all authors analyzed the data. All authors contributed to writing the paper. All authors have read and agreed to the published version of the manuscript.

Funding

This research received no external funding.

Data Availability Statement

Data are contained within the article.

Conflicts of Interest

The authors declare no conflicts of interest.

References

  1. Haase, D. Effects of urbanisation on the water balanceA long-term trajectory. Environ. Impact Assess. Rev. 2009, 29, 211–219. [Google Scholar] [CrossRef]
  2. Barron, O.V.; Barr, A.D.; Donn, M.J. Effect of urbanisation on the water balance of a catchment with shallow groundwater. J. Hydrol. 2013, 485, 162–176. [Google Scholar] [CrossRef]
  3. Garofalo, G.; Giordano, A.; Piro, P.; Spezzano, G.; Vinci, A. A distributed real-time approach for mitigating CSO and flooding in urban drainage systems. J. Netw. Comput. Appl. 2017, 78, 30–42. [Google Scholar] [CrossRef]
  4. Burns, M.J.; Fletcher, T.D.; Walsh, C.J.; Ladson, A.R.; Hatt, B.E. Hydrologic shortcomings of conventional urban stormwater management and opportunities for reform. Landsc. Urban Plan. 2012, 105, 230–240. [Google Scholar] [CrossRef]
  5. Zipper, S.C.; Motew, M.; Booth, E.G.; Chen, X.; Qiu, J.; Kucharik, C.J.; Carpenter, S.R.; Loheide II, S.P. Continuous separation of land use and climate effects on the past and future water balance. J. Hydrol. 2018, 565, 106–122. [Google Scholar] [CrossRef]
  6. Cipolla, S.S.; Altobelli, M.; Maglionico, M. Systems for rainwater harvesting and greywater reuse at the building scale: A modelling approach. Environ. Eng. Manag. J. 2018, 17, 2349–2360. [Google Scholar] [CrossRef]
  7. Basinger, M.; Montalto, F.; Lall, U. A rainwater harvesting system reliability model based on nonparametric stochastic rainfall generator. J. Hydrol. 2010, 392, 105–118. [Google Scholar] [CrossRef]
  8. Xu, W.; Fletcher, T.; Duncan, H.; Bergmann, D.; Breman, J.; Burns, M. Improving the Multi-Objective Performance of Rainwater Harvesting Systems Using Real-Time Control Technology. Water 2018, 10, 147. [Google Scholar] [CrossRef]
  9. Gee, K.D.; Hunt, W.F. Enhancing Stormwater Management Benefits of Rainwater Harvesting via Innovative Technologies. J. Environ. Eng. 2016, 142, 04016039. [Google Scholar] [CrossRef]
  10. Campisano, A.; Butler, D.; Ward, S.; Burns, M.J.; Friedler, E.; De Busk, K.; Fisher-Jeffes, L.N.; Ghisi, E.; Rahman, A.; Furumai, H.; et al. Urban rainwater harvesting systems: Research, implementation and future perspectives. Water Res. 2017, 115, 195–209. [Google Scholar] [CrossRef]
  11. Di Matteo, M.; Liang, R.; Maier, H.R.; Thyer, M.A.; Simpson, A.R.; Dandy, G.C.; Ernst, B. Controlling rainwater storage as a system: An opportunity to reduce urban flood peaks for rare, long duration storms. Environ. Model. Softw. 2019, 111, 34–41. [Google Scholar] [CrossRef]
  12. Gaborit, E.; Muschalla, D.; Vallet, B.; Vanrolleghem, P.A.; Anctil, F. Improving the performance of stormwater detention basins by real-time control using rainfall forecasts. Urban Water J. 2013, 10, 230–246. [Google Scholar] [CrossRef]
  13. Silva, F.; Calheiros, C.S.C.; Albuquerque, A.; Lopes, J.P.; Antão-Geraldes, A.M. Technical and Financial Feasibility Analysis of Rainwater Harvesting Using Conventional or Green Roofs in an Industrial Building. Sustainability 2023, 15, 12430. [Google Scholar] [CrossRef]
  14. Shetty, N.; Wang, M.; Elliott, R.; Culligan, P. Examining How a Smart Rainwater Harvesting System Connected to a Green Roof Can Improve Urban Stormwater Management. Water 2022, 14, 2216. [Google Scholar] [CrossRef]
  15. Bus, A.; Szelągowska, A. Green Water from Green Roofs—The Ecological and Economic Effects. Sustainability 2021, 13, 2403. [Google Scholar] [CrossRef]
  16. Silva, F.; Calheiros, C.S.C.; Valle, G.; Pinto, P.; Albuquerque, A.; Antão-Geraldes, A.M. Influence of Green Roofs on the Design of a Public Stormwater Drainage System: A Case Study. Sustainability 2023, 15, 5762. [Google Scholar] [CrossRef]
  17. Lefkowitz, J.R.; Sarmanian, A.K.; Quigley, M. Continuous monitoring and adaptive control—The internet of things transforms stormwater management. J. New Engl. Water Environ. Assoc. 2016, 50, 44–51. [Google Scholar]
  18. Roman, D.; Braga, A.; Shetty, N.; Culligan, P. Design and Modeling of an Adaptively Controlled Rainwater Harvesting System. Water 2017, 9, 974. [Google Scholar] [CrossRef]
  19. Braga, A.; O’Grady, H.; Dabak, T.; Lane, C. Performance of Two Advanced Rainwater Harvesting Systems in Washington DC. Water 2018, 10, 667. [Google Scholar] [CrossRef]
  20. Marchese, D.; Johnson, J.; Akers, N.; Huffman, M.; Hlas, V. Quantitative Comparison of Active and Passive Stormwater Infrastructure: Case Study in Beckley, West Virginia. Proc. Water Environ. Fed. 2018, 2018, 4298–4311. [Google Scholar] [CrossRef]
  21. Liang, R.; Di Matteo, M.; Maier, H.; Thyer, M. Real-Time, Smart Rainwater Storage Systems: Potential Solution to Mitigate Urban Flooding. Water 2019, 11, 2428. [Google Scholar] [CrossRef]
  22. Abawallo, S.S.; Brandimarte, L.; Maglionico, M. Analysis of the performance response of offline detention basins to inlet structure design: Performance response of offline detention basin design. Irrig. Drain. 2013, 62, 449–457. [Google Scholar] [CrossRef]
  23. Gambi, G.; Maglionico, M.; Tondelli, S. Water management in local development plans: The case of the old Fruit and Vegetable Market in Bologna. Procedia Eng. 2011, 21, 1110–1117. [Google Scholar] [CrossRef]
  24. Campisano, A.; Modica, C. PID and PLC units for the real-time control of sewer systems. Water Sci. Technol. 2002, 45, 95–104. [Google Scholar] [CrossRef] [PubMed]
  25. Campisano, A.; Creaco, E.; Modica, C. Application of Real-Time Control Techniques to Reduce Water Volume Discharges from Quality-Oriented CSO Devices. J. Environ. Eng. 2016, 142, 04015049. [Google Scholar] [CrossRef]
  26. Casadio, A.; Cipolla, S.S.; Maglionico, M.; Martinini, P. Numerical modeling of the sewer system of Rimini (Italy) and strategies for the CSOs reduction on the Adriatic Sea. Environ. Eng. Manag. J. 2013, 12, 121–124. [Google Scholar]
  27. Zanni, S.; Cipolla, S.S.; Di Fusco, E.; Lenci, A.; Altobelli, M.; Currado, A.; Maglionico, M.; Bonoli, A. Modeling for sustainability: Life cycle assessment application to evaluate environmental performance of water recycling solutions at the dwelling level. Sustain. Prod. Consum. 2019, 17, 47–61. [Google Scholar] [CrossRef]
  28. Martins Vaz, I.C.; Istchuk, R.N.; Oneda, T.M.S.; Ghisi, E. Sustainable Rainwater Management and Life Cycle Assessment: Challenges and Perspectives. Sustainability 2023, 15, 12133. [Google Scholar] [CrossRef]
Figure 1. Representation of the case study area with indication of land use and the main existing hydraulic infrastructures and pipes with the flow direction represented by the arrows.
Water 16 00071 g001
Figure 2. Annual rainfall from 1990 to 2019; the dotted red line highlights the average value.
Water 16 00071 g002
Figure 3. Annual rainfall cycle from 1990 to 2019 in the city of Bologna represented by a box plot (with the minimum value, the first quartile, the median, the third quartile, and the maximum value).
Water 16 00071 g003
Figure 4. Frequency distribution of daily rainfall for the period 1990–2019.
Water 16 00071 g004
Figure 5. Schematic representation of the different configurations: (a) Case 0; (b) Case 1; (c) Case 2; (d) Case 3.
Water 16 00071 g005
Figure 6. Schematic representation of the different types of control rules for the pumps: (a) Pump P1 Type A; (b) Pump P1 Type B; (c) Pump P1 Type C and Pump P2; (d) Pump P1 Type D.
Water 16 00071 g006
Figure 7. Water-saving efficiency for each scenario with respect to the three volumes (21, 35, 70 m3).
Water 16 00071 g007
Figure 8. Volume reduction for each scenario with respect to the three volumes (21, 35, 70 m3).
Water 16 00071 g008
Figure 9. Peak flow increase for each scenario with respect to the three volumes (21, 35, 70 m3).
Water 16 00071 g009
Figure 10. Return period (TR) for the critical events of 5 October 1990 and 18 September 2005.
Water 16 00071 g010
Figure 11. Relationship between volume reduction V and efficiency E for each case study.
Water 16 00071 g011
Table 1. Simulation results for each scenario.
CasesEfficiency E
[%]
Discharge
m 3 30   y e a r s
Overflow
m 3 30   y e a r s
Pre-Storm
Release
m 3 30   y e a r s
Total Discharge
m 3 30   y e a r s
Volume Reduction V
[%]
Total Overflow Peak
[L/s]
Peak Flow Increase I
[% ]
0N/A261,589305N/A261,894-94.7-
1-A-2132.272,602302160,300233,20411.094.5−0.2
1-A-3535.955,040302174,842230,18412.194.5−0.2
1-A-7039.033,330302194,148227,78013.094.5−0.2
1-B-2145.2208,1283259031217,48417.0105.015.9
1-B-3556.9195,25734013,094208,69120.3106.117.7
1-B-7074.3172,41344022,009194,86225.6108.724.0
1-C-2146.5172,03932544,476216,84017.2105.015.9
1-C-3558.3164,78534043,175208,30020.5106.117.7
1-C-7075.5154,37944039,883194,70225.7108.724.0
1-D-2146.9214,1393251153215,61717.7105.015.9
1-D-3558.6206,0293401094207,46320.8106.117.7
1-D-7075.8193,0304401074194,54425.7108.724.0
2-2151.8213,248301N/A213,54918.593.8−0.9
2-3557.3208,819301N/A209,12020.293.7−0.9
2-7075.0194,751301N/A195,05225.593.6−1.0
3-A-2152.359,435303153,523213,26118.694.5−0.2
3-A-3557.745,146303163,446208,89520.294.5−0.2
3-A-7075.126,264303168,431194,99825.594.4−0.3
3-B-2167.1191,6903258863200,87823.3104.915.8
3-B-3575.8181,94334011,752194,03625.9106.117.7
3-B-7090.1161,75043920,570182,75930.2108.623.9
3-C-2166.0152,72332548,674201,72223.0104.915.8
3-C-3575.0149,50034048,595198,43624.2106.117.7
3-C-7089.7137,53643943,628181,60330.7108.623.9
3-D-2167.1198,9233251114200,36223.5104.915.8
3-D-3575.8191,4633401025192,82826.4106.117.7
Table 2. Range of efficiency and volume reduction for each case analyzed.
CasesEfficiency Min.
[%]
Efficiency Max.
[%]
Volume Reduction Min.
[%]
Volume Reduction Max.
[%]
Case 132761126
Case 252751826
Case358902031
Table 3. Range of efficiency and volume reduction for each discharge control type.
TypesEfficiency Min.
[%]
Efficiency Max.
[%]
Volume Reduction Min.
[%]
Volume Reduction Max.
[%]
A32751126
B45901730
C47901831
D47901830
Disclaimer/Publisher’s Note: The statements, opinions and data contained in all publications are solely those of the individual author(s) and contributor(s) and not of MDPI and/or the editor(s). MDPI and/or the editor(s) disclaim responsibility for any injury to people or property resulting from any ideas, methods, instructions or products referred to in the content.

