Article

Determination of Winter Irrigation Quotas for Corn and Oil Sunflower Considering Crop Salt Tolerance Threshold under Subsurface Pipe Drainage Technology

1
College of Water Resources Science and Engineering, Taiyuan University of Technology, Taiyuan 030024, China
2
China Institute of Water Resources and Hydropower Research, Beijing 100038, China
3
Datong Modern Agricultural Development Center, Datong 037009, China
*
Authors to whom correspondence should be addressed.
Water 2024, 16(1), 72; https://doi.org/10.3390/w16010072
Submission received: 21 November 2023 / Revised: 20 December 2023 / Accepted: 21 December 2023 / Published: 24 December 2023

Abstract

:
Subsurface pipe drainage (SPD) is an important technique for the improvement of saline–alkali lands in China. Winter irrigation after crop harvest is a key measure used in the Yellow River irrigation area in northwest China to reduce soil salinity in the root zone of crops. To optimize winter irrigation under SPD, the calibrated HYDRUS-2D model was utilized in this study to investigate the effects of soil texture (clay loam, silt loam, loam, and sandy loam), initial soil salinity (1, 3, 5 g/kg), and the winter irrigation quotas (80, 100, 120, 150, 180 mm) on the rate of soil desalination. In this study, soil salinity levels during the stable production of common crops such as sunflower and corn in the Yinbei Irrigation District in Ningxia, China, were taken as the thresholds, efficient utilization of irrigation water was considered, and suitable crops and appropriate winter irrigation quotas for different soil textures and levels of soil salinity were proposed. Soil with a salt content of 1~3 g/kg is suitable for the planting of corn with 80 mm of irrigation water. Sandy loam soil with a salt content of 3~5 g/kg is suitable for sunflower–corn intercropping with 120 mm of irrigation water. Sandy loam soil with a salt content exceeding 5 g/kg is suitable for the planting of sunflower with 80 mm of irrigation water. Other types of soils need to be improved by reducing the spacing between subsurface pipes, using desulfurized gypsum, biochar, and other additives. People engaged in agriculture can utilize this research to determine the appropriate volumes of irrigation water, crop types, planting systems, and subsurface pipe parameters based on local conditions.

1. Introduction

Ningxia is located in northwestern China, which is a typical arid and semiarid region. Since 2022, Ningxia has pursued upgrades to traditional industries and has actively employed modern agricultural measures [1]. Soil salinization is the primary factor that hinders agricultural development in Ningxia. The saline–alkali farmland in Ningxia is primarily found in the Yinbei irrigation district [2,3]. This district is characterized by low-lying land and a high groundwater level (0.5–2.0 m below the surface) [4]. The total area of saline–alkali farmland in the Yinbei irrigation district is 87,000 hm2, which accounts for 36.3% of the total saline–alkali farmland area in Ningxia [2]. To improve crop yield in the saline–alkali soil in the Yinbei irrigation district, scholars have conducted 40 years of exploration and research. They have proposed various control measures from different perspectives. These measures include promoting the use of efficient water-saving irrigation technologies such as drip irrigation and sprinkler irrigation [5,6], increasing the construction of drainage projects such as open ditches and subsurface pipes [7,8], adopting physical measures such as film mulching, deep tillage, and soil replacement [9,10,11], and chemical measures such as the addition of desulfurized gypsum and biochar to achieve synergy between irrigation and drainage [12,13]. In addition, the Ningxia government recommends the planting of salt-tolerant crops such as wolfberry and oil sunflower on saline–alkali land [11,14]. These crops can absorb the salts found in the soil and provide benefits.
Subsurface pipe drainage (SPD) has several advantages, e.g., it occupies less space, has high construction efficiency, results in excellent drainage and salt discharge effects, and is conducive to mechanized operation [15,16]. As a result, such a technology has emerged as an important method for the management of saline–alkali land in the Yinbei irrigation district. By 2021, the application area of SPD technology in Ningxia was 17,000 hm2 [3]. SPD can help keep the groundwater levels low, reduce the upward movement of salt, facilitate the discharge of soil salt leached by irrigation, decrease the salt content in the soil layer where crop roots grow, and create favorable conditions for crop growth [15,16]. Some scholars, through indoor sand tank tests and the SWAP model, have found that, under surface irrigation conditions, the drainage flow of subsurface pipes increases with increasing burial depth of subsurface pipes. When the burial depth is 1.5–2.0 m, increasing the burial depth of subsurface pipes can not only effectively discharge salt from the root layer, but also further reduce groundwater levels and inhibit groundwater evaporation and soil resalinization [17,18]. Many scholars agree that the soil desalination rate above the subsurface pipe increases as the laying distance decreases [19,20,21,22]. However, project cost must be considered to determine the optimal distance [23]. Qian et al. compared soil desalination rates with subsurface pipes of different diameters in field experiments and found that the diameter of subsurface pipes, ranging from 90–160 mm, had no significant effect on the soil desalination rate within a 0–2 m distance above the subsurface pipes [23,24]. Similarly, Heng et al. concluded that the impact of subsurface pipe diameter on soil salinity is negligible compared to that of the depth of the subsurface pipe [25]. Ren et al. found that the drainage flow rate of the filter layer increased by 20.5–62.5% when a permeable material such as quartz sand was used. This was determined through an indoor sand tank test [17]. However, the results of field experiments showed that the filter layer mainly enhanced the drainage capacity of the subsurface pipe, and leaching of soil salt was limited to the soil in the 0–20 cm layer near the subsurface pipe [26].
HYDRUS-2D is one of the most widely used software programs for the simulation of soil solute transport. It accurately models the transport of soil water, fertilizer, heat, and salt under various irrigation modes, including surface irrigation, drip irrigation, and sprinkler irrigation [27,28,29,30]. Lazarovitch et al. incorporated a new boundary condition into HYDRUS-2D, which takes into account the influence of water source characteristics, inlet pressure and soil hydraulic characteristics on the calculated flow of underground irrigation sources, and verifies the rationality of the considered factors based on transient test data [20]. To assess the efficacy of SPD in controlling the salinization of saline–alkali land, Liu et al. utilized HYDRUS to model water and salt transport by substituting the subsurface pipe seepage boundary with a resistance layer. They then compared the simulated values with measured values obtained from indoor soil tank tests. They concluded that replacing a conventional subsurface pipe seepage boundary with a resistance layer can greatly improve the simulation accuracy of HYDRUS [31]. Zhang et al. calibrated the HYDRUS model with field test data and suggested that the burial depth of subsurface pipes in the Hetao Irrigation District of Inner Mongolia, China, should be 1.0–2.0 m, and the laying spacing should be 15–50 m [19]. In recent years, many scholars have used inversion model in HYDRUS-2D to derive soil hydraulic characteristic parameters [32]. Based on the soil water content data measured by the ponding infiltration experiment, Nakhaei et al. successfully inverted the soil hydraulic characteristic parameters using HYDRUS-2D [33]. Based on the water content data of the observation points measured, Zhang et al. obtained the soil hydraulic characteristic parameters by HYDRUS-2D and RETC numerical models, and found that the results obtained by HYDRUS-2D inversion were more accurate and reliable [34].
In the Yinbei irrigation district of Ningxia, local growers use surface irrigation from November to December to reduce soil salinity. The winter irrigation quota is typically greater than 160 mm, which is approximately 50% of the irrigation quota during the crop growth period [35,36]. To alleviate the pressure of water shortages, scholars have started to focus on the study of the optimal winter irrigation quotas. Du et al. conducted indoor soil column experiments to simulate water and heat migration under different winter irrigation conditions. They determined that 105 mm was the optimal winter irrigation quota in Ningxia [35]. Through field experiments, Liu et al. found that when the winter irrigation quota exceeded 180 mm, the desalination rate of the 0–60 cm soil remained essentially unchanged. In addition, the volume of salt that is released after the end of winter irrigation leaching increases with the winter irrigation quotas [8]. Similarly, Luo et al. found that when the winter irrigation quota exceeded 150 mm, the desalination effect of the soil in the crop root zone deteriorated [37,38]. Ramos et al. simulated soil water and salt transport under different winter irrigation quotas using the HYDRUS model. They proposed that the optimal winter irrigation quota needed for desalination and soil moisture conservation is between 200–250 mm [39]. Due to variations in soil texture, soil salinity, and crop types, the winter irrigation quota recommended has significantly varied among scholars. Currently, the research on SPD in China is primarily focused on optimizing calculations of subsurface pipe layout and improving farmland drainage efficiency, and studies on the effect of winter irrigation quotas on soil salinity based on water conservation and crop stable yield considerations are lacking.
Based on the indoor soil tank test, the key parameters of the HYDRUS-2D model were calibrated in this paper, and the influence of winter irrigation quotas on the spatial distribution of the soil desalination rate was explored under different soil textures and initial soil salinities. Taking the typical crops of corn and oil sunflower in the Yinbei irrigation district of Ningxia as the research object and considering the comprehensive evaluation index of crop stable yield and water savings, suitable winter irrigation quotas were determined under different soil conditions to provide a basis for the promotion and application of SPD technology and the systematic formulation of the winter irrigation quotas in Ningxia.

2. Materials and Methods

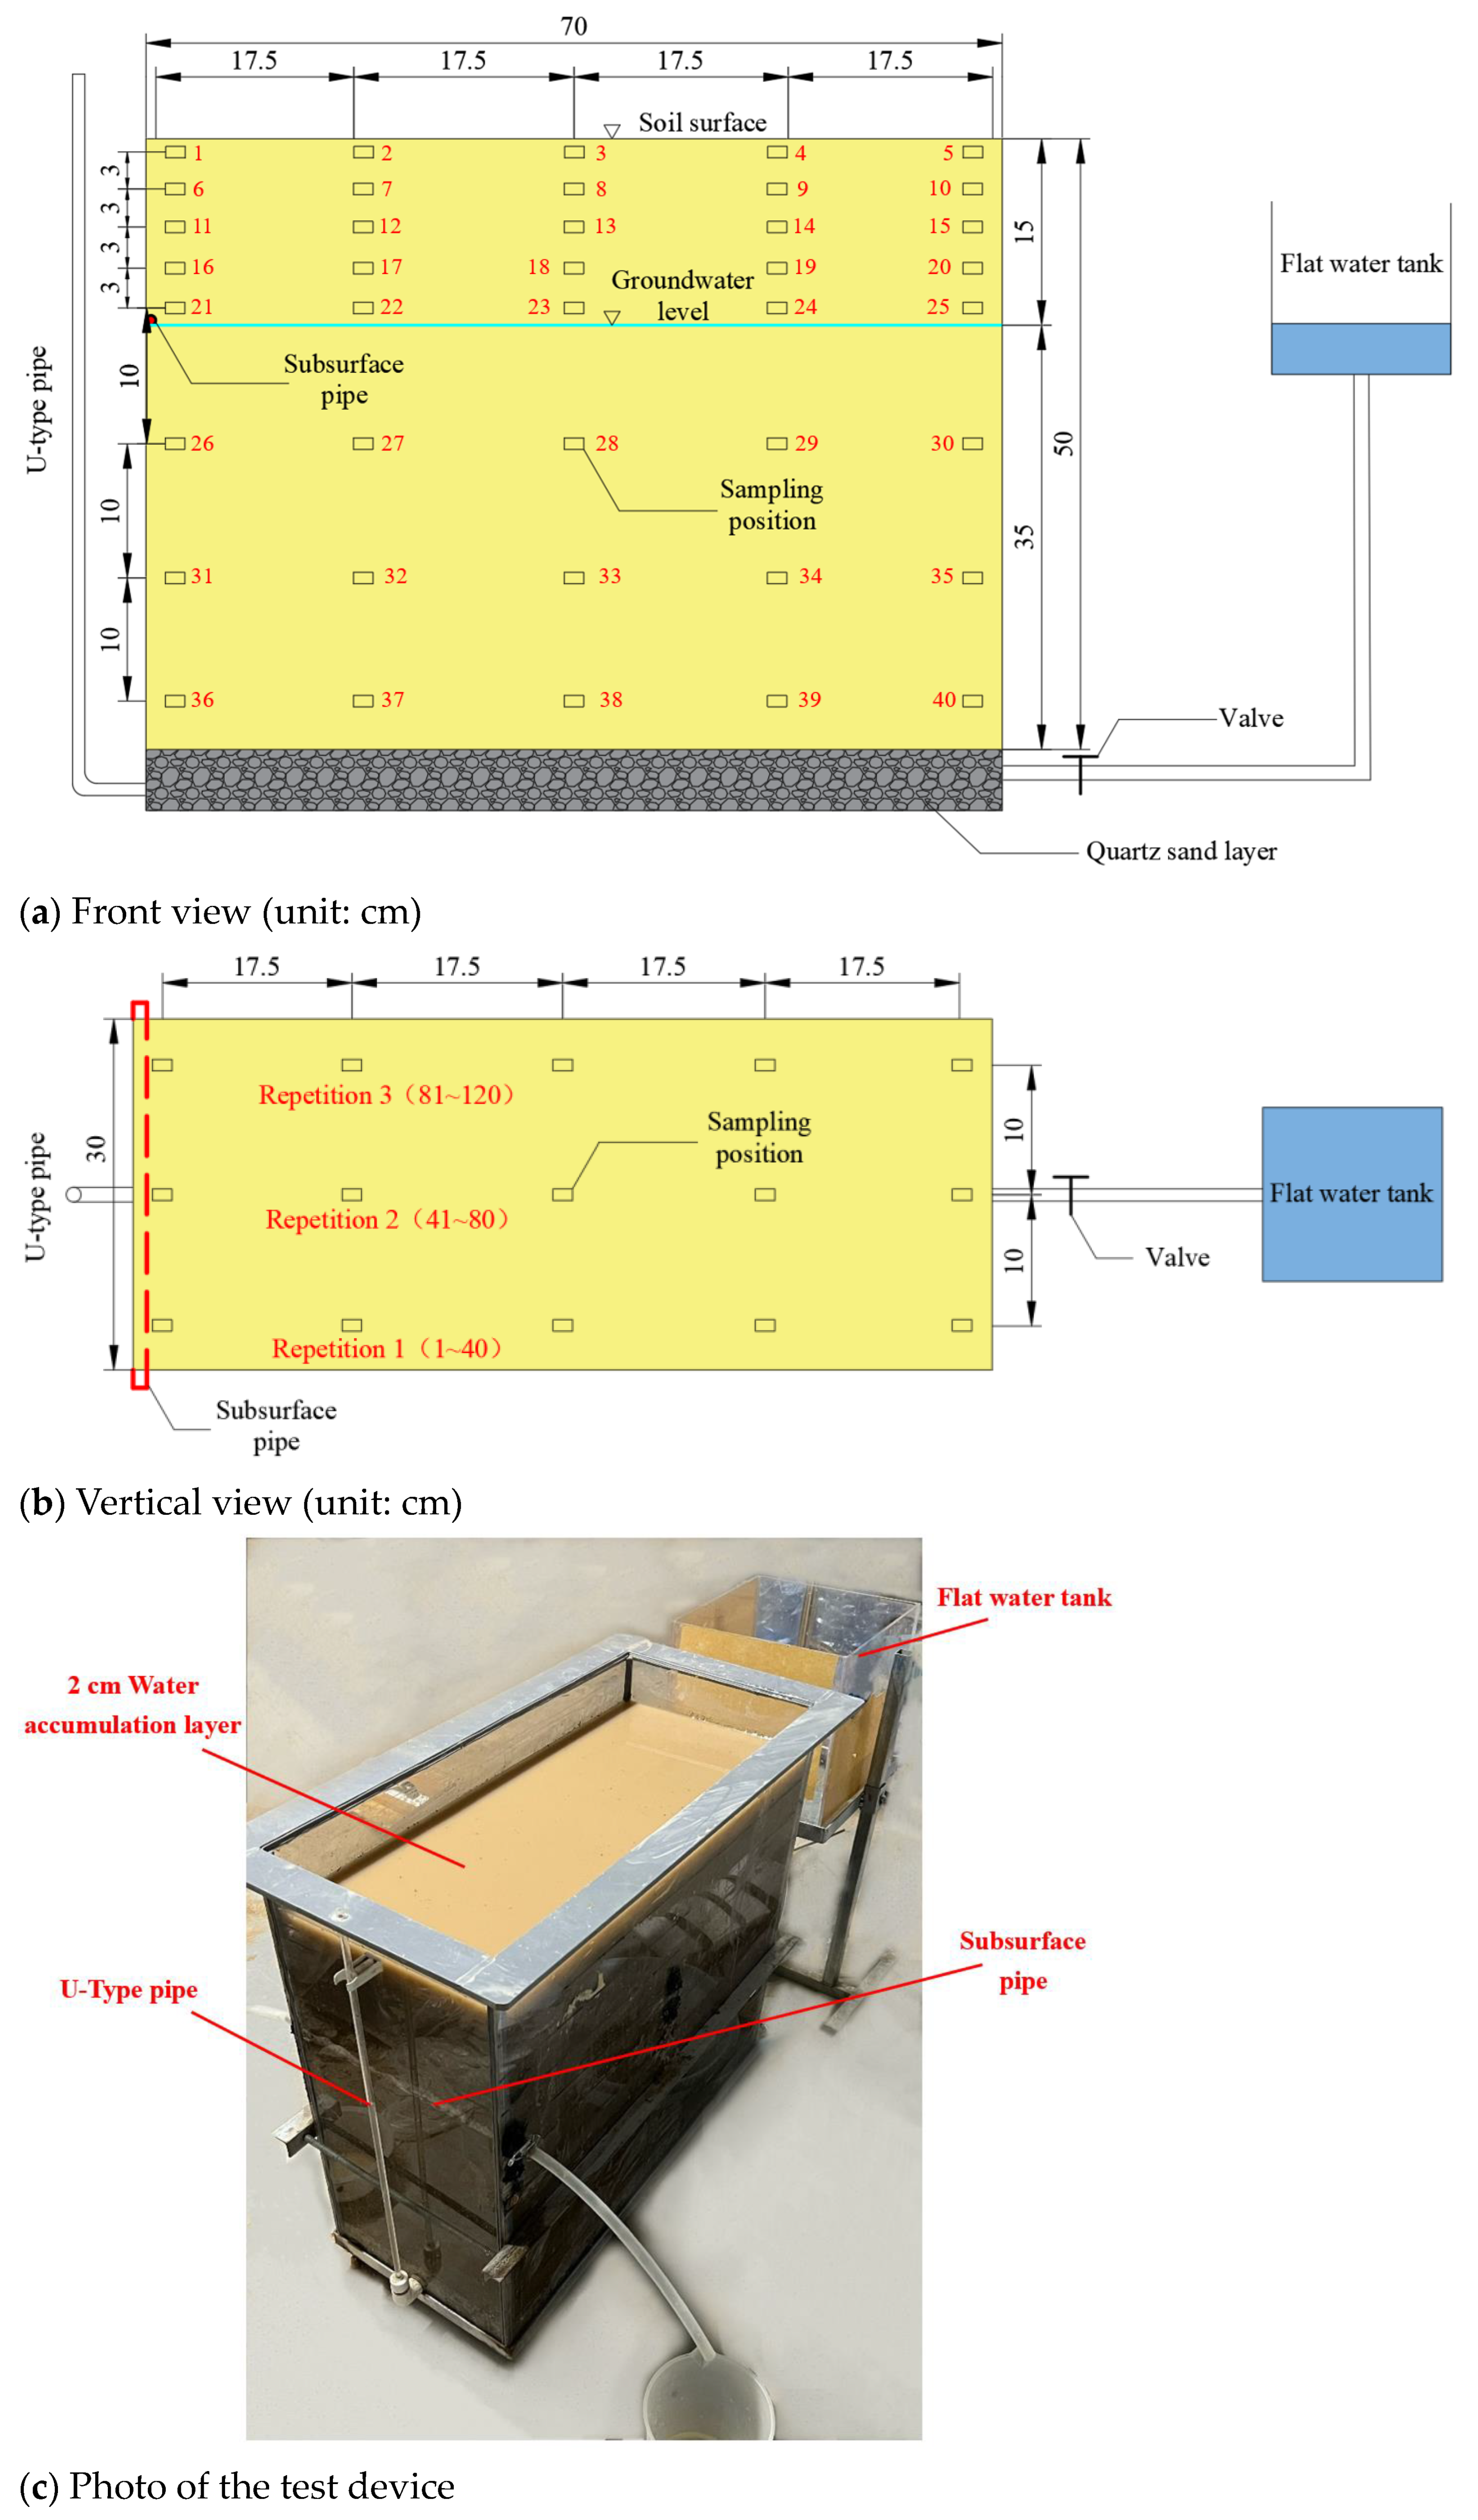
2.1. Indoor Soil Tank Test of Subsurface Pipe Drainage

2.1.1. Test Materials and Treatment

(1)
Test materials
The typical layout distance for the subsurface pipe in the Yinbei Irrigation District of Ningxia, China, is 10–40 m, the burial depth is 1.0–1.6 m, and the pipe diameter is 6.5–8.0 cm [4,17,40]. In this study, the soil tank was used to simulate the actual plot on a scale of 1:10. To simplify the model, only half of the control range of the subsurface pipe was simulated [41]. The soil tank was made of acrylic glass and measured 70 cm in length, 30 cm in width, and 60 cm in height. The subsurface pipe was made of red copper and was arranged on the left side of the soil tank. The pipe was buried at a depth of 15 cm. It had an inner diameter of 0.8 cm, and there were evenly spaced holes around the pipe at 2 cm intervals with 2 mm apertures. The outer surface of the subsurface pipe was covered with permeable gauze. The soil tank simulated the actual conditions of a subsurface pipe with an 8 cm diameter, a burial depth of 150 cm, and a distance of 14 m. The groundwater level in the soil tank was regulated by a flat water tank. A U-type pipe was installed at the bottom of the soil tank to monitor the groundwater level, and the walls of the U-type pipe were marked with a scale (Figure 1). The soil used in the experiment was taken from two plots with varying levels of saline–alkali soil in Liuzhong Township (39°50′ N, 106°35′ E), Shizuishan City, Ningxia, China. The soil texture was loam, with a soil salt content of 1.7 g/kg, and silt loam, with a soil salt content of 2.5 g/kg.
(2)
Test treatment
Two kinds of soil were used to prepare the soil tanks. Three different winter irrigation quotas (100 mm, 120 mm, and 150 mm) were used in each soil tank. The irrigation water used was tap water, and its conductivity ranged from 0.47 ms/cm to 0.51 ms/cm. The experimental treatment is shown in Table 1.
(3)
Test procedure
The methods for soil tank filling, groundwater level control, and irrigation were based on previous experience [42,43].
(1) Soil tank filling: the soil tank was filled with quartz sand, which had a diameter of 2–4 mm and was evenly spread on the tank bottom at a thickness of 5 cm. The surface of the quartz sand was covered with a geotextile material, which had a thickness of 0.35 mm. The test soil was air-dried, crushed, and passed through a 2 mm sieve. It was then loaded in layers based on a dry bulk density of 1.4 g/cm3. Each soil layer was 5 cm thick, totaling 10 layers. The initial volumetric water content of the soil was 25%.
(2) Groundwater control: the groundwater level in the Yinbei irrigation district of Ningxia is typically 1.5 m before winter irrigation [4]. After the soil tank was filled and it was left undisturbed for 24 h, tap water was slowly injected from the quartz sand layer at the bottom of the soil tank using a flat water tank. The injection process was continued until water began to flow out from the subsurface pipe, and then water injection was stopped.
(3) Soil salt leaching: a beaker was used to maintain a water layer thickness of 2 cm on the soil surface, and the irrigation quota was recorded each time.
(4) Water subsidence: once the total irrigation quota had reached the designated value as per Table 1, irrigation was stopped, and the water on the soil surface started to recede.
(5) Soil sampling: after the water in the surface layer of the soil completely subsided, the soil was left undisturbed for 48 h, and soil samples were collected using a soil drill with a diameter of 4 cm. As shown in Figure 1a,b, soil samples were taken at 5, 15, and 25 cm from the front of the soil tank for three replicates, with 40 soil samples taken each time.

2.1.2. Test Indicators

Salt content refers to the ratio of the mass of salt in the soil to the mass of dry soil. In this test, salt content was determined using a conductivity method [44]. The soil samples were dried, crushed, and then passed through a 2 mm sieve. A soil-water mixture was prepared and oscillated for 30 min at a soil-water ratio of 1:5. The soil-water mixture was left undisturbed for 8 h, and, then, the liquid portion was extracted. The conductivity value of the extract was measured using a conductivity meter (DDSJ-308F, Shanghai Leici, Shanghai, China). The relationship between soil salt content (TDS, g/kg) and extract conductivity (EC, ms/cm) was determined using the dry residue method [44]. The calibration formula is as follows:
TDS = 4.173 EC 0.104 R 2 = 0.976
The soil desalination rate is used to characterize soil salinity reduction after irrigation relative to the initial value. The formula is as follows:
N = S 1     S 2 S 1 × 100 % S 1 = i = 1 n s i m i S 2 = j = 1 n s j m j
where N is the soil desalination rate (%), S1 is the soil salt content before irrigation (g), S2 is the soil salt content after irrigation (g), si is the unit mass soil salt content at each sampling position before the start of irrigation (g/kg), which is the designated value of soil salt content in Table 1, sj is the unit mass soil salt content at each sampling position after irrigation (g/kg), mi and mj indicate the air-dried soil mass corresponding to each sampling position (kg), mi = mj, and n is the number of soil samples used to calculate the soil desalination rate.

2.2. Construction and Verification of Numerical Simulation Model of Subsurface Pipe Drainage

HYDRUS-2D is a software used to simulate water, heat, and solute transport in two-dimensional saturated–unsaturated media. It has been used by many scholars to study the movement of soil water and salt [41,45], water and nitrogen [46], water and heat [28], etc. Its simulation accuracy is high.

2.2.1. Basic Principles of the Model

(1)
Soil water transport model
The movement of soil water under surface irrigation conditions can be simplified as a two-dimensional infiltration problem. It was assumed that the soil is uniform and isotropic; the influence of air and temperature on soil water movement or the water absorption of crop roots was not considered. Under these conditions, the movement of soil water can be expressed by Richards’ equation:
θ t = x k h h x + y k h h y + z k h h z + S h
where θ is the soil volumetric water content (cm3/cm3), h is the pressure head (cm), k (h) is the hydraulic conductivity (cm/h), t is the simulation time (h), x and z are the horizontal and vertical coordinates (cm), and S (h) is the root water absorption term. Since winter irrigation is carried out after crop harvest, root water absorption was not considered, and S (h) = 0.
(2)
Soil solute transport model
The transport of solute follows a standard convection–dispersion equation:
θ t = x θ D xz C x q x C
where C is the solution concentration (g/cm3), Dxz is the hydrodynamic dispersion coefficient (cm2/h), and qx is the flow velocity (cm/h).
θ = θ r + θ s     θ r 1   +   α h n m K h = K s S e l 1 1 S e 1 / m m 2 S e = θ h     θ r θ s     θ r
where θs is the soil saturated volumetric water content (cm3/cm3), θr is the residual volumetric water content of the soil (cm3/cm3), se is the relative saturation coefficient, α, n, and m are fitting parameters that are associated with soil physical properties, Ks is the soil saturated hydraulic conductivity (cm/h), and l is the pore correlation parameter, which is taken as 0.5.

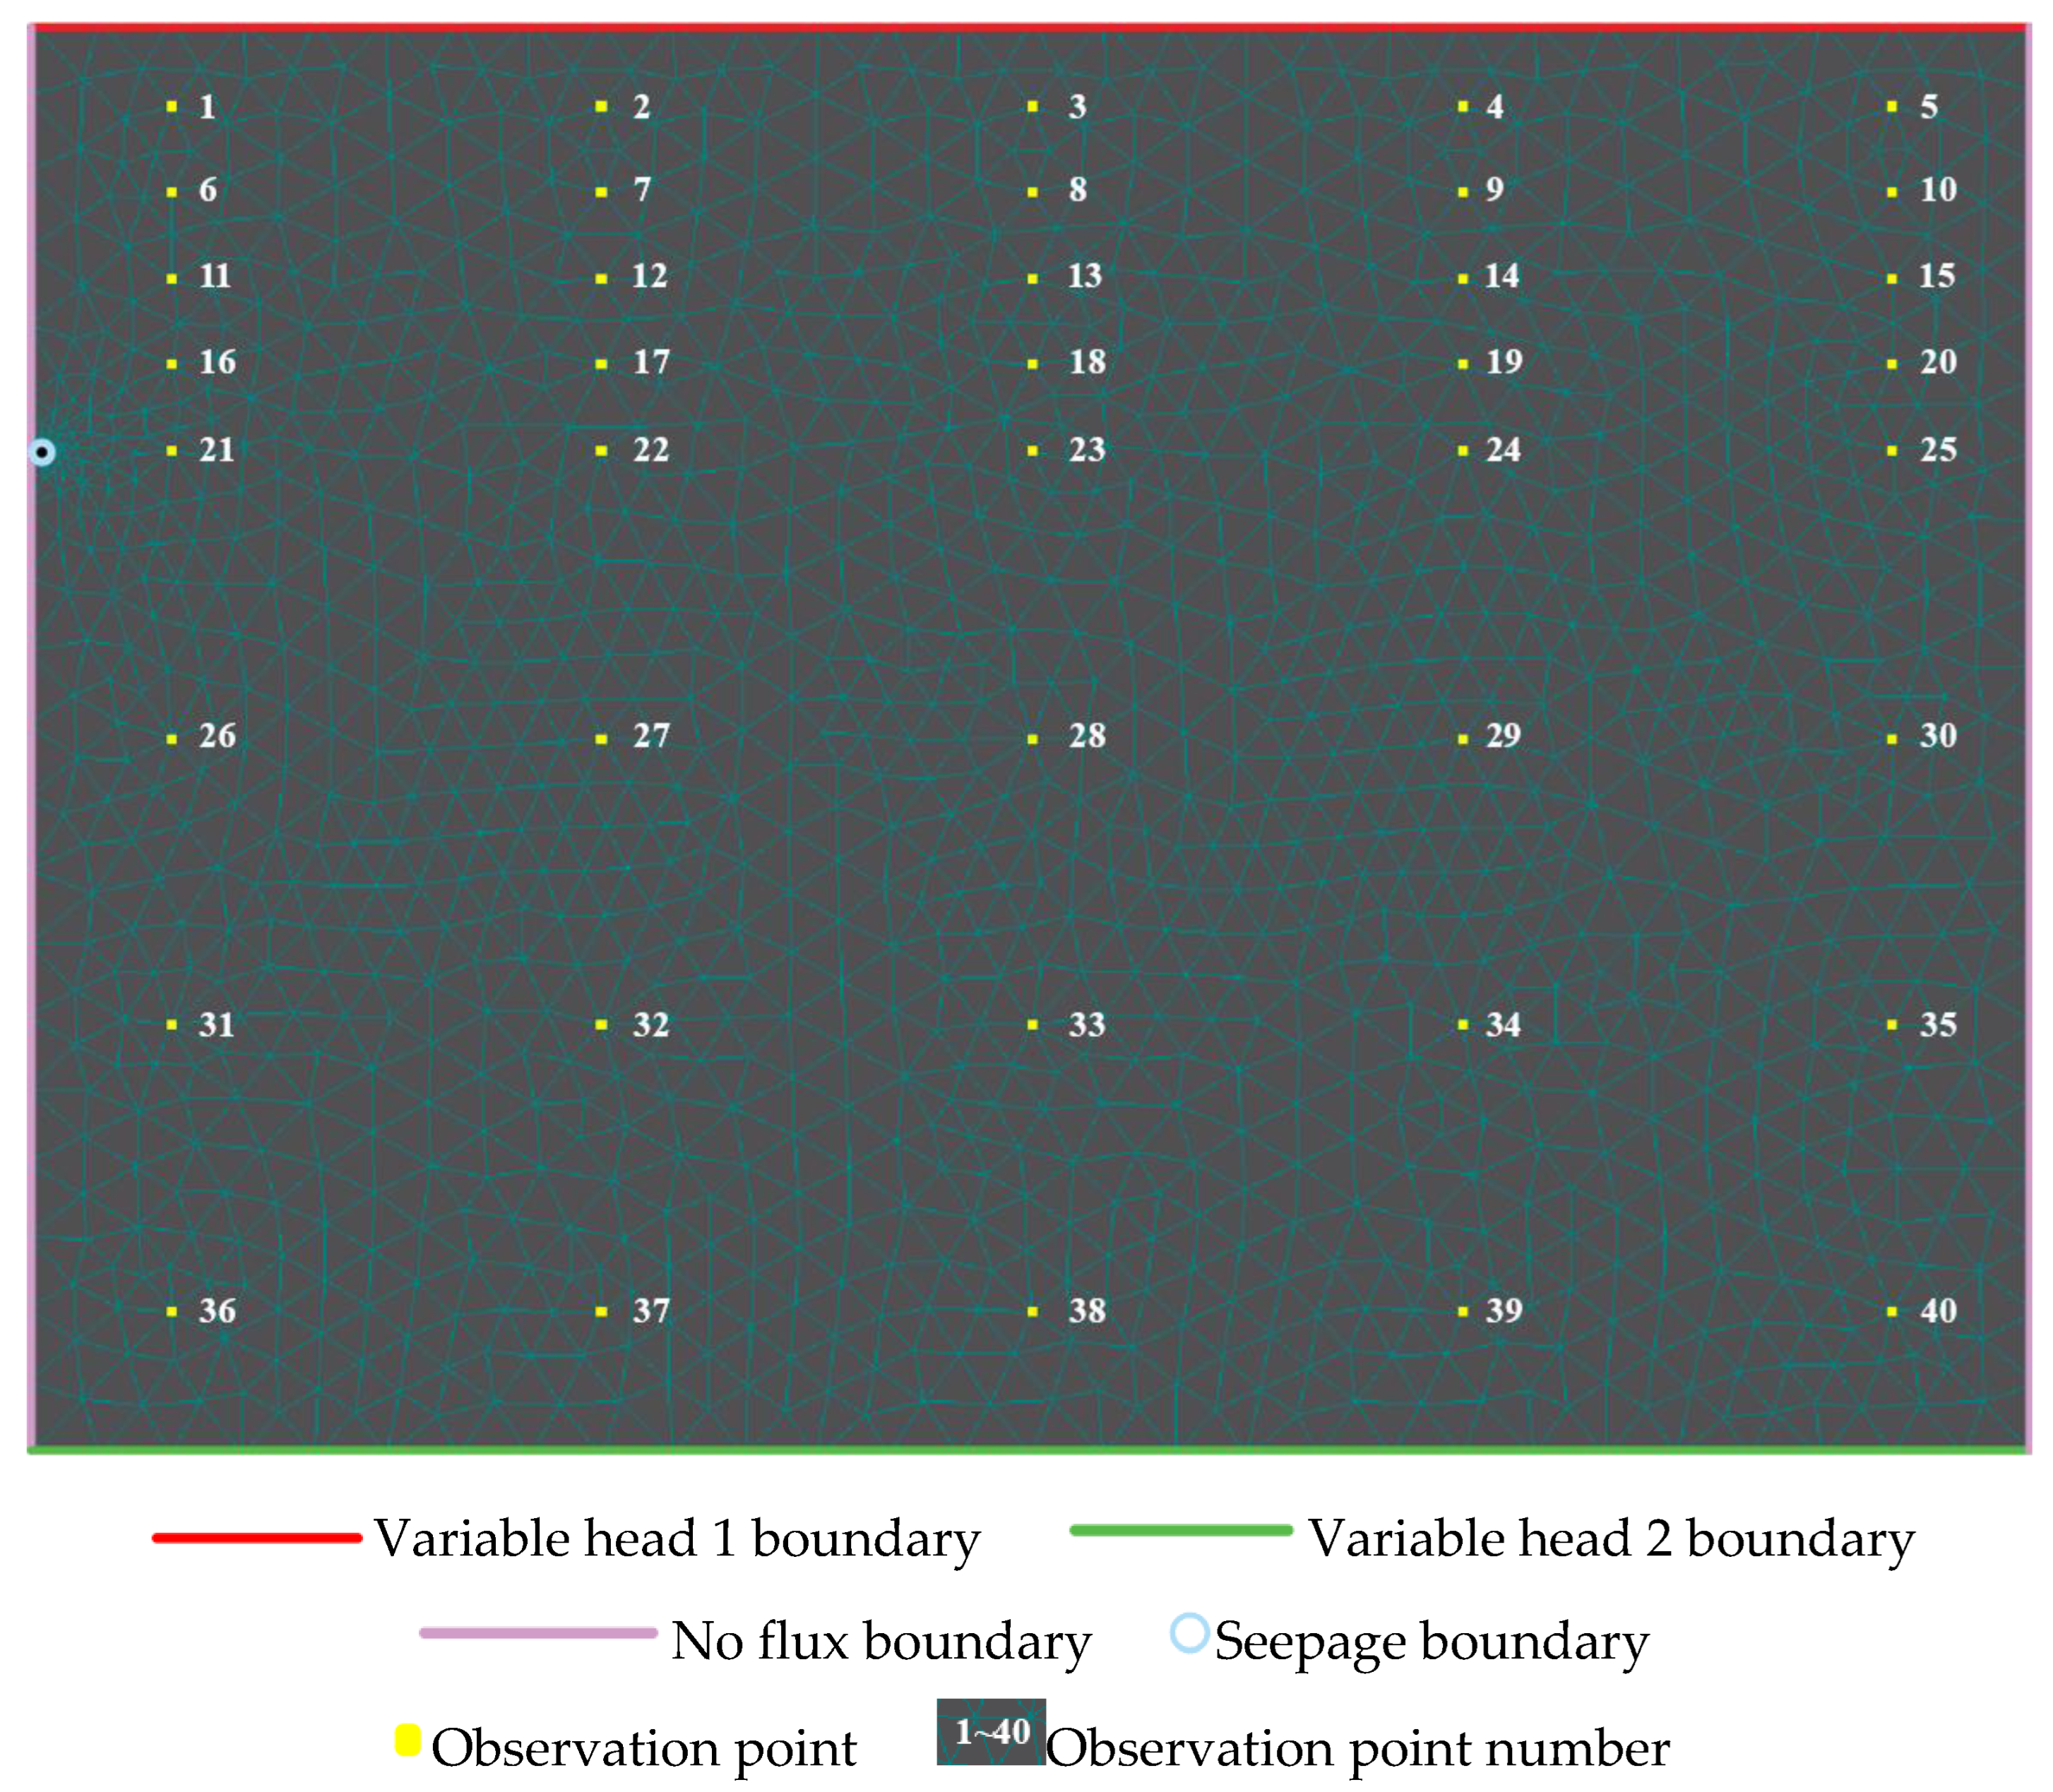
2.2.2. Model Establishment

The simulation area includes the soil section of the soil tank, which measures 70 cm in length and 50 cm in height. The location and number of 40 soil observation points are consistent with the sampling points shown in Figure 1a (Figure 2). The soil bulk density and initial water content of each layer were set to 1.4 g/kg and 25%, respectively. The initial salt content of the soil was set to 1.7 g/kg and 2.5 g/kg, according to Table 1.
According to the steps of the soil tank subsurface drainage test, the upper boundary (variable head 1 boundary) of the model is set as follows in chronological order: the atmospheric boundary (step 2), the constant head boundary with a water depth of 2 cm (step 3), the variable head boundary with a water depth ranging from 2 cm to 0 cm (step 4), and the atmospheric boundary (step 5). The lower boundary (variable head 2 boundary) of the model is set to a constant head boundary of 35 cm (step 2) and a zero-flux boundary (steps 3–5) in chronological order [41]. The left and right boundaries (no flux boundary) of the model are set as impermeable boundaries. The boundary of the subsurface pipe is set as the seepage face. The water boundary condition corresponds to the solute boundary condition. The upper boundary, lower boundary, and subsurface pipe boundary are the third type of boundary conditions.

2.2.3. Soil Hydraulic Characteristics

A laser particle size distribution instrument (BT-9300HT, Dandong Baite, Dandong, China) was used to determine the particle size of the test soil. The Rosetta model in HYDRUS-2D software was utilized to predict the characteristic soil hydraulic parameters (Table 2).

2.2.4. Model Validation

The normalized root mean square error (nRMSE) was used to assess the simulation accuracy of the HYDRUS-2D model for SPD. The formula for calculating nRMSE is as follows:
nRMSE = k = 1 n S k     E k 2 n E a v e × 100 %
where S is the simulated value of soil salinity (g/kg), E is the measured value of soil salinity (g/kg), k is the serial number of measuring points, n is the number of measuring points, and Eave is the average value of all measured values. In addition, if nRMSE ≤ 10%, excellent agreement between the simulated and measured rates exists; if 10% < nRMSE ≤ 20%, the agreement is good, if 20% < nRMSE ≤ 30%, the agreement is fair, and if nRMSE > 30%, the agreement is poor.

2.3. Numerical Simulation Test

2.3.1. Simulation Test Design

In this study, the simulation test under SPD conditions was conducted for soil texture, initial soil salinity, and irrigation quotas. The experimental design is shown in Table 3.

2.3.2. Determination Conditions of Suitable Winter Irrigation Quotas

The crops planted on saline–alkali farmland in Ningxia, China, are primarily oil sunflower and corn. Among these, oil sunflower exhibits better salt tolerance. When the salt content in the root zone of sunflower oil (0–40 cm) was less than 1.4 g/kg, the yield of sunflower oil was more than 3.3 t/hm2; when the salt content was more than 1.4 g/kg, the yield of sunflower oil experienced a significant reduction of more than 12.1% [47,48,49]. When the salt content in the root zone of corn (0–80 cm) was lower than 0.7 g/kg, the yield of corn was more than 12.9 t/hm2; when the salt content was more than 0.7 g/kg, the yield of corn experienced a significant reduction of more than 12.4% [22,50,51]. To obtain suitable winter irrigation quotas for oil sunflower and corn under different soil textures and initial salt contents, in this paper, 1.4 g/kg and 0.7 g/kg were used as the target values of soil salt content after irrigation in oil sunflower and corn fields, respectively. Combined with the HYDRUS-2D simulation results of SPD, suitable winter irrigation quotas were determined for the two crops under different scenarios.
In this study, the use of the standard leaching ratio coefficient η was proposed for the evaluation of the winter irrigation salt leaching effect in farmland. The formula to calculate it is as follows:
η = A i A 0 × 100 %
where Ai is the area where the soil salt content in the root zone after irrigation is lower than the target value, while A0 is the total area of soil.

2.4. Data Analysis

All repeated sampling results were averaged using Microsoft Excel 2021 (Microsoft, Redmond, WA, USA), and were later collated and analyzed. Isoline figure were created using Surfer 15 software (Golden Software, Golden, CO, USA).

3. Results

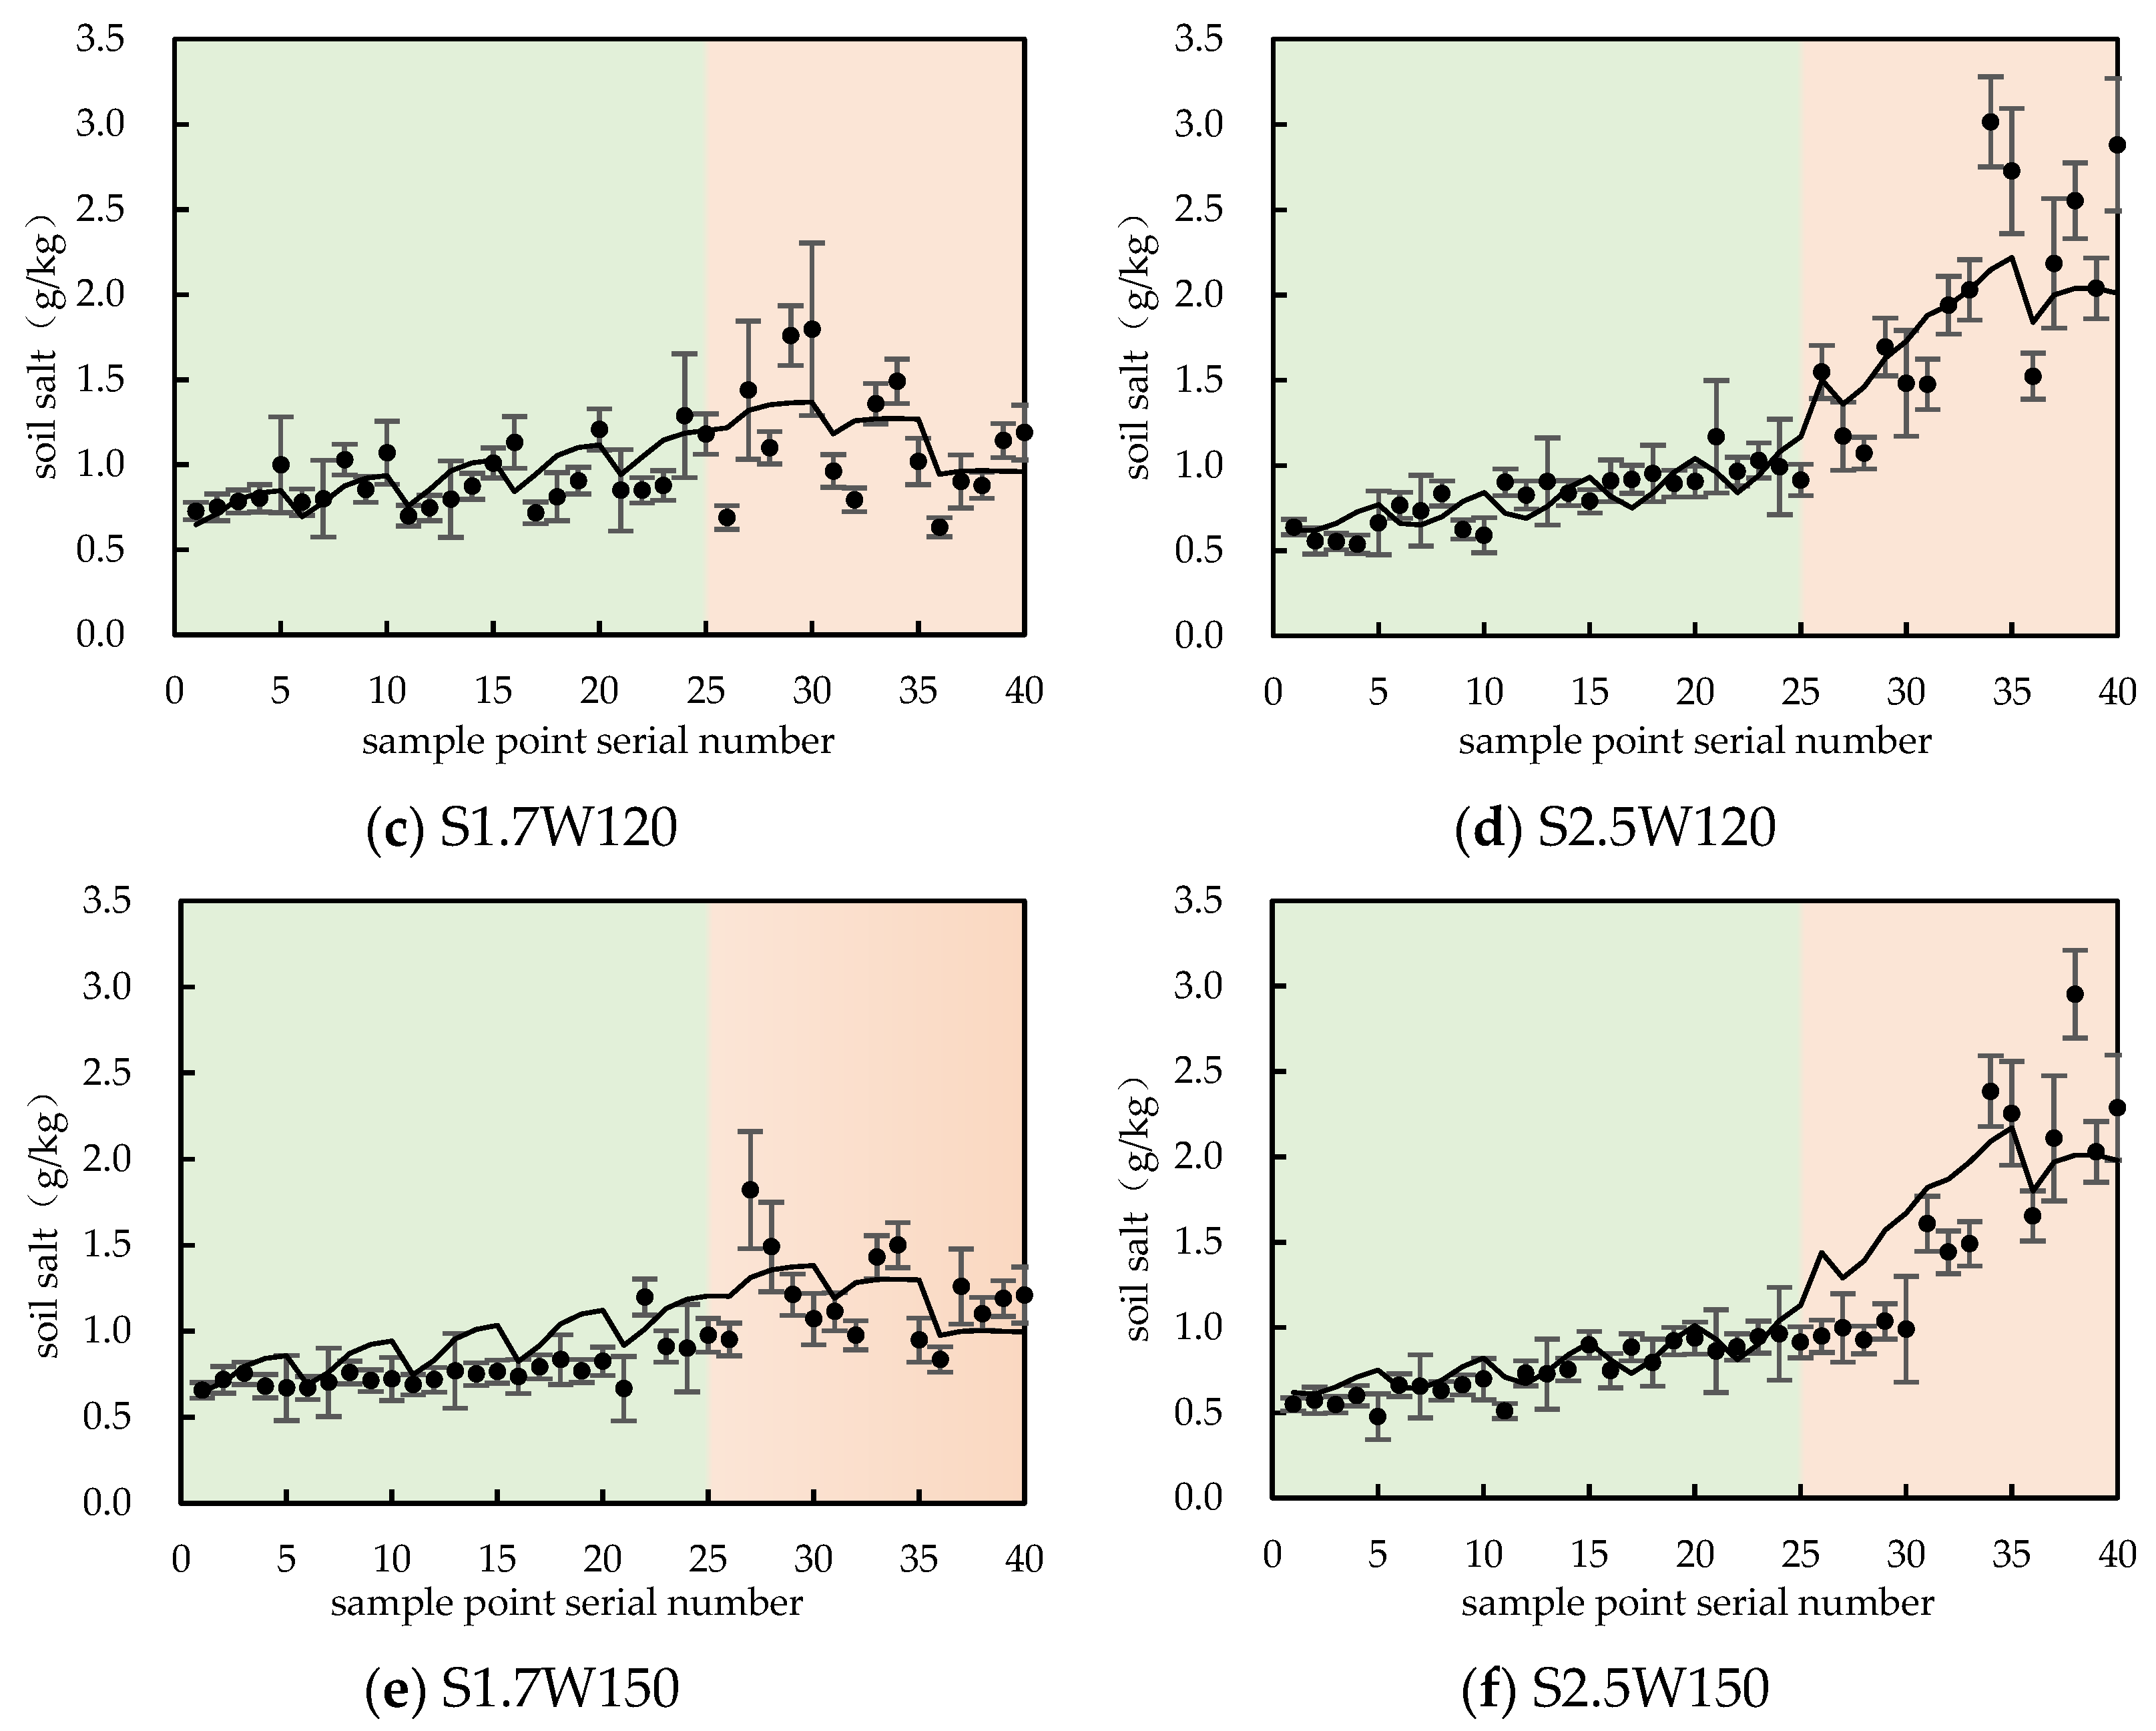
3.1. Verification of HYDRUS-2D Model for Subsurface Drainage

The simulated soil salt content at 40 observation points in the HYDRUS-2D model under different treatments was close to the measured value in the soil tank test (Figure 3). The nRMSE of the soil salt content above the subsurface pipe (sample numbers 1–25 in Figure 2) was 13–21%, which was higher than the nRMSE of the soil salt content below the subsurface pipe (sample numbers 26–40 in Figure 2), but the nRMSE of the soil salt content of all samples (sample numbers 1–40 in Figure 2) was 15–24% (Table 4). The simulation was good.

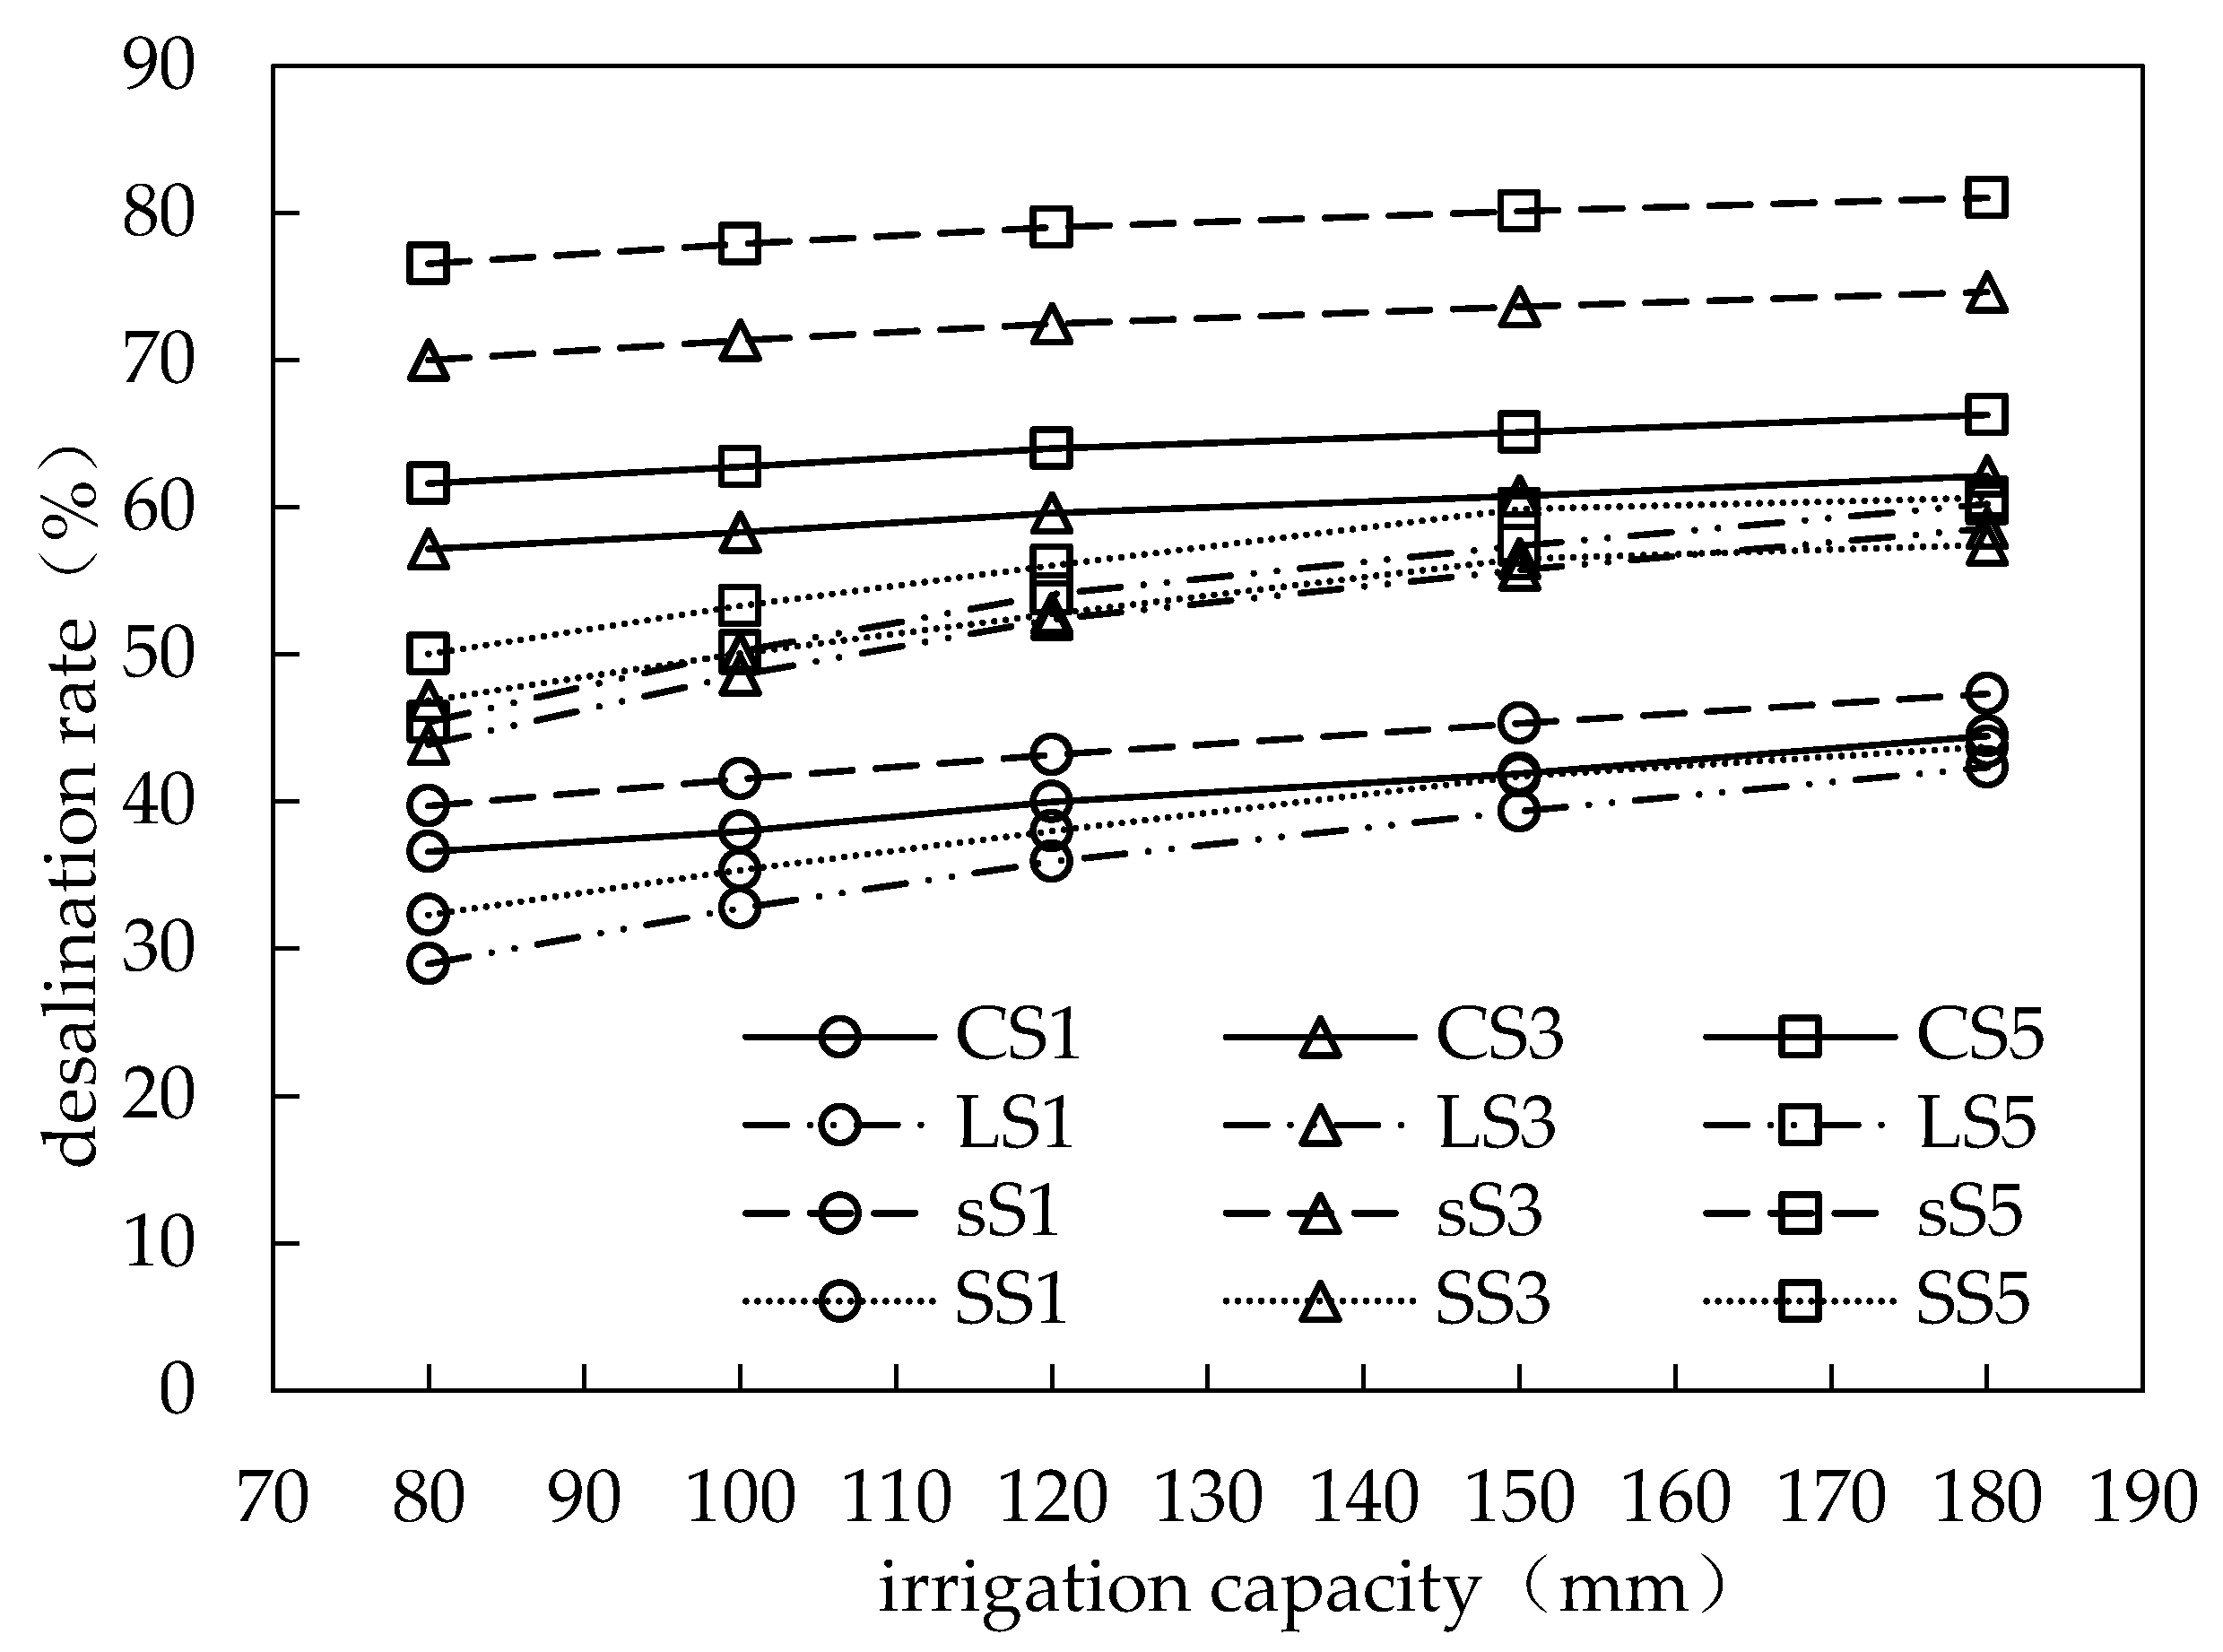
3.2. The Change Rule of Soil Desalination Rate above the Subsurface Pipe

Crop growth is closely related to the soil desalination rate above subsurface pipe Nu. A larger Nu indicates a better soil salt leaching effect [42]. When the initial soil salt content and the winter irrigation quotas were the same, silt loam had the highest Nu, ranging from 39.7% to 80.1%. The Nu values of clay loam and sandy loam were 37.3% to 66.1% and 31.5% to 61.4%, respectively. The Nu value of loam was the lowest, ranging from 28.8% to 41.5% (Figure 4).
When the initial salt content of the soil was the same, Nu increased with an increase in the irrigation quota. When the irrigation quota increased from 80 mm to 180 mm, the average Nu of different soil textures increased from 38.7–62.3% to 54.4–68.2%. Although the Nu of silty loam and clay loam was higher than that of loam and sandy loam, the Nu of the former was less affected by changes in irrigation quotas compared to the latter. The Nu of loam and sandy loam increased by 11.2% to 15.3% with increasing irrigation quotas, whereas the Nu of clay loam and silty loam only increased by 4.8%, reaching 6.0%.
When the winter irrigation quota was the same, Nu increased with increasing initial soil salt content. When the initial salt content increased from 1 g/kg to 3 g/kg, the average Nu of soils with different textures increased from 36.2–42.8% to 52.3–72.2%. When the initial salt content increased to 5 g/kg, the average Nu increased to 52.6–78.7%. The change in the range of Nu in clay loam and silt loam with a change in initial salt content was greater than that in loam and sandy loam. Among them, the Nu of clay loam and silt loam increased by 24.1%, reaching 36.4%, with increasing initial soil salt content, while the Nu of loam and sandy loam only increased by 16.5%, reaching a total of 18.4%. In addition, as the initial salt content increased, the increase in Nu in different soils decreased. When the initial salt content increased from 1 g/kg to 3 g/kg, the increase in Nu in soils of different textures increased by 13.5–28.8%. When the initial salt content increased to 5 g/kg, the increase in Nu decreased to 1.1–7.3%.

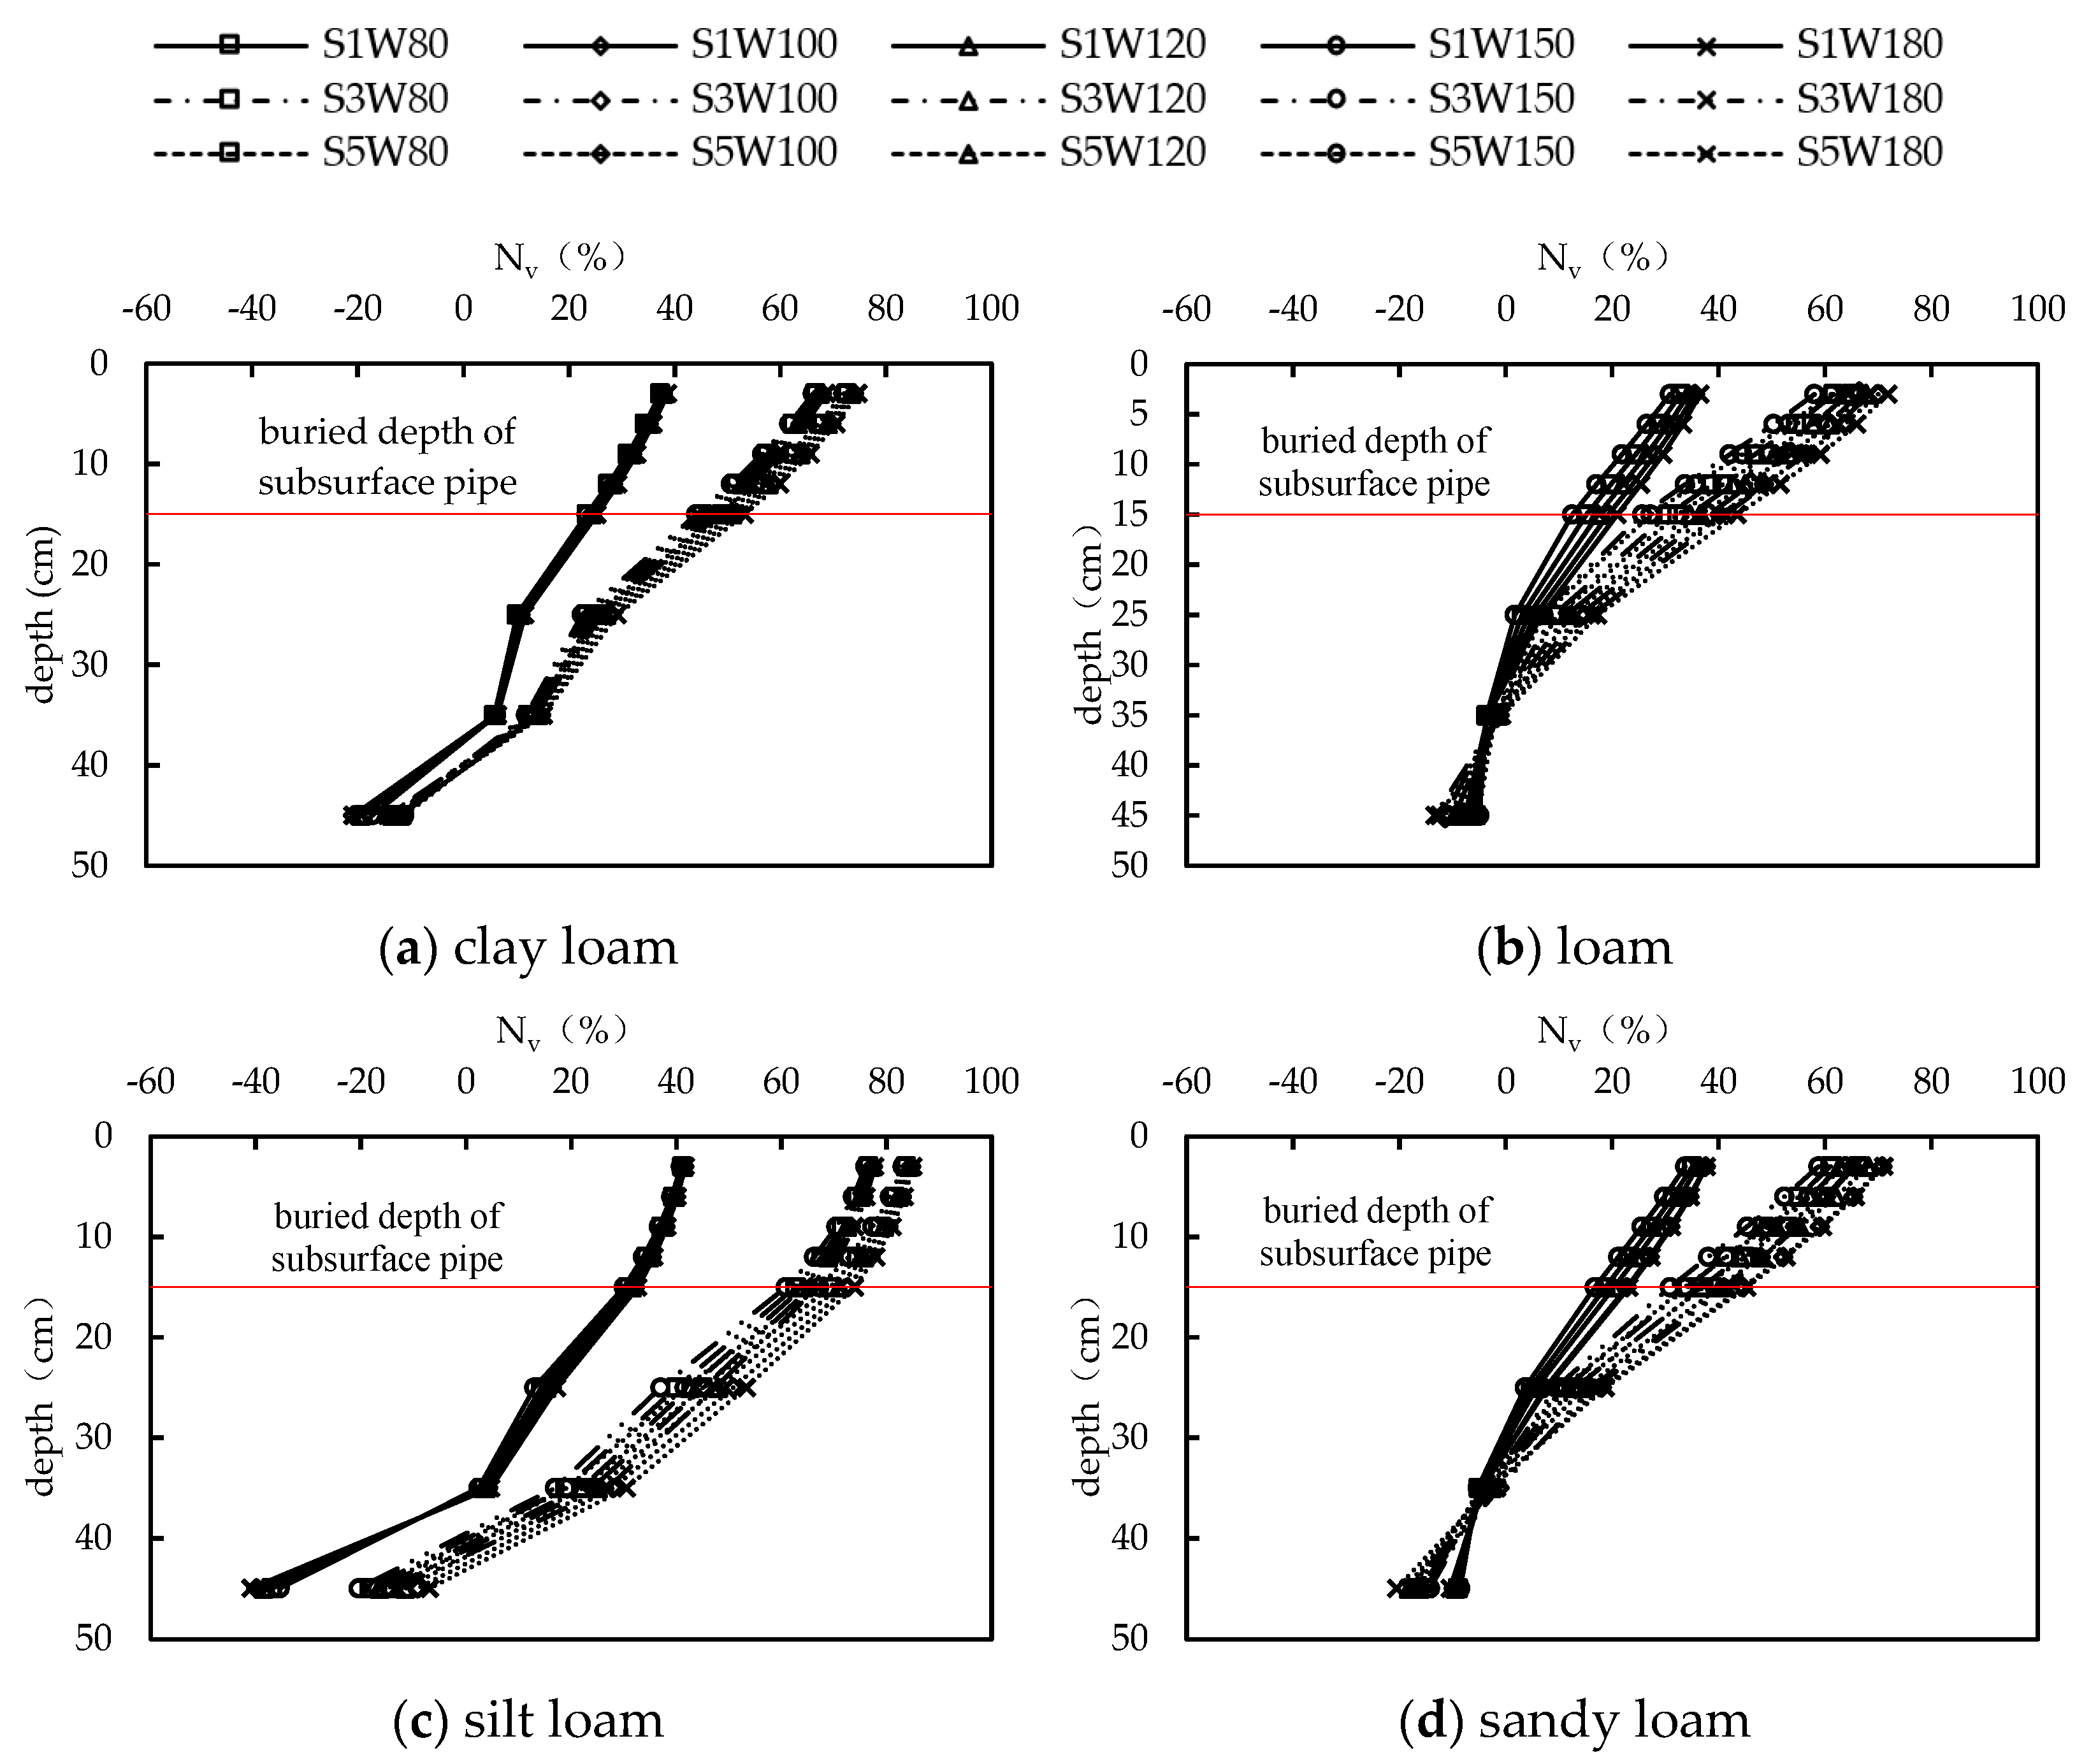
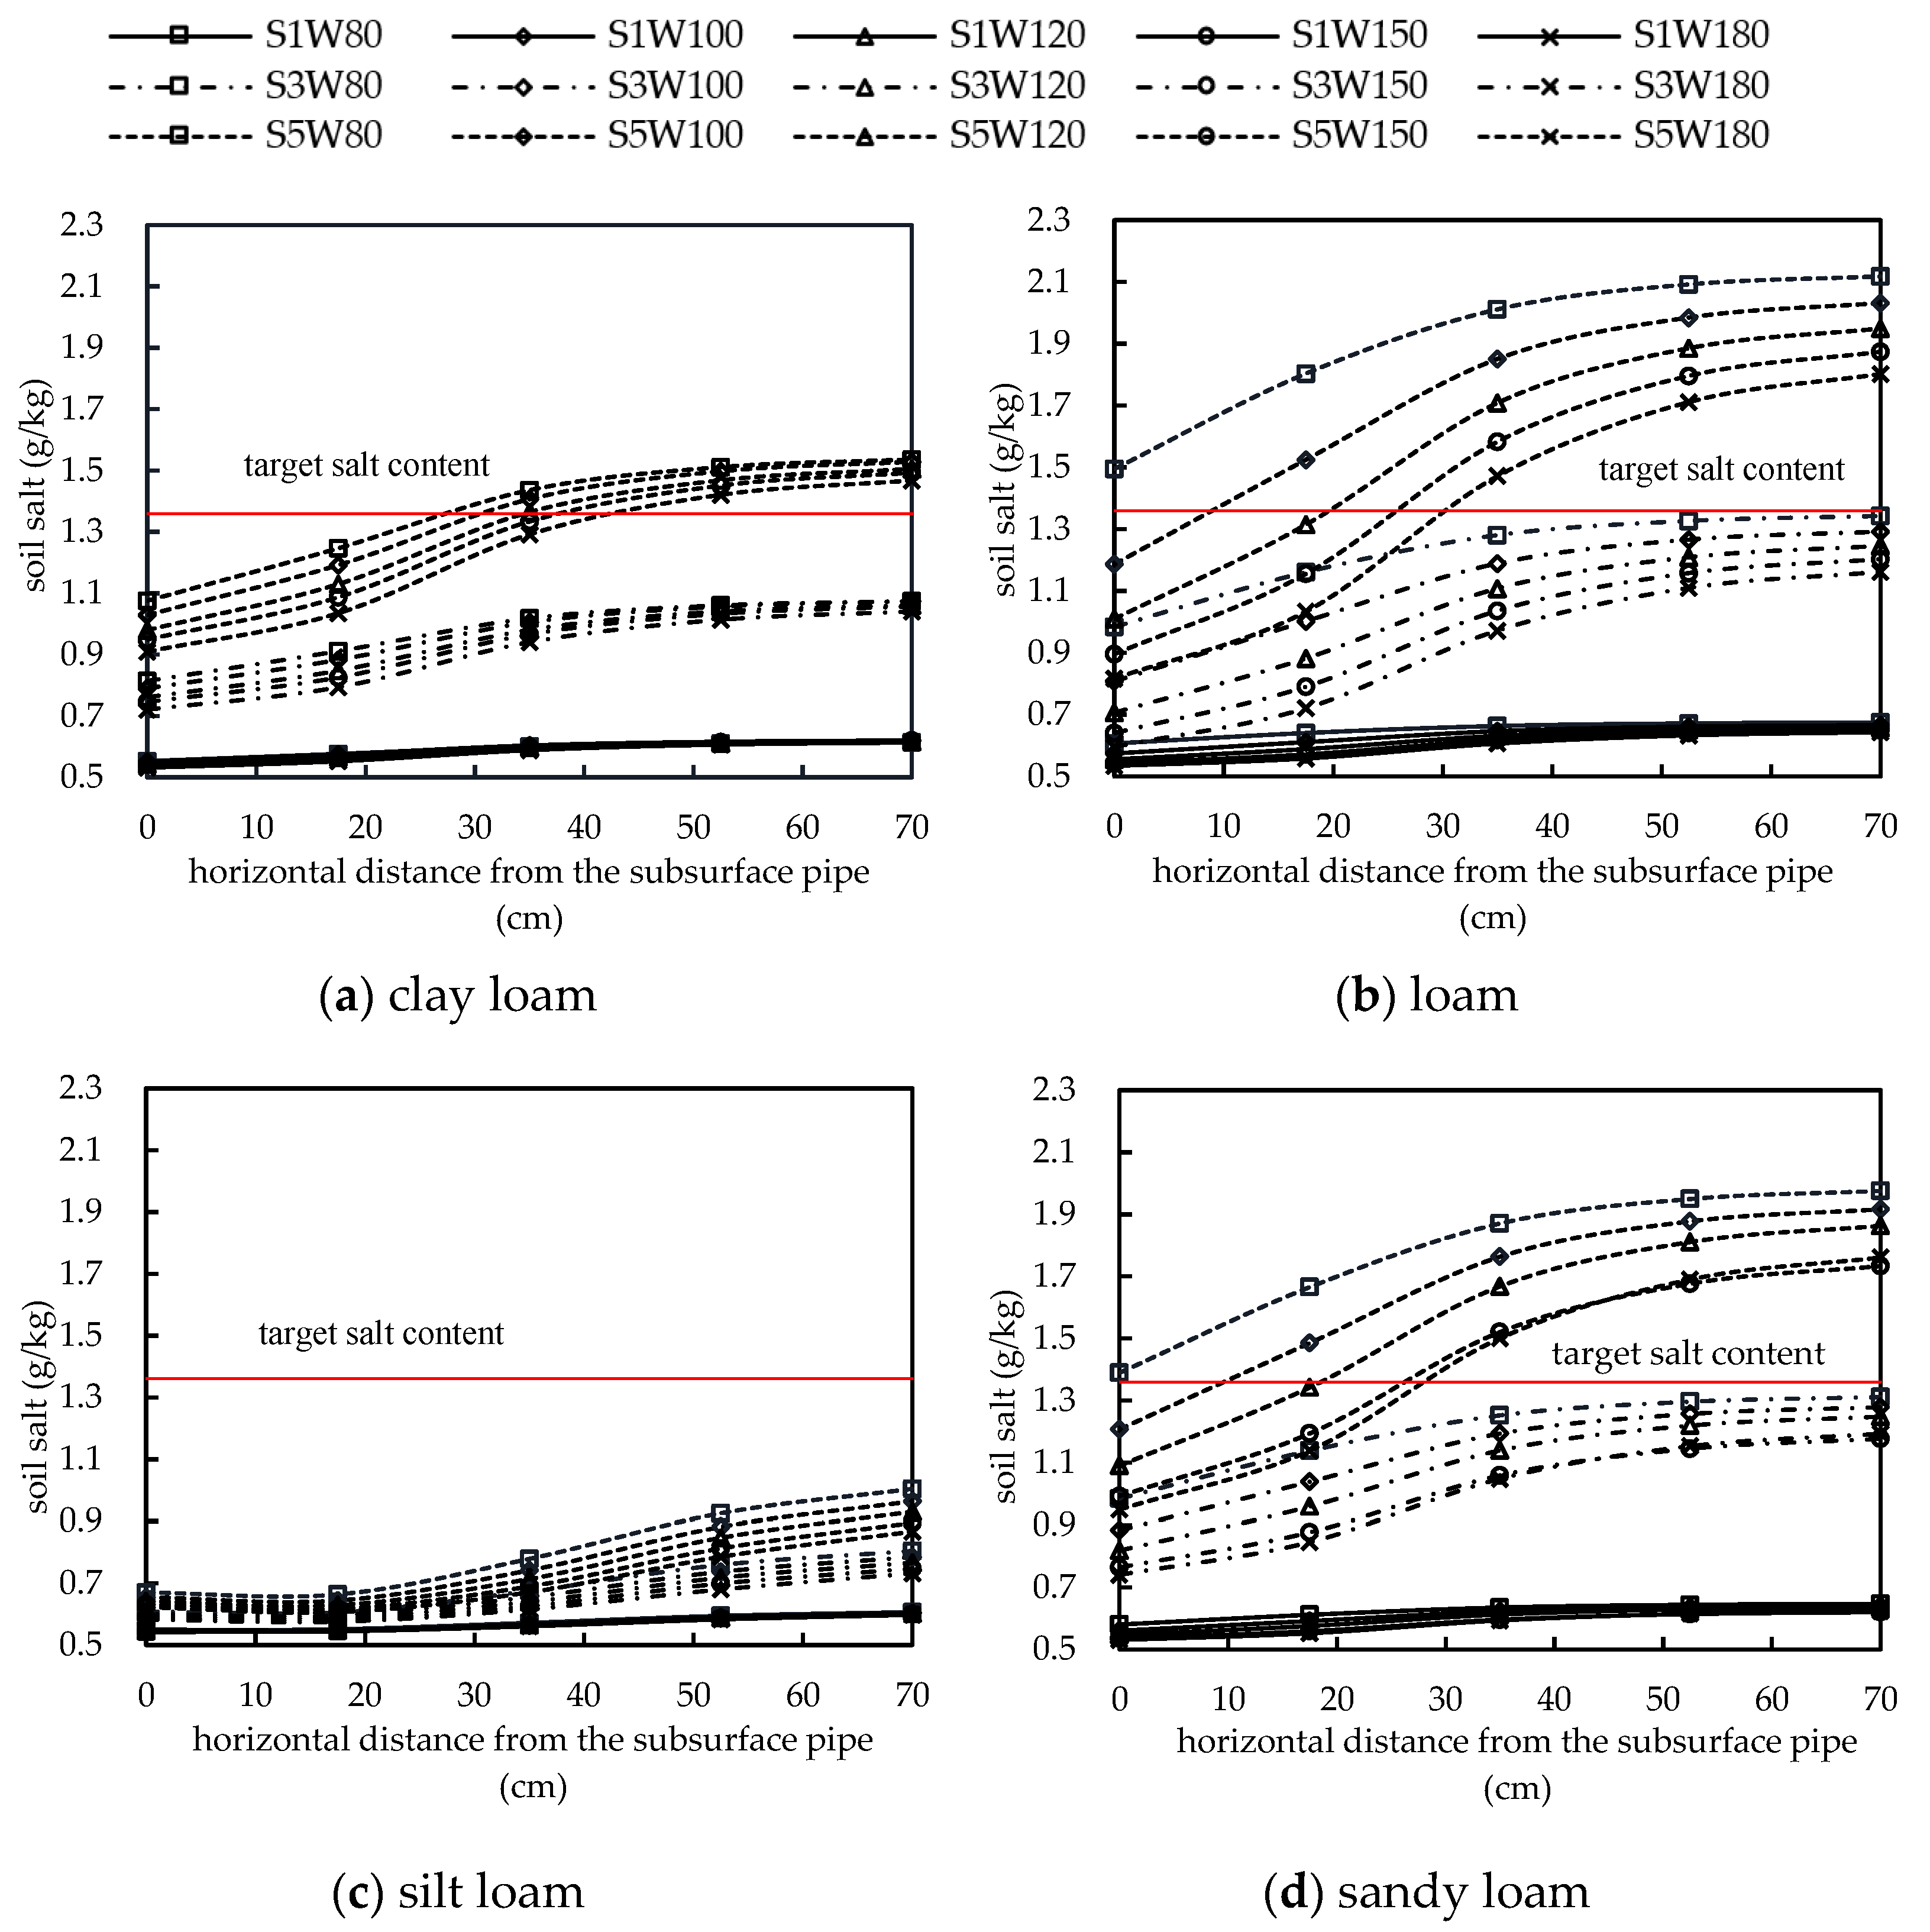
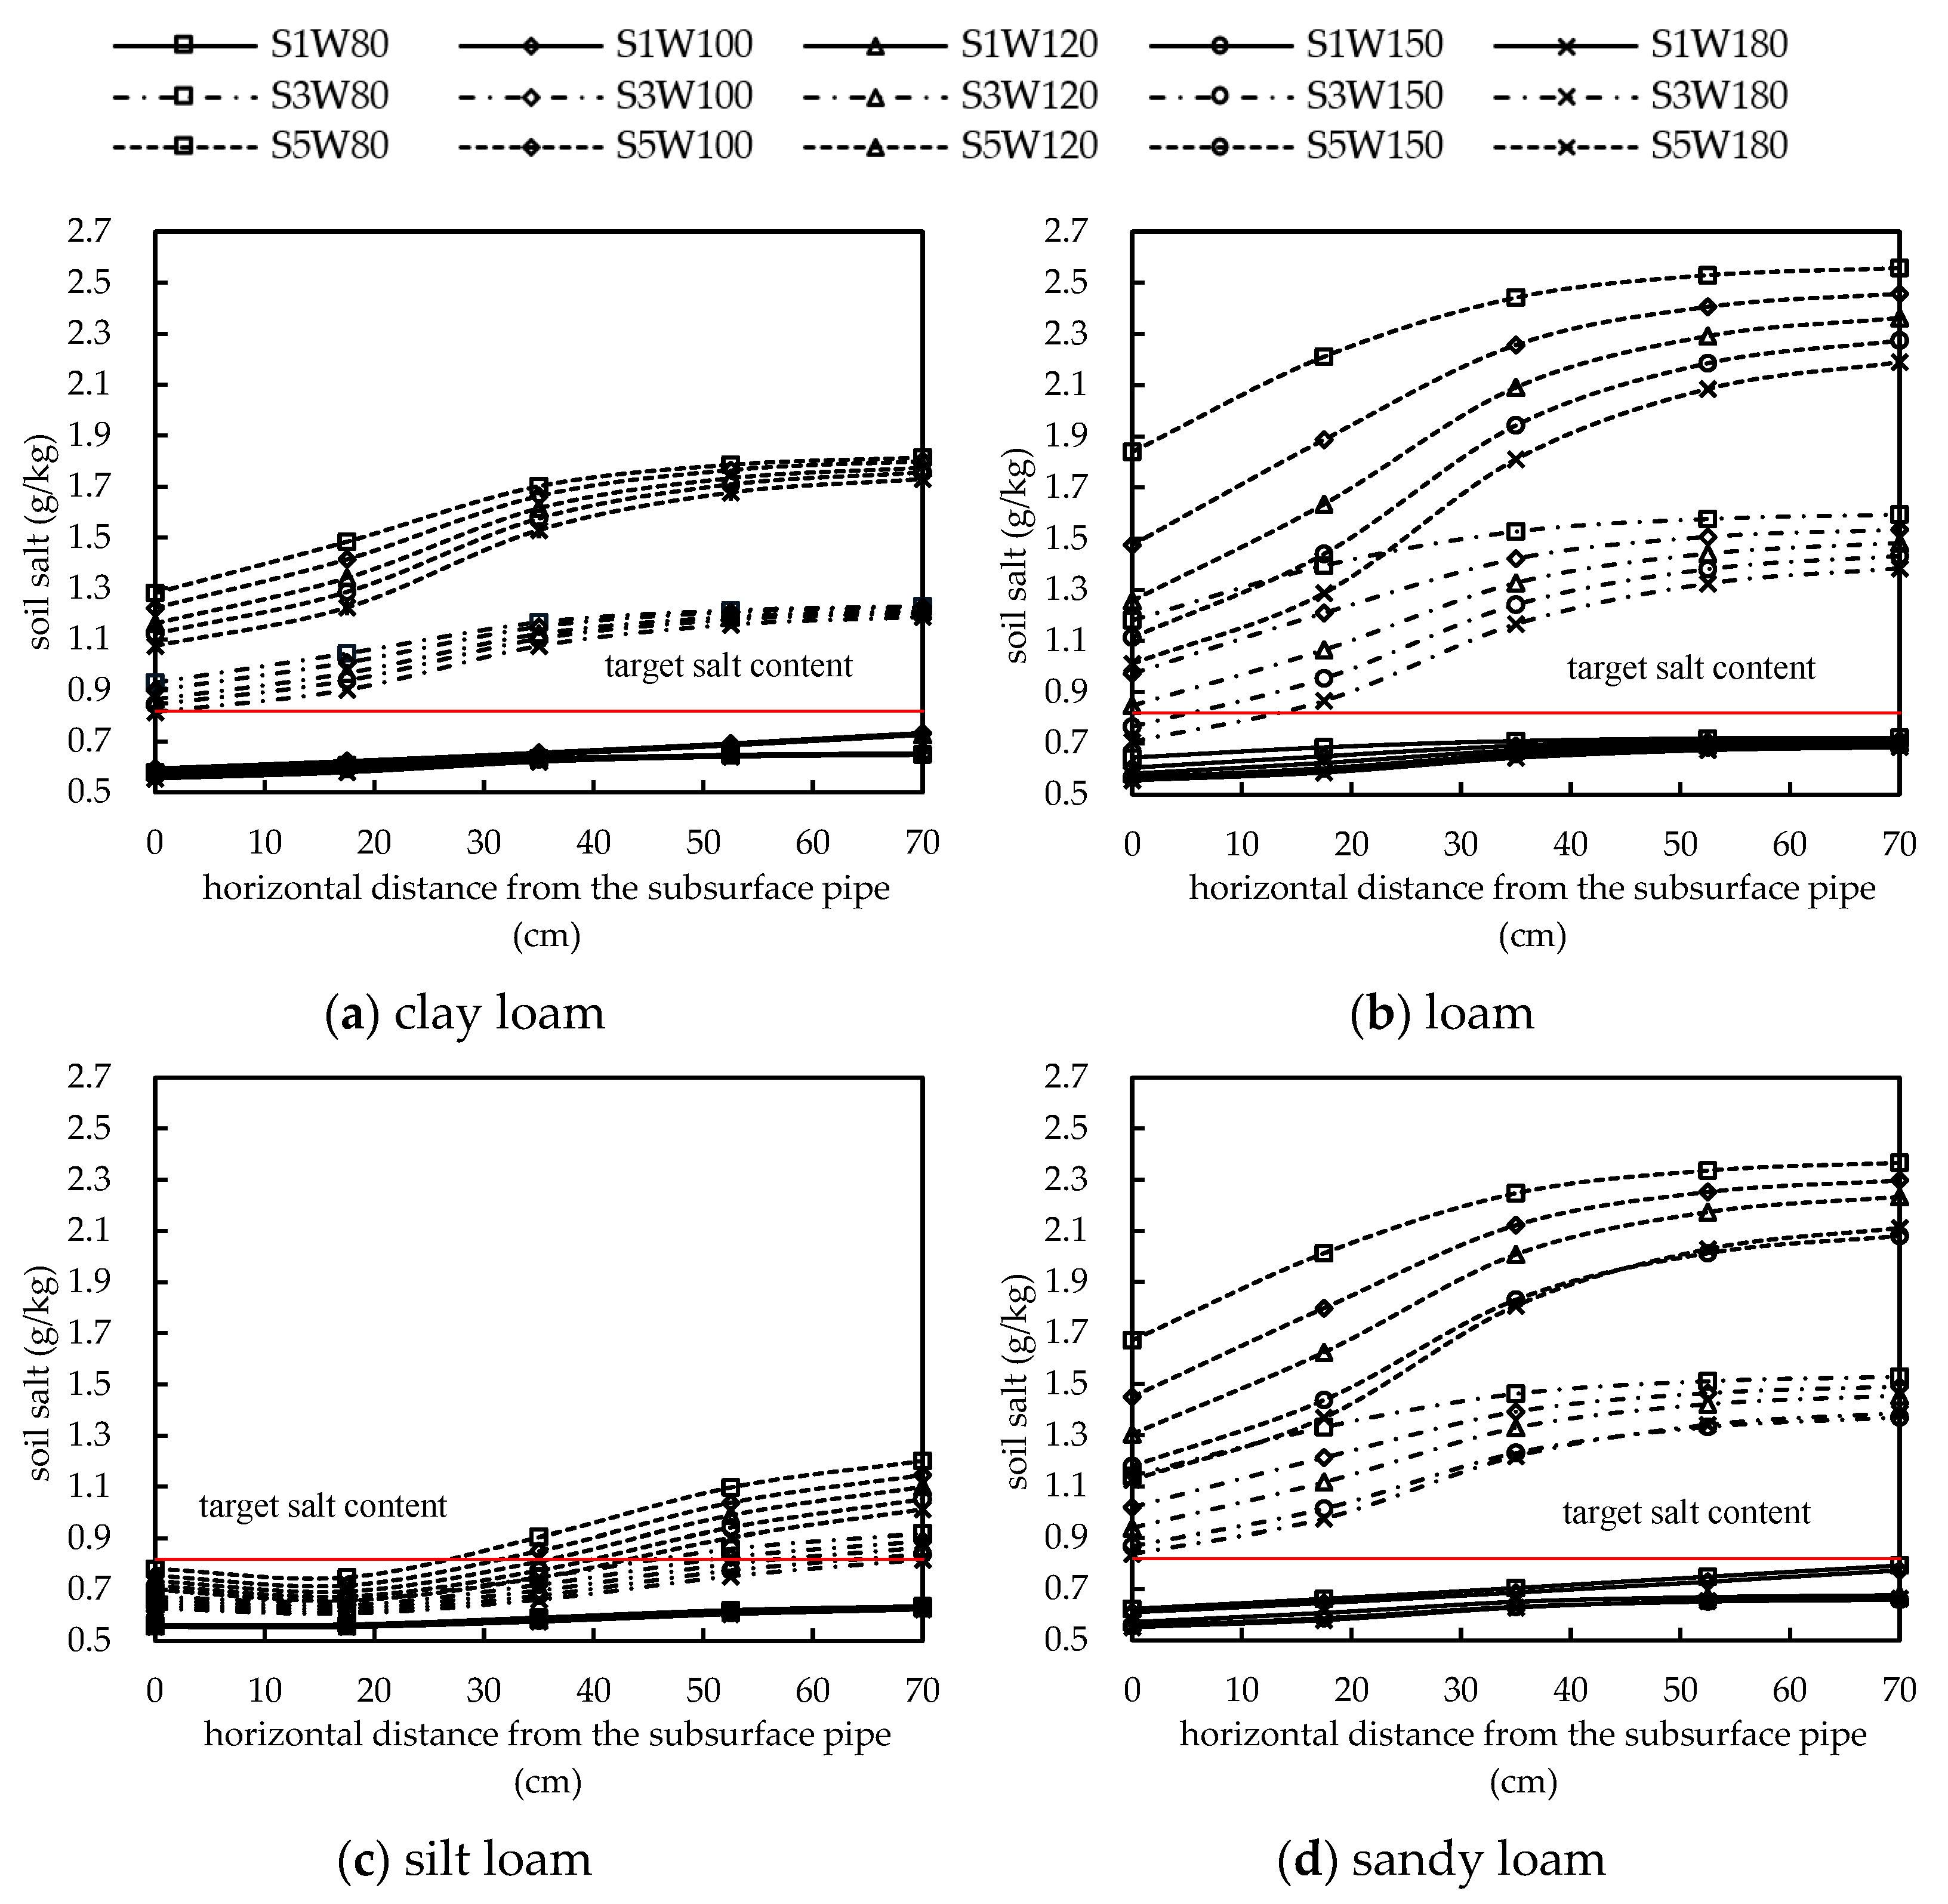
3.3. Spatial Variation of Soil Desalination Rate

Spatial variation in the soil desalination rate affects the distribution of soil salinity after winter irrigation. In the horizontal direction, the average desalination rate Nh of the 0–15 cm soil layer decreased as the distance from the subsurface pipe increased, but the decrease was relatively small, suggesting that the leaching effect of winter irrigation in farmland was not significantly affected by the horizontal distance from the subsurface pipe. The decrease in Nh was influenced by soil texture. Under loam conditions, the decrease in Nh was most significant, and the desalination rate at the farthest point from the subsurface pipe was 18.1% lower than that above the subsurface pipe. For sandy loam and clay loam, Nh decreased by an average of 11.2% to 16.3%. For silty loam, the decrease in Nh was the lowest, with an average of only 7.5% (Figure 5). In addition, the decrease in Nh with increasing distance from the subsurface pipe was greater when there was a higher initial soil salt content and a larger irrigation quota. When the irrigation quota was kept constant, the Nh with an initial salt content of 1, 3, and 5 g/kg decreased by an average of 10.2%, 13.9%, and 14.7%, respectively, at the farthest point from the subsurface pipe. When the initial salt content of the soil was the same, the Nh corresponding to the irrigation quotas of 80–180 mm decreased by 9.5% to 15.4%.
In the vertical direction, the average desalination rate Nv decreased with increasing soil depth in the 0–70 cm horizontal distance (Figure 6). Among the soils, the loam soil Nv value decreased the most, with an average decrease of 26.4% around the subsurface pipe compared to the surface soil. The second type of soil was sandy loam and clay loam, and the average decrease in Nv was 18.7–22.8%. The Nv of the silt loam soil decreased the least, with an average of 12.1%. When the irrigation quota was kept constant, the average decrease in Nv with initial salt contents of 1, 3, and 5 g/kg was 14.3%, 21.7%, and 24.1%, respectively. When the initial salt content of the soil was the same, Nv decreased by 17.5% to 22.3% when the irrigation quota was 80–180 mm. At a depth of 0–10 cm below the surface, the Nv of the four soil textures ranged from 12.1% to 73.8%. When the depth increased to 20 cm below the subsurface pipe, the Nv became negative, indicating salt accumulation.

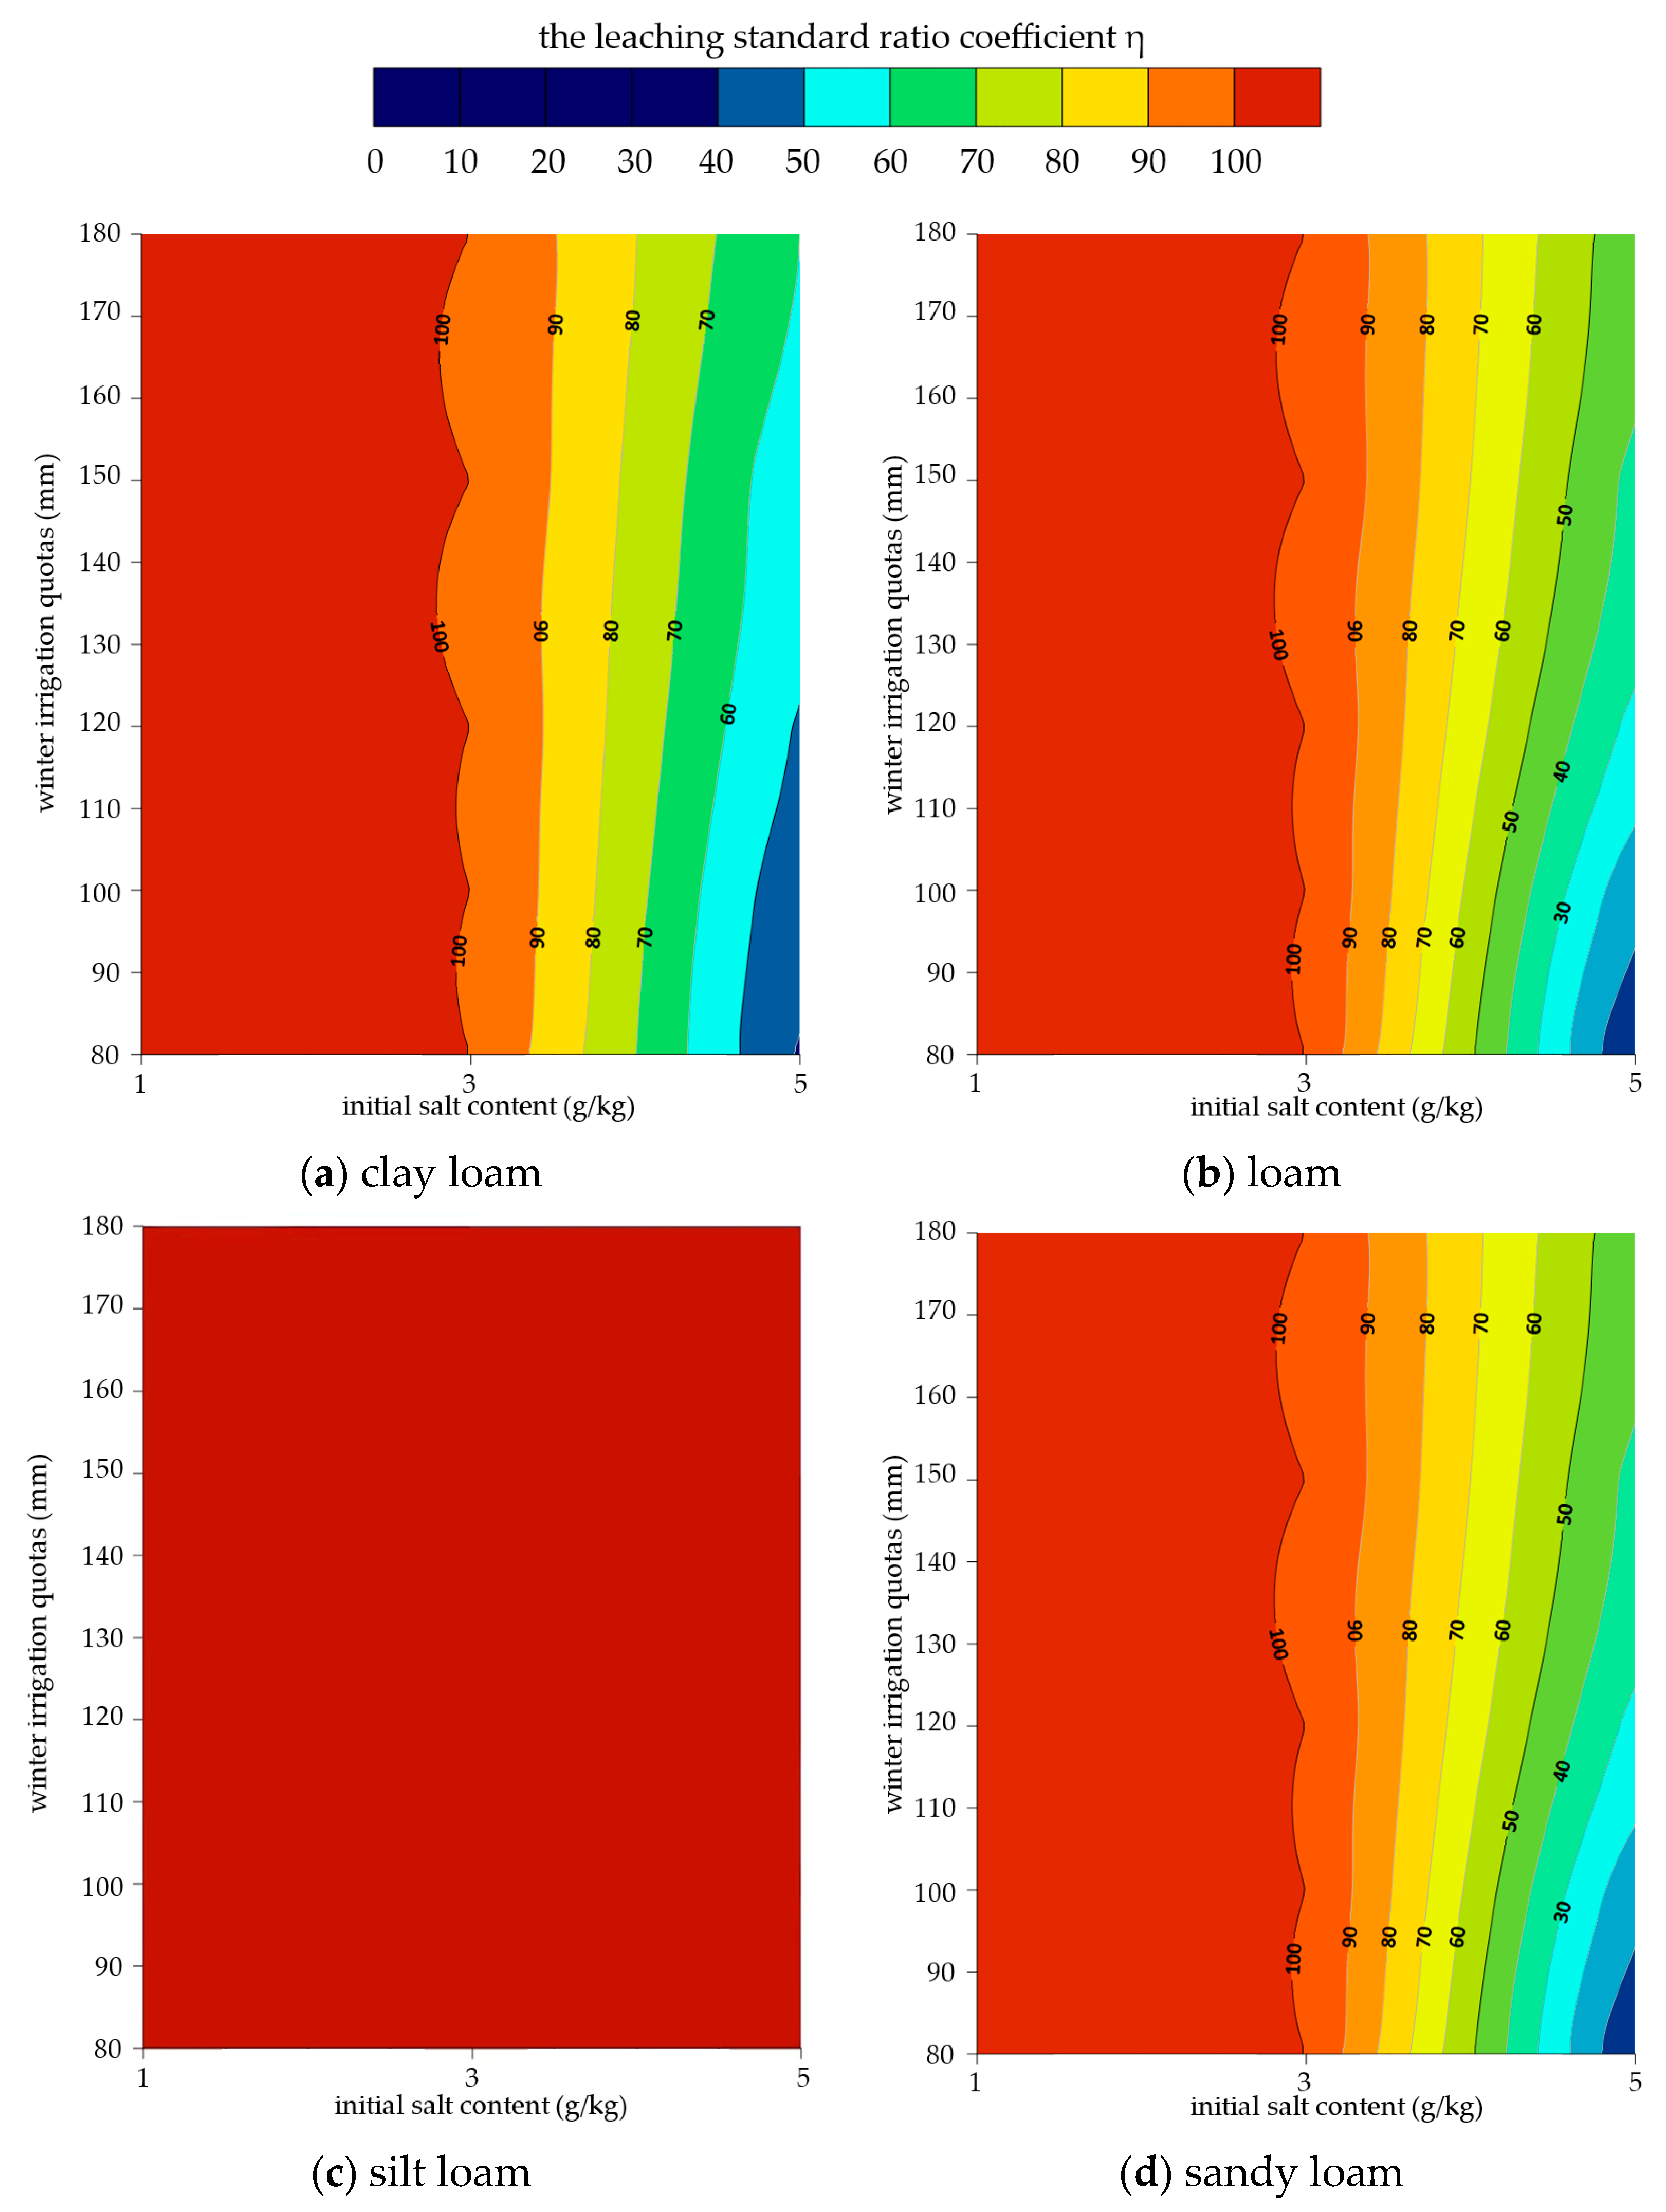
3.4. Subsurface Pipe Drainage Leaching Standard Proportion Coefficient

After irrigation, the average salt content of the soil in the root zone of sunflower and corn oil increased with increasing distance from the subsurface pipe (Figure 7 and Figure 8). The values of 1.4 g/kg and 0.7 g/kg were taken as the targets for soil salt content after irrigation from oil sunflower and corn fields, respectively. The leaching standard ratio coefficient η could be determined by calculating the ratio of the horizontal coordinate l, which corresponded to the intersection point of the curve with the target salt content line (Figure 7 and Figure 8), and dividing it by the length of the simulated area (70 cm). For example, in the case of loam soil with an initial salt content of 5 g/kg and an irrigation quota of 180 mm, the η of oil sunflower was 43.3%. This was calculated by dividing the abscissa of the intersection of the corresponding curve and the salt content target value of 1.4 g/kg, that is, 30 cm by 70 cm (Figure 7b).
For oil sunflower, when the soil texture was silt loam, the soil salt content within the control range of the subsurface pipe was less than 1.4 g/kg under all simulated conditions (initial soil salt content ≤ 5 g/kg, winter irrigation quota ≥ 80 mm), and η was 100%. When the soil initial salt content was ≤3 g/kg, a winter irrigation quota of 80 mm could reduce the salt content of clay loam, loam, and sandy loam to less than 1.4 g/kg, which fell within the control range of the subsurface pipe. However, when the initial soil salt content increased to 5 g/kg, the η of oil sunflower reached the standard and ranged from 38.5% to 60.3% for clay loam under different winter irrigation quotas. For loam and sandy loam, η was 0 when the winter irrigation quota was ≤ 80 mm, and η ranged from 12.9% to 42.5% when the winter irrigation quota was ≥100 mm (Figure 9).
For corn, when the initial soil salt content was ≤1 g/kg and the winter irrigation quota was ≥80 mm, the soil salt content with the use of a subsurface pipe was less than 0.7 g/kg in all four soil types. When the initial soil salt content was ≥3 g/kg and the winter irrigation quota was ≤180 mm, the soil salt content within the control range of the subsurface pipe could not be less than 0.7 g/kg in clay loam, loam, and sandy loam. However, in the case of silt loam, the range of η varied from 39.2% to 100% (Figure 10).

3.5. The Appropriate Amount of Water for Flushing in Subsurface Pipe Drainage

Based on Figure 7, Figure 8, Figure 9 and Figure 10, the soil conditions and winter irrigation quotas suitable for oil sunflower and corn planting were proposed from the perspective of soil salinity in the root zone of crops, with the limiting conditions being no significant reduction in crop yield (η ≥ 80%) and no more than 120 mm of winter irrigation (Table 5) [36]. When the initial soil salt content was 1 g/kg, all four soil types were found to be suitable for planting oil sunflower and corn after the use of 80 mm of irrigation. When the initial soil salt content was 3 g/kg, the η of corn was more than 80% in the silty loam, with winter irrigation quotas ≥ 120 mm. However, in the other soil types, even when the winter irrigation quota ≥ 180 mm, η remained at 0. On the other hand, for oil sunflower, using 80 mm of winter irrigation resulted in a corresponding η of 100% for all four types of soil. When the initial soil salt content was 5 g/kg, the η of corn was mostly less than 40%. For oil sunflower, except for silty loam, η was less than 60%. After considering two factors, i.e., stable crop yield and water conservation, the authors of this study concluded that soil with a salt content of 1 g/kg is suitable for planting oil sunflower and corn. Soil with a salt content of 3 g/kg is suitable for oil sunflower planting, while soil with a salt content of 5 g/kg is not suitable for planting oil sunflower or corn.

4. Discussion

SPD has a clear effect on the reduction of groundwater levels, deepening the soil salt desalination layer, and improving desalination. Coupled with its advantages such as small footprint and ease of mechanized operations, SPD has gradually been promoted in the Yinbei Irrigation District of Ningxia [15,16]. Many scholars have conducted experimental studies on drainage efficiency, the layout factors of buried pipes (such as burial depth and distance) [15,24,52], and outer cladding materials and structures [17,26,43]. Some researchers have utilized the HYDRUS-2D software to simulate the movement of soil water and salt under SPD [41,53]. The authors of this study comprehensively consider the factors affecting crop yield stability and efficient utilization of winter irrigation quotas and utilize a combination of soil tank tests and HYDRUS-2D simulations to propose an optimal combination scheme for soil texture, initial salt content, and winter irrigation quotas for the growth of oil sunflower and corn, taking into account soil salinity.

4.1. Desalination Rate of Soil above the Subsurface Pipe after Irrigation

The higher the soil desalination rate (Nu) above a subsurface pipe, the lower the soil salt content after winter irrigation, and this results in a more favorable crop growth environment. In this study, when the initial soil salt content was 5 g/kg and the winter irrigation quota was 180 mm, the salt content reduction in silty loam was 80%. In a study by Chen et al. [42], the Nu of similar treatments was only 48%. The main reason for this difference was that the diameter of the subsurface pipe and the thickness of the soil layer above and below the subsurface pipe varied in the soil tank test in this study. The soil layer thickness above the subsurface pipe in the previous study was 50 cm, which was three times greater than that in this study (15 cm). Therefore, Nu was 32% lower than that in this study at similar winter irrigation quotas and water layer thicknesses.
Compared to loam and sandy loam, the infiltration rate of water is slower in clay loam and silty loam. This allows for the water to have sufficient time to dissolve and convey soluble salts to the soil. As a result, the Nu values of clay loam and silty loam were higher than those of loam and sandy loam. When the winter irrigation quota was increased from 80 mm to 120 mm, Nu increased by 1.3% for every 10 mm increase in the irrigation quota. However, as the soluble salt remaining in the soil decreased, when the winter irrigation quotas increased to 180 mm, Nu only increased by 0.7% for every 10 mm increase in the irrigation quota. Similar results were also found in a study conducted by Li et al. [54]. When the winter irrigation quota exceeded 100 mm, Nu began to stabilize, and additional winter irrigation quotas contributed less to desalination.
This study also revealed that Nu increased with increasing initial soil salt content, but the rate of increase gradually decreased. When the initial soil salt content increased from 1 g/kg to 3 g/kg, the average Nu increased from 39% to 59%, a 20% increase. However, when the salt content increased to 5 g/kg, Nu increased from 59% to 63%, a 4% increase. Because the solubility of salt in the irrigation water was limited, an increase in the initial salt content from 1 g/kg to 3 g/kg resulted in a higher proportion of salt that could be dissolved in water, leading to a significant increase in Nu. However, as the initial salt content continued to increase to 5 g/kg, the salt in the irrigation water gradually tended to become saturated, and its solubility decreased, leading to a smaller increase in Nu [55].

4.2. Spatial Distribution of Soil Desalination Rate after Irrigation

In the horizontal direction, the soil desalination rate of different treatments decreased with increasing distance from the subsurface pipe. As the distance from the subsurface pipe increased, the soil hydrodynamic conditions deteriorated, and the ability of soil water to carry salt became poorer [19,56]. Therefore, the soil desalination rate decreased from 57% above the subsurface pipe to 44% at the farthest point from the subsurface pipe. In the research of Dou et al., when 225 mm of winter irrigation quota was used, the soil desalination rate decreased from 56% directly above the subsurface pipe to 50% at 10 m from the subsurface pipe [57].
During the winter irrigation process, most of the soil salt above the subsurface pipe was discharged from the pipe, and a small part was transported to the bottom of the subsurface pipe. However, the salt obtained from the upper soil within a certain range below the subsurface pipe was less than the salt transported from this layer to the deeper layer. Therefore, the soil desalination rate at 0–10 cm below the subsurface pipe was greater than 0 in this study. Heng et al. found that when the burial depth of a subsurface pipe was 0.6 m, the soil layer at 1 m below the subsurface pipe showed desalination. Compared to the pre-irrigation conditions during the growth of oil sunflower, the soil salinity at 20 cm below the subsurface pipe after two irrigation events could experience a reduction from 25 g/kg to 21 g/kg [25]. Qia et al. also found a similar phenomenon in Xinjiang, China: when the burial depth of a subsurface pipe was 0.8–1.4 m, desalination occurred within a certain range of soil below the subsurface pipe [23].
In this study, it was found that the depth of the soil layer where salt accumulation occurred with subsurface pipes in silty loam and clay loam was deeper than that of loam and sandy loam, a phenomenon which is consistent with the results of Wang and Tian, who found that groundwater evaporation is related to the size of pores between soil particles. The size of pores between loam and sandy loam is large, the capillary action is strong, the water rising speed is fast, the rate of groundwater evaporation is high, and the soil salt release is strong. While the size of pores between silty loam and clay loam is small, exceeding the capillary range, capillary action is not strong, and the soil does not easily release salt [58,59].

4.3. Suitable Winter Irrigation Quotas under Different Saline–Alkali Degree and Soil Texture Conditions

During an academic seminar on the improvement of saline–alkali soil in the seven provinces of Northwest China, the Chinese Soil Society proposed that it is suitable to cultivate major crops, such as oil sunflower, in saline–alkali soil areas [60]. Li et al. found that planting different crops on saline–alkali soil could reduce the soil pH and total salt content in all plants. However, the cultivation of oil sunflower resulted in a significant increase in the number of nitrifying and denitrifying bacteria and fungi in soil compared to other crops [14]. This finding suggests that oil sunflower benefits saline–alkali soils. Gao planted oil sunflower and corn in moderately saline soil and concluded that the average annual income from oil sunflower was 5577 yuan/hm2, which was twice that of corn. Additionally, the soil pH value of the oil sunflower plot decreased from 9.3 to 8.6 after harvest, which was twice the decrease observed in the corn plot. Furthermore, the total salt content decreased from 3.2 g/kg to 2.5 g/kg in the oil sunflower plot, which was three times the decrease observed in the corn plot [61].
This study showed that for moderate saline–alkali soil, when the winter irrigation quota was 120 mm, the proportion of land area with soil salt content higher than the target salt content (0.7 g/kg) for the corn planting plot after irrigation (η) was greater than 20%. In practice, a planting regime involving the intercropping of corn with oil sunflower can be adopted. This approach can maximize the utilization of land resources.
For the silty loam soil in Table 5, the oil sunflower η is higher than 80% in three of the saline–alkali soil types under all winter irrigation quotas. Increasing the spacing of subsurface pipes can be considered to reduce project investment and minimize the winter irrigation quotas, thereby helping local governments conserve water resources. However, for heavily salinized clay loam, loam, and sandy loam soil types, more than 20% of the plots have a soil salt content higher than the target value (1.4 g/kg), even when the winter irrigation quota is 180 mm. This situation requires engineering measures such as reducing the distance and burial depth of subsurface pipes to improve drainage and salt removal efficiency [15,21] or applying chemical measures such as desulfurized gypsum and biochar to reduce soil salinity [12,13].

5. Conclusions and Suggestions

(1)
The normalized root mean square error (nRMSE) between the simulated value and the measured value above the subsurface pipe is less than 20%, and the nRMSE below the subsurface pipe is less than 25%.
(2)
The soil desalination rate above the subsurface pipe increased with the initial soil salt content and the winter irrigation quota, but the rate of increase gradually decreased. The soil desalination of clay loam and silty loam with small soil particle gap is better than that of loam and sandy loam. The soil desalination rate decreases as the distance from the subsurface pipe increases, and it also decreases with increasing soil depth. There is desalination occurring in the soil from 0–10 cm below the subsurface pipe, and salt accumulation occurs at 20–25 cm below the subsurface pipe.
(3)
Taking into account factors such as crop salt tolerance threshold and standard leaching ratio coefficient η, the four soil types with mild salinization (salt content ≤ 3 g/kg) are suitable for the planting of corn, and the recommended winter irrigation quota is 80 mm. The silty loam with severe salinization (salt content ≥ 5 g/kg) is suitable for the planting of oil sunflower, and the recommended winter irrigation quota is 80 mm. For the four soil types with moderate salinization (salt content of 3–5 g/kg), the planting mode of oil sunflower–corn intercropping is recommended, and the recommended winter irrigation quota is 120 mm.
(4)
For loam, sandy loam, and clay loam with severe salinization (salt content ≥ 5 g/kg), it is suggested to increase other measures to reduce soil salt content, such as reducing the spacing and burial depth of subsurface pipes, applying desulfurization gypsum and biochar, and deep tillage.

Author Contributions

Conceptualization, S.W. and Y.M.; methodology, J.L.; software, S.W.; validation, Y.M. and J.X.; formal analysis, S.W.; investigation, X.L.; data curation, Y.M.; writing—original draft preparation, S.W. and Y.M.; writing—review and editing, Y.M. and J.L.; supervision, J.X. All authors have read and agreed to the published version of the manuscript.

Funding

This research was funded by the National Key Research and Development Program of China (2021YFD1900600), the Research and Development Support Program of China Institute of Water Resources and Hydropower Research (ID0145B042021), the Research Project Supported by Shanxi Scholarship Council of China (2023-051), the Basic Research Project of Shanxi Province (201901D111059).

Data Availability Statement

The authors state that all data generated or analyzed during this study are included in this article. The full data used to support the findings of this study are available from the corresponding author upon request.

Conflicts of Interest

The authors declare no conflict of interest.

References

  1. Chen, J. Analysis of regional coordinated development in Ningxia. China Natl. Cond. Natl. Strength 2021, 5, 64–67. (In Chinese) [Google Scholar]
  2. Guo, J.; Wang, M.; Geng, R.; Li, X.; Yin, X.; Wei, G. Analysis on salinization characteristics of saline-alkali land in Yinbei irrigation area of Ningxia. Chin. Agric. Sci. Bull. 2021, 37, 38–42. (In Chinese) [Google Scholar]
  3. Tan, P.; Wang, S.; Fu, T.; Liu, J.; Han, L. Development history, current situation and prospect of subsurface pipe drainage technology in China. Chin. J. Eco-Agric. 2021, 29, 633–639. (In Chinese) [Google Scholar]
  4. Wang, S.; Li, Y.; Tao, Y.; Li, J.; Tian, J. Solar photovoltaic subsurface pipe drainage system capacity improvement. Agric. Eng. 2022, 38, 99–104. (In Chinese) [Google Scholar]
  5. Liu, H.; Ju, W.; Shao, M.; Hou, L. Investigation of Salt and Nitrogen Distribution under Belt Plastic Film Mulching in Surface-and Drip-Irrigated Maize Field in Hetao Irrigation District. Water 2023, 15, 2755. [Google Scholar] [CrossRef]
  6. Yasmeen, R.; Hao, G.; Ye, Y.; Shah, W.U.H.; Tang, C. The Synergy of Water Resource Agglomeration and Innovative Conservation Technologies on Provincial and Regional Water Usage Efficiency in China: A Super SBM-DEA Approach. Water 2023, 15, 3524. [Google Scholar] [CrossRef]
  7. Chen, S.; Jiang, G. Ecosystem Service Value Response to Different Irrigation and Drainage Practices in a Land Development Project in the Yellow River Delta. Water 2022, 14, 2985. [Google Scholar] [CrossRef]
  8. Liu, J.; Huang, Q.; Li, Z.; Liu, N.; Li, J.; Huang, G. Effect of Autumn Irrigation on Salt Leaching under Subsurface Drainage in an Arid Irrigation District. Water 2023, 15, 2296. [Google Scholar] [CrossRef]
  9. Xu, J.; Wang, Y.; Chen, Y.; He, W.; Li, X.; Cui, J. Identifying the Influencing Factors of Plastic Film Mulching on Improving the Yield and Water Use Efficiency of Potato in the Northwest China. Water 2023, 15, 2279. [Google Scholar] [CrossRef]
  10. Yao, R.; Gao, Q.; Liu, Y.; Li, H.; Yang, J.; Bai, Y.; Zhu, H.; Wang, X.; Xie, W.; Zhang, X. Deep vertical rotary tillage mitigates salinization hazards and shifts microbial community structure in salt-affected anthropogenic-alluvial soil. Soil Tillage Res. 2023, 227, 105627. [Google Scholar] [CrossRef]
  11. Shen, Q.; Yang, J. Effects of different improvement models on alkaline soil properties and wolfberry yield under drip irrigation conditions. Jiangsu J. Agric. Sci. 2020, 36, 343–349. (In Chinese) [Google Scholar]
  12. Zhao, Y.; Wang, S.; Li, Y.; Liu, J.; Zhuo, Y.; Zhang, W.; Wang, J.; Xu, L. Long-term performance of flue gas desulfurization gypsum in a large-scale application in a saline-alkali wasteland in northwest China. Agric. Ecosyst. Environ. 2018, 261, 115–124. [Google Scholar] [CrossRef]
  13. Liang, J.; Shi, W. Cotton/halophytes intercropping decreases salt accumulation and improves soil physicochemical properties and crop productivity in saline-alkali soils under mulched drip irrigation: A three-year field experiment. Field Crops Res. 2021, 262, 108027. [Google Scholar] [CrossRef]
  14. Li, F.; Guo, Y.; Wang, Z.; Mu, Y. Influence of different phytoremediation on soil microbial diversity and community composition in saline-alkaline land. Int. J. Phytoremediat. 2022, 24, 507–517. [Google Scholar] [CrossRef] [PubMed]
  15. Feng, G.; Zhang, Z.; Wan, C.; Lu, P.; Ahmad, B. Effects of saline water irrigation on soil salinity and yield of summer corn (Zea mays L.) in subsurface drainage system. Agric. Water Manag. 2017, 193, 205–213. [Google Scholar] [CrossRef]
  16. Tiwari, P.; Goel, A. An overview of impact of subsurface drainage project studies on salinity management in developing countries. Appl. Water Sci. 2017, 7, 569–580. [Google Scholar] [CrossRef]
  17. Ren, X.; Wang, S.; Yang, P.; Tao, Y. Simulation test on subsurface drainage effect of different drainage measures in farmland. J. Drain. Irrig. Mach. Eng. 2023, 41, 253–260. (In Chinese) [Google Scholar]
  18. Zhuang, X.; Feng, S.; Yu, H.; Yuan, C.; Qian, C. SWAP model simulates soil water and salt transport under subsurface drainage conditions. J. Irrig. Drain. 2020, 39, 93–101. (In Chinese) [Google Scholar]
  19. Zhang, L.; Jiao, P.; Dong, Q.; Tao, Y. The effects of subsurface pipe spacing and buried depth on the change of water and salt transport in the field. J. Irrig. Drain. 2023, 42, 1–10. (In Chinese) [Google Scholar]
  20. Lazarovitch, N.; Šimůnek, J.; Shani, U. System-dependent boundary condition for water flow from subsurface source. Soil Sci. Soc. Am. J. 2005, 69, 46–50. [Google Scholar] [CrossRef]
  21. Wang, Z.; Heng, T.; Li, W.; Zhang, J.; Yang, B. The effect of drainage pipe spacing on soil salt leaching under drip irrigation conditions. Agric. Mach. 2017, 48, 253–261. (In Chinese) [Google Scholar]
  22. Zhao, Y. The effect of drainage pipe spacing on the desalination effect of saline soil leaching in Yinbei area of Ningxia. Theor. Res. Urban Constr. 2014, 4, 1403–1404. (In Chinese) [Google Scholar]
  23. Qian, Y.; Zhu, Y.; Huang, J.; Wu, J.; Ao, C.; He, S. Study on the key parameters of the optimal layout of the salt drainage pipe in the arid area. Agric. Eng. 2021, 37, 117–126. (In Chinese) [Google Scholar]
  24. Qian, Y.; Zhu, Y.; Ye, M.; Huang, J.; Wu, J. Experiment and numerical simulation for designing layout parameters of subsurface drainage pipes in arid agricultural areas. Agric. Water Manag. 2021, 243, 106455. [Google Scholar] [CrossRef]
  25. Heng, T.; Wang, Z.; Li, W.; Zhang, J.; Yang, B. The effect of buried depth and diameter of drainage pipe on soil salinity under drip irrigation. Acta Pedol. Sin. 2018, 55, 111–121. (In Chinese) [Google Scholar]
  26. Wang, W.; Yang, S.; Hu, L.; Zhang, W. Effect of outsourcing filter material on subsurface pipe drainage and soil desalination. J. Drain. Irrig. Mach. Eng. 2023, 41, 425–432. (In Chinese) [Google Scholar]
  27. Kanzari, S.; Daghari, I.; Šimůnek, J.; Younes, A.; Ilahy, R.; Mariem, S.B.; Rezig, M.; Nouna, B.B.; Bahrouni, H.; Abdallah, M. Simulation of water and salt dynamics in the soil profile in the semi-arid region of Tunisia—Evaluation of the irrigation method for a tomato crop. Water 2020, 12, 1594. [Google Scholar] [CrossRef]
  28. Tian, H.; Bo, L.; Mao, X.; Liu, X.; Wang, Y.; Hu, Q. Modelling soil water, salt and heat dynamics under partially mulched conditions with drip irrigation, using HYDRUS-2D. Water 2022, 14, 2791. [Google Scholar] [CrossRef]
  29. Xiao, Y.; Sun, C.; Wang, D.; Li, H.; Guo, W. Analysis of Hotspots in Subsurface Drip Irrigation Research Using CiteSpace. Agriculture 2023, 13, 1463. [Google Scholar] [CrossRef]
  30. Moghbel, F.; Mosaedi, A.; Aguilar, J.; Ghahraman, B.; Ansari, H.; Maria, C. Bayesian Calibration and Uncertainty Assessment of HYDRUS-1D Model Using GLUE Algorithm for Simulating Corn Root Zone Salinity under Linear Move Sprinkle Irrigation System. Water 2022, 14, 4003. [Google Scholar] [CrossRef]
  31. Liu, Y.; Ao, C.; Zeng, W.; Amit, K.; Thomas, G.; Wu, J.; Huang, J. Simulating water and salt transport in subsurface pipe drainage systems with HYDRUS-2D. J. Hydrol. 2021, 592, 125823. [Google Scholar] [CrossRef]
  32. Zhang, K.; Burns, G.; Greenwood, J.; Hammond, P.; White, P. Developing a reliable strategy to infer the effective soil hydraulic properties from field evaporation experiments for agro-hydrological models. Agric. Water Manag. 2010, 3, 399–409. [Google Scholar] [CrossRef]
  33. Nakhaei, M.; Šimůnek, J. Parameter estimation of soil hydraulic and thermal property functions for unsaturated porous media using the HYDRUS-2D code. J. Hydrol. Hydromech. 2014, 1, 7–15. [Google Scholar] [CrossRef]
  34. Zhang, J.; Zhang, X.; Liu, J.; Jin, J.; Wang, W. The characteristics of soil hydraulic parameters were analyzed by HYDRUS-2D and RETC numerical models. J. Gansu Agric. Univ. 2013, 5, 161–166. (In Chinese) [Google Scholar]
  35. Du, B.; Zhang, H.; Wang, L.; Gao, J.; Zhang, N.; Ma, X.; Zhou, L. Study on the changes of soil water and heat in the plough layer during the wintering period of different winter irrigation quotas. J. Ningxia Agric. For. Sci. Technol. 2021, 62, 30–33+2+71. (In Chinese) [Google Scholar]
  36. Jing, Q.; Liu, X. Application of subsurface pipe drainage technology and engineering effect monitoring in Yinbei Irrigation District of Ningxia. J. Irrig. Drain. 2005, 1, 45–49. (In Chinese) [Google Scholar]
  37. Luo, Y.; Jiang, X.; Cao, H.; Bian, Y. Study on suitable autumn irrigation quota in Yellow River irrigation area of Inner Mongolia. J. Water Resour. Water Eng. 2012, 23, 131–134. (In Chinese) [Google Scholar]
  38. Luo, Y.; Jiang, X.; Bian, Y.; Yang, X. Analysis of the influence of autumn irrigation quota on soil salt change. J. Water Resour. Water Eng. 2010, 21, 118–123. (In Chinese) [Google Scholar]
  39. Ramos, T.; Liu, M.; Paredes, P.; Shi, H.; Feng, Z.; Lei, H.; Pereira, L. Salts dynamics in corn irrigation in the Hetao plateau using static water table lysimeters and HYDRUS-1D with focus on the autumn leaching irrigation. Agric. Water Manag. 2023, 283, 108306. [Google Scholar] [CrossRef]
  40. Wang, Y.; Tian, S.; Zuo, Z. Study on desalination effect of subsurface pipe drainage for saline-alkali land improvement in Ningxia. J. Ningxia Univ. 2021, 42, 456–462. (In Chinese) [Google Scholar]
  41. Liu, H.; Bai, Z.; Li, K. Based on the HYDRUS-2D model, the change of soil salinity in cotton field with subsurface pipe drainage under mulched drip irrigation was studied. Agric. Eng. 2021, 37, 130–141. (In Chinese) [Google Scholar]
  42. Chen, M.; Huang, J.; Zeng, W.; Ao, C.; Liu, D.; Liu, Y. The law of water and salt migration under the condition of salt discharge in the buried pipe of the outer geotextile. Agric. Eng. 2020, 36, 130–139. (In Chinese) [Google Scholar]
  43. Qin, W.; Li, M.; Li, Y.; Liu, H. The effect of subsurface pipe filter structure on drainage and salt discharge under drip irrigation. J. Irrig. Drain. 2017, 36, 80–85. (In Chinese) [Google Scholar]
  44. Yang, Y.; Zhou, X.; Li, D.; Ji, Q. Effect of subsurface pipe drainage on salt leaching in cotton field under high water level mulched drip irrigation in southern Xinjiang. J. Irrig. Drain. 2021, 40, 137–144. (In Chinese) [Google Scholar]
  45. Dou, X.; Shi, H.; Li, R.; Miao, Q.; Yan, J.; Tian, F.; Wang, B. Simulation and evaluation of soil water and salt transport under controlled subsurface drainage using HYDRUS-2D model. Agric. Water Manag. 2022, 273, 107899. [Google Scholar] [CrossRef]
  46. Rezayati, S.; Khaledian, M.; Razavipour, T.; Rezaei, M. Water flow and nitrate transfer simulations in rice cultivation under different irrigation and nitrogen fertilizer application managements by HYDRUS-2D model. Irrig. Sci. 2020, 38, 353–363. [Google Scholar] [CrossRef]
  47. Wang, X.; Sun, Z.; Han, L.; Ma, F.; Wang, F.; He, J. Gravel subsurface pipe improves the effect of desulfurized gypsum on improving cracked alkaline soil and oil sunflower yield. Agric. Eng. 2017, 33, 143–151. (In Chinese) [Google Scholar]
  48. Yang, J.; Du, J.; Ma, X.; Jing, H.; Sun, Z. Study on the effects of different groundwater depths on water and salt migration and oil sunflower yield in cracked alkaline soil. China Rural. Water Hydropower 2023, 10, 1–13. (In Chinese) [Google Scholar]
  49. Zeng, Y. Effects of Buried Depth of Subsurface Pipe and Irrigation Quota on Water and Salt Distribution and Oil Sunflower Growth in Low-Lying Saline-Alkali Land. Master’s Thesis, Ningxia University, Yinchuan, China, 2022. (In Chinese). [Google Scholar]
  50. Zhang, S.; Tian, J. Effect of solar subsurface pipe drainage on improving saline-alkali land and water production efficiency. J. Ningxia Univ. 2018, 39, 181–186. (In Chinese) [Google Scholar]
  51. Han, B.; Tian, J.; Yang, J. Effects of irrigation on film on soil water and salt change characteristics in corn field. J. Soil Water Conserv. 2015, 29, 252–257. (In Chinese) [Google Scholar]
  52. Ghane, E. Choice of pipe material influences drain spacing and system cost in subsurface drainage design. Appl. Eng. Agric. 2022, 38, 685–695. [Google Scholar] [CrossRef]
  53. Provenzano, G. Using HYDRUS-2D simulation model to evaluate wetted soil volume in subsurface drip irrigation systems. J. Irrig. Drain. Eng. 2007, 133, 342–349. [Google Scholar] [CrossRef]
  54. Li, Q.; Kong, F.; Xi, M.; Li, Y. Leaching law of soil salinity in aquaculture ponds in Jiaozhou Bay under different leaching water amounts. Chin. J. Ecol. 2018, 37, 1127–1134. (In Chinese) [Google Scholar]
  55. Dou, X.; Shi, H.; Li, R.; Miao, Q.; Tian, F.; Yu, D.; Zhou, L. Effectiveness evaluation of subsurface pipe drainage and salt control on soil salt leaching in salinized irrigation area. J. Irrig. Drain. 2020, 39, 102–110. (In Chinese) [Google Scholar]
  56. Youngs, E.; Leeds-Harrison, P. Improving efficiency of desalinization with subsurface drainage. J. Irrig. Drain. Eng. 2000, 126, 375–380. [Google Scholar] [CrossRef]
  57. Dou, X.; Shi, H.; Li, R.; Miao, Q.; Tian, F.; Yu, D. Effect of spring irrigation quota on soil water and salt transport under subsurface drainage conditions. Agric. Mach. 2020, 51, 318–328. (In Chinese) [Google Scholar]
  58. Wang, X. Causes, problems and improvement measures of cultivated land salinization in Zhanhua District, Binzhou City, Shandong Province. Agric. Eng. Technol. 2019, 39, 39+41. (In Chinese) [Google Scholar]
  59. Tian, C.; Li, Z.; Lin, Z. Effect of crop drainage on inhibition of soil salinization. Soil Fertil. Sci. China 1997, 3, 29–30. (In Chinese) [Google Scholar]
  60. Symposium on Saline-Alkali Soil Improvement in Seven Provinces (Regions) of Northwest China Soil Society. Some suggestions on the prevention and control of soil salinization in the Yellow River irrigation area of Ningxia. J. Ningxia Agric. For. Sci. Technol. 1984, 5, 1–2. (In Chinese) [Google Scholar]
  61. Gao, H. Experimental Study on Crop Cultivation in Saline-alkali Land in Northern Shaanxi—Taking the Saline-alkali Land Development Project of Xiaotanzi Village, Duiziliang Town, Dingbian County as an Example. West China Dev. 2019, 4, 60–64. (In Chinese) [Google Scholar]
Figure 1. Subsurface pipe drainage soil tank test device diagram.
Water 16 00072 g001
Figure 2. Model simulates boundary conditions and observation points.
Water 16 00072 g002
Figure 3. Comparison of measured values and simulated values of soil salinity under various soil textures, initial soil salinity levels, and winter irrigation quotas. Notes: The green part indicates the area above the subsurface pipe; the red part indicates the area under the subsurface pipe.
Water 16 00072 g003aWater 16 00072 g003b
Figure 4. Desalination rate of soil above the subsurface pipe (Nu).
Water 16 00072 g004
Figure 5. The average desalination rate Nh of 0–15 cm soil depth changed with the horizontal distance from the subsurface pipe.
Water 16 00072 g005
Figure 6. The curve of average soil desalination rate Nv with depth in 0–70 cm horizontal direction.
Water 16 00072 g006
Figure 7. The change rule of soil salt content in oil sunflower root zone (0–40 cm).
Water 16 00072 g007
Figure 8. The change rule of soil salt content in corn root zone (0–80 cm).
Water 16 00072 g008
Figure 9. Changes in oil sunflower η with soil initial salt content and winter irrigation quotas.
Water 16 00072 g009
Figure 10. Changes in corn η with soil initial salt content and winter irrigation quotas.
Water 16 00072 g010
Table 1. Test treatment of subsurface pipe drainage soil tank.
Test TreatmentSoil TextureSoil Salt (g/kg)Irrigation Capacity (mm)
S1.7W100Loam1.7100
S1.7W120Loam1.7120
S1.7W150Loam1.7150
S2.5W100Silt loam2.5100
S2.5W120Silt loam2.5120
S2.5W150Silt loam2.5150
Table 2. Soil hydraulic characteristic parameters.
Soil TextureParticles Content (%) θ r θ s α
(1/cm)
n K s (cm/h) l D L (cm) D T (cm) D W
(cm2/h)
ClaySiltSand
Loam1546390.0540.390.0181.462.280.5930.06
Silt loam1861210.0650.390.0531.362.130.5630.06
Table 3. Subsurface pipe drainage simulation test design.
Soil TextureInitial Soil Salt Content (g/kg)Irrigation Capacity (mm)
80100120150180
clay loam1CS1W80CS1W100CS1W120CS1W150CS1W180
3CS3W80CS3W100CS3W120CS3W150CS3W180
5CS5W80CS5W100CS5W120CS5W150CS5W180
loam1LS1W80LS1W100LS1W120LS1W150LS1W180
3LS3W80LS3W100LS3W120LS3W150LS3W180
5LS5W80LS5W100LS5W120LS5W150LS5W180
silt loam1sS1W80sS1W100sS1W120sS1W150sS1W180
3sS3W80sS3W100sS3W120sS3W150sS3W180
5sS5W80sS5W100sS5W120sS5W150sS5W180
sandy loam1SS1W80SS1W100SS1W120SS1W150SS1W180
3SS3W80SS3W100SS3W120SS3W150SS3W180
5SS5W80SS5W100SS5W120SS5W150SS5W180
Table 4. Verification of simulation results from HYDRUS-2D model for subsurface drainage.
Sample LocationnRMSE (%)
S1.7W100S1.7W120S1.7W150S2.5W100S2.5W120S2.5W150
Above subsurface pipe
(number 1–25)
171521171713
Below subsurface pipe
(number 26–40)
142521242224
All sample
(number 1–40)
152121242324
Table 5. Suitable winter irrigation quotas for oil sunflower and corn under different soil textures and initial salt content.
CropSoil TextureInitial Salt Content (g/kg)H (%)Appropriate Irrigation Quota (mm)
Oil sunflowerClay loam1100≥80 *
3100≥80 *
5≥80-
60~80≥180 *,#
40~60≥80 #
Loam1100≥80 *
3100≥80 *
5≥60- #
40~60≥120 #
Silt loam1100≥80 *
3100≥80 *
5100≥80 *
Sandy loam1100≥80 *
3100≥80 *
5≥60- #
40~60≥120 #
CornClay loam1100≥80 *
3≥40- #
5≥40- #
Loam1100≥80 *
3≥40- #
5≥40- #
Silt loam1100≥80 *
3≥80≥120 *
40~80≥80 #
5≥80-
60~80≥180 #
40~60≥100 #
Sandy loam1100≥80 *
3≥40- #
5≥40- #
Note: “*” indicates a suitable combination for planting oil sunflowers or corn. “-” indicates a large water consumption (irrigation quotas > 120 mm), making it unsuitable for planting oil sunflowers or corn. “#” indicates a low crop yield (η < 80%), making it unsuitable for planting oil sunflowers or corn.
Disclaimer/Publisher’s Note: The statements, opinions and data contained in all publications are solely those of the individual author(s) and contributor(s) and not of MDPI and/or the editor(s). MDPI and/or the editor(s) disclaim responsibility for any injury to people or property resulting from any ideas, methods, instructions or products referred to in the content.

