Article

Evaluation of Algal Control Measures in Eutrophic Reservoirs Based on Aquatic Ecosystem Models

1
Fuzhou Research Academy of Environmental Sciences, Fuzhou 350011, China
2
Shanghai Investigation, Design & Research Institute Co., Ltd., Shanghai 200434, China
3
State Key Laboratory of Hydraulics and Mountain River Engineering, Sichuan University, Chengdu 610065, China
4
Fuzhou Environmental Monitoring Center Station, Fuzhou 350011, China
5
Danish Trade Council Water & Environment Team, Shanghai 200336, China
6
Key Laboratory of Resource Environment and Geographic Information System, Capital Normal University, Beijing 100048, China
*
Author to whom correspondence should be addressed.
Water 2024, 16(11), 1494; https://doi.org/10.3390/w16111494
Submission received: 26 April 2024 / Revised: 16 May 2024 / Accepted: 20 May 2024 / Published: 24 May 2024

Abstract

:
The frequency of freshwater cyanobacterial blooms is increasing globally due to climate change and eutrophication, particularly in reservoirs. Reservoir ecosystems exhibit unique characteristics, and there is a complex relationship between factors such as light, temperature, nutrient salts, hydrology, and algal growth. The impact of the other factors on algal growth varies significantly among different reservoirs. Thus, it is crucial to assess the effectiveness of various algal control measures implemented in different reservoirs. This study conducted a comprehensive assessment by establishing a eutrophication model for the Shanzi Reservoir in Fuzhou City. The model incorporated meteorology, hydrology, carbon dynamics, nutrient cycling, and biological communities. The effectiveness of diverse management measures was systematically evaluated. The findings demonstrate that increasing the water level, reducing nutrient salts in sediments, and implementing ecological fish stocking effectively suppressed algal growth to varying degrees and improved nitrogen and phosphorus levels. Lower water levels and ecological fish stocking had a significant impact on algal reproduction, while sediment reduction had a minimal effect. Conversely, lower water levels and ecological fish stocking did not significantly improve nitrogen and phosphorus concentrations in the reservoir, whereas sediment reduction had a noticeable effect. Consequently, the management strategies for the Shanzi Reservoir should prioritize external control measures and the implementation of ecological fish stocking.

1. Introduction

Eutrophication is a significant ecological issue facing lake and reservoir water ecosystems [1]. It is characterized by excessive plant and algal growth due to the increased availability of nutrients, such as nitrogen and phosphorus, leading to imbalanced ecosystems [2]. Human activities have accelerated eutrophication through the discharge of nutrients into aquatic ecosystems, causing dramatic consequences for water quality, fisheries, and recreational water bodies. The latest survey results from 2018 showed that 63% of the world’s lake water bodies are experiencing eutrophication, making it a global challenge. In China, the 2019 survey results showed that 69.5% of China’s lakes are in a eutrophic state, higher than the global average [3,4].
Eutrophication occurs naturally over centuries as lakes age and are filled with sediments. However, human activities have significantly accelerated this process through the discharge of nutrients into aquatic ecosystems, leading to detrimental consequences for the affected water bodies [5].
Water resource managers employ various strategies to minimize the effects of eutrophication, including the diversion of excess nutrients, altering nutrient ratios, physical mixing, and shading water bodies [6]. Additionally, sustainable management practices, such as ecological engineering and biomanipulation, have been developed to mitigate eutrophication and improve water quality in lakes and reservoirs [7].
The overabundance of nutrients, primarily nitrogen and phosphorus, in water starts a process called eutrophication. Algae feed on nutrients, leading to enhanced vegetation growth. This poses significant environmental, economic, and social threats around the world. Good monitoring practices and active management methods are essential to prevent or limit eutrophication in water bodies [8].
In the research on the mechanism of eutrophication in lakes and reservoirs and the direction of pollution control, scholars have conducted extensive and detailed studies on the evaluation of eutrophication levels, analyses of eutrophication influencing factors (nutrient salts, light, hydrology, etc.), and various physical, chemical, and biological means of algae control [6,9,10]. External factors affecting algae growth include not only physical, chemical, and biological factors such as sunlight, nutrient salts, transparency, water temperature, and pH, but also hydrodynamic conditions in the water such as flow velocity, flow rate, and water disturbance [11,12,13].
Given the complexity of eutrophication under the influence of multiple ecological environmental factors, people have used the method of establishing mathematical models to assess and manage lake eutrophication [14,15]. With the development of regression statistical models, total phosphorus mass balance models, phytoplankton mass balance models, as well as ecological dynamic models, the comprehensiveness and systematisms of lake eutrophication models have been gradually improved [16,17,18]. The complexity and multi-factor nature of the eutrophication model of lakes and reservoirs have gradually been improved, as well as the related systemic research. The model has been widely used in the control and management of water eutrophication, mainly including assessing the algal proliferation in lakes and reservoirs under different scenarios, such as changes in nitrogen and phosphorus inputs in the watershed, nitrogen and phosphorus release from sediments, and hydrodynamic changes, etc. It plays an important role in evaluating the expected effects of eutrophication control technologies in lakes [19,20,21,22].
Aquatic ecological models describe the inherent mechanisms of change between individuals or populations in aquatic ecosystems, linking hydrology, water quality, meteorology, and other factors. They are mainly used to study eutrophication, biological enrichment, and food chains in aquatic systems [23]. Modern aquatic ecosystem models take into account the interaction between multiple factors in nature and spatiotemporal changes. At present, some large-scale ecological dynamics integration models are quite mature, and some have been commercialized, such as EFDC, CE-QUAL W2, WASP, DELFT3D, AUATOX, and MIKE. EFDC, DELFT3D, and MIKE are widely used for simulating eutrophication in reservoirs. In recent years, many domestic studies have been conducted on this topic. For example, Wu et al. used the EFDC model to predict the trends in chlorophyll and algal blooms and provided the criterion for the evaluation of algal bloom levels [23,24]. Dang et al. developed a DELFT3D model and analyzed the impact of temperature, wind forcing, and nitrogen–phosphorus inputs on algal blooms, and they concluded that the simultaneous reduction in nitrogen and phosphorus is more effective in controlling algal growth [25]. Cui et al. considered the impact of hydrodynamic conditions, specifically flow velocity, on algal growth. They coupled the velocity function with the MIKE21 Ecolab model and obtained simulation results that were more consistent with observations. The optimal flow velocity for algal growth within the pond was determined to be 0.055 m per second [26].
Comparing these mainstream models, each has its own strengths. The Ecolab module in the MIKE model allows researchers to freely add the processes of phytoplankton and zooplankton growth, as well as interactions with light, temperature, and nutrients based on personal experience and understanding [27]. It possesses good modifiability and expandability, making it advantageous for exploring the effects of different environmental factors on algal growth [28].
This study aims to develop a lake and reservoir aquatic ecological model based on the ecological cycle mechanism [29,30,31,32], using MIKE Ecolab as the development foundation and comprehensively considering all relevant factors. The focus will be on incorporating the nodes of aquatic organisms and microorganisms within the water ecological model, simulating the complete life cycle of algae, and ultimately developing a risk assessment and early warning system for algal blooms under the control of various ecological factors in lake reservoirs [33]. This system will serve as a predictive tool to evaluate the expected effects of various algal control technologies. Analyzing and validating the application of biological, chemical, and physical technologies to control oxygen, nitrogen, and phosphorus in lake reservoirs is crucial for the effective prevention and control of algal reproduction [34,35,36,37]. This research holds significant importance for the sustainable and healthy development of the ecological environment of lakes.

2. Materials and Methods

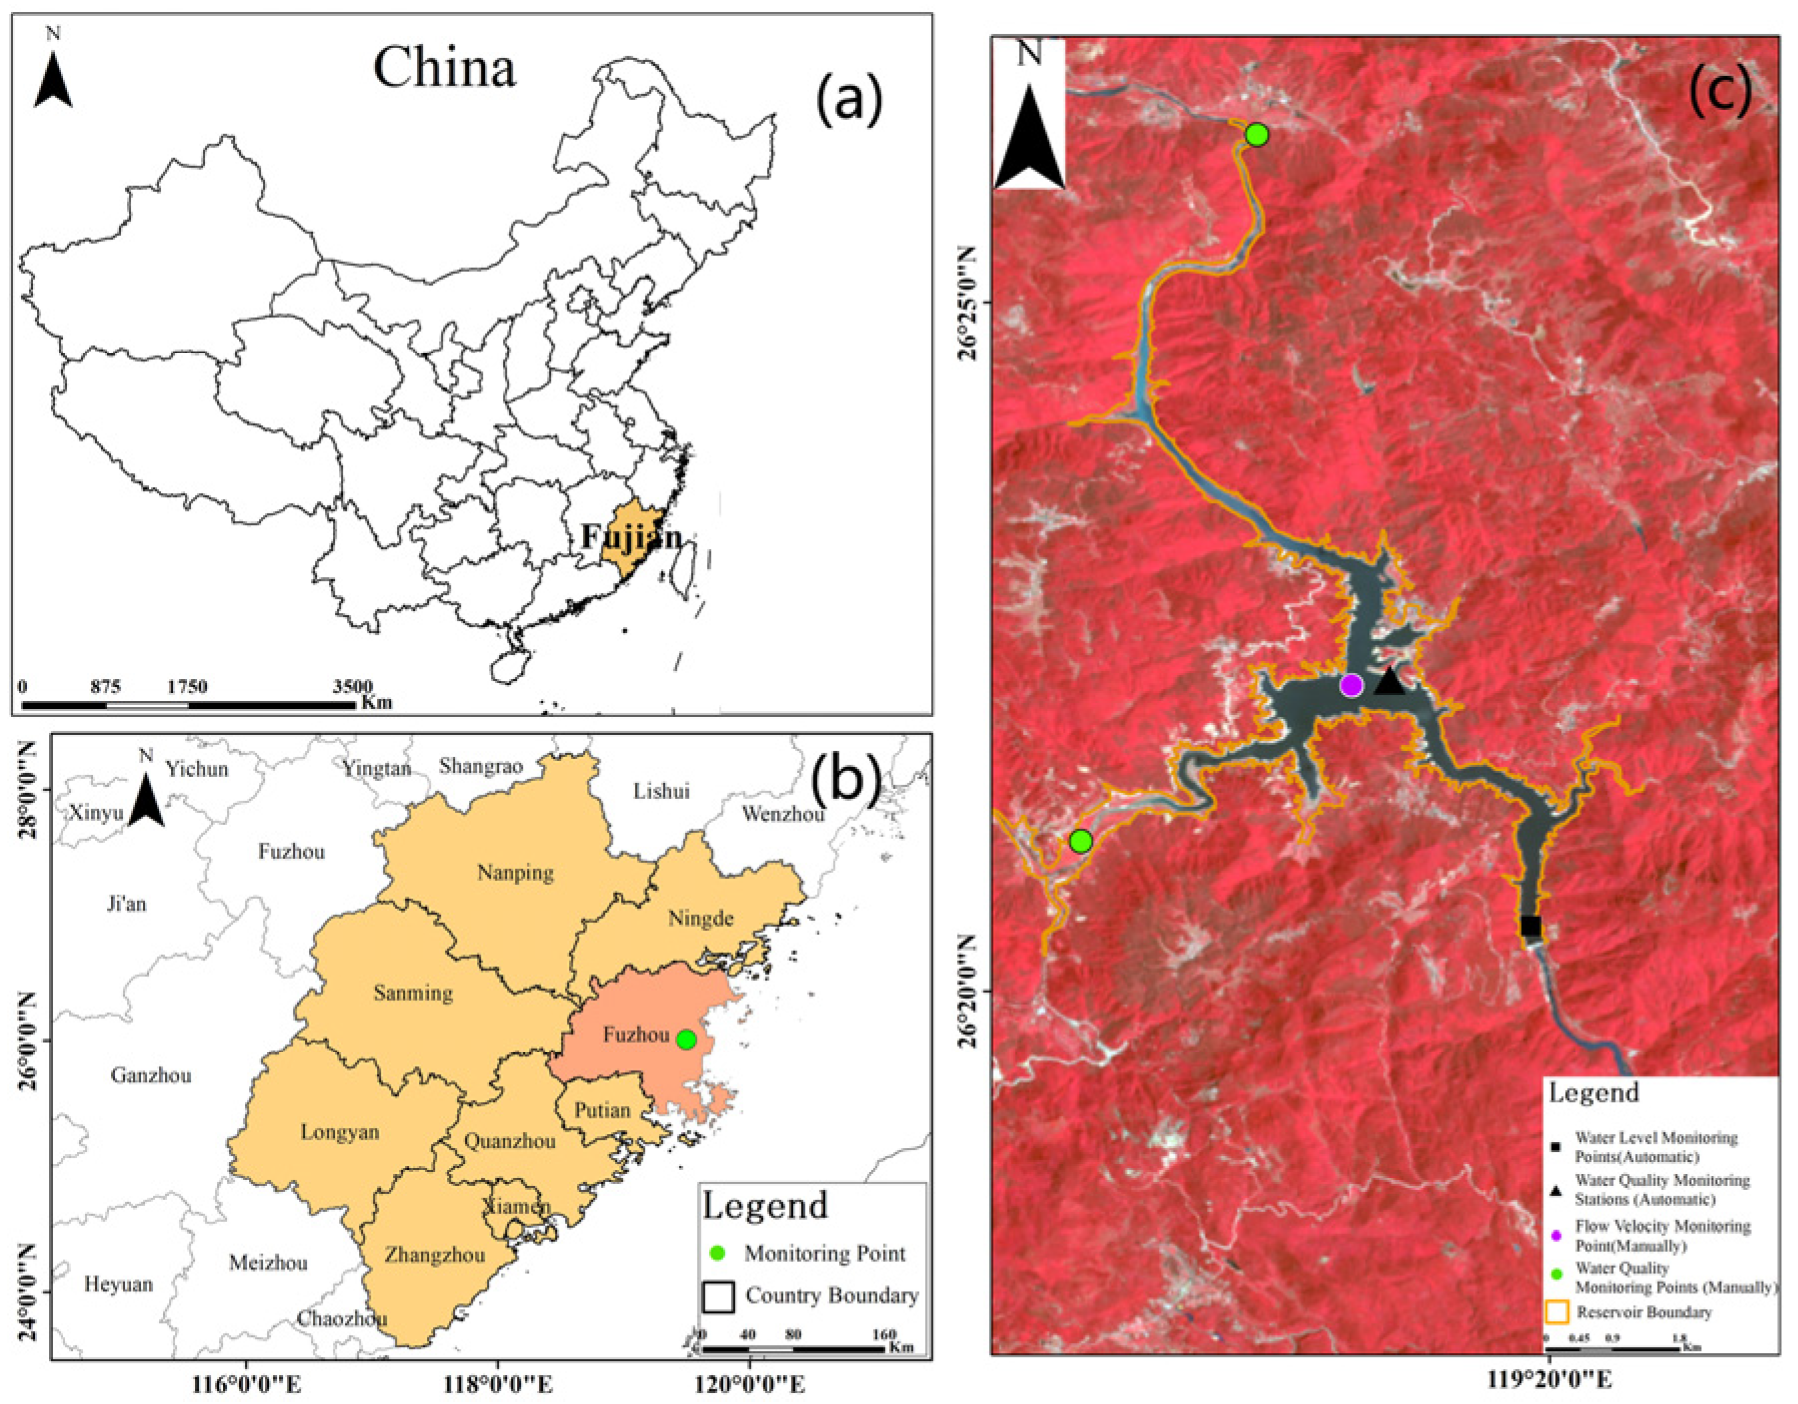
2.1. Overview of the Study Area

The Shanzai Reservoir is located in the lower reaches of the Ao River. The geographic coordinates at the center of the reservoir are 26°17′51″ north latitude and 119°21′35″ east longitude (Figure 1) [38]. The entire basin area of the reservoir is 1646 km2, with a total capacity of 1.06 × 10⁸ m3. It is situated in the middle reaches of the Ao River, with the dam site located approximately 6 km upstream from Tangban Village in Lianjiang County. This is a third-level reservoir developed on the main stem of the Ao River, with primary functions including water supply, flood control, power generation, irrigation, and aquaculture [39]. The Shanzai Reservoir is the second water supply source for Fuzhou, serving the important task of supplying water to 1.6 million residents. It not only has to ensure the quantity, but also the quality of the water supply.
The water flow direction of the Shanzai Reservoir starts from the north, where the Qili River meets and merges with the Rixi River flowing from the southwest to the east towards the center of the reservoir. The main stream gradually inclines towards the dam, forming an irregular elongated shape, with an average depth of about 25–30 m and the deepest part reaching approximately 50 m in front of the dam. The hydraulic retention time is approximately 20.8 days, indicating that it is a seasonal regulating reservoir. The vertical water temperature distribution in the Shanzai Reservoir is characterized by a single convection type, forming a stable thermal stratification from spring to summer to autumn. The thermal stratification disappears in winter, and the vertical water body approaches a uniform mixing.
With the economic and social development of the catchment area, the reservoir has faced new or intensified challenges, including the following: (1) the increased pressure of eutrophication in the reservoir area; (2) the increased risk of seasonal algal blooms; (3) the availability of total nitrogen (TN) and total phosphorus (TP) as a nutrient source. As a result, the optimization of the aquatic biological community structure, and the reduction in the algal bloom risk have become key issues in the Shanzai Reservoir.

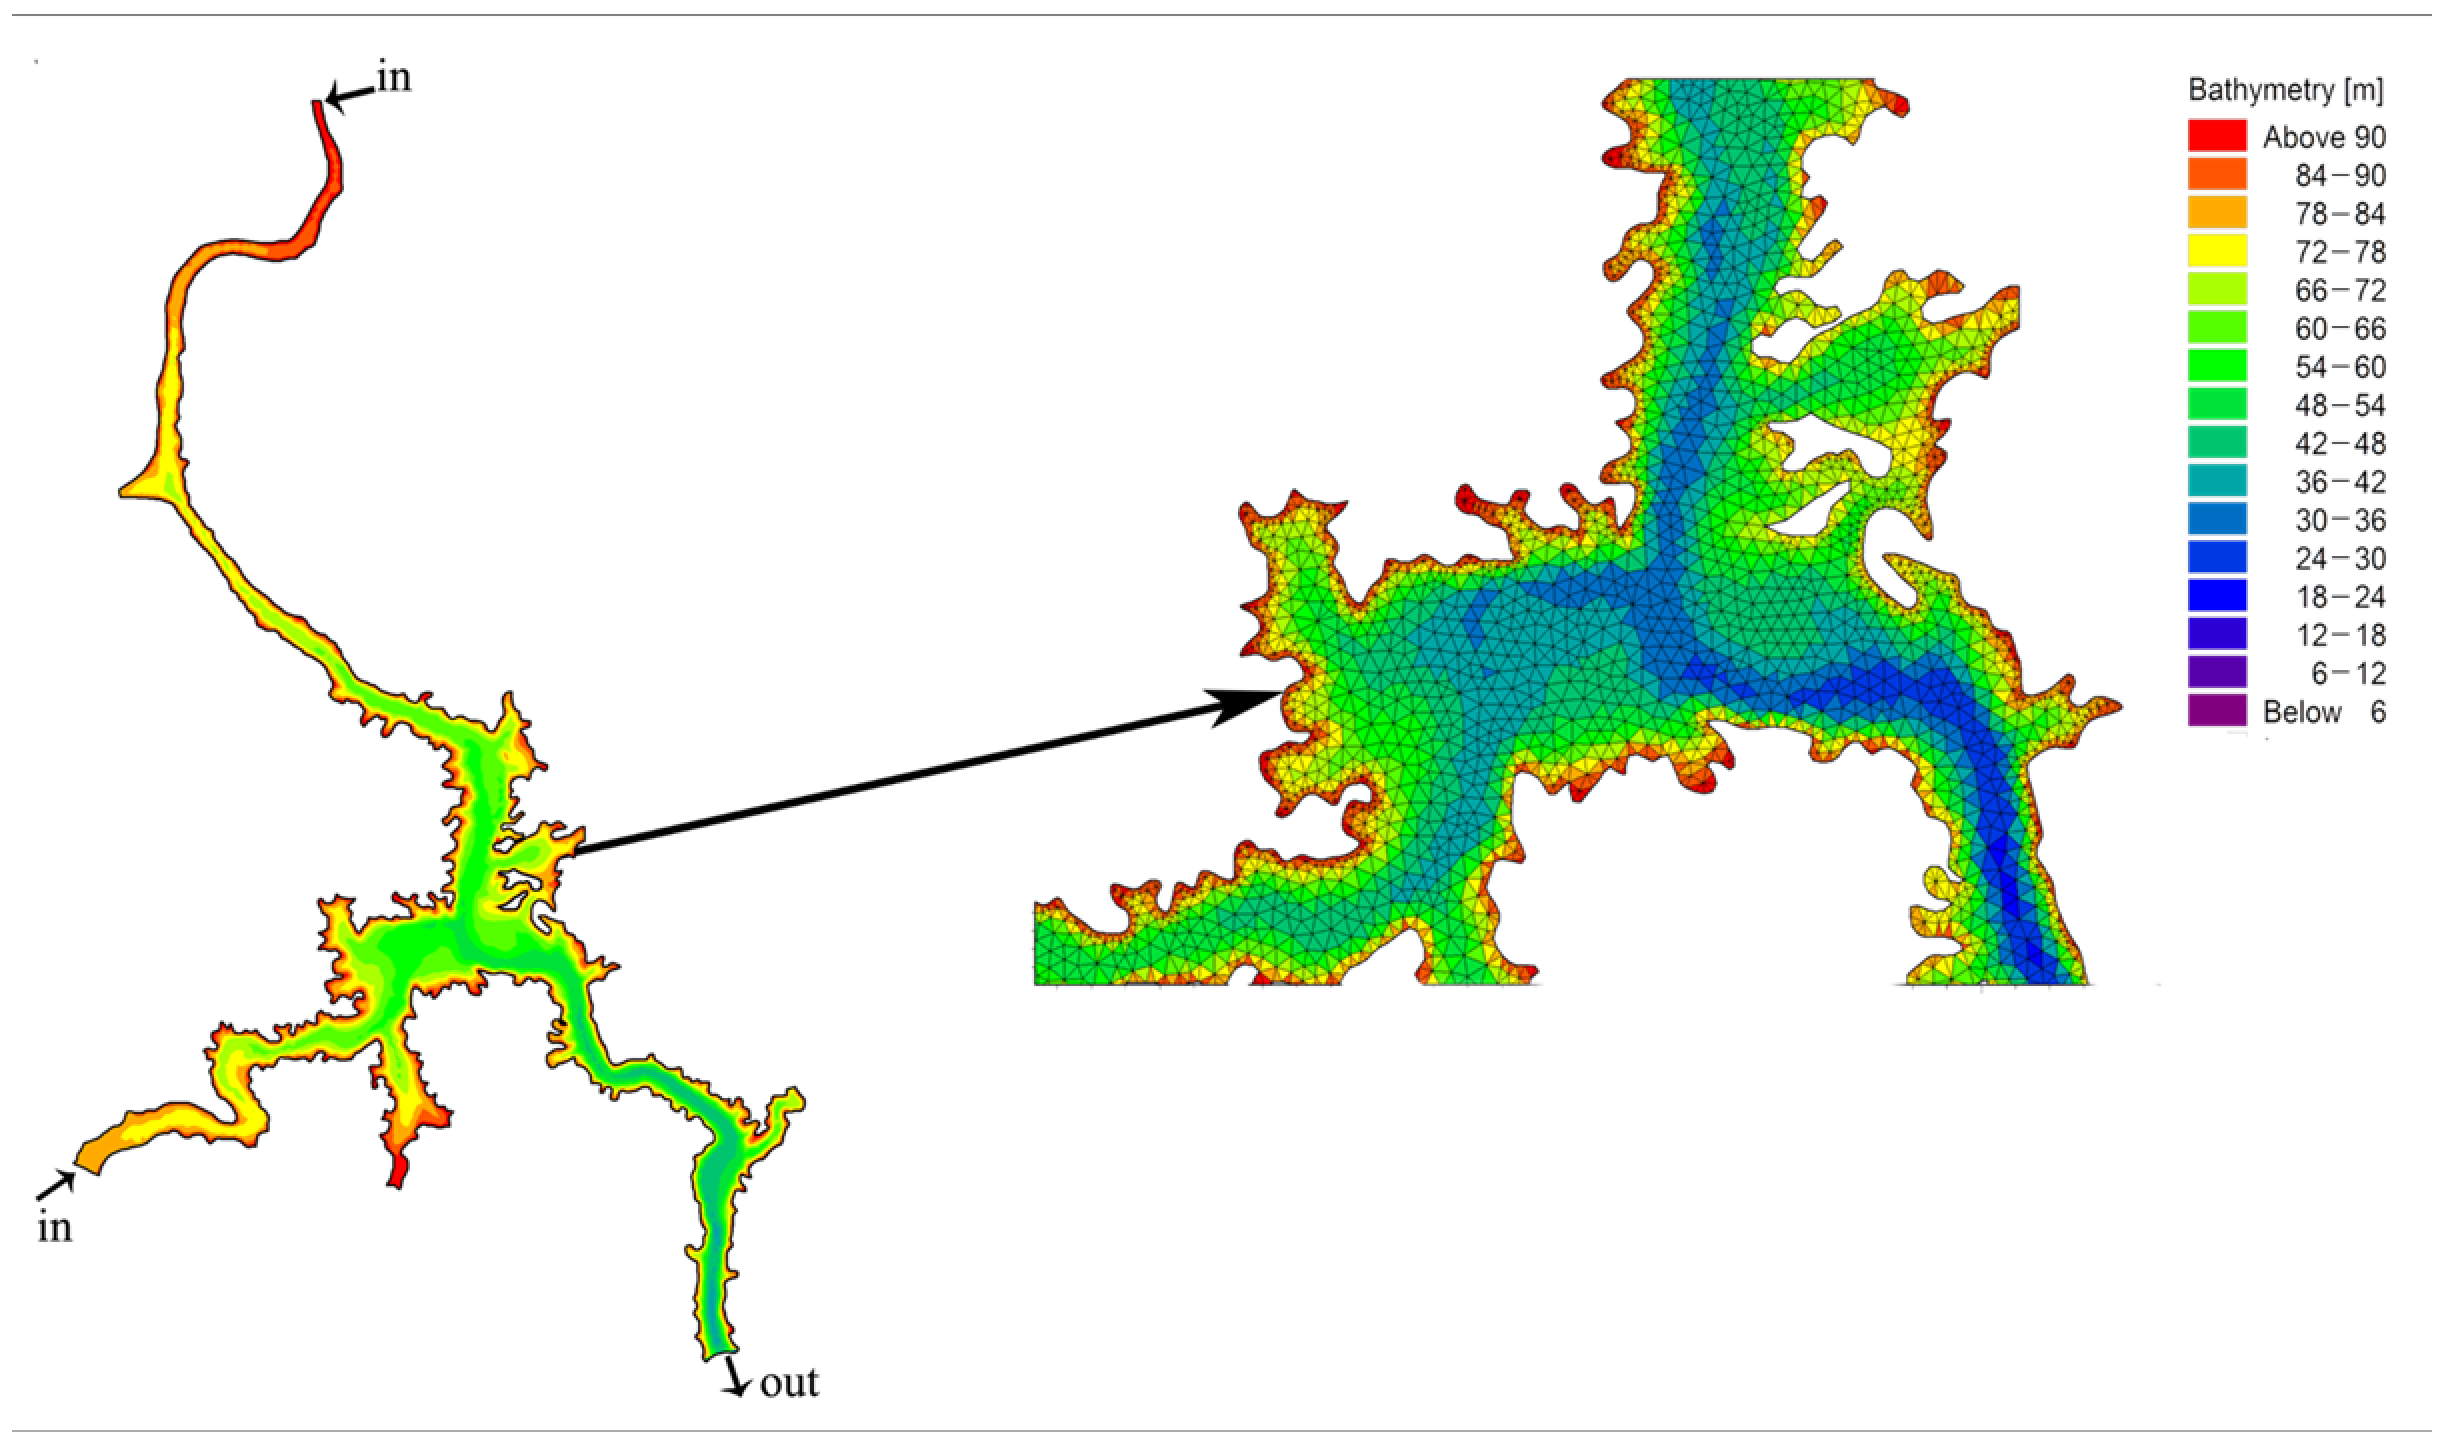
2.2. Principles of Hydrodynamic Modeling

The two-dimensional numerical model MIKE 21 FM, developed by the Danish Hydraulic Institute, was utilized to examine tidal flow in engineered sea areas [40]. The model employs an unstructured triangular grid for calculations, allowing for a better fit with the land boundaries and the software possesses several advantages: it has reliable algorithms, stable computations, a user-friendly interface, and powerful pre- and post-processing functions [41]. For horizontal spatial discretization, MIKE 21 FM employs the standard finite volume method, while a first-order explicit Euler difference format is used for the discretization of momentum and transport equations in time [42].
ζ t + p x + q y = 0
p t + x p 2 h + y p q h + g h ζ x + g p p 2 + q 2 C 2 h 2 1 ρ w x h τ x x + y h τ x y Ω q f V V x + h ρ w x P α = 0
q t + y q 2 h + x p q h + g h ζ y + g p p 2 + q 2 C 2 h 2 1 ρ w y ( h τ y y ) + x ( h τ x y ) + Ω p f V V y + h ρ w y ( P α ) = 0
where h ( x , y , t ) is the water depth (m); ζ ( x , y , z ) is the tidal level (m); p , q ( x , y , t ) are the single-width flows in the x and y directions; C ( x , y ) is the chezy coefficient (m^1/2/s); g is the gravitational acceleration (m/s2); f ( V ) is the wind friction factor, f ( V ) = γ α 2 ρ α where γ α 2 is the wind stress coefficient and ρ α is the air density; V , V x , V y ( x , y , t ) are the wind speed and its components in x, y directions; Ω ( x , y ) is the Coriolis force coefficient (s−1); p a ( x , y , t ) is the atmospheric pressure (kPa); ρ w is the density of water (kg/m3); τ x x , τ x y , τ y y are the effective shear force components.
Equations (1)–(3) constitute the basic governing equations for solving the tidal flow field. In order to solve this initial boundary value problem, appropriate initial and boundary conditions must be provided.

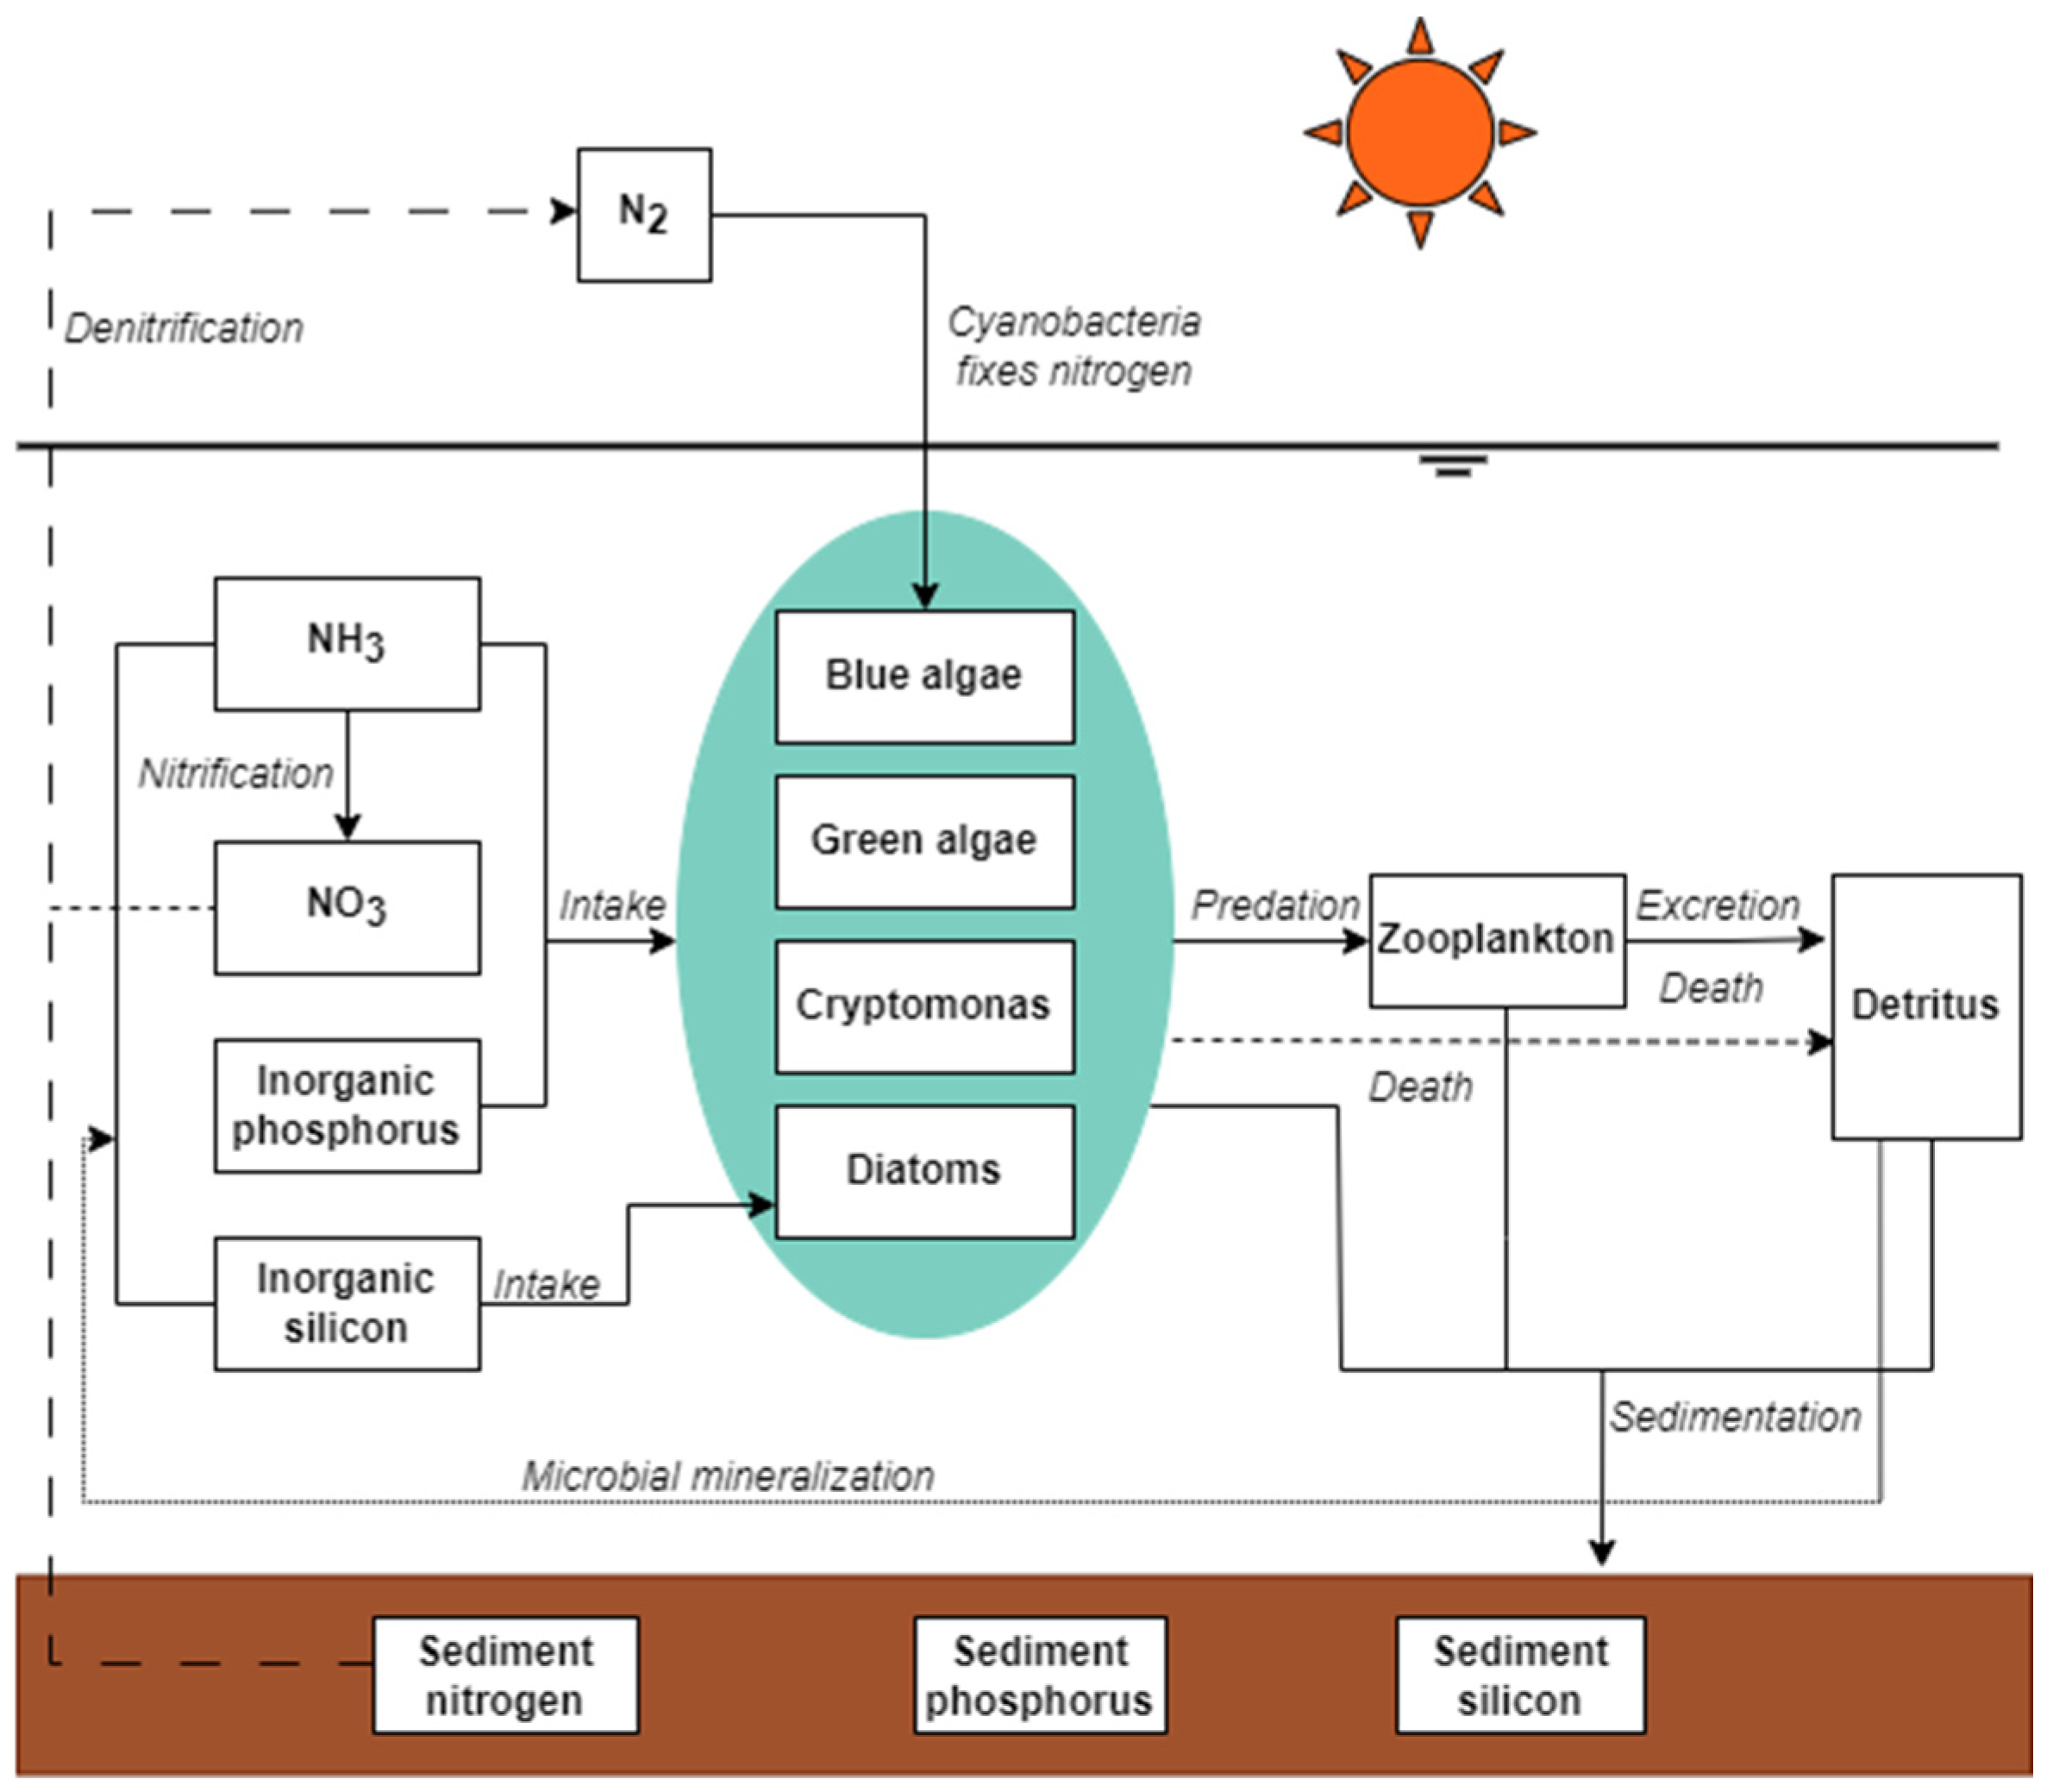
2.3. Aquatic Ecological Model Framework

The Shanzai eutrophication model reflects a redeveloped and enhanced version of the eutrophication and sediment system template found in MIKE 21 (DHI) in the ECO Lab [43]. It simulates and adjusts the biomass of blue-green algae, green algae, diatoms, and fish (using ABM simulation) while tailoring the aquatic ecological cycling mechanism to accurately replicate the eutrophication process in the Shanzai reservoir.
This model is derived from the established eutrophication and sediment system template in the ECO Lab [44]. It simulates and adjusts the biomass of blue-green algae, green algae, diatoms, and fish (employing ABM simulation). Furthermore, it customizes the aquatic ecological cycling mechanism to represent the eutrophication process in the Shanzai reservoir.
The Shanzai eutrophication model articulates the nutrient cycling process in the reservoir and the growth dynamics of phytoplankton and zooplankton. It also encompasses the cycling processes of various forms of nitrogen and phosphorus nutrients in the sediment, capturing their interactions with the overlying water. Utilizing a suite of 129 differential equations, the Shanzai eutrophication model describes the variations in 29 distinct state variables, encompassing phytoplankton (blue-green algae, green algae, diatoms, and dinoflagellates), chlorophyll-a, zooplankton, humic substances, dissolved oxygen, and inorganic nutrients.
Additionally, the model calculates various derived variables, such as primary productivity, total nitrogen and phosphorus concentrations, sediment oxygen demand, and water clarity. Figure 2 illustrates the carbon, nitrogen, phosphorus, and oxygen cycling and transformation processes described in the eutrophication and sediment system template. The entire model is constructed around the carbon cycling and transformation processes of different nutrient pools, including phytoplankton, zooplankton, humic substances, and sediment.
c t + u c x + v c y + w c z = D x 2 c z 2 + D y 2 c z 2 + D z 2 c z 2 + S c + P c
P c = d c d t = i = 1 n process i
where c is the concentration of the ECO Lab state variable; u , v , w are the flow velocity components; p , q ( x , y , t ) are the single-width flow in the x and y directions; D x ,   D y ,   D z are the dispersion coefficients; S c is the sources and sinks; P c is the ECO Lab processes, process i stands for various biochemical processes.

2.4. Data Collection

All the data were collected in the year 2021. Water quality data were obtained from the automated monitoring station operated by the Ecological and Environmental Bureau’s Reservoir Center in Fuzhou, with a monitoring frequency of every 4 h. Additionally, monthly manual monitoring data from the inlet rivers were utilized. These data encompass parameters such as water temperature (TEM), dissolved oxygen (DO), total nitrogen (TN), ammonia (NH3), total phosphorus (TP), and chlorophyll concentration (CHL).
Hydrodynamic data for the reservoir area were obtained from the daily average data provided by the Shanzai Reservoir Management Office, including inlet flow, outlet flow, and upstream water level. On-site measurements of flow velocity in the reservoir were conducted using a portable flow velocity meter.
Meteorological data were sourced from the tavg1_2d_rad_Nx dataset in the second Modern-Era Retrospective analysis for Research and Applications version 2 (MEERA-2) [45]. This dataset includes information on rainfall, wind speed, wind direction, solar radiation intensity, and photosynthetically active radiation (PAR).

2.5. Model Setup and Simulation Scenarios

2.5.1. Initial Model Parameters

In the simulation of the annual growth and succession of the main algal species in the Shanzai Reservoir, in order to reflect the succession of the main algal species in the Shanzai Reservoir as realistically as possible, it is necessary to use the actual water quality situation of the Shanzai Reservoir as a basis. For measurable indicators, the average of the measured data from various monitoring stations within the reservoir can be used as the initial value for the entire reservoir. For indicators that lack monitoring data or are difficult to monitor, default values of the various state variables in the model can be used as the initial values for simulation.
The model comprised two inlet boundaries and one outlet boundary, as depicted in Figure 3. The total number of cells in the unstructured mesh model was 10,541, with a typical horizontal size of 40 m × 40 m and no vertical stratification. The initial values of various indicators in the model were set as shown in Table 1.

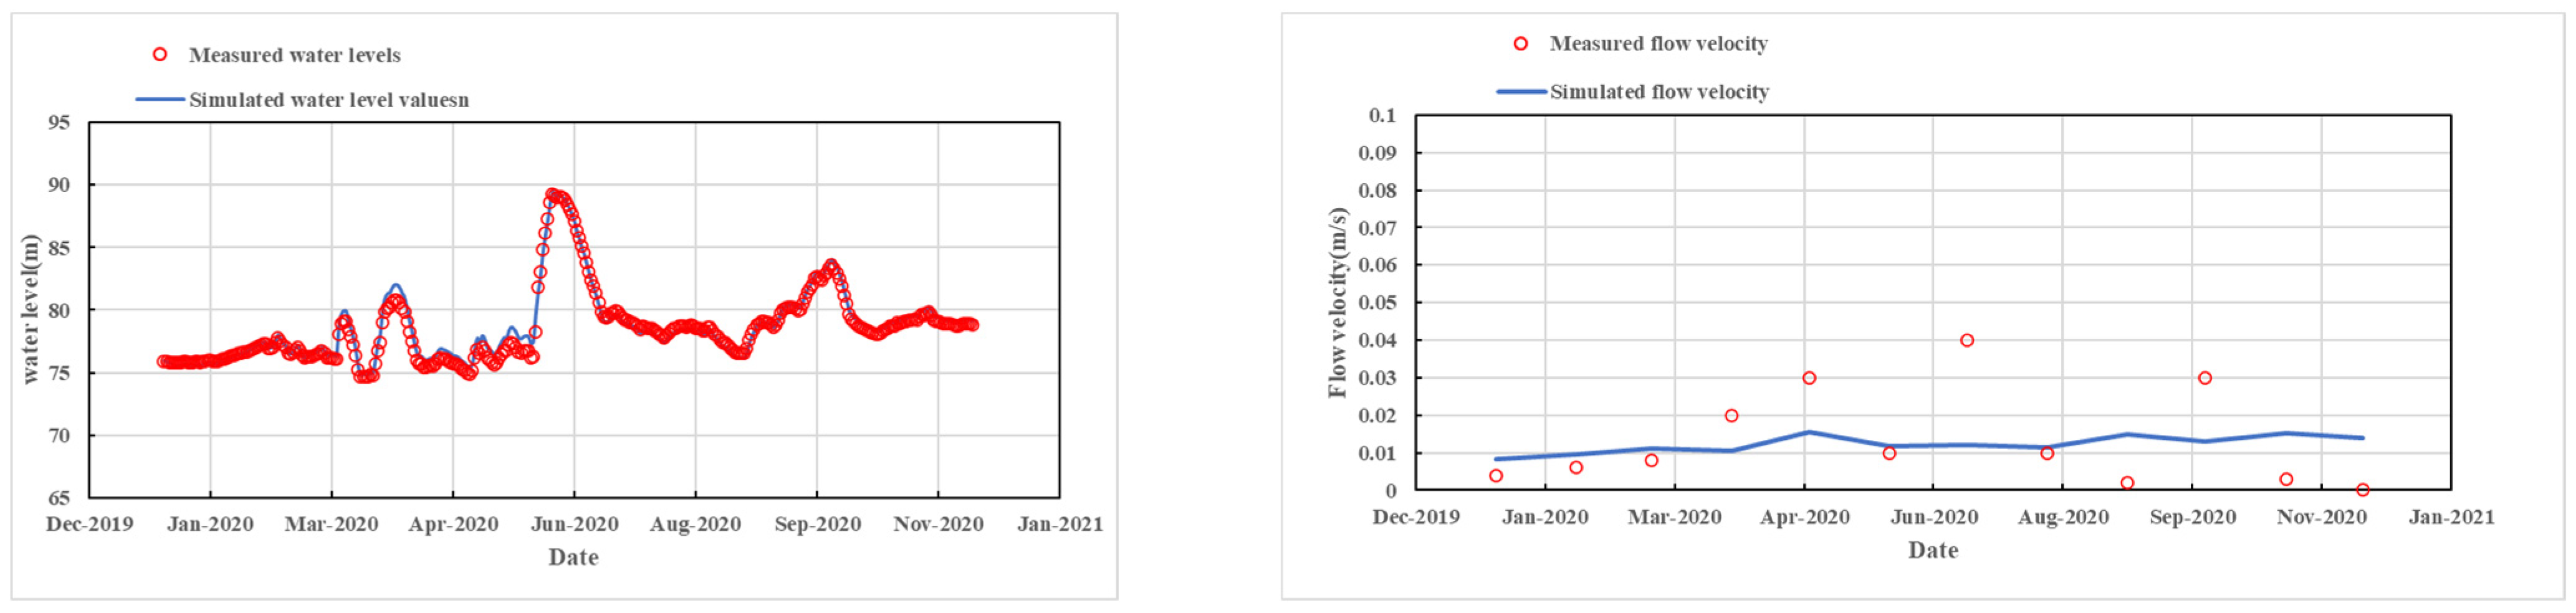
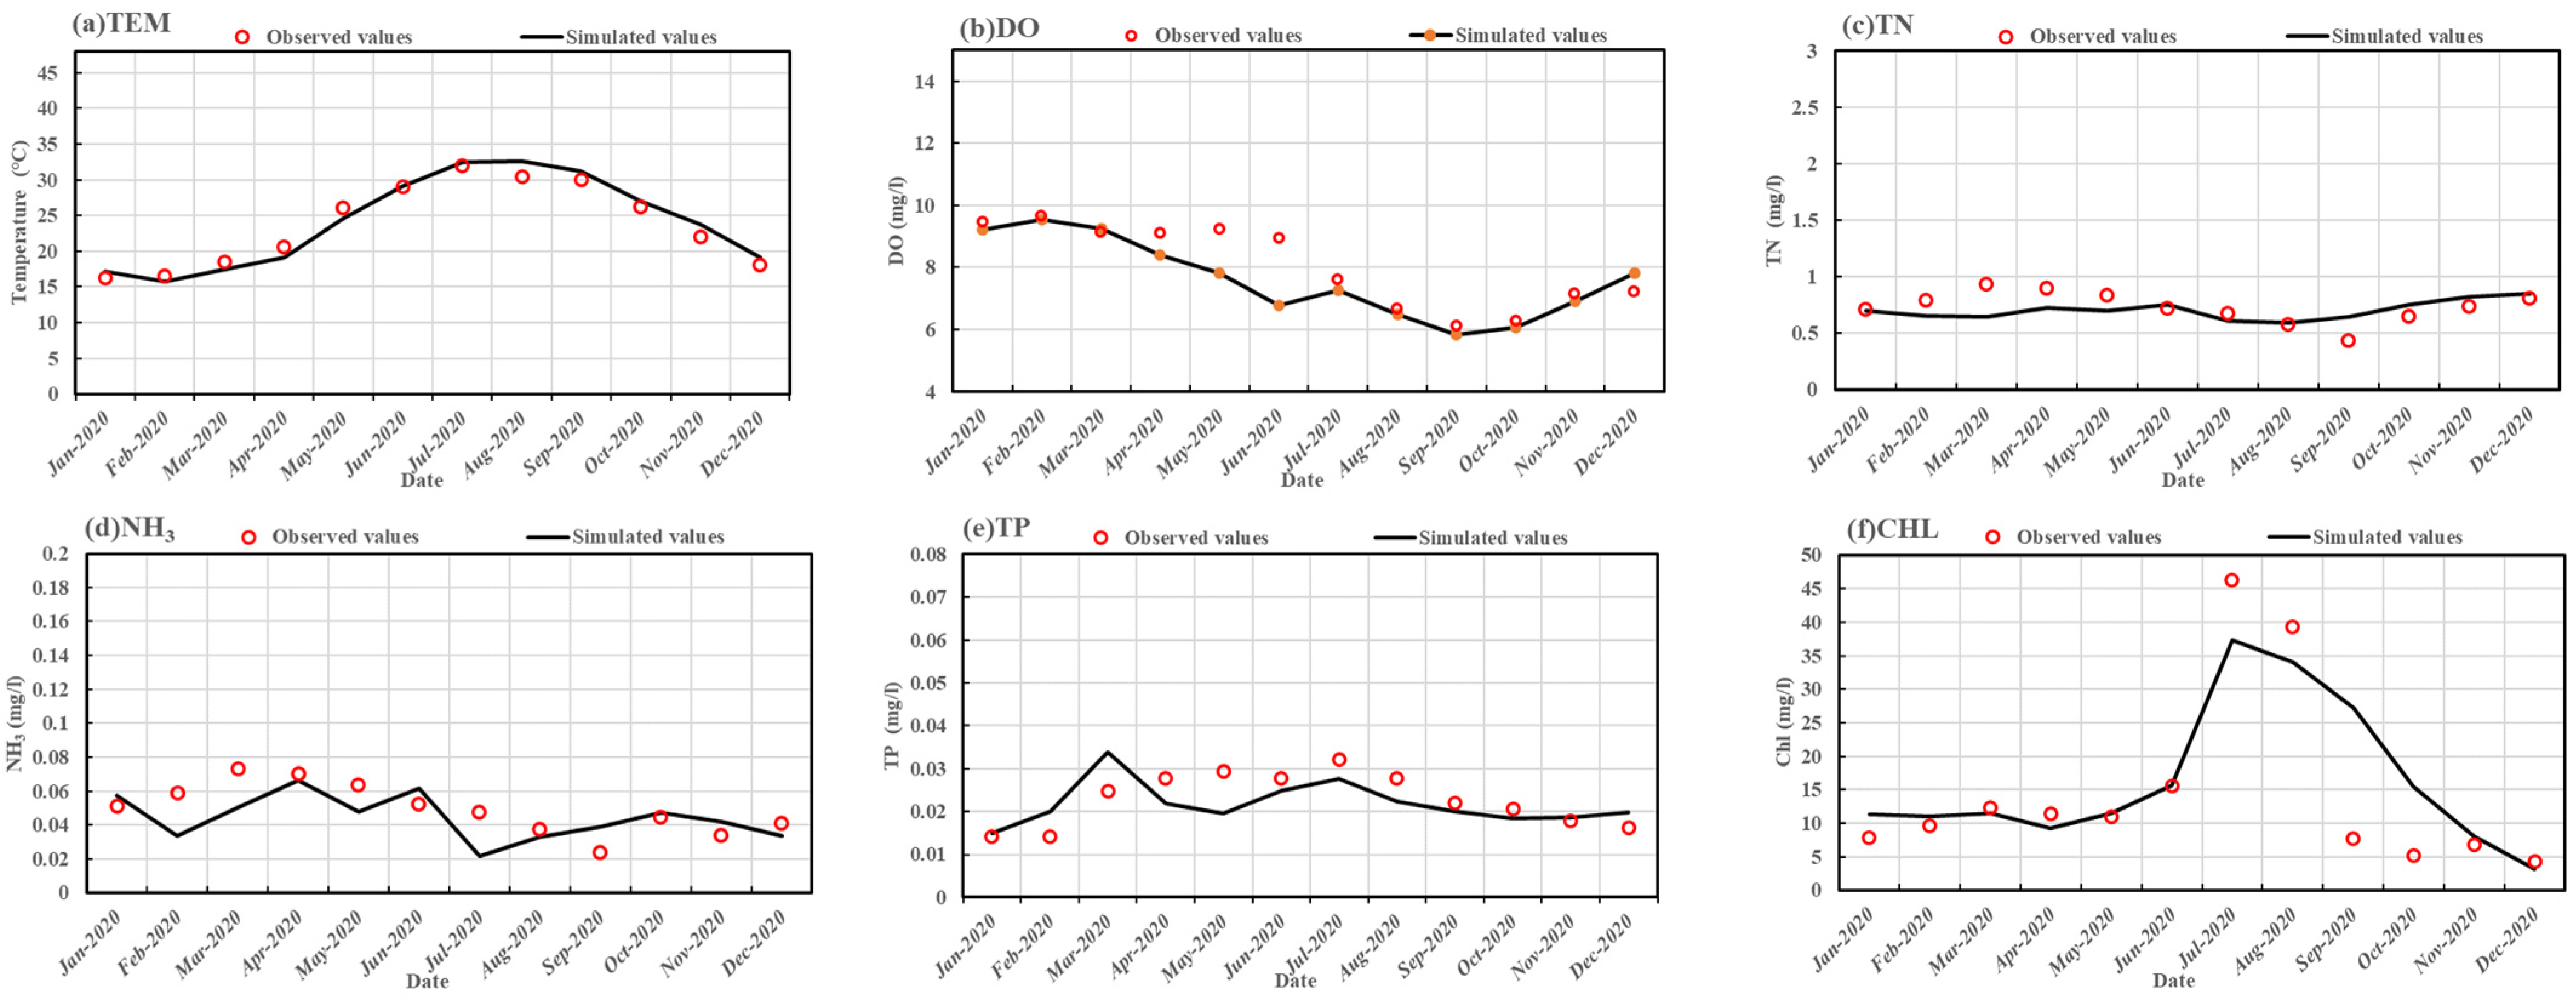
2.5.2. Model Verification and Validation

The hydrodynamic verification results are shown in Figure 4, while the water quality and biomass indicators’ verification results are illustrated in Figure 5. Simultaneously, the model’s effectiveness was evaluated and analyzed using the statistical indicators Root Mean Square Error (RMSE) and Nash–Sutcliffe efficiency coefficient (NSE) [46], as shown in Table 2. Due to the strong correlation between chlorophyll and biomass [47,48], this study uses chlorophyll concentration to represent the biomass indicator.
Generally speaking, an NSE greater than 0.6 is considered acceptable, and a smaller MRE is preferred. Based on the indicator results (Table 2), the NSEs for TN, TP, NH3, and flow rate are relatively low, indicating poor performance. However, the NSEs for water level, CHL, TEM, and DO are higher, indicating better performance. The performance of the RMSE is acceptable, with the chlorophyll indicator slightly higher compared to other indicators.
Overall, the water level simulation results are in good agreement, and the flow velocity simulation demonstrates moderate effectiveness, showcasing the reservoir flow velocity’s order of magnitude. The simulated water quality indicators are basically consistent with the measured values, especially the important parameters such as CHL and TEM, effectively reflecting the annual variations in the water quality of Shanzai Reservoir.
Concerning CHL simulation and measurement results, the simulation effectively reflects the inter-annual variations, showing a normal distribution curve with the highest concentration occurring from June to August. The simulation results exceed the measured values in August and September, likely due to the gradual decrease in solar radiation after July in the northern hemisphere, leading to a rapid decline in reservoir temperature. The model’s monthly average TEM simulation is 1–2 °C higher than the actual temperatures due to the reservoir’s vertical stratification buffer effect [49]. Moreover, the model utilizes a single-value function curve to express the algae growth rate at the most suitable temperature, while a stepped growth curve where algae maintain a stable growth efficiency within an optimal temperature range may exist in reality [50]. Addressing this discrepancy is a potential direction for further exploration and model improvement.

2.5.3. Simulation Scenarios

The management and control of eutrophication and algae in water sources should consider water usage safety and the ecological risks associated with chemical and microbial methods of algae control, which are challenging to manage. In the prevention and control of algae in water sources such as lakes and reservoirs, the focus should be on reducing nutrient sources, particularly internal sources within the reservoir, and implementing biological and physical algae control measures, such as ecological fish stocking, mollusk breeding, and algae removal equipment [51,52,53,54,55].
Consequently, this research project specifically proposes hydrodynamic solutions, a reduction in sediment pollution sources, and ecological stocking measures to address the issue of blue algae bloom in Shanzai Reservoir. It conducts a simulated analysis to evaluate the effectiveness of these control measures.
This chapter presents a water ecological cycle model, constructed based on the characteristics of the Shanzai Reservoir. It analyzes various simulation scenarios and operating conditions to study their effects on the growth of blue algae in Shanzai Reservoir throughout the year. The research is guided by an ecological perspective of the control system of algae in lakes and reservoirs, and it establishes different simulation scenarios and operating conditions can be used to analyze the impact of different water levels (Table 3), bottom sediment endogenous sources (Table 4), and ecological fish stocking (Table 5) on the growth of blue algae in the Shanzai Reservoir.

3. Results and Discussions

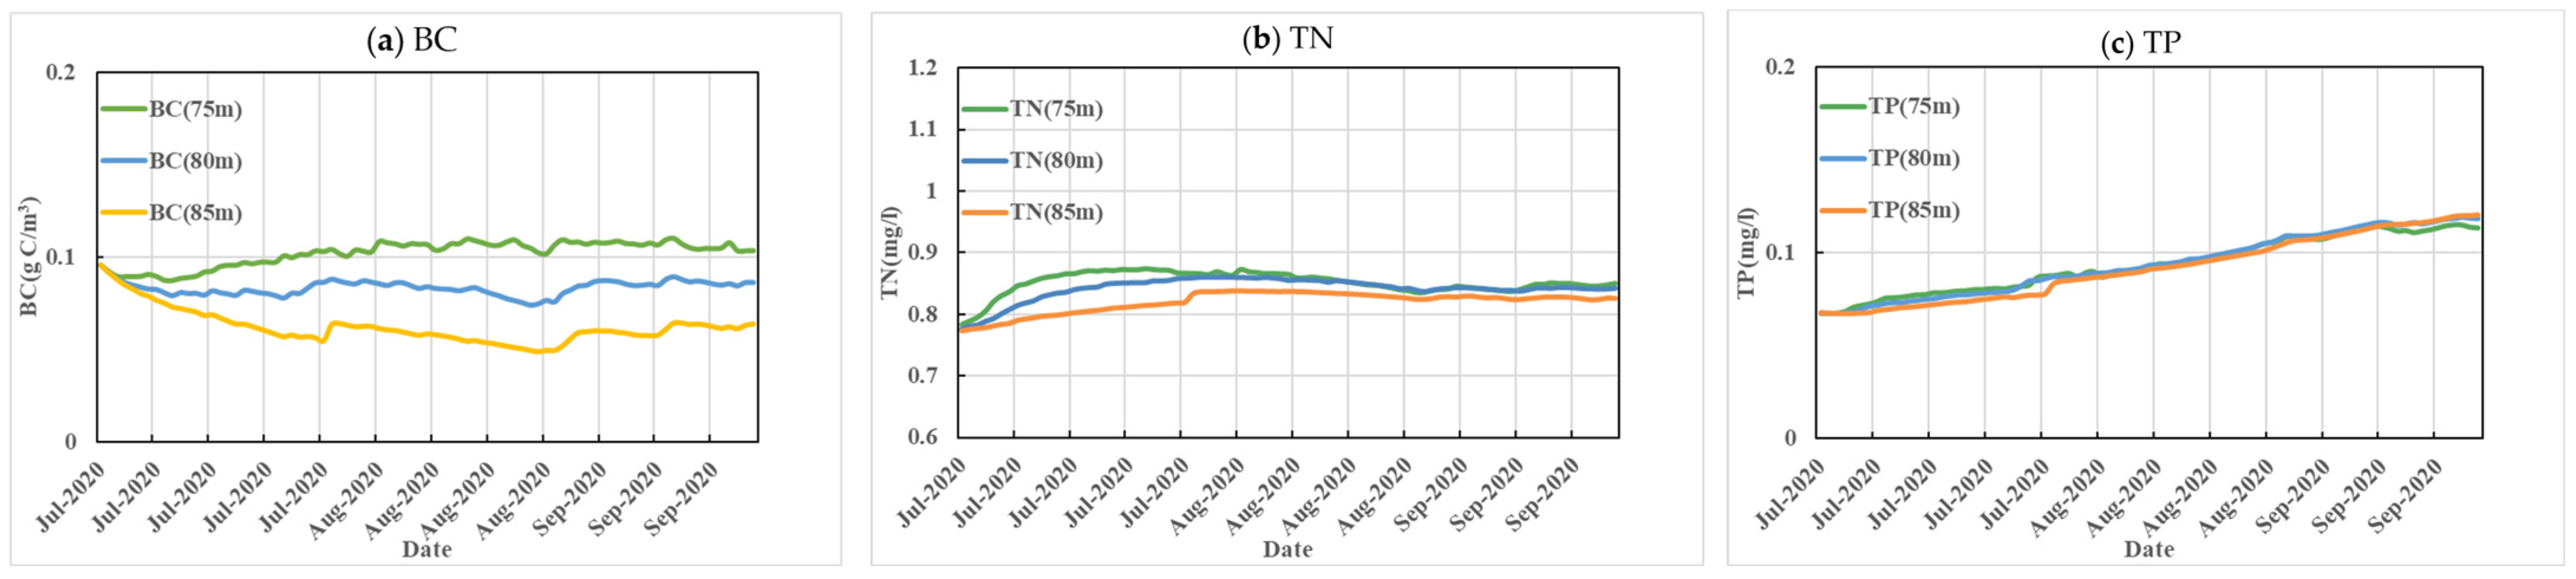
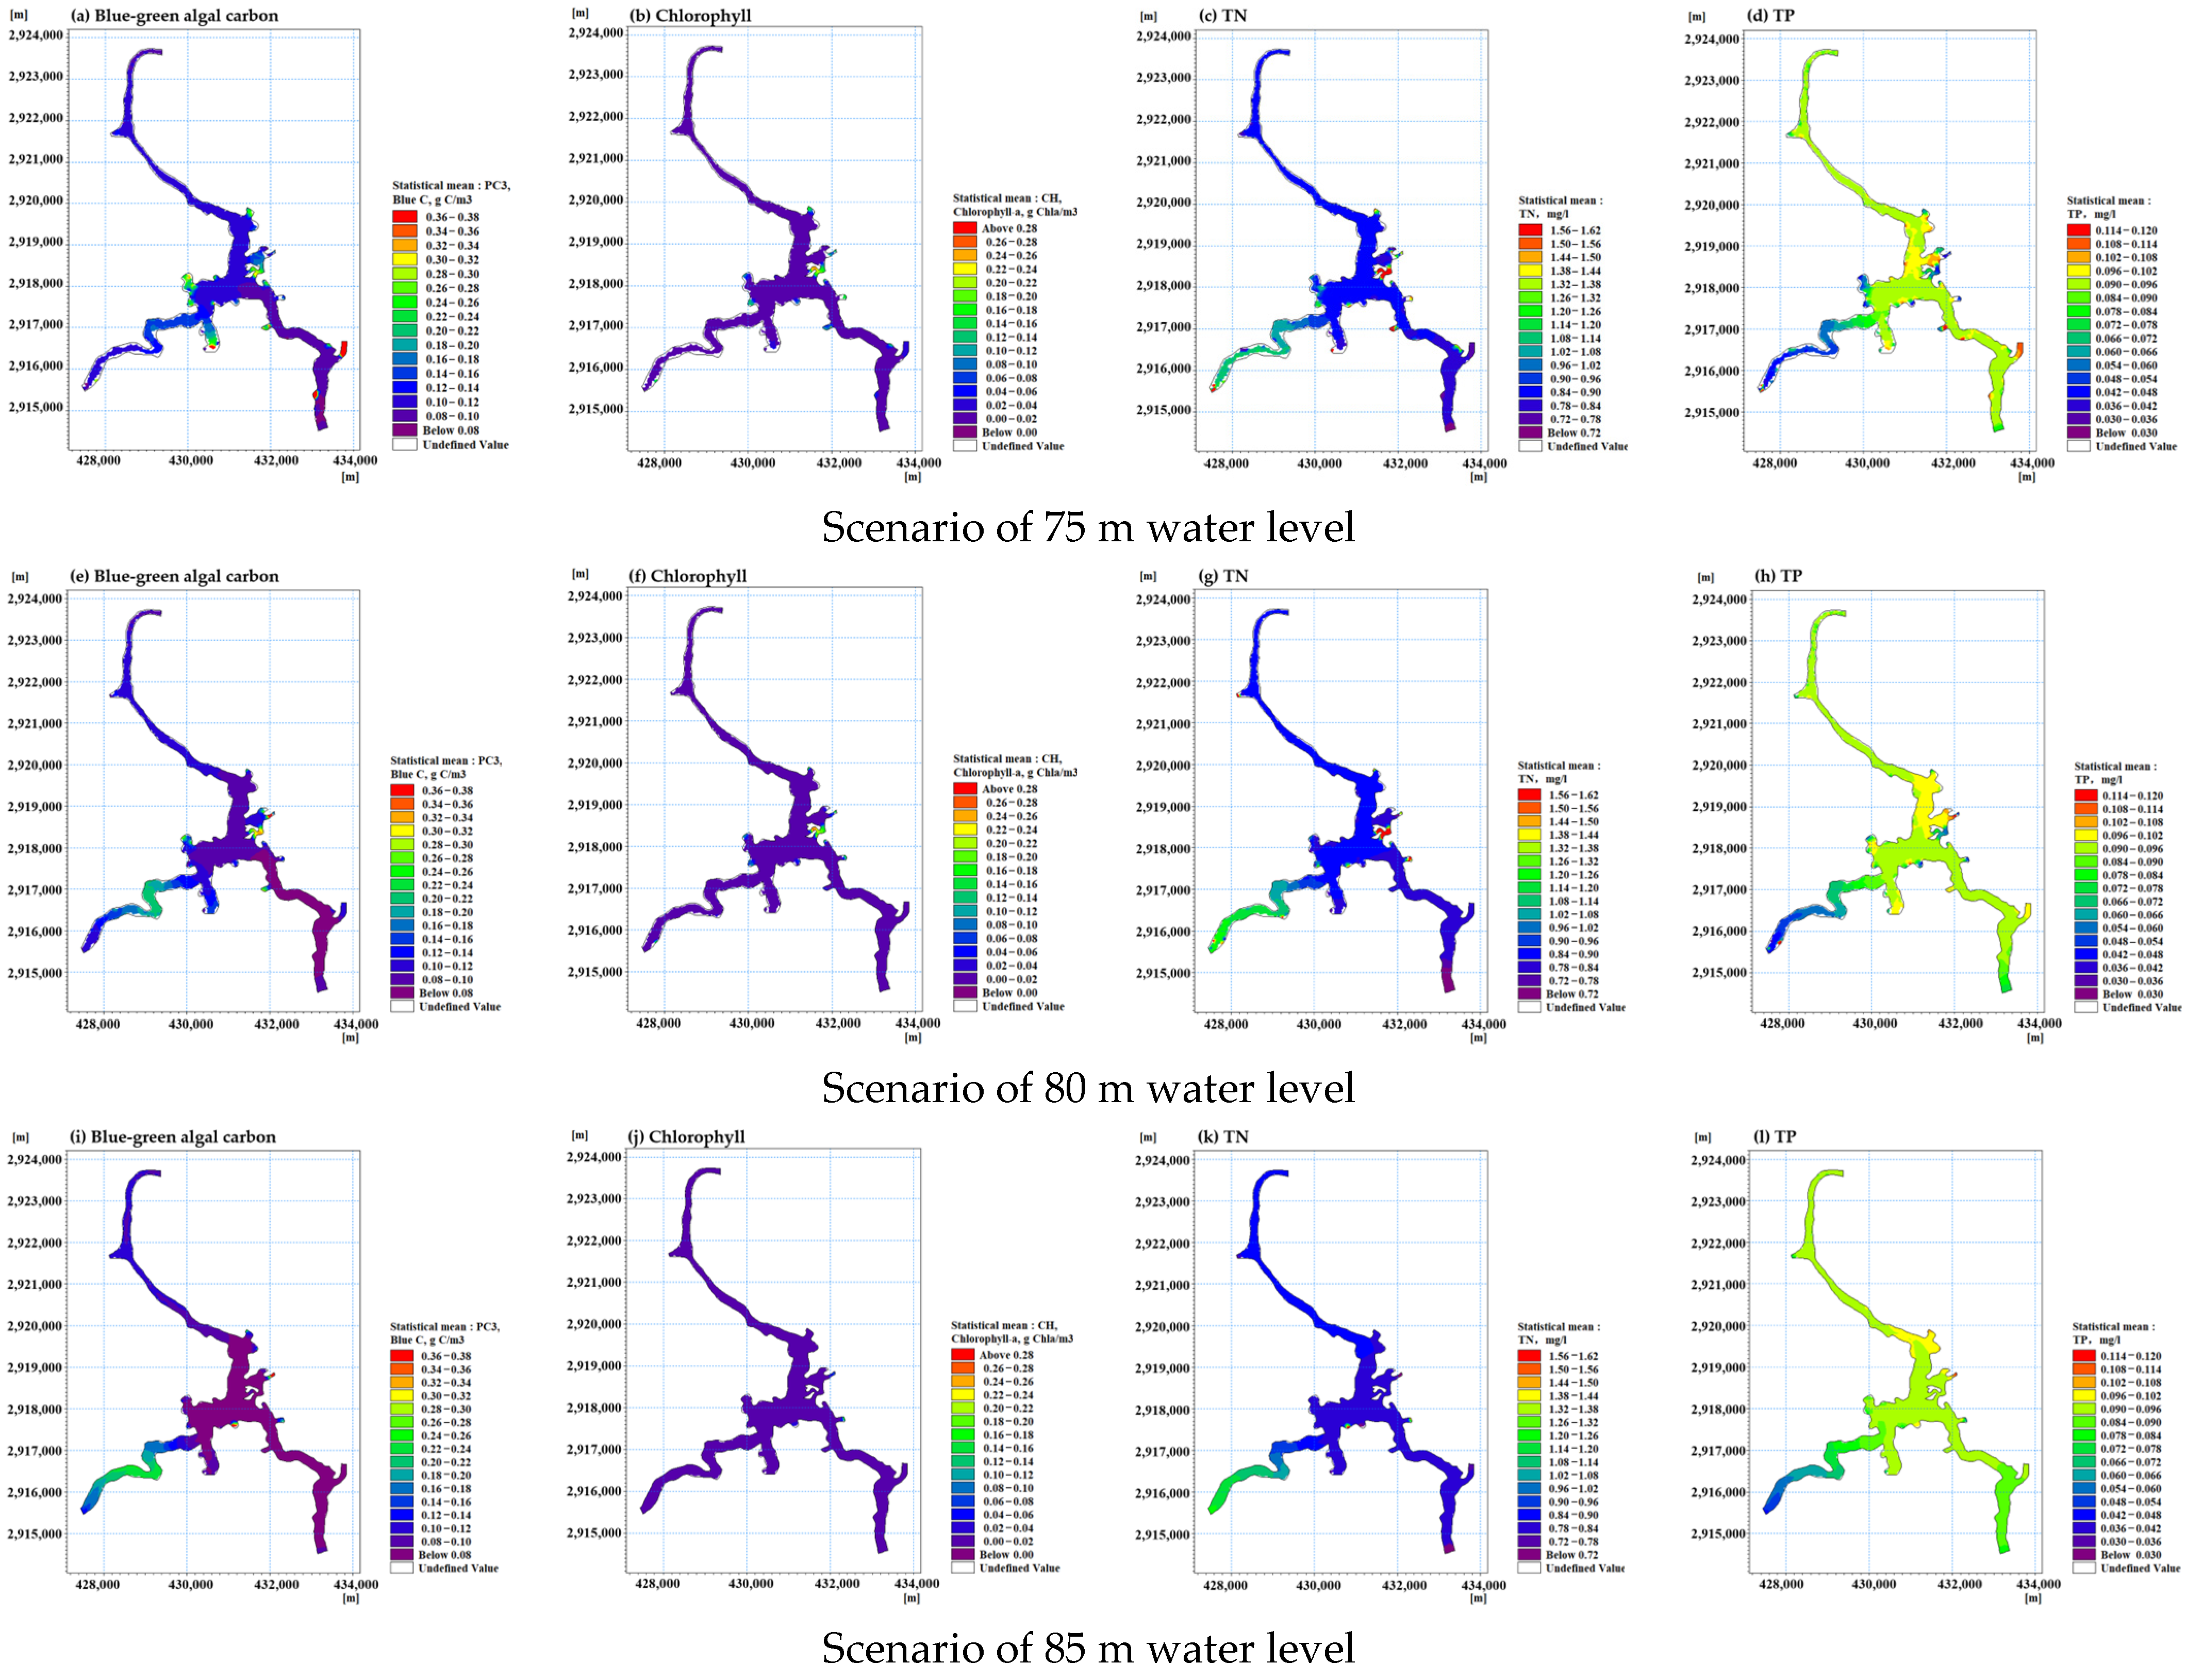
3.1. Reservoir Water Level Scheme Analysis

In the reservoir’s water level design scheme, the figure displays the results for both the reservoir center (Figure 6) and the overall reservoir (Figure 7).
The results (Figure 6) of the reservoir area simulation indicate the following conclusion:
(1) As the water level rises, there is a significant decrease in blue-green algae carbon (BC) content in the reservoir center. For instance, in scheme one, the blue-green algae carbon amount is approximately 48% higher at a water level of 75 m compared to scheme three at a water level of 85 m. This result aligns with the actual algal outbreak in the reservoir between July and April 2020 at a water level of 75 m, and the same period in 2021 and 2022 at a water level of around 85 m.
(2) There are minimal variations in the total nitrogen and total phosphorus content in the reservoir center across different water level schemes, with slight fluctuations observed. Over time, it can be observed that the concentration of nutrients in the water transitions from being higher at low water levels to being relatively consistent at high water levels. This is because the model-simulated total nitrogen and total phosphorus encompass all nitrogen and phosphorus substances in the water, including algal nitrogen and phosphorus, detrital nitrogen and phosphorus, inorganic nitrogen, and inorganic phosphates. With no changes at the inflow and outflow boundaries, the main factors influencing changes in the total nitrogen and phosphorus content are nitrogen and phosphorus deposits and their release from the bottom sediment.
On one hand, the decrease in water levels leads to an increase in water temperature and light intensity, particularly impacting shallow areas and the overall flow velocity in the reservoir. This results in excessive water exchange and an overall rise in nutrient concentration, fostering increased algal growth and reproduction. On the other hand, following algal death, detritus settles at the reservoir’s bottom, carrying nitrogen and phosphorus into the sediment. As nitrogen and phosphorus concentrations in the water decrease due to algal absorption, the concentration gradient between the interstitial water in the sediment and the overlying water intensifies, leading to an increase in nutrient release from the sediment. This relationship is a dynamic equilibrium tied to water temperature. Ultimately, the overall change in total nitrogen and total phosphorus tends towards a stable state, with slightly different variations as the seasons shift.
The results (Figure 7) of the reservoir area simulation indicate the following conclusion:
(1) Blue-green algae and chlorophyll are primarily distributed in various bays and areas with different water depths, with a higher biomass of blue-green algae observed in the dock area compared to other regions. The overall distribution of blue-green algae and chlorophyll demonstrates a spatial decreasing trend from the inflow to the dam.
(2) The distribution of nutrients, nitrogen, and phosphorus displays minor variations, with the total nitrogen concentration being positively correlated with algal biomass and the total phosphorus exhibiting the opposite trend. The simulation results clearly indicate that the total phosphorus in the dock bay area is significantly higher than in other regions, while the total nitrogen concentration is lower. This disparity arises because algae absorb more inorganic nitrogen, and the amount of phosphorus released from the sediment exceeds the amount that is deposited, whereas the opposite trend applies to total phosphorus.
Therefore, in reservoir management, when considering flood control and storage, as well as ensuring flood discharge safety and water resource protection, it is crucial to establish an appropriate ecological water level based on the relationship between algae and the local reservoir water level [56].

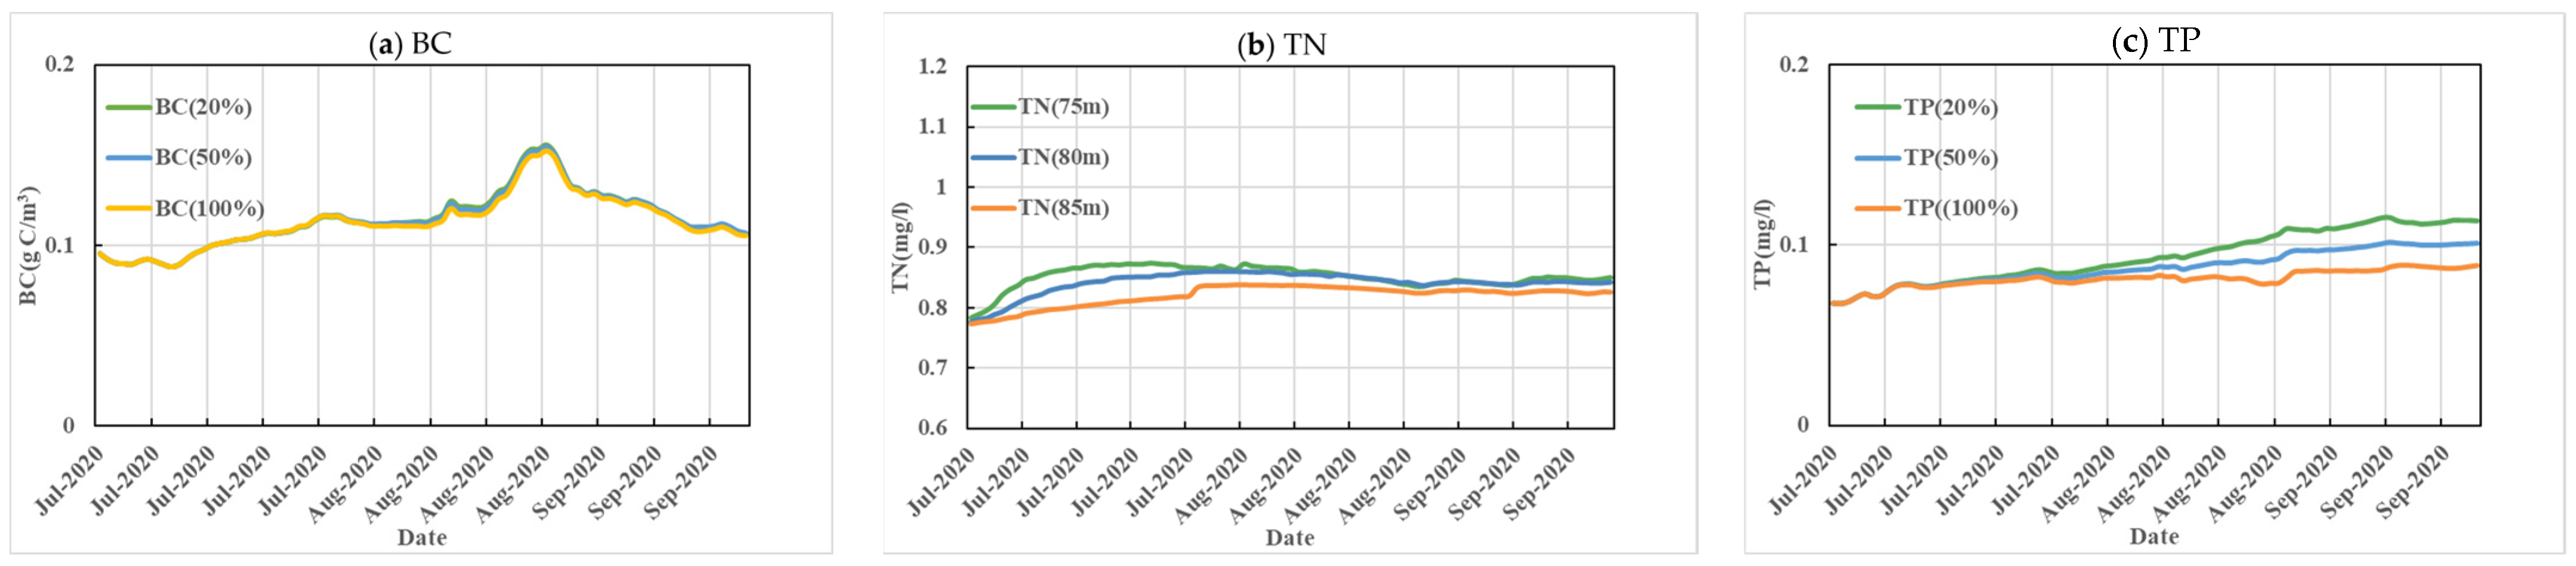
3.2. Analysis of the Impact of the Sediment Pollution Reduction Plan

In the reservoir’s sediment pollution reduction scheme, the figure displays the results for both the reservoir center (Figure 8) and the overall reservoir (Figure 9).
The results (Figure 8) of the reservoir area simulation indicate the following conclusion:
(1) The reduction in bottom sediment has a minimal impact on the growth of blue-green algae, slightly decreasing the algal biomass.
(2) The reduction in bottom sediment significantly affects the concentration of nutrients in the reservoir center, notably decreasing the concentration of total phosphorus and total nitrogen. A 25% reduction leads to a 6% decrease in total nitrogen and an 8% decrease in total phosphorus. A reduction of 50% results in a 12% decrease in total nitrogen and a 14% decrease in total phosphorus.
The results (Figure 9) of the reservoir area simulation indicate the following conclusion:
(1) Overall, dredging and cleaning the bottom sediment has a greater impact on algal growth in the dock and shallow water areas of the bays compared to the deepwater areas of the reservoir. This is because, on the one hand, although there is a reduction in nutrients in the deepwater areas, the diffusion of released nutrients from the bottom to the surface is weaker, resulting in a smaller effect compared to the shallow water areas. On the other hand, the two-dimensional model considers the time cost and averages the algal concentration vertically at the grid scale [57]. However, the actual distribution of algae is not uniform, with the majority existing in the surface layer within the photic zone. Assessing algal growth by removing the influence of water depth, possibly using g/m2, might be more appropriate.
(2) Overall, the reduction in internal sources in the reservoir significantly decreases the concentration of total nitrogen and total phosphorus, but they still remain above the threshold levels of 0.6 mg/L for total nitrogen and 0.03 mg/L for total phosphorus. In terms of the inhibitory effect on algal growth, although algal biomass has decreased, the effect is not as significant as the decrease in nutrient concentration. The total nitrogen and total phosphorus from the river inflows at Huokou and Rixi still represent the largest input of nutrients into Shanzai Reservoir. Merely carrying out internal dredging is not enough to achieve the environmental threshold of 0.6 mg/L for total nitrogen and 0.03 mg/L for total phosphorus. To some extent, reducing nutrient levels does not play a decisive role in algal growth, given the strong influence of light and water temperature.
From the results of the model simulation from July to September, it is evident that under an appropriate water temperature and sufficient light intensity, the role of nutrients in algal growth is much less significant than the influence of light and water temperature. Therefore, in the prevention and control of algae, paying continuous attention to temperature and light conditions is particularly crucial [58].

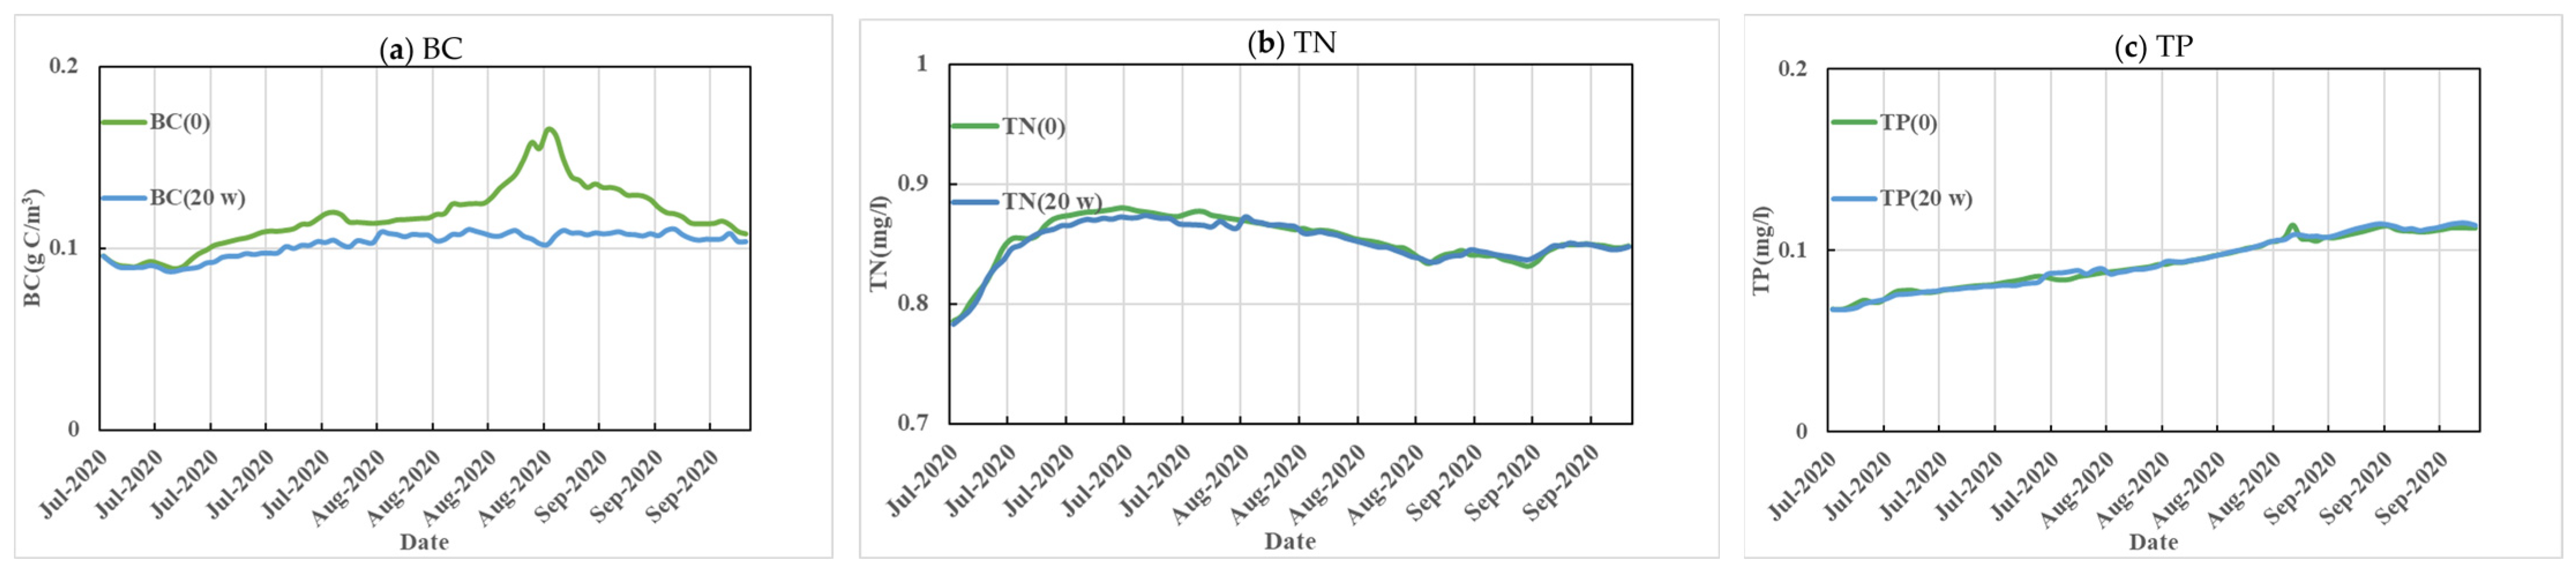
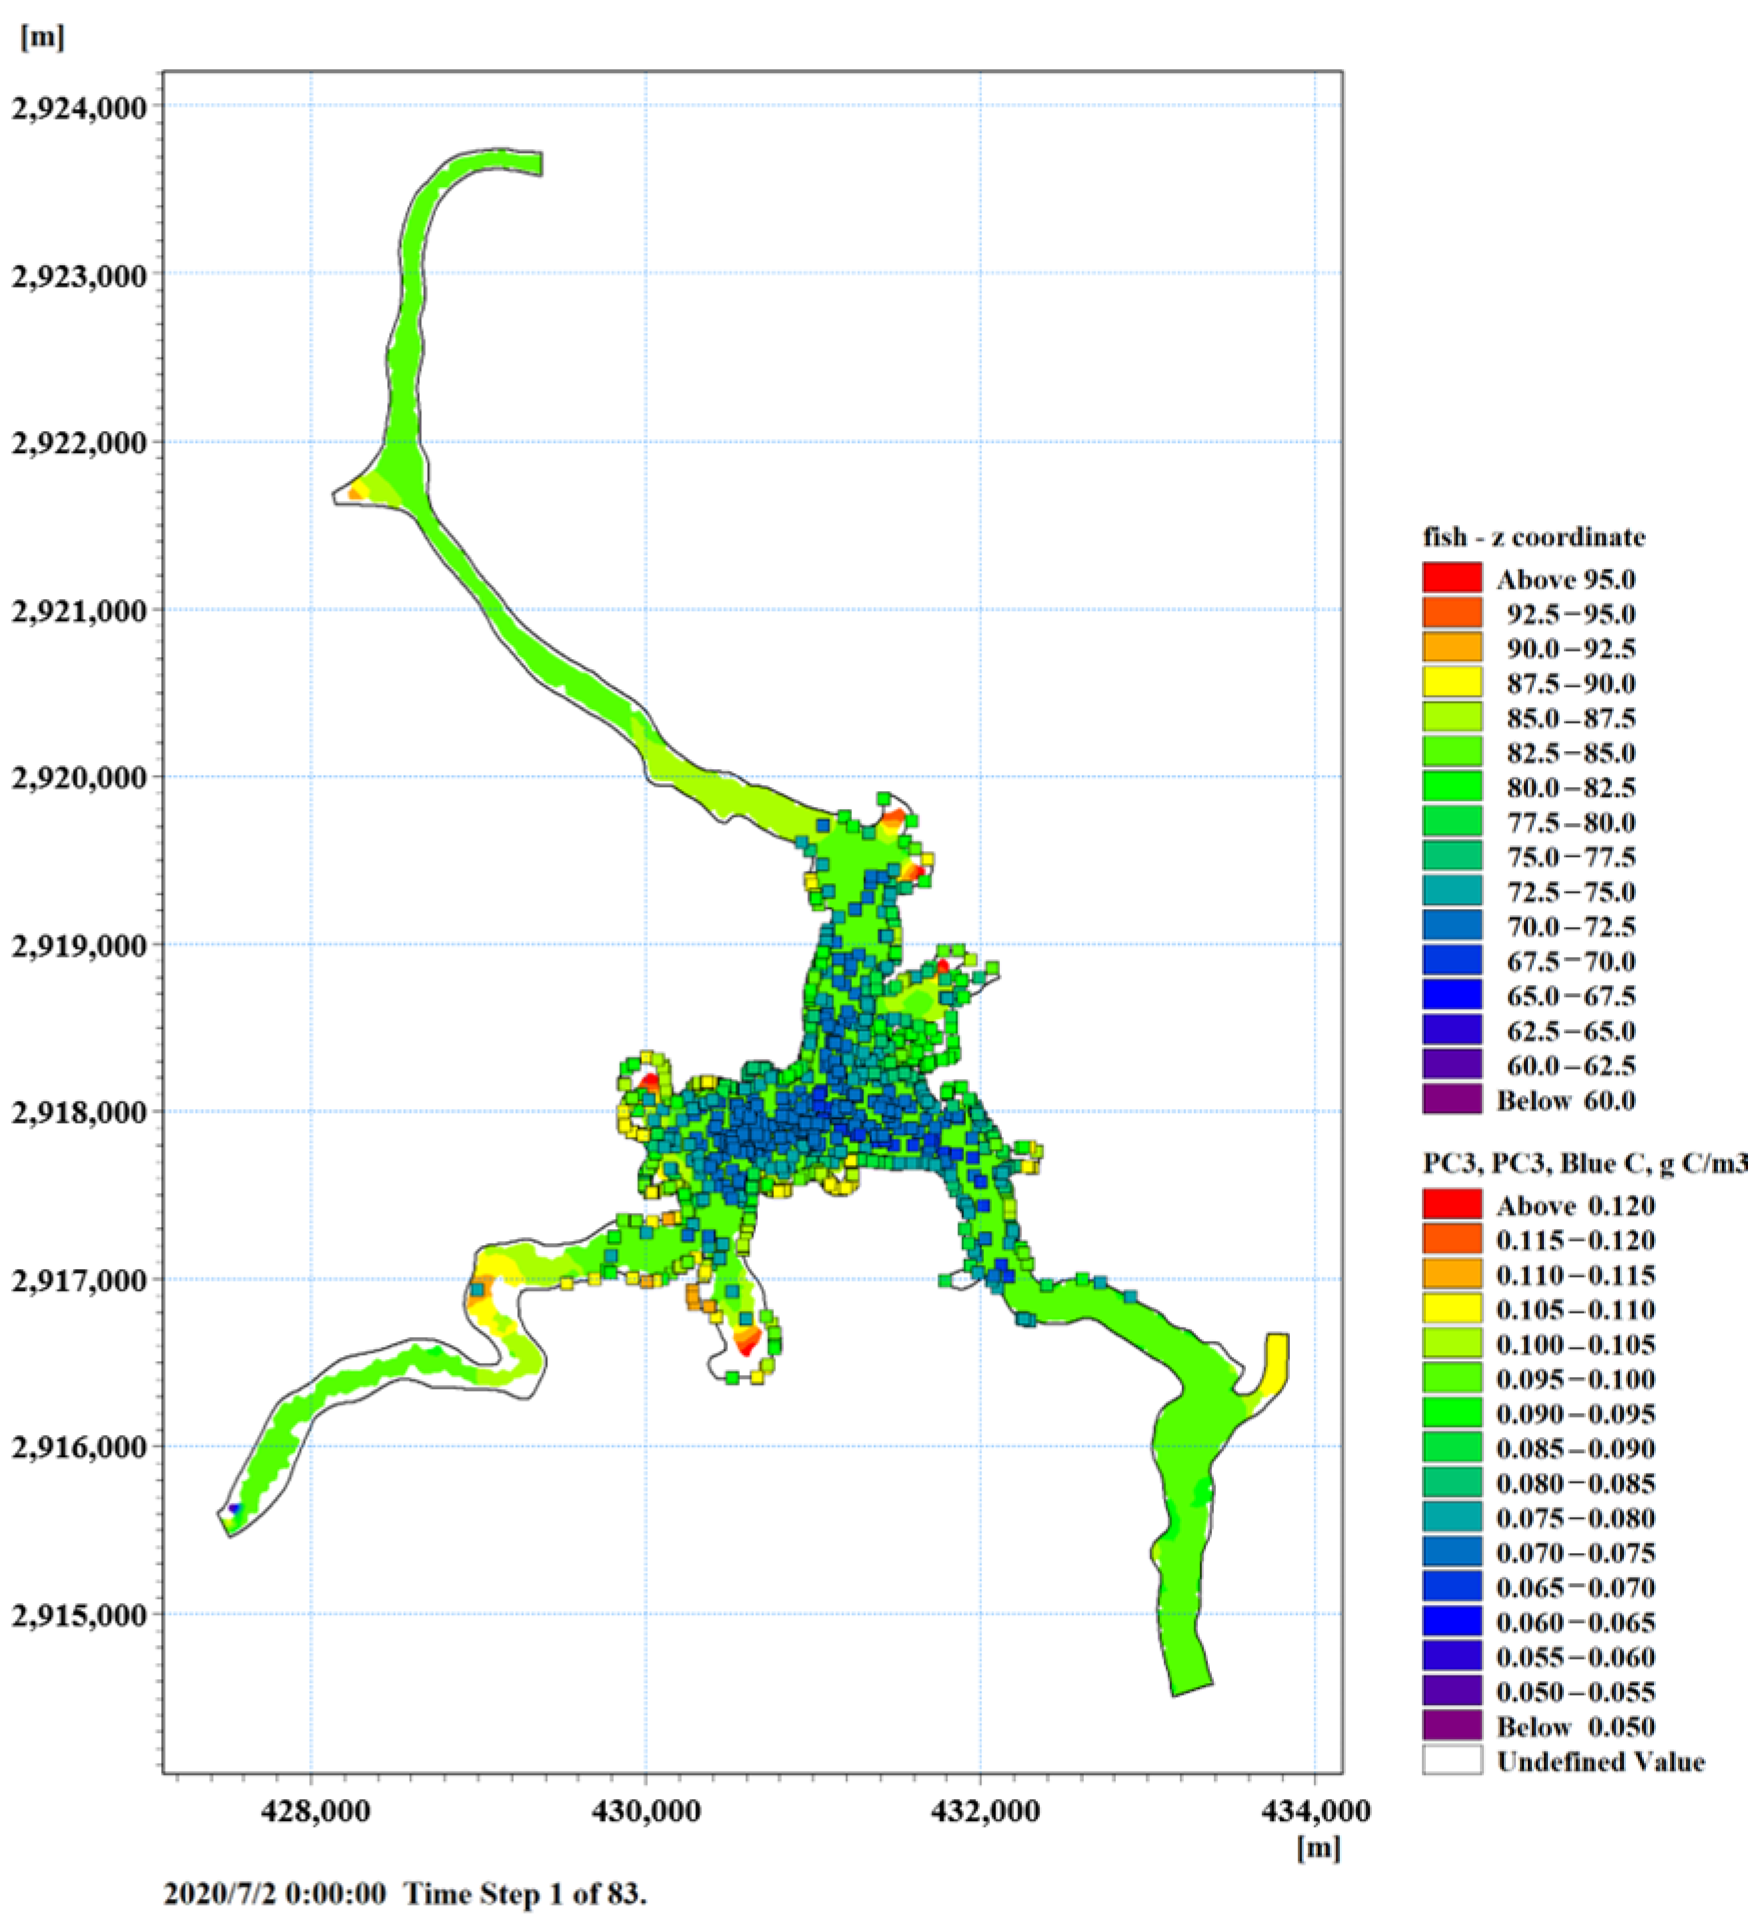
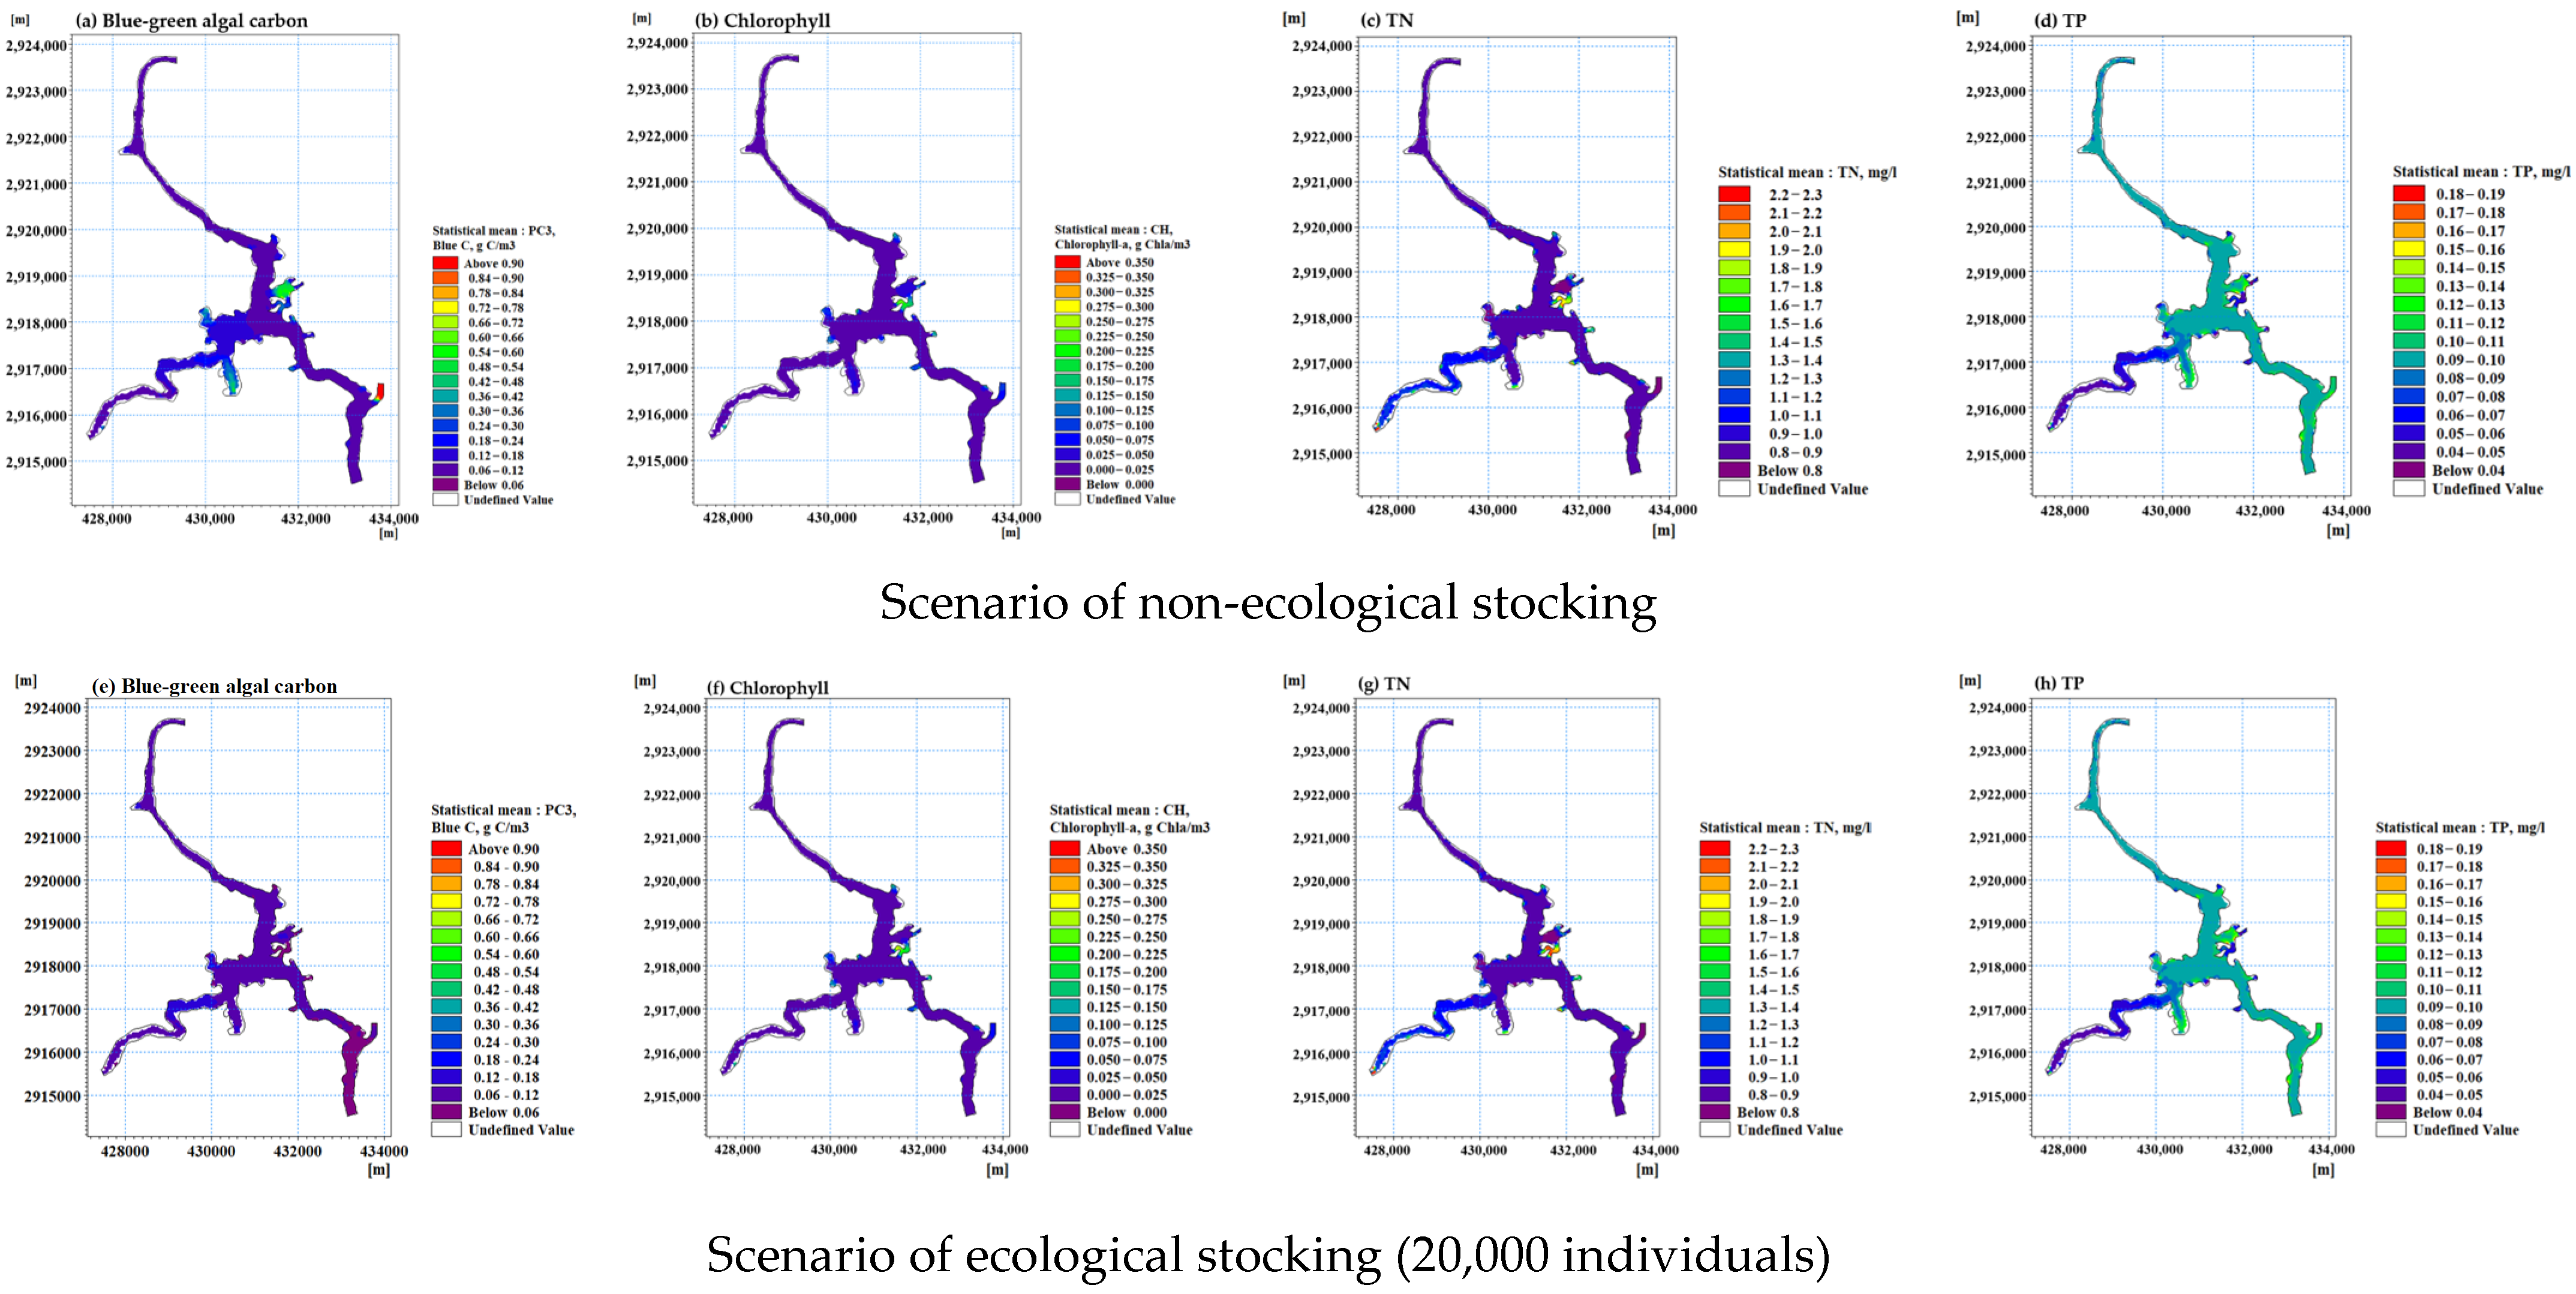
3.3. Ecological Fish Farming

Regarding the reservoir’s ecological fish farming scheme, the results for both the reservoir center (Figure 10) and the overall reservoir (Figure 11 and Figure 12) are presented.
The results (Figure 10) of the reservoir area simulation indicate the following conclusion:
(1) An analysis of the ecological stocking from July to October indicated that the stocking of 200,000 fish had a significant impact on reducing algae biomass. Following the introduction of carp and silver carp, there was an average decrease of approximately 35% in blue-green algae biomass compared to pre-stocking levels. This decrease had a discernible effect on the peak outbreak, leading to a flattening of the overall algae biomass curve. A comparison with the ecological stocking of 300,000 fish by our institute in 2009 yielded similar results.
(2) Following ecological stocking, there was a marginal decrease in the concentration of total nitrogen and total phosphorus in the deep-water area represented by the reservoir center, with a reduction of approximately 1% for total nitrogen and 0.4% for total phosphorus. There are two main reasons for the poor effect of nitrogen and phosphorus reduction. Firstly, in this model, fish only feed on phytoplankton, and the proportion of nitrogen and phosphorus content in algae to total nitrogen in the reservoir is very small. Secondly, In this simulation process, only the predation on phytoplankton was considered, while the situation of fish feeding on organic debris and zooplankton ingestion was ignored. Therefore, the assessment of the reduction ability of fish on total nitrogen and total phosphorus nutrients is relatively conservative, and there is room for improvement in actual effectiveness.
The results (Figure 11 and Figure 12) of the reservoir area simulation indicate the following conclusion:
(1) Following ecological fish farming, the overall distribution of algae biomass became more evenly spread in the reservoir area due to the feeding activity of fish. Regions with previously high levels of algal biomass, such as local bays and shallow waters near the dock, exhibited a significant decrease in biomass after fish stocking.
(2) Although the overall distribution of nutrients decreased in the area, there were instances where nutrient levels increased after ecological stocking, mainly concentrated near the dock or in shallow waters in front of small islands in the reservoir, where algae reproduction was significant.
(3) An analysis of the nitrogen and phosphorus conversion details in the various ecological circulation processes simulated by the model revealed that, primarily due to the large-scale reproduction of algae resulting from ecological fish farming, nitrogen and phosphorus were brought to the surface after stocking, contributing to an “anomalous phenomenon” of increased levels without offsetting the amount brought into the sediment through the dead biomass of algae [59].
Therefore, acknowledging the significant role of planktonic algae in the aquatic ecosystem is paramount; the controlled reproduction of algae acts as an absorber and converter of nitrogen and phosphorus, playing a crucial role in reducing and buffering nutrient concentrations in reservoirs. Pursuing the complete eradication of algae may have detrimental effects on the ecological cycle of reservoirs.

4. Conclusions

This research aims to explore the mechanism of algal growth in the Shanzai Reservoir and establish an algal reproduction growth model to deepen the understanding of the interaction between algal growth and the external environment, encompassing hydrology, meteorology, nutrients, and plankton. This model provides a reliable method to assess the impact of various algae control measures on the overall ecological balance of the reservoir, which is of significant importance. The study evaluated three primary directions of algae control measures—water level, internal source reduction, and ecological stocking. By comparing the effects of these measures on algal biomass and nutrient reduction, future directions in reservoir control research can be derived as follows:
(1) The implementation of ecological hydraulic construction in the reservoir area, integrating algae control with reservoir water conservancy prevention and control. When balancing the ecological water level factor, it is recommended to consider controlling the water level and reservoir capacity within the scope of the flood limit water level and dead storage capacity in water conservancy. This approach ensures macroscopic control over the hydrodynamics and water environment for algae growth.
(2) The adoption of a moderate reduction in pollution sources, with a focus on regular early warning monitoring. In the face of the increasing treatment of basin pollution sources, especially after the effective control of major pollution sources in southern reservoirs, the pursuit of the complete elimination of algae is deemed detrimental to the stability of aquatic ecosystems. The simulation model indicates suitable light and temperature conditions as the main driving forces for algal reproduction, recommending incremental reductions in internal and external sources, along with strengthened regular monitoring, to anticipate and prevent extensive algal growth.
(3) The integration of ecological governance, pollution source reduction, and emergency responses. Combining ecological governance, such as the ecological stocking of fish species like carp and silver carp, with efforts to reduce pollution sources, including internal and external sources in the reservoir, would compensate for the deficiency in nutrient reduction. Over time, this integrated approach will help establish a stable water ecological system in the reservoir, preventing algal outbreaks.

Author Contributions

Conceptualization, Z.Z. and T.L.; methodology, Z.Z.; software, X.Z.; validation, Z.Z., T.L. and Y.L.; formal analysis, Z.Z.; investigation, Z.Z. and Y.L.; resources, Y.L.; data curation, Z.Z. and X.Z., writing—original draft preparation, Z.Z. and X.Z.; writing—review and editing, H.M.; visualization, T.L. and X.Z.; supervision, T.L.; project administration, Z.Z.; funding acquisition, Z.Z. All authors have read and agreed to the published version of the manuscript.

Funding

This research was funded by Sichuan University, State Key Laboratory of Hydraulics and Mountain River Engineering (Grant No. SKHL2322), Environmental Protection Technology Plan Project of Fujian (Grant No. 2021R015), Science and Technology Projects of Shanghai Investigation, Design & Research Institute Co., Ltd. (2023SD(81)-001).

Data Availability Statement

The data presented in this study are available on request from the corresponding author.

Acknowledgments

The authors would like to give our sincerest thanks to those who participated in the data processing and manuscript revisions.

Conflicts of Interest

Author Tingting Liao was employed by the Shanghai Investigation, Design & Research Institute Co., Ltd. The remaining authors declare that the research was conducted in the absence of any commercial or financial relationships that could be construed as a potential conflict of interest. The authors declare that this study received funding from Shanghai Investigation, Design & Research Institute Co., Ltd. The funder was not involved in the study design, collection, analysis, interpretation of data, the writing of this article or the decision to submit it for publication.

References

  1. Vorosmarty, C.J.; Mcintyre, P.B.; Gessner, M.O.; Dudgeon, D.; Prusevich, A.; Green, P.; Glidden, S.; Bunn, S.E.; Sullivan, C.A.; Liermann, C.R.; et al. Global threats to human water security and river biodiversity. Nature 2010, 467, 555–561. [Google Scholar] [CrossRef]
  2. Glibert, P.M. Harmful algae at the complex nexus of eutrophication and climate change. Harmful Algae 2020, 91, 101583. [Google Scholar] [CrossRef] [PubMed]
  3. Wang, X.; Zhou, Y.; Zhao, Z.; Wang, L.; Xu, J.; Yu, J. A novel water quality mechanism modeling and eutrophication risk assessment method of lakes and reservoirs. Nonlinear Dyn. 2019, 96, 1037–1053. [Google Scholar] [CrossRef]
  4. Istvánovics, V. Eutrophication of Lakes and Reservoirs. In Lake Ecosystem Ecology; Elsevier: San Diego, CA, USA, 2010; pp. 47–55. [Google Scholar]
  5. Chislock, M.F.; Sarnelle, O.; Olsen, B.K.; Doster, E.; Wilson, A.E. Large effects of consumer offense on ecosystem structure and function. Ecology 2013, 94, 2375–2380. [Google Scholar] [CrossRef] [PubMed]
  6. Chislock, M.F.; Doster, E.; Zitomer, R.A.; Wilson, A.E. Eutrophication: Causes, consequences, and controls in aquatic ecosystems. Nat. Educ. Knowl. 2013, 4, 10. [Google Scholar]
  7. Area, W.R.M. Nutrients and Eutrophication. 3 March 2019. Available online: https://www.usgs.gov/mission-areas/water-resources/science/nutrients-and-eutrophication (accessed on 3 March 2019).
  8. Dey, I.; Banerjee, S.; Bose, R.; Pal, R. Spatiotemporal variations in the composition of algal mats in wastewater treatment ponds of tannery industry. Environ. Monit. Assess. 2021, 193, 359. [Google Scholar] [CrossRef]
  9. Wagner, T.; Erickson, L.E. Sustainable Management of Eutrophic Lakes and Reservoirs. J. Environ. Prot. Ecol. 2017, 8, 436–463. [Google Scholar] [CrossRef]
  10. Schindler, D.W.; Carpenter, S.R.; Chapra, S.C.; Hecky, R.E.; Orihel, D.M. Reducing phosphorus to curb lake eutrophication is a success. Environ. Sci. Technol. 2016, 50, 8923–8929. [Google Scholar] [CrossRef] [PubMed]
  11. Hambaryan, L.; Khachikyan, T.; Ghukasyan, E. Changes in the horizontal development of phytoplankton of the littoral of Lake Sevan (Armenia) in conditions of water level fluctuations. Limnol. Freshw. Biol. 2020, 3, 662–664. [Google Scholar] [CrossRef]
  12. Zeng, G.; Zhang, R.; Liang, D.; Wang, F.; Han, Y.; Luo, Y.; Gao, P.; Wang, Q.; Wang, Q.; Yu, C.; et al. Comparison of the Advantages and Disadvantages of Algae Removal Technology and Its Development Status. Water 2023, 15, 1104. [Google Scholar] [CrossRef]
  13. Dalu, T.; Wasserman, R.J. Cyanobacteria dynamics in a small tropical reservoir: Understanding spatio-temporal variability and influence of environmental variables. Sci. Total Environ. 2018, 643, 835–841. [Google Scholar] [CrossRef] [PubMed]
  14. Dou, M.; Ma, X.; Zhang, Y.; Zhang, Y.; Shi, Y. Modeling the interaction of light and nutrients as factors driving lake eutrophication. Ecol. Model. 2019, 400, 41–52. [Google Scholar] [CrossRef]
  15. Pers, B.C. Modeling the Response of Eutrophication Control Measures in a Swedish Lake. Ambio 2005, 34, 552–558. [Google Scholar] [CrossRef] [PubMed]
  16. Karul, C.; Soyupak, S.; Çilesiz, A.F.; Akbay, N.; Germen, E. Case studies on the use of neural networks in eutrophication modeling. Ecol. Model. 2000, 134, 145–152. [Google Scholar] [CrossRef]
  17. Heikonen, S.; Heikkilä, M.Y.; Heino, M. Modeling the drivers of eutrophication in Finland with a machine learning approach. Ecosphere 2023, 14, e4522. [Google Scholar] [CrossRef]
  18. Lavrik, V.I.; Dobrynskiy, V.A.; Rogal, I.V. Application of Simulation Mathematical Modeling to the Problems of Management of Eutrophication Processes in Lakes and Reservoirs. Hydrobiol. J. 2002, 38, 10. [Google Scholar] [CrossRef]
  19. Li, Y.; Huang, Y.; Ji, D.; Cheng, Y.; Nwankwegu, A.S.; Paerl, H.W.; Tang, C.; Yang, Z.; Zhao, X.; Chen, Y.; et al. Storm and floods increase the duration and extent of phosphorus limitation on algal blooms in a tributary of the Three Gorges Reservoir, China. J. Hydrol. 2022, 607, 127562. [Google Scholar] [CrossRef]
  20. Roy, K.; Vrba, J.; Kajgrova, L.; Mraz, J. The concept of balanced fish nutrition in temperate European fishponds to tackle eutrophication. J. Clean. Prod. 2022, 364, 132584. [Google Scholar] [CrossRef]
  21. Zeng, Q.; Qin, L.; Li, X. The potential impact of an inter-basin water transfer project on nutrients (nitrogen and phosphorous) and chlorophyll a of the receiving water system. Sci. Total Environ. 2015, 536, 675–686. [Google Scholar] [CrossRef]
  22. Pu, P.; Wang, G.; Hu, C.; Hu, W.; Fan, C. Can We Control Lake Eutrophication by Dredging? Hu Po Ke Xue 2000, 12, 279–287. [Google Scholar]
  23. Anagnostou, E.; Gianni, A.; Zacharias, I. Ecological modeling and eutrophication—A review. Nat. Resour. Model. 2017, 30, e12130. [Google Scholar] [CrossRef]
  24. Wu, G.; Xu, Z. Prediction of algal blooming using EFDC model: Case study in the Daoxiang Lake. Ecol. Model. 2011, 222, 1245–1252. [Google Scholar] [CrossRef]
  25. Dang, T.D.; Arias, M.E.; Tarabih, O.; Phlips, E.J.; Ergas, S.J.; Rains, M.C.; Zhang, Q. Modeling temporal and spatial variations of biogeochemical processes in a large subtropical lake: Assessing alternative solutions to algal blooms in Lake Okeechobee, Florida. J. Hydrol. Reg. Stud. 2023, 47, 101441. [Google Scholar] [CrossRef]
  26. Cui, J.; Xu, H.; Cui, Y.; Song, C.; Qu, Y.; Zhang, S.; Zhang, H. Improved eutrophication model with flow velocity-influence function and application for algal bloom control in a reservoir in East China. J. Environ. Manag. 2023, 348, 119209. [Google Scholar] [CrossRef]
  27. Kuang, C.; Wang, D.; Wang, G.; Liu, J.; Han, X.; Li, Y. Impact of reclamation projects on water quality in jinmeng bay, China. Estuar. Coast. Shelf Sci. 2024, 300, 108719. [Google Scholar] [CrossRef]
  28. Bai, J.; Zhao, J.; Zhang, Z.; Tian, Z. Assessment and a review of research on surface water quality modeling. Ecol. Model. 2022, 466, 109888. [Google Scholar] [CrossRef]
  29. Peiyu, L.; Xuan, W.; Fangbing, M.A. Effect of hydrodynamic conditions on water eutrophication: A review. J. Lake Sci. 2013, 25, 455–462. [Google Scholar] [CrossRef]
  30. Deng, J.; Chen, F.; Liu, X.; Peng, J.; Hu, W. Horizontal migration of algal patches associated with cyanobacterial blooms in an eutrophic shallow lake. Ecol. Eng. 2016, 87, 185–193. [Google Scholar] [CrossRef]
  31. Ranjbar, M.H.; Hamilton, D.P.; Etemad-Shahidi, A.; Helfer, F. Impacts of atmospheric stilling and climate warming on cyanobacterial blooms: An individual-based modelling approach. Water Res. 2022, 221, 118814. [Google Scholar] [CrossRef]
  32. Attayde, J.L.; Hansson, L. Effects of Nutrient Recycling by Zooplankton and Fish on Phytoplankton Communities. Oecologia 1999, 121, 47–54. [Google Scholar] [CrossRef]
  33. Rast, W.; Thornton, J.A. Trends in eutrophication research and control. Hydrol. Process. 1996, 10, 295–313. [Google Scholar] [CrossRef]
  34. Qin, B.; Yang, L.; Chen, F.; Zhu, G.; Zhang, L.; Chen, Y. Mechanism and control of lake eutrophication. Chin. Sci. Bull. 2006, 51, 2401–2412. [Google Scholar] [CrossRef]
  35. Ansari, A.A.; Singh, G.S.; Lanza, G.R.; Rast, W. Eutrophication: Causes, Consequences and Control; Springer: Berlin/Heidelberg, Germany, 2010; Volume 1. [Google Scholar]
  36. Zhou, Q.; Chen, J.; Liu, S.; Zhou, F.; Wen, H. Pollution Control and Well-Being in Rural Areas: A Study Based on Survey Data. Sustainability 2024, 16, 1334. [Google Scholar] [CrossRef]
  37. Liu, Q.; Jiang, Y.; Huang, X.; Liu, Y.; Guan, M.; Tian, Y. Hydrological conditions can change the effects of major nutrients and dissolved organic matter on phytoplankton community dynamics in a eutrophic river. J. Hydrol. 2024, 628, 130503. [Google Scholar] [CrossRef]
  38. Meng, H.; Zhang, J.; Zheng, Z.; Lai, Y.; Geng, H. Risk assessment and spatio-temporal characteristics analysis of water bloom in three large-scale eutrophic reservoirs in Fujian Province, China. Ecol. Indic. 2024, 158, 111539. [Google Scholar] [CrossRef]
  39. Sun, Q.; Jiang, J.; Zheng, Y.; Wang, F.; Wu, C.; Xie, R. Effect of a dam on the optical properties of different-sized fractions of dissolved organic matter in a mid-subtropical drinking water source reservoir. Sci. Total Environ. 2017, 598, 704–712. [Google Scholar] [CrossRef]
  40. Warren, I.R.; Bach, H.K. MIKE 21: A modelling system for estuaries, coastal waters and seas. Environ. Softw. 1992, 7, 229–240. [Google Scholar] [CrossRef]
  41. Ahn, J.; Na, Y.; Park, S.W. Development of two-dimensional inundation modelling process using MIKE21 model. KSCE J. Civ. Eng. 2019, 23, 3968–3977. [Google Scholar] [CrossRef]
  42. Li, X.; Huang, M.; Wang, R. Numerical simulation of Donghu Lake hydrodynamics and water quality based on remote sensing and MIKE 21. ISPRS Int. J. Geo-Inf. 2020, 9, 94. [Google Scholar] [CrossRef]
  43. Xu, C.; Ren, Z.; Huang, S.; Li, J.; Zi, Y.; Hu, X. Simulation Study on the Impact of Water Flow Regulation Based on the MIKE 21 Model in a River Water Environment. Sustainability 2023, 15, 10313. [Google Scholar] [CrossRef]
  44. Engin, G.O.; Gurbulak, E.; Celen, M.; Ulu, F.; Oncel, M.S. Nutrient Modelling in Coastal Waters of Izmit Bay, Turkey. Fresenius Environ. Bull. 2014, 23, 3345–3352. [Google Scholar]
  45. Global Modeling and Assimilation Office (GMAO). MERRA-2 tavg1_2d_rad_Nx: 2d, 1-Hourly, Time-Averaged, Single-Level, Assimilation, Radiation Diagnostics V5.12.4; Goddard Earth Sciences Data and Information Services Center (GES DISC): Greenbelt, MD, USA, 2015. [Google Scholar] [CrossRef]
  46. Wang, Q.; Liu, R.; Men, C.; Guo, L.; Miao, Y. Effects of dynamic land use inputs on improvement of SWAT model performance and uncertainty analysis of outputs. J. Hydrol. 2018, 563, 874–886. [Google Scholar] [CrossRef]
  47. Brient, L.; Lengronne, M.; Bertrand, E.; Rolland, D.; Sipel, A.; Steinmann, D.; Baudin, I.; Legeas, M.; Le Rouzic, B.; Bormans, M. A phycocyanin probe as a tool for monitoring cyanobacteria in freshwater bodies. J. Environ. Monit. 2008, 10, 248–255. [Google Scholar] [CrossRef] [PubMed]
  48. Fadel, A.; Sharaf, N.; Siblini, M.; Slim, K.; Kobaissi, A. A simple modelling approach to simulate the effect of different climate scenarios on toxic cyanobacterial bloom in a eutrophic reservoir. Ecohydrol. Hydrobiol. 2019, 19, 359–369. [Google Scholar] [CrossRef]
  49. Bhagowati, B.; Ahamad, K.U. A review on lake eutrophication dynamics and recent developments in lake modeling. Ecohydrol. Hydrobiol. 2019, 19, 155–166. [Google Scholar] [CrossRef]
  50. Chen, L.; Yang, Z.; Liu, H. Assessing the eutrophication risk of the Danjiangkou Reservoir based on the EFDC model. Ecol. Eng. 2016, 96, 117–127. [Google Scholar] [CrossRef]
  51. Pereira, A.C.; Mulligan, C.N. Practices for Eutrophic Shallow Lake Water Remediation and Restoration: A Critical Literature Review. Water 2023, 15, 2270. [Google Scholar] [CrossRef]
  52. Kakade, A.; Salama, E.; Han, H.; Zheng, Y.; Kulshrestha, S.; Jalalah, M.; Harraz, F.A.; Alsareii, S.A.; Li, X. World eutrophic pollution of lake and river: Biotreatment potential and future perspectives. Environ. Technol. Innov. 2021, 23, 101604. [Google Scholar] [CrossRef]
  53. Jilbert, T.; Couture, R.M.; Huser, B.J.; Salonen, K. Preface: Restoration of eutrophic lakes: Current practices and future challenges. Hydrobiologia 2020, 847, 4343–4357. [Google Scholar] [CrossRef]
  54. Sellergren, M.; Li, J.; Drakare, S.; Thöns, S. Decision Support for Lake Restoration: A Case Study in Swedish Freshwater Bodies. Water 2023, 15, 668. [Google Scholar] [CrossRef]
  55. Drenner, R.W.; Hambright, K.D. Biomanipulation of fish assemblages as a lake restoration technique. Arch. Hydrobiol. 1999, 146, 129–165. [Google Scholar] [CrossRef] [PubMed]
  56. Beklioğlu, M.; Bucak, T.; Coppens, J.; Bezirci, G.; Tavşanoğlu, Ü.; Çakıroğlu, A.; Levi, E.; Erdoğan, Ş.; Filiz, N.; Özkan, K.; et al. Restoration of eutrophic lakes with fluctuating water levels: A 20-year monitoring study of two inter-connected lakes. Water 2017, 9, 127. [Google Scholar] [CrossRef]
  57. Kim, J.; Lee, T.; Seo, D. Algal bloom prediction of the lower han river, korea using the EFDC hydrodynamic and water quality model. Ecol. Model. 2017, 366, 27–36. [Google Scholar] [CrossRef]
  58. Horppila, J. Sediment nutrients, ecological status and restoration of lakes. Water Res. 2019, 160, 206–208. [Google Scholar] [CrossRef] [PubMed]
  59. Zhou, J.; Qiu, H.; Chen, Y.; Ma, X.; Yu, G.; Hong, Y.; Hu, B. Fish-mussel-algae-bacteria model remedied eutrophication pollution: Application in Dongxiang district reservoir. Environ. Pollut. 2024, 342, 123011. [Google Scholar] [CrossRef] [PubMed]
Figure 1. (a) Fujian Province, in the yellow section, is located on the southeastern coast of China; (b) Fuzhou City, in the pink section, is located at the eastern end of central Fujian Province; (c) the boundary of Shanzai Reservoir. These points are hydrological and water quality monitoring sites.
Water 16 01494 g001
Figure 2. Schematic diagram of eutrophication model structure.
Water 16 01494 g002
Figure 3. Domain and grid partitioning in the model.
Water 16 01494 g003
Figure 4. Verification of hydrodynamic simulation results.
Water 16 01494 g004
Figure 5. Water quality simulation results’ verification.
Water 16 01494 g005
Figure 6. (a) Comparison of carbon content of blue-green algae (BC) in different water level scenarios; (b) comparison of total nitrogen (TN) concentration in different water level scenarios; (c) comparison of total phosphorus (TP) concentration in different water level scenarios.
Water 16 01494 g006
Figure 7. Comparison of carbon content of blue-green algae (a,e,i), chlorophyll concentration (b,f,j), total nitrogen concentration (c,g,k), and total phosphorus concentration (d,h,l) in scenarios with a water level of 75 m (ad), 80 m (eh), and 85 m (il).
Water 16 01494 g007
Figure 8. (a) Comparison of carbon content of blue-green algae (BC) in different dredging scenarios; (b) comparison of total nitrogen (TN) concentration in different dredging scenarios; (c) comparison of total phosphorus (TP) concentration in different dredging scenarios.
Water 16 01494 g008
Figure 9. Comparison of carbon content of blue-green algae (a,e,i), chlorophyll concentration (b,f,j), total nitrogen concentration (c,g,k), and total phosphorus concentration (d,h,l) in original sediment cleaning (ad), 20% sediment cleaning (eh), and 50% sediment cleaning (il) scenarios.
Water 16 01494 g009
Figure 10. (a) Comparison of carbon content of blue-green algae (BC) in different farming schemes; (b) comparison of total nitrogen (TN) concentration in different farming scenarios; (c) comparison of total phosphorus (TP) concentration in different farming scenarios.
Water 16 01494 g010
Figure 11. After one day of release, the fish fry dispersed and swam away.
Water 16 01494 g011
Figure 12. Comparison of carbon content of blue-green algae (a,e), chlorophyll concentration (b,f), total nitrogen concentration (c,g), and total phosphorus concentration (d,h) in non-ecological stocking (ad) and ecological stocking (20,000 individuals) (eh) scenarios.
Water 16 01494 g012
Table 1. State variables and initial value settings.
State VariableDescriptionInitial ValueUnit
BACBlue algae carbon content0.1g C/m3
BANBlue algae nitrogen content0.014g N/m3
BAPBlue algae phosphorus content0.002g P/m3
BACHBlue algae chlorophyll content0.001g CH/m3
Diatoms SiDiatoms silicon content0.01g Si/m3
Zooplankton CZooplankton carbon0.003g C/m3
DCDetritus carbon content0.5g C/m3
DNDetritus nitrogen content0.3g N/m3
Detritus PDetritus phosphorus content0.02g P/m3
Detritus SiDetritus silicon content0.1g Si/m3
Dissolved oxygenDissolved oxygen11.05g DO/m3
AmmoniumAmmonium nitrogen4.05g N/m3
NitrateNitrate nitrogen1.6g N/m3
PhosphatePhosphate0.1g P/m3
SilicateSilicate0.1g Si/m3
Table 2. Model statistical indicators.
Statistical IndicatorsWater Level
(m)
Flow Velocity (m/s)Tem
(°C)
DO (mg/L)TN
(mg/L)
NH3 (mg/L)TP
(mg/L)
CHL (mg/L)
RMSE1.120.0011.241.550.130.520.0057.18
NSE0.980.010.960.650.080.160.320.71
Table 3. Hydrodynamic settings scenario design.
ScenarioWater Level in Front of the DamAquatic Ecological Environment BackgroundNutrient
175The inflow is the average of the last five years, including 35 m3/s in Huokou and 5 m3/s in Rixi. Water quality uses average data of 2022.The nitrogen and phosphorus loads entering the reservoir include inflow and internal sources of pollution. All parameters are set using the model parameters validated in 2020.
280
385
Table 4. Endogenous source cleaning conditions.
ScenarioWater Level in Front of the DamAquatic Ecological Environment Background
120%Idealized setting for sediment reduction to quantify the benefits of dredging. Actual projects should consider safe dredging with negative effects on sediment disturbance and consider zoning, staging, and negative impact. All settings are based on the 2020 modeling parameters.
250%
3100%
Table 5. Ecological farming.
ScenarioSurvival Quantity (Ten Thousand)Fish Fry
(g/piece)
Feed Intake (Daily Weight Percentage, 1/d)Feed Intake (Daily Weight Percentage, 1/d)Hydraulic Conditions
Crucian carp20150.05Actual inflow and outflow and water quality from July to September 2020Idealized setting for sediment reduction to quantify the benefits of dredging. Actual projects should consider safe dredging with negative effects on sediment disturbance and consider zoning, staging, and negative impact. All settings are based on the 2020 modeling parameters.
Disclaimer/Publisher’s Note: The statements, opinions and data contained in all publications are solely those of the individual author(s) and contributor(s) and not of MDPI and/or the editor(s). MDPI and/or the editor(s) disclaim responsibility for any injury to people or property resulting from any ideas, methods, instructions or products referred to in the content.

