Article

Temperature-Dependent Mixotrophy in Natural Populations of the Toxic Dinoflagellate Karenia brevis

Horn Point Laboratory, University of Maryland Center for Environmental Science, Cambridge, MD 21613, USA
*
Author to whom correspondence should be addressed.
Current address: Biology Department, Woods Hole Oceanographic Institution, Woods Hole, MA 02543, USA.
Water 2024, 16(11), 1555; https://doi.org/10.3390/w16111555
Submission received: 22 April 2024 / Revised: 20 May 2024 / Accepted: 24 May 2024 / Published: 29 May 2024
(This article belongs to the Section Biodiversity and Functionality of Aquatic Ecosystems)

Abstract

:
Previous studies have revealed that mixotrophs can become more heterotrophic as the temperature rises, although these studies were primarily conducted under laboratory conditions with temperature-acclimated grazers. This study investigated the short-term thermal regulation of grazing and photosynthetic performance, measured in terms of the maximum relative electron transport rate (rETRmax), of natural Karenia brevis populations on cultured Synechococcus. Bloom waters were collected in Sarasota, Florida, during the fall of 2022. Synechococcus were inoculated into K. brevis bloom waters in varying ratios and incubated at an ambient temperature and an ambient temperature ±5 °C (19, 24, and 29 °C). In general, the grazing coefficient, clearance, and ingestion rates were higher in warmer waters, although ingestion rates were significantly regulated by the prey-to-grazer ratios and, to a lesser degree, by temperatures (22 to 204 Synechococcus K. brevis−1 d−1). Overall, the rETRmax of Synechococcus controls generally increased over time with a more substantial increase at warmer temperatures, but, in the presence of grazers, the rETRmax of Synechococcus did not increase, and, remarkably, even decreased in some cases. These findings suggest that grazing on Synechococcus could directly regulate Synechococcus concentrations and indirectly reduce the photosynthetic performance of prey. Furthermore, this study demonstrates that the thermal regulation of grazing and photosynthetic performance can occur on a short-term basis.

1. Introduction

The metabolic theory of ecology predicts that metabolic rates increase with rising temperatures, with heterotrophic metabolism being more temperature-sensitive than autotrophic metabolism [1,2]. Several studies have demonstrated that mixotrophs become more phago-heterotrophic as temperatures increase (e.g., [3,4]) or exhibit increased temperature tolerance when provided with a food source (e.g., [5]). These findings suggest potential alterations in the role of mixotrophs in global food webs and carbon cycling in response to climate change [6]. However, most studies have been conducted in controlled laboratory conditions with grazers acclimated to specific temperatures. To complement these studies, we conducted short-term grazing experiments using natural Karenia populations to subject them to sudden temperature changes, mimicking the conditions that cells are likely to experience in the field.
Karenia brevis is a toxic mixotrophic dinoflagellate responsible for the nearly annual Florida red tide [7]. This species can be found throughout the year in the waters of the Gulf of Mexico, especially in the West Florida Shelf, but blooms are typically initiated from late summer to early fall [8,9]. On a daily basis, K. brevis undergoes thermal fluctuations. These cells disperse to deeper depths at night but migrate into surface waters during the daytime due to phototactic and negative geotactic responses [10]. Sharp vertical thermal gradients may be encountered in the surface water during the day, and cells might undergo strong temperature gradients while undergoing vertical migration [11]. Therefore, grazing and photosynthetic responses to ambient temperature and ±5 °C variations were herein investigated.
The phago-mixotrophic ability of K. brevis was observed by providing cyanobacterium Synechococcus as prey, as this organism has been shown to be a preferred prey item in previous studies [12,13,14]. However, these previous studies were conducted in controlled laboratory environments with cultured K. brevis. In the field, based on a pigment analysis, an inverse relationship between the spatial extent of picocyanobacteria (e.g., Synechococcus) and K. brevis was observed [15]. Additionally, an inverse relationship between cell concentrations of Synechococcus-like species and K. brevis collected near Sanibel Island, Florida, was reported [16]. Collectively, these patterns suggest mixoplanktonic grazing by natural populations of K. brevis on Synechococcus or, at least, that the presence of K. brevis negatively affects Synechococcus in the coastal waters of Florida.
Previous studies of the mixoplanktonic behavior of cultured K. brevis were conducted with grazers acclimated to 20 °C [12,13,14]. The grazing responses of K. mikimotoi—a close relative to K. brevis—have also been investigated at a single temperature, 20 °C [17,18,19]. In the present study, the feeding behavior and photosynthetic responses of natural K. brevis populations and cultured prey to short-term temperature variations (ambient temperature and ±5 °C variations) were examined. We hypothesized that K. brevis will become more heterotrophic when exposed to warmer temperatures, even on a short-term basis.

2. Materials and Methods
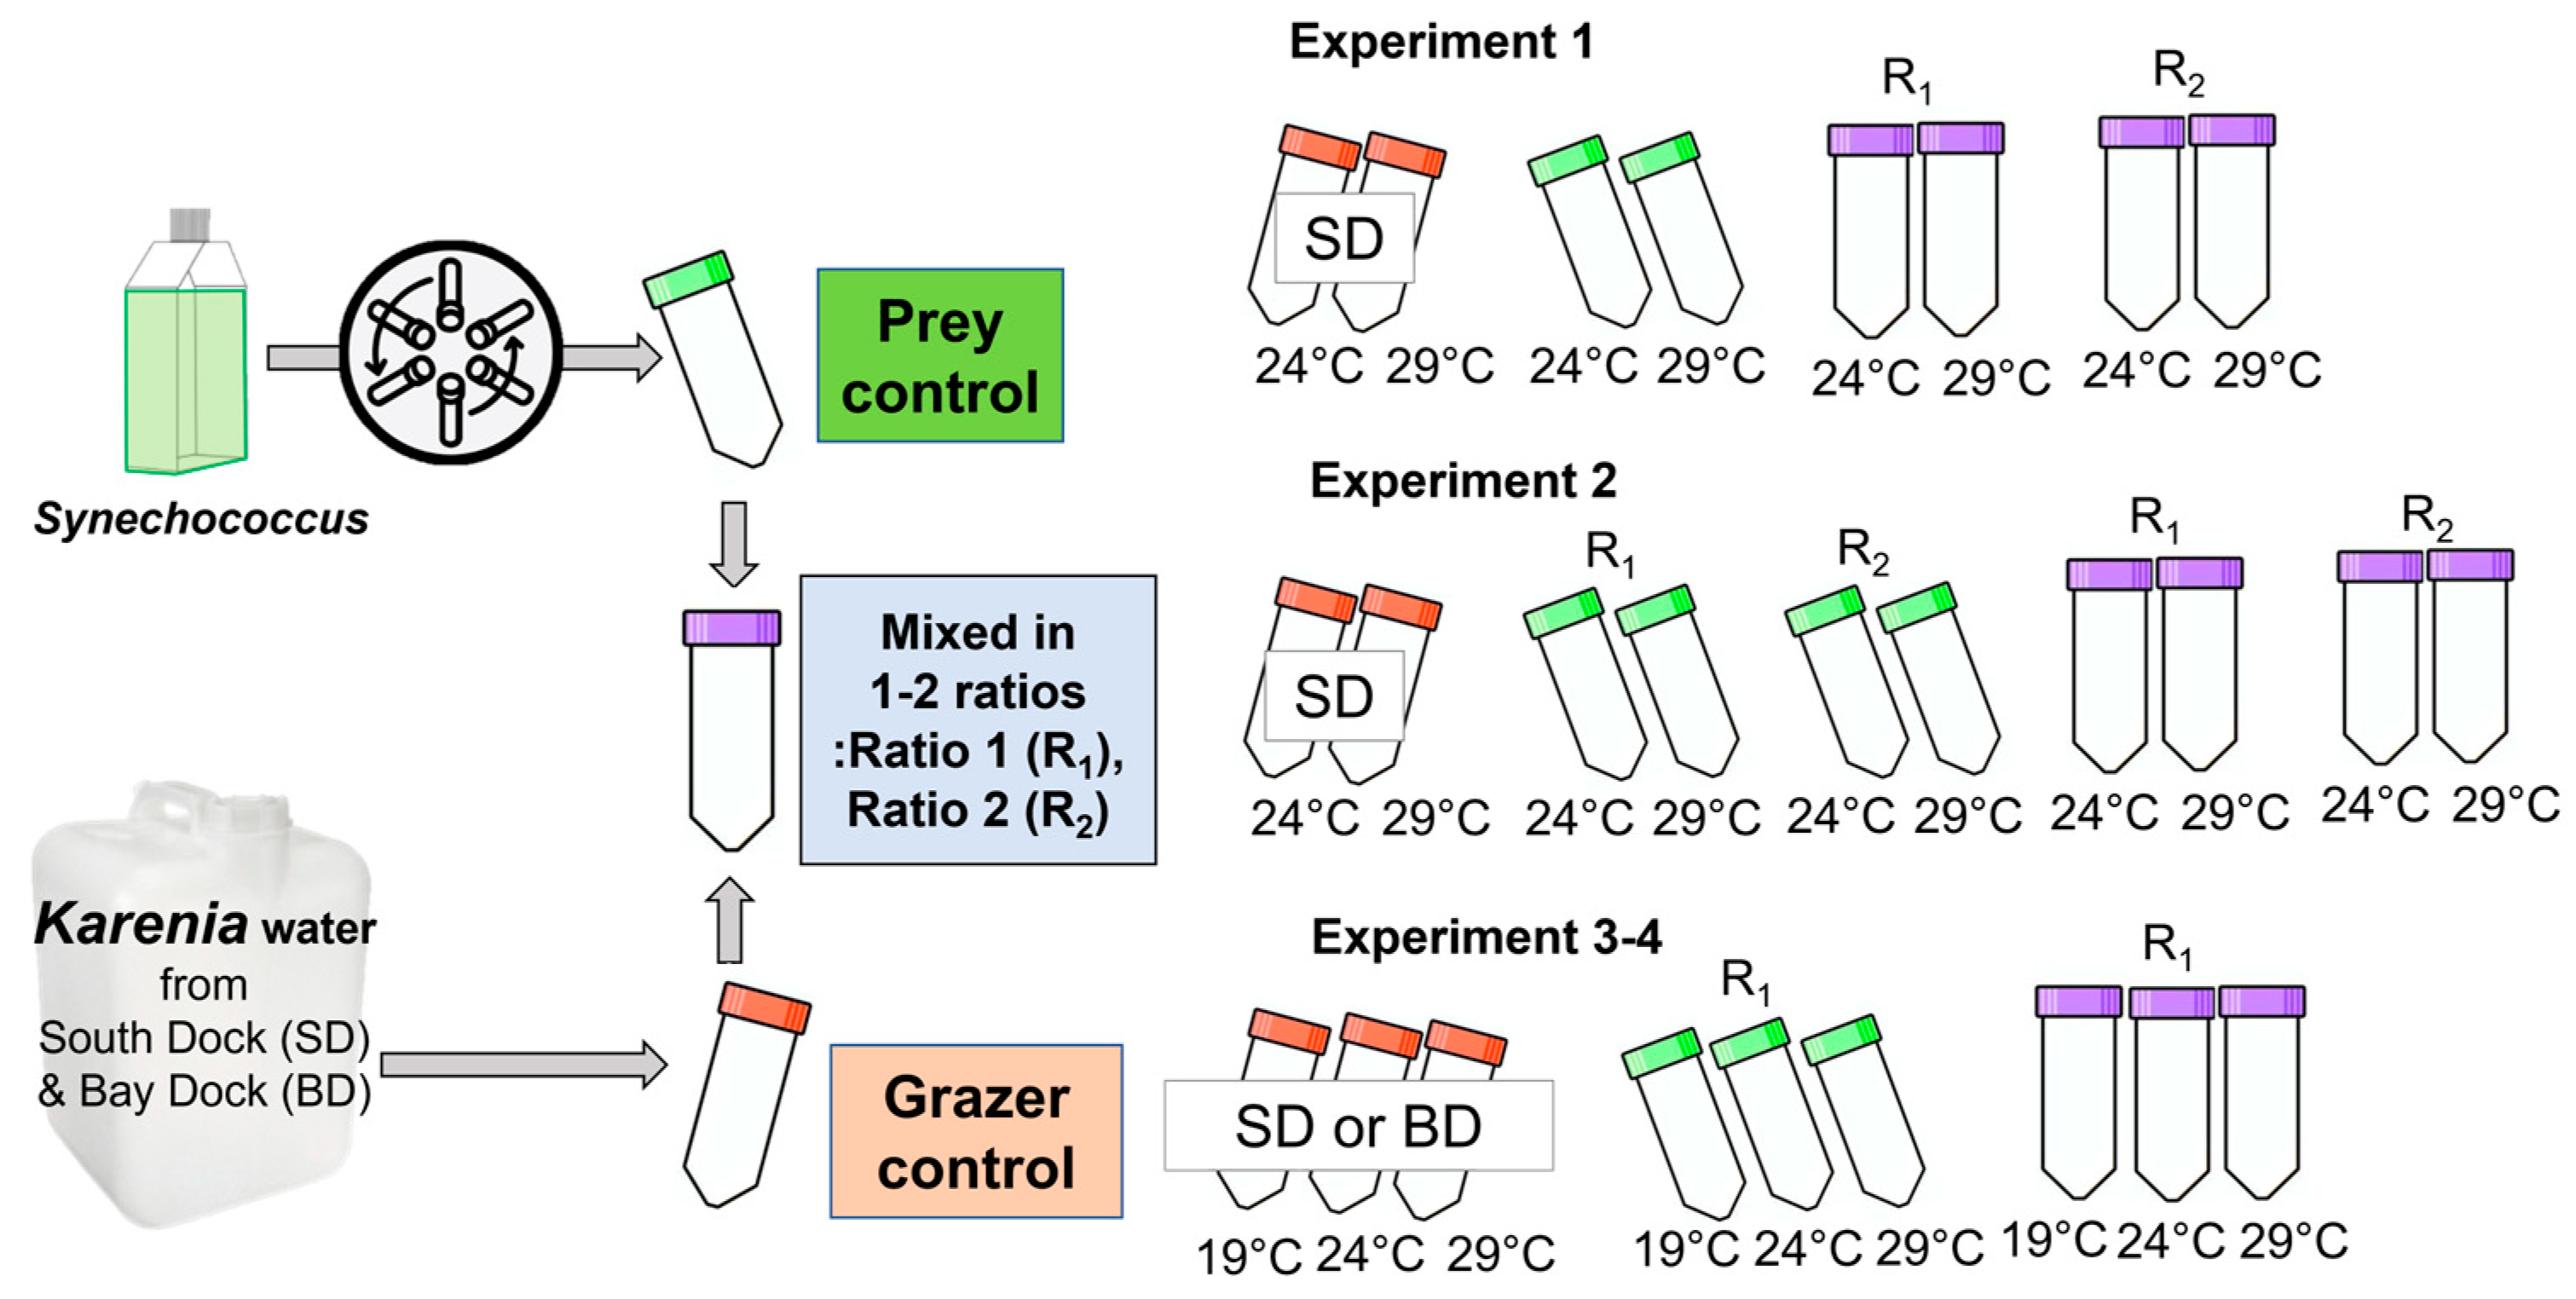
2.1. Field Sampling

Bloom waters were collected over four days, from 28 November 2022 to 30 November 2022, and 2 December 2022 (Table 1). Surface waters were collected at two sites in Sarasota, Florida, herein designated as South Dock (SD; dock near the Sarasota Sailing Squadron) and Bay Dock (BD; Mote Marine Laboratory dock) between 9 am and 10 am using a bucket. Samples were transported within 30 min under shade to the location where experiments were conducted. Surface temperatures were measured with a YSI hand-held instrument (YSI Inc., Yellow Springs, OH, USA). Samples for dissolved inorganic nutrients (nitrate + nitrite, ammonium, and phosphate) were filtered through Whatman GF/F filters (Whatman, Maidstone, UK) and filtrates were frozen for subsequent analysis. The filtrates were later analyzed at the Bigelow Laboratory for Ocean Sciences, East Boothbay, ME, USA.

2.2. Prey Culture

A culture of non-axenic Synechococcus sp. (CCMP836) was maintained at 20 °C with a salinity of 30 and a light intensity of 100 µmol photons m−2 s−1 in a 12 h light–12 h dark cycle. The medium for the original stock culture was prepared using previously collected nutrient-poor offshore Gulf of Mexico seawater. The seawater was filtered through GF/F filters (nominal pore size: ~0.7 µm; Whatman, Maidstone, UK) and autoclaved. Then, 0.2 µm-filtered nutrient stocks were added based on the L1-silicate medium recipe [20].
Before starting the grazing experiments, exponentially growing Synechococcus cultures were centrifuged at 1000× g for 5 min to isolate them from nutrient-rich culture medium. Subsequently, Synechococcus pellets at the bottom of the tubes were resuspended into nutrient-poor offshore Gulf of Mexico seawater with a salinity of 33–34. Resuspended Synechococcus cultures were then maintained at 22–24 °C with a light intensity of 50–100 µmol photons m−2 s−1 in a 12 h light–12 h dark cycle.

2.3. Short-Term Ingestion Experiments

Bloom waters collected from SD (all sampling dates) and BD (30 November 2022, only) were divided into 50 mL polypropylene tubes for separate treatments: grazer control, prey control, and grazers mixed with prey at one or two different ratios (R1 and R2). The prey-to-grazer ratios (water volume–volume) were set based on fluorescence signals of both Karenia and Synechococcus as determined using a Phyto-PAM-II fluorometer (Heinz Walz GmbH, Effeltrich, Germany). All treatments were exposed to two (Experiments 1, 2) to three (Experiments 3, 4) different temperatures, including ambient (24 °C) and ambient temperature ±5 °C (19, 29 °C) (Figure 1). All incubations were conducted in custom-made temperature-controlled water baths (Bay Instruments LLC., Easton, MD, USA), illuminated by LED lights with 100–150 μmol photons m−2 s−1.
Bloom waters collected from SD were used as grazer controls and also to provide grazers that were mixed with resuspended Synechococcus cultures in Experiments 1 and 2. In Experiment 1, the prey-to-predator water ratios (R1 and R2 by water volume) were 3:1 and 5:4, respectively, and samplings were conducted at T0 (Time0), T3, T24, and T72. In Experiment 2, R1 and R2 for the mixed treatments were 2:3 and 5:8 (by water volume), respectively, and prey controls were diluted using filtrates of bloom waters in the same ratios as the mixed treatments (prey control R1 and R2). Samplings were carried out at T0, T5, T24, and T48 in Experiment 2. All incubations were conducted at 24 °C and 29 °C in Experiments 1 and 2. Samples for cell counting and PAM analysis were obtained at all sampling points except at T24 for prey control R2 of Experiment 2.
In Experiments 3 and 4, BD and/or SD bloom waters were used as grazer controls and were mixed with prey cultures. The ratios were 1:1 (R1) for BD (Experiment 3) and 1:4 (R1) for SD (Experiments 3–4). Prey controls were diluted in the same ratios as the mixed treatments (Prey control R1). Incubations took place at 19, 24, and 29 °C and samplings were conducted at T0, T4, and T24 for SD treatments and at T0, T4, T24, and T48 for BD treatments in Experiment 3. Additional PAM analyses of mixed treatments were performed at T2 and T1 for SD and BD treatments, respectively. In Experiment 4, samples were obtained at T0, T1, and T4 and incubated at 19, 24, and 29 °C. The actual prey-to-grazer ratios (cell–cell) for all experiments were determined after subsequent counting of the cell concentrations.

2.4. Enumeration of Grazer and Prey and Rate Calculations

Samples for determining the cell concentrations of grazers were fixed in acid Lugol’s solution (final concentration 2%), while those for prey were fixed with glutaraldehyde (final concentration 0.5%). Grazers were enumerated at 100× g magnification using a Sedgewick Rafter chamber under light microscopy. Samples for prey were filtered onto 25 mm black polycarbonate membrane filters with a pore-size of 0.2 µm (GVS, Bologna, Italy) and then mounted onto glass slides with mounting solution (Thermo Fisher Scientific, Waltham, MA, USA) under a cover slip. Synechococcus cells were counted using an Axiophot epifluorescent microscope (Zeiss, Oberkochen, Germany) using a light excitation filter set (excitation 550 nm and emission 605 nm) at 1000× g magnification. Synechococcus cultures were phycocyanin-type, and thus were autofluorescent in red. At least 400 red cells from 20 random fields were counted per slide.
Specific growth rates were calculated as µ = (lnN2 – lnN1) × (t2t1)−1, where N2 and N1 denote the cell concentrations of prey or grazer cells at times t2 and t1, respectively. The grazing coefficient was calculated as g = µprey control-µprey + grazer. Clearance rates (CR) were calculated by dividing the grazing coefficient, g, with mean predator cell concentrations, P = (P0 × (eµt – 1)) × (µt)−1, where P0 is the initial grazer concentration [21,22]. Ingestion rates (IR) were calculated by multiplying clearance rates with mean prey abundance, C = (C0 × (eµt – 1)) × (µt)−1, where C0 is the initial abundance of prey cells [21,22]. Note that daily and initial hourly rates (within the first 24 h) were calculated in Experiments 1–3, but only initial hourly rates were calculated in Experiment 4 due to the shorter incubation time of that experiment.

2.5. Pulse-Amplitude-Modulated (PAM) Fluorometry

The photosynthetic characteristics of grazer and prey were examined using a Phyto-PAM-II fluorometer (Heinz Walz GmbH, Effeltrich, Germany). Rapid light curves consisting of 10 light steps increasing at intervals of 20 s (0 to ~600 µmol photons m−2 s−1) were performed after a dark adaptation (15 min) of the samples. A modified nonlinear function of Platt et al. [23] was fitted to each curve to obtain the maximum relative electron transport rate (rETRmax) and all values are reported in Supplementary Material. Fluorescence signals of both grazer and prey were obtained with a single measurement because the Phyto-PAM-II fluorometer can differentiate blue-green algae (e.g., phycocyanin-type Synechococcus), green algae, brown algae (diatom and dinoflagellate), and phycoerythrin-containing algae. Reference calibrations for K. brevis for brown algae and Synechococcus for blue-green algae were used.

2.6. Statistical Analysis

All statistical analyses were performed with R software (v4.3.2). Differences in cell concentrations (last two time points), grazing coefficients, clearance rates, ingestion rates, and rETRmax values of prey and grazer (last two time points) across different treatments (control or mixed, 2–3 different temperatures) were analyzed using a t-test or a one-way analysis of variance (ANOVA) with the data passing normality (Shapiro–Wilk test) and equal variance tests (Levene’s test). If data did not satisfy the normality assumption, the non-parametric Wilcoxon rank sum test or Kruskal–Wallis’s analysis was applied. Correlations between variables were examined using Pearson’s product moment correlation with normally distributed data while Spearman rank order correlation was applied if data were not normally distributed. Multiple linear regression was used to explore the relationship between ingestion rates by K. brevis on Synechococcus and prey-to-predator ratios and temperatures. Initial hourly ingestion rates were log-transformed plus one (so zero values could be transformed) to meet the equal variance assumption for regression analysis.

3. Results

3.1. Environmental Conditions

The surface water temperatures varied marginally over the four sampling days (Table 1). Therefore, incubation temperatures, ambient and ambient ±5 °C, followed the setting of Experiment 1 (19 °C, 24 °C, 29 °C), although ambient temperatures were slightly lower in Experiment 2 SD and Experiment 4 SD. The concentrations of major inorganic nutrients, nitrate + nitrite, ammonium, and phosphate, were low (<0.6 µM) during sampling dates, but concentrations of ammonium were somewhat higher (>2 µM) on November 28 and 30 at site SD (Table 1).
All samples were dominated by K. brevis, with concentrations ranging from 2100 to 19,100 cells mL−1 in T0 samples (Table 2). Few other protist plankton (e.g., Prorocentrum sp., Chaetoceros sp.) were present, but they did not exceed 1% of the total community in Experiments 1 SD and 3 BD. In Experiments 2 SD and 3 SD, K. brevis accounted for 93% and 96% of the total communities, respectively. Undefined flagellates in two size ranges, 2–3 µm and 5–6 µm, were also observed. In Experiments 1 and 3, undefined flagellates contributed <0.5% to 2% in T0 samples but slightly increased at Tfinal when incubated at 29 °C (1–5%). In Experiment 2, the percentages of flagellates were 4% in T0 samples, increasing to approximately 15% at 24 °C and 34% at 29 °C in the final sampling points. The contribution of diatoms to total protist plankton was the highest in Experiment 4, ranging from 4% in the T0 sample to approximately 7% in the Tfinal samples. At T0, K. brevis comprised 76% of the total protist plankton, while undefined flagellates (2–3 µm) contributed approximately 19% in Experiment 4. For the Tfinal samples, the contribution of flagellates increased to 21–26% in other temperatures, while it increased to 34% at 29 °C.
The initial concentrations of grazers (P0) were positively correlated with ambient temperature (r = 0.96, p < 0.001, n = 11), nitrate + nitrite (r = 0.60, p < 0.05, n = 11), ammonium (r = 0.70, p < 0.01, n = 11), and phosphate concentrations (r = 0.75, p < 0.001, n = 11) while the initial prey concentrations (C0) were only correlated with phosphate concentrations (r = 0.60, p < 0.05, n = 11). The ambient temperature was positively correlated with nitrate + nitrite (r = 0.53, p < 0.05, n = 5), ammonium (r = 0.73, p < 0.001, n = 5), and phosphate concentrations (r = 0.72, p < 0.01, n = 5).

3.2. Synechococcus Cell Concentration Changes

The cell concentrations of Synechococcus controls were higher than those in the presence of K. brevis, although only Experiments 1 and 2 exhibited significant differences (p < 0.05) (Figure 2). In most of the prey controls, concentrations of Synechococcus increased or remained similar from T0 to Tfinal (solid lines in Figure 2), but the concentration of the prey control at 29 °C was reduced by 37% of the initial concentration at Tfinal in Experiment 3 BD (Figure 2C). When Synechococcus were mixed with grazers, prey concentrations generally decreased with time after 24 h except in the BD treatments in Experiment 3. In other experiments, generally, the Synechococcus abundance in the presence of grazers decreased with time, with a more substantial reduction at 29 °C when experiments lasted longer than 24 h (e.g., 10% and 1% of initial concentrations at Tfinal in Experiment 1 R1 at 24 °C and 29 °C, respectively).

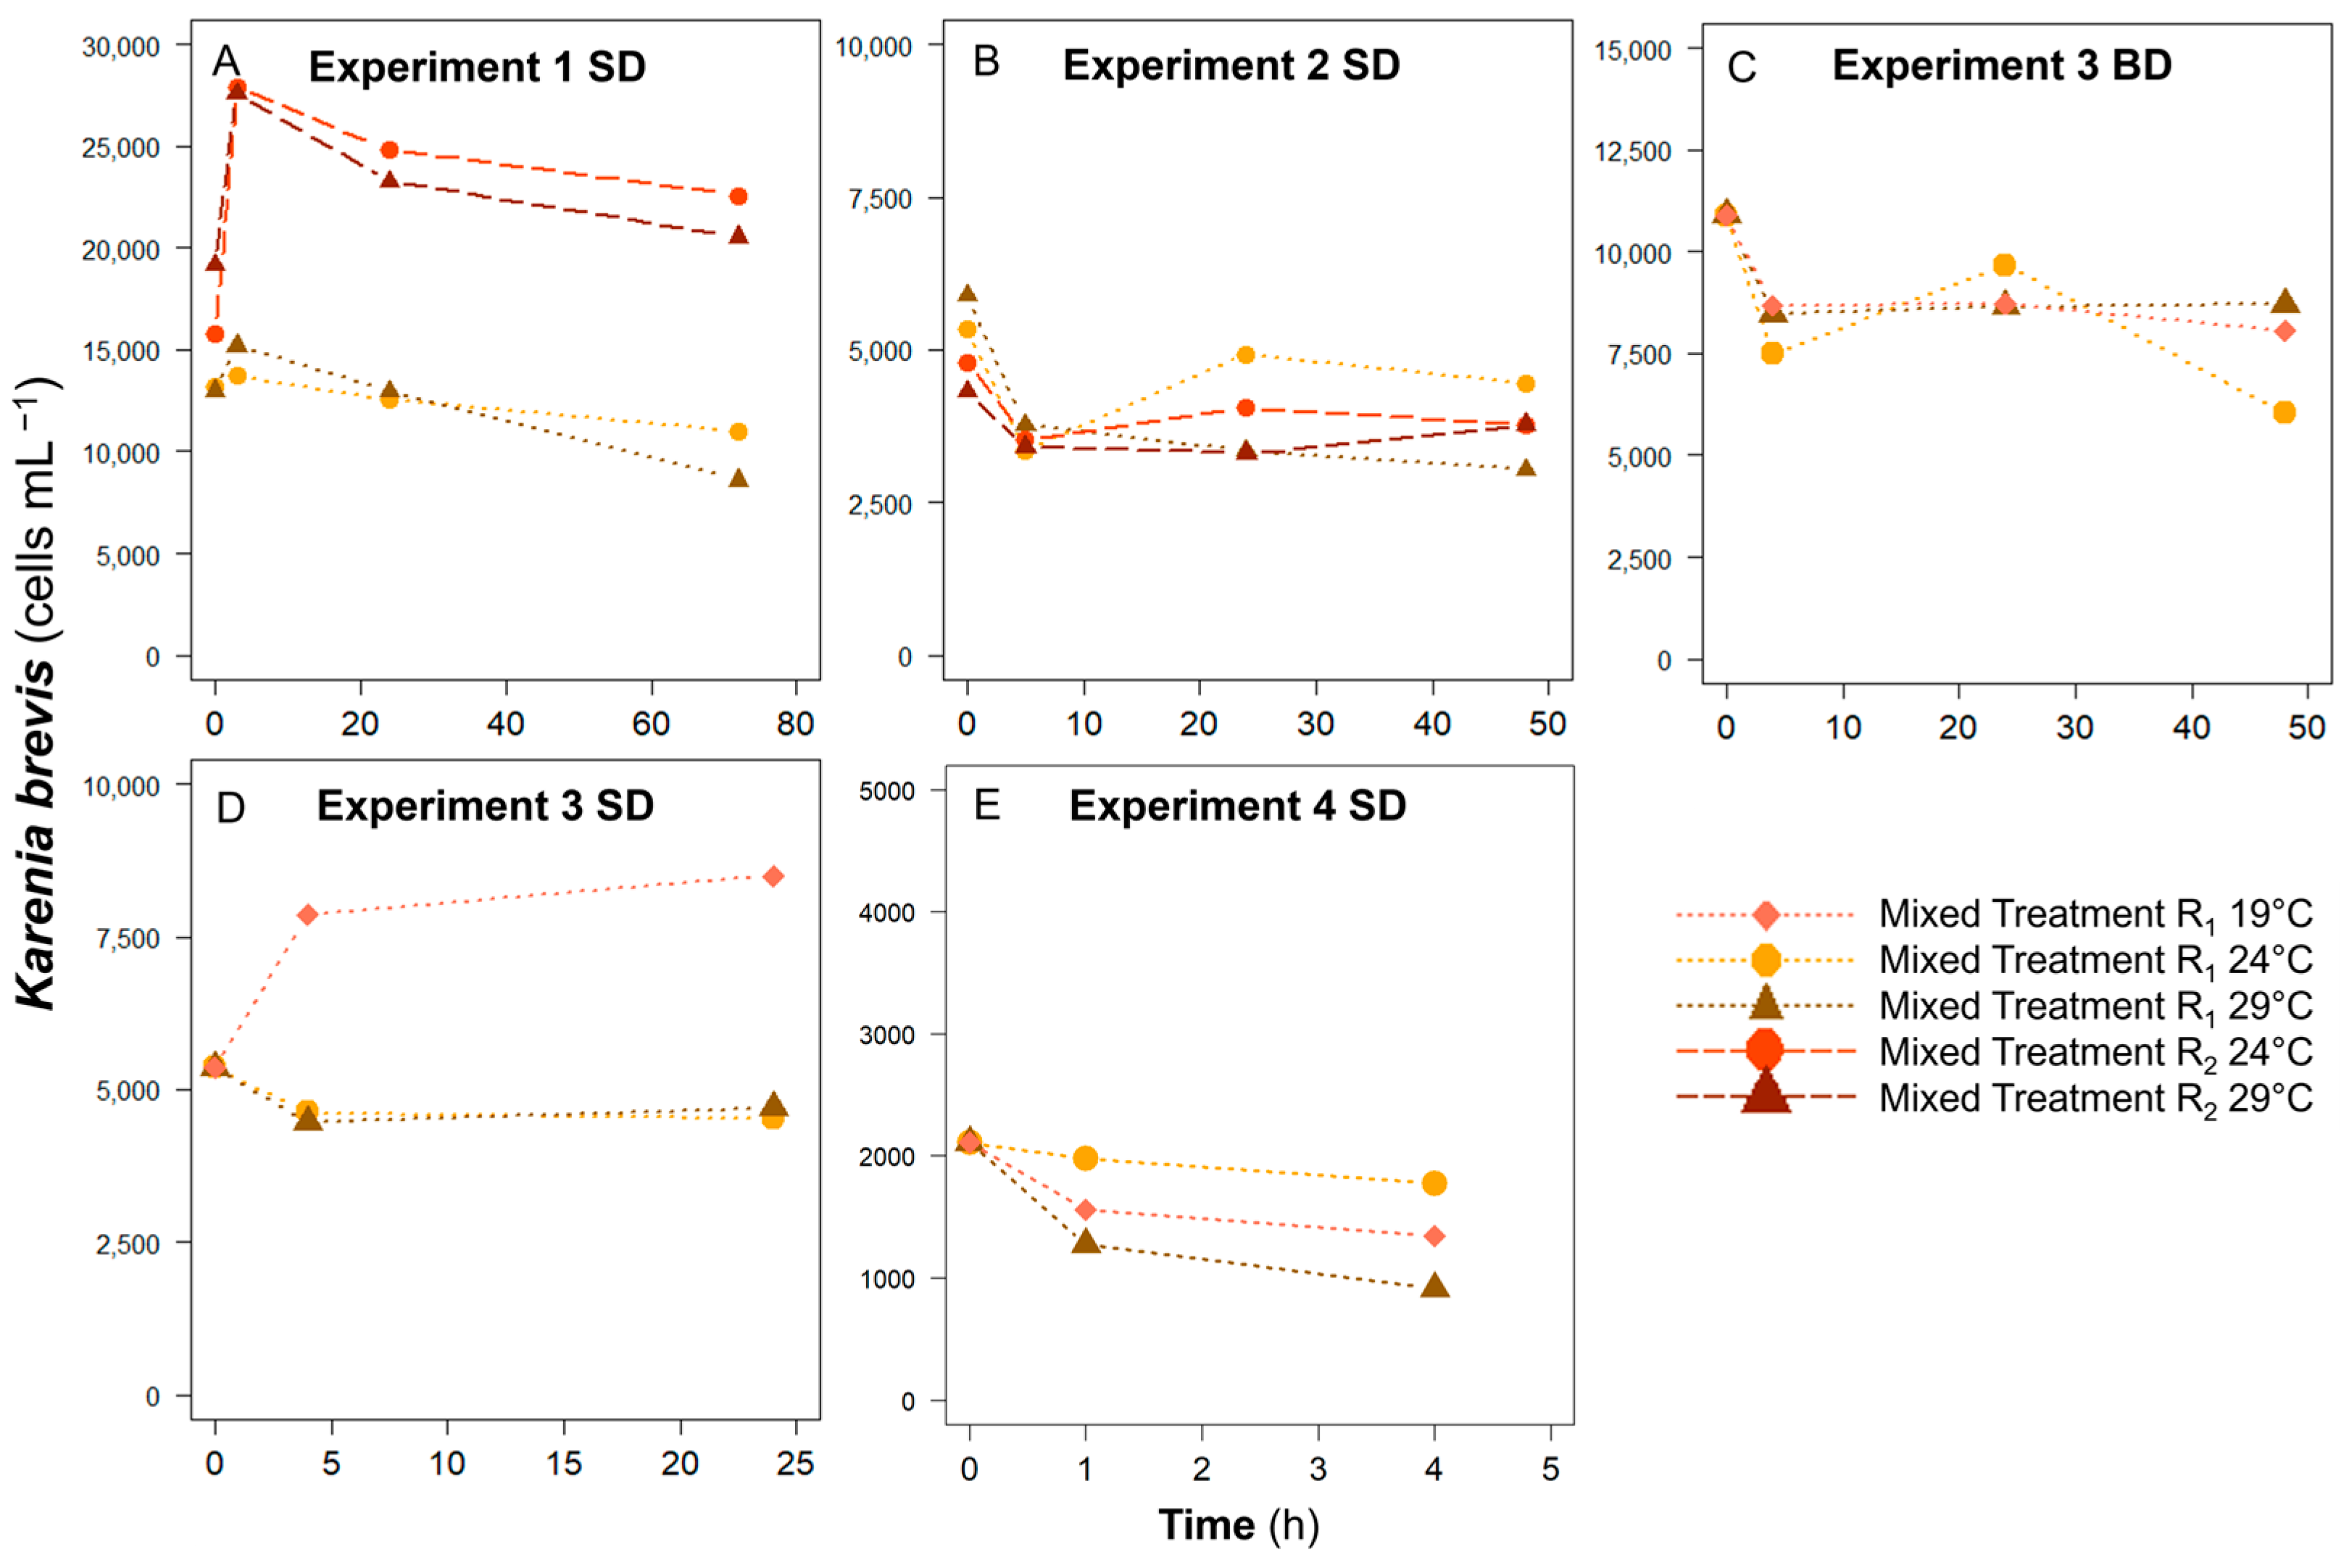
3.3. Karenia brevis Cell Concentration Changes

The cell concentrations of K. brevis primarily decreased with time in all treatments except in the Experiment 1 SD R2 and Experiment 3 SD R1 treatments at 19 °C (Figure 3). In Experiment 1, K. brevis abundance increased in both R1 and R2 treatments with a significant increase in the later treatments at T3 (Figure 3A). On the other hand, in all other treatments, cell concentrations of grazers decreased at T1-T5 and generally maintained their abundances until Tfinal. In Experiments 1 and 2, decreases in abundance were greater at 29 °C. In the R1 treatments, grazer concentrations decreased to 66% and 51% at 29 °C while at 24 °C, they decreased to 84% and 83% of those at T0 in Experiments 1 and 2, respectively. These patterns were not observed in Experiment 3, but the final cell concentration of K. brevis was reduced to 43% when incubated at 29 °C, while it decreased to 84% of the initial abundance at 24 °C in Experiment 4.

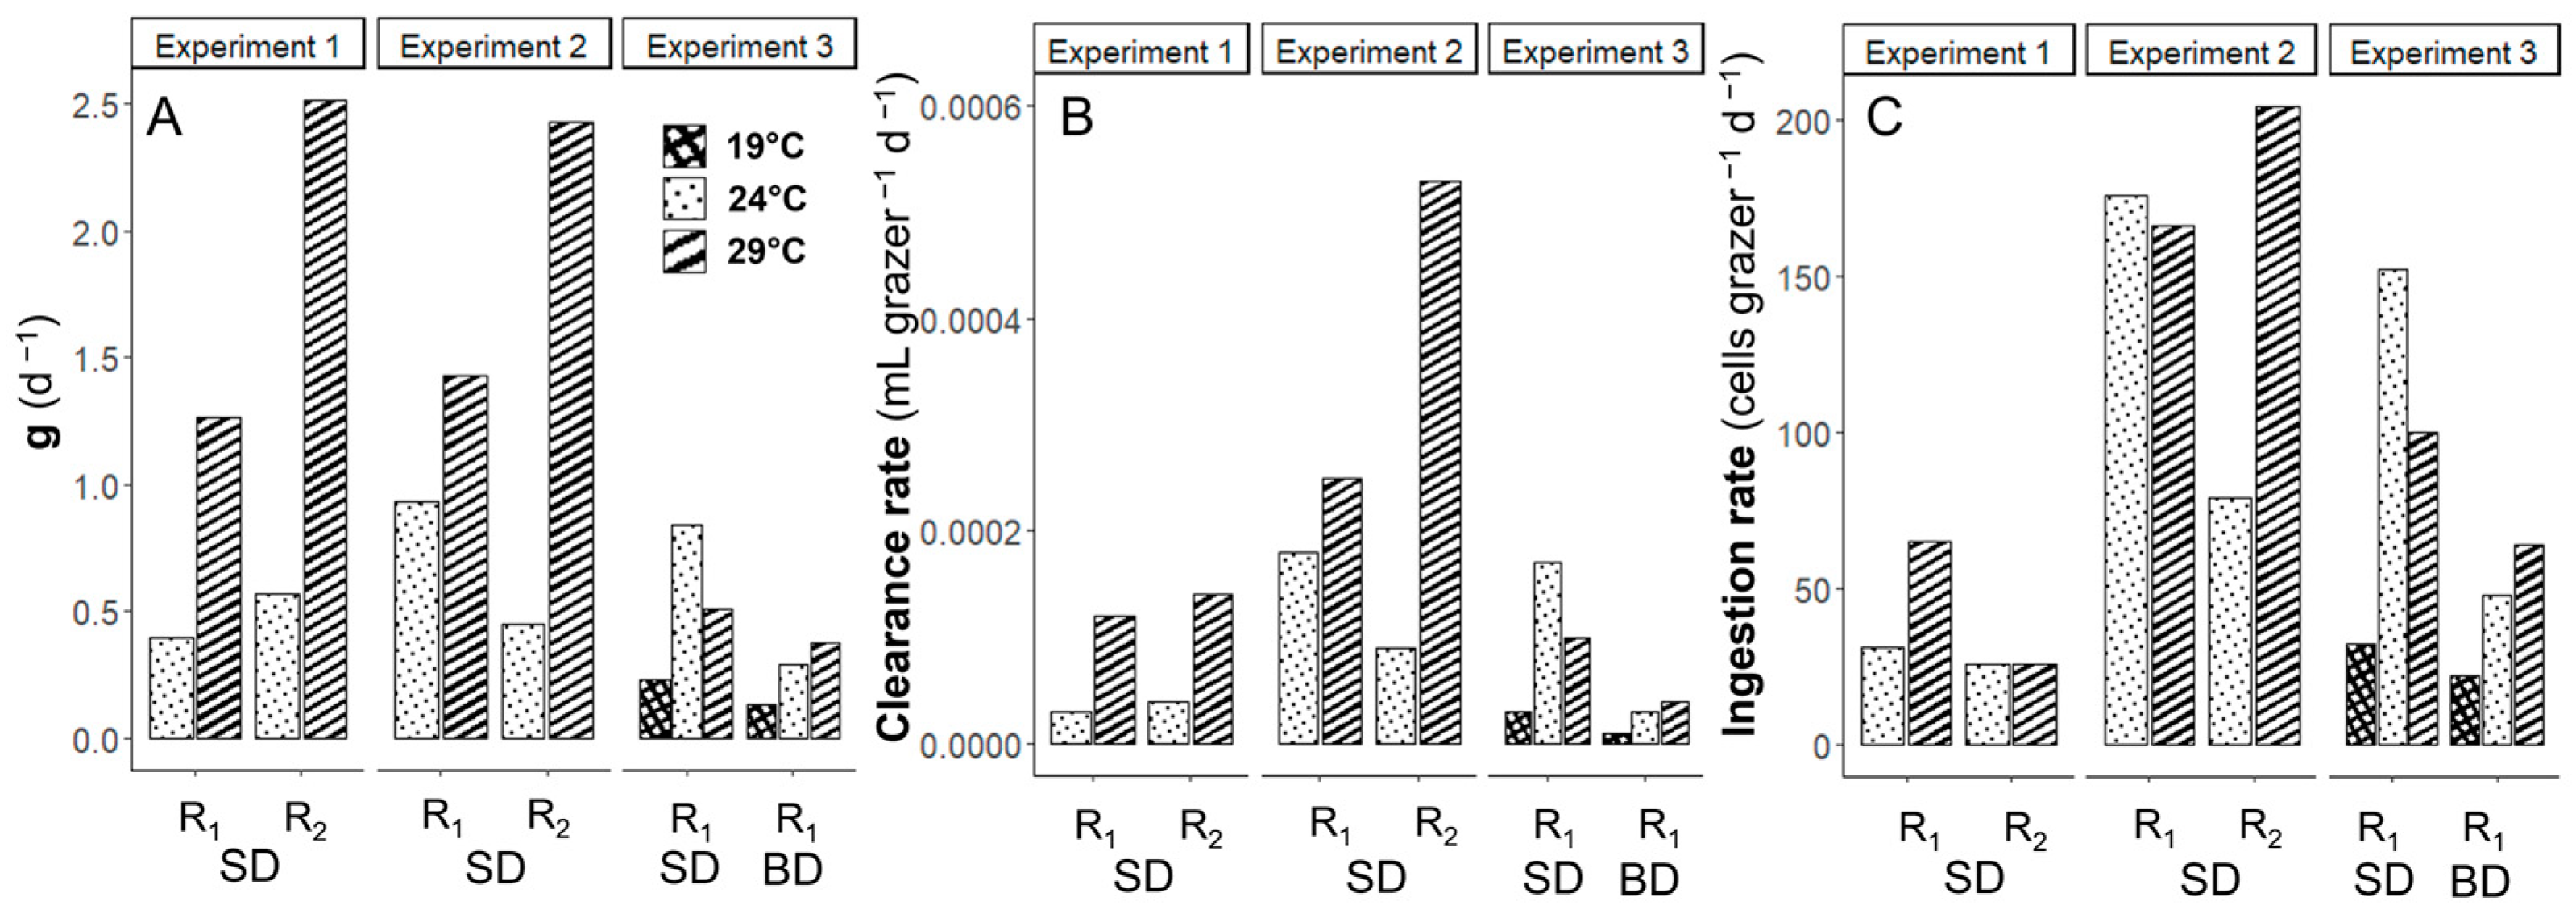
3.4. Temperature Effects on Grazing of Karenia brevis on Synechococcus

The daily maximum grazing coefficient (g), volume-specific clearance rate, and cell-specific ingestion rates of K. brevis on Synechococcus were generally higher at warmer temperatures (Figure 4). In Experiments 1–2, the daily rates of g at 29 °C were 1.5 to 5.4-fold higher than those at 24 °C across different prey-to-grazer ratios (Figure 4A, Table 2). In Experiment 3 SD and BD, the rates of g at 19 °C were the lowest and gradually increased with rising temperature in the BD treatments (from 0.13 to 0.38 d−1), but not in the SD treatments. In the SD treatment of Experiment 3, the value of g was the highest at 24 °C compared with other temperatures (Figure 4A). The daily clearance rates exhibited a consistent pattern with g, showing higher rates at warmer temperatures except in Experiment 3 SD treatments (Figure 4B).
The ingestion rates by K. brevis on Synechococcus generally showed some differences compared to grazing coefficients and clearance rates (Figure 4C). The daily ingestion rates by K. brevis on prey at 24 °C were similar and higher than those at 29 °C in the Experiment 1 SD R2 and Experiment 2 SD R1 treatments. The daily ingestion rates were more strongly dependent on prey-to-predator ratios (p < 0.001) than on temperatures (p < 0.05) (R2 = 0.77) (Figure 5A). The lowest ingestion rate was observed at 19 °C in the Experiment 3 BD R1 treatment (22 Synechococcus K. brevis−1 d−1), and the highest rate was found at 29 °C in the Experiment 2 R2 treatment (204 Synechococcus K. brevis−1 d−1) when the prey-to-grazer ratio was the second highest (Table 2). The ingestion rates were not dependent on prey concentrations (p > 0.05) (R2 = 0.15) (Figure 5B).
In contrast to the daily rates, the initial hourly ingestion rates that were calculated at ≤T5 after mixing prey and grazers did not correlate with either prey-to-predator ratios or with temperatures (p > 0.05). Grazing activities were not observed in some treatments (Table 2). The initial hourly ingestion rates were the highest at 24 °C except for the Experiment 2 R1 and Experiment 4 treatments. Overall, the ingestion rates ranged from 0 to 67 Synechococcus K. brevis−1 h−1.

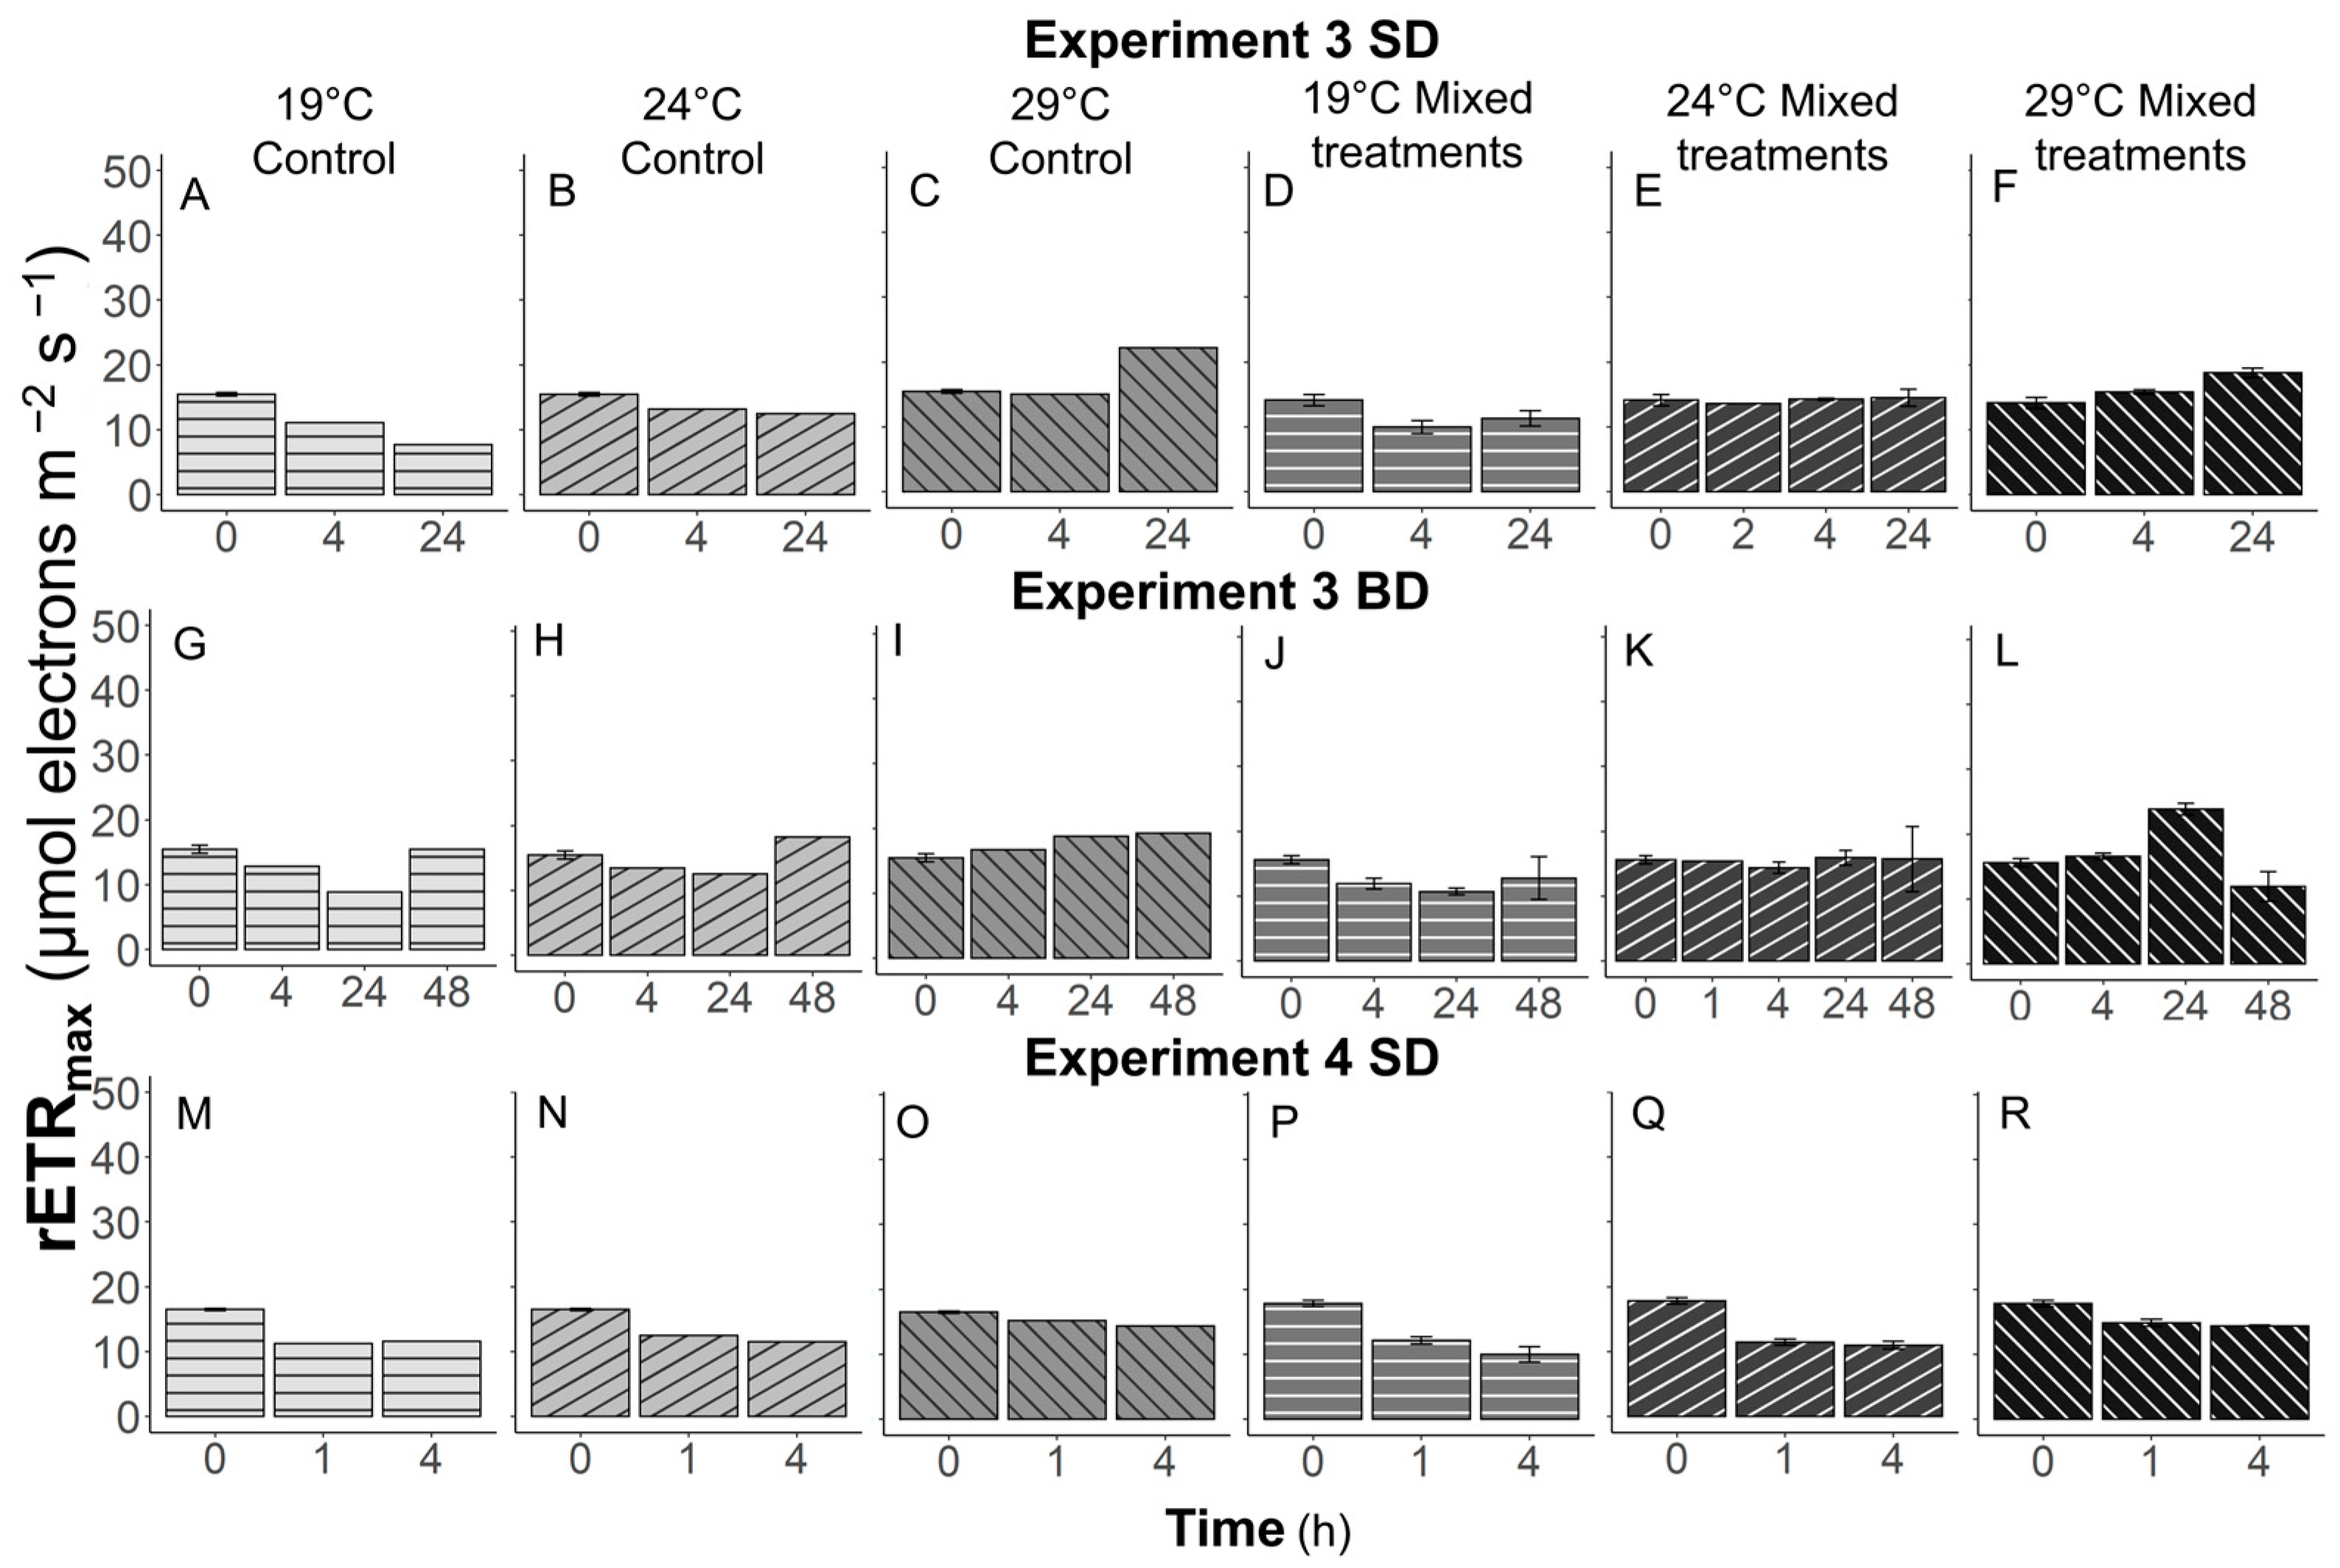
3.5. Temperature Effects on Photosynthetic Performance

The effects of grazer presence and temperature on the photosynthetic rate of Synechococcus, measured with rETRmax, were significant (p < 0.05) in Experiments 1 and 2 (Figure 6). In Experiments 1–2, the rETRmax of Synechococcus controls increased with time, especially at 29 °C in Experiment 2 (Figure 6A,B,G,H,K,L). The rETRmax values of Synechococcus increased 2.1- and 1.8-fold at 24 °C in the R1 and R2 control treatments, while at 29 °C these values were enhanced 2.4- and 2.2-fold from T0 to Tfinal. However, when prey were mixed with grazers, the rETRmax of prey decreased (Figure 6E,J,N) and even became undetectable (Figure 6D,F), or remained similar (Figure 6C,I,M) to the values of T0 at Tfinal. When mixed treatments were exposed to a warmer temperature, the rETRmax values of Synechococcus decreased more. In Experiment 3, the rETRmax values of Synechococcus controls were the highest at 29 °C and the lowest at 19 °C at Tfinal (Figure 7A–C,G–I). At 29 °C, the rETRmax of Synechococcus controls were higher than those mixed with grazers at Tfinal (Figure 7C,F,I,L). However, these differences were not significant (p > 0.05). Thermal and grazer presence effects were not observed in Experiment 4 (Figure 7M–R).
In all experiments and all treatments, rETRmax values of K. brevis decreased over time (Figure 8 and Figure 9). No differences were found between grazer controls and those feeding on prey. Also, temperature effects on the photosynthetic rates of K. brevis with or without prey were not observed. The only differences were found in Experiment 1 at Tfinal (72 h). When K. brevis was fed with Synechococcus, the rETRmax values of grazers declined to 73–100% of the initial values in the R1 and R2 treatments (Figure 8B,C,E,F). However, in grazer controls at 24 and 29 °C, the rETRmax values were reduced to 54% and 38% of those at T0 (Figure 8A,D).

4. Discussion

In this study, the short-term temperature-dependent mixoplanktonic and photosynthetic activities of natural K. brevis populations were examined when cells were supplied with cultured Synechococcus in different proportions. As hypothesized, the grazing rates of K. brevis were generally enhanced with rising temperatures. Grazing also affected the photosynthetic rates of prey to a greater extent at warmer temperatures.

4.1. Grazing on Synechococcus by Natural Karenia brevis Population

Natural populations of K. brevis could graze on Synechococcus, and the rates strongly depended on prey-to-predator ratios (R2 = 0.77, Figure 5A), which is consistent with previous culture experiments [12,13,14]. However, Synechococcus amounts did not significantly influence the ingestion rates (R2 = 0.15, Figure 5B), although prey concentrations have previously been shown to be important factors that positively correlate with ingestion rates until saturation [22]. Prey encounter rates, usually discussed in scenarios with higher trophic levels, e.g., [24], could be more important factors that regulate the ingestion rates, thus showing a positive relationship between prey-to-predator ratios and feeding rates in this study.
The studies of Glibert et al. [13] and Ahn et al. [14] did not observe saturating responses in grazing until prey–predator ratios (cell–cell) were >200:1 and >300:1, respectively. In this study, although the actual densities of prey and grazer were significantly different from previous studies, saturation responses were not observed up to 243:1 of prey-to-predator on a cell–cell basis (Table 2), showing a linear relationship (R2 = 0.77, Figure 5A). Along with previous studies, these findings suggest that both cultured and natural K. brevis have a substantial ability to graze on Synechococcus.

4.2. Warming Shifts Karenia brevis towards More Phago-Heterotrophic in a Short-Term

Several studies have revealed that mixotrophs become more heterotrophic with rising temperatures. The study of Wilken et al. [3] exhibited grazing on bacterial prey by mixotrophic chrysophyte Ochromonas sp. and showed that grazing rates increased more with temperature (13–33 °C) than did photosynthetic electron transport rates. The mixotrophic dinoflagellate Lepidodinium sp. also showed enhanced ingestion rates on Rhodomonas salina with rising temperatures from 25 °C and 28 °C to 31 °C [4,25]. The dinoflagellate Gymnodinium smaydae and Alexandrium pohangense fed more on Heterocapsa rotundata (10–32 °C) and Margalefidium polykrikoides (15–30 °C), respectively, with increasing temperature [5,26]. Furthermore, Lepori-Bui et al. [27] found that mixotrophs that were adapted at 18, 24, and 30 °C (>200 generations) exhibited reduced photosynthesis activity but higher grazing ability with increasing temperature in general.
In this study, the grazing responses of K. brevis on Synechococcus to increasing temperatures were consistent with previous studies, even though our experiments were conducted with grazers that were not acclimated to specific temperatures (Figure 4, Table 2). However, unlike previous studies, increases in abundance or growth rates of grazers were not generally observed in this study (Figure 3). Specifically, at warmer temperatures, the cell concentrations tended to decrease more in general. This was possibly due to the fact that the mixotrophs were undergoing short-term stress when exposed to new environments (e.g., new temperatures). At warmer temperatures, respiration rates would also increase, as predicted by the metabolic theory of ecology; therefore, less energy would be directed to synthesizing new biomass [1,2]. In addition, initial hourly ingestion rates measured in the interval from ≤T1–T5 were mainly the highest at 24 °C (i.e., the ambient temperature), and grazing was not observed in some cases (Table 2), implying stress responses of grazers to new environments.

4.3. The Potential Role of Karenia brevis Grazing in the Surface Layer on the West Florida Shelf

Karenia brevis are subject to temperature fluctuations due to daylight surface aggregation behavior, and this surface layer is an area in which increased biological activities as well as nutrient cycling can be observed [10]. The surface layer is typically warmer than deeper depths unless significant upwelling occurs. Our results demonstrate the increased grazing behavior of K. brevis on Synechococcus, a ubiquitous picocyanobacteria found in the Gulf of Mexico [28,29], at an ambient temperature +5 °C compared to an ambient temperature and ambient temperature −5 °C. Although no significant differences were found in the rETRmax values of grazers except in the experiment that lasted the longest (72 h) (Figure 8 and Figure 9), the photosynthetic rates of prey were strongly regulated by the presence of grazers, especially at warmer temperatures in general (Figure 6 and Figure 7).
The undefined nanoflagellates could also contribute to increased grazing at warmer temperatures. In Experiments 1–3, they contributed <0.5% to ~4% in the T0 samples but increased to ~15% at 24 °C and ~34% at 29 °C in the final sampling points in one of the treatments. The contribution of nanoflagellates also increased from 19% to 34% at 29 °C in Experiment 4. Indeed, mixotrophic nanoflagellates are also predicted to be more heterotrophic with rising temperatures, e.g., [27]. Nanoflagellates can be prey of K. brevis and grazers of Synechococcus at the same time; therefore, it is hard to distinguish their contribution to the total grazing. However, even the short-term exposure of K. brevis-dominated bloom water to warmer temperatures enhanced the grazing pressure on prey.

5. Conclusions and Summary

These findings indicate that natural populations of K. brevis exhibit grazing behavior on Synechococcus, and grazing rates are influenced by prey-to-predator ratios and temperature. Prey concentrations have traditionally been considered important factors affecting ingestion rates, and the results of this study underscore the significance of prey availability. Additionally, these results showed that natural field K. brevis populations possess a similar ability to graze on Synechococcus, which has previously been documented in laboratory settings.
Rising temperatures shift K. brevis towards a more phago-heterotrophic state, even in the short term. Despite the fact that the data on grazing responses to increasing temperatures in this study are consistent with previous studies, significant increases in grazer abundance or growth rates were not observed, possibly due to the short-term stress experienced by mixotrophs in new environments and the short time course of these studies. These findings highlight the potential role of K. brevis grazing in the surface layer of the West Florida Shelf, particularly in warmer temperatures, where increased biological activities and nutrient cycling may occur. Not only were the grazing rates enhanced, but the photosynthetic performance of prey was also reduced by the presence of K. brevis, especially at warmer temperatures.
Overall, this study underscores the importance of considering temperature effects on mixotrophic grazing behaviors, which can have significant implications for ecosystem dynamics. The many nutrient sources available to support blooms of K. brevis, e.g., those documented in [10], should include mixotrophic feeding.

Supplementary Materials

The following supporting information can be downloaded at: https://www.mdpi.com/article/10.3390/w16111555/s1, Table S1: Rapid light curve parameters in Experiment 1–4.

Author Contributions

Conceptualization, S.H.A. and P.M.G.; methodology, S.H.A. and P.M.G.; validation, S.H.A. and P.M.G.; formal analysis, S.H.A.; investigation, S.H.A. and P.M.G.; resources, P.M.G.; data curation, S.H.A. and P.M.G.; writing—original draft preparation, S.H.A.; writing—review and editing, S.H.A. and P.M.G.; visualization, S.H.A.; supervision, P.M.G.; project administration, P.M.G.; funding acquisition, P.M.G. All authors have read and agreed to the published version of the manuscript.

Funding

Funding was provided by NOAA Award NA19NOS4780183 to P.M.G. This is contribution number 6382 from the University of Maryland Center for Environmental Science and 1103 from NOAA ECOHAB Program.

Data Availability Statement

Data are contained within the article or Supplementary Material.

Acknowledgments

The authors thank C. Heil, S. Klass, and T. Bercel (Mote Marine Laboratory) for helping with field work, and J. Martínez-Martínez and A. Booker (Bigelow Laboratory for Ocean Science) for nutrient analysis. Also, the authors thank T.M. Kana (Bay Instruments LLC) for the use of the PhytoPAM-II fluorometer.

Conflicts of Interest

The authors declare no conflicts of interest.

References

  1. Brown, J.H.; Gillooly, J.F.; Allen, A.P.; Savage, V.M.; West, G.B. Toward a metabolic theory of ecology. Ecology 2004, 85, 1771–1789. [Google Scholar] [CrossRef]
  2. Allen, A.P.; Gillooly, J.F.; Brown, J.H. Linking the global carbon cycle to individual metabolism. Funct. Ecol. 2005, 19, 202–213. [Google Scholar] [CrossRef]
  3. Wilken, S.; Huisman, J.; Naus-Wiezer, S.; van Donk, E. Mixotrophic organisms become more heterotrophic with rising temperature. Ecol. Lett. 2013, 16, 225–233. [Google Scholar] [CrossRef] [PubMed]
  4. Liu, K.; Ng, H.Y.-T.; Zhang, S.; Liu, H. Effects of temperature on a mixotrophic dinoflagellate (Lepidodinium sp.) under different nutritional strategies. Mar. Ecol. Prog. Ser. 2021, 678, 37–49. [Google Scholar] [CrossRef]
  5. You, J.H.; Jeong, H.J.; Lim, A.S.; Ok, J.H.; Kang, H.C. Effects of irradiance and temperature on the growth and feeding of the obligate mixotrophic dinoflagellate Gymnodinium smaydae. Mar. Biol. 2020, 167, 64. [Google Scholar] [CrossRef]
  6. Glibert, P.M.; Mitra, A. From webs, loops, shunts, and pumps to microbial multitasking: Evolving concepts of marine microbial ecology, the mixoplankton paradigm, and implications for a future ocean. Limnol. Oceanogr. 2022, 67, 585–597. [Google Scholar] [CrossRef]
  7. Brand, L.E.; Campbell, L.; Bresnan, E. Karenia: The biology and ecology of toxic genus. Harmful Algae 2012, 14, 156–178. [Google Scholar] [CrossRef] [PubMed]
  8. Brand, L.E.; Compton, A. Long-term increase in Karenia brevis abundance along the Southwest Florida coast. Harmful Algae 2007, 6, 232–252. [Google Scholar] [CrossRef] [PubMed]
  9. Heil, C.A.; Amin, S.A.; Glibert, P.M.; Hubbard, K.A.; Li, M.; Martínez, J.M.; Weisberg, R.; Liu, Y.; Sun, Y. Termination patterns of Karenia brevis blooms in the eastern Gulf of Mexico. In Proceedings of the 19th International Conference on Harmful Algae, La Paz, Mexico, 10–15 October 2022. [Google Scholar] [CrossRef]
  10. Heil, C.A.; Bronk, D.A.; Mulholland, M.R.; O’Neil, J.M.; Bernhardt, P.W.; Mursako, S.; Havens, J.A.; Vargo, G.A. Influence of daylight surface aggregation behavior on nutrient cycling during a Karenia brevis (Davis) G. Hansen & Ø. Moestrup bloom: Migration to the surface as a nutrient acquisition strategy. Harmful Algae 2014, 38, 86–94. [Google Scholar] [CrossRef]
  11. Weisberg, R.H.; Zheng, L.; Liu, Y.; Lembke, C.; Lenes, J.M.; Walsh, J.J. Why no red tide was observed on the West Florida Continental Shelf in 2010. Harmful Algae 2014, 28, 119–126. [Google Scholar] [CrossRef]
  12. Jeong, H.J.; Park, J.Y.; Nho, J.H.; Park, M.O.; Ha, J.H.; Seong, K.A.; Jeng, C.; Seong, C.N.; Lee, K.Y.; Yih, W.H. Feeding by red-tide dinoflagellates on the cyanobacterium Synechococcus. Aquat. Microb. Ecol. 2005, 41, 131–143. [Google Scholar] [CrossRef]
  13. Glibert, P.M.; Burkholder, J.M.; Kana, T.M.; Alexander, J.; Skelton, H.; Shilling, C. Grazing by Karenia brevis on Synechococcus enhances its growth rate and may help to sustain blooms. Aquat. Microb. Ecol. 2009, 55, 17–30. [Google Scholar] [CrossRef]
  14. Ahn, S.H.; Mayali, X.; Weber, P.K.; Glibert, P.M. Grazing by the toxigenic dinoflagellate Karenia brevis on Synechococcus and Rhodomonas: Effects of food quantity and quality and photophysiological responses of predator and prey. Limnol. Oceanogr. 2024; to be submitted. [Google Scholar]
  15. Heil, C.A.; Revilla, M.; Glibert, P.M.; Murasko, S. Nutrient quality drives differential phytoplankton community composition on the southwest Florida Shelf. Limnol. Oceanogr. 2007, 52, 1067–1078. [Google Scholar] [CrossRef]
  16. Sipler, R.E.; Bronk, D.A.; Seitzinger, S.P.; Lauck, R.; McGuinness, L.R.; Kirkpatrick, G.J.; Heil, C.A.; Kerkhof, L.J.; Schofield, O.M. Trichodesmium-derived dissolved organic matter is a source of nitrogen capable of supporting the growth of toxic red tide Karenia brevis. Mar. Ecol. Prog. Ser. 2013, 483, 31–45. [Google Scholar] [CrossRef]
  17. Zhang, Q.; Yu, R.; Song, J.; Yan, T.; Wang, Y.; Zhou, M. Will harmful dinoflagellate Karenia mikimotoi grow phagotrophically? Chin. J. Oceanol. Limnol. 2011, 29, 849–859. [Google Scholar] [CrossRef]
  18. Zhang, Q.; Song, J.; Yu, R.; Yan, T.; Wang, Y.; Kong, F.; Zhou, M. Roles of mixotrophy in blooms of different dinoflagellates: Implications from the growth experiment. Harmful Algae 2013, 30, 10–26. [Google Scholar] [CrossRef]
  19. Ok, J.H.; Jeong, H.J.; Lim, A.S.; Kang, H.C.; You, J.H.; Park, S.A.; Eom, S.H. Lack of mixotrophy in three Karenia species and the prey spectrum of Karenia mikimotoi (Gymnodiniales, Dinophyceae). Algae 2023, 38, 39–55. [Google Scholar] [CrossRef]
  20. Guillard, R.R.L.; Hargraves, P.E. Stichochrysis immobilis is a diatom, not a chrysophyte. Phycologia 1993, 32, 234–236. [Google Scholar] [CrossRef]
  21. Heinbokel, J.F. Studies on the functional role of Tintinnids in the Southern California Bight. I. Grazing and growth rates in laboratory cultures. Mar. Biol. 1978, 47, 177–189. [Google Scholar] [CrossRef]
  22. Frost, B.W. Effects of size and concentration of food particles on the feeding behavior of the marine planktonic copepod. Limnol. Oceanogr. 1972, 17, 805–815. [Google Scholar] [CrossRef]
  23. Platt, T.; Gallegos, C.L.; Harrison, W.G. Photoinhiition of photosynthesis in natural assemblages of marine phytoplankton. J. Mar. Res. 1980, 38, 687–701. [Google Scholar]
  24. Pécseli, H.L.; Truslen, J.K.; Fiksen, Ø. Predator-prey encounter and capture rates in turbulent environments. Limnol. Oceanogr. 2014, 4, 85–105. [Google Scholar] [CrossRef]
  25. Liu, K.; Ng, H.Y.-T.; Gao, Z.; Liu, H. Selective feeding of a mixotrophic dinoflagellate (Lepidodinium sp.) in response to experimental warming and inorganic nutrient imbalance. Front. Microbiol. 2022, 13, 805306. [Google Scholar] [CrossRef] [PubMed]
  26. Lim, A.S.; Jeong, H.J.; Ok, J.H.; You, J.H.; Kang, H.C.; Kim, S.J. Effects of light intensity and temperature on growth and ingestion rates of the mixotrophic dinoflagellate Alexandrium pohangense. Mar. Biol. 2019, 166, 98. [Google Scholar] [CrossRef]
  27. Lepori-Bui, M.; Paight, C.; Eberhard, E.; Mertz, C.M.; Moeller, H.V. Evidence for evolutionary adaptation of mixotrophic nanoflagellates to warmer temperatures. Glob. Chang. Biol. 2022, 28, 7094–7107. [Google Scholar] [CrossRef] [PubMed]
  28. Paul, J.H.; Alfreider, A.; Kang, J.B.; Stokes, R.A.; Griffin, D.; Campbell, L.; Ornolfsdottir, E. Form IA rbcL transcript associated with a low salinity/high chlorophyll plume (‘Green River’) in the eastern Gulf of Mexico. Mar. Ecol. Prog. Ser. 2000, 198, 1–8. [Google Scholar] [CrossRef]
  29. Wawrik, B.; Callaghan, A.V.; Bronk, D.A. Use of inorganic and organic nitrogen by Synechococcus spp. and diatoms on the West Florida Shelf as measured using stable isotope probing. Appl. Environ. Microb. 2009, 75, 6662–6670. [Google Scholar] [CrossRef]
Figure 1. Experimental design examining short-term temperature effects on grazing rates by K. brevis on Synechococcus. SD, BD, R1, and R2 represent South Dock, Bay Dock, and ratios 1 and 2, respectively. Prey-only treatments are shown in green, K. brevis-only treatments are shown in orange, and mixed predator + prey treatments are shown in purple. Detailed information is presented in Table 2.
Water 16 01555 g001
Figure 2. The changes of Synechococcus abundance with or without grazers at different temperatures and ratios in (A) Experiment 1 SD, (B) Experiment 2 SD, (C) Experiment 3 BD, (D) Experiment 3 SD, and (E) Experiment 4 SD treatments. Solid lines with empty symbols represent controls of Synechococcus. In contrast, dotted lines with filled symbols represent Synechococcus mixed with K. brevis bloom waters from the South Dock (SD) and Bay Dock (BD): diamonds (, ♢) for the treatments at 19 °C, circles (○, ●) for the treatments at 24 °C, and triangles (△, ▲) for the treatments at 29 °C. Note that treatments in Experiment 1 and 2 include 2 prey-to-grazer ratios (R1, R2) and 2 temperatures (24, 29 °C), while those in Experiment 3 and 4 include 1 prey-to-grazer ratio (R1) and 3 temperatures (19, 24, and 29 °C).
Water 16 01555 g002
Figure 3. The changes in Karenia brevis abundance at different temperatures and ratios in (A) Experiment 1 SD, (B) Experiment 2 SD, (C) Experiment 3 BD, (D) Experiment 3 SD, and (E) Experiment 4 SD treatments. R1, R2, SD, and BD represent ratio 1, ratio 2, South Dock, and Bay Dock, respectively. The scales of the X and Y axis are different for different experiments. Note that treatments in Experiment 1 and 2 include 2 prey-to-grazer ratios (R1, R2) and 2 temperatures (24, 29 °C) while those in Experiment 3 and 4 include 1 prey-to-grazer ratio (R1) and 3 temperatures (19, 24, 29 °C).
Water 16 01555 g003
Figure 4. The maximum (A) grazing coefficient (g), (B) clearance rate, and (C) Ingestion rate of K. brevis on Synechococcus at 19, 24, and 29 °C. R1, R2, SD, and BD represent ratio 1, ratio 2, South Dock, and Bay Dock, respectively.
Water 16 01555 g004
Figure 5. The relationship between daily ingestion rate by K. brevis on Synechococcus and (A) the prey-to-grazer ratio and temperature and (B) prey concentrations and temperature. The multiple linear regression plane and R2 are shown.
Water 16 01555 g005
Figure 6. The maximum relative electron transfer rate, rETRmax, of Synechococcus over time in Experiments 1 (AF) and 2 (GN). R1, R2, SD, and BD represent ratio 1, ratio 2, South Dock, and Bay Dock, respectively.
Water 16 01555 g006
Figure 7. The maximum relative electron transfer rate, rETRmax, of Synechococcus over time in Experiments 3 SD (AF) and BD (GL) and Experiment 4 SD (MR). SD, and BD represent South Dock, and Bay Dock, respectively.
Water 16 01555 g007
Figure 8. The maximum relative electron transfer rate, rETRmax, of Karenia brevis over time in Experiments 1 (AF) and 2 (GL). R1, R2, SD, and BD represent ratio 1, ratio 2, South Dock, and Bay Dock, respectively.
Water 16 01555 g008
Figure 9. The maximum relative electron transfer rate, rETRmax, of Karenia brevis over time in Experiment 3 SD (AF), Experiment 3 BD (GL) and Experiment 4 SD (MR). R1, R2, SD, and BD represent ratio 1, ratio 2, South Dock, and Bay Dock, respectively.
Water 16 01555 g009
Table 1. Ambient temperature and nutrient concentrations during four days of sampling from South Dock (Experiment 1–4) and Bay Dock (Experiment 3).
South DockBay DockSouth Dock
Experiment 1Experiment 2Experiment 3Experiment 3Experiment 4
28 November29 November30 November30 November2 December
Temperature (°C)24.022.523.523.922.0
Nitrate + Nitrite (µM)0.530.25<0.050.190.18
Ammonium (µM)3.770.592.410.53<0.04
Phosphate (µM)0.210.120.100.250.10
Table 2. Initial conditions of prey (C0) (×106 cells mL−1) and predator (P0) (×103 cells mL−1) abundance and prey–predator ratios (C0:P0), calculated initial hourly and daily grazing coefficient (g) (h−1, d−1), clearance rate (CR) (mL K. brevis−1 h−1, mL K. brevis−1 d−1), and ingestion rates (IR) (cells K. brevis−1 h−1, cells K. brevis−1 d−1). Exp and Temp represent experiment and temperature, respectively.
ExpC0:P0
(vol:vol)
TempC0P0C0:P0
(Cell:Cell)
Hourly gHourly
CR
Hourly
IR
Daily
g
Daily
CR
Daily
IR
13:124 °C1.213.290:10.100.00000770.400.0000331
29 °C1.413.0106:10.040.00000331.260.0001265
5:424 °C0.915.863:10.110.00001040.570.0000426
29 °C0.919.148:10002.510.0001426
22:324 °C1.35.3243:10000.930.00018176
29 °C1.25.9209:10.050.000010121.430.00025166
5:824 °C1.04.8216:10000.450.0000979
29 °C1.04.3242:10002.430.00053204
31:419 °C1.15.4208:10.060.00001080.230.0000332
24 °C1.15.4208:10.110.000020180.840.00017152
29 °C1.15.4208:10.010.00000110.510.00010100
1:1 *19 °C1.510.9141:10000.130.0000122
24 °C1.510.9141:10.010.00000120.290.0000348
29 °C1.510.9141:10000.380.0000464
41:419 °C0.92.1440:10.010.0000033
24 °C0.92.1440:10.050.00002826
29 °C0.92.1440:10.120.00007367
Notes: * The bloom water was collected from Bay Dock while others were collected from South Dock. See Table 1 for the details.
Disclaimer/Publisher’s Note: The statements, opinions and data contained in all publications are solely those of the individual author(s) and contributor(s) and not of MDPI and/or the editor(s). MDPI and/or the editor(s) disclaim responsibility for any injury to people or property resulting from any ideas, methods, instructions or products referred to in the content.

