Article

Occurrence and Mitigation of Bacterial Regrowth in Stored Household Water in Eastern Coastal Madagascar

by
Lauren A. Judah
1,
Cathy Andriambololonirina
2,
Lova Rakotoarisoa
2,
Luke John Paul Barrett
2,
Mahmooda Khaliq
3,
James R. Mihelcic
1 and
Jeffrey A. Cunningham
1,*
1
Department of Civil and Environmental Engineering, University of South Florida, Tampa, FL 33620, USA
2
ONG Ranontsika, 22 rue du Commerce, Ampasimazava, Toamasina 501, Madagascar
3
College of Public Health, University of South Florida, Tampa, FL 33612, USA
*
Author to whom correspondence should be addressed.
Water 2024, 16(11), 1592; https://doi.org/10.3390/w16111592
Submission received: 18 April 2024 / Revised: 29 May 2024 / Accepted: 30 May 2024 / Published: 1 June 2024
(This article belongs to the Section Oceans and Coastal Zones)

Abstract

:
In communities where people lack on-demand, safely managed drinking water, stored household water often becomes contaminated by fecal bacteria, regardless of the source-water quality. The objectives of this paper are to assess and control bacterial contamination in stored household water in Toamasina, a rapidly urbanizing city in eastern coastal Madagascar. We collected samples of source water and stored household water from 10 representative households that use different water sources and different storage strategies, and we analyzed the samples for several fecal indicator bacteria. We also tested three methods that residents of Toamasina could realistically employ for cleaning their household water storage vessels, assessing the effect of the cleaning methods on measured bacterial levels in the water. Consistent with the previous literature, we found that concentrations of total coliforms in stored household water were significantly higher than in the corresponding source water (p < 0.05). In 100% of households that stored their water in 20 L polyethylene jerrycans (n = 4), biofilms on the walls of the jerrycan harbored total coliforms and Enterococcus. The use of a closed storage container was, on its own, not found to provide a meaningful protective effect against bacterial regrowth; to be protective, closed storage containers must be combined with high-quality source water and/or with adequate cleaning to prevent biofilm formation. A dilute solution of sodium hypochlorite, known locally as Sûr’Eau or Manadio Rano, was both the most effective and the least expensive method for cleaning household water storage containers. We conclude that regular and effective cleaning of storage containers is an essential component of safe water storage. Because household storage of collected water is common in many low- and middle-income countries, these results are important towards the worldwide achievement of the United Nations’ Sustainable Development Goal 6.

Graphical Abstract

1. Introduction

In low- and middle-income countries (LMICs), safely managed water is often not available to households on demand. Thus, in many LMICs, people rely heavily on self-supply strategies to meet household water needs [1,2,3], including the need for drinking water. Gathered water might or might not be treated to improve quality [4] and is often stored in the household in a bucket, jerrycan, or other container [5,6,7,8].
Unfortunately, the biological quality of gathered water often deteriorates during transport from the collection point to the household and/or during storage in the home [9,10,11,12,13]. This deterioration can be due to “regrowth” (bacteria present in the water at the time of collection grow from initially low levels over time), “recontamination” (water free from measurable levels of fecal indicator bacteria at the time of collection becomes contaminated during handling, perhaps from contact with contaminated hands, utensils, or the container), or both. It is not always clear which mechanism, regrowth or recontamination, is responsible for an observed degradation of water quality.
The severity of bacterial regrowth and/or recontamination in stored household water has been observed to depend on many different factors. These include the source of the water [14], the material of which the storage container is made [15,16], the shape or structure of the storage container [17], the use of unwashed hands or utensils to access water from the storage container [18,19], the presence of biofilms on the walls of the container [20], and the duration of the storage period [21,22]. However, not all these factors are necessarily important in all contexts, and there may be interplay between these factors.
Generally speaking, the physical design of the storage container is believed to be a particularly important factor in preventing or promoting recontamination during household storage. Of particular interest is whether the storage container is open (e.g., an uncovered bucket) or closed (e.g., a screw-cap jerrycan or a bucket with a lid and spigot). Mintz et al. [5] proposed that containers with narrow necks, tight lids, and a spigot improve the quality of stored water compared to uncovered wide-mouthed containers. Subsequently, Roberts et al. [17] found that improved buckets with a lid and spigot resulted in better than a 50% reduction in fecal coliforms compared to unimproved buckets, and Jensen et al. [23] observed that the use of narrow-necked storage pitchers led to a significant reduction in Escherichia coli contamination compared to the use of wide-necked pitchers. Based on findings such as these, the U.S. Centers for Disease Control (CDC) have recommended storage of water in “containers with a narrow mouth, lid, and a spigot to prevent recontamination” as part of their Safe Water System [24], and they presently advocate for containers that have “a single small (5–8 cm) opening that has a cover or can be closed tightly” and “a narrow neck or opening so water can be poured out without hands or objects entering the container” [25] (cf. [5]). Similarly, the World Health Organization (WHO) has recommended that household storage containers should include “a secure, tight-fitting lid” to protect against recontamination [9]. However, a handful of studies have observed that the quality of stored water did not significantly depend upon whether the container was covered or uncovered, nor upon whether the container was wide-necked or narrow-necked [8,11,14,26]. Thus, although it is generally espoused and widely accepted that “water is safer from contamination in containers with a small opening than in those with a wide opening” [6], it may be that such wisdom holds only under certain circumstances, in which case these circumstances require further elucidation.
Another factor implicated in bacterial recontamination is the presence of biofilms on the interior walls of the storage container. Biofilms can form on household water storage containers made of polyethylene, polyvinyl chloride (PVC), steel, or clay [15,18,20]. These biofilms typically harbor coliform bacteria and can also harbor a variety of other fecal indicator bacteria [15,20,22]. There is ample evidence that even if water is of acceptable quality upon collection, the presence of biofilms in the collection containers or storage containers—i.e., the use of “dirty” containers—can lead to bacterial recontamination [27,28], presumably by bacteria sloughing off from the biofilm and entering the water. Formation of biofilms can be rapid [29,30] and can be promoted by repeated use of the same containers [31], which is problematic because many people who practice household water storage do not have the financial resources to frequently change their collection or storage containers. Biofilm formation and bacterial recontamination can be partially mitigated by treating either the water or the container prior to collection and storage [29,32,33], but once biofilms are formed, they usually cannot be removed by simple rinsing of the container [18,34]. What is not yet clear is the degree of frequency or ubiquity of biofilm formation on storage vessels in communities where household storage is common.
Because the use of “dirty” containers can be a significant contributor to bacterial recontamination, it is important that people are regularly able to clean their collection and storage containers [22,29]. Meierhofer et al. [32], Steele et al. [35], and Gärtner et al. [36] have reported that cleaning of water storage containers with chlorine solution mitigates recontamination; furthermore, they found that the chlorination of gathered water at the point of distribution protects water quality at the point of consumption. However, many people in LMICs do not have easy access to chlorine-based cleaning agents, or cannot afford the cost of such cleaning agents, or have not accepted the use of such agents as part of their local culture. String et al. [30,34] tested cleaning methods that are likely to be affordable and locally available to most people, but those tests were performed on containers that had been artificially contaminated in the laboratory, not on biofilms that had grown under true storage conditions. Therefore, a need remains to assess the performance of affordable, locally available, culturally acceptable cleaning methods when applied to water storage containers under true field conditions. This need is particularly acute for narrow-necked storage vessels such as jerrycans; it is difficult to access the interior surfaces that harbor biofilms [28] and immersing the jerrycans for soaking is impractical [34].
The overall objective of this paper is to assess and control bacterial regrowth and recontamination in stored household water in Toamasina, a rapidly urbanizing city in eastern coastal Madagascar. Many people throughout Toamasina store water in their homes, either in buckets or in 20 L screw-cap polyethylene jerrycans, after gathering the water from a self-supply groundwater pump or from a public water tap. Additional details about the study site are provided subsequently in this paper. The specific objectives of this paper are (1) to quantify the frequency and severity of bacterial regrowth/recontamination in household water in Toamasina, (2) to determine if bacterial regrowth/recontamination is correlated with the type of water source and/or with the type of household storage container, (3) to test the hypothesis that biofilms on the walls of the jerrycans are a ubiquitous source of bacterial recontamination, and (4) to test the efficacy of locally available cleaning methods to mitigate the bacterial recontamination caused by jerrycan biofilms.
These objectives respond to important research needs: determining the conditions under which regrowth/recontamination depends on the type of the storage vessel; determining the prevalence or ubiquity of biofilms as a source of recontamination; and finding an affordable, effective, locally available method for cleaning storage containers. For Toamasina, these needs are particularly acute in light of a recent report [37] that found drinking water to be an important route of exposure to fecal bacteria for children in southeastern Madagascar. Also, the quantification of bacterial contamination in water in Toamasina is important because such quantification is relatively rare in Madagascar, perhaps because of challenges associated with the scarcity of laboratory facilities capable of performing such analysis, lack of availability of necessary equipment and chemical reagents, and high costs of reagents when they are available; these are issues that frequently hinder microbiological research in many parts of sub-Saharan Africa [38,39]. Finally, although the work described herein was performed in only one community, the water collection and storage practices in Toamasina are similar to those reported from many LMICs worldwide [40]. The ability to understand and mitigate bacterial regrowth and recontamination in Toamasina will therefore help to prevent such contamination—and its accompanying gastrointestinal illnesses—in thousands or perhaps millions of households worldwide.

2. Materials and Methods

2.1. Study Area, Context, and Households Sampled

Toamasina (also known as Tamatave in French) is Madagascar’s second-largest city, with over 300,000 people. Over the past decade, Toamasina has experienced rapid urbanization, which has been accompanied by a rise in peri-urban settlements that are typically not serviced by safely managed water available on residential premises. The national electric and water utility of Madagascar is Jiro Sy Rano Malagasy (JIRAMA), which provides piped treated water throughout the country [41]. However, only 64% of urban dwellers in Madagascar have access to a piped water source on their premises [42], and the percentage is likely much lower in peri-urban areas of Toamasina. Therefore, many households in Toamasina collect water from communal JIRAMA taps and/or from paompy tany (hand pumps that access shallow groundwater) that are not located on their premises. In these cases, most people use 20 L polyethylene jerrycans for collecting water and transporting it to their homes. In the home, water is either stored in the jerrycan until usage or transferred to a separate household storage vessel such as an open bucket.
In recognition of such factors, a national initiative called Diorano WASH was launched in Madagascar in 2002. Diorano WASH was an IEC/BCC (information, education, and communication/behavioral change communication) campaign that aimed to “reduce poverty by addressing the issues of water supply, sanitation, and hygiene” [43,44]. One of the key target areas of this campaign was safeguarding the water supply between the source and point of use. Diorano WASH provided some guidance regarding household water storage practices, but messaging was focused more strongly on promoting point-of-use water treatment through boiling, chlorination, or solar disinfection [43]. Furthermore, the guidance provided on household water storage did not emphasize the importance of regular cleaning of water collection and storage containers. In practice, water storage vessels in Toamasina are typically used over and over without cleaning or maintenance, and users are generally not aware of the risk of developing biofilms on the vessels over time.
For this project, our team generated a list of possible households for water sampling based on our knowledge of the community. From this list, 10 households were selected based on their water source, type of storage container, and availability and willingness to participate in this study. Household participation was voluntary. Of the ten households selected, five principally used paompy tany as a water source and five principally used JIRAMA tap water. Also, half of the households used a closed container (jerrycan or bottle) for water storage and the other half used an open bucket. Additional information about the participating households is provided by Judah [45].

2.2. Collection of Water Samples

Water samples were collected from the 10 households in 207 mL sterile Whirl-Pak® bags (Nasco Sampling, Pleasant Prairie, WI, USA) containing sodium thiosulfate to neutralize any residual chlorine [46,47]. Two sampling campaigns were conducted over a two-week period in late June and early July, 2022. During each campaign, 1 L was collected from each household’s water storage container (jerrycan, bottle, or bucket) and 1 L was collected from each household’s associated water source (JIRAMA tap or paompy tany). The age of the water samples from the households (i.e., the extent of time that the water had been stored in the household after collection from the source) is not known, but because most families collect water at least once per week, it can be estimated that the stored water was sampled within one week of collection. JIRAMA taps and paompy tany spigots were disinfected with alcohol-soaked cotton before collecting source water. For closed household storage containers, the caps were disinfected with alcohol before being removed to collect water, and container water was poured directly into Whirl-Pak® bags. For open household storage buckets, the water was poured directly into Whirl-Pak® bags. Following collection, samples were immediately taken in a cooler with ice to the Ranontsika laboratory for analysis and were analyzed immediately upon arrival at the laboratory.

2.3. Quantifying Bacterial Concentrations in Water

Samples expected to have high bacterial concentrations (paompy tany samples or samples from visibly dirty storage containers) were diluted with distilled water by a factor of 10, 100, or 1000 prior to analysis. Water was distilled via the Stuart W4000/120V Merit Water Still (Cole-Parmer Ltd., Staffordshire, UK) and was verified to be sterile. Distilled water was used for dilution because phosphate-buffered saline solution was unavailable, and we wanted to ensure that a sterile water source was used for dilution.
Water samples were analyzed for concentrations of five fecal indicator bacteria: total coliforms, Escherichia coli, Enterococcus, Pseudomonas aeruginosa, and Clostridium perfringens. The selection of this combination of fecal indicators was based on multiple considerations. First, each type of bacteria has strengths and weaknesses, and no single indicator is sufficient on its own, as reviewed elsewhere [48]. Second, over the past few decades, the use of total coliforms has generally become less recommended than Enterococcus and/or E. coli, but many LMICs still rely upon total coliforms and fecal coliforms as their principal indicator organisms for monitoring water quality. E. coli exhibit many of the desired characteristics of a fecal indicator but, importantly for our study, are more sensitive to inactivation than many pathogenic bacteria, viruses, and protozoa. Furthermore, Kohn et al. [49] have provided evidence that fecal coliforms and Enterococcus exhibit similar disinfection behavior as bacterial pathogens, suggesting their use in combination with E. coli. In addition, it has been suggested that combining the use of intestinal enterococci with E. coli will increase the confidence in results related to the presence/absence of fecal pollution. While the anaerobic C. perfringens will not multiply in the environments tested in this study, it is a spore-forming bacterium and behaves in a treatment environment more like a difficult-to-treat pathogen such as protozoa, arguing for its utility as an indicator. Because of its anaerobic nature, C. perfringens should be used in conjunction with E. coli or fecal coliforms, not individually. Next, water-based pathogens such as P. aeruginosa are important because they are known to grow and thrive in engineered water systems, growing via biofilms [50]. A final consideration was selecting indicator organisms for which the Ranontsika laboratory had developed reliable protocols for detection and quantification.
Concentrations of total coliforms and E. coli were determined via membrane filtration, following Standard Method 9222B [51] and using Harlequin® Chromogenic Coliform Agar (CCA; Neogen, Ayr, Scotland, UK). Adapted versions of Standard Method 9222B were used to test samples for Enterococcus (m-Enterococcus Agar; Neogen), P. aeruginosa (Pseudomonas Agar Base; Neogen), and C. perfringens (Perfringens Agar Base; Neogen). All samples were filtered through 0.45 µm microdisc membrane filters (Membrane Solutions), which were then placed in Petri dishes filled with the corresponding agar. Petri dishes were incubated for 24 h at 36 °C for coliforms and C. perfringens, and for 48 h at 35 °C for Enterococcus and P. aeruginosa. Also, Petri dishes with C. perfringens were placed in a container with a 2.5 L AnaeroGen™ pack (Thermo Scientific, Waltham, MA, USA) to provide anaerobic conditions during incubation. Membrane filtration for P. aeruginosa was performed with 250 mL samples, instead of the 100 mL samples used for the other fecal indicators. One Petri dish (or “plate”) was prepared for each water sample collected.
After incubation, all filters were counted visually for colony forming units (CFU) to calculate the bacterial concentration in the water sample (CFU per 100 mL). In CCA dishes, E. coli were distinguished from total coliforms by color. E. coli colonies were dark blue or violet and other coliform colonies were pink or red. Additionally, E. coli colonies were confirmed following the American Society for Microbiology’s indole spot test [52] with indole spot reagent (Hardy Diagnostics, Santa Maria, CA, USA). Colonies of the other fecal indicators were confirmed via the American Society for Microbiology’s gram stain procedures [53]. In samples that had been diluted, the CFU counts were multiplied by their corresponding dilution factor to calculate the original bacterial concentration in the water.
All analyses were performed in the Ranontsika laboratory in Toamasina and did not require shipment of samples to external laboratories; this is important from the standpoint of building research capacity within Madagascar [38,54].

2.4. Measuring Biofilms on Interior Surfaces of Jerrycans

Following the two-week period described above, the four households that used jerrycans for household water storage voluntarily surrendered their jerrycans to our team for further analysis. New jerrycans were provided to these four households in exchange for their surrendered jerrycans. The four collected jerrycans were tested for the presence of biofilms on the interior, following an adapted sterilized swirl protocol [8,17], described as follows. Containers were poured out to remove any remaining household water, then rinsed with 1 L of distilled water to remove any bacteria not associated with the biofilms. The rinse water was then poured out and an additional 2 L of distilled water was introduced to the jerrycan. Distilled water was confirmed to be free of any fecal indicators via membrane filtration. Each jerrycan was vigorously shaken by hand for 15 s in an up/down direction, 15 s in a left/right direction, and 15 s in a front/back direction. Effluent was then emptied into sterilized containers, diluted if necessary, and tested for Enterococcus, total coliforms, E. coli, P. aeruginosa, and C. perfringens via membrane filtration, as described above. Any fecal indicators detected were attributed to the jerrycans’ internal biofilms.

2.5. Measuring Efficacy of Jerrycan Cleaning Methods

In addition to the four jerrycans tested from the initial 10 households, eight more were collected by our team from other households in the community, for a total of twelve jerrycans used to test potential cleaning methods. The eight additional jerrycans were collected from randomly selected households willing to surrender their jerrycan in exchange for a new one. The twelve jerrycans were divided into four groups corresponding to four candidate cleaning methods. The four candidate cleaning methods were soapy water, baking soda and vinegar, Manadio Rano (a dilute solution of sodium hypochlorite that is available in stores and markets in Toamasina, also sometimes known as Sûr’Eau), and a control group with no cleaning method employed. Details of the cleaning protocols are provided by Judah [45]. Each of the four groups contained three jerrycans of differing apparent levels of biofilm growth, based on visual inspection, as described by Judah [45].
Prior to cleaning, each jerrycan was rinsed with 1 L of distilled water, poured out, refilled with 2 L of distilled water, and then shaken vigorously for 15 s in each direction (up/down, left/right, and front/back). Effluent was then collected and tested for fecal indicators (as described above) to determine a pre-cleaning baseline bacterial concentration for each indicator in each jerrycan. Next, each jerrycan was cleaned with its assigned cleaning agent (soapy water, Manadio Rano, or baking soda and vinegar). No cleaning method was performed on the control group. Following cleaning, the jerrycans were rinsed with distilled water to remove any remaining cleaning agents (1 L rinse for the baking soda/vinegar group, 1 L for the Manadio Rano group, 5 L for the soapy water group). Following rinsing, each jerrycan was filled with 2 L of distilled water and shaken vigorously for 15 s in each direction. Effluent was collected and tested for fecal indicators, as described above. This provided a post-cleaning bacterial concentration for each indicator in each jerrycan.
Efficacy of cleaning is quantified by percent reduction in the measured bacterial concentrations:
%   reduction = ( CFU / 100   mL ) pre-clean ( CFU / 100   mL ) post-clean CFU / 100   mL pre-clean × 100 % ,
and a negative value of percent reduction indicates that the measured bacterial concentration was higher after cleaning than it was before cleaning.

2.6. Statistical Tests

For the analysis of collected data, we used four types of statistical tests: (1) χ2 tests to compare observed frequencies of regrowth/recontamination with expected or hypothetical frequencies, (2) Kolmogorov–Smirnov tests to determine if groups of collected data were normally distributed, (3) t tests to compare arithmetic means of groups of normally distributed data, and (4) Mann–Whitney U tests (equivalent to Wilcoxon rank sum tests) to compare distributions of data that were not normally distributed. Unless stated otherwise, a significance level of α = 0.05 was used as a threshold to determine statistical significance. Kolmogorov–Smirnov tests and Mann–Whitney U tests were performed in MATLAB® (version R2024a) using the kstest and ranksum functions, respectively; χ2 tests and t tests were performed in Microsoft Excel (Version 2404, Build 16.0.17531.20152) using the CHISQ.TEST and T.TEST functions, respectively.

3. Results

3.1. Frequency of Bacterial Regrowth/Recontamination in Household Water

Some degree of regrowth or recontamination was observed in all the households sampled in this study. In total, 10 households and their associated source waters were each sampled twice; in 19 of the 20 overall sample pairs, the concentration of at least one bacterial indicator was observed to be higher in the household water than in the source water. Thus, in a general sense, bacterial regrowth or recontamination in household water was observed to occur frequently in Toamasina, consistent with many other communities in LMICs where water is gathered and stored in the household [10,11,12,55].
The frequency of regrowth/recontamination differed somewhat from one fecal indicator to another, as shown in Figure 1. For all five indicators, an increase in bacterial concentration between collection and storage (i.e., regrowth or recontamination) was more frequent than a decrease in concentration. In this sense, we reiterate the finding that regrowth/recontamination of household water in Toamasina is a prevalent occurrence. However, only for Enterococcus (15 occurrences) and total coliforms (18 occurrences) is regrowth/recontamination more likely to occur than not (χ2 test to determine if there is a statistically significant difference between the observed frequency of regrowth/recontamination and a hypothetical frequency of 50%; p = 0.03 and 0.0003, respectively).
It is not surprising that the different fecal indicators exhibited different frequencies of regrowth/recontamination: Jagals et al. [20] also observed that the extent of recontamination differed between E. coli, C. perfringens, and total coliforms; Meierhofer et al. [28] observed differences in the growth of E. coli and total coliforms. An interesting question is why the different indicators behave differently. It is reasonable to expect that some of the indicators survive and grow better than others in the environment under consideration, i.e., in household water containers at ambient temperature; differences in growth and survival could be related to temperature [56] or to the composition of assimilable organic carbon in the water [57], for example. However, here, we hypothesize that the different frequency and severity of bacterial regrowth/recontamination is due mainly to the presence or absence of the bacteria in biofilms on the interior surfaces of the water storage containers cf. [20]. Evidence supporting this hypothesis will be presented subsequently.
The relatively infrequent occurrence of E. coli regrowth/recontamination (Figure 1) is interesting in light of a recent study in southeastern Madagascar [37] that found more than 60% of drinking water samples were contaminated by E. coli at relatively high concentrations. The difference between our results and those of the previous study could be caused by a difference in context: the regions of Madagascar studied by Poulin et al. [37] are predominantly rural and agricultural, whereas Toamasina is urban and peri-urban. Water sources in the rural southeast are more likely to be impacted by animal feces [37]. Also, in the present study, for many of the samples from both source water and household water, E. coli were not detected, resulting in an apparent situation of “bacterial concentration stayed the same” in Figure 1 (i.e., the source water and the household water both appeared to be 0 CFU/(100 mL)). However, the non-detection of E. coli could possibly be a “false negative” result caused by a high dilution factor. This is because E. coli and total coliforms are quantified from the same water sample on the same Petri dish (see Section 2.3), and the water sample often must be diluted by a factor of 10, 100, or 1000 to yield a reliable estimate of the total coliform concentration. Therefore, in Figure 1, the estimate of 14 incidents of “bacterial concentration stayed the same” for E. coli might be an overestimate, and it is possible that household water in Toamasina is more susceptible to E. coli regrowth/recontamination than is suggested by Figure 1. Finally, it is possible that the underlying mechanism of water-quality deterioration (regrowth or recontamination, as defined previously) could differ between the two study sites.

3.2. Severity of Bacterial Regrowth/Recontamination in Household Water

If, instead of examining frequency, we examine the actual bacterial concentrations in source water and in household water (i.e., the severity of regrowth/recontamination), similar findings emerge. Figure 2 shows the distributions of measured concentrations for the two most common indicators, Enterococcus and total coliforms, in both source water and stored household water. In Figure 2, the central mark of each distribution is the median measured concentration, and the edges of the box are the 25th and 75th percentiles of the measured concentrations.
From Figure 2, it can be clearly seen that the bacterial concentrations increased between the water source and the household for both Enterococcus and total coliforms. Similar results were also observed for the other three indicators [45]. Based on a Mann–Whitney U test, the observed differences in bacterial concentrations were statistically significant for total coliforms (p = 0.0009), for Enterococcus (p = 0.011), and for C. perfringens (p = 0.0018). This finding is generally consistent with the results for frequency of regrowth/recontamination (Figure 1 and Section 3.1).

3.3. Correlation of Regrowth/Recontamination with Type of Water Source

People in Toamasina who store water in their homes gather that water from a variety of sources. Two of the most common sources of gathered water are self-supply groundwater pumps, known locally as paompy tany [58], and public or semi-private taps managed by JIRAMA, the national utility service. Of the ten households monitored in this study, five households used paompy tany as their water source, four households used JIRAMA taps as their water source, and one household used both (paompy tany during the first sampling campaign and JIRAMA during the second sampling campaign). We wanted to know if the frequency or severity of bacterial regrowth/recontamination is correlated with the source of the household water (paompy tany or JIRAMA).
The biological quality of JIRAMA tap water is typically superior to that of paompy tany water at the respective collection points. Paompy tany access shallow groundwater that is potentially impacted by a variety of sources of contamination [58], including latrines, which are used commonly in Toamasina for the disposal of human excrement. Also, the shallow groundwater accessed by paompy tany has not undergone any treatment prior to its collection. In contrast, water from JIRAMA taps has usually undergone some form of treatment and often contains a measurable concentration of chlorine residual to protect against biological contamination (measurable free-chlorine residual in seven of the nine JIRAMA water samples collected, ranging from 0.02 mg/L to 0.17 mg/L; see Judah [45]). In paompy tany samples collected in this study, the 75th percentile for measured Enterococcus concentrations was 87 CFU/(100 mL) and the 75th percentile for measured total coliform concentrations was 4300 CFU/(100 mL). However, in JIRAMA samples, the 75th percentiles for the concentrations of these indicators were only 2 CFU/(100 mL) and 4 CFU/(100 mL), respectively.
Because of the difference in source-water quality, one might expect household water collected from paompy tany to experience worse deterioration than water collected from JIRAMA taps cf. [59]. However, that would likely only be the case if bacterial regrowth (rather than recontamination) is the dominant cause of water-quality deterioration after collection. If recontamination from contaminated hands, utensils, or containers is the principal driver of water-quality deterioration, then the quality of the original source water would be of less importance.
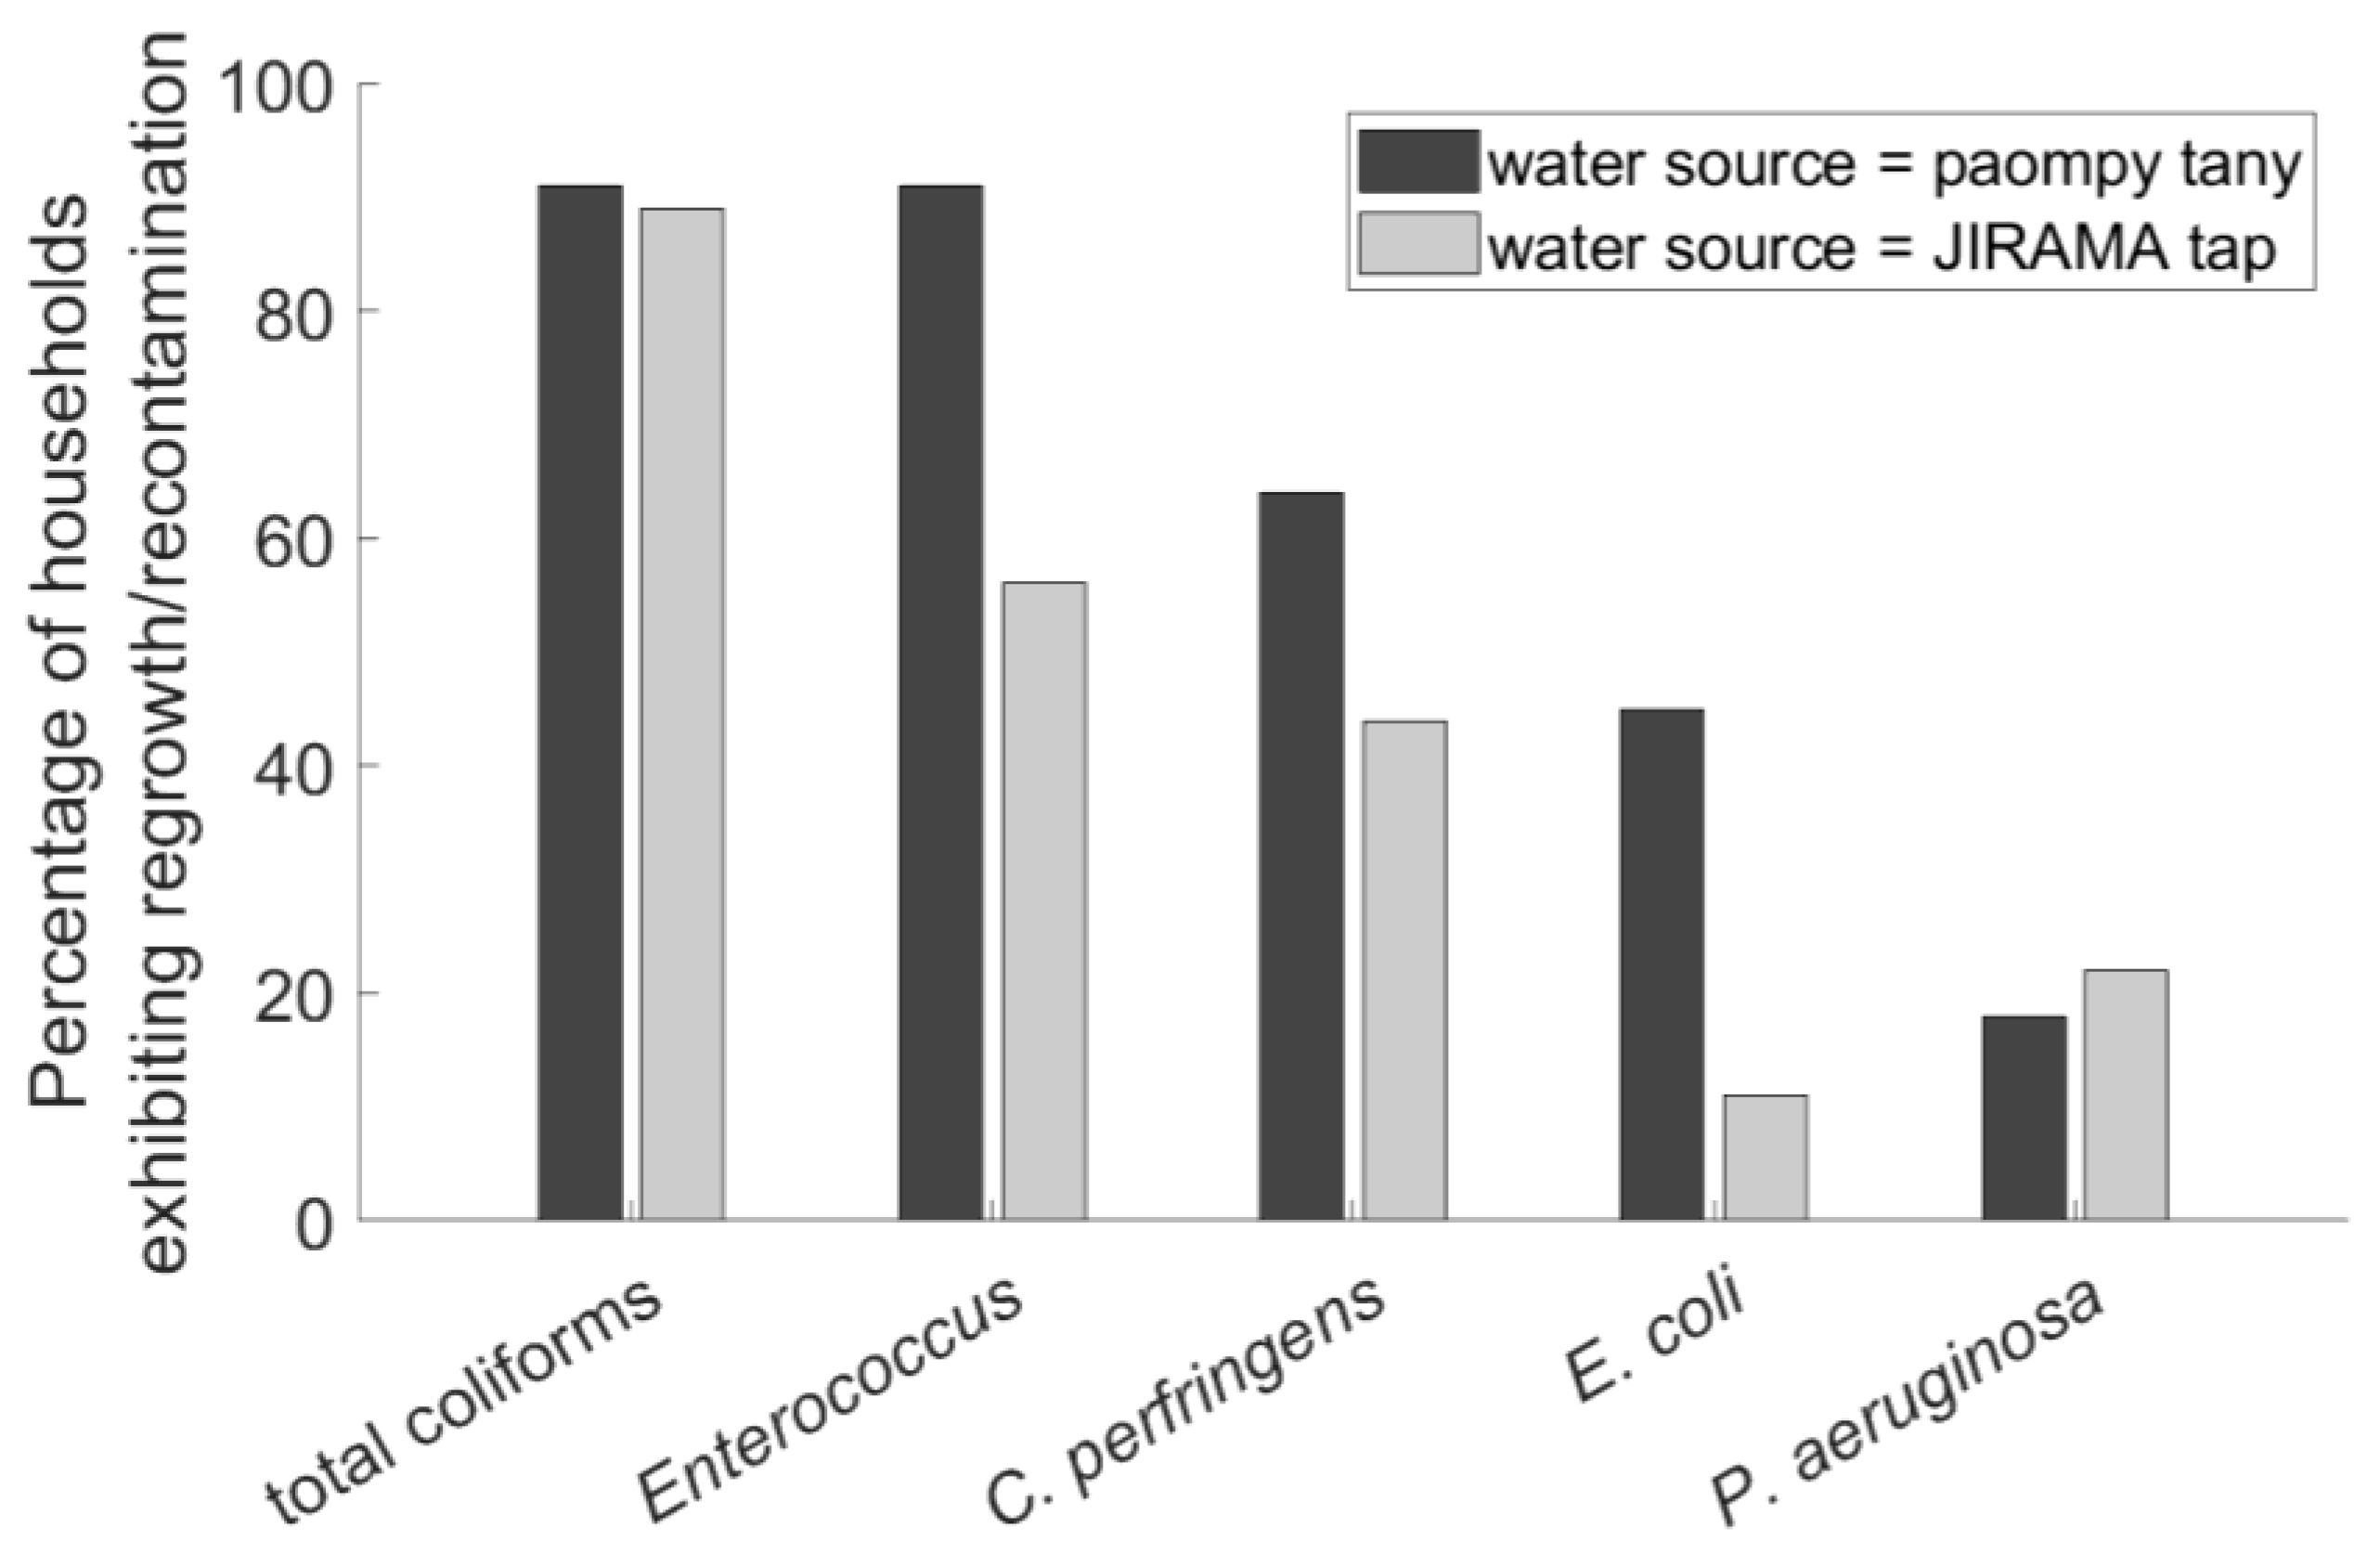
It can be seen from Figure 3 that the frequency of regrowth/recontamination does not differ greatly based on the water source. For E. coli and Enterococcus, we can conclude with 90% confidence (but not with 95% confidence) that regrowth/recontamination is more frequent when a paompy tany is the source of the water than when a JIRAMA tap is the source of the water (χ2 test; p = 0.095 and 0.069, respectively). Furthermore, when we compare the measured increase in bacterial concentrations (i.e., the concentration in the household water minus the concentration in the source water), only for Enterococcus is there a significant difference between households using paompy tany and households using JIRAMA taps (Mann–Whitney U test, comparing increases in JIRAMA-sourced water to increases in paompy tany-sourced water; p = 0.0097).
Thus, although JIRAMA water is generally a higher-quality source water than shallow groundwater from paompy tany, the frequency and severity of bacterial regrowth/recontamination are approximately the same for both water sources. This suggests that recontamination, rather than regrowth, might be the dominant driver of water-quality degradation in household water. We still recommend that people in Toamasina should select JIRAMA water over paompy tany water if both are equally available; in this study, stored household water sourced from JIRAMA taps had significantly lower levels of Enterococcus and total coliforms than did stored household water sourced from paompy tany (Mann–Whitney U test; p = 0.015 and p = 0.0067, respectively). However, the selection of the water source, on its own, does not prevent bacterial regrowth or recontamination of the collected water.

3.4. Correlation of Regrowth/Recontamination with Type of Storage Vessel

As summarized previously in this paper, conventional wisdom holds that closed containers with a narrow mouth are more protective of water quality than open containers such as buckets [5,6]. However, some studies have failed to find a correlation between water quality and the physical shape of the storage container [8,11,14,26]. We therefore wanted to know if the frequency or severity of bacterial regrowth/recontamination in Toamasina is correlated with the type of household storage vessel (open or closed container). Of the ten households monitored in this study, five households stored their water in closed bottles or jerrycans and five stored their water in open containers (most commonly a bucket).
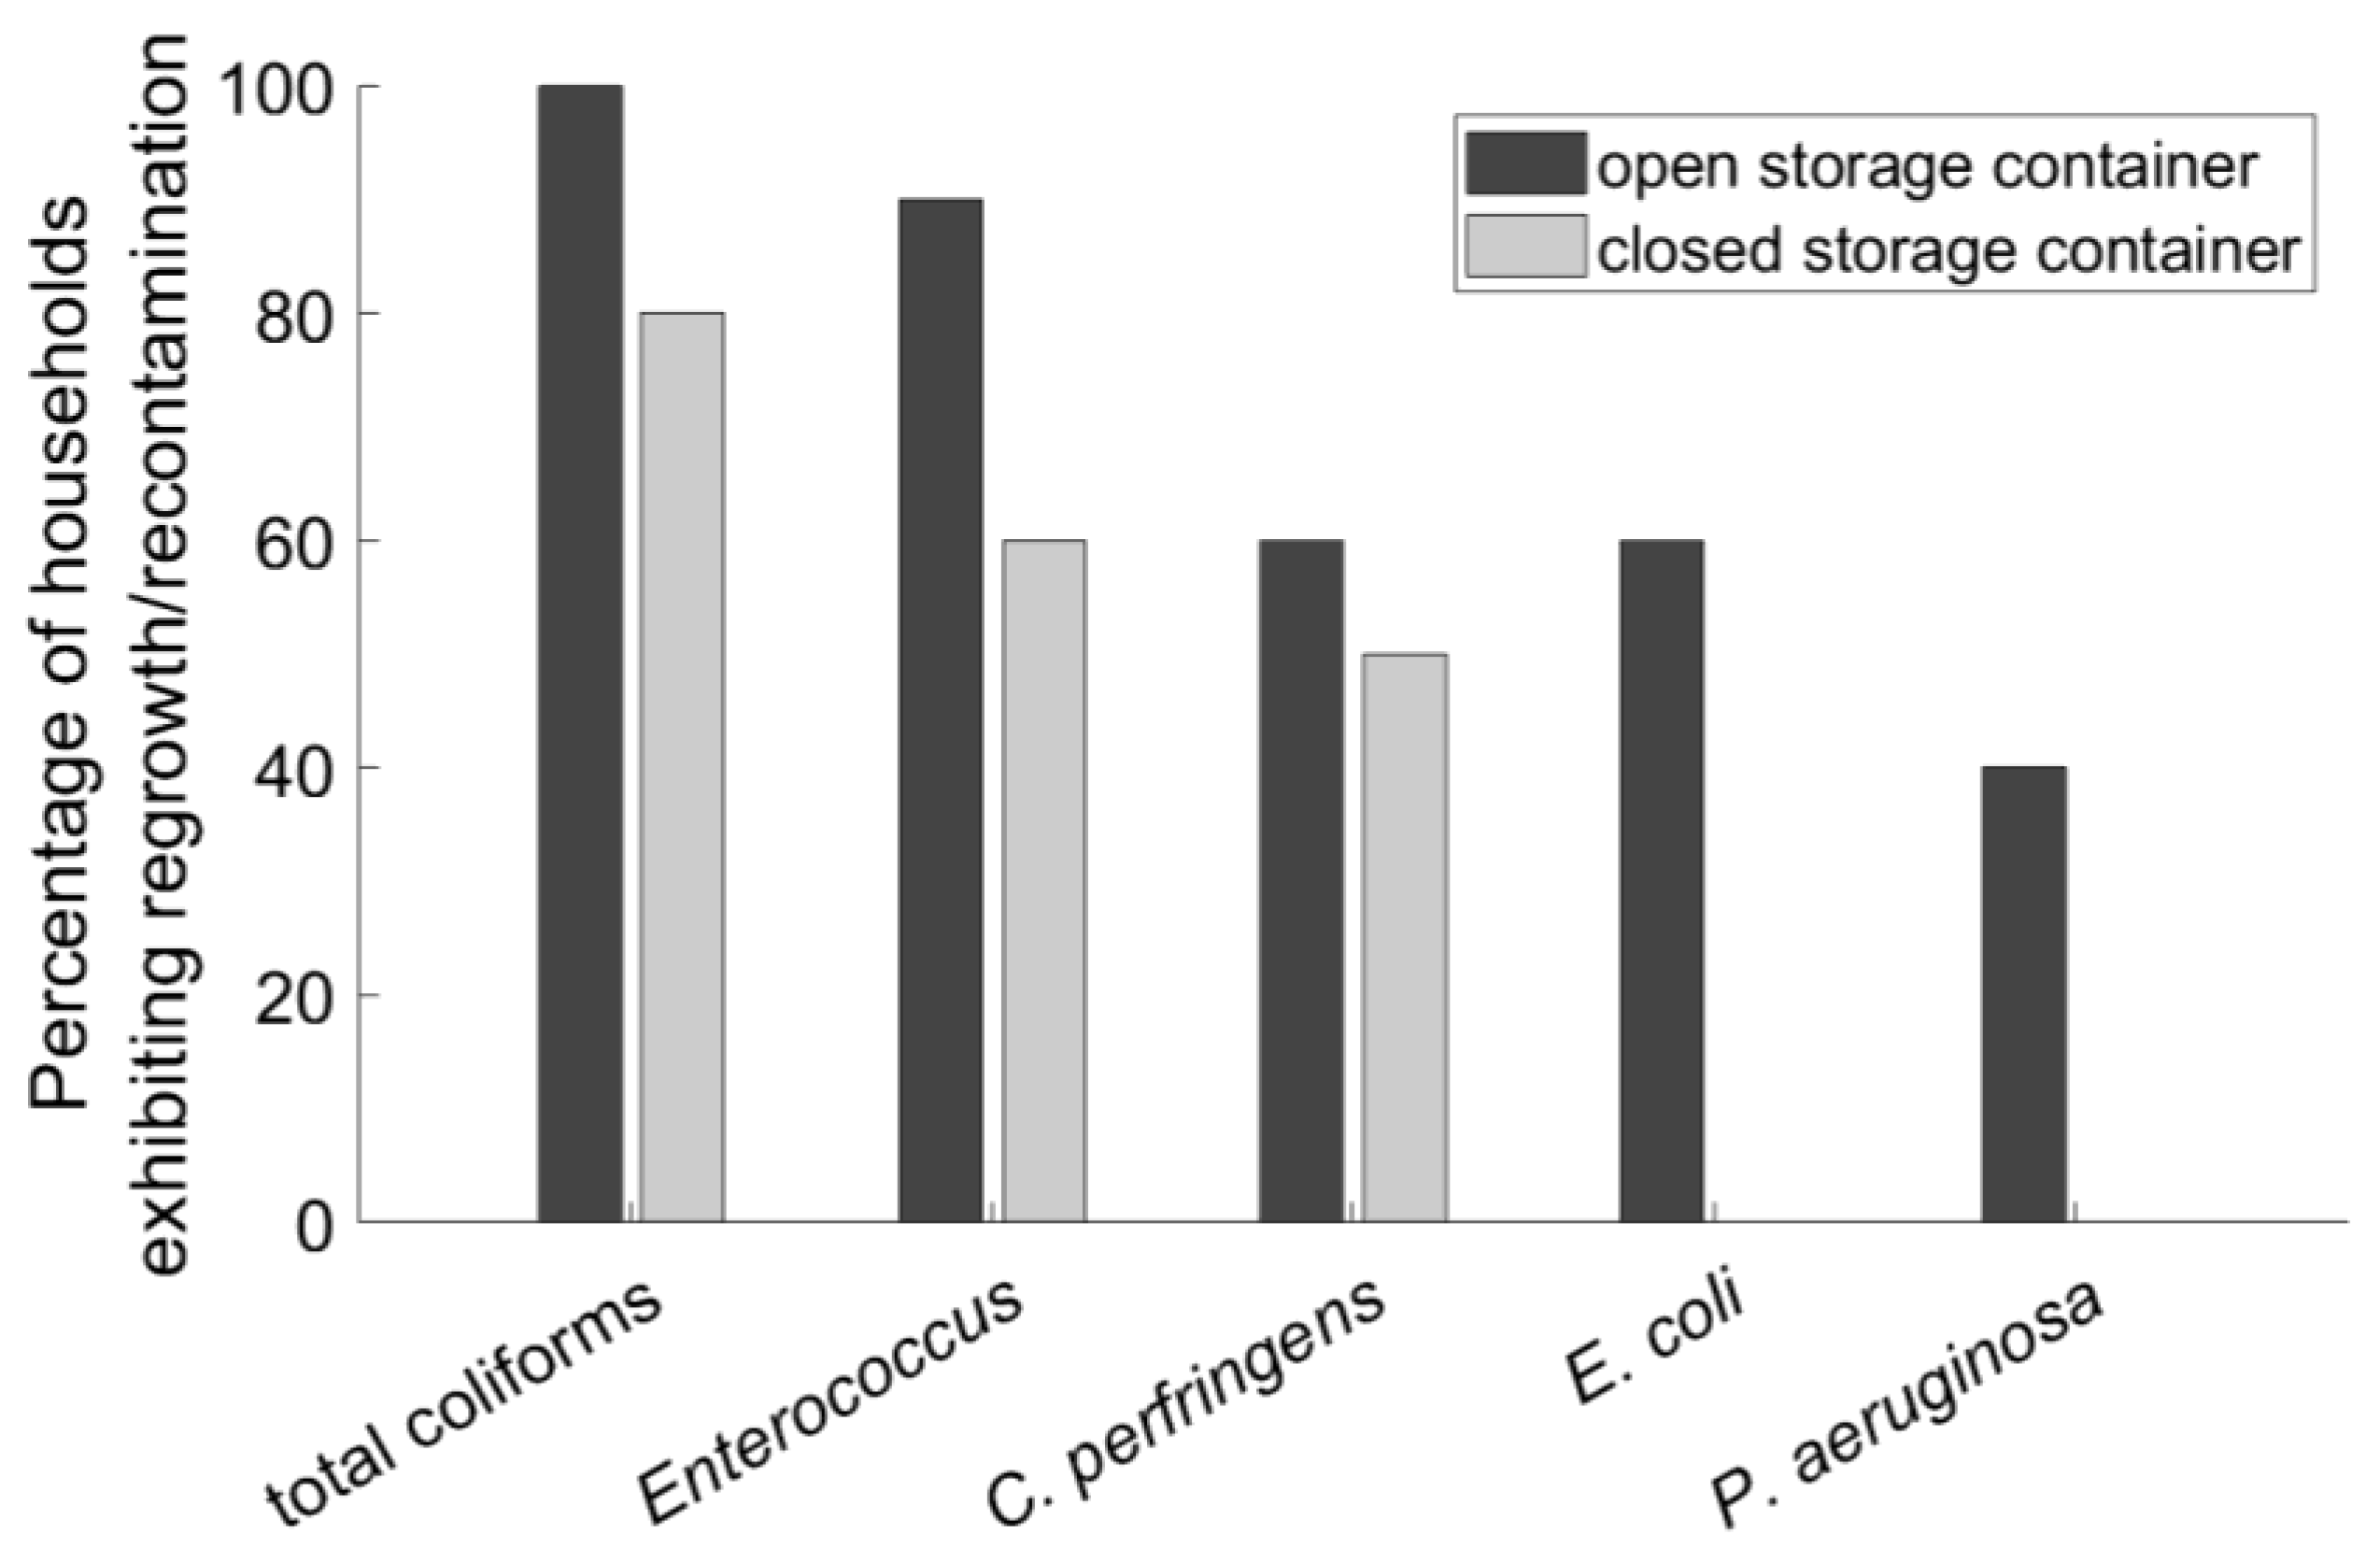
It can be seen from Figure 4 that regrowth/recontamination by all five fecal indicators is more frequent in open containers than in closed containers. For E. coli and for P. aeruginosa, but not for the other three indicators, the effect is statistically significant at a 95% confidence level (χ2 test; p = 0.0034 and 0.025, respectively). Similar results arise if we consider the severity of recontamination. When we compare the measured increase in bacterial concentrations (i.e., concentration in the household water minus the concentration in the source water), there is a significant difference between households using open containers and households using closed containers for both E. coli (p = 0.006) and P. aeruginosa (p = 0.025; Mann–Whitney U test comparing increases in open container-stored water to increases in closed container-stored water).
Interestingly, and importantly, the type of storage vessel does not have a significant effect on the frequency or severity of recontamination by Enterococcus or by total coliforms, the two indicators that most frequently exhibit recontamination in Toamasina households. In fact, the average (mean) increase in both Enterococcus and total coliforms was higher in households using closed storage containers than in households using open storage containers (Table 1), although the effect was not found to be significant with 95% confidence.
We therefore conclude that the use of closed storage containers does not, on its own, ensure protection against bacterial regrowth/recontamination. Closed containers do appear to offer protection against E. coli and P. aeruginosa, suggesting that perhaps these bacteria are introduced into the water by external sources such as animals or contaminated utensils. However, closed containers do not offer significant protection against Enterococcus, total coliforms, or C. perfringens. This might indicate that the presence of these bacteria in household water is caused by regrowth of the bacteria if they were present in the original source water, or that the household storage container itself is an important source of these bacteria, a hypothesis that will be investigated subsequently. However, these findings do not necessarily mean that closed storage containers might not be part of an overall strategy for safe water storage cf. [24,25]. In the sections that follow, we explore what other factors might be important and/or necessary towards an overall strategy of safe household water storage.

3.5. Combined Effects of Water Source and Storage Vessel

In the preceding sections, we found that neither the selection of the water source nor the use of a closed storage vessel is, on its own, sufficient to protect against bacterial regrowth/recontamination. It is also worth considering if there is any synergy between these two factors.
Three of the ten households considered in this study used both JIRAMA source water and a closed storage vessel [45]. These three households exhibited significantly less recontamination by total coliforms (p = 0.0034) and Enterococcus (p = 0.0083) than the other seven households (Mann–Whitney U test). This result is shown graphically in Figure 5 for total coliforms. For the other three indicators besides total coliforms and Enterococcus, recontamination was also less severe in the three households using JIRAMA water and closed vessels than in the other seven households. However, for those three indicators, the effect was not found to be significant with 95% confidence (Mann–Whitney U test, α = 0.05).
These findings are in general agreement with the recommendations of the CDC [24,25] that safe water storage should include treatment of water with disinfectant followed by storage in a closed vessel. Furthermore, this might represent important information for the community in Toamasina: using JIRAMA water as a source and storing it in closed containers appears to be correlated with a significant improvement in quality of household water (and, presumably, a concomitant decrease in gastrointestinal disorders). The sample size here is small (n = 6), so even though the effect was found to be significant with 95% confidence, we still consider the finding tentative until a larger data set can corroborate the result. We also tentatively hypothesize that the observed relationship is causal (not merely correlated), i.e., that the improvement in water quality is a result of the combination of JIRAMA water and closed storage vessels.
Unfortunately, many people in Toamasina might not have ready access to a JIRAMA tap and might therefore be forced to rely on water from paompy tany or other lower-quality sources. It is therefore important to consider what other options might be available for members of the community to protect and/or improve the quality of their stored household water. Such options are considered subsequently.

3.6. Are Biofilms on Vessel Walls a Source of Recontamination?

Some previous studies have implicated biofilms on the walls of storage containers as a source of fecal bacteria into the stored water [8,15,18,20,22]. However, it is not yet clear how ubiquitous this phenomenon is. We therefore wanted to determine if biofilms on container walls are prevalent in Toamasina. We collected 20 L jerrycans that had been used for storage by four of the ten households in this study and tested for the presence of fecal indicator bacteria in biofilms on the walls of those four jerrycans. Of the four households that provided us with their jerrycans for testing, two used JIRAMA and two used paompy tany as their water source.
All four jerrycans tested positive for the presence of Enterococcus and total coliforms, three of four tested positive for the presence of C. perfringens, and one of four tested positive for the presence of E. coli (Table 2). These results are consistent with those of Jagals et al. [20], who found that biofilms in PVC storage containers harbored total coliforms and C. perfringens but not E. coli. Although the sample size is small, it seems that biofilm formation on the walls of the storage vessels is ubiquitous, and that these biofilms consistently harbor at least two of the fecal indicator bacteria. The fecal indicator bacteria were present in all jerrycans regardless of the source of the water (JIRAMA or paompy tany) stored in them.
These results help us to understand and interpret some of the findings discussed previously in this paper. For instance, we can see that the frequency of regrowth or recontamination of the five different indicator bacteria (Figure 1) is consistent with the frequency of finding those bacteria in jerrycan biofilms (Table 2). The bacteria found most commonly in biofilms (Enterococcus and total coliforms) are the ones that most frequently exhibit regrowth/recontamination (Figure 1 and Figure 2); the bacteria that we rarely found in biofilms (E. coli and P. aeruginosa) seldom exhibit regrowth/recontamination (Figure 1). This suggests that the phenomenon of bacterial regrowth/recontamination is driven largely by the presence of the biofilms in the storage vessels rather than by the presence of the bacteria in the source water or by the introduction of the bacteria from a dirty ladle or dirty hand cf. [20].
We can also now see why the use of a closed storage container is protective against E. coli and P. aeruginosa, but not against the other three indicators (Figure 4, Table 1). E. coli and P. aeruginosa are generally not present in the jerrycan biofilms, and a closed container can help to guard against their introduction by external sources (e.g., dirty utensils), thereby effectively preventing their regrowth or recontamination in the closed containers. However, Enterococcus, C. perfringens, and total coliforms are already present in the jerrycan biofilms, so keeping the jerrycan closed does not eliminate their presence and therefore does not prevent regrowth/recontamination.
One finding that is not explained by the biofilms is how or why the combined use of JIRAMA water and a closed storage vessel is able to protect against regrowth/recontamination of total coliforms (Figure 5) and Enterococcus. All four jerrycans tested, including the two that had used JIRAMA water as a source, harbored total coliforms and Entero-coccus in their biofilms. Why, then, do the closed vessels using JIRAMA water exhibit significantly reduced regrowth and recontamination of these organisms? One possibility is that the presence of a low concentration of residual chlorine in the JIRAMA source water [45] suppresses the regrowth of bacteria that are harbored in the biofilms, but that the chlorine residual does not persist in open buckets; that would explain why a protective effect is observed only in households using both JIRAMA water and a closed container. Another possibility is that paompy tany water, which is impacted by a variety of stressors, contains higher concentrations of assimilable organic carbon that is needed to promote the growth of the bacteria harbored in the biofilms. However, in that case, we might expect to see a more significant impact of the source water than that which was actually observed (Figure 3). The specific mechanism of the observed protective effect is therefore only hypothesized at this point.

3.7. Efficacy of Locally Available Cleaning Methods

From the preceding analysis, it is clear that the presence of biofilms on the walls of the storage container plays an important role in bacterial recontamination of stored household water, especially recontamination by Enterococcus and total coliforms. We therefore wanted to determine if there are realistic strategies by which people can clean the jerrycans and thereby partially or completely remove the biofilms. It has been noted by previous researchers [23,28,30] that it is challenging to clean narrow-necked vessels such as jerrycans because the shape of the vessel prevents accessing all internal surfaces via insertion of an arm or tool. We therefore tested three potential cleaning methods based on the use of affordable and locally available cleaning solutions that do not require scrubbing of internal surfaces. Also, we tested chemical cleaning methods rather than abrasive cleaning methods because there is some evidence that increased container roughness caused by abrasion of the interior surfaces can lead to more rapid biofilm regrowth in the future [30].
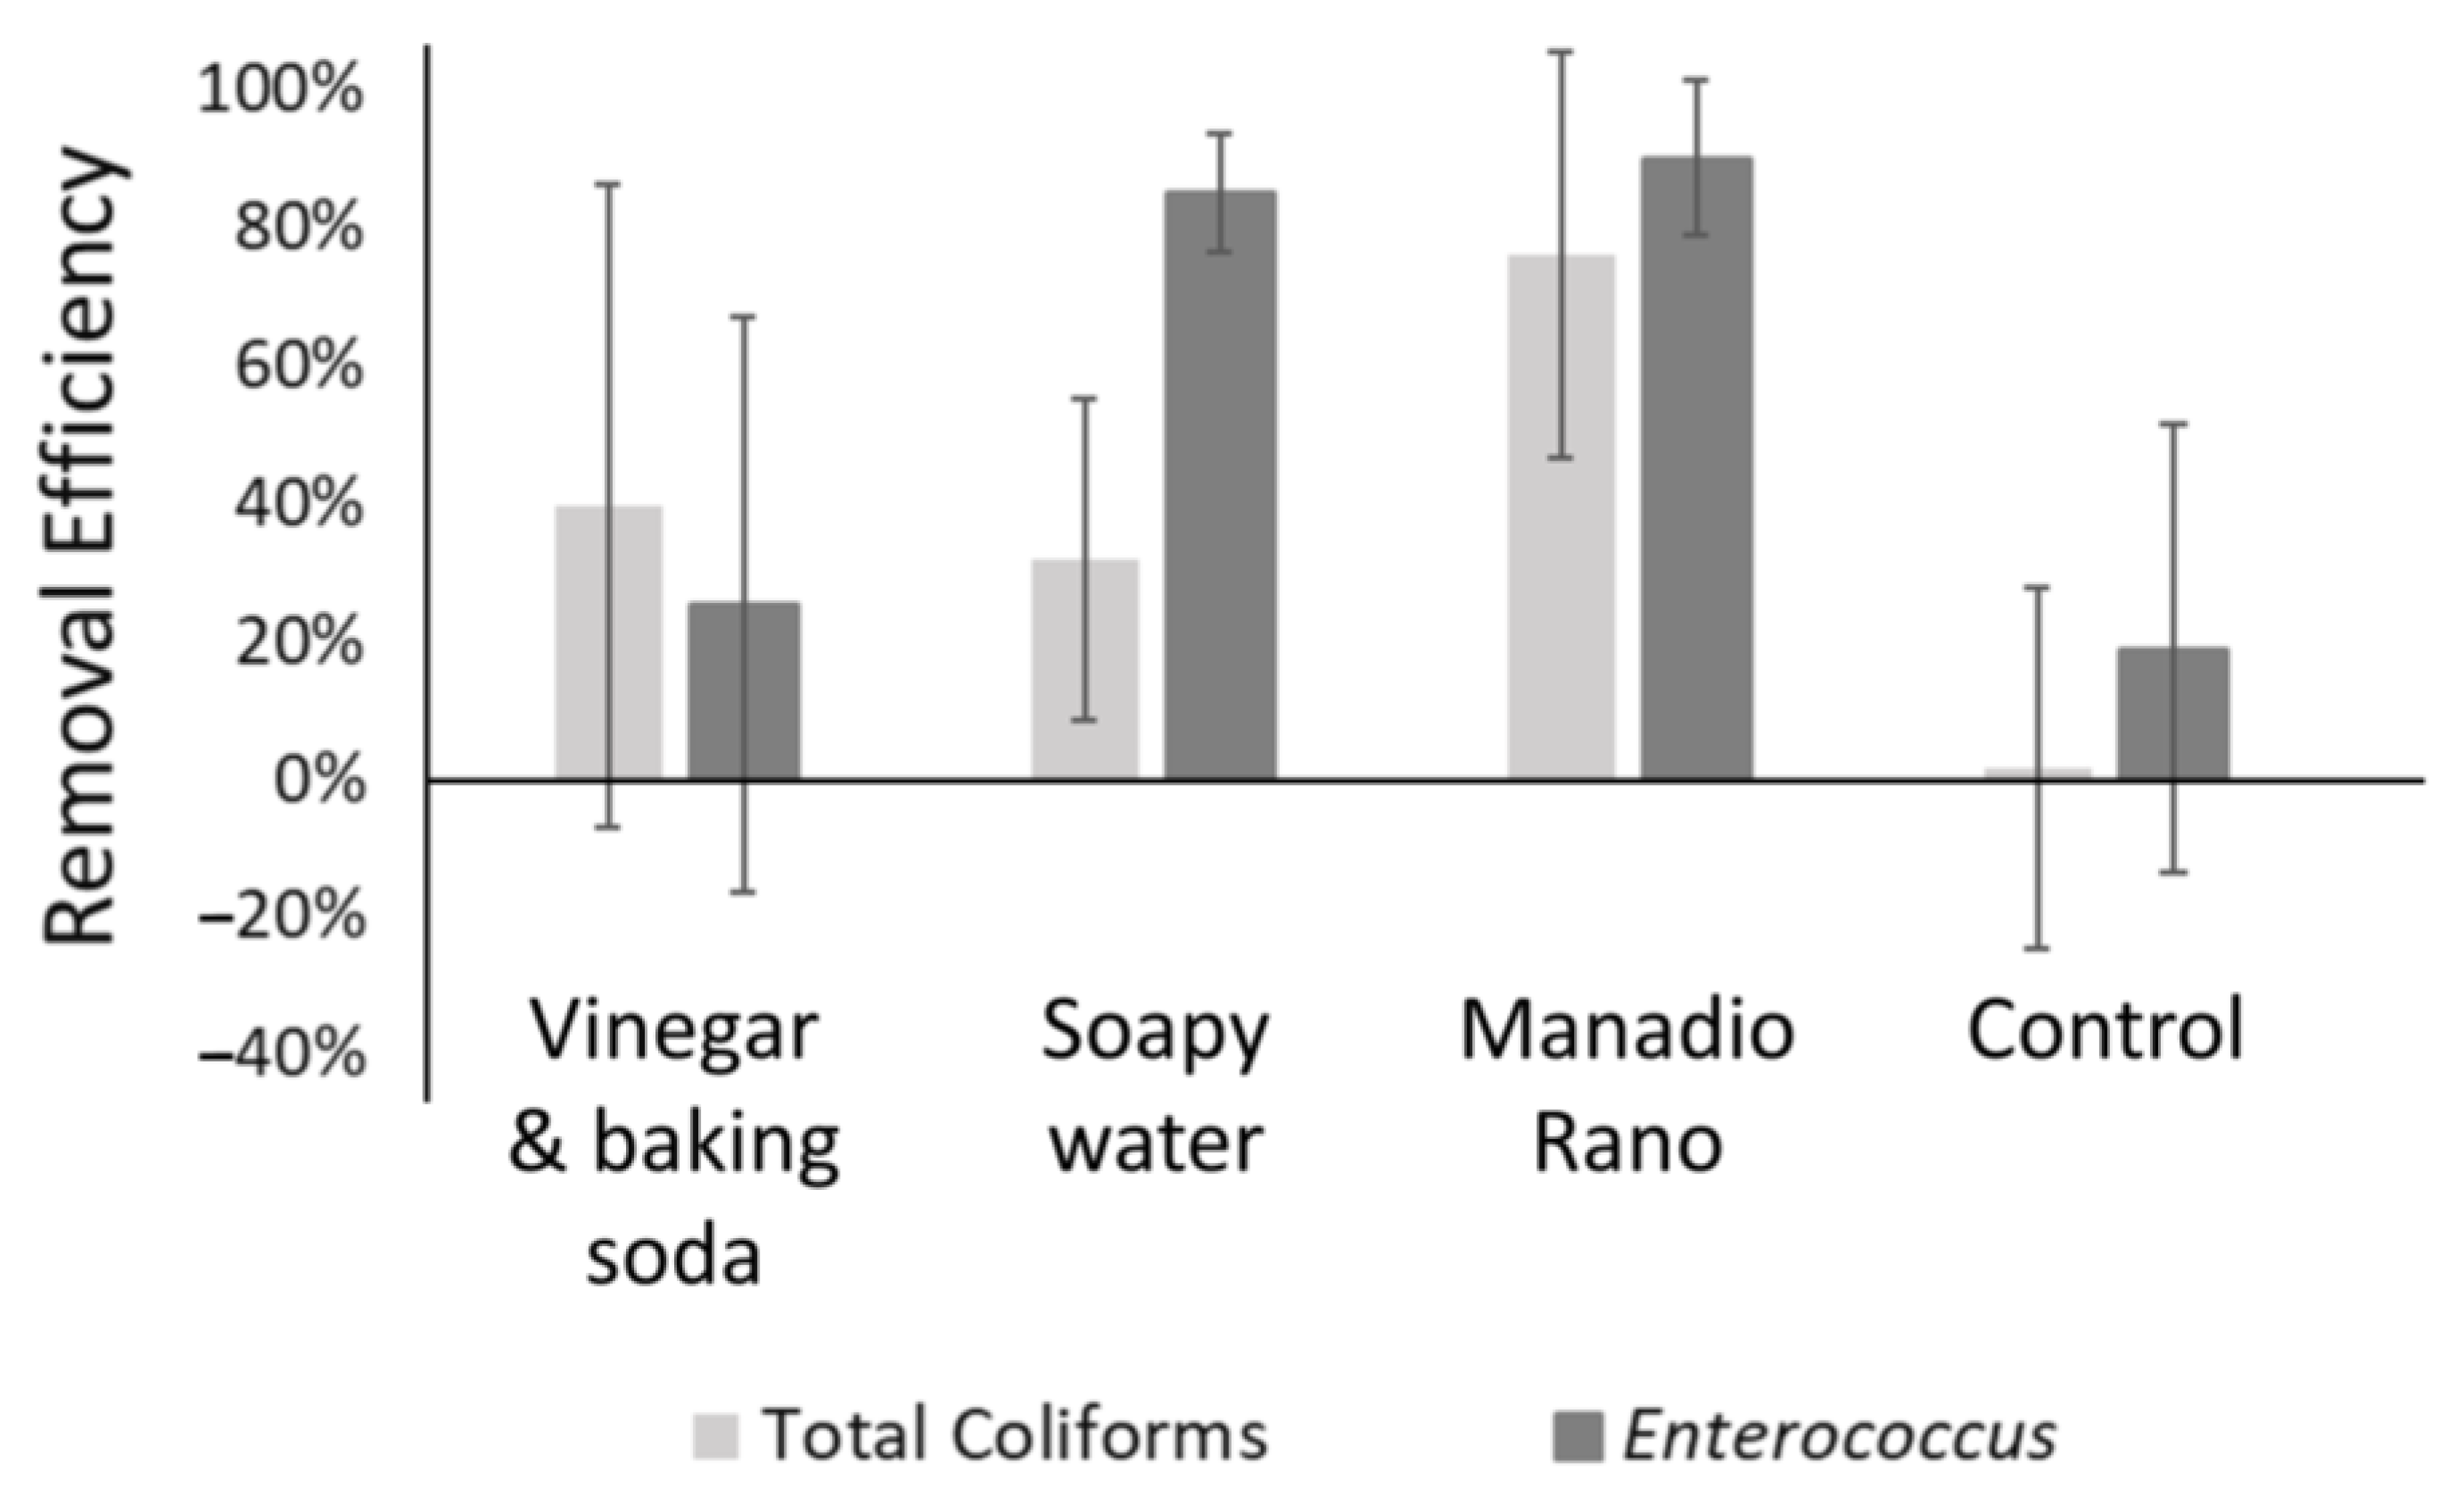
The efficacy of the cleaning methods is shown in Figure 6. All three cleaning methods provided some reduction in the average measured concentrations of Enterococcus and total coliforms, i.e., all three cleaning methods provided some benefit. Cleaning with Manadio Rano (dilute hypochlorite) provided significantly better reduction in total coliforms than rinsing with water alone (two-tailed t test, p = 0.031). Also, we can be 90% confident (but not 95% confident) that cleaning with either Manadio Rano or soapy water provides significantly better reduction in Enterococcus than rinsing with water alone (two-tailed t test, p = 0.051 and 0.064, respectively).
From Figure 6, we can see that Manadio Rano is, on average, the most effective of the three cleaning solutions tested. This result is consistent with those of Steele et al. [35] and String et al. [30], who found that biofilm growth on jerrycans was ameliorated by cleaning with hypochlorite solution. Importantly, Manadio Rano is also the least expensive of the three tested cleaning methods; Judah [45] estimated that the cost of cleaning a jerrycan with Manadio Rano is approximately USD 0.10 per cleaning. Furthermore, Manadio Rano is easily available for purchase in many locations around Toamasina. However, we have observed that community members rarely, if ever, employ Manadio Rano for its intended purpose, which is the point-of-use disinfection of water on a regular basis. Despite previous efforts in Madagascar to promote hypochlorite solutions (often marketed under the product name Sûr’Eau) for water treatment [60,61,62], this practice has not been accepted or adopted by people in Toamasina. What remains to be determined is whether people will be more accepting of Manadio Rano as a cleaning solution to be used periodically for disinfecting household water storage containers.
These results show that Manadio Rano is effective at treating the biofilms on the internal walls of jerrycans, but we have not yet tested what happens when jerrycans are put back into service following cleaning. Does the reduction of the biofilms actually reduce the frequency or severity of bacterial recontamination of household water? Previous research by Steele et al. [35] and String et al. [30] suggests this might be the case, but it has not yet been determined for Toamasina.

4. Discussion

4.1. Regrowth, Recontamination, or Both?

From Figure 1, Figure 2, Figure 3, Figure 4 and Figure 5, it is clear that the biological quality of water stored in the participating households is, overall, worse than the quality of the original source waters. An important question is whether the observed deterioration of water quality is due to regrowth (bacteria present in the water at the time of collection grew from low levels to high levels over time), recontamination (water originally free from pathogens became contaminated during handling, perhaps from contact with contaminated hands, utensils, or containers), or both. Identifying the mechanism responsible for water-quality deterioration is likely to be a necessary first step in preventing that deterioration.
Although the source waters frequently contained measurable levels of the indicator bacteria—which might suggest that the water is susceptible to regrowth—we conclude that recontamination, not regrowth, is the dominant mechanism of water-quality degradation in households in Toamasina. However, the main source of the recontamination differs among the different fecal indicators. For total coliforms and Enterococcus, and possibly for C. perfringens, the source of recontamination appears to be biofilms on the walls of the storage containers (Table 2). This explains why the frequency of recontamination did not depend on the source water employed (Figure 3), and why the severity of recontamination in closed containers was just as bad as in open containers (Table 1). However, E. coli and P. aeruginosa are not ubiquitous in jerrycan biofilms (Table 2); for these indicators, it seems that some external source (perhaps a contaminated hand or utensil) is the main source of recontamination. That would explain why closed containers offered greater protection than open containers against recontamination by E. coli and P. aeruginosa (Figure 4). These findings are consistent with those of Jagals et al. [20].

4.2. Limitations of This Study

The preceding analysis has answered several questions that are important for protecting the safety of household water in Toamasina, and we posit that these results will be similarly important for other communities in LMICs where people gather their water and store it in their households. However, we recognize three important limitations of this analysis. First, the number of samples analyzed (10 households and their associated 10 water sources, each sampled twice) is somewhat small. The relatively small sample size is likely one reason why some of the apparent trends and patterns that we observed cannot be considered significant with 95% confidence.
Second, the samples were collected over a relatively short two-week period, and therefore represent a “snapshot” of the water quality in the source water and the household storage containers. It must be recognized that the quality of the source water might change over time (e.g., seasonally, or in response to extreme weather events), and such changes are not captured by our analysis. Similarly, households that used JIRAMA water during our sampling campaigns might have sometimes used paompy tany water in the past, and vice-versa. This might have had an effect on the development of the biofilms on the jerrycans.
Third, and finally, in our laboratory analyses, distilled water (as opposed to, say, sterile phosphate buffer solution) was used for dilutions and for the measurement of bacterial concentrations derived from jerrycan biofilms. The use of distilled water can potentially lead to bacterial cell lysis from a large gradient in osmotic pressure between intra-cellular and extra-cellular environments. If this occurred, our estimates of bacterial concentrations would be underestimates of the true concentrations, because lysed cells would not form colonies during the membrane filtration tests.
The small sample size, the short duration of the sampling campaigns, and the use of distilled water were all necessary due to the practical challenges of conducting research in a community that is not easily accessed by research teams or by suppliers of research supplies. We contend that our results and analyses are valid and important despite these practical limitations. The results exhibit a high degree of internal consistency, as well as consistency with previously published studies, that might not be expected if they were affected significantly by sample size or by the use of distilled water. For instance, the observed frequency of bacterial recontamination by the different fecal indicators (Figure 1) is exactly consistent with the observed presence of the indicators in the jerrycan biofilms (Table 2). Such consistency gives us confidence that any effects caused by the sample size or by the use of distilled water are small. In the future, we will attempt to collect additional data to augment the data sets presented here, and we will attempt to procure additional lab supplies to further refine the bacteriological analyses. However, in the meantime, we believe the results and analysis presented herein are important to convey to the residents of Toamasina, and to researchers working in similar communities throughout the world.

4.3. Implications and Recommendations for Household Storage in Toamasina

Using JIRAMA source water and storing it in closed containers is correlated with significant improvement in bacteriological water quality (Figure 5). Thus, residents of Toamasina might benefit from using a combination of JIRAMA water and a closed storage container if this option is available to them. However, it must be recognized that there might yet be important physico-chemical or organoleptic issues with the stored water that prevent it from being recommended outright as a source of drinking water. Furthermore, using JIRAMA water and a closed storage container might not be feasible for every resident, as JIRAMA water is not available on many residential premises, and supply may be intermittent. Thus, it is important that paompy tany users keep their storage vessels clean and free of biofilms, perhaps by disinfecting with Manadio Rano, which was found to be the most effective and least expensive (~USD 0.10 per use) cleaning option for biofilm removal. Other options for water management that were not explored in this study include point-of-use disinfection and/or purchase of high-quality, moderately priced, treated water from Ranontsika kiosks; these may be considered in future work. By improving the quality of their stored water, Toamasina residents can presumably decrease their risk of diarrheal diseases and the accompanying health and financial burdens associated with such illnesses.

5. Conclusions

We determined that, in Toamasina, the biological quality of gathered water deteriorates between the point of collection and the point of storage (i.e., the household). This deterioration is caused largely by the presence of biofilms on the interior walls of household storage containers. These biofilms harbor fecal indicator bacteria such as Enterococcus and total coliforms. For bacteria that are generally not present in the biofilms (Escherichia coli, Pseudomonas aeruginosa), the use of a closed storage vessel can protect against bacterial recontamination by preventing the introduction of those bacteria into the water (e.g., via a dirty utensil). However, for bacteria that are present in the biofilms (Enterococcus, total coliforms), the use of a closed storage container is not protective against recontamination because the bacteria are already present in the vessel.
Thus, the use of a closed storage container is, on its own, not sufficient to protect against regrowth/recontamination. Similarly, the use of a higher-quality water source (treated water provided by the national utility to a communal tap) instead of a lower-quality water source (shallow groundwater accessed by hand pumps) is, on its own, not sufficient to protect against regrowth/recontamination. In the households studied here, the combined use of the higher-quality source water with a closed storage vessel was associated with a statistically significant decrease in regrowth/recontamination of total coliforms. This was somewhat surprising, because the closed storage vessels—even those used to store high-quality water—are known to contain biofilms on the interior vessel walls. The exact mechanism of the observed protective effect is presently undetermined.
Because biofilms on the vessel walls lead to bacterial recontamination, we conclude that regular and effective cleaning of storage vessels should be recognized as an essential component to safe water storage. Of the three cleaning protocols tested, a dilute solution of sodium hypochlorite, known locally as Sûr’Eau or Manadio Rano, was both the most effective and the least expensive. Although Manadio Rano is readily available for purchase in many locations around Toamasina, community members generally do not use it for its intended purpose, i.e., regular point-of-use water disinfection cf. [63]. It remains to be determined if people will be more accepting of Manadio Rano as a cleaning solution to be used periodically for disinfecting household water storage containers.
These findings are particularly important in light of a recent study [37] that found that drinking water is an important route of exposure to fecal bacteria for children in southeastern Madagascar. Beyond Madagascar, household storage of gathered water is common in cities in many low- and middle-income countries [40]. We therefore believe that the results of this study are important towards the worldwide achievement of the United Nations’ Sustainable Development Goal 6.

Author Contributions

Conceptualization, L.A.J., M.K., J.R.M. and J.A.C.; methodology, L.A.J., L.R. and L.J.P.B.; investigation, L.A.J. and C.A.; resources, L.R. and L.J.P.B.; formal analysis, L.A.J. and J.A.C.; writing—original draft preparation, L.A.J. and J.A.C.; writing—reviewing and editing, M.K., J.R.M. and J.A.C.; visualization, L.A.J. and J.A.C.; supervision, L.J.P.B., J.R.M. and J.A.C.; project administration, J.A.C.; funding acquisition, M.K., J.R.M. and J.A.C. All authors have read and agreed to the published version of the manuscript.

Funding

This research was funded by the U.S. National Science Foundation (NSF) grant numbers 1930451 and 2107114.

Data Availability Statement

The data presented in this study are available on request from the corresponding author.

Acknowledgments

The authors thank Olive-Anne Thomas, Rova Ny Ando Fitiavana Tomefintsoa “Shanna” Rakotoarison, and Adaline Buerck for their important contributions towards project coordination and sample collection. The authors thank the members of the Ranontsika laboratory staff for their support and accommodation of team members visiting Toamasina from the University of South Florida (USF).

Conflicts of Interest

Three of the authors of this paper are affiliated with ONG Ranontsika, a Malagasy non-governmental organization that promotes access to high-quality drinking water through a social franchise business model. Ranontsika oversees a network of water production stations and water kiosks around Toamasina, at which locally sourced groundwater is treated and then sold at an affordable price. See also Section 4.3 of this paper.

References

  1. Oluwasanya, G.; Smith, J.; Carter, R. Self supply systems: Urban dug wells in Abeokuta, Nigeria. Water Sci. Tech. Water Supply 2011, 11, 172–178. [Google Scholar] [CrossRef]
  2. Foster, T.; Priadi, C.; Kotra, K.K.; Odagiri, M.; Rand, E.C.; Willetts, J. Self-supplied drinking water in low- and middle-income countries in the Asia-Pacific. npj Clean Water 2021, 4, 37. [Google Scholar] [CrossRef]
  3. Foster, S.; Hirata, R.; Eichholz, M.; Alam, M.-F. Urban self-supply from groundwater—An analysis of management aspects and policy needs. Water 2022, 14, 575. [Google Scholar] [CrossRef]
  4. Rosa, G.; Kelly, P.; Clasen, T. Consistency of use and effectiveness of household water treatment practices among urban and rural populations claiming to treat their drinking water at home: A case study in Zambia. Am. J. Trop. Med. Hyg. 2016, 94, 445–455. [Google Scholar] [CrossRef] [PubMed]
  5. Mintz, E.D.; Reiff, F.M.; Tauxe, R.V. Safe water treatment and storage in the home: A practical new strategy to prevent waterborne disease. JAMA 1995, 273, 948–953. [Google Scholar] [CrossRef] [PubMed]
  6. Oswald, W.E.; Lescano, A.G.; Bern, C.; Calderon, M.M.; Cabrera, L.; Gilman, R.H. Fecal contamination of drinking water within peri-urban households, Lima, Peru. Am. J. Trop. Med. Hyg. 2007, 77, 699–704. [Google Scholar] [CrossRef] [PubMed]
  7. WEDC (Water Engineering and Development Centre). An Engineer’s Guide to Domestic Water Containers; Loughborough University: Loughborough, UK, 2011. [Google Scholar]
  8. Mellor, J.E.; Smith, J.A.; Samie, A.; Dillingham, R.A. Coliform sources and mechanisms for regrowth in household drinking water in Limpopo, South Africa. J. Environ. Eng. (ASCE) 2013, 139, 1152–1161. [Google Scholar] [CrossRef]
  9. WHO (World Health Organization). Guidelines for Drinking-Water Quality, 2nd ed.; World Health Organization: Geneva, Switzerland, 1997. [Google Scholar]
  10. Clasen, T.F.; Bastable, A. Faecal contamination of drinking water during collection and household storage: The need to extend protection to the point of use. J. Water Health 2003, 1, 109–115. [Google Scholar] [CrossRef]
  11. Trevett, A.F.; Carter, R.; Tyrrel, S. Water quality deterioration: A study of household drinking water quality in rural Honduras. Int. J. Environ. Health Res. 2004, 14, 273–283. [Google Scholar] [CrossRef]
  12. Wright, J.; Gundry, S.; Conroy, R. Household drinking water in developing countries: A systematic review of microbiological contamination between source and point-of-use. Trop. Med. Int. Health 2004, 9, 106–117. [Google Scholar] [CrossRef]
  13. Trevett, A.F.; Carter, R.C. Targeting appropriate interventions to minimize deterioration of drinking-water quality in developing countries. J. Health Popul. Nutr. 2008, 26, 125–138. [Google Scholar]
  14. Levy, K.; Anderson, L.; Robb, K.A.; Cevallos, W.; Trueba, G.; Eisenberg, J.N.S. Household effectiveness vs. laboratory efficacy of point-of-use chlorination. Water Res. 2014, 54, 69–77. [Google Scholar] [CrossRef]
  15. Momba, M.N.B.; Kaleni, P. Regrowth and survival of indicator microorganisms on the surfaces of household containers used for the storage of drinking water in rural communities of South Africa. Water Res. 2002, 36, 3023–3028. [Google Scholar] [CrossRef]
  16. Murphy, J.L.; Ayers, T.L.; Knee, J.; Oremo, J.; Odhiambo, A.; Faith, S.H.; Nyagol, R.O.; Stauber, C.E.; Lantagne, D.S.; Quick, R.E. Evaluating four measures of water quality in clay pots and plastic safe storage containers in Kenya. Water Res. 2016, 104, 312–319. [Google Scholar] [CrossRef]
  17. Roberts, L.; Chartier, Y.; Chartier, O.; Malenga, G.; Toole, M.; Rodka, H. Keeping clean water clean in a Malawi refugee camp: A randomized intervention trial. Bull. World Health Organ. 2001, 79, 280–287. [Google Scholar]
  18. Trevett, A.F.; Carter, R.C.; Tyrrel, S.F. The importance of domestic water quality management in the context of faecal-oral disease transmission. J. Water Health 2005, 3, 259–270. [Google Scholar] [CrossRef]
  19. Pickering, A.J.; Davis, J.; Walters, S.P.; Horak, H.M.; Keymer, D.P.; Mushi, D.; Strickfaden, R.; Chynoweth, J.S.; Liu, J.; Blum, A.; et al. Hands, water, and health: Fecal contamination in Tanzanian communities with improved, non- networked water supplies. Environ. Sci. Technol. 2010, 44, 3267–3272. [Google Scholar] [CrossRef]
  20. Jagals, P.; Jagals, C.; Bokako, T.C. The effect of container-biofilm on the microbiological quality of water used from plastic household containers. J. Water Health 2003, 1, 101–108. [Google Scholar] [CrossRef]
  21. Momba, M.N.B.; Notshe, T.L. The microbiological quality of groundwater-derived drinking water after long storage in household containers in a rural community of South Africa. Aqua 2003, 52, 67–77. [Google Scholar] [CrossRef]
  22. Bae, S.; Lyons, C.; Onstad, N. A culture-dependent and metagenomic approach of household drinking water from the source to point of use in a developing country. Water Res. X 2019, 2, 100026. [Google Scholar] [CrossRef]
  23. Jensen, P.K.; Ensink, J.H.J.; Jayasinghe, G.; van der Hoek, W.; Cairncross, S.; Dalsgaard, A. Domestic transmission routes of pathogens: The problem of in-house contamination of drinking water during storage in developing countries. Trop. Med. Int. Health 2002, 7, 604–609. [Google Scholar] [CrossRef]
  24. CDC (United States Centers for Disease Control and Prevention). Safe Water Systems for the Developing World: A Handbook for Implementing Household-Based Water Treatment and Safe Storage Projects; Department of Health & Human Services, Centers for Disease Control and Prevention: Atlanta, GA, USA, 2006.
  25. About Safe Water Storage. Available online: https://www.cdc.gov/global-water-sanitation-hygiene/about/about-safe-water-storage.html (accessed on 30 May 2024).
  26. Maraj, S.; Rodda, N.; Jackson, S.; Buckley, C.; Macleod, N. Microbial deterioration of stored water for users supplied by stand-pipes and ground-tanks in a peri-urban community. Water SA 2006, 32, 693–699. [Google Scholar] [CrossRef]
  27. Harris, A.R.; Davis, J.; Boehm, A.B. Mechanisms of post-supply contamination of drinking water in Bagamoyo, Tanzania. J. Water Health 2013, 11, 543–554. [Google Scholar] [CrossRef]
  28. Meierhofer, R.; Rubli, P.; Dreyer, K.; Ouma, H.; Wanyama, K.; Peter-Varbanets, M. Membrane filtration reduces recontamination risk in chlorinated household water containers. In Proceedings of the 40th WEDC International Conference, Loughborough, UK, 24–28 July 2017; p. 2595. Available online: https://wedc-knowledge.lboro.ac.uk/resources/conference/40/Meierhofer-2595.pdf (accessed on 5 April 2024).
  29. Budeli, P.; Moropeng, R.C.; Mpenyana-Monyatsi, L.; Momba, M.N.B. Inhibition of biofilm formation on the surface of water storage containers using biosand zeolite silver-impregnated clay granular and silver impregnated porous pot filtration systems. PLoS ONE 2018, 13, e0194715. [Google Scholar] [CrossRef]
  30. String, G.M.; Domini, M.; Badr, H.; Brodsky, H.; Kamal, Y.; Tatro, T.; Johnston, M.; Ogudipe, A.; Vu, T.N.; Wolfe, M.K.; et al. Efficacy of locally available cleaning methods and household chlorination at inhibiting biofilm development in jerricans used to store household drinking water. Environ. Sci. Water Res. Technol. 2021, 7, 367–383. [Google Scholar] [CrossRef]
  31. Burkowska-But, A.; Kalwasinska, A.; Swiontek-Brzezinska, M. Bacterial growth and biofilm formation in household-stored groundwater collected from public wells. J. Water Health 2015, 13, 353–361. [Google Scholar] [CrossRef]
  32. Meierhofer, R.; Wietlisbach, B.; Matiko, C. Influence of container cleanliness, container disinfection with chlorine, and container handling on recontamination of water collected from a water kiosk in a Kenyan slum. J. Water Health 2019, 17, 308–317. [Google Scholar] [CrossRef]
  33. Meierhofer, R.; Rubli, P.; Oremo, J.; Odhiambo, A. Does activated silver reduce recontamination risks in the reservoirs of ceramic water filters? Water 2019, 11, 1108. [Google Scholar] [CrossRef]
  34. String, G.; Domini, M.; Mirindi, P.; Brodsky, H.; Kamal, Y.; Tatro, T.; Johnston, M.; Badr, H.; Lantagne, D. Efficacy of locally available cleaning methods in removing biofilms from taps and surfaces of household water storage containers. npj Clean Water 2020, 3, 13. [Google Scholar] [CrossRef]
  35. Steele, A.; Clarke, B.; Watkins, O. Impact of jerry can disinfection in a camp environment—Experiences in an IDP camp in northern Uganda. J. Water Health 2008, 6, 559–564. [Google Scholar] [CrossRef]
  36. Gärtner, N.; Germann, L.; Wanyama, K.; Ouma, H.; Meierhofer, R. Keeping water from kiosks clean: Strategies for reducing recontamination during transport and storage in eastern Uganda. Water Res. X 2021, 10, 100079. [Google Scholar] [CrossRef]
  37. Poulin, C.; Trimmer, J.; Delaire, C.; Peletz, R. Pathogen Pathways Study for Children Under Two Years in the USAID Fiovana Intervention Areas of Southeastern Madagascar; The Aquaya Institute: Nairobi, Kenya, 2022. [Google Scholar]
  38. Allali, I.; Abotsi, R.E.; Tow, L.A.; Thabane, L.; Zar, H.J.; Mulder, N.M.; Nicol, M.P. Human microbiota research in Africa: A systematic review reveals gaps and priorities for future research. Microbiome 2021, 9, 241. [Google Scholar] [CrossRef]
  39. Muhammad, F. The 21st-century microbiology profession and professionals’ challenges in African countries. J. Microbiota 2024, e145808. [Google Scholar] [CrossRef]
  40. WHO (World Health Organization); UNICEF (United Nations Children’s Fund). Progress on Household Drinking Water, Sanitation and Hygiene 2000–2020: Five Years into the SDGs; World Health Organization: Geneva, Switzerland, 2021. [Google Scholar]
  41. USAID (United States Agency for International Development). Madagascar Water and Sanitation Profile. 2010. Available online: https://www.washplus.org/sites/default/files/madagascar2010.pdf (accessed on 8 April 2024).
  42. WHO (World Health Organization); UNICEF (United Nations Children’s Fund). Progress on Household Drinking Water, Sanitation and Hygiene 2000–2017; World Health Organization: Geneva, Switzerland, 2019. [Google Scholar]
  43. Diorano-WASH. Available online: https://www.comminit.com/global/content/diorano-wash (accessed on 3 March 2024).
  44. WSSCC (Water Supply and Sanitation Collaborative Council). Madagascar: WaSH Case Study Series; WSSCC: Geneva, Switzerland, 2008; Available online: https://www.ircwash.org/sites/default/files/WSSCC-2008-Madagascar.pdf (accessed on 8 April 2024).
  45. Judah, L. Assessment and Prevention of Bacterial Regrowth in Stored Household Water in Eastern Coastal Madagascar. Master’s Thesis, University of South Florida, Tampa, FL, USA, 2022. Available online: https://digitalcommons.usf.edu/etd/9786/ (accessed on 20 May 2024).
  46. The Public Health Laboratory Service Water Sub-Committee. The effect of sodium thiosulphate on the coliform and Bacterium coli counts of non-chlorinated water samples. J. Hyg. 1953, 51, 572–577. [Google Scholar]
  47. Murray, A.L.; Kumpel, E.; Peletz, R.; Khush, R.S.; Lantagne, D.S. The effect of sodium thiosulfate dechlorination on fecal indicator bacteria enumeration: Laboratory and field data. J. Water Health 2018, 16, 70–77. [Google Scholar] [CrossRef]
  48. Momba, M.; Edbon, J.; Kamika, I.; Verbyla, M. Using indicators to assess microbial treatment and disinfection efficacy. In Water and Sanitation for the 21st Century: Health and Microbiological Aspects of Excreta and Wastewater Management (Global Water Pathogen Project); Rose, J.B., Jiménez-Cisneros, B., Eds.; Part 2: Indicators and Microbial Source Tracking Markers; UNESCO: Paris, France; Michigan State University: East Lansing, MI, USA, 2019. [Google Scholar]
  49. Kohn, T.; Decrey, L.; Vinneras, B. Chemical disinfectants. In Water and Sanitation for the 21st Century: Health and Microbiological Aspects of Excreta and Wastewater Management (Global Water Pathogen Project); Rose, J.B., Jiménez-Cisneros, B., Eds.; Part 4: Management of Risk from Excreta and Wastewater—Section: Disinfection; UNESCO, Michigan State University:: East Lansing, MI, USA, 2019. [Google Scholar]
  50. Pruden, A.; Ashbolt, N.; Miller, J. Overview of issues for water bacterial pathogens. In Water and Sanitation for the 21st Century: Health and Microbiological Aspects of Excreta and Wastewater Management (Global Water Pathogen Project); Rose, J.B., Jiménez-Cisneros, B., Eds.; Part 3: Specific Excreted Pathogens: Environmental and Epidemiology Aspects—Section 2: Bacteria; UNESCO: Paris, France; Michigan State University: East Lansing, MI, USA, 2019. [Google Scholar]
  51. Standard Methods for the Examination of Water and Wastewater, 23rd ed.; Baird, R.B.; Eaton, A.D.; Rice, E.W. (Eds.) American Public Health Association: Washington, DC, USA; American Water Works Association: Denver, CO, USA; Water Environment Federation: Alexandria, VA, USA, 2017. [Google Scholar]
  52. MacWilliams, M.P. Indole Test Protocol; American Society for Microbiology: Washington, DC, USA, 2009; Available online: https://asm.org/getattachment/200d3f34-c75e-4072-a7e6-df912c792f62/indole-test-protocol-3202.pdf (accessed on 3 March 2023).
  53. Smith, A.C.; Hussey, M.A. Gram Stain Protocols; American Society for Microbiology: Washington, DC, USA, 2005; Available online: https://asm.org/getattachment/5c95a063-326b-4b2f-98ce-001de9a5ece3/gram-stain-protocol-2886.pdf (accessed on 3 March 2023).
  54. Mfuh, K.O.; Abanda, N.N.; Titanji, B.K. Strengthening diagnostic capacity in Africa as a key pillar of public health and pandemic preparedness. PLoS Glob. Public Health 2023, 3, e0001998. [Google Scholar] [CrossRef]
  55. Daniel, D.; Diener, A.; van de Vossenberg, J.; Bhatta, M.; Marks, S.J. Assessing drinking water quality at the point of collection and within household storage containers in the hilly rural areas of mid- and far-western Nepal. Int. J. Environ. Res. Public Health 2020, 17, 2172. [Google Scholar] [CrossRef]
  56. Dey, A.; Bokka, V.; Sen, S. Dependence of bacterial growth rate on dynamic temperature changes. IET Syst. Biol. 2020, 14, 68–74. [Google Scholar] [CrossRef]
  57. Vital, M.; Stucki, D.; Egli, T.; Hammes, F. Evaluating the growth potential of pathogenic bacteria in water. Appl. Environ. Microbiol. 2010, 76, 6477–6484. [Google Scholar] [CrossRef]
  58. MacCarthy, M.F.; Annis, J.; Mihelcic, J.R. Unsubsidised self-supply in eastern Madagascar. Water Altern. 2013, 6, 424–438. [Google Scholar]
  59. Agensi, A.; Tibyangye, J.; Tamale, A.; Agwu, E.; Amongi, C. Contamination potentials of household water handling and storage practices in Kirundo Subcounty, Kisoro District, Uganda. J. Environ. Public Health 2019, 7932193. [Google Scholar] [CrossRef] [PubMed]
  60. PROJECT Sur’Eau (PSE), Final Report (September 15, 2000 through December 14, 2002); PSI Madagascar: Antananarivo, Madagascar, 2003. Available online: https://pdf.usaid.gov/pdf_docs/Pdaby045.pdf (accessed on 11 April 2024).
  61. Ram, P.K.; Kelsey, E.; Rasoatiana; Miarintsoa, R.R.; Rakotomalala, O.; Dunston, C.; Quick, R.E. Bringing safe water to remote populations: An evaluation of a portable point-of-use intervention in rural Madagascar. Am. J. Public Health 2007, 97, 398–400. [Google Scholar] [CrossRef] [PubMed]
  62. Praz, V.; Morton, A.; Matondo, I. End-of-Project Evaluation of the PSI Social Marketing Project in Madagascar; United States Agency for International Development and International Business & Technical Consultants, Inc.: Washington, DC, USA, 2013. [Google Scholar]
  63. Potgieter, N.; Becker, P.J.; Ehlers, M.M. Evaluation of the CDC safe water-storage intervention to improve the microbiological quality of point-of-use drinking water in rural communities in South Africa. Water SA 2009, 35, 505–516. [Google Scholar] [CrossRef]
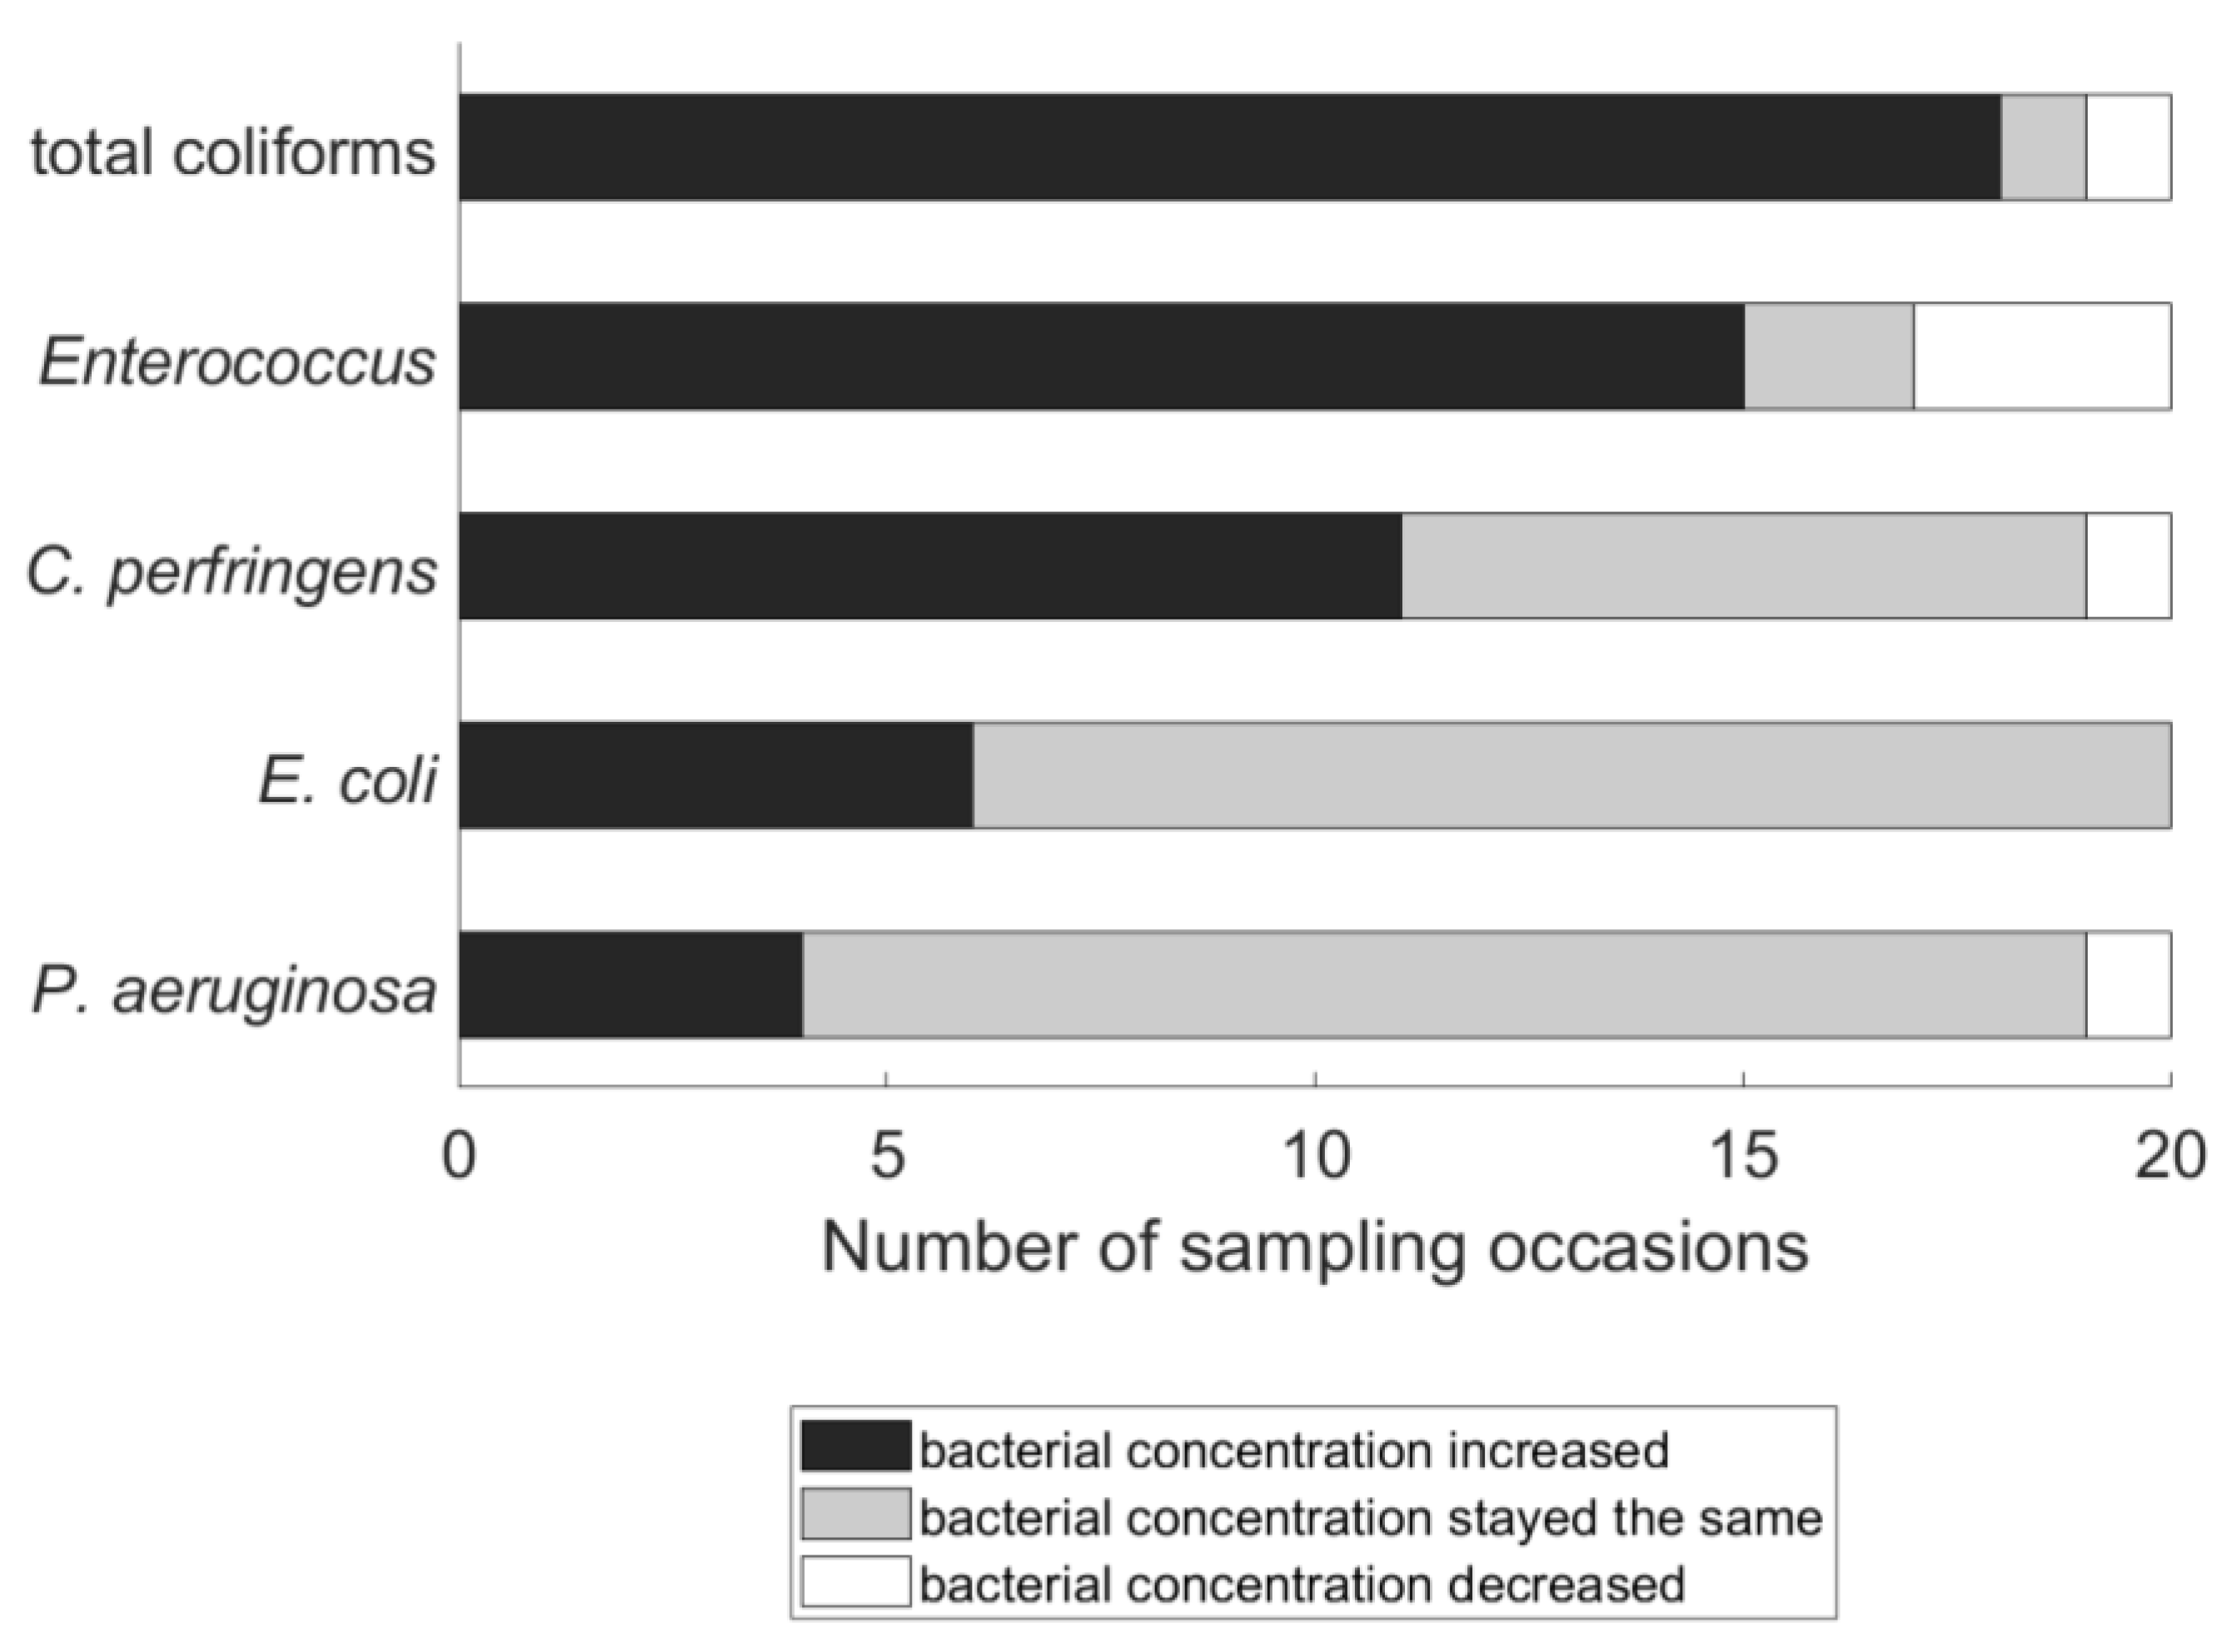
Figure 1. Frequency at which measured bacterial concentration increased, decreased, or stayed the same between water source and household storage. A total of 10 households and their corresponding water sources were each sampled twice, for a total of 20 pairs of concentrations (i.e., 20 overall sampling occasions). For each of the 20 sample pairs, bacterial concentration was considered to increase if the measured level of the indicator was higher in the household water than in the source water by at least 1 CFU/(100 mL) and was considered to decrease if the measured level of the indicator was lower in the household water than in the source water by at least 1 CFU/(100 mL).
Water 16 01592 g001
Figure 2. Measured distributions of bacterial concentrations for Enterococcus (left panel) and total coliforms (right panel) in source water and in stored household water (n = 20 measurements for each). For each distribution, the central mark is the median measured concentration, and the edges of the box are the 25th and 75th percentiles. Whiskers extend to the furthest measured concentration that lies within 1.5 times the interquartile range from the edge of the box. Note that the concentration scales of the two panels differ by a factor of 10.
Water 16 01592 g002
Figure 3. Frequency of bacterial regrowth/recontamination as a function of the source of the water (paompy tany or JIRAMA tap).
Water 16 01592 g003
Figure 4. Frequency of bacterial recontamination as a function of the type of household storage container (open or closed).
Water 16 01592 g004
Figure 5. Measured distributions of concentrations of total coliforms in source water and in household storage containers; (A) distributions for the three households that used JIRAMA source water and stored the water in a closed storage vessel (n = 6); (B) distributions for the other seven households (n = 14). For each distribution, the central mark is the median measured concentration, and the edges of the box are the 25th and 75th percentiles. Whiskers extend to the furthest measured concentration that lies within 1.5 times the interquartile range from the edge of the box. Note that the concentration scales of the two panels differ by a factor of 10. Also, note that the right-hand panel of Figure 2, which shows the distributions of concentrations of total coliforms for all 10 households (n = 20), is an amalgamation of the two panels of Figure 5.
Water 16 01592 g005
Figure 6. Efficacy of cleaning methods for removing biofilms from internal walls of jerrycans. Removal efficiency is calculated as the percent reduction in the measured bacterial concentration from before cleaning to after cleaning. The heights of bars represent arithmetic averages (n = 3 jerrycans tested for each cleaning method) and error bars represent ±1 standard deviation. A negative value of removal efficiency indicates that the measured bacterial concentration increased (rather than decreased) after the cleaning.
Water 16 01592 g006
Table 1. Average (mean) increase in bacterial concentrations in households using open and closed storage vessels. An asterisk indicates that the difference between open and closed vessels was found to be statistically significant with 95% confidence (Mann–Whitney U test).
Average Increase in Bacterial Concentration in Households Using Open Storage Vessels
(n = 10)
Average Increase in Bacterial Concentration in Households Using Closed Storage Vessels
(n = 10)
Total coliforms7500 CFU/(100 mL)16,000 CFU/(100 mL)
Enterococcus280 CFU/(100 mL)2300 CFU/(100 mL)
C. perfringens2 CFU/(100 mL)2 CFU/(100 mL)
E. coli * 270 CFU/(100 mL)0 CFU/(100 mL)
P. aeruginosa *2 CFU/(100 mL)–1 CFU/(100 mL)
Table 2. Presence of fecal indicator bacteria in biofilms on the interior surfaces of jerrycans collected from four households.
Fecal IndicatorNumber of Jerrycans with Fecal Indicator Present on Internal Jerrycan Walls
(Out of 4 Jerrycans Tested)
Total coliforms4
Enterococcus4
C. perfringens3
E. coli1
P. aeruginosa0
Disclaimer/Publisher’s Note: The statements, opinions and data contained in all publications are solely those of the individual author(s) and contributor(s) and not of MDPI and/or the editor(s). MDPI and/or the editor(s) disclaim responsibility for any injury to people or property resulting from any ideas, methods, instructions or products referred to in the content.