Abstract
The rural population in the Dry Zone of Sri Lanka is largely affected by Chronic Kidney Disease of Unknown etiology (CKDu). According to the multidisciplinary research carried out so far, quality of groundwater is considered one of the possible causative factors for CKDu. Therefore, assessment of the quality of groundwater being used for drinking and its evolution mechanism is the key to identifying the linkage between CKDu and drinking water. This study aimed to perform a detailed investigation on groundwater sources using isotopic, chemical, and hydrogeological methods in the CKDu-endemic (site A) and the control area (sedimentary formation—site B) in the Malwathu Oya basin and the control areas in the Malala Oya basin (site C) selected for a systematic comparison. Our investigation shows that elevated levels of TDS, magnesium, and fluoride in the shallow groundwater affected by climatic, geochemical, and hydrogeological processes may contribute to the CKDu in the Dry Zone of Sri Lanka. All the groundwater samples analysed have exceeded the hardness threshold. Prominent Mg hardness proportion together with excess F− in the CKDu endemic area may produce nephrotoxic MgF2 complexes that may trigger renal damage. In contrast, NaF complexes in the CKDu control area leads to reduction of F− toxicity in the human body. Elevated F− and Mg2+ are found in site A, low F− and high Mg2+ in site B, and either combinations of low F− and low Mg2+, high F− and low Mg2+, or low F− with high Mg2+ in site C. TDS, hardness, Mg2+, Na+, and F− are formed with different mechanisms in the three selected areas. The primary process that regulates the evolution of groundwater types and contents in sites A and C is the weathering of silicates. Similarly, in site A, carbonate dissolution and reverse ion exchange are quite strong. Cation exchange and evaporite dissolution are more pronounced in site C. Shallow groundwaters are evapo-concentrated, hence their quality deteriorates more significantly than the deep groundwater in the CKDu endemic area. Dilution decreases the ion content in site A while evaporite dissolution increases it in site C after the rainy season. Evaporation and seawater mixing affect the quality of groundwater in site B. It is also found that a statistically significant difference exists in the F−/Na+, F−/Mg2+, and F−/Ca2+ between the endemic and control areas. Intensive rock weathering combined with desorption has added excess F− to the groundwater in site A, while cation exchange and fluorite dissolution are contributing factors in site C.
1. Introduction
Chronic Kidney Disease (CKD) is a serious, non-communicable health problem predominantly affecting tropical countries [1,2] with a global prevalence rate of 8 to 16% [3,4]. Because the cause of this disease diverges from the commonly known risk factors of CKD, it is referred to as Chronic Kidney Disease of unknown etiology or “CKDu” [5,6].
CKDu is an unusual form of renal disease reported only in tropical countries such as India, Central America, Nicaragua, El Salvador, Costa Rica, Mexico, Egypt, and Sri Lanka [7,8,9]. Low- to middle-income countries have seen an alarming rise over the past 20 years. Prevalence of CKDu has now overtaken that in many high-income countries [10]. There have been several global epidemics of unexplained kidney disease, including the Uddanam Endemic Nephropathy in Andhra Pradesh of India. CKDu in Sri Lanka shows similarities with these outbreaks, such as the disease being progressive and asymptomatic until end stage, presenting with a male predominance, and with clustered distribution among rural middle-aged communities [6,8,11].
CKDu in Sri Lanka was first reported in the mid-1990s; high prevalence was observed in the dry zone of Sri Lanka, particularly in the North Central Province (NCP) and North Western Province (NWP). Currently it is spreading over other dry zone areas and some of the intermediate zone areas of Central, Eastern, and Southern Provinces [4,5,7,8,12] (Figure 1). More than 400,000 people are affected by this disease, with the recent prevalence rate reaching 15–23% [13,14], with around 22,000 deaths over the past 20 years [8].


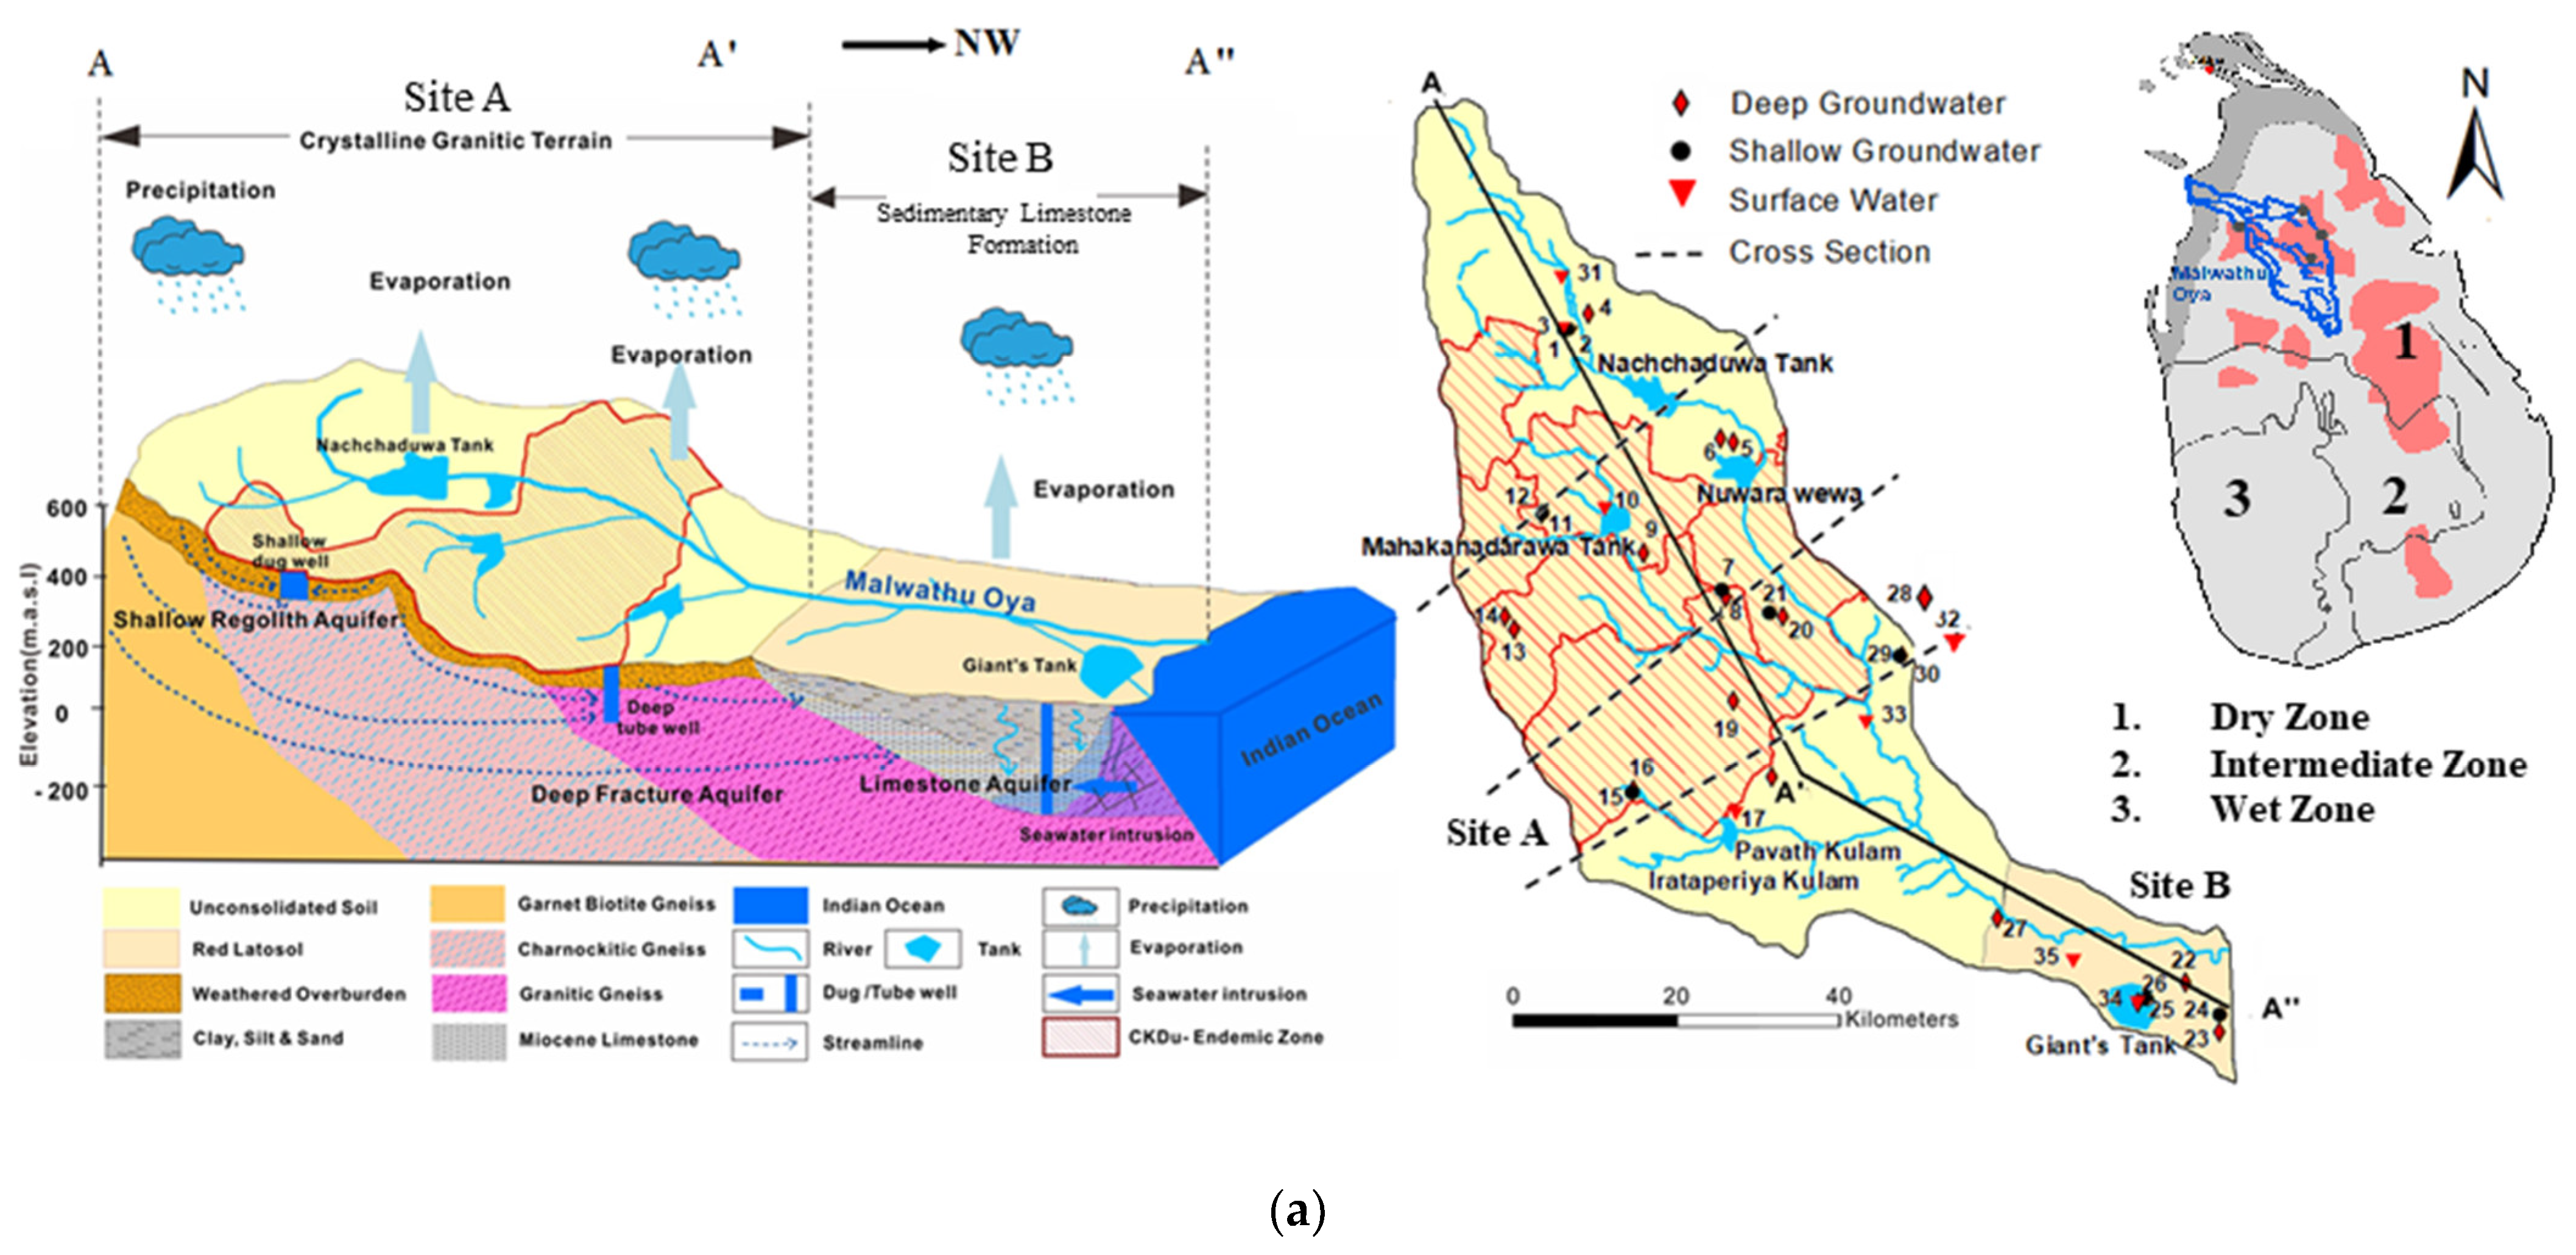
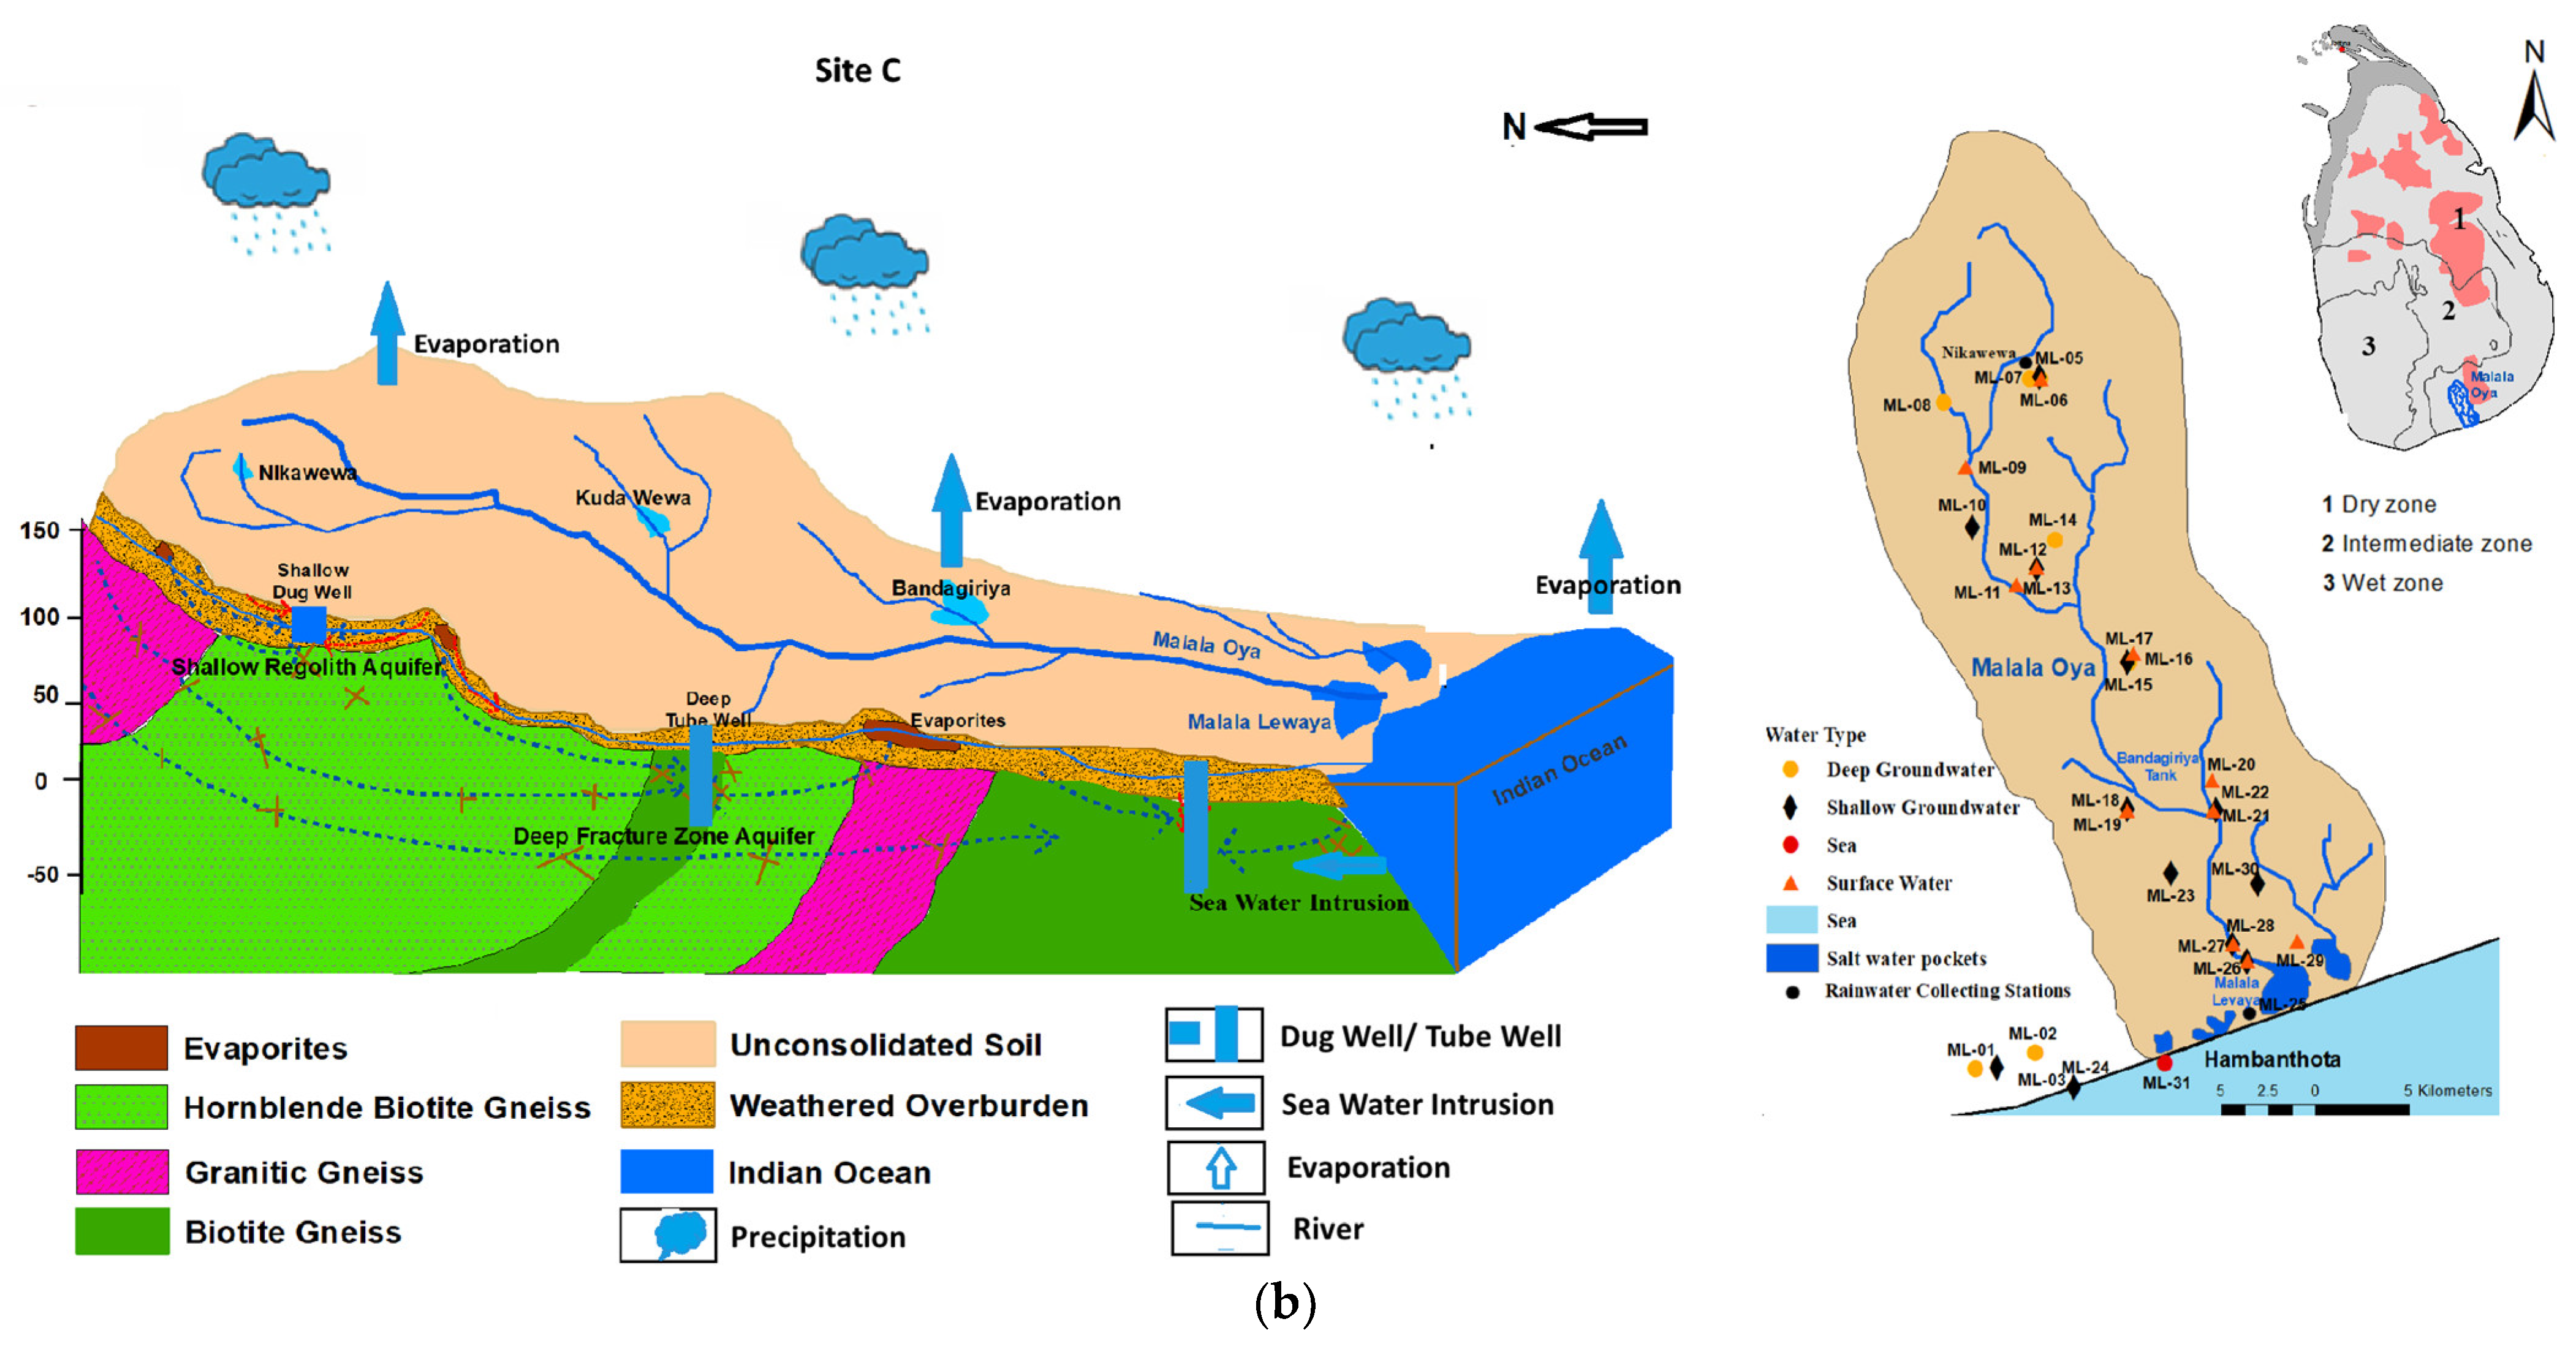
Figure 1.
(a): A schematic hydrogeological cross section and spatial distribution of sampling locations in the Malwathu Oya basin (site A and site B); (b): A schematic hydrogeological cross section and spatial distribution of sampling locations in the Malala Oya basin (site C).
Over past few decades, multidisciplinary research studies were carried out focusing on environmental [3,15], genetic [16], occupational, and socio-economic [2,3,17] disciplines to discover the possible risk factors for CKDu. Unfortunately, none of the risk factors alone could logically explain the existence of the disease. Later, it was suggested that the cause may be multifactorial in origin [6,18], with this cause needing to be established by unveiling the main possible component of the risk factors.
Since CKDu is linked with tubulointerstitial damage and that the disease prevalent pattern coexists with the areas where groundwater is the main drinking water source, it is generally suspected that groundwater is an important risk factor for CKDu [19,20].
The dry zone comprises all geographic hotspots of CKDu (Figure 1) and it suffers prolonged dry periods and limited rainfall [6]. Available water resources in these areas became stressed due to the increasing population and agricultural activities. Thus, to fulfil the population’s water requirements, exploitation of groundwater began in the 1980s [21]. Over the last four decades, more than 98% of the population in the CKDu endemic areas have adapted to the sole use of groundwater to fulfil their potable water requirement. The problem of CKDu began a few years after the adaptation to the groundwater [12,22]. Interestingly, very low (1.5%) or zero prevalence of CKDu was reported in the people who consumed water from natural springs, rainwater, surface water, and treated water within the endemic area, Refs. [4,14,23] sedimentary limestone formations, and the wet zone of Sri Lanka [7,12,24]. All this evidence implied the close association of CKDu with the consumption of untreated groundwater [6]. Therefore, groundwater quality-based risk factors are important to hypothesize.
This paper aims to differentiate the water quality parameters, which are present in excessive amounts in the CKDu endemic and control areas, to identify their evolution mechanism and the coupled effects that trigger nephrotoxicity tin the kidneys of the people in the CKDu endemic area.
2. Climatological, Geological, and Hydrological Settings of Sri Lanka
Climatically, Sri Lanka is a sub-tropical humid island with three well-distinguished climatic zones, namely, Wet Zone, Dry Zone, and Intermediate Zone (Figure 1). The Wet Zone receives annual rainfall from 2280 to 5100 mm while Intermediate Zone receives an annual average of 1700 mm. The Dry Zone occupies the Northern, Eastern, and South Eastern parts of the Island and receives an annual average of 1000 mm rainfall, arriving with Northeast monsoon and convectional rains in the second inter-monsoon [25,26]. The lowest precipitation, around 900 mm per annum, is recorded on Mannar Island [27].
Geologically, 90% of Sri Lanka is made up of highly crystalline amphibolite to granulite grade metamorphic rocks from the Precambrian age. The rest of the Island, mainly the North-Western coastal zone, is covered by sedimentary sequences that belong to the Jurassic, Miocene, and Holocene periods (Figure 1). The crystalline crust is further sub-divided into three major lithological units based on geochronology, petrology, and geochemistry, named Highland Complex (HC), the Vijayan Complex (VC), and the Wanni Complex (WC) [28].
Surface water resources in Sri Lanka are highly influenced by topographical characteristics and regional climatic patterns. In the 103 river basins of the country, more than 30,000 freshwater reservoirs have been built to regulate seasonal runoff [29].
Annual run-off generation is estimated to be about five million ha m with a runoff ratio of 0.4; it is estimated that 65% of the runoff escapes into the sea as stream runoff. Groundwater replenishment and evapotranspiration from the runoff are estimated to be 20% and 40%, respectively [30].
There are six types of groundwater aquifers in the country and their position and distribution depend on the geomorphology and geology. Shallow groundwater is buried at a depth of around 10 m and is mainly stored in the weathered overburden. These waters are collected from shallow-dug wells. The depth of the shallow dug well in Sri Lanka generally varies from 3 to 10 m and water level fluctuation is around 1 to 4 m during the wet and dry season. In Sri Lanka, groundwater is generally termed deep groundwater when groundwater occurs in the deep consolidated sedimentary formation or crystalline bedrocks. These are largely unconfined fractured aquifers and the water is extracted through the constructed tube wells with hand pumps [31,32,33]. Deep confined aquifers in the North-Western sedimentary formations, which extend from Puttalam to the Jaffna Peninsula, are the largest but least utilized aquifers in the country, though they have proven potential [33]. Average annual evaporation exceeds the average annual rainfall, resulting in a soil moisture deficit during the dry period in this coastal zone [21]. Seven highly fractured, highly faulted, and separated groundwater basins occur, and of these seven, four are considered semi-confined [31,33].
The unweathered crystalline formation is relatively non-porous and impervious, and deep groundwater circulation is mainly along the joints, fissures, and the planes of foliation. There are separate pockets of groundwater with different water heads. Some productive wells occur in deep fracture zone aquifers in the rocks, which are connected to regional lineaments with heavy fracturing and jointing at depths beyond 30 m and up to 100 m. However, groundwater potential is limited in hard rock aquifers due to the low storage capacity and low transmissivity [33,34]. The present study is focused on those aquifers that are used to provide drinking water to the local residents.
3. Materials and Methods
3.1. Study Area
Two main drainage basins, Malwathu Oya (Aruvi Aru) (Figure 1a) and Malala Oya Basins (Figure 1b), in Sri Lanka were selected for the present study.
Malwathu Oya basin comprises two different geological formations. The upper part of the basin is covered with metamorphic crystalline terrain while the lower part of the basin is covered with sedimentary limestone formation.
The middle part of the Malwathu Oya basin is comprised of high CKDu prevalence hot spots, namely Meawachchiya, Kebithigollewa, Vauniyawa, Horowpathana, and Tanthirimale [14,35]. The prevalence of CKDu in the Malwathu Oya area is reported as 12.9%. Of these, 90% of the patients are farmers. The majority of people living in these areas consume water from shallow wells (92%) [14].
The incidence of CKDu has not been reported in the uppermost part of the Malwathu Oya basin because people in this area do not use the groundwater sources, having depended solely on the pipe-born surface water for more than twenty years [32,36]. According to the available literature, there was no prevalence of CKDu reported in the sedimentary limestone formation.
The crystalline terrain of the Malwathu Oya basin area is considered a CKDu endemic area (site A) and the sedimentary formation is considered as control area (site B). The Malala Oya basin area is also considered as a control area (site C). The purpose of selecting these three particular areas is that the magnitude of the prevalence of CKDu shows a distinct difference and the areas possessing some different geological, hydrological, and climatological conditions. Thus, the two basins provide a platform to compare and contrast these conditions and the prevalence and non-prevalence of CKDu, giving due consideration to the quality of potable water in the two basins.
Malwathu Oya is the second largest river in Sri Lanka, with a total length of 164 km and a watershed area of 3246 km2. It starts from the North Central Province and merges into the sea at Mannar Bay on the Northwest coast. Geologically, the upper part of the basin is covered with granitic gneiss, charnockitic gneiss, and garnet biotite gneiss [28]. The soil thickness is 5–12 m, which is mainly the red-brown soil covered on the weathering crust of the rock. In addition, Miocene limestone, alluvial/lagoon sediment clay, silt, beach sand, and dunes are distributed in the sedimentary formation of the lower basin, and saline-alkaline soil is distributed along the lower bank of the Malwathu Oya watershed. The aquifer system in the hard rock area comprises shallow regolith aquifers underlain by deep fracture zone aquifers, while sedimentary formation occurs with the confined and semi-confined deep aquifers [33]. The upper catchment area and the lower catchment area receive an average annual rainfall of 1750 mm and 900 mm, respectively [27]. Rainfall is restricted to a few months of the year and a mostly dry and humid climate prevails [37]. The average temperature of the basin area ranges from 30 to 33 °C.
Malala Oya river basin (site C) flows through the Southern Dry Zone and the basin extends up to 405 km2. The entire river flows in a high-grade metamorphic basement complex that mainly comprises granitic gneisses, biotite-hornblende gneisses, and scattered bands of charnockitic gneisses [28]. This area is characterized by a nine-month-long dry period, followed by heavy precipitation (November to February); annual groundwater recharge is estimated as 41 MCM from the total precipitation [38]. Low precipitation and higher evaporation have resulted a limited surface water availability and this has led to the utilization of a significant amount of groundwater as the main source particularly for the industrialized zone in the area.
However, the annual extraction of groundwater from this basin is 0.13 MCM, which is 3.42% of the total demand [39].
The principal groundwater reservoir is the weathered overburden (regolith) within which all domestic water supply wells have been constructed. Due to the variable thickness of the regolith and undulating terrain conditions, groundwater does not occur as a continuous body but as several independent and semi-connected cells [28,33]. The depth to the groundwater table is highly variable spatially and fluctuates from a depth of a couple of meters in the rainy season to about more than 10 m below ground during droughts. A considerable number of wells even become dry. Shallow groundwater recharge takes place mainly from infiltration of rainwater within the basin. A considerable number of water supply tube wells, often fitted with hand pumps, are also present in both basins. These tube wells are about 40 m deep and often tap water from tectonically developed fracture/fault zones. Groundwater in these fracture zones has a hydraulic connection with the water in the regolith at a distance or right at the well location.
On the contrary, there are thousands of small surface water reservoirs, used to irrigate rice fields, situated in the Malwathu Oya basin. These widespread small surface water bodies provide surface water to rice fields and make a good contribution to the groundwater recharge in the basin. These conditions do not prevail in the Malala Oya basin, where less than 20 such small reservoirs are present.
This situation can lead to two significant differences in the groundwater surface water interactions and mobilization of ionic species in groundwater. In addition, evaporation and concentration of salts in water in small tanks during prolonged droughts can infiltrate and enrich groundwater locally, leading to complex and heterogeneous hydrochemical environments.
In addition, the compositional differences in the rocks and soils of the two basins can lead to distinct differences in rock and soil-water interactions and the resulting chemical quality of the groundwater.
3.2. Sample Collection and Analysis
A total of twenty-eight (28) water samples, including six surface water (SW), seven shallow groundwater (SGW: well depth < 10 m), and thirteen deep groundwater (DGW: well depth 10–200 m), from site A, seven (7) water samples, including two SW, two SGW and three DGW, from site B, and thirty water samples, including eleven SW, twelve SGW, and seven DGW, from site C were collected to represent samples in CKDu endemic and control areas, respectively (Figure 1a,b). Two sessions of sampling were completed in each basin, representing the dry and wet seasons.
Field data, including coordinates, altitude, sample type, well depth, well diameter, static water level, piezometric head, and geology, were recorded. pH, electrical conductivity (EC), salinity, total dissolved solids (TDS), dissolved oxygen (DO), and temperature (T) were measured onsite with the standard deviations of ±0.1, ±0.5%, ±1‰, ±0.5%, ±0.1 mg/L, and ±0.3 °C, respectively, using a calibrated HACH HQ 40d multi PHC 30101 instrument connected with CDC 40101 and LDO 101 probes. Nitrate nitrite (NO2−) and ammonium (NH4+) were measured on-site using the HACH HQ 40d multi-parameter instrument. Total alkalinity was measured using the potentiometric titration method using the APHA 2320B on-site [40].
All the water samples were collected into pre-cleaned, double-capped high-density polyethylene (HDPE) bottles. Unfiltered 30 mL and 1000 mL samples were collected for stable water isotope (δ18O, δ2H) analysis, tritium (3H) analysis, and DIC14-C analysis. Filtered, non-acidified 200 mL samples from each sample were collected for cation and anion analysis. Filtered and ultrapure HNO3 (1% v/v) was added to each 200 mL samples and were collected for trace element analysis. All water sample bottles were sealed with parafilm to prevent evaporation and leakage. During the sample collection, pumping was carried out for 10 min by deep tube wells while shallow dug well samples were obtained from 1 m below the standing water level using a horizontal depth water sampler.
EDTA titrimetric method: APHA 2340B was used to calculate total hardness [40]. The HCO3− concentration was calculated based on the equation of [HCO3−] = 1.22 × (Total Alkalinity/mg/L)] [32]. The anions (Cl−, F−, Br−, NO3−, and SO42−) were analyzed at the Beijing Research Institute of Uranium Geology (BRIUG) by the Ion Chromatograph (Dionex DX-500, Poway, CA, USA) with a detection limit of 0.05 mg/L. Major cations (Na+, K+, Ca2+, and Mg2+) were measured using Inductively Coupled Plasma Optical Emission Spectroscopy (ICP-OES) and trace elements were determined by Inductively Coupled Plasma Mass Spectrometer (ICP-MS NexION300D, PerkinElmer, Inc., Shelton, CT, USA) at the same laboratory with an analytical precision of 0.5%.
Stable Isotopes (δ18O and δ2H) of the water samples were analyzed using a liquid water isotope laser analyzer (Picarro L2130-i, Picarro, Inc., Santa Clara, CA, USA) in the BRIUG and (LGR DLT-100, Mountain View, CA, USA) in the Isotope Hydrology Section, Sri Lanka Atomic Energy Board (IHS-SLAEB). Water isotope results are reported in the delta notation (δ) versus Vienna Standard Mean Ocean Water-2 (VSMOW-2) standards and expressed in per-mill (‰) notation [41]. Samples were analyzed in duplicate and the precision of the measurement was within ±0.1‰ for δ2H and ±0.025‰ for δ18O in the Picarro L2130-i and ±0.2‰ for δ18O and ±1.0‰ for δ2H in the LGR DLT-100. The local meteoric water line and evaporation lines established for the North Central dry zone and Hambanthota of Sri Lanka [26,38] were used to interpret the isotope results of Malwathu Oya and Malala Oya basin areas.
The mixing proportion of surface water into the groundwater system of these two basins was calculated using the mass balance equation defined with non-reactive geochemical tracers of δ18OH2O and δ2HH2O [42].
where X = proportion of percolated surface water; δGW = isotope composition of the groundwater sample; δRW = average isotopic composition of rainwater in the recharge area; δsw = average isotopic composition of the surface water in the relevant basin. This equation was tested for δ18O and δ2H and yielded the same results within a range of ±5%.
X = (δGW − δRW)/(δSW − δRW) × 100
Water samples collected from the CKDu endemic area were electrolytically enriched and Tritium concentration was measured using Liquid Scintillation Analyzer (Packard; TRI-CARB 3170TR/SL, Shelton, CT, USA) at SLAEB. Its concentration is expressed as a Tritium Unit (TU) with a minimum detection limit of 0.3 TU. Radiocarbon dating of the seven selected deep groundwater samples was analyzed using Atomic Mass Spectrometer (AMS) at the Beta Analytic Testing Laboratory, Miami, FL, USA, relative to NIST SRM-4990C. Carbon isotopes (δ13C) of the same samples were measured using gas-bench IRMS relative to VPDB.
4. Results and Discussion
The water samples collected during this study include surface water (mainly from tanks and rivers), shallow groundwater, and deep groundwater. Surface water sources, both tanks and rivers, are reduced during the dry season and some stagnated water pockets can be seen along the river and even in the larger tanks. However, water levels reach or exceed full capacity during the wet season.
Shallow groundwater was collected from about 0.5 m below the water surface and deep groundwater was collected using a hand pump attach to the tube well after purging the well for 10 min.
4.1. Groundwater Chemistry
A summary of the hydrogeochemical data of CKDu endemic and control areas are shown in Table 1.

Table 1.
Summary of the hydro geochemical data of water samples in the Malwathu and Malala Oya basins.
The pH of the water in both shallow and deep groundwaters in sites A, B, and C during the wet and dry seasons are within the WHO and SLS maximum permissible limits of 6.5 to 8.5. A slightly alkaline condition is prominent in the groundwater in the surface waters of the CKDu endemic area.
The TDS in groundwater is a direct indicator used to identify the rock-water interaction, mineral dissolution, and evaporation effect in the groundwater system [32]. The average TDS content of all groundwater during both seasons exceeded the SLS desirable level of 500 mg/L. The surface water having very low levels of TDS suggests that these waters may regularly mix with surface runoff or infiltrated rainwater [19]. Shallow groundwater has comparatively higher TDS than deep groundwater and the sedimentary rock area (site B) than the metamorphic rock area (site A and C). According to the TDS classification, groundwater in sites A and C are of poor quality (900 to 1200 mg/L), and site B has unfavourable conditions [43]. Shallow groundwater with a high content of TDS may be due to the high rate of evaporation and/or mineral dissolution from the unsaturated zone. However, shallow- and deep-water wells close to the coastal area with high TDS (>1000 mg/L) may be due to the mixing of a small amount of saline water, sea spray, or dissolution of buried alluvial material in this area.
The hardness of water is mainly caused by the presence of alkaline earth elements calcium (Ca) and magnesium (Mg) together with carbonate, bicarbonate, sulphate, and chloride anions [44] and it is one of the most important factors suggested for the etiology of CKDu. The total hardness of groundwater collected in both seasons in the CKDu endemic area is higher than in the control area. In addition, total hardness in the dry season is comparatively higher than in the wet season. Based on the WHO guidelines, water can be classified into four categories according to its hardness level as follows: soft water at CaCO3 hardness <60 mg/L, moderately hard water at 60–120 mg/L, hard water at 120–180 mg/L, and very hard water at >180 mg/L. Almost all the collected water from the dry season exceeded the WHO desirable level of 300 mg/L. However, the hardness of all surface and groundwater samples is below the value of 300 mg/L in the wet season, with only a few exceptions. Shallow groundwater is always subjected to a higher rate of evaporation and intensified rock weathering under the tropical climatic conditions, resulting in excess amounts of Ca2+ and Mg2+ entering into the groundwater system, which, in turn, leads the higher total hardness in the CKDu endemic area. Deep groundwater with more or less similar hardness and TDS values in both seasons indicate that these waters are not affected by immediate recharge, and that it is controlled only by the dissolution of the aquifer matrix.
Among the studied geochemical parameters, fluoride is one of the major geogenic constituents in drinking water and excessive intake can cause serious health issues [45]. Nearly 60% of absorbed total fluoride per day is filtered and excreted via urine, hence kidneys are one of the target organs for fluoride accumulation. Long-term fluoride exposure can enhance renal damage and it has been suggested as a possible causative factor for the etiology of CKDu [19]. Rocks are the main source of groundwater fluoride, with fluoride being leached from common rock-forming minerals such as apatite, mica, sphene, fluorite, hornblende, amphibole, and pyroxene with high F− content [24,46]. F− concentration of deep groundwater taken in both CKDu endemic and control areas are from underlying metamorphic rocks such as biotite gneiss, granites, and charnockitic gneiss. However, carbonate rocks produce less fluoride and its concentration is quite low in the sedimentary formation (<0.5 mg/L).
Results from the present study show that fluoride content of the shallow and deep groundwater in site A varied from 0.3 to 1.6 mg/L and 0.4 to 1.3 mg/L in the dry season and 0.3 to 2.2 mg/L and 0.2 to 2.7 mg/L in the wet season, respectively. The fluoride content of the shallow and deep groundwater of site C varied from <0.2 to 2.1 mg/L and <0.2 to 5.9 mg/L in the dry season and 0.2 to 5.8 mg/L and 1.5 to 7.8 mg/L in the wet season, respectively. Almost all the water samples collected from site B had an F− concentration <0.5 mg/L in both seasons. More than 80% of the samples collected during both seasons of the site A were close or exceeded the maximum permissible limit (>1.5 mg/L) established by the WHO. Interestingly, 20% and more than 75% of the water samples collected in the site C exceeded that limit during the dry and wet seasons, respectively.
The results imply that the CKDu endemic area, with higher groundwater fluoride than the control area and the wet season, shows elevated levels in the wet season. This difference in the F− concentration of groundwater may be due to the presence of various mineral components in the aquifer rocks and their F− dissolution capability. In addition to that, long residence time leaves deep groundwater more time to interact with F−-bearing minerals and leads to the accumulation of dissolved F−.
Furthermore, evaporation under dry climatic conditions causes the enrichment of groundwater F− [19,24,47]. Usually, the components in shallow groundwater are likely to be diluted due to mixing with infiltrated rainwater in the wet season while becoming concentrated due to the high evaporation in the dry season. However, F− content in deep groundwater in site A and both shallow and deep groundwater in site C showed an opposite phenomenon. This implies that the high fluoride concentration in the wet season may not controlled by the individual factor. According to Saxena and Su [48,49], chemical properties of groundwater, such as weakly alkaline pH (7.2 to 8.2), moderate TDS, and dominant ions of HCO3− and Na+, are the favourable conditions for the enhancement of groundwater F−. This may suggest that the geochemical cycling of F− in groundwater could be highly influenced by the combined effect of the underground geology, hydrodynamic, and geochemical nature of the aquifer system. The fluoride geochemistry and its fate in groundwater in the CKDu endemic and control area are further discussed in Section 4.5.
Many previous studies identified that the presence of calcium (Ca2+), magnesium (Mg2+), and sodium (Na+) in drinking water is an important parameter, and the dominance of these ions in the water control the onset of CKDu [19,37,50]. However, the Mg2+ concentration of both the shallow and deep groundwater in sites A and B and deep groundwater in site C exceeded the Maximum Allowable Limit (MAL) of Mg2+ (30 mg/L). None of the water samples collected during the dry season exceeded the limit of Ca2+, while two samples from site A and one sample from site C collected after the wet season exceeded the MAL of Ca2+ (100 mg/L).
Na+ concentration in the groundwater collected from the CKDu control areas (both sites B and C) exceeded the MAL of Na+ (200 mg/L) in both seasons. The ratio between Ca2+ and Mg2+ can be applied to identify their source, and the Na+/Ca2+ ratio can be used to compare their activities [37,45,51]. The calculated Na/Ca ratio of groundwater collected in the dry season varied from 0.5 to 3.1 in the CKDu endemic area and 0.4 to 44.1 in the control area. However, the same ratio in the wet season varied from 0.4 to 5.9 in the CKDu endemic area to 0.5 to 59.2 in the control area.
Nitrate is one of the major constituents in freshwater and its concentration is mostly controlled by anthropogenic factors rather than natural factors [52]. Almost all the water samples collected from site A during both seasons had lower nitrate levels compared to the drinking water quality standards (50 mg/L) given by the WHO. NO3− concentration of surface and groundwater ranged from 0.1 to 3.6 mg/L and 0.1 to 27.6 mg/L in the dry season and 0.1 to 0.6 mg/L and 0.2 to 8.5 mg/L in the wet season, respectively. Undetectable amounts of NO3− were present in the all-water types of site B. However, three surface water samples collected from site C in both seasons with unacceptable levels of nitrate (up to 120 mg/L) are likely due to intense agricultural activities.
Potential nephrotoxic effects of environmental exposure to heavy metals and metalloids, mainly As, Cd, Pb, and Cr, have been identified as a causative factor for CKDu [7,15,53]. These metals in groundwater may be derived from rock weathering or by the use of agrochemicals [27,53]. Measured heavy metal concentration, except for As, of the water from all three area were well below the MALs. However, the average Arsenic (As) concentration of surface water and shallow and deep groundwater in site C exceeded the standard limits of 10 µg/L and were reported to be 42.7 mg/L, 28.7 mg/L, and 17.1 mg/L, respectively. This high As content may be derived from the heavily used chemical fertilizers in that area.
All measured surface water parameters in the three study sites are well below their MALs.
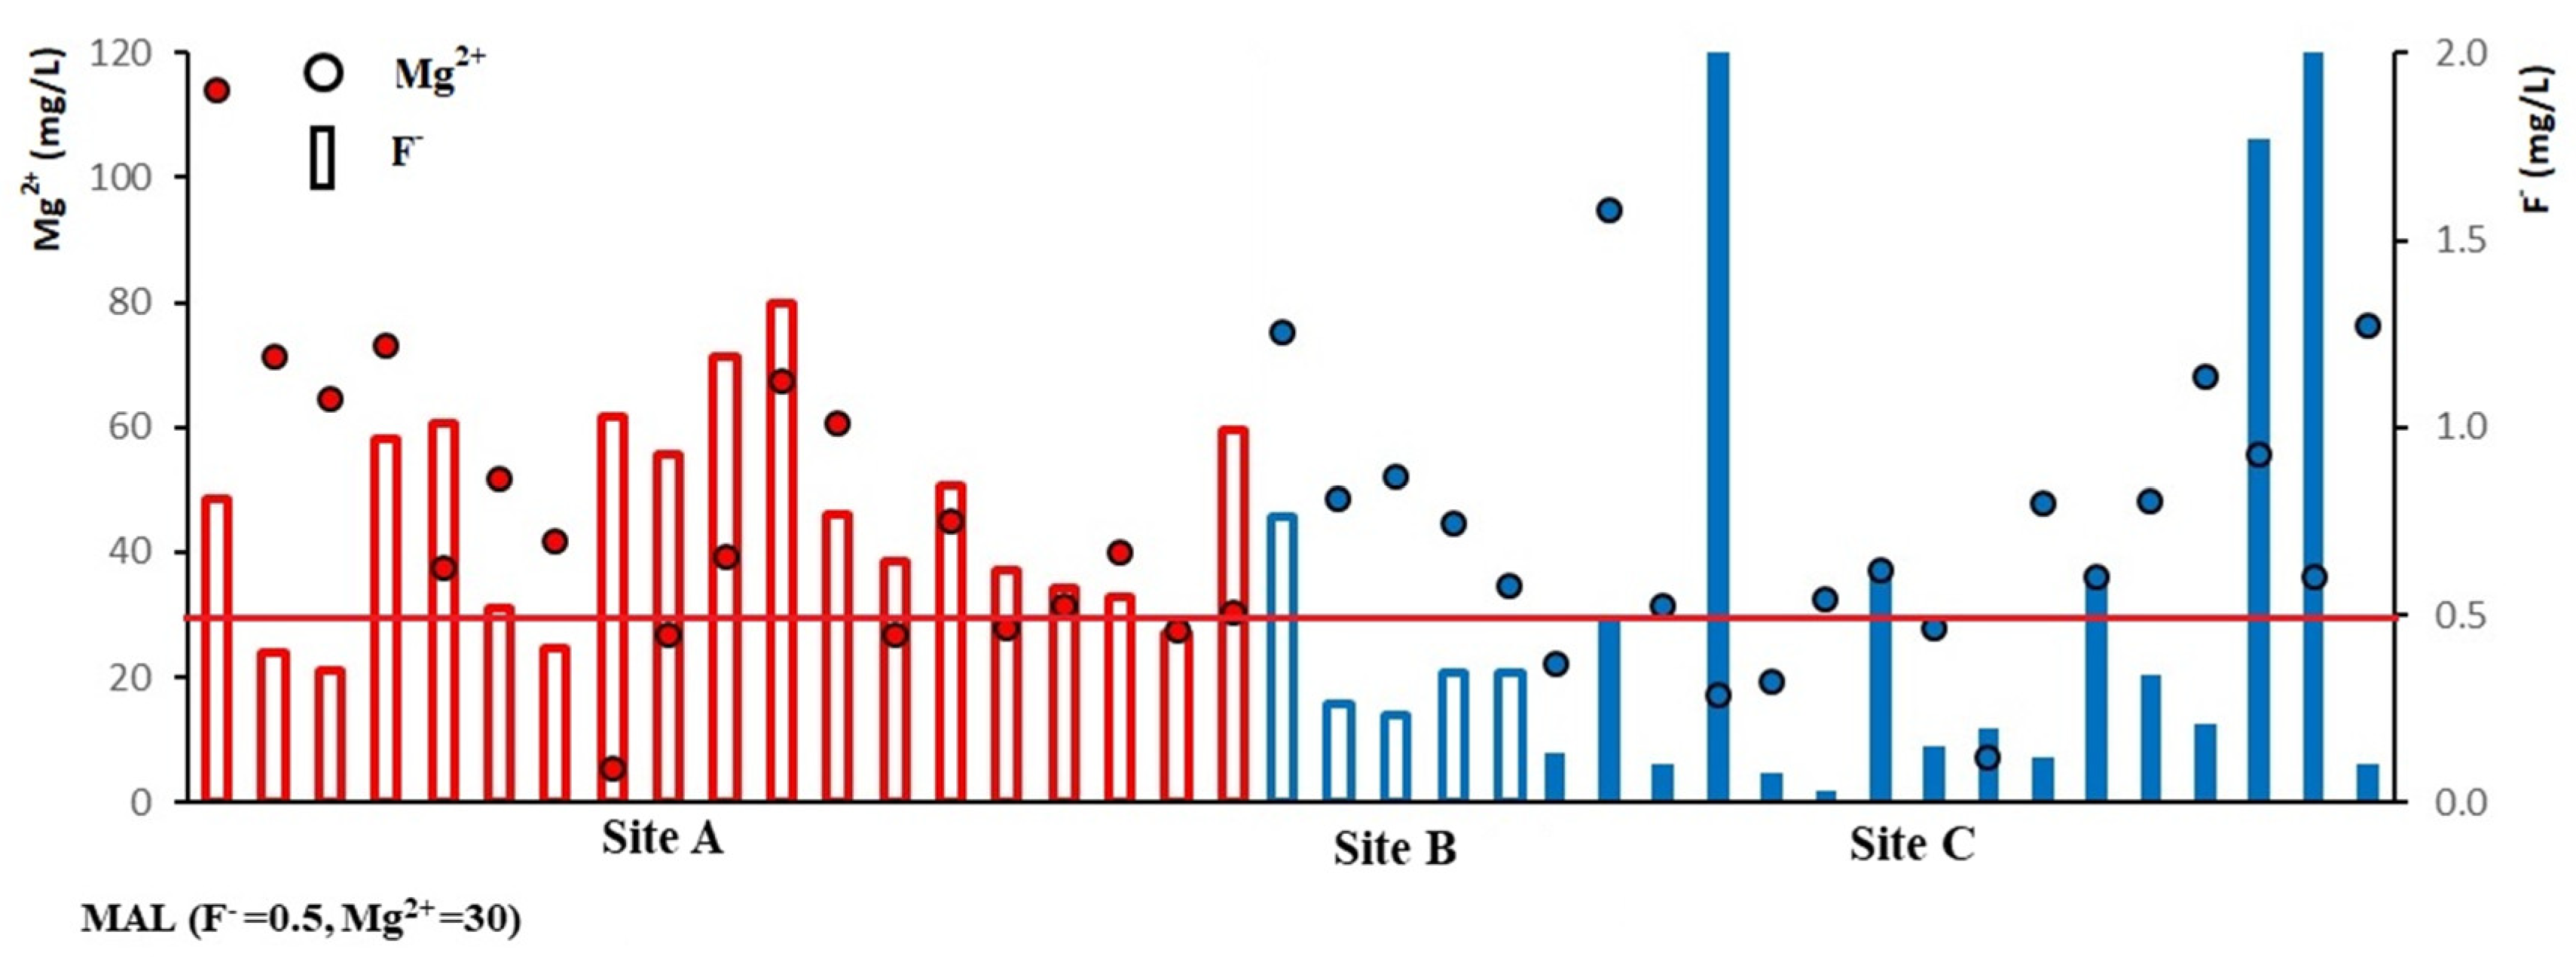
Considering the combined ionic ratios, the excess F− and Mg2+ ions are present in the groundwater samples in site A, but F− is relatively low in site B. In site C, there are three different types of water, showing low F− and low Mg2+, high F− and low Mg2+, or low F− with high Mg2+ (Figure 2). Chandrajith (2017) explained that low F− with high Mg2+ or high Mg2+ with low F− has an inhibitory effect on CKDu. According to the generated results, the combined effect of high F− and high Mg2+ may be the possible causative factor for CKDu.
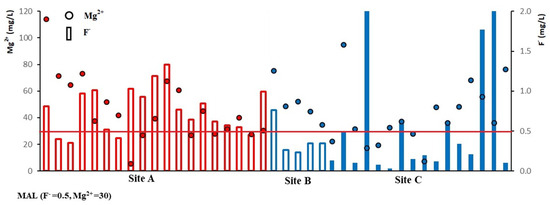
Figure 2.
The plot showing the F− and Mg2+ variation of groundwater during the dry season.
The spatiotemporal variation of measured water quality parameters exceeded the MAL in CKDu endemic and control areas. TDS and Na+ concentrations are higher in sites B and C while total hardness, F−, and Mg2+ concentrations are higher in site A. The concentration of the water quality parameters in the Malwathu Oya basin area is higher in the dry season than the wet season while shallow groundwater is higher than the deep groundwater. However, the same ion concentrations in the Malala Oya are higher in the wet season than the dry season. Ionic concentration of the shallow groundwater in both basins increases downstream. However, no significant spatial variation can be identified in the deep groundwater except for F− in site C. The high F− spot during the dry season is likely due to its geogenic origin.
All measured water quality parameters and their spatiotemporal variation imply that the deep groundwater is qualitatively better than shallow groundwater in the CKDu endemic area.
4.2. Hydrogeochemical Evolution of Groundwater
Distinct geological, hydrological, and climatic conditions play an important role in the geochemistry of CKDu causative factors [47]. Depending on the geological, hydrological, and climatological conditions, the groundwater type of the area may differ.
Piper trilinear diagrams are widely used for the geochemical classification of groundwater (Figure 3). Groundwater in site A mostly consists of Ca2+, Mg2+, and HCO3− ions, and the Ca-HCO3 type is predominant. Chemical results revealed that, in the shallow groundwater, Mg is dominant in the dry season while Ca is dominant in the wet season. This may be due to the dissolution of carbonate and silicate minerals in the wet season and the reduction of Ca ions by the ion exchange process during the dry season.
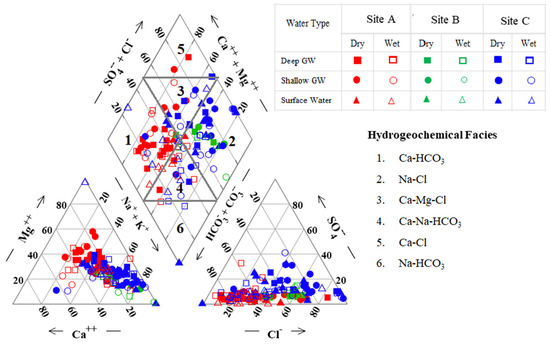
Figure 3.
A Piper trilinear plot illustrating the hydro-geochemical facies of groundwater during the wet and dry seasons.
Groundwater in site B is predominantly the Na-Cl type. Hydrochemical facies of Na-Cl may have a link to sea water mixing and/or cation exchange [31].
Site C has predominantly Na-Cl, Ca-Mg-Cl, and Ca-Na-HCO3 together with Na+, K+, and Ca2+ as the dominant cations and HCO3− and Cl− as the dominant anions. Ca-Mg-Cl and Ca-Na-HCO3 water types in this study area suggest a significant contribution to the weathering of mica, amphibolite, and pyroxene in the high-grade metamorphic rocks in the evolution of groundwater type in that basin area.
Gibb’s plot [54] is widely used to describe the source of dissolved chemical constituents in groundwater contributing from rock-weathering, evaporation-crystallization, and atmospheric precipitation. Evaporation-dominant waters generally occur in arid (high temperature) or coastal zones; this is due to the evaporation-fractional crystallization process causing rich, intermediate salinity to Na-rich, high salinity waters [54,55]. Groundwater collected from all three regions during both seasons fall in the transition zone of rock weathering dominance and evaporation concentration fields, indicating the influence of different degrees of water-rock interaction and evaporation concentration (Figure 4). However, the contribution rate of evaporation concentration to shallow groundwater is higher than that of deep groundwater in site A. The rock-dominance component is higher in the deep groundwater samples, while a lower Na+/(Na++Ca2+) ratio specifies the dominance of carbonate minerals in the CKDu endemic area while a higher value represents the dominance of silicate minerals/sea water mixing in the two control areas.
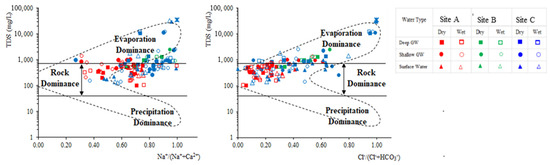
Figure 4.
Gibb’s plot illustrating the hydro-chemical facies of groundwater during the wet and dry season.
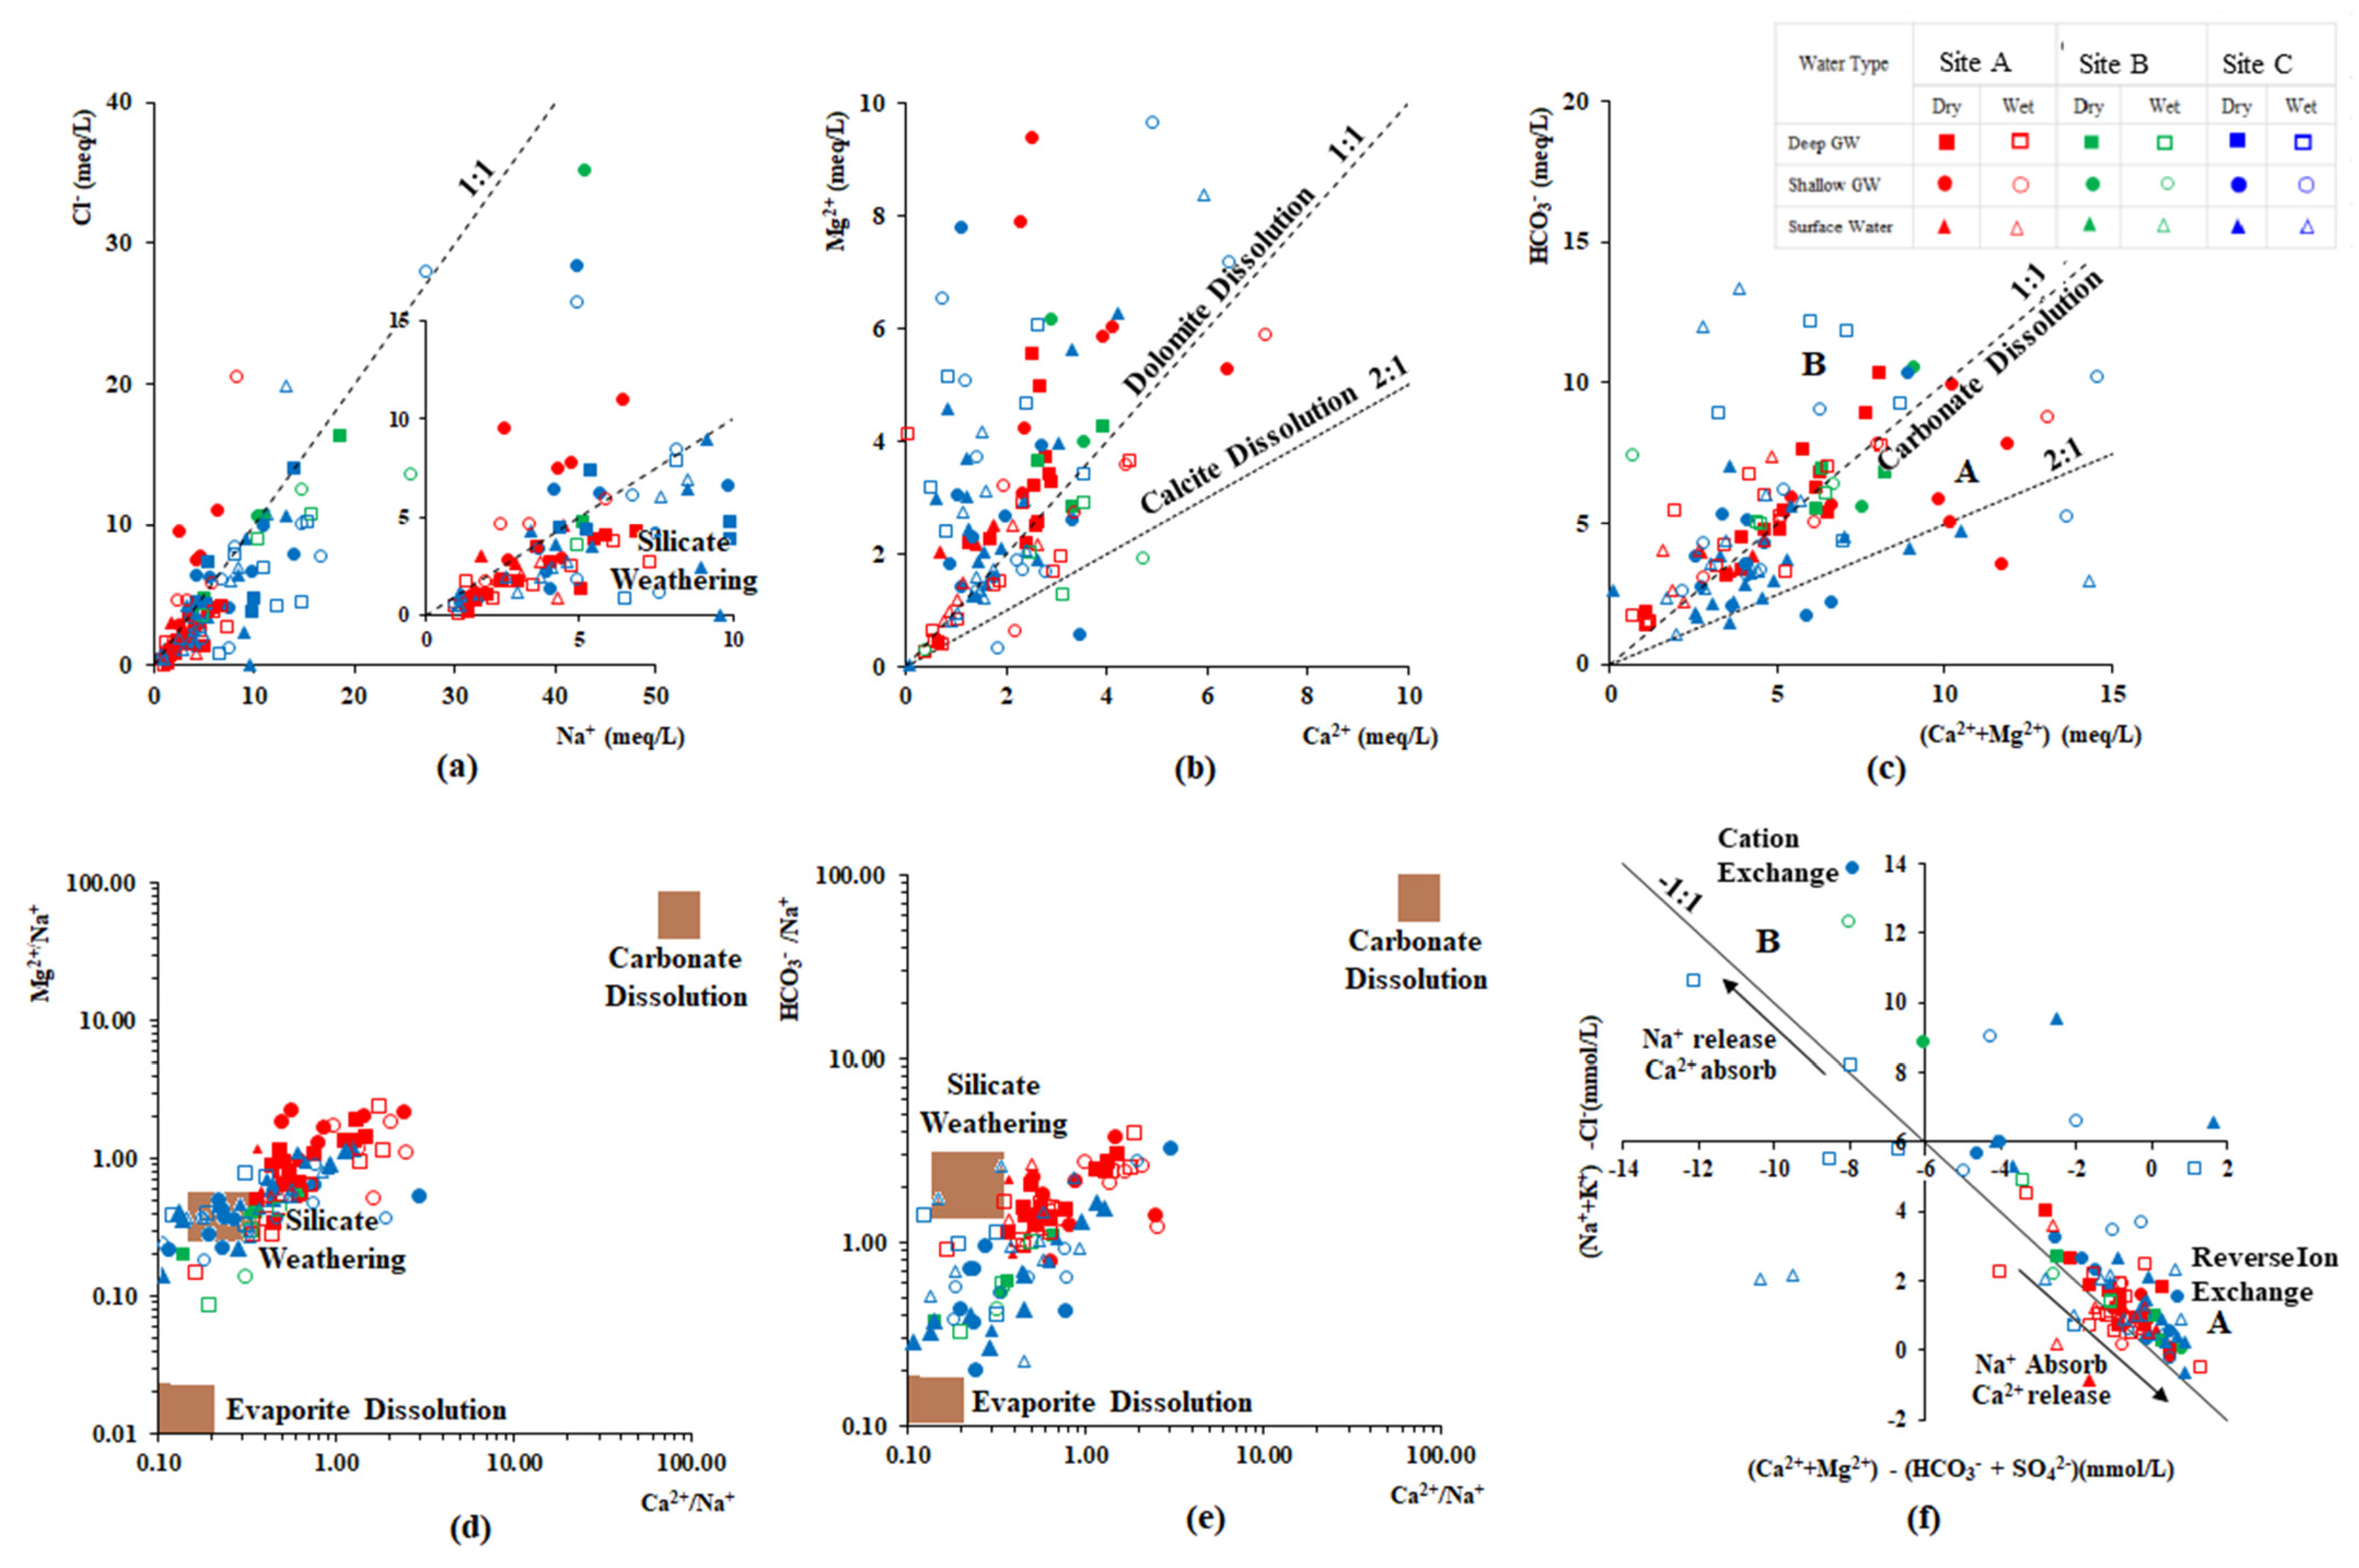
Na+, Ca2+, Mg2+, Cl−, and HCO3− are the major ions presence in the study area and are mainly influenced by rock weathering, evaporation crystallization, and cation exchange. The relationships between major ions are generally used to identify the evolution of groundwater and its mixing mechanisms [38,56,57]. Measured ion content shows a significantly higher linear relationship in the dry season because of the higher rock-water interaction in the dry season (Figure 5). On the other hand, the linearity of the relationship was scattered in the wet season because of the dilution effect. The molar ratio of Na+/Cl− is widely used to evaluate silicate weathering, seawater intrusion, halite dissolution, and ion exchange processes [56]. Groundwater samples collected from site B and two samples collected near the coast of site C were scattered along a 1:1 line of Na+/Cl−, indicating that this groundwater chemistry is based on seawater mixing (Figure 5a). An Na+/Cl− ratio greater than 1 represents silicate mineral weathering [38] Similarly, when this ratio is greater than 1.5, an additional source contributing to the dissolved Na+ is indicated; this is potentially due to the weathering of Na-bearing silicates, a dissolution of Na-bearing evaporites, and cation exchange between Ca2+ and Mg2+ in groundwater with Na+ on the aquifer matrix [58]. This phenomenon is common in the collected groundwater in the wet season of site C.

Figure 5.
Major ion relationships of (a) Cl− vs. Na+ (meq/L) (b) Mg2+ vs. Ca2+ (meq/L) (c) HCO3− vs. (Ca2+ + Mg2+) (meq/L) (d) Mg2+/Na+ vs. Ca2+/Na+ (e) HCO3−/Na+ vs. Ca2+/Na+ and (f) (Na+/K+)-Cl− vs. (Ca2+ + Mg2+)-(HCO3− + SO42−) of groundwater in the CKDu endemic and control area.
On the other hand, as shown in Figure 5b,c, water samples collected from the Malwathu Oya basin area are located on the 1:1 line of (Ca2+ + Mg2+) vs. HCO3− (meq/L); a Ca2+/Mg2+ ratio between 1 and 2 indicates the prominent calcite dissolution process [32,38]. Evaluation of the groundwater chemistry from the carbonate dissolution and silicate mineral weathering process can also be reconfirmed by the end-member diagrams (Figure 5d,e). However, Ca2+, Mg2+, and HCO3− in site C is mainly affected by silicate weathering and evaporite dissolution.
The evolution processes of Ca2+, Mg2+, and HCO3− in the CKDu endemic and the control are as shown below:
Dissolution of pyroxenes:
CaMg(Si2O6) + 4CO2 + 6H2O = Ca2+ + Mg2+ + 4HCO3− + 2Si(OH)4
Dissolution of amphiboles;
Ca2Mg5Si8O22(OH)2 + 14CO2 + 22H2O = 2Ca2+ + 5Mg2+ +14HCO3− + 8Si(OH)4
Dissolution of calcite and dolomites:
CaCO3 + CO2 + H2O = Ca2+ + 2HCO3−
CaMg(CO3)2 + 2CO2 + 2H2O = Ca2+ + Mg2+ + 4HCO3−
Cation exchange mainly occurs at the interface of the groundwater and aquifer matrix, during which Ca2+ and Mg2+ in groundwater are adsorbed into the aquifer material and Na+ and K+ are desorbed into groundwater. Groundwater containing HCO3− and SO42− are from the carbonate mineral dissolution and silicate weathering process, respectively. Hence, cation exchange is calculated by subtracting the equivalent concentration of HCO3− and SO42− from Ca2+and Mg2+, ([(Ca2+ + Mg2+) − (HCO3− + SO42−)]. Na+ and K+ come from desorption and can be calculated by subtracting an equivalent concentration of Cl− from Na+ + K+ [(Na+ + K+) − Cl−] [59]. Almost all groundwater samples collected from both seasons were plotted near the line with a slope of −1, indicating the presence of alternating cation adsorption in both CKDu endemic and control areas (Figure 5f). Water samples collected from site A during both seasons were plotted around a 1:1 line in the fourth quadrant of the coordinates, suggesting that alternate cation adsorption exists, mainly in the form of Ca2+ release and Na+ adsorption [36]. However, the regression line between ((Ca2+ + Mg2+) − (HCO3− + SO42−)) and ((Na+ + K+) − Cl−) in samples collected during the dry season had a slope of −1.1, which is slightly different from the wet season with the value of −0.8. In addition, the median value of ((Na+ + K+) − Cl−) in samples collected from the dry season (1.05) is slightly higher than that of the wet season (1.02), meaning that the Ca2+ release into the groundwater during the wet season is higher than the dry season in the CKDu endemic area (Area A: reverse ion exchange).
Na++ CaX2/MgX2 = Ca2+/Mg2++ NaX
During this process, clay minerals absorb Na+ from the water, and releasing Ca2+ or Mg2+ into the water may cause to increase in the hardness and Ca2+ or Mg2+ in water.
In contrast, samples collected from the wet season in the two control areas are moving towards the first quadrant of the coordinates (median value changing from dry to wet season are 1.90 to 5.21, respectively), suggesting that the forward ion exchange is occurring in this groundwater system (Area B).
Ca2+/Mg2+ + NaX = CaX2/MgX2+Na+
During this process, the absorption of Ca2+/Mg2+ in clay water and release of Na+ into the groundwater occurs and it causes a decrease of Mg2+ and/or Ca2+ in the body of water.
These findings show that cation exchange in the CKDu control area is more evident than in the CKDu endemic area.
4.3. Sources of Groundwater Recharge
Moisture origin of different monsoonal patterns was identified by previous research [25,26]. The authors proposed that the degree of isotopic depletion in rainwater across the island depends on the altitude, distance, and rain amount. Previously identified local meteoric water line (LMWL) of Dry Zone North East Valley area [δ2H = 7.7δ18O + 11.8‰ (r2 = 0.96)], evaporation line (EL) of North Central Dry Zone (δ2H = 5.7δ18O − 3.6‰) [26], and LMWL of Hambanthota area [δ2H = 8.0 δ18O + 12.8‰ (r2 = 0.96)] [38] provide the basis for interpretation of isotopic data in the Malwathu Oya (MO) and Malala Oya (ML) basin areas.
The D-excess provides indications of local environmental conditions, such as the degree of moisture recycling, amount of sub-cloud evaporation occurring during rainout, distinct air mass sources, and temperature of condensation [60].
Minimum and maximum δ18O, δ2H, and d-excess values of collected water sources of the MO and ML in both wet and dry seasons are presented in Table 2. The relationship between δ18O and δ2H is graphically illustrated in Figure 6a,b,d,e. The relationship of deuterium excess and TDS are represented in Figure 6c,f.
Table 2.
Stable isotopic characteristics of water in MO and ML.
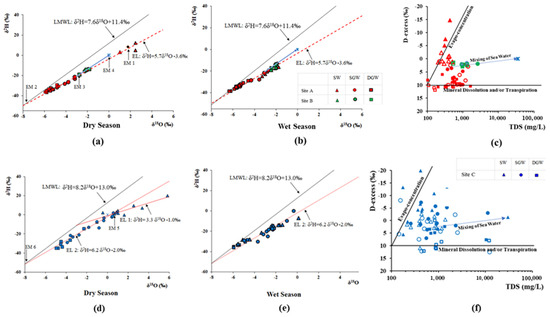
Figure 6.
δ2H vs. δ18O relationship of groundwater in (a,b). CKDu endemic Malawthu Oya (d,e). CKDu control Malala Oya, and (c,f) relationship of D-excess and TDS in both dry and wet seasons.
(a) Recharge source of the Malwathu Oya (sites A and B)
The δ18O and δ2H isotope value of surface water, shallow, and deep groundwater in the MO shows significant differences (Figure 6a). The δ18O and δ2H of surface water of the dry season in the MO are more enriched than the isotopic values of seawater, indicating strong evaporation. However, surface waters and shallow groundwater after the wet season (Figure 6a,b) show a similar depleted isotopic signature, implying that the groundwater in the regolith area may be interconnected with adjacent surface water bodies and may be fully saturated due to the heavy rainfall. In contrast, deep groundwater has no immediate recharge effect after the rainy season.
Almost all the water samples collected during the dry season lie on the evaporation lines of the North-Central Dry Zone (Figure 6a), but deep groundwater close to LMWL indicates that these waters are mainly recharged by monsoon rain and are slightly mixed with evaporated water. The basin area receives rainfall from the North East monsoon and 2nd Inter monsoon; the long-term average rain index of the basin shows δ18O and δ2H values of −6.7‰ and −40.7‰, respectively [26]. The δ18O confluence point (EM 2) of LMWL and evaporation line is −7.7‰, showing a more depleted isotopic signature than the rain index of the MO basin area. This is likely due to a higher elevation recharge condition.
The identified δ18O depletion in the rain per 100 m elevation is 0.6 ± 0.2‰ [26]. Considering the isotopic values and altitude effect, it is suggested that the deep groundwater in this basin is recharged from an altitude of 100 to 200 m amsl [31].
Both shallow and deep groundwater in the sedimentary limestone area (site B) have more enriched isotopic signatures than site A. These water samples are aligned in between the LMWL and evaporation line as well as pointing to the seawater, indicating that these waters are not only affected by evaporation but also mixing with seawater.
The slope of the evaporation line varies with the evaporation condition and is usually less than 8 in groundwater sources that originate from atmospheric precipitation and are affected by the evaporation. It is 4 to 6 in open water bodies and can reach 2 to 3 during soil evaporation. The slope of the evaporation line in the Malwathu Oya basin is 5.7 and it indicates that the groundwater in this study area may be recharged by the already evaporated surface water or that the shallow groundwater may be directly affected by evaporation. Hence, the isotopic composition of recharged groundwater in the 100 m (EM-2: δ18O and δ2H are −7.7‰ and −47.5‰) and average isotopic signature of the surface water (EM-1: δ18O and δ2H are 1.7‰ and 8.0‰, respectively) were considered as the end-members to calculate the mixed surface water proportion during the dry season of the study area.
This implies that the evaporated surface water proportion of the deep and shallow groundwaters are between 19 to 33% and 23 to 48%, respectively. The proportion of mixed sea water in site B was calculated using the confluence point of the groundwater regression line into the evaporation line (EM-3: δ18O and δ2H are −2.8‰ and −19.2‰, respectively) and the isotopic signature of seawater (EM-4: δ18O and δ2H are −0.4‰ and 2.1‰, respectively). The calculated mixed seawater proportion varies from 23 to 39%.
The relationship of D-excess with TDS (Figure 6c) indicates that the mineral dissolution mostly contributes to the salinity of deep groundwater in the site A. However, surface water is affected by evapo-concentration and seawater mixing is prominent in site B.
(b) Recharge source of the Malala Oya (site C)
The δ18O and δ2H isotope value of surface water and shallow- and deep groundwater in the Malala Oya basin area shows significant differences (Figure 6d,e) during both seasons. All the water in site C is plotted away from the LMWL of Hambanthota; this implies that all these waters are affected by evaporation to varying degrees. Poorly interconnected surface water-groundwater networks due to the depleted groundwater levels during the dry season may be the possible reason for this isotopic separation. After the wet season, similar isotopic signatures can be seen in the shallow groundwater and surface water because they may interconnect and become saturated by heavy rainfall.
Groundwater collected during the dry period at site C was plotted on the regression line (EL 2) denoted by δ2H = 6.2δ18O − 2.0‰ (r2 = 0.96) (Figure 6d). However, the surface water appears to have a different origin and the isotopic composition of surface water represents the evaporation line (EL 1) of δ2H = 3.3δ18O − 1.0‰. The δ18O and δ2H value of the confluence point of EL 1 into the LMWL is −2.9‰ and −10.7‰, respectively, and represents the rain index of Southwestern (SW) monsoon [26]; this suggests that the surface waters are only recharged by SW monsoonal rain. However, δ18O and δ2H values of the confluence point of EL 2 into the LMWL (EM 6: δ18O and δ2H are −8.2‰ and −52.8‰, respectively) show a more depleted isotopic signature than the local rain index of the basin area. This suggests that the shallow and deep groundwaters have a recharge origin from the adjacent mountainous area. The enriched and evaporated isotopic composition of shallow and deep groundwater composition could have been attributed to mixing with already evaporated surface water.
Mixing the proportion of evaporated surface water into the groundwater system is calculated using end-members of EM-5 and EM-6. The mixing proportion of evaporated surface water in deep groundwater varies from 37 to 69% and in shallow groundwater from 53 to 100%. Three shallow groundwater wells in this basin area are fully recharged by the evaporated surface waters.
Deep groundwater collected after the rainy season is aligned along the evaporation line but close to the LMWL, indicating that these waters are mainly recharged from monsoon rain. The deviation of shallow groundwater and surface water from the LMWL indicates intensive evaporation under prevailing dry conditions even after the rainy season (Figure 6e). However, the evaporation effect is lesser compared to the dry season.
The relationship of D-excess with TDS (Figure 6f) confirms that both mineral dissolution and evapo-concentration partially contribute to the salinity of groundwater during the dry season. However, surface water is only affected by the evapo-concentration, and mixing proportion is different from each other. After the wet season, the salinity of the deep groundwater is controlled only by mineral dissolution.
4.4. Groundwater Age
Tritium is a radioactive isotope of hydrogen, and it is a reliable tracer to discriminate groundwater more than 50 years old from recent meteoric waters with a half-life of 12.32 years (4500 days).
The measured long-term average tritium concentration in the precipitation in Sri Lanka is ~1.5TU [12] and the minimum detection limit of the instrument is 0.4 TU.
Tritium concentration of the surface and shallow groundwaters in the CKDu endemic area ranges from 0.64 to 1.07 TU and 0.4 to 0.67 TU, respectively; this shows that they are recently precipitated. Almost all the deep groundwater samples analyzed in the three regions are tritium-free (<0.4 TU), indicating their prolonged retention time with very low recharge rate along the aquifer [31,38]
Radiocarbon (14C) is a widely used groundwater dating method [61] that can be used to date groundwater up to thousands of years old based on the measurement of 14C of the DIC (dissolved inorganic carbon) in groundwater. The age is determined according to the following equation.
where, α is the groundwater age; 5730 is the half-life of 14C; 14CDIC is the measured 14C value of the DIC in the groundwater sample; and 14C0 is the initial 14C content of DIC.
The apparent radiocarbon age of the selected seven groundwater samples measured in the Malwathu Oya basin shows that their age is >150a BP except for one location (W07). An artesian well was identified in the sedimentary formation with an age of ~4500a BP. This further confirms that the deep groundwater in the Malwathu Oya basin is flowing along the regional flow paths with a longer mean residence time.
4.5. Correlation between Groundwater Fluoride, Hardness, TDS and Occurrence of CKDu
Spatiotemporal variation of water quality parameters exceeded the MALs of the three study sites are described in Section 4.2. However, their individual impact cannot correlate with the CKDu, even with the higher concentrations. Therefore, correlation coefficient matrix analysis was performed to identify the combined effect of water quality parameters with CKDu (Figure 7a–d).
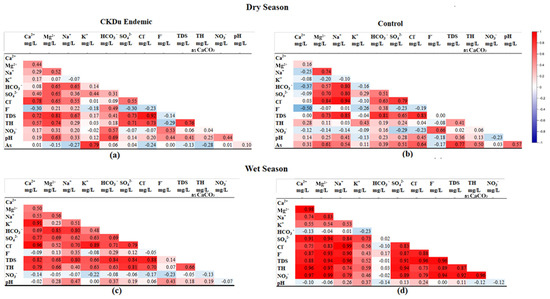
Figure 7.
Pearson’s correlation analysis among water quality parameters of groundwater in CKDu endemic (a,c) and control areas (b,d).
The TDS in the water collected from both seasons of the CKDu endemic area and the wet season of the control area shows a strong positive correlation with Mg2+, Ca2+, Na+, and Cl− and SO42−, which indicates that TDS may derived from weathering and/or dissolution of aquifer materials from the same source [36]. The TDS and Ca2+ are non-correlated in the dry season, with a strong positive correlation during the wet season; this reflects that its mineralization was mainly caused by Ca2+ in the control area [36].
The correlation of Mg2+ and total hardness (TH) is higher than the correlation of other cations with TH, implying that TH is more influenced by Mg2+ ions [61]. Mg hardness is prominent in the dry season, while Ca hardness is prominent in the wet season. In contrast, Ca hardness is prominent in the dry season of the control area. The more or less similar correlation coefficient of hardness with Ca and Mg (0.96) in the wet season indicates their equal contribution to the formation of total hardness in the control area.
The correlation between F− with other chemical components can used to further understand the source of groundwater F− [62,63]. There was a negative correlation between groundwater fluoride and Ca2+ in the CKDu endemic area during the both seasons and the control area during the dry season, with r = −0.30, r = −0.09, and r = −0.50, respectively. As groundwater Ca2+ increases from the dry to wet season in the CKDu endemic area, the reaction shown in Equation (7) will proceed, thereby decreasing the content of F− in groundwater due to the formation of CaF2.
Ca2+ + 2F− = CaF2
pH is an important factor that affects the desorption of groundwater F− [49] and a high concentration of HCO3− will result in an alkaline groundwater environment [63]. There is a positive correlation between groundwater F− with pH and HCO3− in the CKDu endemic area, indicating that an alkaline environment is more conducive to fluoride enrichment. As HCO3− is the main groundwater anion in the CKDu endemic area [5,64,65], alkaline groundwater may lead to desorption of F− as in Equation (8):
CaF2 + 2HCO3− = CaCO3+ 2F−+ H2O+ CO2
In contrast, F− desorption is unfavorable in the CKDu control area; this is because there was a non-correlation between groundwater F− with pH and a weak positive correlation between F− with HCO3. However, F− concentration in the control area is considerably high, especially during the wet season. This study has shown there is a strong positive correlation between F− with Na+ (r = 0.90). The main sources of Na+ are the weathering of sodium silicates, the dissolution of evaporites, and the cation exchange process.
However, the weathering of silicates and dissolution of evaporites are not directly related to groundwater fluoride [63]; hence, the positive correlation between F− and Na+ may be due to cation exchange and it encouraged the CaF2 dissolution. Thus, the F− concentration increases where Ca2+ ions have dropped.
High concentrations of major ions present in the water contribute to the TDS and certain concentrations of these ions can activate the Hofmeister series effects, leading to kidney damage in humans [50,65]. The results from the present study showed a direct correlation of TDS with other major ions of drinking water that can be used to identify their increasing and decreasing toxicity in the human body. Also, ionic ratios of F− with Mg2+, Ca2+, and Na+ and their impact on the biological mechanism leading to the disease may provide evidence as to its actual cause [45]. The present study identified a positive correlation between F− with pH, Mg2+, and HCO3− in the CKDu endemic area and F− with Na+ in the control area. In addition, the calculated Na/Ca ratio in the endemic and control area is different and it has been identified as a promising factor to indicate major geochemical dissimilarities. The Na/Ca ratio is strongly related to the F− concentration and in the CKDu endemic area; the lower Na/Ca ratio could be due to either the lower Na+ activity or high Ca2+ activity. Ca2+ activity is more prominent compared to the Na+ activity in the CKDu region and F− showed more affinity towards Ca2+ [37,45].
Several studies conducted by previous authors highlighted the relationship between F− and TH with CKDu [4,19]. Even with the high TH in both CKDu and the control area, this study showed the TH in the CKDu area induced by a higher content of Mg2+ ion and Mg hardness could be a causative factor for CKDu. Consideration of the Hofmeister-type action of anions [50] showed that the pairing of F− and Mg2+ in groundwater is expected to form nephrotoxic MgF2 complexes that lead to the etiology of CKDu.
In contrast, the formation of NaF by complexation of F− with Na+ leads to decreased F− toxicity in the human body [13]. The control area with a higher Na/Ca ratio due to the increase of Na+ concentration during the ion exchange process leads to a reduction of toxicity. Furthermore, high evaporation rates due to prevailing high temperatures in the control area may further concentrate ions in the groundwater system.
5. Conclusions
Hydrogeochemical and isotopic evidence from groundwater samples collected from dug wells and tube wells of three areas show distinctive variations in water quality parameters at selected groundwater basins representing CKDu endemic and non-endemic areas of Sri Lanka.
It has been found that, among the water quality parameters concerned, TDS, Mg2+, and F− have been identified as indicative of CKDu endemic areas. The combined effects of these parameters/components are considered potential causes leading to CKDu in Sri Lanka.
Detailed analysis and interpretation of the data obtained also reveal the formation mechanism and evolution processes of the water quality parameters. The sources of these components are considered in view of their hydrogeological background. Silicate weathering, carbonate dissolution and ion exchange are the main processes identified.
Based on analysis of the local climatic regime and groundwater circulation patterns, as established from isotope studies, it has been found that shallow groundwater is more sensitive t to these processes, thereby tends to deteriorate faster in quality.
Author Contributions
Conceptualization, Z.P. and K.S.G.S.P.; methodology, Z.P. and K.S.G.S.P.; software, K.S.G.S.P.; validation, K.S.G.S.P. and Z.P.; formal analysis, Z.P. and K.S.G.S.P.; investigation, All; resources, H.M.T.G.A.P.; data curation, E.A.N.V.E.; writing—original draft preparation, K.S.G.S.P.; writing—review and editing, Z.P. and K.S.G.S.P.; supervision, Z.P.; project administration, Z.P. All authors have read and agreed to the published version of the manuscript.
Funding
This research was funded by Program of China-Sri Lanka Joint Center for Water Technology Research and Demonstration by the Chinese Academy of Sciences (CAS). The first author would like to express her gratitude to the financial support of the CAS-TWAS President’s Fellowship Program (2018CTF2827) for her PhD study. Support of the International Atomic Energy Agency through Projects RCA RAS7030, RAS7035 and RAS7040 is sincerely acknowledged.
Data Availability Statement
The original data presented in the study are included in the article, further inquiries can be directed to the corresponding author.
Acknowledgments
We thank Mingguo Zhai, Xianhua Li, Jinghui Guo, Lei Zhao and Umaya Doss Saravana Kumar for helpful discussions and Min Yang and Yuansong Wei together with their team for their continued support and friendship in the broader CAS CKDu program over the years. We thank the three anonymous reviewers for their constructive comments and suggestions that have helped to improve the quality of this paper considerably.
Conflicts of Interest
Author Yifan Bao was employed by the company Sinopec Star (Beijing) New Energy Research Institute Co., Ltd. and Sinopec Star Co., Ltd. The remaining authors declare that the research was conducted in the absence of any commercial or financial relationships that could be construed as a potential conflict of interest.
References
- Levine, K.E.; Redmon, J.H.; Elledge, M.F.; Wanigasuriya, K.P.; Smith, K.; Munoz, B.; Waduge, V.A.; Periris-John, R.J.; Sathiakumar, N.; Harrington, J.M.; et al. Quest to identify geochemical risk factors associated with chronic kidney disease of unknown etiology (CKDu) in an endemic region of Sri Lanka—A multimedia laboratory analysis of biological, food, and environmental samples. Environ. Monit. Assess. 2015, 188, 548. [Google Scholar] [CrossRef] [PubMed]
- Nanayakkara, I.; Dissanayake, R.K.; Nanayakkara, S. The presence of dehydration in paddy farmers in an area with chronic kidney disease of unknown aetiology. Nephrology 2020, 25, 156–162. [Google Scholar] [CrossRef]
- Pry, J.M.; Jackson, W.; Rupasinghe, R.; Lishanthe, G.; Badurdeen, Z.; Abeysekara, T.; Chandrajith, R.; Smith, W.; Wickramasinghe, S. A pilot case-control study using a one health approach to evaluate behavioral, environmental, and occupational risk factors for chronic kidney disease of unknown etiology in Sri Lanka. One Health Outlook 2021, 3, 4. [Google Scholar] [CrossRef] [PubMed]
- Wickramarathna, S.; Balasooriya, S.; Diyabalanage, S.; Chandrajith, R. Tracing environmental aetiological factors of chronic kidney diseases in the dry zone of Sri Lanka-A hydrogeochemical and isotope approach. J. Trace Elem. Med. Biol. 2017, 44, 298–306. [Google Scholar] [CrossRef] [PubMed]
- Cooray, T.; Wei, Y.; Zhong, H.; Zheng, L.; Weragoda, S.K.; Weerasooriya, R. Assessment of Groundwater Quality in CKDu Affected Areas of Sri Lanka: Implications for Drinking Water Treatment. Int. J. Environ. Res. Public Health 2019, 16, 1698. [Google Scholar] [CrossRef] [PubMed]
- Imbulana, S.; Oguma, K. Groundwater as a potential cause of Chronic Kidney Disease of unknown etiology (CKDu) in Sri Lanka: A review. J. Water Health 2021, 19, 393–410. [Google Scholar] [CrossRef] [PubMed]
- Wimalawansa, S.J. The role of ions, heavy metals, fluoride, and agrochemicals: Critical evaluation of potential aetiological factors of chronic kidney disease of multifactorial origin (CKDmfo/CKDu) and recommendations for its eradication. Environ. Geochem. Health 2015, 38, 639–678. [Google Scholar] [CrossRef] [PubMed]
- Faleel, R.A.; Jayawardena, U.A. Progression of potential etiologies of the chronic kidney disease of unknown etiology in Sri Lanka. J. Environ. Sci. Health C Toxicol. Carcinog. 2020, 38, 362–383. [Google Scholar] [CrossRef] [PubMed]
- Torres, C.; Aragón, A.; González, M.; López, I.; Jakobsson, K.; Elinder, C.G.; Lundberg, I.; Wesseling, C. Decreased Kidney Function of Unknown Cause in Nicaragua: A Community-Based Survey. Am. J. Kidney Dis. 2010, 55, 485–496. [Google Scholar] [CrossRef]
- Gifford, F.J.; Gifford, R.M.; Eddleston, M.; Dhaun, N. Endemic Nephropathy Around the World. Kidney Int. Rep. 2017, 2, 282–292. [Google Scholar] [CrossRef]
- McDonough, L.K.; Meredith, K.T.; Nikagolla, C.; Middleton, R.J.; Tan, J.K.; Ranasinghe, A.V.; Sierro, F.; Banati, R.B. The water chemistry and microbiome of household wells in Medawachchiya, Sri Lanka, an area with high prevalence of chronic kidney disease of unknown origin (CKDu). Sci. Rep. 2020, 10, 18295. [Google Scholar] [CrossRef] [PubMed]
- Edirisinghe, E.A.N.V.; Manthrithilake, H.; Pitawala, H.M.T.G.A.; Dharmagunawardhane, H.A.; Wijayawardane, R.L. Geochemical and isotopic evidences from groundwater and surface water for understanding of natural contamination in chronic kidney disease of unknown etiology (CKDu) endemic zones in Sri Lanka. Isot. Environ. Health Stud. 2017, 54, 244–261. [Google Scholar] [CrossRef]
- Rajapakse, S.; Shivanthan, M.C.; Selvarajah, M. Chronic Kidney Disease of Unknown Etiology in Sri Lanka. Int. J. Occup. Environ. Health 2016, 22, 259–264. [Google Scholar] [CrossRef] [PubMed]
- Jayasekara, J.M.K.B.; Dissanayake, D.M.; Adhikari, S.B.; Bandara, P. Geographical Distribution of Chronic Kidney Disease of Unknown Origin in North Central Region of Sri Lanka. Ceylon Med. J. 2013, 58, 6–10. [Google Scholar] [CrossRef] [PubMed]
- Kulathunga, M.R.D.L.; Ayanka Wijayawardena, M.A.; Naidu, R.; Wijeratne, A.W. Chronic kidney disease of unknown aetiology in Sri Lanka and the exposure to environmental chemicals: A review of literature. Environ. Geochem. Health 2019, 41, 2329–2338. [Google Scholar] [CrossRef] [PubMed]
- Friedman, D.; Luyckx, V.A. Genetic and Developmental Factors in Chronic Kidney Disease Hotspots. Semin. Nephrol. 2019, 39, 244–255. [Google Scholar] [CrossRef] [PubMed]
- Premadasa, H.K.S.; Priyanath, H.M.S.; Walpita, C.N. The Impact of Social Capital on Socioeconomic Condition of Ckdu Patients in Sri Lanka: An Empirical Investigation. Int. J. Sci. Res. Manag. 2020, 8, 377–388. [Google Scholar] [CrossRef]
- Sandanayake, S.; Diyabalanage, S.; Edirisinghe, E.A.N.V.; Guo, H.; Vithanage, M. Hydrogeochemical characterization of groundwater with a focus on Hofmeister ions and water quality status in CKDu endemic and CKDu non–endemic areas, Sri Lanka. Environ. Pollut. 2023, 328, 121596. [Google Scholar] [CrossRef]
- Balasooriya, B.M.J.K.; Chaminda, G.G.T.; Weragoda, S.K.; Kankanamge, C.E.; Kawakami, T. Assessment of Groundwater Quality in Sri Lanka Using Multivariate Statistical Techniques. In Contaminants in Drinking and Wastewater Sources: Challenges and Reigning Technologies; Springer: Berlin/Heidelberg, Germany, 2021; pp. 117–135. [Google Scholar]
- Vlahos, P.; Schensul, S.L.; Nanayakkara, N.; Chandrajith, R.; Haider, L.; Anand, S.; Silva, K.T.; Schensul, J.J. Kidney progression project (KiPP): Protocol for a longitudinal cohort study of progression in chronic kidney disease of unknown etiology in Sri Lanka. Glob. Public Health 2019, 14, 214–226. [Google Scholar] [CrossRef]
- Panabokke, C.R.; Perera, A.P.G.R.L. Groundwater Resources of Sri Lanka; Water Resources Board: Colombo, Sri Lanka; Sri Lank: Kotte, Sri Lanka, 2005.
- Pathmarajah, S. Use of Groundwater for Agriculture in Sri Lanka Proceedings of a Symposium (Reprint); Symposium Sponsors Agricultural Engineering Society of Sri Lanka (AESSL); Postgraduate Institute of Agriculture (PGIA), Peradeniya Faculty of Agriculture: Peradeniya, Sri Lanka, 2007. [Google Scholar]
- Wasana, H.M.; Aluthpatabendi, D.; Kularatne, W.M.T.D.; Wijekoon, P.; Weerasooriya, R.; Bandara, J. Drinking water quality and chronic kidney disease of unknown etiology (CKDu): Synergic effects of fluoride, cadmium and hardness of water. Environ. Geochem. Health 2016, 38, 157–168. [Google Scholar] [CrossRef]
- Chandrajith, R.; Nanayakkara, S.; Itai, K.; Aturaliya, T.; Dissanayake, C.; Abeysekera, T.; Harada, K.; Watanabe, T.; Koizumi, A. Chronic kidney diseases of uncertain etiology (CKDue) in Sri Lanka: Geographic distribution and environmental implications. Environ. Geochem. Health 2011, 33, 267–278. [Google Scholar] [CrossRef] [PubMed]
- Jayasena, H.A.H.; Chandrajith, R.; Dissanayake, C.B. Spatial variation of isotope composition in precipitation in a tropical environment: A case study from the Deduru Oya river basin, Sri Lanka. Hydrol. Process. 2008, 22, 4565–4570. [Google Scholar] [CrossRef]
- Edirisinghe, E.A.N.V.; Pitawala, H.M.T.G.A.; Dharmagunawardhane, H.A.; Wijayawardane, R.L. Spatial and temporal variation in the stable isotope composition (δ18O and δ2H) of rain across the tropical island of Sri Lanka. Isotopes Environ. Health Stud. 2017, 53, 628–645. [Google Scholar] [CrossRef] [PubMed]
- Xu, S.; Li, S.L.; Yue, F.; Udeshani, C.; Chandrajith, R. Natural and anthropogenic controls of groundwater quality in sri lanka: Implications for chronic kidney disease of unknown etiology (ckdu). Water 2021, 13, 2724. [Google Scholar] [CrossRef]
- Cooray, P.G. The precambrian of Sri Lanka: A historical review. Precambrian Res. 1994, 66, 3–18. [Google Scholar] [CrossRef]
- Amarasinghe, U.A.; Mutuwatta, L.; Sakthivadivel, R. Water Scarcity Variations within a Country: A Case Study of Sri Lanka; International Water Management Institute: Colombo, Sri Lanka, 1999. [Google Scholar]
- Gangadhara, K.R.; Jayasena, H.A.H. Rainwater Harvest by Tank Cascades in Sri Lanka-Was it a Technically Adapted Methodology by the Ancients? In Proceedings of the Twelfth International Conference on Rain Water Catchment Systems, New Delhi, India, 1 November 2005. [Google Scholar]
- Priyadarshanee, K.S.G.S.; Pang, Z.; Edirisinghe, E.A.N.V.; Dharmagunawardhane, H.A.; Pitawala, H.M.T.G.A.; Gunasekara, J.D.C.; Tilakarathna, I.A.N.D.P. Deep groundwater recharge mechanism in the sedimentary and crystalline terrains of Sri Lanka: A study based on environmental isotope and chemical signatures. Appl. Geochem. 2022, 136, 105174. [Google Scholar] [CrossRef]
- Indika, S.; Hu, D.; Wei, Y.; Yapabandara, I.; Cooray, T.; Makehelwala, M.; Jinadasa, K.B.S.N.; Weragoda, S.K.; Weerasooriya, R.; Pang, Z. Spatiotemporal Variation of Groundwater Quality in North Central Province, Sri Lanka. ACS EST Water 2023, 3, 1687–1698. [Google Scholar] [CrossRef]
- Panabokke, C.R. Groundwater Conditions in Sri Lanka: A Geomorphic Perspective; National Science Foundation of Sri Lanka: Colombo, Sri Lanka, 2007. [Google Scholar]
- Harris, N.B.W.; Cooray, P.G. An Introduction to the Geology of Sri Lanka (Ceylon), 2nd ed.; National Museums of Sri Lanka: Colombo, Sri Lanka, 1991; Volume 128, p. 85. [Google Scholar] [CrossRef]
- Athuraliya, N.T.C.; Abeysekera, T.D.J.; Amerasinghe, P.H.; Kumarasiri, R.; Bandara, P.; Karunaratne, U.; Milton, A.H.; Jones, A.L. Uncertain etiologies of proteinuric-chronic kidney disease in rural Sri Lanka. Kidney Int. 2011, 80, 1212–1221. [Google Scholar] [CrossRef]
- Hu, D.; Indika, S.; Makehelwala, M.; Titus, C.; Zhu, L.; Pang, Z.; Zhong, H.; Weragoda, S.K.; Jinadasa, K.B.S.N.; Weerasooriya, R.; et al. Chemical characteristics and water stability evaluation of groundwater in the CKDu Zone of Sri Lanka. J. Environ. Sci. 2023, in press. [CrossRef]
- Liyanage, D.N.D.; Diyabalanage, S.; Dunuweera, S.P.; Rajapakse, S.; Rajapakse, R.M.G.; Chandrajith, R. Significance of Mg-hardness and fluoride in drinking water on chronic kidney disease of unknown etiology in Monaragala, Sri Lanka. Environ. Res. 2022, 203, 111779. [Google Scholar] [CrossRef]
- Senarathne, S.L.; Jayawardana, J.M.C.K.; Edirisinghe, E.A.N.V.; Chandrajith, R. Characterization of groundwater in Malala oya river basin, Sri Lanka using geochemical and isotope signatures. Groundw. Sustain. Dev. 2019, 9, 100225. [Google Scholar] [CrossRef]
- Imbulana, K.A.U.S.; Droogers, P.; Makin, I.W. World Water Assessment Programme Sri Lanka case study. In Proceedings of the Ruhuna Basins: Workshop Held at Koggala Beach Hotel, Koggala, Sri Lanka, 7–9 April 2002. [Google Scholar] [CrossRef]
- Standard Methods for the Examination of Water and Wastewater, 22nd ed.; APHA: Cincinnati, OH, USA, 2012.
- Reference Materials-VSMOW2. Available online: https://analytical-reference-materials.iaea.org/vsmow2 (accessed on 20 May 2024).
- Barth, J.A.C.; Veizer, J. Water mixing in a St. Lawrence river embayment to outline potential sources of pollution. Appl. Geochem. 2004, 19, 1637–1641. [Google Scholar] [CrossRef]
- Chabuk, A.; Abed, S.A.; Al-Zubaidi, H.A.M.; Al-Ansari, N.; Maliki, A.A.A.; Ewaid, S.H.; Laue, J. Application GIS Software to Determine the Distribution of T.D.S. Concentrations along the Tigris River. IOP Conf. Ser. Earth Environ. Sci. 2021, 735, 012055. [Google Scholar] [CrossRef]
- Dissanayake, C.B.; Weerasooriya, S.V.R. Fluorine as an indicator of mineralization—Hydrogeochemistry of a Precambrian mineralized belt in Sri Lanka. Chem. Geol. 1986, 56, 257–270. [Google Scholar] [CrossRef]
- Dissanayake, C.B.; Chandrajith, R. Groundwater fluoride as a geochemical marker in the etiology of chronic kidney disease of unknown origin in Sri Lanka. Ceylon J. Sci. 2017, 46, 3–12. [Google Scholar] [CrossRef]
- Ranasinghe, A.V.; Kumara, G.W.G.P.; Karunarathna, R.H.; De Silva, A.P.; Sachintani, K.G.D.; Gunawardena, J.M.C.N.; Kumari, S.K.C.R.; Sarjana, M.S.F.; Chandraguptha, J.S.; De Silva, M.V.C. The incidence, prevalence and trends of Chronic Kidney Disease and Chronic Kidney Disease of uncertain aetiology (CKDu) in the North Central Province of Sri Lanka: An analysis of 30,566 patients. BMC Nephrol. 2019, 20, 338. [Google Scholar] [CrossRef] [PubMed]
- Chandrajith, R.; Diyabalanage, S.; Dissanayake, C.B. Geogenic fluoride and arsenic in groundwater of Sri Lanka and its implications to community health. Groundw. Sustain. Dev. 2020, 10, 100359. [Google Scholar] [CrossRef]
- Su, C.; Wang, Y.; Xie, X.; Li, J. Aqueous geochemistry of high-fluoride groundwater in Datong Basin, Northern China. J. Geochem. Explor. 2013, 135, 79–92. [Google Scholar] [CrossRef]
- Saxena, V.; Ahmed, S. Dissolution of fluoride in groundwater: A water-rock interaction study. Environ. Geol. 2001, 40, 1084–1087. [Google Scholar]
- Dharma-wardana, M.W.C. Chronic kidney disease of unknown etiology and the effect of multiple-ion interactions. Environ. Geochem. Health 2018, 40, 705–719. [Google Scholar] [CrossRef]
- Kumar, A.; Singh, C.K. Characterization of Hydrogeochemical Processes and Fluoride Enrichment in Groundwater of South-Western Punjab. Water Qual. Expo. Health 2015, 7, 373–387. [Google Scholar] [CrossRef]
- Vaheesar, K. Nitrate and fluoride content in ground water in the batticaloa district. J. Sci. 2001, 2, 9–15. [Google Scholar]
- Jayasumana, C.; Gunatilake, S.; Senanayake, P. Glyphosate, Hard Water and Nephrotoxic Metals: Are They the Culprits Behind the Epidemic of Chronic Kidney Disease of Unknown Etiology in Sri Lanka? Int. J. Environ. Res. Public Health 2014, 11, 2125. [Google Scholar] [CrossRef]
- Gibbs, R.J. Mechanisms Controlling World Water Chemistry. Science (1979) 1970, 170, 1088–1090. [Google Scholar] [CrossRef] [PubMed]
- Kumar, S.K.; Logeshkumaran, A.; Magesh, N.S.; Godson, P.S.; Chandrasekar, N. Hydro-geochemistry and application of water quality index (WQI) for groundwater quality assessment, Anna Nagar, part of Chennai City, Tamil Nadu, India. Appl. Water Sci. 2015, 5, 335–343. [Google Scholar] [CrossRef]
- Rubasinghe, R.; Gunatilake, S.K.; Chandrajith, R. Geochemical characteristics of groundwater in different climatic zones of Sri Lanka. Environ. Earth Sci. 2015, 74, 3067–3076. [Google Scholar] [CrossRef]
- Raja, P.; Krishnaraj, S.; Selvaraj, G.; Kumar, S.; Francis, V. Hydrogeochemical investigations to assess groundwater and saline water interaction in coastal aquifers of the southeast coast, Tamil Nadu, India. Environ. Sci. Pollut. Res. 2021, 28, 5495–5519. [Google Scholar] [CrossRef] [PubMed]
- Lyu, M.; Pang, Z.; Yin, L.; Zhang, J.; Huang, T.; Yang, S.; Li, Z.; Wang, X.; Gulbostan, T. The control of groundwater flow systems and geochemical processes on groundwater chemistry: A case study in Wushenzhao Basin, NW China. Water 2019, 11, 790. [Google Scholar] [CrossRef]
- Wei, C.; Guo, H.; Zhang, D.; Wu, Y.; Han, S.; An, Y.; Zhang, F. Occurrence and hydrogeochemical characteristics of high-fluoride groundwater in Xiji County, southern part of Ningxia Province, China. Environ. Geochem. Health 2016, 38, 275–290. [Google Scholar] [CrossRef]
- Bershaw, J.; Hansen, D.D.; Schauer, A.J. Deuterium excess and 17O-excess variability in meteoric water across the Pacific Northwest, USA. Tellus B Chem. Phys. Meteorol. 2020, 72, 1–17. [Google Scholar] [CrossRef]
- Egbueri, J.C. Evaluation and characterization of the groundwater quality and hydrogeochemistry of Ogbaru farming district in southeastern Nigeria. SN Appl. Sci. 2019, 1, 851. [Google Scholar] [CrossRef]
- Adimalla, N. Assessment and Mechanism of Fluoride Enrichment in Groundwater from the Hard Rock Terrain: A Multivariate Statistical Approach. Geochem. Int. 2020, 58, 456–471. [Google Scholar] [CrossRef]
- Liu, J.; Peng, Y.; Li, C.; Gao, Z.; Chen, S. A characterization of groundwater fluoride, influencing factors and risk to human health in the southwest plain of Shandong Province, North China. Ecotoxicol. Environ. Saf. 2021, 207, 111512. [Google Scholar] [CrossRef] [PubMed]
- Chandrajith, R.; Dissanayake, C.B.; Ariyarathna, T.; Herath, H.M.J.M.K.; Padmasiri, J.P. Dose-dependent Na and Ca in fluoride-rich drinking water—Another major cause of chronic renal failure in tropical arid regions. Sci. Total Environ. 2011, 409, 671–675. [Google Scholar] [CrossRef]
- Hettithanthri, O.; Sandanayake, S.; Magana-Arachchi, D.; Wanigatunge, R.; Rajapaksha, A.U.; Zeng, X.; Shi, Q.; Guo, H.; Vithanage, M. Risk factors for endemic chronic kidney disease of unknown etiology in Sri Lanka: Retrospect of water security in the dry zone. Sci. Total Environ. 2021, 795, 148839. [Google Scholar] [CrossRef]


Disclaimer/Publisher’s Note: The statements, opinions and data contained in all publications are solely those of the individual author(s) and contributor(s) and not of MDPI and/or the editor(s). MDPI and/or the editor(s) disclaim responsibility for any injury to people or property resulting from any ideas, methods, instructions or products referred to in the content. |
© 2024 by the authors. Licensee MDPI, Basel, Switzerland. This article is an open access article distributed under the terms and conditions of the Creative Commons Attribution (CC BY) license (https://creativecommons.org/licenses/by/4.0/).