Article

Reflection of Daily, Seasonal and Interannual Variations in Run-Off of a Small River in the Water Isotopic Composition (δ2H, δ18O): A Case of the Ala-Archa Mountain River Basin with Glaciation (Kyrgyzstan, Central Asia)

1
Research Park, St. Petersburg State University, 198504 St. Petersburg, Russia
2
N. Laverov Federal Center for Integrated Arctic Research of UB RAS, 163000 Arkhangelsk, Russia
3
Institute of Water Problems and Hydropower of the National Academy of Sciences of the Kyrgyz Republic, Bishkek 720033, Kyrgyzstan
*
Author to whom correspondence should be addressed.
Water 2024, 16(11), 1632; https://doi.org/10.3390/w16111632
Submission received: 15 April 2024 / Revised: 27 May 2024 / Accepted: 3 June 2024 / Published: 6 June 2024

Abstract

:
Small intermountain river basins are most suitable for developing new methods to estimate water balance due to their well-defined catchment boundaries, relatively rapid runoff processes, and accessible landscapes for study. In general terms, dissecting the hydrograph of a small mountain river requires calibration of the flow model against multi-year data sets, including (a) glacier mass balance and snow water content, (b) radiation balance calculation, (c) estimation of the groundwater contribution, and (d) water discharge measurements. The minimum primary data set is limited to the precipitation and temperature distributions at the catchment. This approach postulates that the conditions for the formation of all components of river flow are known in advance. It is reduced to calculating the dynamic balance between precipitation (input part) and runoff, ablation, and evaporation (output part). In practice, accurately accounting for the inflow and outflow components of the balance, as well as the impact of regulating reservoirs, can be a challenging task that requires significant effort and expense, even for the extensively researched catchments. Our studies indicate the potential benefits of an approach based on one-time, but detailed, observations of stable isotope composition, temperature, and water chemistry, in addition to standard datasets. This paper presents the results of the 2022–2023 work conducted in the basin of the small mountain river Ala-Archa, located on the northern slope of the Kyrgyz Range in Tien-Shan, which was chosen as an example due to its well-studied nature. Our approach could identify previously unknown factors of flow formation and assess the time and effectiveness of work in similar conditions.

1. Introduction

The temporal variation of streamflow is the most readily accessible dataset that provides integrated information on the flow generation processes in the catchment [1,2,3,4]. It is accepted that the hydrograph shape allows for the extraction of information, which can be used as parameters in the numerical model of the basin runoff [5,6,7,8,9,10,11,12]. Several methods have been suggested for transforming inter-annual and intra-annual flow variations into hydrological characteristics. These characteristics are used as a target function for model calibration [5,6,13,14,15,16,17,18,19,20,21,22,23].
There are natural limitations to the use of discharge data. For instance, warm season runoff cannot be used to calculate snow accumulation, and winter discharge is not relevant for estimating glacier melt rates [2,24]. Furthermore, runoff generation processes exhibit significant variations, not only over time but also in different parts of the single mountain catchment, particularly those that have elevations spanning several kilometers [25,26,27,28]. In the upper part of the glaciated mountain catchment, diffuse runoff usually occurs, typically from melting glaciers and/or snow. Measuring the discharge of this runoff is challenging due to the migration of the individual streams from one place to another and its very small depth. A reliable estimate of the contribution of glacial meltwater requires measurement of the total discharge of such streams. But it is a difficult task, as the diffusion discharge varies on a seasonal and also on a diurnal scale.
The general equation of the water balance of a mountain catchment includes precipitation, runoff, and evapotranspiration. Glaciers, seasonal snow, and groundwater act as regulators, dynamically redistributing water supplies over time. From the information above, it can be concluded that it is not possible to correctly calibrate the hydrological model on the basis only of the water discharge data [23,29,30,31,32]. The identification of processes that take place in the catchment can be improved if several independent datasets are available [2,33,34,35].
Remotely sensed data are the most readily available and are often sufficient in terms of temporal coverage and spatial resolution. For example, an approach based on the analysis of multiple catchment images from MODIS and AVHRR sensors is widely used to train an algorithm to identify snow cover [36,37,38,39,40,41]. Methods for regionalization of the point measurements of glacier mass balance have been developed [42]. Glacier mass balance is estimated using digital elevation model analyses [43,44] and laser altimetry [45]. Remote sensing methods have limitations, particularly related to periods of high cloud density. Correlating remote sensing data with ground-based parameters can also be problematic [29,46,47]. For instance, hydrological models operate on basin snow water equivalent (SWE), while satellite data only provide information on snow areas [37,39,48] and poorly account for the spatial variability in glaciation [49]. Therefore, when modeling glaciated mountain catchments, it is necessary to include additional parameters that clearly define water sources, in addition to runoff hydrographs and remote sensing data. Direct ground-based methods with minimal costs are desirable for estimating these parameters. The end-member mixing analysis (EMMA) is widely used for identifying individual flow elements and hydrograph separation [50,51,52,53,54,55,56,57,58,59,60].
Application of the EMMA approach reveals that the isotopic composition of water is a valuable tracer, offering insight into the contribution of individual processes to runoff generation [55,61,62,63,64,65,66,67,68,69,70,71,72,73,74,75,76,77,78,79,80]. The stable isotopes have the advantage of clearly distinguishing rain and snow due to the varying contents of deuterium and oxygen-18 in the precipitation of the different seasons. Also, despite the significant variation in the δ2H and δ18O parameters in the glacier ice [81,82,83,84], the abundance of stable isotopes in glacial runoff remains relatively stable over time [76,78].
The use of the water isotopic composition (δ2H, δ18O) in combination with the data about the physical and chemical characteristics of water (temperature and electrical conductivity) can significantly expand the diagnostic capabilities of the EMMA technique for the river water balance description. This paper presents the results of a study of the behavior of stable isotopes and physicochemical parameters of water within the catchment of a small mountain river with glaciation. These data revealed the following:
Several factors that influence the formation of the water runoff, including one previously unknown component.
A correlation between runoff components and their distribution over time.
These results demonstrate that stable isotopes can help in the identification of the runoff components in the glacial basins and enhance the calibration of the hydraulic model for the river basin, where discharge data are the exclusive, available hydrological information.

2. Research Area

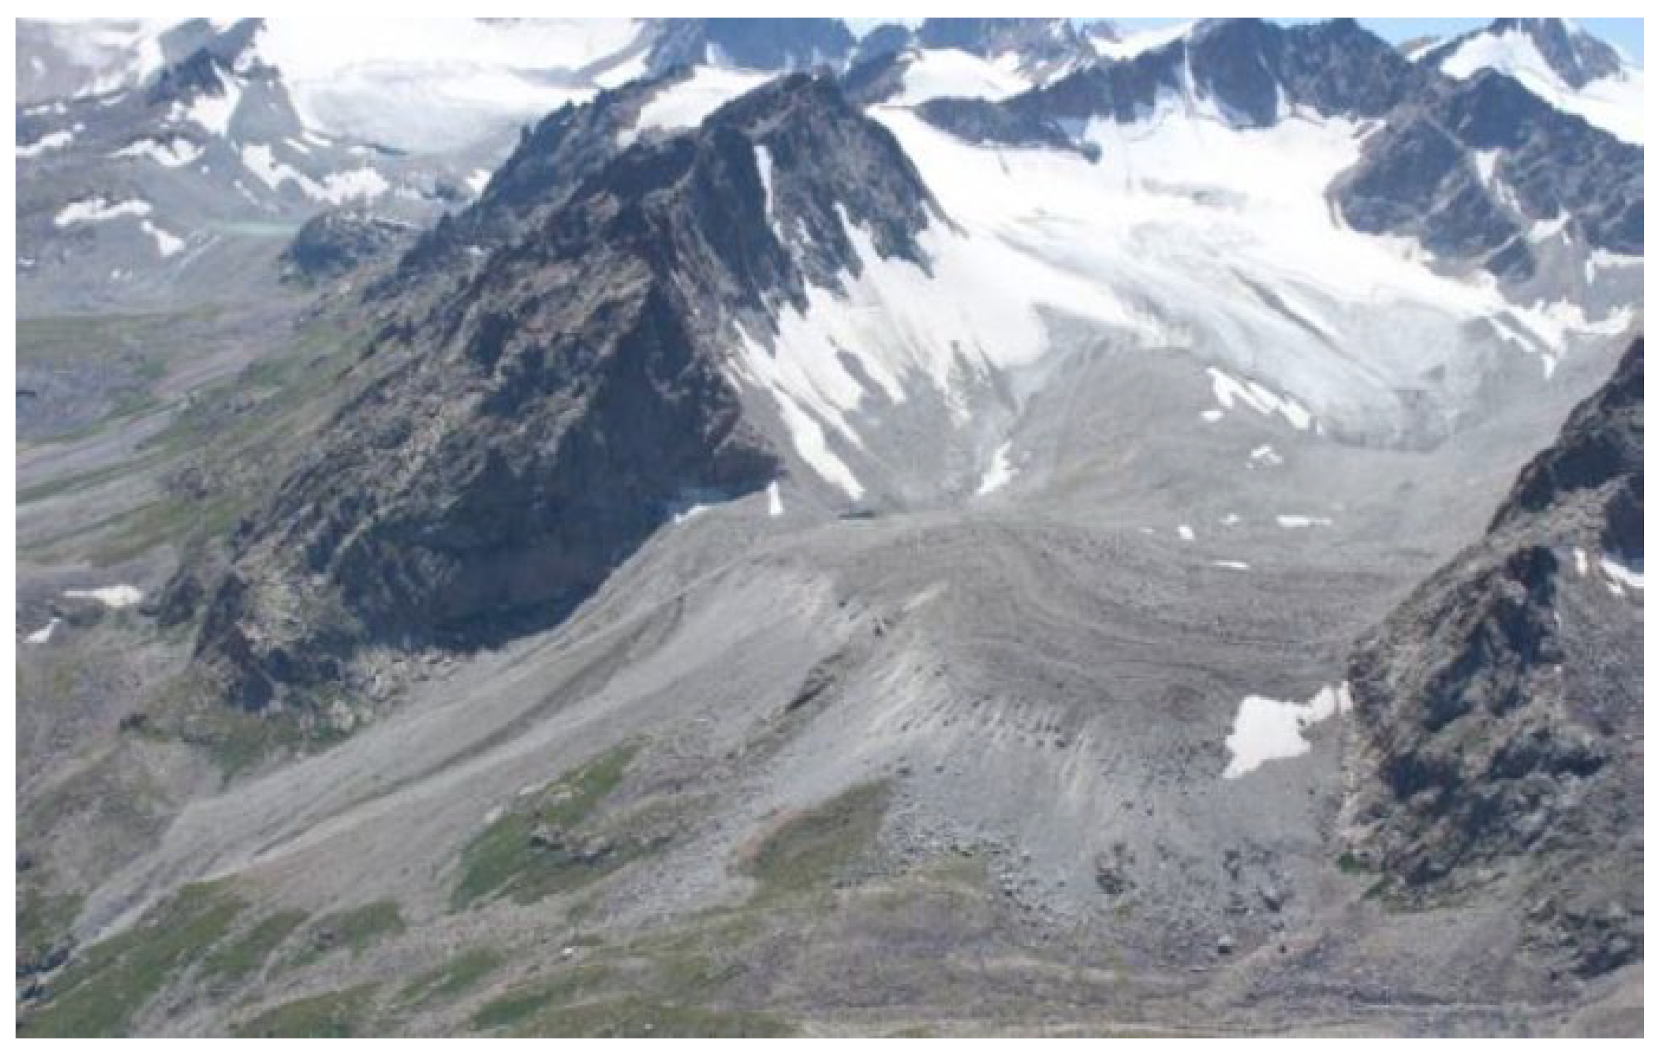
The Ala-Archa mountain river basin covers an area of approximately 233 km2. It is situated in the western part of the Tien Shan on the northern slope of the Kyrgyz Range at its highest point (Kyrgyz Republic, Central Asia, 74°24′–74°34′ E; 42°25′–42°39′ N, Figure 1). The summits in this part of the Kyrgyz Range reach a height of 4895 m above sea level, with pre-top rocky ridges ranging from 4000 to 4500 m. The area is characterized by steep, high-mountainous relief with numerous rocks and screes, as well as large glaciers. For the unregulated part of the Ala-Archa river basin, altitudes range from 1560 to 4864 m above sea level, with a weighted average altitude of approximately 3300 m. Up to 17% of the basin area is covered by glaciers, among which the large valley glaciers predominate, mainly occupying altitudes of 3700–4100 m [43]. The glaciers form an extensive area of moraine–glacial deposits (Figure 2).
The Golubina glacier is the largest glacier of the Ala-Archa River basin, which belongs to the summer accumulation type, and it is located at altitudes ranging from 3320 to 4350 m (Figure 1). Precipitation primarily falls on the surface of the glacier during spring and early summer, resulting in parallel accumulation and ablation. The Golubina Glacier’s mass balance was measured annually from 1973 to 1993 and after 2011 using glaciological and remote sensing methods [85]. Glacier degradation in the upper reaches of the Ala-Archa River has been occurring since the late 1980s. During glacier retreat, part of the ice is buried under a cloak of rocky debris (Figure 2).
Daily (4–6 times) data series of atmospheric precipitation, air temperature, and humidity, as well as solar radiation, have been available since the 1970s for the meteorological stations Baitik (altitude 1580 m) and Alpine camp (2159 m, see Figure 1), which are under the jurisdiction of the Kyrgyz Hydrometeorological Service. Daily average discharge observations have been available for the hydrological station Ala-Archa since the 1960s. The station is located near the Baitik station and records the river discharge at the entrance to the regulated part of the basin. The Alpine camp meteorological station recorded an average annual precipitation of 560 mm and a mean temperature of +2.68 °C between 1970 and 2000. Precipitation is highest during the spring and summer months; snow and glacier melting typically begin in late March; and flooding on the Ala-Archa River is usually from July to September [43,81,86,87]. The daily flow rate typically reaches its peak of 25–40 m3/s during July and August, while the minimum daily flow rate of approximately 1.9 m3/s is observed in January and February.
During an extended period of heavy rain, water discharge can increase significantly. Additionally, when water breaks through high mountain lakes, floodwaters can turn into mudflows, resulting in a discharge of up to 50–55 m3/s. Most of the side valleys of the Ala-Archa River are susceptible to mudflows. The Aksai and Adygene rivers’ valleys are particularly prone to high-capacity debris flows caused by outbursts of high-mountain lakes in their upper reaches. Mudflow processes may be activated between May and August, with the peak occurring during the third decade of July to the first decade of August, which are the most mudflow-prone days in the valley. High-mountain lakes have experienced breakthroughs repeatedly in the past. Currently, there are 15 high-altitude breakthrough lakes in the Ala-Archa river basin, some of which are approaching the breakthrough stage in their development. These lakes are located in the upper reaches of the Adygene (left tributary) and Top-Karagai (right tributary) valleys.
It should be noted that transpiration has an insignificant influence on the water balance of the Ala-Archa River basin. This is due to the fact that the average annual vegetation cover does not exceed 28%.
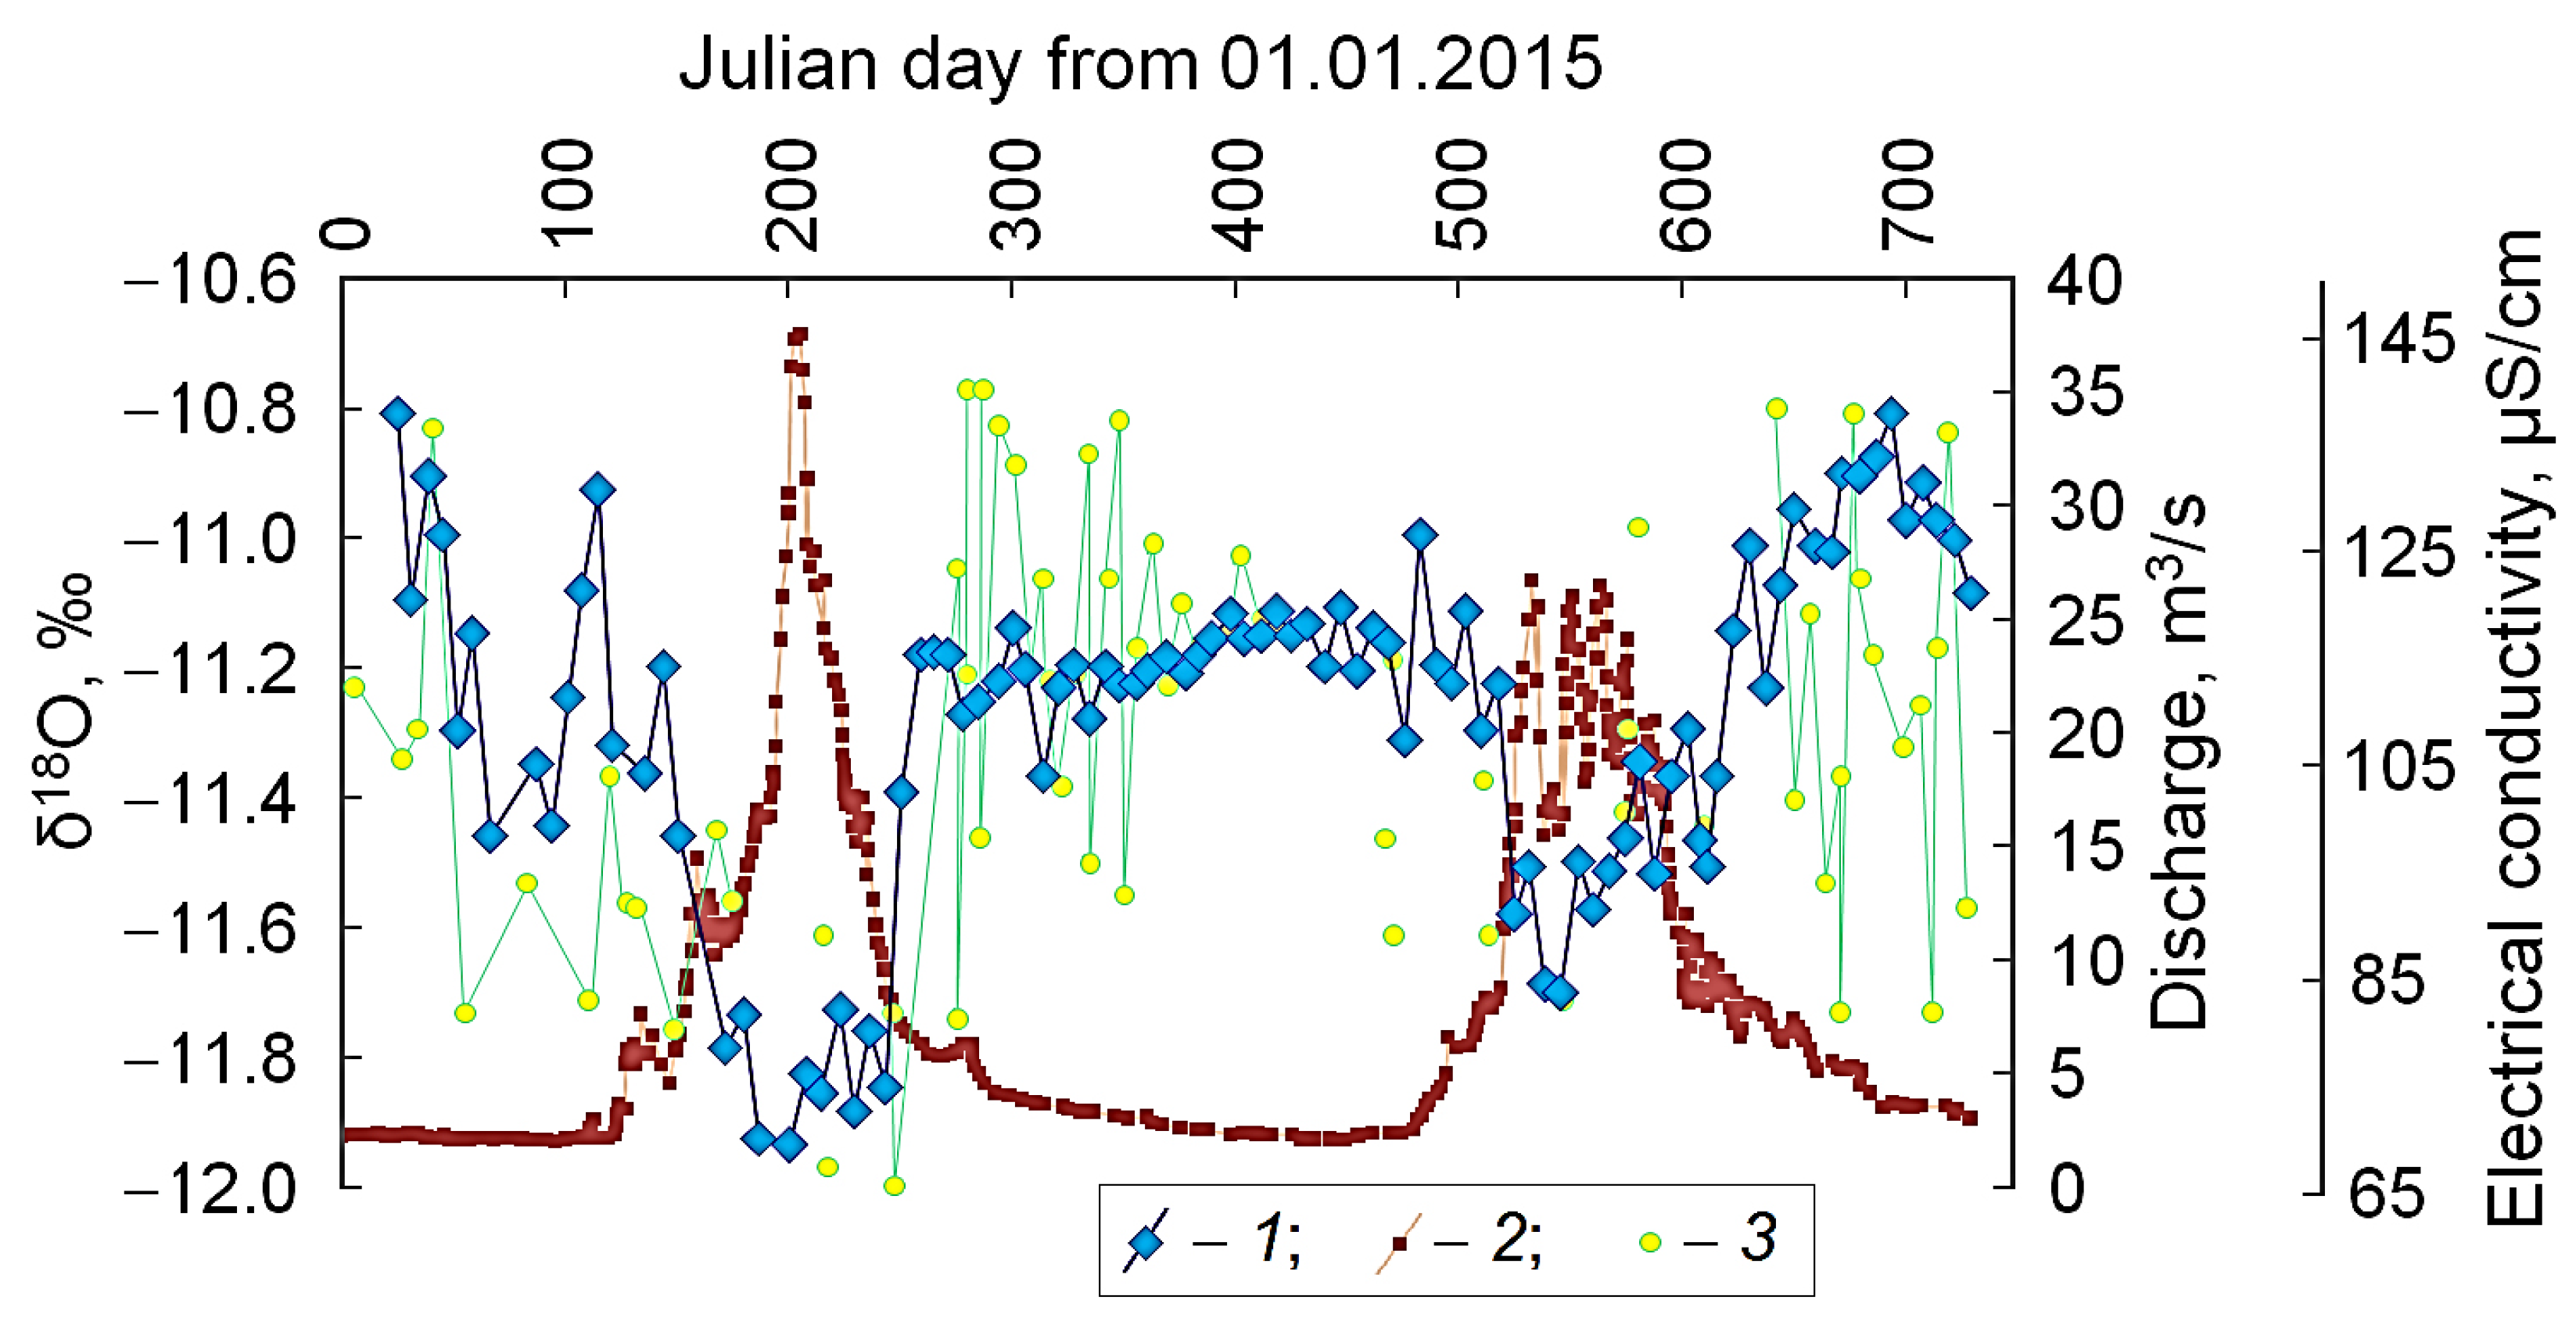
Data on the isotopic composition of precipitation and runoff from the Ala-Archa River are presented in [76,78]. Precipitation and river water were sampled from January 2013 at the Baitik (located near the Kashkasuu village, see Figure 1) and Alpine camp weather stations; glacial runoff was sampled near the Golubina glacier tongue at 3280–3520 m; and seasonal snow was sampled at the same elevations. A water sample was also taken from a spring. The most detailed data were obtained for 2015 and 2016 (Figure 3).
The statistically processed results of the observations of the hydrogen and oxygen isotopic composition of various objects from [76,78] are summarized in Table 1.
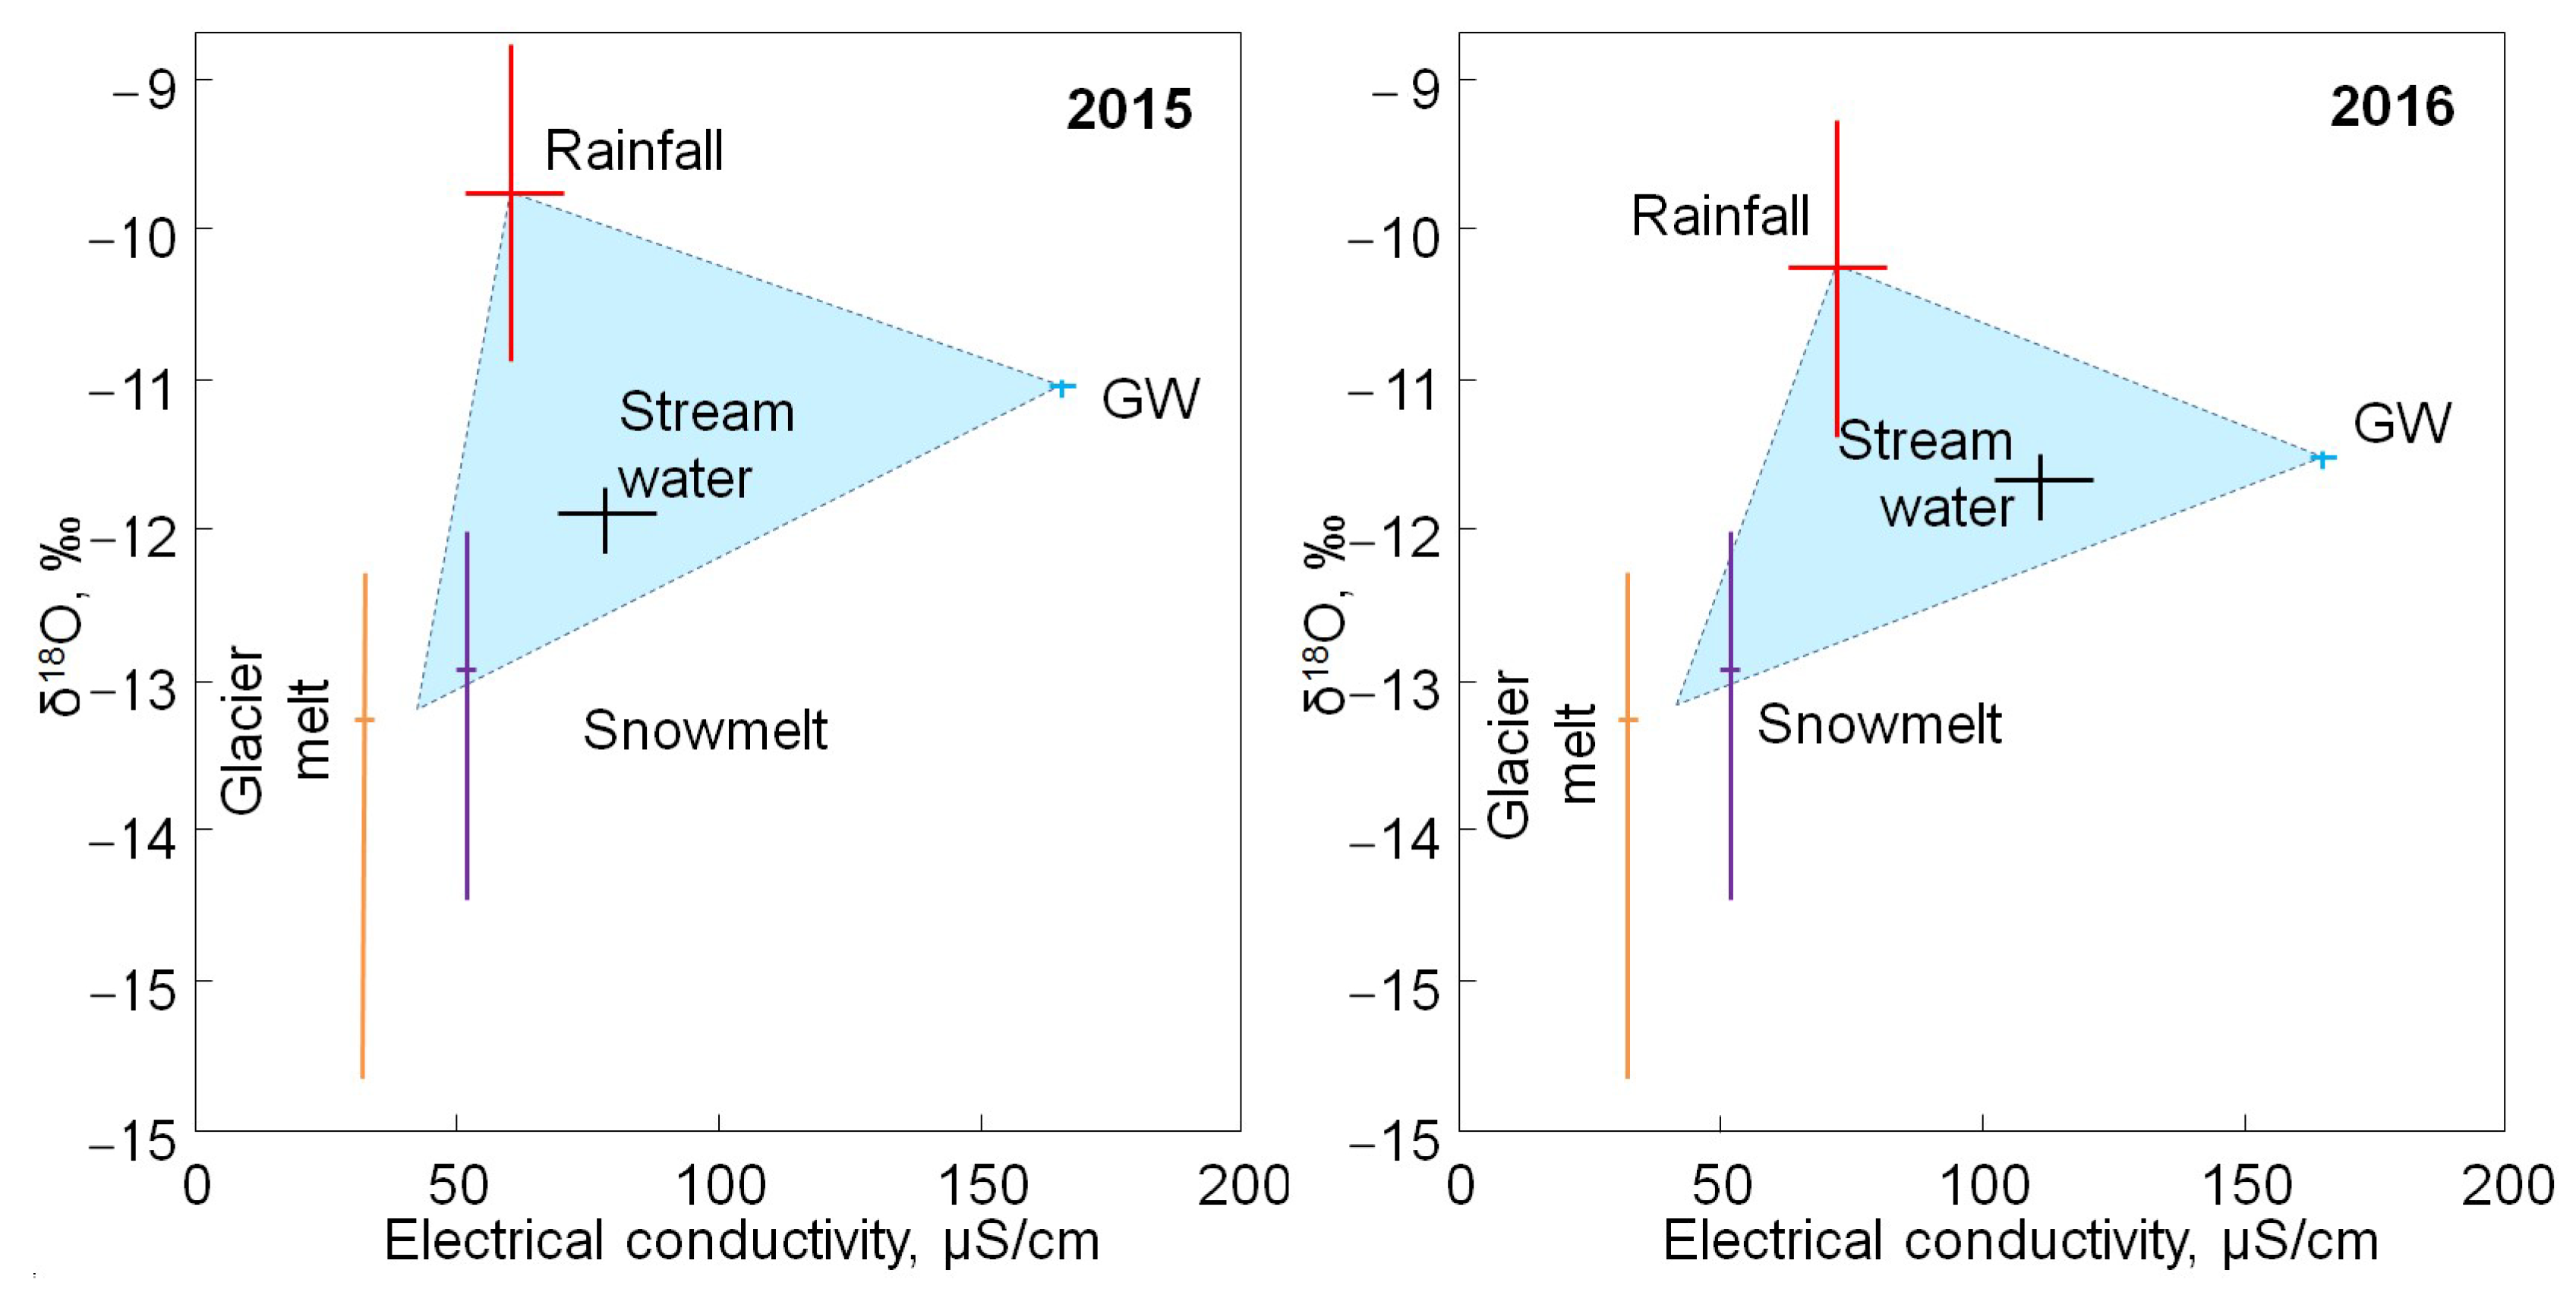
In [76,78], variations in the isotopic composition of glacial ice in the accumulation zone were not considered, and the isotopic composition of groundwater and river runoff in January was assumed to be formed by warm season precipitation. For altitudes above 3200 m, the contribution of groundwater to runoff was assumed to be negligible. Based on the obtained data on the isotopic composition and electrical conductivity of water [76,78], the following three sources of the runoff composition formation were identified (Table 1, Figure 4):
Atmospheric precipitation in the form of rain;
Glacial meltwater and snowmelt;
Groundwater.
The long experience of the author’s work in the Ala-Archa river basin has shown that the interpretation of the data obtained in [76,78] does not fully correspond to the real situation. He et al. [76,78] assumed that the parameters δ18O and δ2H in precipitation, glacial meltwater, and groundwater are linearly related to basin elevation, as is generally accepted [75,88,89,90,91,92]. Firstly, according to our observations at Elbrus (Caucasus, altitudes 3100–3900 m) and southeastern Altai (altitudes 2900–3500 m), wind-driven snow transport can significantly distort the linear dependence of the isotopic composition of seasonal snow on altitude and, therefore, of glacial ice [62,93]. Secondly, during field work in the glaciation zone of the Ala-Archa River basin, we discovered buried ice that differed significantly in morphology from the modern glacier. This suggests that the buried ice also differs from modern ice in other ways. Thirdly, assessing groundwater characteristics based on the unique sample from the single spring may be unreliable.
In this regard, detailed sampling of the water in the Ala-Archa River basin was carried out in 2022 and 2023. The water was sampled to determine its isotopic and chemical composition and tested by field measurements for its water conductivity, temperature, hydrogen, and redox potentials.

3. Materials and Methods

Fieldwork was conducted at the end of the summer flood in the Ala-Archa River basin (13–24 September 2022 and 26 August–6 September 2023) and in the winter, low water (18–28 April 2023). The collection included 398 surface and groundwater samples, as well as 14 samples of rain, snow, and ice. From the Ala-Archa River, 284 water samples were collected, including 28 samples from the branched network of the diffuse water discharge under the moraine. Sampling was conducted from the source to the downstream near the Kashkasuu village (Baitik station), covering the main tributaries, springs, and high-mountain lakes. The samples were collected in 10 mL thick-walled plastic vials with tightly screwed lids. Physicochemical parameters, including water temperature (t), electrical conductivity (EC), redox potential (Eh), and hydrogen potential (pH), were measured directly at the sampling site. The water samples were stored in a refrigerator at +4 °C before and after transfer to the laboratory in the additional plastic box with a hermetic lid.
Analytical determinations of isotopic composition were conducted at the Research Park of Saint-Petersburg State University (Centre for X-ray Diffraction Studies) using a Picarro L2130i laser spectrometer (Picarro, Inc., Santa Clara, CA, USA) and USGS45 and USGS46 standards [94,95]. The measurement procedure was designed in such a way that the reproducibility of ±0.02‰ for δ18O and ±0.3‰ for δ2H (in the SMOW scale) was achieved, which proved to be important for the interpretation of the data obtained.

4. Results

4.1. Daily Observations

In autumn 2023, two hypotheses were tested concerning the influence of factors that can cause short-term changes in a number of parameters of the main watercourse of the Ala-Archa River. The first hypothesis tested the functional dependence of isotopic composition and physicochemical parameters of water on diurnal variations of runoff, which are usually associated with the intensification of the glacier and snow melt during the daytime. The second one evaluated the response of the isotopic composition and physicochemical parameters of water to rainfall floods.
Daily allowance observations at the Alpine camp point during the week-long period of no precipitation revealed a clear impact of diurnal variations in runoff on the isotopic composition and physicochemical parameters of water (Figure 5). The variations observed during daily monitoring are insignificant compared to the general variations in the isotopic composition and physical and chemical characteristics of the Ala-Archa River flow. The analytical error of the parameter measurements during daily monitoring with respect to the found variations is rather large (see Section 3). However, there is a synchronous (albeit multidirectional) change in the estimated parameters, which makes their interpretation more reliable.
A cyclic-like change in the water isotopic composition was detected (Figure 5a,e). This change is a result of several factors; first of all, it is a variation in the glacial and snow meltwater abundance in the river runoff. Up until mid-day (as seen in the observations up to and including the sample on 28 August 2023 16:18 in Figure 5a,e), there is a slight depletion in the oxygen isotopic composition with a slightly changing hydrogen composition. Subsequently, the isotopic composition of water becomes isotopically heavier due to evaporation (Figure 5a,c,e).
Evaporation is most likely to occur when the elementary trickle of meltwater moves along the surface of the heated mineral bedrock, after which it is absorbed by the soil. The time gap between the peak of the glacial meltwater runoff wave around 16:18 (Figure 5e), which is formed mainly due to the water absorption by cracks and wells in the glacier body, and the run-up of the evaporated meltwater wave around 19:45 is due to the time spent on the water filtration through the soil. The increase in the electrical conductivity of water (Figure 5b) and radon-222 activity (Figure 5c) also indicate this.
The variation of river water temperature generally follows the course of air temperature (Figure 5d). However, the increase in the river water temperature ends before the maximum of the oxygen isotope depletion and the maximum in the river water discharge. This suggests the presence of an additional runoff component with a relatively low temperature. This is expected given that the soil temperature is significantly lower than the air temperature, excluding the soil surface. In He et al. [76,77], modeling also obtained the influence of the soil water inflow into the main channel of the Ala-Archa River, which lags several hours behind the runoff generated by the melting glaciers and snow.
Observations of the rainfall flood at the Alpine camp point did not reveal any significant impact of precipitation on the isotopic composition of the Ala-Archa River flow. However, it should be noted that it was not possible to measure the intensity and isotopic composition of rainfall that occurred in the upper reaches of the river about 800 m vertically upstream of the observation point. Therefore, we plan to repeat this type of observation, which will be realized at lower river discharges and higher precipitation towards the end of winter low water or the beginning of summer floods.
The daily variations of the isotopic and physicochemical parameters of water in the Ala-Archa River are relatively small compared to the variations in the basin as a whole. Therefore, they can be disregarded when considering the obtained data for diagnosing the conditions of river flow composition formation.

4.2. Seasonal and Inter-Annual Variations

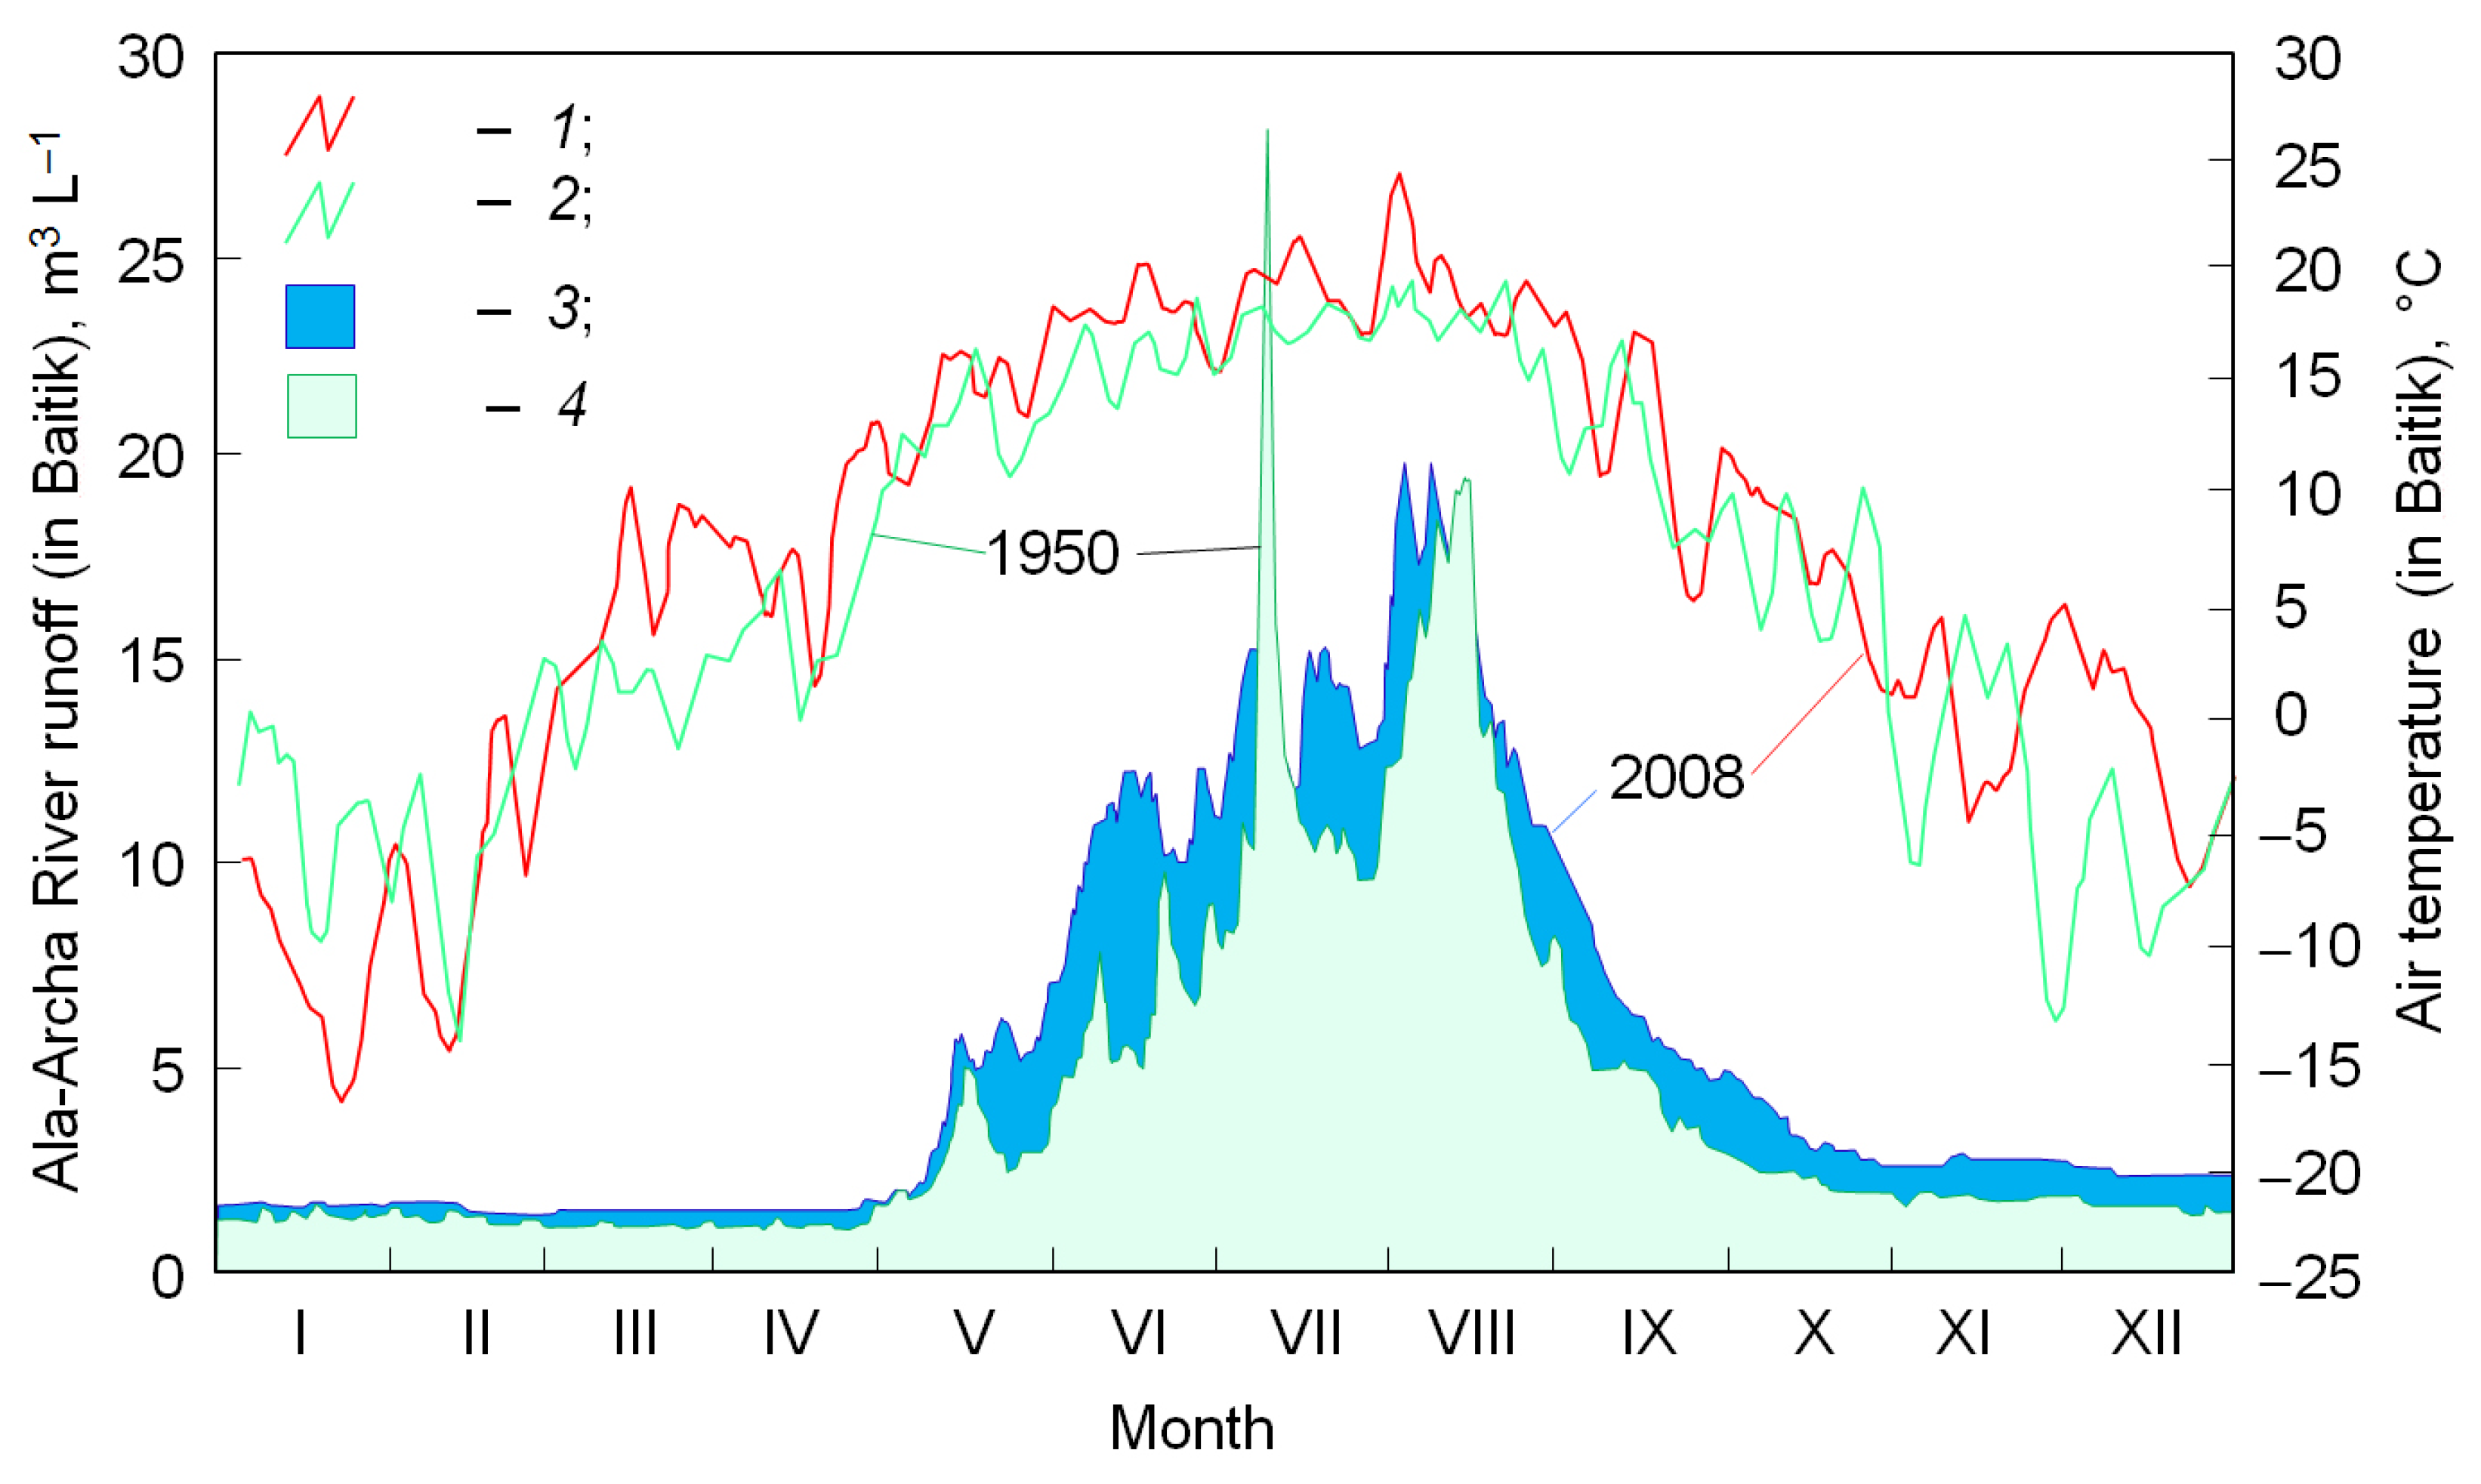
Figure 6 shows the intra-annual flow distribution of the Ala-Archa River as a percentage of the monthly runoff volume from the whole year runoff [96]. Groundwater from the highest part of the Ala-Archa basin enters the intermountain depression as a flow through the alluvial sediments. On average, the sub-channel flow accounts for only 3–5% of the surface water runoff and ranges from 0.09 m3/s to 0.23 m3/s [96].
Figure 7 shows the distribution of mean daily air temperatures and precipitation for the period of January to December 2023 at the Alpine camp station (Figure 1, 42.56 N; 74.48 E, altitude 2159 m) and the Ala-Archa Pass station (42.44 N; 74.43 E, 3902 m) using the Meteoblue® meteorological data archive. It is important to note that the meteorological data provided are from the NEMSGLOBAL model, which is a computer simulation of weather conditions and not precise measurements for the selected location. Currently, there is no comparison with meteorological station data, but such a comparison is planned for the future. Modeling data can provide highly accurate results, but they cannot be considered actual data.
The total annual precipitation at Alpine camp station in 2023 was 4.5 times higher than at Ala-Archa Pass station, with 1701.5 mm and 381.3 mm, respectively. The majority of precipitation fell in the spring–summer period. There was about 46.1% at Alpine camp station and 43.1% at Ala-Archa Pass station of annual precipitation during the summer, and 31.8% at Alpine camp station and 36.6% at Ala-Archa Pass station during the spring. Therefore, to generate a correct river flow model, it is necessary to take into account the fact that precipitation in the Ala-Archa river basin is not evenly distributed over the area and much more precipitation falls in the valley. It is also necessary to take into account the transport of snow by wind and its concentration in ravines and hollows, as well as the movement of snow masses during avalanches. All these processes are integrally taken into account when using stable isotopes to identify the sources of water balance formation.
Snow, accumulated in the Ala-Archa river basin in winter, begins to melt in the river valley earlier than on the mountains (see the moment of the stable crossing the zero temperature, Figure 7), and the spring–summer precipitation causes the first wave of floods. This weather circumstance could have influenced the isotope composition of river water for the lower reaches of the Ala-Archa River in 20–25 April 2023. However, at this time, the precipitation continues to accumulate due to the negative temperatures in the highlands. From the end of May, the seasonal snow and the glacial ice begin to thaw (the effect of the slope must also be taken into account as the sunny side thaws much faster), and the heavy summer rainfall has a more intense melting effect, causing the second increase in the runoff. From mid-summer, when most of the seasonal snow has melted, the surface ice of glaciers begins to release water into river flow. Then, as the rocks and moraine sediments warm, a component of meltwater from the buried ice is added. All components that form the runoff should appear in the isotopic composition of the river water at the end of the summer flood (see sampling campaign 15–20 September 2022 and 29 August–6 September 2023).
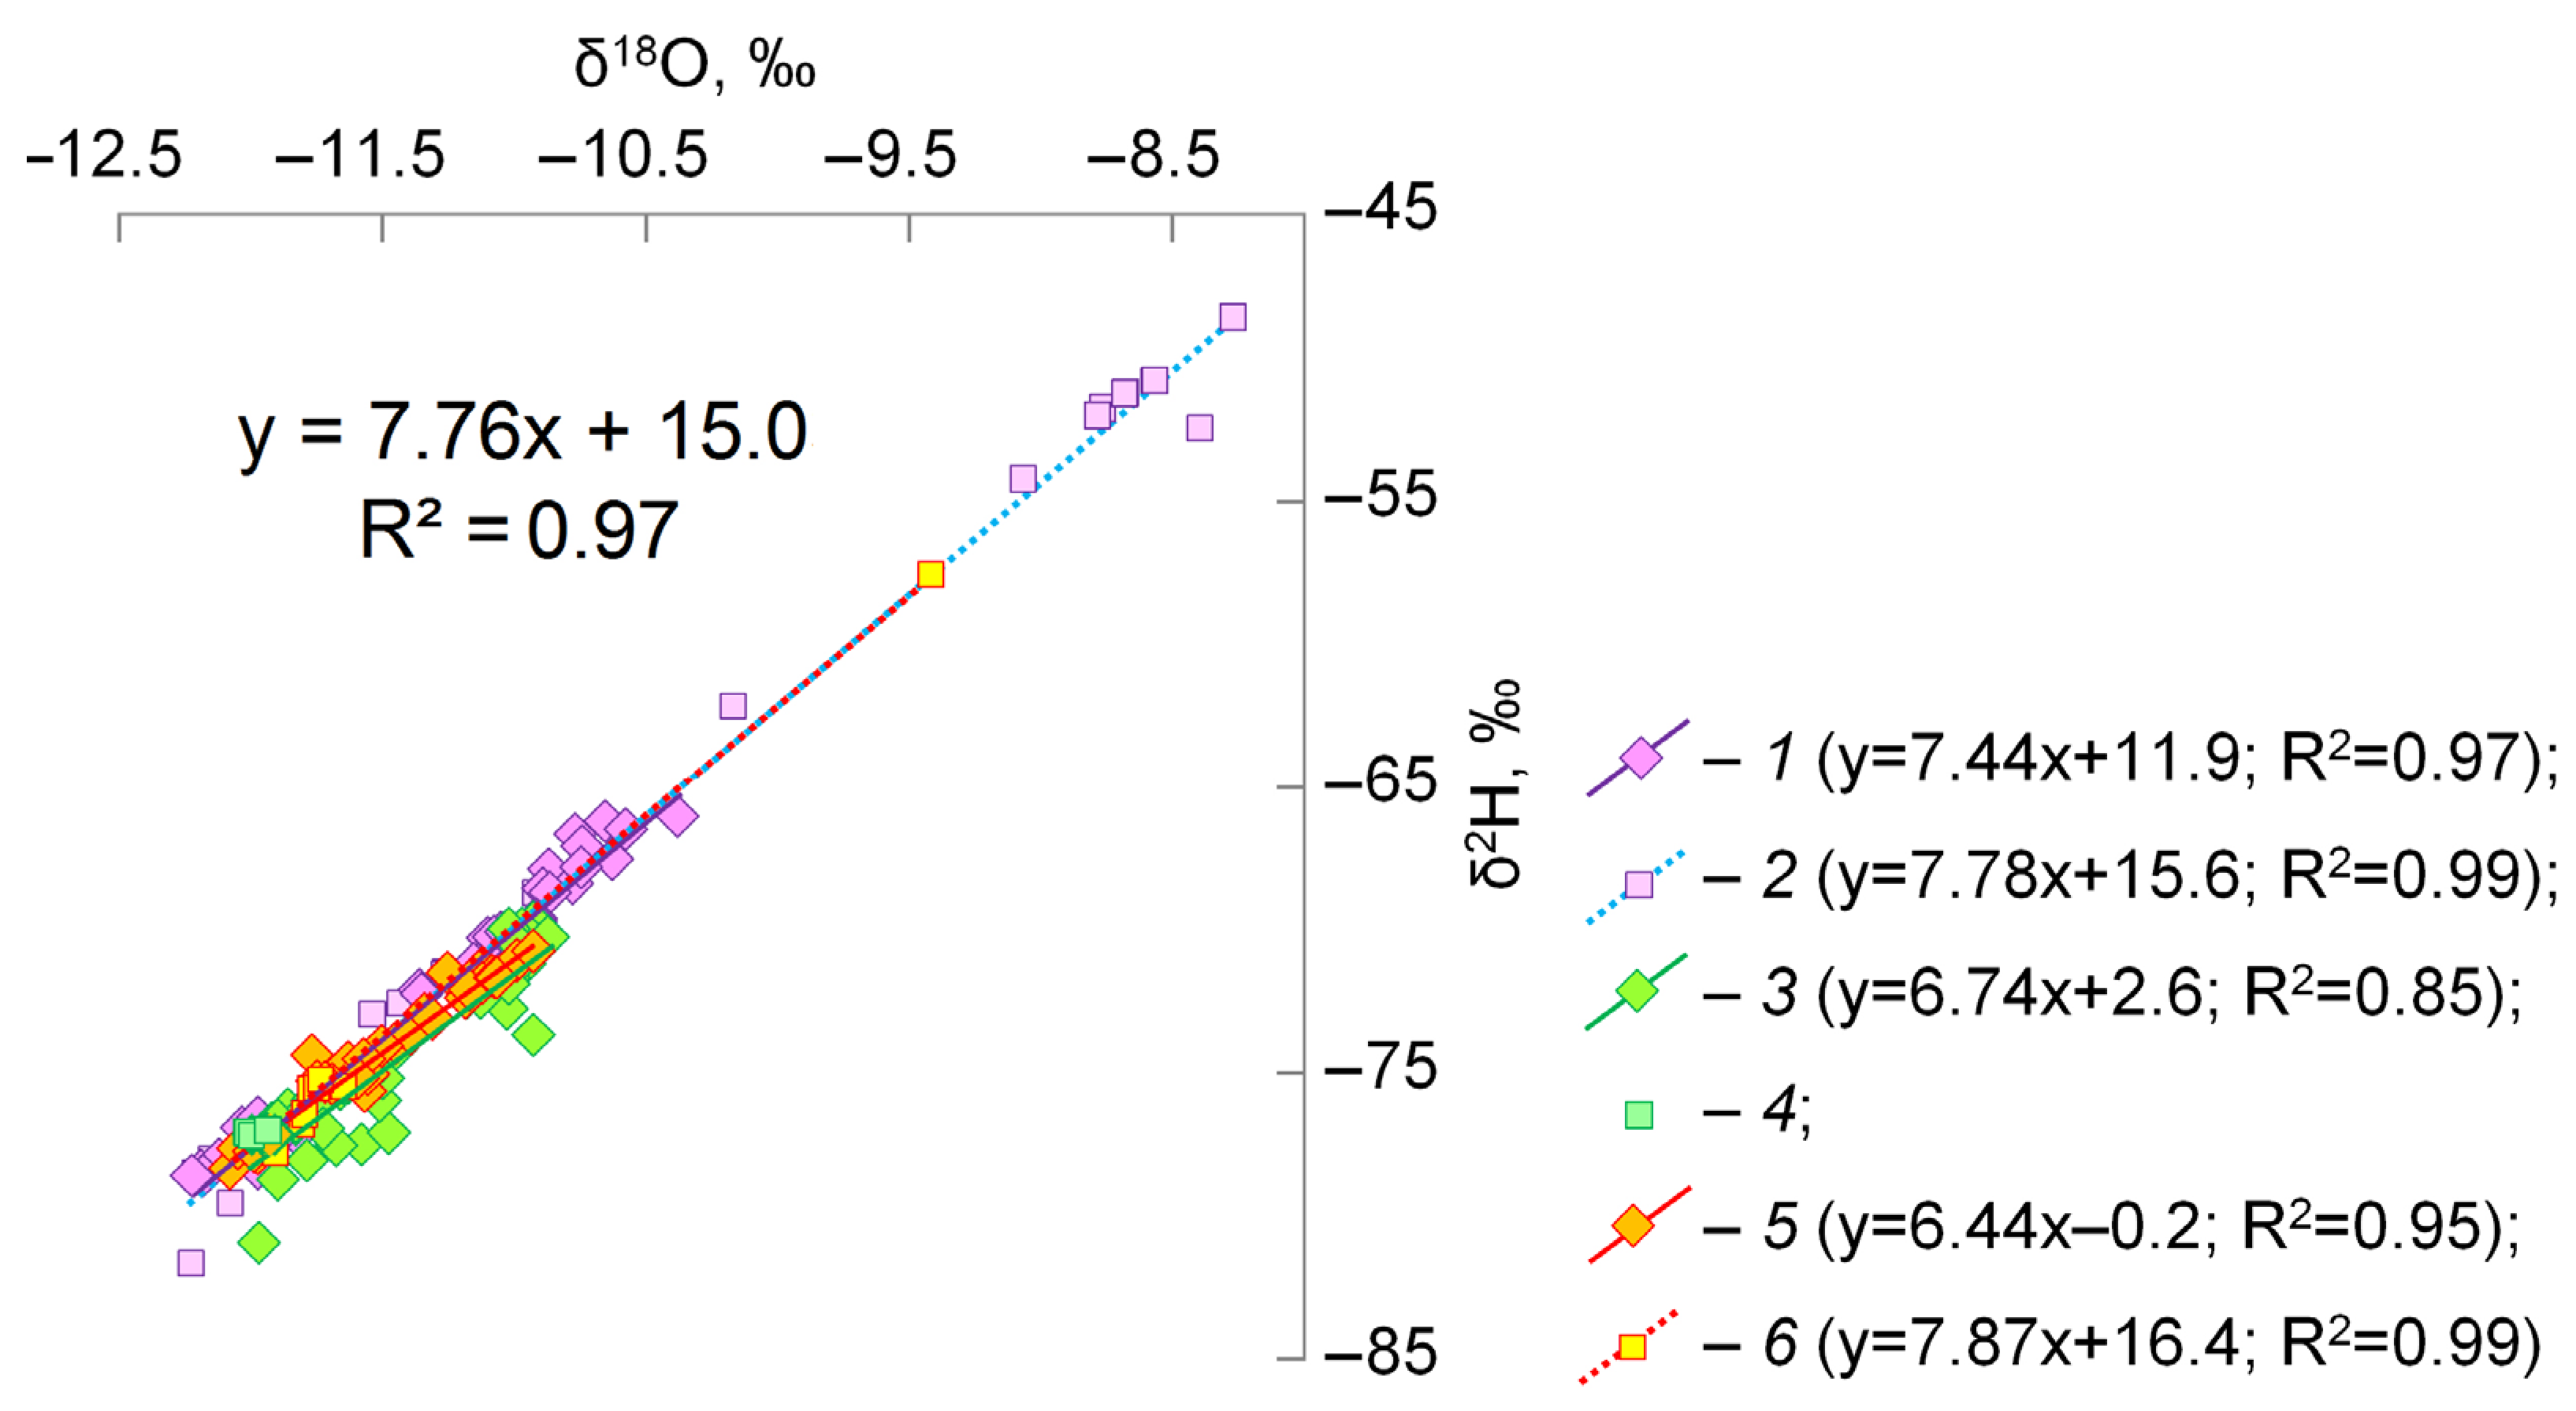
Figure 8 presents the water isotopic composition results of the Ala-Archa River during three sampling periods: 15–20 September 2022; 20–25 April 2023; and 29 August–6 September 2023.
The equation for the approximation line for the whole data is as follows:
δ2H = 7.76 × δ18O + 15.03 (R² = 0.97),
which closely resembles the equation for the local meteoric water line obtained in the following [78]:
δ2H = 7.53 × δ18O + 8.78 (R² = 0.97).
The angular coefficient of the data approximation line for the main water flow in the Ala Archa River decreased from 7.44 in autumn 2022 to 6.44 in autumn 2023. The angular coefficient for diffuse flow water in the glaciation zone remained more stable, at 7.78 and 7.87, respectively. This trend may be due to evaporation and lower water runoff during the warmer summer of 2023 compared to summer 2022.
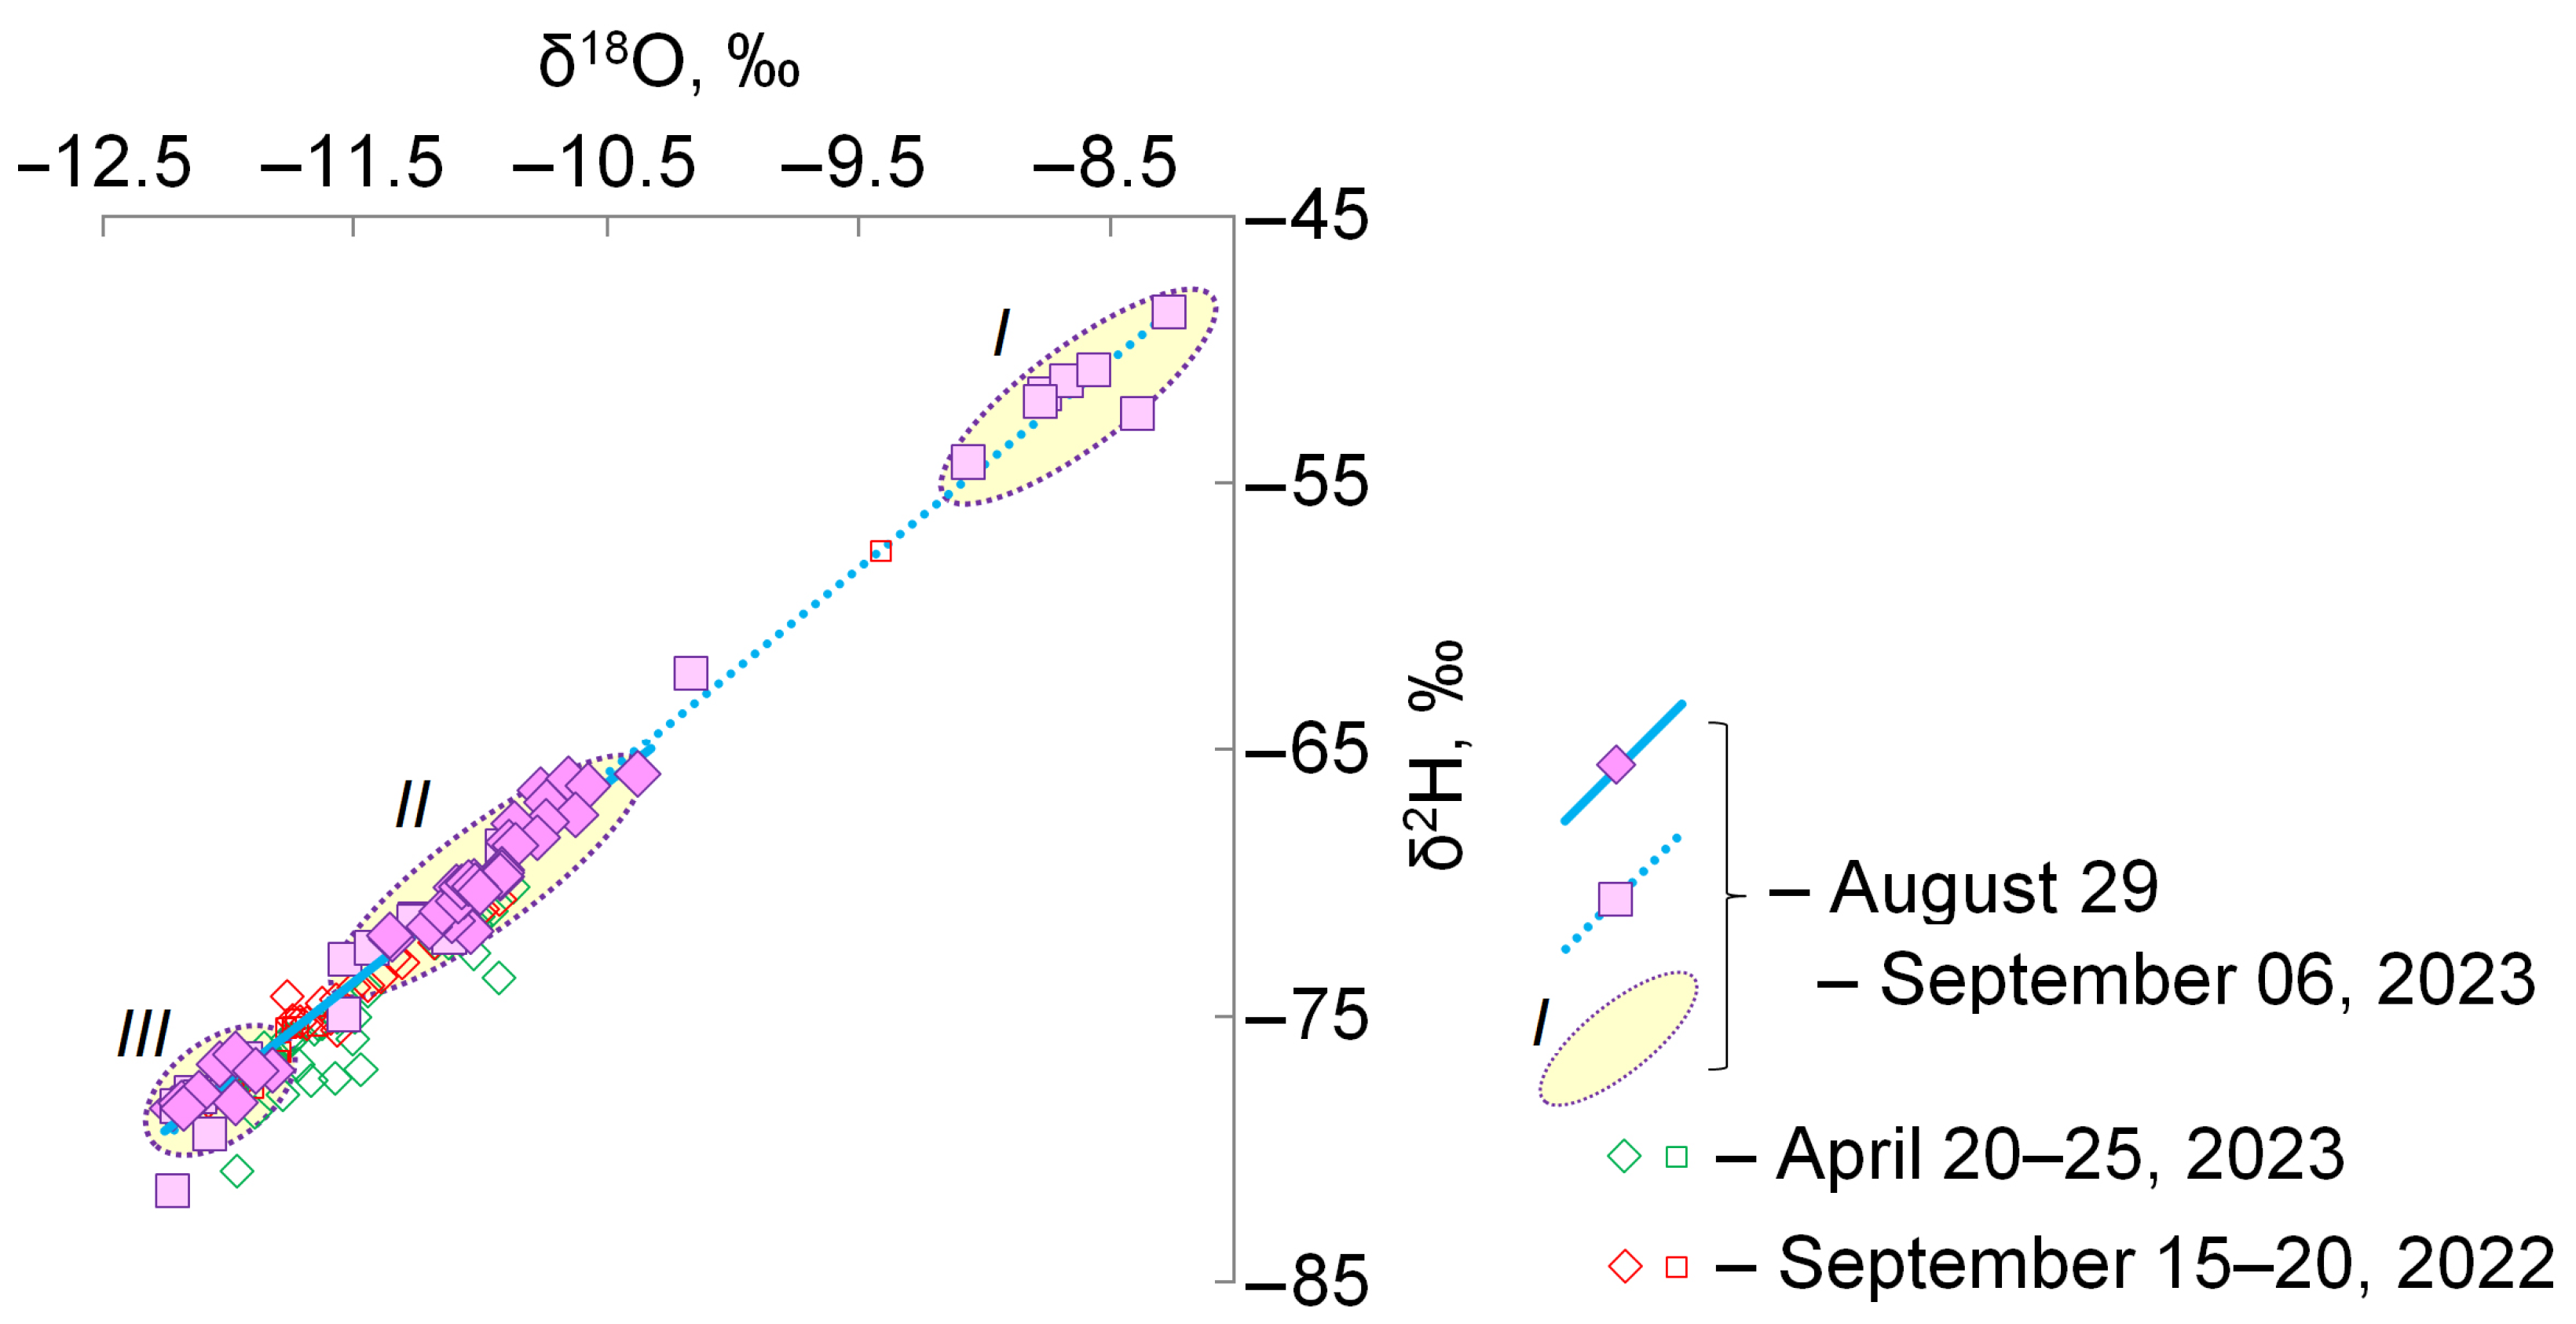
The results of the autumn 2023 work, which included the most detailed sampling, allow us to divide the isotopic composition data for the Ala-Archa River flow into three groups on δ2H vs. δ18O diagram (hereafter following the isotopic depletion of the water, Figure 9).
  • The least populated area with relatively isotopically heavy compositions of water from δ18O = −8.26‰ and δ2H = −48.6‰ to δ18O = −9.06‰ and δ2H = −54.3‰ is represented exclusively by water from the diffuse runoff in the glaciation zone above 3000 m (Figure 10), which contradicts the assumption about the progressive depletion of the isotopic composition of precipitation with increasing elevations of the terrain, as all other samples in the altitude interval 1500–3000 m demonstrate a more depleted isotope composition of hydrogen and oxygen.
  • The most populated region with a relatively depleted isotope composition of water ranging from δ18O = −10.37‰ and δ2H = −66.1‰ to δ18O = −11.53‰ and δ2H = −73.0‰ is generally represented by the river water from the main channel in the lower and middle reaches and partially by the diffuse runoff in the upper part of the basin due to small tributary inflow in the main stream of the Ala-Archa River (Figure 10).
  • Water with the most depleted isotope composition from δ18O = −11.90‰ and δ2H = −77.2‰ to δ18O = −12.07‰ and δ2H = −79.6‰ is only found in the glaciation zone (above altitude 2900 m, Figure 10), and these samples were taken from the main channel (where the main flow of the Ala-Archa River acquires a tree-like and multi-branch structure) and from the diffuse runoff.
The isotopic composition of water in the Ala-Archa River is visibly dependent on terrain altitude, especially for the samples taken in autumn 2022 and winter 2023 (Figure 10). However, this relationship is not linear, as suggested by He et al. [78]. The isotopic composition of the river water appears to remain relatively stable up to a height of approximately 2100 m. In autumn 2022 and winter 2023, at altitudes between 2100 and 2700 m, the isotopic composition of the river water, in terms of the δ18O parameter, depleted in steps of about 0.11‰ per 100 m of altitude. In autumn 2022, at an altitude above 2700 m, an anomalous isotope weighting of the oxygen is observed, which is clearly visible both in the diffuse flow and in the main channel water. In winter 2023, above a 2700 m altitude, this anomaly disappears, and the change in the isotopic composition of the water is chaotic within relatively small limits.
In autumn 2023, the isotopic composition of water in the Ala-Archa River had an inverse dependence on the altitude up to approximately 2500 m, as compared to previous records (Figure 8). Starting at an altitude of 2500 m, the isotopic composition of water in the Ala-Archa River becomes lighter with a step of 0.21‰ per 100 m of altitude for δ18O, which is much more than that calculated in [78]. In autumn 2023, the sampling of the diffuse flow in the glaciated zone of the Ala-Archa River basin showed a significant anomaly in the water isotope composition towards enrichment by 18O.

5. Discussion

It was expected that meltwater from the modern glaciation and seasonal snow should have depleted isotopic compositions (about δ18O = −12.79…−11.50‰ and δ2H = −79.1…−72.1‰ for the Ala-Archa river) and very low salinity (EC = 8–50 μS/cm) and temperature (t < 3 °C), as it follows from theories and the natural data for this region [76,78]. Actually, by direct sampling, a discrepancy between the behaviors of the isotopic composition of water in the Ala-Archa River and the terrain altitude (Figure 10) was found that requires explanation.

5.1. Anomaly in the Isotopic Composition of the River Water

The causes of the heavy isotopic composition anomaly in water from the main river channel and diffuse runoff in the glaciated zone of the basin are most easily identified (Figure 3 and Figure 4). Two outcrops of the buried ice beneath 3–15 m thick moraine deposits were sampled at altitudes of 3050 and 3290 m. The isotopic compositions of these buried ice were δ18O = −8.13‰ и δ2H = −48.7‰, and δ18O = −8.82‰ и δ2H = −53.7‰, respectively. Therefore, the anomaly of the heavy water isotopic composition in the diffuse flow in the upper reaches of the Ala-Archa River is most accurate to attribute to the melting of the buried ice.
The contribution of the isotopically heavy component to the flow of the Ala-Archa River, resulting from the melting of buried ice, is more noticeable in autumn 2023 (Figure 11). This is most likely due to the sum of the mean daily temperatures for 45 days preceding the 2023 survey, which was +273 °C compared to +231 °C in 2022 (data for the Alpine camp station). The increase in the accumulated heat reserve in the moraine sediments led to more intensive melting of the buried ice.
The appearance of ice with an anomalously heavy isotopic composition at relatively high altitudes can be explained by the following:
  • Freezing of rainwater in the cold clastic rock massif in late spring or early summer (the composition of summer rain at the “Alpine camp” point at an altitude of 2100 m reaches δ18O = −0.06‰, Table 1).
  • Detection of ice formed in one of the previous warmer climatic periods and subsequently buried under the massif of clastic sediments.
The first hypothesis is contradicted by our observations in the upper reaches of the Naryn River (runoff from the Petrov Glacier [97]). These observations indicate that in the spring, only the partial freezing of rainwater occurs as it penetrates through coarse clastic material with a negative temperature. There is disequilibrium fractionation of the isotopic composition of the newly formed ice during this process. As a result, the isotopic composition of this ice becomes heavier compared to the initial composition of rainwater. In the δ2H vs. δ18O diagram, this process is visible as a shift of the figurative points to the right from their initial position on the meteoric water line. In the case of the Ala-Archa River basin, there is no significant displacement of the isotopic composition points of buried ice relative to the local meteoric water line (LMWL).
The impact of the meltwater from the buried ice on the isotopic composition and physicochemical properties of water in the diffuse runoff in the upper reaches of the Ala-Archa River is supported by its temperature and electrical conductivity (Figure 11 and Figure 12).
In autumn 2022 and 2023, the diffuse runoff with a heavier isotopic composition (δ18O > −10‰) had elevated salinity (EC = 130–181 μS/cm), which is close to groundwater (Figure 11, Table 1). Diffuse runoff with a depleted composition (δ18O < −10‰) had significantly lower salinity (EC < 25–60 μS/cm), which is close to meltwater from the modern glaciation and seasonal snow.
In the late winter of 2023 (18–25 April 2023, Figure 11), the number of outlets of the diffuse runoff decreased significantly due to the freezing of the mountain massif. In other cases, the isotopic composition of the water streams varied within a narrow range (δ18O = −12.00…−11.91‰) and was similar to the meltwater of the modern glacier and seasonal snow. The electrical conductivity of this water slightly increased compared to the autumn period (EC = 69–75 μS/cm), which is most likely due to the increased contribution of groundwater.
In autumn 2022, the diffuse runoff with a heavy isotopic composition (δ18O > −10‰) had a lower water temperature (t = +1.1 °C, Figure 12) compared to the water of the diffuse runoff (t = +2.7 °C) with a depleted isotopic composition (δ18O < −10‰). In autumn 2023, the water temperature (t = +4.6 °C, on average) in the diffuse runoff with a heavy isotopic composition (δ18O > −10‰) was slightly higher than the water temperature (t = +3.7 °C, on average) of the diffuse runoff with a depleted isotopic composition (δ18O < −10‰). This may be a result of the related warmer summer of 2023 (as mentioned earlier) and also due to the higher average air temperature found during the survey. At the Alpine camp station in autumn 2022, the daily temperature was +2.8 °C, and in autumn 2023, it was +3.5 °C. If the meltwater from the modern glacier and seasonal snow dominated the diffuse runoff (δ18O < −10‰), then the water temperature corresponded to the current meteorological conditions. In contrast, the water of the diffuse runoff with a heavy isotopic composition (δ18O > −10‰) reflects the sum of the summer temperatures accumulated by the massif of the moraine sediment.
Therefore, it can be inferred that the runoff in the glaciation zone of the Ala-Archa River, the water with the heavy isotopic composition (δ18O > −10‰), has the contribution of the meltwater from the buried ice (δ18O = −8.82...−8.13‰). During the migration of this water towards the main channel, it can absorb salts from the host rocks and sediments, resulting in an increase in the electrical conductivity of the water. The electrical conductivity of this water ranges from 130 to 181 μS/cm, which is higher than the electrical conductivity of meltwater from modern glaciation and seasonal snow, which ranges from 8 to 50 μS/cm. In winter, melting of the ground ice stops, and the diffuse runoff with a heavy isotopic composition disappears.

5.2. Variations in the Isotopic Composition of Water in the Main Stream of the Ala-Archa River

During autumn 2022 and 2023, the electrical conductivity of water (EC = 48–112 μS/cm, in average 69 μS/cm) and the isotopic composition of water (δ18O = −12.22...−10.4‰, in average δ18O = −11.18‰) in the main stream of the Ala-Archa River were close to the weighted annual precipitation (Table 1), with a notable contribution of meltwater from the modern glaciation and seasonal snow (δ18O = −12.79...−11.50‰). In winter 2023, the electrical conductivity of water in the Ala-Archa River significantly increased (EC = 67–171 μS/cm, on average 119 μS/cm), which was likely due to a growth in groundwater abundance, which has a high salt content (EC = 70–167 μS/cm, Table 1).
The river water at the end of winter 2023 is separated into two groups by isotopic composition and electrical conductivity, which is apparently a result of the variation in the mixing proportions of the precipitation and groundwater (Figure 10, Figure 11 and Figure 12). Generally, all water samples collected during this period have a light isotopic composition (δ18O < −10‰). However, at altitudes up to about 2100 m in the river, water is clearly dominant in the groundwater discharge, as indicated by the high conductivity (EC = 112–171 μS/cm) and temperature (t = 5.8–9.4 °C, Figure 13 and Figure 14). As the groundwater integrates the recharge water from various periods throughout the year, its isotope composition (δ18O = −11.2...−10.9‰) is similar to precipitation, as shown in Table 1.
Above 2100 m after the inflow of the large tributary, the Adygene River, the isotopic composition of the river water becomes significantly depleted (δ18O = −12.1...−11.5‰). In this area, a decrease in the electrical conductivity of water (EC = 61–111 μS/cm) and a wide range of water temperature fluctuations, generally with low values, are observed (t = 0.8–6.1 °C, Figure 13 and Figure 14). This suggests that the contribution of glacial meltwater and snow water from the moraine–glacial complex in the upper reaches of the Ala-Archa River begins to play a significant role in the river runoff.
Based on the water temperature trend in the Ala-Archa River for autumn 2022 and 2023 (Figure 13), it can be used to rough estimate the position of the snow line (t = 0 °C) as an elevation of approximately 3300 m, which is consistent with remote observations. The distribution of the water temperature in the main stream along with the mountain height is not linear, as are other parameters. This is most clearly reflected in the results from the autumn 2023 sampling campaign. Between altitudes of 0 and 2100 m, there is a linear decrease in temperature. However, above the Adygene River mouth, there is a sharp increase in the water temperature (Figure 12, 29 August–6 September 2023). As the altitude increases above 2300 m, there is, again, an almost linear decrease in the water temperature. During the autumn 2023 survey, an unusually high temperature was found in the river water at altitudes of 3000–3100 m for the diffuse flow. For the sapling time, the background temperature for these elevations can be estimated at approximately 3.2 °C from the meteorological data, but in individual small streams, it reaches a value of approximately 7.0 °C. Maybe the solar heating appears to have an effect, as all flows with water temperatures above 4.0 °C have a flow rate of less than 0.3 L/s.
Water conductivity varies almost linearly over the entire range of the investigated altitudes, behaving more conservatively than the isotopic composition and temperature of water (Figure 10, Figure 13 and Figure 14). In the autumn of 2022 and the late winter of 2023, there is a linear decrease in the water conductivity up to altitudes of about 2700 m, but in different ranges (Figure 14). Water conductivities decrease from 110 to 50 μS/cm during the autumn of 2022 and from 170 to 67 μS/cm during the winter of 2023, indicating the decreasing contribution of groundwater discharge. At altitudes above 2700 m in the autumn of 2022 and the winter of 2023, there is either stabilization or a slight increase in the electrical conductivity of water. This is likely due to the influence of the component, which is associated with the melting of buried ice.
The non-linear changes in the water’s electrical conductivity with altitude were most distinct during autumn 2023 (Figure 14). A noticeable decrease in the water’s electrical conductivity from 105 to 70 μS/cm was observed at altitudes up to about 2100 m. From altitudes of 2100 m up to elevations of about 3000 m, the conductivity stabilized at values of 50–68 μS/cm. In the diffuse flow zone, the water’s electrical conductivity varied dramatically, with increases of up to 140–180 μS/cm in the small streams. Changes in the water’s electrical conductivity are consistent with the results of the runoff component analyses derived from the water isotopic compositions. They are also consistent with the sharp increase in the contribution of the melt component from the buried ice at the end of the anomalously warm summer of 2023.

6. Conclusions

The Ala-Archa River is a small mountain river with glaciation on the northern slope of the Kyrgyz Range in the western part of the Tien Shan (Central Asia). The study involved measuring the water isotopic composition (δ18O and δ2H), field measurements of the electrical conductivity, and the temperature of the water. A total of 284 measurements of isotope and physicochemical parameters of water in the main stream of the Ala-Archa River were taken for the following three separate periods: 15–20 September 2022; 20–25 April 2023; and 29 August–6 September 2023.
The diurnal variation in the isotope and chemical parameters was studied, and it was found that they can be disregarded when compared to the whole basin characteristic variations.
Seasonal and interannual variations in the isotopic composition, electrical conductivity, and temperature of water are significant. For the main stream of the river and also the diffuse flow in the upper part of the basin, they reflect an increased abundance in the groundwater during the cold period of the year and an increase in the glacial supply during the warm period of the year.
The isotopic composition and electrical conductivity of water demonstrate that the contributions of groundwater to the Ala-Archa River runoff decrease with altitude. Isotope tracers indicate that groundwater reserves are replenished through the infiltration of atmospheric precipitation, which has a nearly identical isotopic composition to groundwater.
Based on variations in the isotopic composition and electrical conductivity of water in the Ala-Archa River, the following two specific components, which are significant for the river runoff formation in the glaciation zone of the basin, were identified:
  • Meltwater from modern glaciation and seasonal snows.
  • An anomalous component associated with the melting of buried ice at altitudes above 3000 m was not previously identified.
The contribution of this anomalous component to the flow of the Ala-Archa River sharply increased during the anomalously warm summer of 2023.

Author Contributions

All authors contributed to the study conception and design. Conceptualization, validation, and writing—original draft preparation are performed by I.T., E.Y., S.E. and T.T. Methodology was performed by E.Y., I.T., S.D. and A.P. Formal analysis and investigation were performed by E.Y., I.T., S.D. and A.P. Writing—review and editing were performed by I.T. and E.Y. Funding acquisition were performed by E.Y and I.T. Project administration and resources were performed by E.Y. and I.T. Supervision and visualization were performed by E.Y. and I.T. All authors have read and agreed to the published version of the manuscript.

Funding

The work was supported by the Russian Science Foundation grant No. 20-77-10057 “Diagnostics of permafrost degradation based on isotope indicators (234U/238U, 18O+2H, 13C+14C)”. Isotope analysis was performed at the Center for X-Ray Diffraction Studies of the Research Park of St. Petersburg State University (Russia) within the project AAAA-A19-119091190094-6.

Data Availability Statement

The datasets presented in this study can be obtained upon request to the corresponding author.

Acknowledgments

The authors thank everyone who provided support in conducting field research.

Conflicts of Interest

The authors declare no conflicts of interest.

References

  1. Guse, B.; Pfannerstill, M.; Gafurov, A.; Fohrer, N.; Gupta, H. Demasking the integrated information of discharge—Advancing sensitivity analysis to consider different hydrological components and their rates of change. Water Resour. Res. 2016, 52, 8724–8743. [Google Scholar] [CrossRef]
  2. Nearing, G.S.; Gupta, H.V. The quantity and quality of information in hydrologic models. Water Resour. Res. 2015, 51, 524–538. [Google Scholar] [CrossRef]
  3. Rets, E.P.; Popovnin, V.V.; Toropov, P.A.; Smirnov, A.M.; Tokarev, I.V.; Chizhova, J.N.; Budantseva, N.A.; Vasil’chuk, Y.K.; Kireeva, M.B.; Ekaykin, A.A.; et al. Djankuat Glacier Station in the North Caucasus, Russia: A Database of complex glaciological, hydrological, meteorological observations and stable isotopes sampling results during 2007–2017. Earth Syst. Sci. Data Discuss. 2019, 11, 1463–1481. [Google Scholar] [CrossRef]
  4. Reusser, D.; Blume, T.; Schaefli, B.; Zehe, E. Analysing the temporal dynamics of model performance for hydrological models. Hydrol. Earth Syst. Sci. 2009, 13, 999–1018. [Google Scholar] [CrossRef]
  5. Hingray, B.; Schaefli, B.; Mezghani, A.; Hamdi, Y. Signature-based model calibration for hydrological prediction in mesoscale Alpine catchments. Hydrol. Sci. J. 2010, 55, 1002–1016. [Google Scholar] [CrossRef]
  6. Schaefli, B.; Hingray, B.; Niggli, M.; Musy, A. A conceptual glacio-hydrological model for high mountainous catchments. Hydrol. Earth Syst. Sci. 2005, 9, 95–109. [Google Scholar] [CrossRef]
  7. Soulsby, C.; Birkel, C.; Geris, J.; Dick, J.; Tunaley, C.; Tetzlaff, D. Stream water age distributions controlled by storage dynamics and nonlinear hydrologic connectivity: Modeling with high-resolution isotope data. Water Resour. Res. 2015, 51, 7759–7776. [Google Scholar] [CrossRef] [PubMed]
  8. Richter, B.D.; Baumgartner, J.V.; Powell, J.; Braun, D.P. A method for assessing hydrologic alteration within ecosystems. Conserv. Biol. 1996, 10, 1163–1174. [Google Scholar] [CrossRef]
  9. Fovet, O.; Ruiz, L.; Hrachowitz, M.; Faucheux, M.; Gascuel-Odoux, C. Hydrological hysteresis and its value for assessing process consistency in catchment conceptual models. Hydrol. Earth Syst. Sci. 2015, 19, 105–123. [Google Scholar] [CrossRef]
  10. Gupta, H.V.; Wagener, T.; Liu, Y.Q. Reconciling theory with observations: Elements of a diagnostic approach to model evaluation. Hydrol. Process. 2008, 22, 3802–3813. [Google Scholar] [CrossRef]
  11. Hrachowitz, M.; Savenije, H.; Bogaard, T.A.; Tetzlaff, D.; Soulsby, C. What can flux tracking teach us about water age distribution patterns and their temporal dynamics? Hydrol. Earth Syst. Sci. 2013, 17, 533–564. [Google Scholar] [CrossRef]
  12. Sivapalan, M.; Blöschl, G.; Zhang, L.; Vertessy, R. Downward approach to hydrological prediction. Hydrol. Process. 2003, 17, 2101–2111. [Google Scholar] [CrossRef]
  13. Boyle, D.P.; Gupta, H.V.; Sorooshian, S. Toward improved calibration of hydrologic models: Combining the strengths of manual and automatic methods. Water Resour. Res. 2000, 36, 3663–3674. [Google Scholar] [CrossRef]
  14. Hay, L.E.; Leavesley, G.H.; Clark, M.P.; Markstrom, S.L.; Viger, R.J.; Umemoto, M. Step wise, multiple objective calibration of a hydrologic model for a snowmelt dominated basin. J. Am. Water Resour. Assoc. 2006, 42, 877–890. [Google Scholar] [CrossRef]
  15. Willems, P. Parsimonious rainfall-runoff model construction supported by time series processing and validation of hydrological extremes—Part 1: Step-wise model-structure identification and calibration approach. J. Hydrol. 2014, 510, 578–590. [Google Scholar] [CrossRef]
  16. Jothityangkoon, C.; Sivapalan, M.; Farmer, D.L. Process controls of water balance variability in a large semi-arid catchment: Downward approach to hydrological model development. J. Hydrol. 2001, 254, 174–198. [Google Scholar] [CrossRef]
  17. Liucci, L.; Valigi, D.; Casadei, S. A new application of flow duration curve (FDC) in designing run-of-river power plants. Water Resour. Manag. 2014, 28, 881–895. [Google Scholar] [CrossRef]
  18. Luo, Y.; Arnold, J.; Allen, P.; Chen, X. Baseflow simulation using SWAT model in an inland river basin in Tianshan Mountains, Northwest China. Hydrol. Earth Syst. Sci. 2012, 16, 1259–1267. [Google Scholar] [CrossRef]
  19. Ye, S.; Yaeger, M.; Coopersmith, E.; Cheng, L.; Sivapalan, M. Exploring the physical controls of regional patterns of flow duration curves-Part 2: Role of seasonality, the regime curve, and associated process controls. Hydrol. Earth Syst. Sci. 2012, 16, 4447–4465. [Google Scholar] [CrossRef]
  20. Coxon, G.; Freer, J.; Wagener, T.; Odoni, N.A.; Clark, M. Diagnostic evaluation of multiple hypotheses of hydrological behaviour in a limits-of-acceptability framework for 24 UK catchments. Hydrol. Process. 2014, 28, 6135–6150. [Google Scholar] [CrossRef]
  21. Shafii, M.; Tolson, B.A. Optimizing hydrological consistency by incorporating hydrological signatures into model calibration objectives. Water Resour. Res. 2015, 51, 3796–3814. [Google Scholar] [CrossRef]
  22. Finger, D.; Vis, M.; Huss, M.; Seibert, J. The value of multiple data set calibration versus model complexity for improving the performance of hydrological models in mountain catchments. Water Resour. Res. 2015, 51, 1939–1958. [Google Scholar] [CrossRef]
  23. Tarasova, L.; Knoche, M.; Dietrich, J.; Merz, R. Effects of input discretization, model complexity, and calibration strategy on model performance in a data-scarce glacierized catchment in Central Asia. Water Resour. Res. 2016, 52, 4674–4699. [Google Scholar] [CrossRef]
  24. Singh, S.K.; Bardossy, A. Calibration of hydrological models on hydrologically unusual events. Adv. Water Resour. 2012, 38, 81–91. [Google Scholar] [CrossRef]
  25. Duethmann, D.; Zimmer, J.; Gafurov, A.; Guntner, A.; Kriegel, D.; Merz, B.; Vorogushyn, S. Evaluation of areal precipitation estimates based on downscaled reanalysis and station data by hydrological modelling. Hydrol. Earth Syst. Sci. 2013, 17, 2415–2434. [Google Scholar] [CrossRef]
  26. Immerzeel, W.W.; Wanders, N.; Lutz, A.F.; Shea, J.M.; Bierkens, M.F.P. Reconciling high-altitude precipitation in the upper Indus basin with glacier mass balances and runoff. Hydrol. Earth Syst. Sci. 2015, 19, 4673–4687. [Google Scholar] [CrossRef]
  27. Pfannerstill, M.; Guse, B.; Fohrer, N. Smart low flow signature metrics for an improved overall performance evaluation of hydrological models. J. Hydrol. 2014, 510, 447–458. [Google Scholar] [CrossRef]
  28. Razavi, S.; Tolson, B.A. An efficient framework for hydrologic model calibration on long data periods. Water Resour. Res. 2013, 49, 8418–8431. [Google Scholar] [CrossRef]
  29. Konz, M.; Seibert, J. On the value of glacier mass balances for hydrological model calibration. J. Hydrol. 2010, 385, 238–246. [Google Scholar] [CrossRef]
  30. Le Lay, M.; Saulnier, G.M.; Galle, S.; Seguis, L.; Metadier, M.; Peugeot, C. Model representation of the Sudanian hydrological processes: Application on the Donga catchment (Benin). J. Hydrol. 2008, 363, 32–41. [Google Scholar] [CrossRef]
  31. Madsen, H. Automatic calibration of a conceptual rainfall-runoff model using multiple objectives. J. Hydrol. 2000, 235, 276–288. [Google Scholar] [CrossRef]
  32. Seibert, J.; McDonnell, J.J. On the dialog between experimentalist and modeler in catchment hydrology: Use of soft data for multicriteria model calibration. Water Resour. Res. 2002, 38, 1241. [Google Scholar] [CrossRef]
  33. Efstratiadis, A.; Koutsoyiannis, D. One decade of multi-objective calibration approaches in hydrological modelling: A review. Hydrol. Sci. J. 2010, 55, 58–78. [Google Scholar] [CrossRef]
  34. Parajka, J.; Naeimi, V.; Bloschl, G.; Komma, J. Matching ERS scatterometer based soil moisture patterns with simulations of a conceptual dual layer hydrologic model over Austria. Hydrol. Earth Syst. Sci. 2009, 13, 259–271. [Google Scholar] [CrossRef]
  35. Seibert, J. Multi-dataset calibration of a conceptual runoff model using a genetic algorithm. Hydrol. Earth Syst. Sci. 2000, 4, 215–224. [Google Scholar] [CrossRef]
  36. Gafurov, A.; Lüdtke, S.; Unger-Shayesteh, K.; Vorogushyn, S.; Schöne, T.; Schmidt, S.; Kalashnikova, O.; Merz, B. MODSNOW-Tool: An operational tool for daily snow cover monitoring using MODIS data. Environ. Earth Sci. 2016, 75, 1078. [Google Scholar] [CrossRef]
  37. Parajka, J.; Blöschl, G. The value of MODIS snow cover data in validating and calibrating conceptual hydrologic models. J. Hydrol. 2008, 358, 240–258. [Google Scholar] [CrossRef]
  38. Parajka, J.; Blöschl, G. Spatio-temporal combination of MODIS images-Potential for snow cover mapping. Water Resour. Res. 2008, 44, W03406. [Google Scholar] [CrossRef]
  39. Duethmann, D.; Peters, J.; Blume, T.; Vorogushyn, S.; Güntner, A. The value of satellite- derived snow cover images for calibrating a hydrological model in snow-dominated catchments in Central Asia. Water Resour. Res. 2014, 50, 2002–2021. [Google Scholar] [CrossRef]
  40. Peters, J.; Bolch, T.; Gafurov, A.; Prechtel, N. Snow cover distribution in the Aksu Catchment (Central Tien Shan) 1986–2013 based on AVHRR and MODIS data. IEEE J. Sel. Top. Appl. Earth Obs. Remote Sens. 2015, 8, 5361–5375. [Google Scholar] [CrossRef]
  41. Zhou, H.; Aizen, E.; Aizen, V. Deriving long term snow cover extent dataset from AVHRR and MODIS data: Central Asia case study. Remote Sens. Environ. 2013, 136, 146–162. [Google Scholar] [CrossRef]
  42. Huss, M. Extrapolating glacier mass balance to the mountain-range scale: The European Alps 1900–2100. Cryosphere 2012, 6, 713–727. [Google Scholar] [CrossRef]
  43. Aizen, V.B.; Kuzmichenok, V.A.; Surazakov, A.B.; Aizen, E.M. Glacier changes in the Tien Shan as determined from topographic and remotely sensed data. Glob. Planet. Chang. 2007, 56, 328–340. [Google Scholar] [CrossRef]
  44. Shangguan, D.H.; Bolch, T.; Ding, Y.J.; Krohnert, M.; Pieczonka, T.; Wetzel, H.U.; Liu, S.Y. Mass changes of Southern and Northern Inylchek Glacier, Central Tian Shan, Kyrgyzstan, during similar to 1975 and 2007 derived from remote sensing data. Cryosphere 2015, 9, 703–717. [Google Scholar] [CrossRef]
  45. Kääb, A.; Berthier, E.; Nuth, C.; Gardelle, J.; Arnaud, Y. Contrasting patterns of early twenty first-century glacier mass change in the Himalayas. Nature 2012, 488, 495–498. [Google Scholar] [CrossRef] [PubMed]
  46. Schaefli, B.; Huss, M. Integrating point glacier mass balance observations into hydrologic model identification. Hydrol. Earth Syst. Sci. 2011, 15, 1227–1241. [Google Scholar] [CrossRef]
  47. Mayr, E.; Hagg, W.; Mayer, C.; Braun, L. Calibrating a spatially distributed conceptual hydrological model using runoff, annual mass balance and winter mass balance. J. Hydrol. 2013, 478, 40–49. [Google Scholar] [CrossRef]
  48. Hamlet, A.F.; Mote, P.W.; Clark, M.P.; Lettenmaier, D.P. Effects of temperature and precipitation variability on snowpack trends in the western United States. J. Clim. 2005, 18, 4545–4561. [Google Scholar] [CrossRef]
  49. Farinotti, D.; Longuevergne, L.; Moholdt, G.; Duethmann, D.; Mölg, T.; Bolch, T.; Vorogushyn, S.; Güntner, A. Substantial glacier mass loss in the Tien Shan over the past 50 years. Nat. Geosci. 2015, 8, 716–722. [Google Scholar] [CrossRef]
  50. Chiogna, G.; Rolle, M.; Bellin, A.; Cirpka, O.A. Helicity and flow topology in three dimensional anisotropic porous media. Adv. Water Resour. 2014, 73, 134–143. [Google Scholar] [CrossRef]
  51. Dahlke, H.E.; Lyon, S.W.; Jansson, P.; Karlin, T.; Rosqvist, G. Isotopic investigation of runoff generation in a glacierized catchment in northern Sweden. Hydrol. Process. 2014, 28, 1383–1398. [Google Scholar] [CrossRef]
  52. Klaus, J.; McDonnell, J.J. Hydrograph separation using stable isotopes: Review and evaluation. J. Hydrol. 2013, 505, 47–64. [Google Scholar] [CrossRef]
  53. Li, X.G.; Williams, M.W. Snowmelt runoff modelling in an arid mountain watershed, Tarim Basin, China. Hydrol. Process. 2008, 22, 3931–3940. [Google Scholar] [CrossRef]
  54. Sun, Y.; Du, W.; Fu, P.; Wang, Q.; Li, J.; Ge, X.; Zhang, Q.; Zhu, C.; Ren, L.; Xu, W.; et al. Primary and secondary aerosols in Beijing in winter: Sources, variations and processes. Atmos. Chem. Phys. 2016, 16, 8309–8329. [Google Scholar] [CrossRef]
  55. Pu, T.; Qin, D.H.; Kang, S.C.; Niu, H.W.; He, Y.Q.; Wang, S.J. Water isotopes and hydrograph separation in different glacial catchments in the southeast margin of the Tibetan Plateau. Hydrol. Process. 2017, 31, 3810–3826. [Google Scholar] [CrossRef]
  56. Engel, M.; Penna, D.; Bertoldi, G.; Dell’Agnese, A.; Soulsby, C.; Comiti, F. Identifying run-off contributions during melt-induced run-off events in a glacierized alpine catchment. Hydrol. Process. 2016, 30, 343–364. [Google Scholar] [CrossRef]
  57. He, Z.H.; Parajka, J.; Tian, F.Q.; Blöschl, G. Estimating degree-day factors from MODIS for snowmelt runoff modeling. Hydrol. Earth Syst. Sci. 2014, 18, 4773–4789. [Google Scholar] [CrossRef]
  58. He, Z.H.; Tian, F.Q.; Gupta, H.V.; Hu, H.C.; Hu, H.P. Diagnostic calibration of a hydrological model in a mountain area by hydrograph partitioning. Hydrol. Earth Syst. Sci. 2015, 19, 1807–1826. [Google Scholar] [CrossRef]
  59. Joerin, C.; Iorgulescu, I.; Musy, A.; Beven, K.J. Uncertainty in hydrograph separations based on geochemical mixing models. J. Hydrol. 2002, 255, 90–106. [Google Scholar] [CrossRef]
  60. Rahman, K.; Besacier-Monbertrand, A.L.; Castella, E.; Lods-Crizet, B.; Ilg, C.; Beguin, O. Quantification of the daily dynamics of streamflow components in a small alpine watershed in Switzerland using end member mixing analysis. Environ. Earth Sci. 2015, 74, 4927. [Google Scholar] [CrossRef]
  61. Ala-aho, P.; Tetzlaff, D.; McNamara, J.P.; Laudon, H.; Soulsby, C. Using isotopes to constrain water flux and age estimates in snow-influenced catchments using the STARR (Spatially distributed Tracer-Aided Rainfall-Runoff) model. Hydrol. Earth Syst. Sci. 2017, 21, 5089–5110. [Google Scholar] [CrossRef]
  62. Bantcev, D.; Ganyushkin, D.; Terekhov, A.; Ekaykin, A.; Tokarev, I.; Chistyakov, K. Isotopic Composition of Glacier Ice and Meltwater in the Arid Parts of the Altai Mountains (Central Asia). Water 2022, 14, 252. [Google Scholar] [CrossRef]
  63. Birkel, C.; Dunn, S.M.; Tetzlaff, D.; Soulsby, C. Assessing the value of high-resolution isotope tracer data in the stepwise development of a lumped conceptual rainfall-runoff model. Hydrol. Process. 2010, 24, 2335–2348. [Google Scholar] [CrossRef]
  64. Soulsby, C.; Tetzlaff, D. Towards simple approaches for mean residence time estimation in ungauged basins using tracers and soil distributions. J. Hydrol. 2008, 363, 60–74. [Google Scholar] [CrossRef]
  65. van Huijgevoort, M.H.J.; Tetzlaff, D.; Sutanudjaja, E.H.; Soulsby, C. Using high resolution tracer data to constrain water storage, flux and age estimates in a spatially distributed rainfall-runoff model. Hydrol. Process. 2016, 30, 4761–4778. [Google Scholar] [CrossRef]
  66. Gudkov, A.V.; Tokarev, I.V.; Tolstikhin, I.N. The formation and balance of the atmospheric precipitations, surface water, and groundwater on the southern slopes of the Khibiny massif (based on data on the isotopic composition of oxygen and hydrogen). Water Resour. 2021, 48, 124–132. [Google Scholar] [CrossRef]
  67. Seibert, J.; Rodhe, A.; Bishop, K. Simulating interactions between saturated and unsaturated storage in a conceptual runoff model. Hydrol. Process. 2003, 17, 379–390. [Google Scholar] [CrossRef]
  68. Weiler, M.; McGlynn, B.L.; McGuire, K.J.; McDonnell, J.J. How does rainfall become runoff? A combined tracer and runoff transfer function approach. Water Resour. Res. 2003, 39, 1315. [Google Scholar] [CrossRef]
  69. Stadnyk, T.; St Amour, N.; Kouwen, N.; Edwards, T.W.D.; Pietroniro, A.; Gibson, J.J. A groundwater separation study in boreal wetland terrain: The WATFLOOD hydrological model compared with stable isotope tracers. Isotopes Environ. Health Stud. 2005, 41, 49–68. [Google Scholar] [CrossRef]
  70. Dunn, S.M.; Bacon, J.R. Assessing the value of Cl- and delta O-18 data in modelling the hydrological behaviour of a small upland catchment in northeast Scotland. Hydrol. Res. 2008, 39, 337–358. [Google Scholar] [CrossRef]
  71. Stadnyk, T.A.; Delavau, C.; Kouwen, N.; Edwards, T.W.D. Towards hydrological model calibration and validation: Simulation of stable water isotopes using the isoWATFLOOD model. Hydrol. Process. 2013, 27, 3791–3810. [Google Scholar] [CrossRef]
  72. Capell, R.; Tetzlaff, D.; Soulsby, C. Can time domain and source area tracers reduce uncertainty in rainfall-runoff models in larger heterogeneous catchments? Water Resour. Res. 2012, 48, W09544. [Google Scholar] [CrossRef]
  73. Tetzlaff, D.; Buttle, J.; Carey, S.K.; van Huijgevoort, M.H.J.; Laudon, H.; McNamara, J.P.; Mitchell, C.P.J.; Spence, C.; Gabor, R.S.; Soulsby, C. A preliminary assessment of water partitioning and ecohydrological coupling in northern headwaters using stable isotopes and conceptual runoff models. Hydrol. Process. 2015, 29, 5153–5173. [Google Scholar] [CrossRef] [PubMed]
  74. Penna, D.; Engel, M.; Bertoldi, G.; Comiti, F. Towards a tracer-based conceptualization of meltwater dynamics and streamflow response in a glacierized catchment. Hydrol. Earth Syst. Sci. 2017, 21, 23–41. [Google Scholar] [CrossRef]
  75. Maurya, A.S.; Shah, M.; Deshpande, R.D.; Bhardwaj, R.M.; Prasad, A.; Gupta, S.K. Hydrograph separation and precipitation source identification using stable water isotopes and conductivity: River Ganga at Himalayan foothills. Hydrol. Process. 2011, 25, 1521–1530. [Google Scholar] [CrossRef]
  76. He, Z.H.; Hu, H.C.; Tian, F.Q.; Ni, G.H.; Hu, Q.F. Correcting the TRMM rainfall product for hydrological modelling in sparsely-gauged mountainous basins. Hydrol. Sci. J. 2017, 62, 306–318. [Google Scholar] [CrossRef]
  77. He, Z.; Vorogushyn, S.; Unger-Shayesteh, K.; Gafurov, A.; Kalashnikova, O.; Omorova, E.; Merz, B. The value of hydrograph partitioning curves for calibrating hydrological models in glacierized basins. Water Resour. Res. 2018, 54, 2336–2361. [Google Scholar] [CrossRef]
  78. He, Z.; Unger-Shayesteh, K.; Vorogushyn, S.; Weise, S.M.; Duethmann, D.; Kalashnikova, O.; Gafurov, A.; Merz, B. Comparing Bayesian and traditional end-member mixing approaches for hydrograph separation in a glacierized basin. Hydrol. Earth Syst. Sci. 2020, 24, 3289–3309. [Google Scholar] [CrossRef]
  79. Stahl, K.; Moore, R.D.; Shea, J.M.; Hutchinson, D.; Cannon, A.J. Coupled modelling of glacier and streamflow response to future climate scenarios. Water Resour. Res. 2008, 44, W02422. [Google Scholar] [CrossRef]
  80. Shamov, V.V.; Tokarev, I.V.; Mikhaylik, T.A.; Kozachek, A.V. Dynamics of isotopic composition (2H, 18O) of waters of small river basins of the southern Sikhote-Alin in summer-autumn period. Hydrosphere Hazard. Process. Phenom. 2022, 4, 202–215. (In Russian) [Google Scholar]
  81. Aizen, V.B.; Aizen, E.M.; Melack, J.M. Climate, snow cover, glaciers, and runoff in the Tien-Shan, Central-Asia. Water Resour. Bull. 1995, 31, 1113–1129. [Google Scholar] [CrossRef]
  82. Aizen, V.B.; Aizen, E.M.; Melack, J.M. Precipitation, melt and runoff in the northern Tien Shan. J. Hydrol. 1996, 186, 229–251. [Google Scholar] [CrossRef]
  83. Aizen, V.B.; Mayewski, P.A.; Aizen, E.M.; Joswiak, D.R.; Surazakov, A.B.; Kaspari, S.; Grigholm, B.; Krachler, M.; Handley, M.; Finaev, A. Stable-isotope and trace element time series from Fedchenko glacier (pamirs) snow/firn cores. J. Glaciol. 2009, 55, 275–291. [Google Scholar] [CrossRef]
  84. Mikhalenko, V.N.; Kutuzov, S.S.; Lavrentiev, I.I.; Toropov, P.A.; Vladimirova, D.O.; Abramov, A.A.; Matskovsky, V.V. Glacioclimatological investigations of the Institute of Geography, RAS, in the crater of Eastern Summit of Mt. Elbrus in 2020. Ice Snow 2021, 61, 149–160. [Google Scholar] [CrossRef]
  85. Hoelzle, M.; Azisov, E.; Barandun, M.; Huss, M.; Farinotti, D.; Gafurov, A.; Hagg, W.; Kenzhebaev, R.; Kronenberg, M.; Machguth, H.; et al. Re-establishing glacier monitoring in Kyrgyzstan and Uzbekistan, Central Asia. Geosci. Instrum. Methods Data Syst. 2017, 6, 397. [Google Scholar] [CrossRef]
  86. Aizen, V.; Aizen, E.; Glazirin, G.; Loaiciga, H.A. Simulation of daily runoff in Central Asian alpine watersheds. J. Hydrol. 2000, 238, 15–34. [Google Scholar] [CrossRef]
  87. Kuzmichenok, V.A. Probabilistic assessment of possible evolution of glaciers and runoff of Kyrgyzstan under projected climate changes. Mater. Glaciol. Stud. 2009, 107, 10–24. [Google Scholar]
  88. Allen, S.T.; Kirchner, J.W.; Goldsmith, G.R. Predicting spatial patterns in precipitation isotope (δ2H and δ18O) seasonality using sinusoidal isoscapes. Geophys. Res. Lett. 2018, 45, 4859–4868. [Google Scholar] [CrossRef]
  89. Dalai, T.K.; Bhattacharya, S.K.; Krishnaswami, S. Stable isotopes in the source waters of the Yamuna and its tributaries: Seasonal and altitudinal variations and relation to major cations. Hydrol. Process. 2002, 16, 3345–3364. [Google Scholar] [CrossRef]
  90. Mark, B.G.; McKenzie, J.M. Tracing increasing tropical Andean glacier melt with stable isotopes in water. Environ. Sci. Technol. 2007, 41, 6955–6960. [Google Scholar] [CrossRef]
  91. Ohlanders, N.; Rodriguez, M.; McPhee, J. Stable water isotope variation in a Central Andean watershed dominated by glacier and snowmelt. Hydrol. Earth Syst. Sci. 2013, 17, 1035–1050. [Google Scholar] [CrossRef]
  92. Payne, B.R.; Leontiadis, J.; Dimitroulas, C. A study of the Kalamos springs in Greece with environmental isotopes. Water Resour. Res. 1978, 14, 653–658. [Google Scholar] [CrossRef]
  93. Vasil’chuk, Y.; Chizhova, J.; Frolova, N.; Budantseva, N.; Kireeva, M.; Oleynikov, A.; Tokarev, I.; Rets, E.; Vasil’chuk, A. A variation of stable isotope composition of snow with altitude on the Elbrus mountain, Central Caucasus. Geogr. Environ. Sustain. 2020, 13, 172–182. [Google Scholar] [CrossRef]
  94. Lorenz, J.M.; Tarbox, L.; Buck, B.; Qi, H.; Coplen, T.B. Biscayne aquifer drinking water (USGS45): A new isotopic reference material for δ2H and δ18O measurements of water. Rapid Commun. Mass Spectrom. 2014, 28, 2031–2034. [Google Scholar] [CrossRef] [PubMed]
  95. Coplen, T.B.; Qi, H.; Tarbox, L.; Lorenz, J.; Buck, B. USGS46 Greenland Ice Core Water—A New Isotopic Reference Material for δ2H and δ18O Measurements of Water. Geostand. Geoanalytical Res. 2013, 38, 153–157. [Google Scholar] [CrossRef]
  96. Kalashnikova, O.Y.; Esenaman Uulu, M.; Usubaliev, R.A. The impact of climate change on the runoff and glaciers of the Ala-Archa river basin for the period 1915–2018. Sci. New Technol. Innov. Kyrg. 2019, 4, 36–41. (In Russian) [Google Scholar]
  97. Tokarev, I.V.; Polyakov, V.A.; Samsonova, A.A.; Shilo, V.A.; Tolstikhin, G.M.; Nurbaev, T.N.; Zhakeev, B.I.; Shabunin, A.G.; Alekhina, V.M. Study of Conditions of Formation of Water Balance of Toktogul Reservoir by Isotopic Composition of Water (δ2H, δ18O); Study of Formation Factors and Assessment of the Impact of Reservoirs of the Lower Naryn Cascade of HPPs on the Quality of Water Resources of the Naryn River Basin by Isotopic Methods (Based on the Results of ISTC Project KR-1430, 2007–2010); National Academy of Sciences of the Kyrgyz Republic: Bishkek, Kyrgyzstan, 2010; pp. 56–84. (In Russian) [Google Scholar]
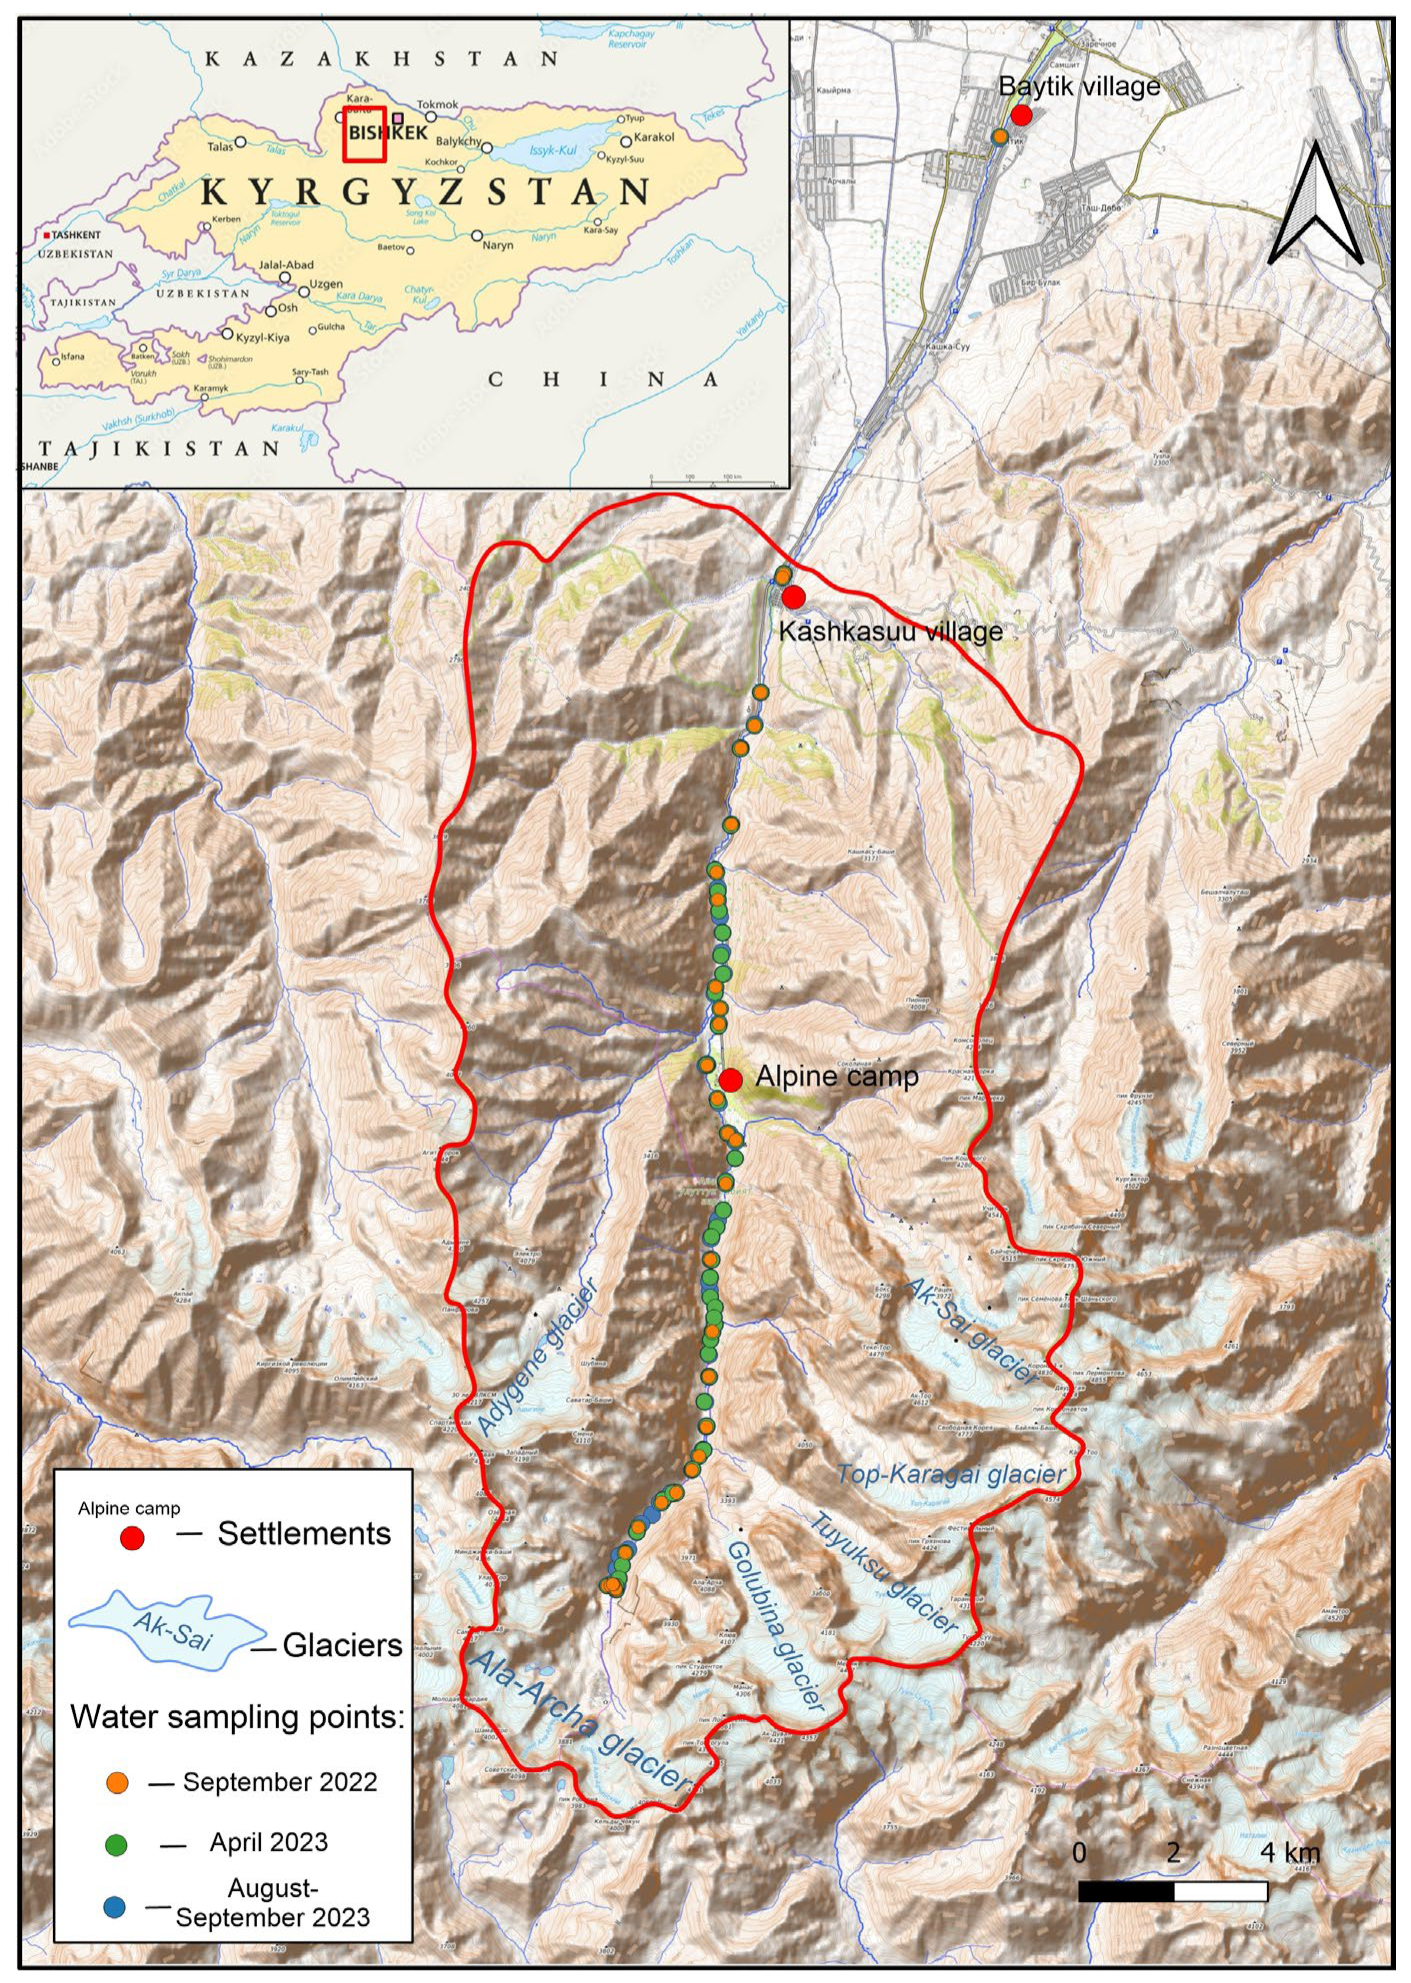
Figure 1. Scheme of the catchment area of the Ala-Archa River (Kyrgyz Republic, Central Asia), location of the main glaciers, and the sampling point’s distribution. The red curve marks the boundary of the catchment part, which is located above the area where the flow of the Ala-Archa River is regulated by hydraulic structures.
Water 16 01632 g001
Figure 2. Fragment of the moraine–glacial complex in the upper reaches of the Ala-Archa River (photo by Sergey Erokhin, 2017, from an unmanned aerial vehicle). It should pay attention to the wide, flat surface of the terminal moraine, inside which there is an ice core.
Water 16 01632 g002
Figure 3. Chronological plot of changes in water isotopic composition (1), discharge (2), and water electrical conductivity (3) in the Ala Archa River in 2015–2016 at the Alpine camp observation point (adapted from [76,78]).
Water 16 01632 g003
Figure 4. Diagnosis of three-component mixing from monitoring of the water isotopic composition and the electrical conductivity of water in the Ala-Archa River, precipitation in 2015–2016, sampling of glaciers, snow, and groundwater (adapted from [76,78]).
Water 16 01632 g004
Figure 5. Daily observations at the “Alpine camp” point (Figure 1) for some parameters of water in the Ala-Archa River during the period of no precipitation: (a) change in the isotopic composition of water in the Ala-Archa River (the numbers near the dots indicate the date and time of sampling, the circular arrow indicates the sequence of measurements and the cyclic change in the contents of deuterium and oxygen-18); (b) changes in the red-ox potential and the electrical conductivity of water; (c) changes in the isotopic composition of hydrogen and the radon-222 activity; (d) changes in temperature and the hydrogen potential of water; and (e) variations of the isotopic composition of oxygen in water.
Water 16 01632 g005
Figure 6. Hygrograph of the Ala-Archa River and air temperature: 1—air temperature in 1950 (by 5 days smoothing); 2—air temperature in 2008 (by 5 days smoothing); 3—hygrograph in 1950; and 4—hygrograph in 2008 [96].
Water 16 01632 g006
Figure 7. Mean daily air temperature, °C (1), and precipitation, mm (2), for the Ala-Archa River valley in 2023: (a) Alpine camp station on altitude 2159 m a.s.l. (Figure 1); (b) Ala-Archa Pass station on altitude 3902 m a.s.l. (the Meteoblue® meteorological data archive).
Water 16 01632 g007
Figure 8. The stable isotope composition of water in the Ala-Archa watershed (general approximation line is y = 7.76x + 15.03; R2 = 0.97). Rhombus is the water of the main flow of the Ala-Archa river, and square is the diffusing flows and small streams in the upper part of the Ala-Archa watershed above 2800 m: 1, 2—29 August–6 September 2023 (here and after line is the linear approximation for these data, equation in the brackets); 3, 4—20–25 April 2023; 5, 6—15–20 September 2022.
Water 16 01632 g008
Figure 9. Distribution of the stable isotope composition of water in the Ala-Archa River catchment for sampling in 29 August—6 September 2023 (large solid signs). Rhombus is water of the Ala-Archa River; square is water of the diffusing flows and small streams in the upper part of the Ala-Archa watershed; and oval with number is the different groups of water due to separation by the isotope composition. The small open signs on this diagram refer to two other sampling episodes, and they are shown to compare the isotopic composition of water at different times.
Water 16 01632 g009
Figure 10. Variations in composition of the stable isotopes of water in the Ala-Archa River with altitude have occurred several times. Rhombus is the water of the Ala-Archa River, and square is the diffusing flows and small streams in the upper part of the Ala-Archa watershed. Large solid signs show the isotopic composition of water for each sampling period (15–20 September 2022 on the left; 20–25 April 2023 in the center; and 29 August–6 September 2023 on the right). Small signs on each diagram refer to two other sampling episodes, and they are shown to compare the isotopic composition of water at different times.
Water 16 01632 g010
Figure 11. Relationship between electrical conductivity and isotopic composition of water in the main flow of the Ala-Archa River (1) and the dispersed flow in the glaciation zone (2), as well as variations in these parameters during daily monitoring (3).
Water 16 01632 g011
Figure 12. Relationship between temperature and isotopic composition of water in the main flow of the Ala-Archa River (1) and in the dispersed flow in the glaciation zone (2), as well as variations in these parameters during daily monitoring (3).
Water 16 01632 g012
Figure 13. Altitude dependence of the water temperature variation in the main stream of the Ala-Archa River (rhombuses) and the diffuse flow in the glaciation zone (squares).
Water 16 01632 g013
Figure 14. Variation in water conductivity as a function of height in the main flow of the Ala-Archa River (rhombuses) and diffuse flow in the glaciation zone (squares).
Water 16 01632 g014
Table 1. Statistical characteristics of δ18O and electrical conductivity of various waters in the Ala-Archa river basin on stations “Alpine camp” and “Baitik” (adapted from [76], VSMOW scale, accuracy ±0.25 ‰ for δ18O).
Variableδ18O, ‰Electrical Conductivity (EC), μS/cm
Sample NumberMeanRangeSample NumberMeanRange
Precipitation at Baitik 136−11.21−20.99...1.511469.926.6–99.6
Streamflow at Baitik158−11.32−12.37...−10.8225114.781.0–139.3
Precipitation at Alpine camp 243−11.41−22.82...−0.062368.321.3–102.0
Streamflow at Alpine camp184−11.73−12.90...−10.9478108.766.7–137.1
Groundwater14−11.17−11.70...−10.6112126.869.6–167.2
Snowmelt45−13.98−24.24...−10.53728.411.0–55.1
Glacier melt17−13.46−15.66...−12.33332.130.1–33.4
Notes: 1 Altitude for the Baitik station is 1580 m a.s.l.; 2 altitude for the Alpine camp station is 2159 m a.s.l.
Disclaimer/Publisher’s Note: The statements, opinions and data contained in all publications are solely those of the individual author(s) and contributor(s) and not of MDPI and/or the editor(s). MDPI and/or the editor(s) disclaim responsibility for any injury to people or property resulting from any ideas, methods, instructions or products referred to in the content.