Abstract
Rainfall-induced landslides are a major hazard in the Three Gorges Reservoir area (TGRA) of China, encompassing 19 districts and counties with extensive coverage and significant spatial variation in terrain. This study introduces the Gradient Boosting Decision Tree (GBDT) model, implemented on the Google Earth Engine (GEE) cloud platform, to dynamically assess landslide risks within the TGRA. Utilizing the GBDT model for landslide susceptibility analysis, the results show high accuracy with a prediction precision of 86.2% and a recall rate of 95.7%. Furthermore, leveraging GEE’s powerful computational capabilities and real-time updated rainfall data, we dynamically mapped landslide hazards across the TGRA. The integration of the GBDT with GEE enabled near-real-time processing of remote sensing and meteorological radar data from the significant “8–31” 2014 rainstorm event, achieving dynamic and accurate hazard assessments. This study provides a scalable solution applicable globally to similar regions, making a significant contribution to the field of geohazard analysis by improving real-time landslide hazard assessment and mitigation strategies.
1. Introduction
Landslides are common and dangerous in the Three Gorges Reservoir area (TGRA) due to its complex geographic, geologic, and hydrologic conditions. Rainfall is one of the main inducing factors of landslides in the TGRA [1,2]. The effects of rainfall are mainly manifested in the massive infiltration of rainwater, which leads to the saturation of the slope’s soil and rock layer and even the accumulation of water at the slope’s lower water barrier, increasing the weight of the slide body and reducing the shear strength of the soil and rock layer, resulting in landslides [3,4]. Rain-induced landslides are characterized by regional and clustered occurrences and can cause significant catastrophic damage in a short period of time [5,6,7]. Therefore, it is of great practical importance to use a reliable method to dynamically evaluate the regional risk of rainfall-induced landslides, improving the level of landslide hazard early warning and providing decision support for regional disaster prevention and mitigation.
Landslide hazard assessment is based on the results of landslide susceptibility mapping to forecast the likelihood of landslide deformation in a given area under the dynamic influence of inducing factors (such as rainfall, earthquakes, and human construction activities) [8,9,10]. Therefore, landslide hazard assessment can provide regional landslide early warning. The degree of difficulty of landslide occurrence at different spatial locations in the region is referred to as landslide susceptibility [11]. Since the first attempt to assess landslide susceptibility in the mid-1970s, various mathematical–physical models have been introduced in related research [12,13,14,15]. The purpose of landslide susceptibility mapping is to use geology, engineering, statistics, remote sensing, GIS, data mining, and other technologies to establish the relationship between the spatial location of landslides and the factors that influence them in order to achieve spatial identification of landslide-prone areas. With the rise of machine learning, data-driven methods have been introduced for studying landslide susceptibility mapping, including informativeness, the weight of evidence, logistic regression, support vector machines, and convolutional neural networks [12,16,17,18,19]. Ensemble learning, which constructs and combines multiple weak machine learners to achieve strong learning capabilities, has become a hot topic in machine learning in recent years because it provides stable models and high prediction accuracy. The bagging method, represented by Random Forest, and the boosting method, represented by AdaBoost, are the two main types of ensemble learning methods. The Gradient Boosting Decision Tree (GBDT) has achieved good predictive performance in landslide susceptibility mapping as an improved method of AdaBoost [20]. In geohazard analysis and other structured data applications, the GBDT demonstrates superior performance compared to other machine learning models, such as artificial neural networks (ANNs) or deep learning techniques. The GBDT leverages its strong interpretability, reduced overfitting through ensemble learning, and efficient feature utilization, making it particularly effective for predicting landslide susceptibility. As a result, incorporating the GBDT algorithm into the entire TGRA’s landslide susceptibility mapping has promising application potential. In the study of rainfall-induced landslide hazards, critical precipitation grading is an effective tool for performing quantitative analysis of landslides. Current methods for establishing critical precipitation gradings are mainly physical, empirical, mathematical, and statistical models. Physical models have limited applicability in a large study area [21]. When calculating the critical precipitation threshold, empirical, mathematical, and statistical models mainly use the combination of single or multiple precipitation parameters to determine the correlation between precipitation and landslides, such as the accumulated rainfall (E) and rainfall duration (D), accumulated rainfall and rainfall intensity (I), rainfall duration and rainfall intensity, the total rainfall amount and rainfall intensity, etc. [22,23,24,25,26]. The choice of empirical, mathematical, and statistical models must be made in conjunction with the study area’s actual geological environment and precipitation events.
Remote sensing and GIS applications are changing due to the explosion of geographic big data and recent advances in cloud computing and big data processing services. The Google Earth Engine (GEE) cloud platform is widely used for regional and even global remote sensing applications and geospatial data analysis [27]. Landslide susceptibility mapping and dynamic hazard assessment on a regional scale require large amounts of data and high computational power. GEE provides a new approach to geospatial data processing that addresses the challenges of data acquisition and processing faced by remote sensing researchers [28]. It provides a large number of remote sensing datasets as well as hundreds of pre-built functions that are simple to understand and use for users from various background. GEE allows researchers, scientists, and developers to quickly extract valuable information from large remote sensing datasets [29,30]. NASA researchers initiated regional landslide hazard studies previously, but they still encountered challenges such as data preprocessing difficulties and the simplicity of susceptibility evaluation models [31,32]. To date, GEE has been applied to both landslide susceptibility mapping research and landslide hazard assessment on a region scale [33,34].
Given the considerations detailed previously, this study aims to develop a dynamic, near-real-time method for assessing the risk of rainfall-induced landslides across a broad area using the Google Earth Engine (GEE) cloud platform. Our objectives are as follows: (1) Employ remote sensing big data from the GEE cloud platform to map landslide susceptibility throughout the Three Gorges Reservoir area (TGRA). (2) Utilize accumulated rainfall data and susceptibility maps from GEE’s meteorological datasets to facilitate dynamic hazard assessments of rainfall-induced landslides in the TGRA. (3) Examine the efficacy of this dynamic hazard assessment approach by analyzing remote sensing interpretation data of landslides in the TGRA before and after the significant rainfall event on 31 August 2014.
To innovate and extend the current knowledge base, this study introduces a novel application of GEE’s comprehensive big data capabilities for real-time monitoring and analysis. This approach allows for a more timely and precise identification of potential landslide risks, contributing significantly to disaster risk management and mitigation in large, vulnerable regions.
2. Study Area and Dataset
2.1. Study Area
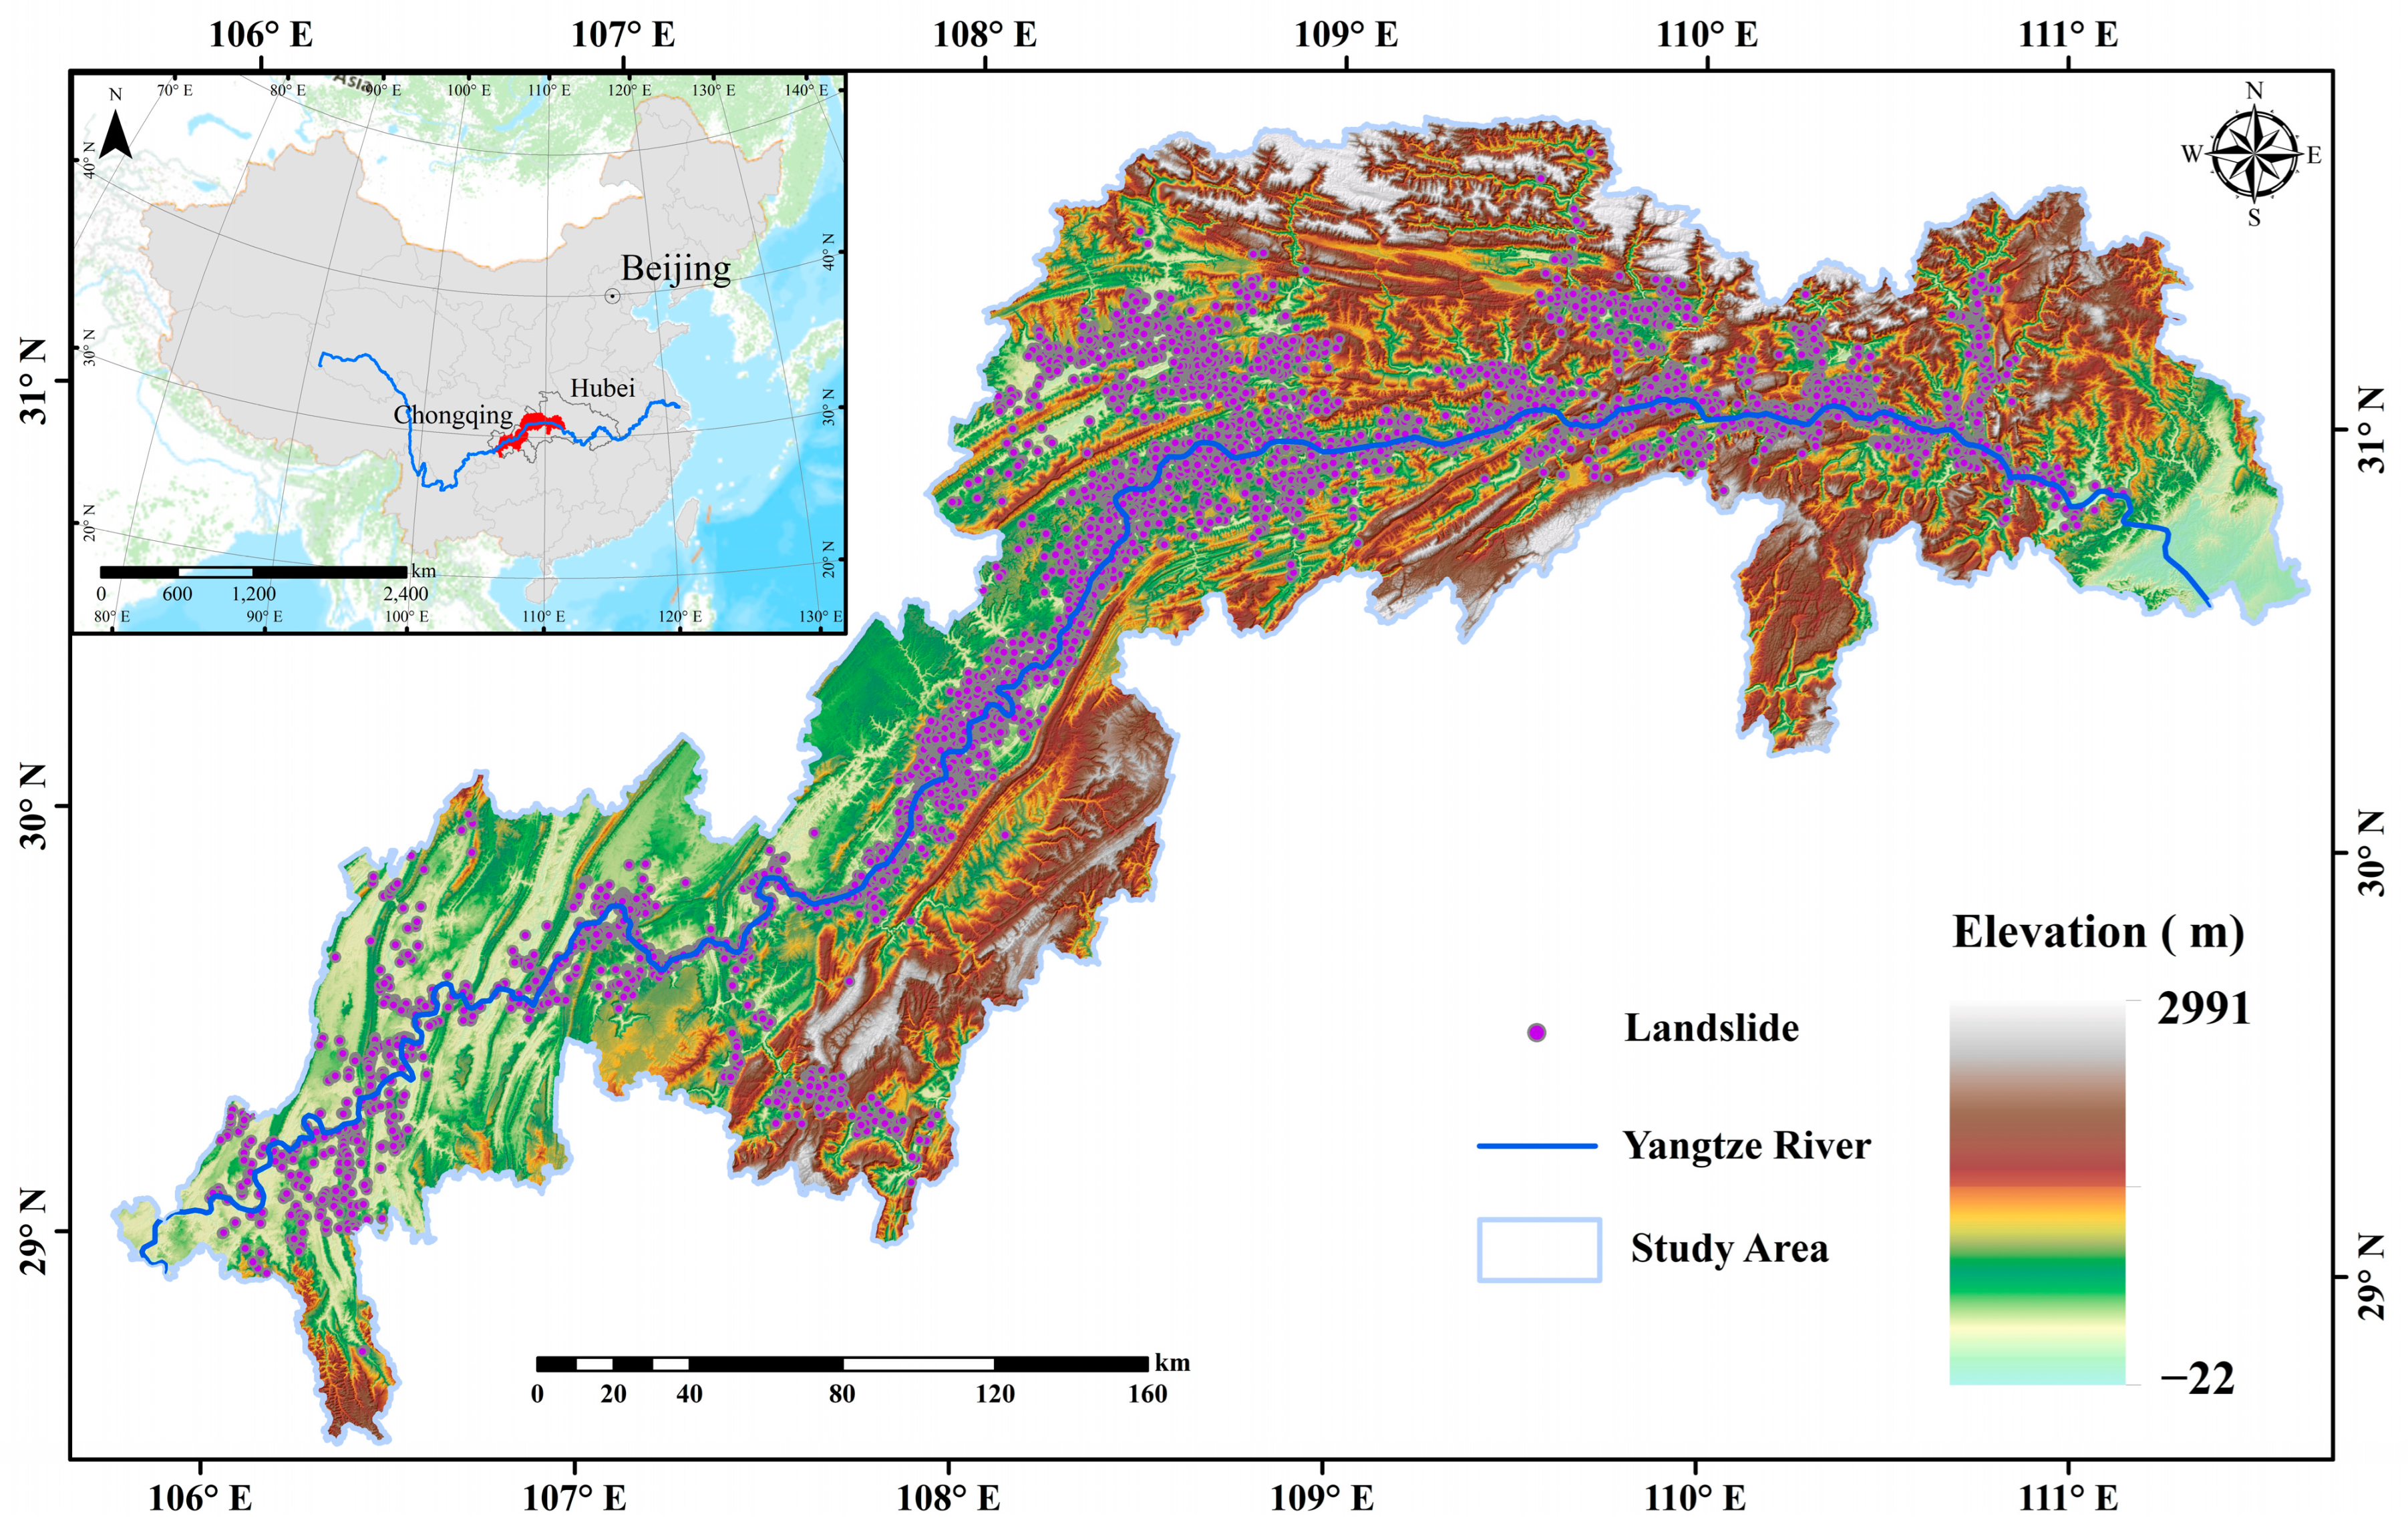
The Three Gorges Reservoir area (TGRA) (28°56′~31°44′ N, 106°16′~111°28′ E) is located in the junction of the Sichuan Basin and the middle and lower reaches of the Yangtze River Plain in China (see Figure 1), spanning the canyons in the medium mountains of Hubei Province and the eastern valleys of Sichuan Province [35]. The TGRA covers the areas inundated or affected by the Three Gorges Project, encompassing 26 counties and districts in Hubei and Chongqing, with a total area of 58,377 km2 and a shoreline length of about 650 km along the Yangtze River’s main channel. With Fengjie as the boundary, the Three Gorges Reservoir area can be roughly divided into two major geomorphological units, the low and medium mountains of the Three Gorges, and the low hills of the Sichuan Basin. The TGRA is characterized by its highly complex geological and structural features. The stratigraphic composition primarily comprises sedimentary rocks from the Paleozoic, Mesozoic, and Cenozoic eras, with sandstone, shale, and limestone being predominant. Extensive tilting and folding are common, resulting in complex geological structures. Additionally, the area is interspersed with several active fault zones, such as the Badong and Zigui faults, which elevate the risk of geological hazards. The region’s rugged terrain is dominated by high mountains and deep valleys, with steep slopes and significant topographical relief, alongside swiftly flowing rivers in the valleys. These geomorphological conditions play a crucial role in influencing the occurrence of geological disasters. Furthermore, the increasing number of human engineering activities have disrupted the natural balance of the original ecological environment, promoting the emergence and formation of geological hazards. The Three Gorges Reservoir area is a subtropical monsoon zone with a mild and humid climate, high air humidity, abundant rainfall, and high average temperature. About 70% of the annual precipitation in the region occurs from May to September, most of which is heavy rain and rainstorms that frequently raise groundwater levels, causing abnormal pore water pressure or hydrodynamic pressure and prompting the resurgence of landslides [36,37]. Over the past few decades, heavy rain events have repeatedly triggered major geological disasters in the TGRA. The TGRA is the main ecologically fragile area on the upper reaches of the Yangtze River and one of the most special ecological functional areas in China and even the world [38,39,40,41].

Figure 1.
Location of Three Gorges Reservoir area and distribution of documented rainfall-induced landslides.
2.2. Datasets
Traditional data collection via the archives and online data collection via the Google Earth Engine (GEE) cloud platform are the primary data sources for this study. The documented rainfall-induced landslide data were obtained from the China Institute of Geo-Environment Monitoring and included a total of 5008 landslide points, whose spatial location and size are shown in Figure 1. Landslides predominantly consist of soil and rock, with a minor proportion of mixed rock–soil slides. The size distribution of these landslides is categorized as follows: mega-landslides, with volumes exceeding 10 million cubic meters, totaling 148; large landslides, with volumes ranging from 1 million to 10 million cubic meters, totaling 1292; medium landslides, encompassing volumes from 100,000 to 1 million cubic meters, accounting for 2443; and small landslides, less than 100,000 cubic meters, comprising 1125 instances. The current stability assessment reveals that 2037 landslides are relatively stable, 2048 exhibit moderate stability, and 503 are classified as unstable. The overall trend in landslide stability is deteriorating. These landslides primarily pose threats to human populations, residential structures, infrastructure such as roads, agricultural lands, and navigational routes. Landslides have threatened a total of 789,078 people, resulting in a direct economic loss of CNY 429,585,800 up to 2013 in the TGRA. The 1:200,000-scale base geological map and engineering geological map were obtained from the archives of China University of Geosciences (Wuhan). They were used to extract the engineering rock groups and geological formations. The following are the data obtained through the GEE cloud platform: high-precision digital elevation models for calculating elevation, slope, and aspect; multispectral remote sensing images from Landsat 8 OLI for calculating the type of land cover, the intensity of water influence, and the normalized difference vegetation index; precipitation radar satellite data from 23 August to 3 September 2014; the soil moisture index obtained from the inversion of a microwave remote sensing satellite; the dataset of annual average precipitation in the TGRA. The high-resolution remote sensing imagery used in this study includes unmanned aerial vehicle (UAV) flights conducted by the Geological Disaster Management Department of Chongqing Municipal Government and Google Earth time-series images captured before and after the disaster events. These images were primarily employed for the visual interpretation of landslides following intense rainfall events. The interpretation adhered to the Chinese national standard for landslide hazard investigation to ensure scientific rigor and accuracy in landslide identification [42]. Detailed statistical characteristics and the criteria are presented in Table 1.

Table 1.
Description and statistical characteristics of the datasets.
2.3. Influencing Factors of Landslides
The selected influencing factors in this study for rainfall-induced landslides refer to the influencing factors used in the consultation meeting on the development of geological disasters in the TGRA in 2020. This combination was determined by experts in the relevant fields who are familiar with the evolution of geological disasters in the TGRA and is a reasonable scheme. This combination of factors includes topographic factors, geological factors, land cover type, water system influence, the normalized difference vegetation index, the average annual precipitation, and soil moisture.
2.3.1. Topographic Factors
Topographic factors include elevation, slope, and aspect.
Elevation: The elevation of the terrain has a significant influence on the development of landslides. It mainly affects the surface type of the landslide, human activities, and the vegetation cover of the surface. Elevation changes result in changes in temperature, rainfall, vegetation types, and human activities, which indirectly affect the landslide development environment. Elevation can be obtained directly from the DEM (see Figure 1).
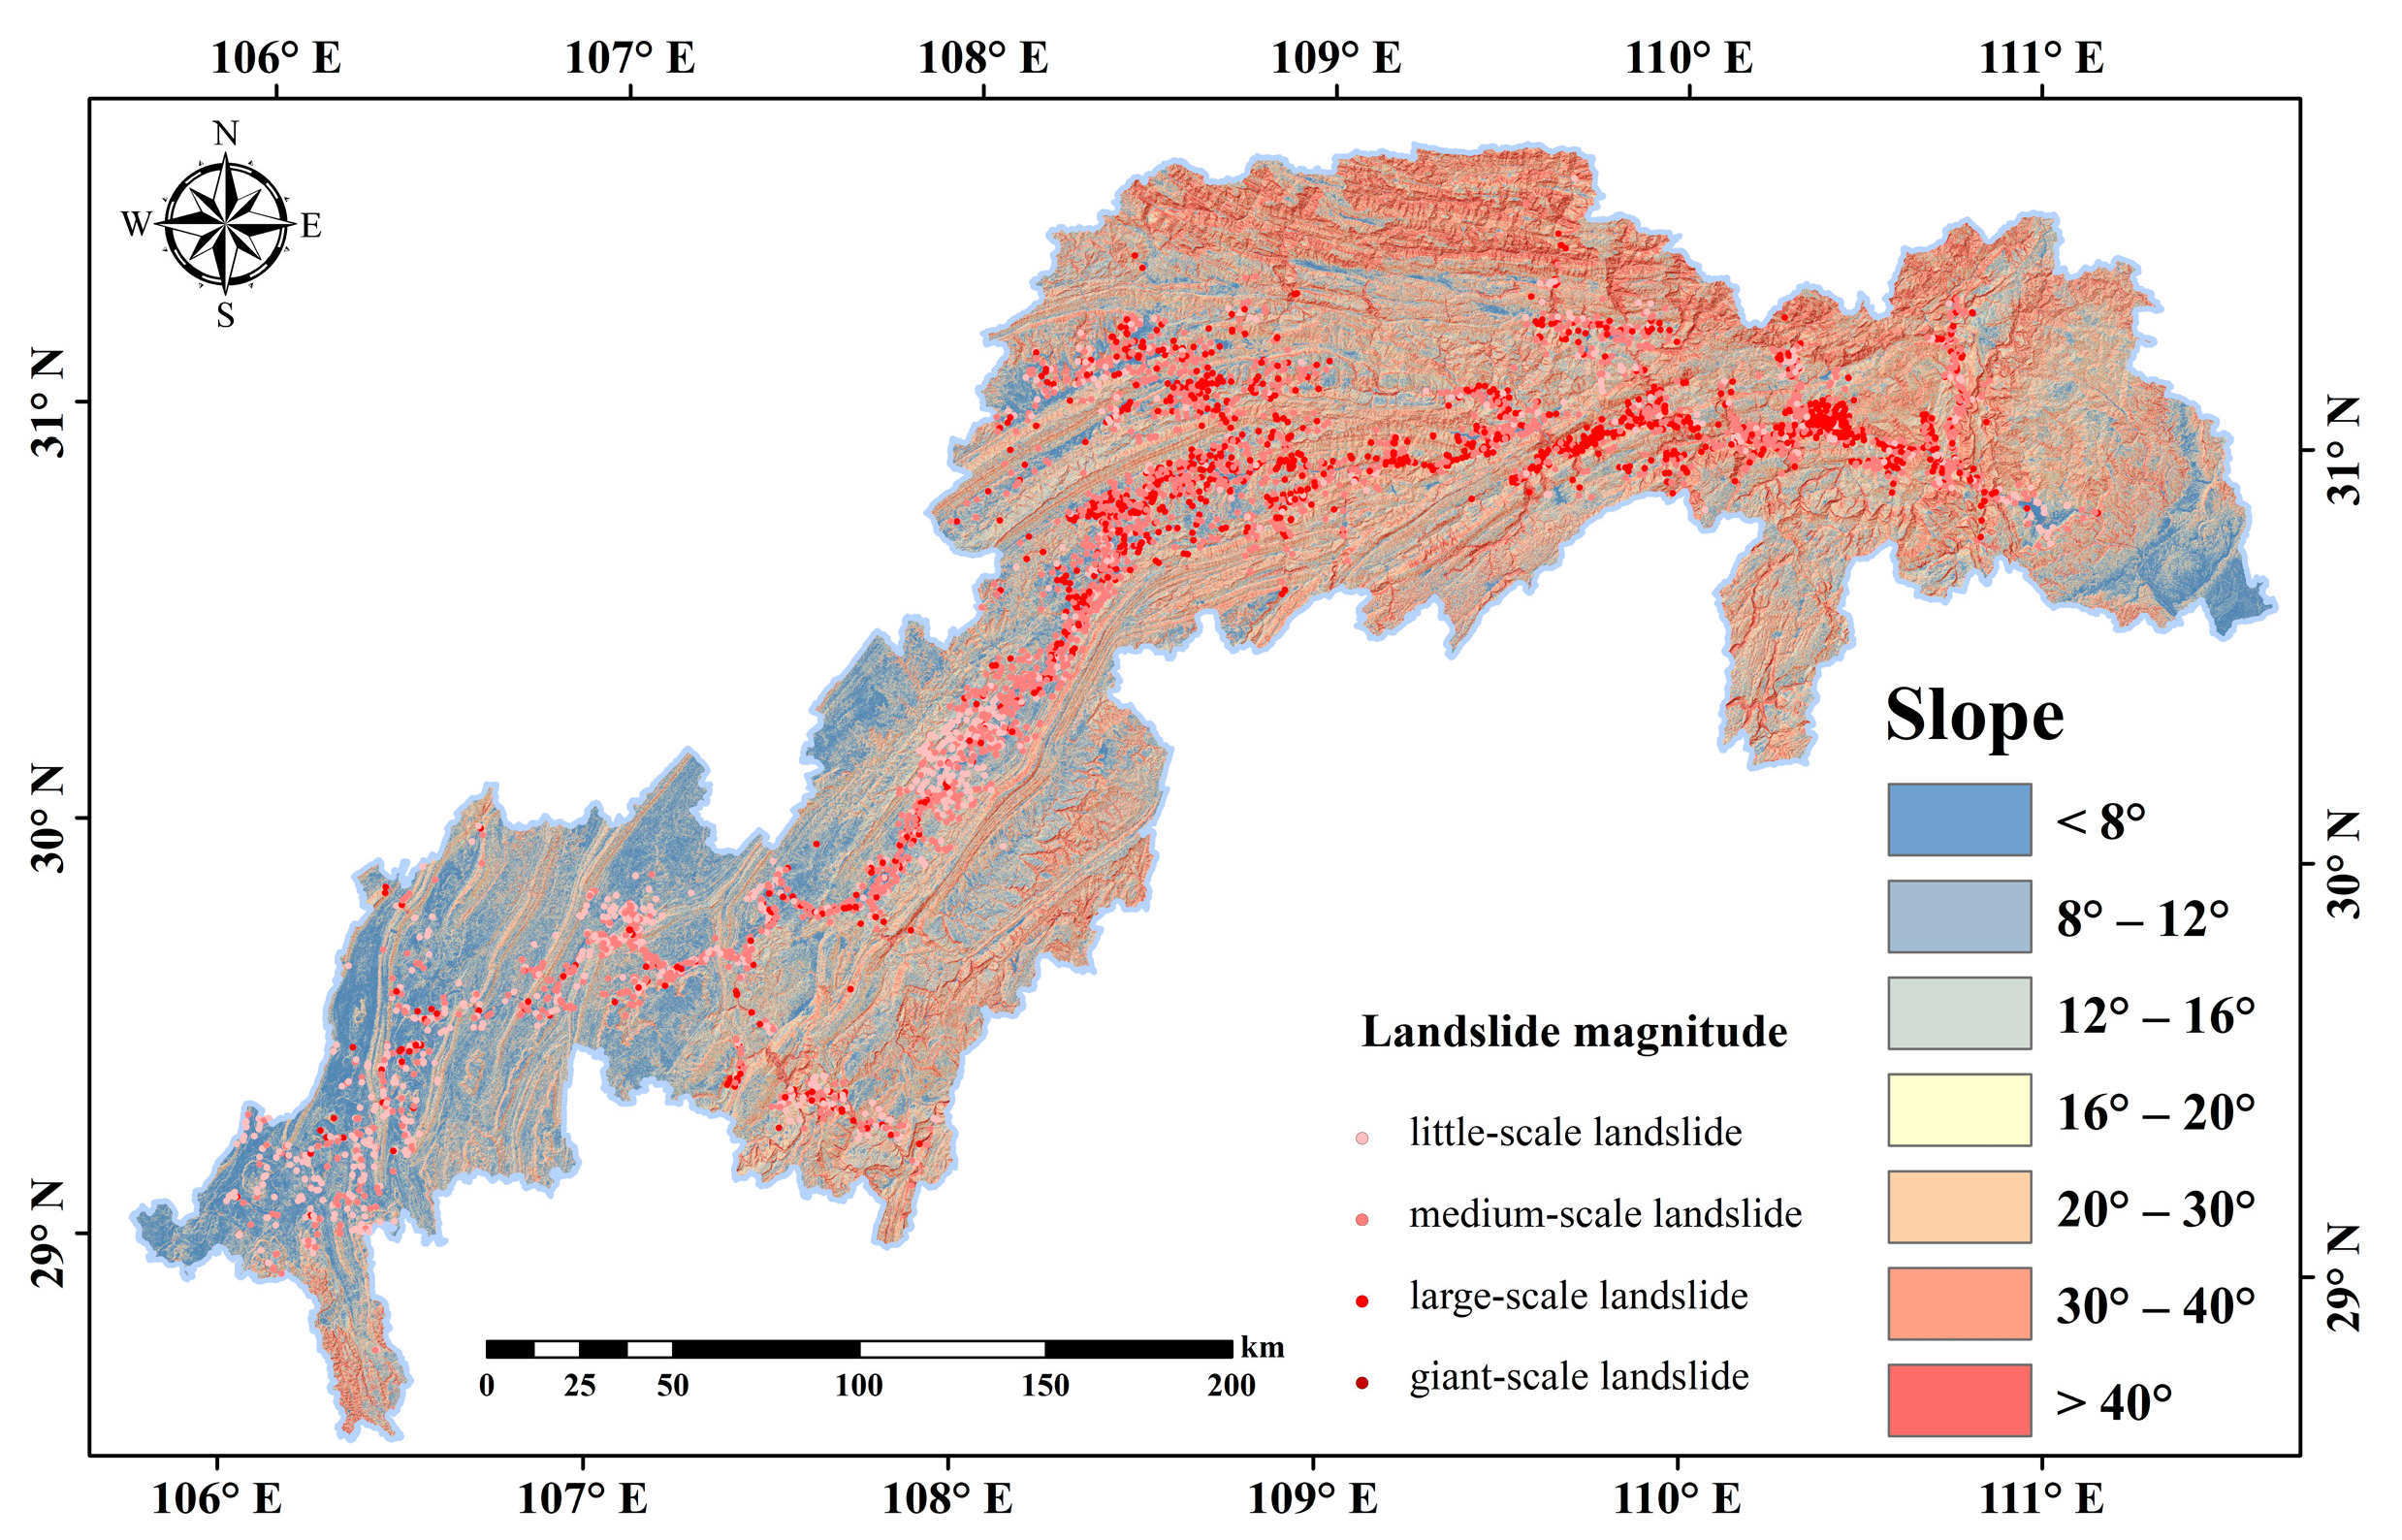
Slope: Slope is used to describe the degree of change in surface elevation. The angle of inclination directly affects the stability of the slope. Slope has a great influence on the stress distribution of the rock and soil mass, the runoff of surface water on the slope, the recharge and discharge of groundwater on the slope, the thickness of the weathered layer on the slope, vegetation cover, land use, and so on. It affects the stress distribution of the slope mass. In general, the larger the slope, the less stable the slope; the smaller the slope, the lower the potential energy of the slope and the less susceptible it is to landslides. In this paper, the slope factor is extracted by using the DEM (see Figure 2).

Figure 2.
Slope distribution in the TGRA. The slope from small to large was divided into <8°, 8°–12°, 12°–16°, 16°–20°, 20°–30°, 30°–40°, and >40°, a total of 7 levels.
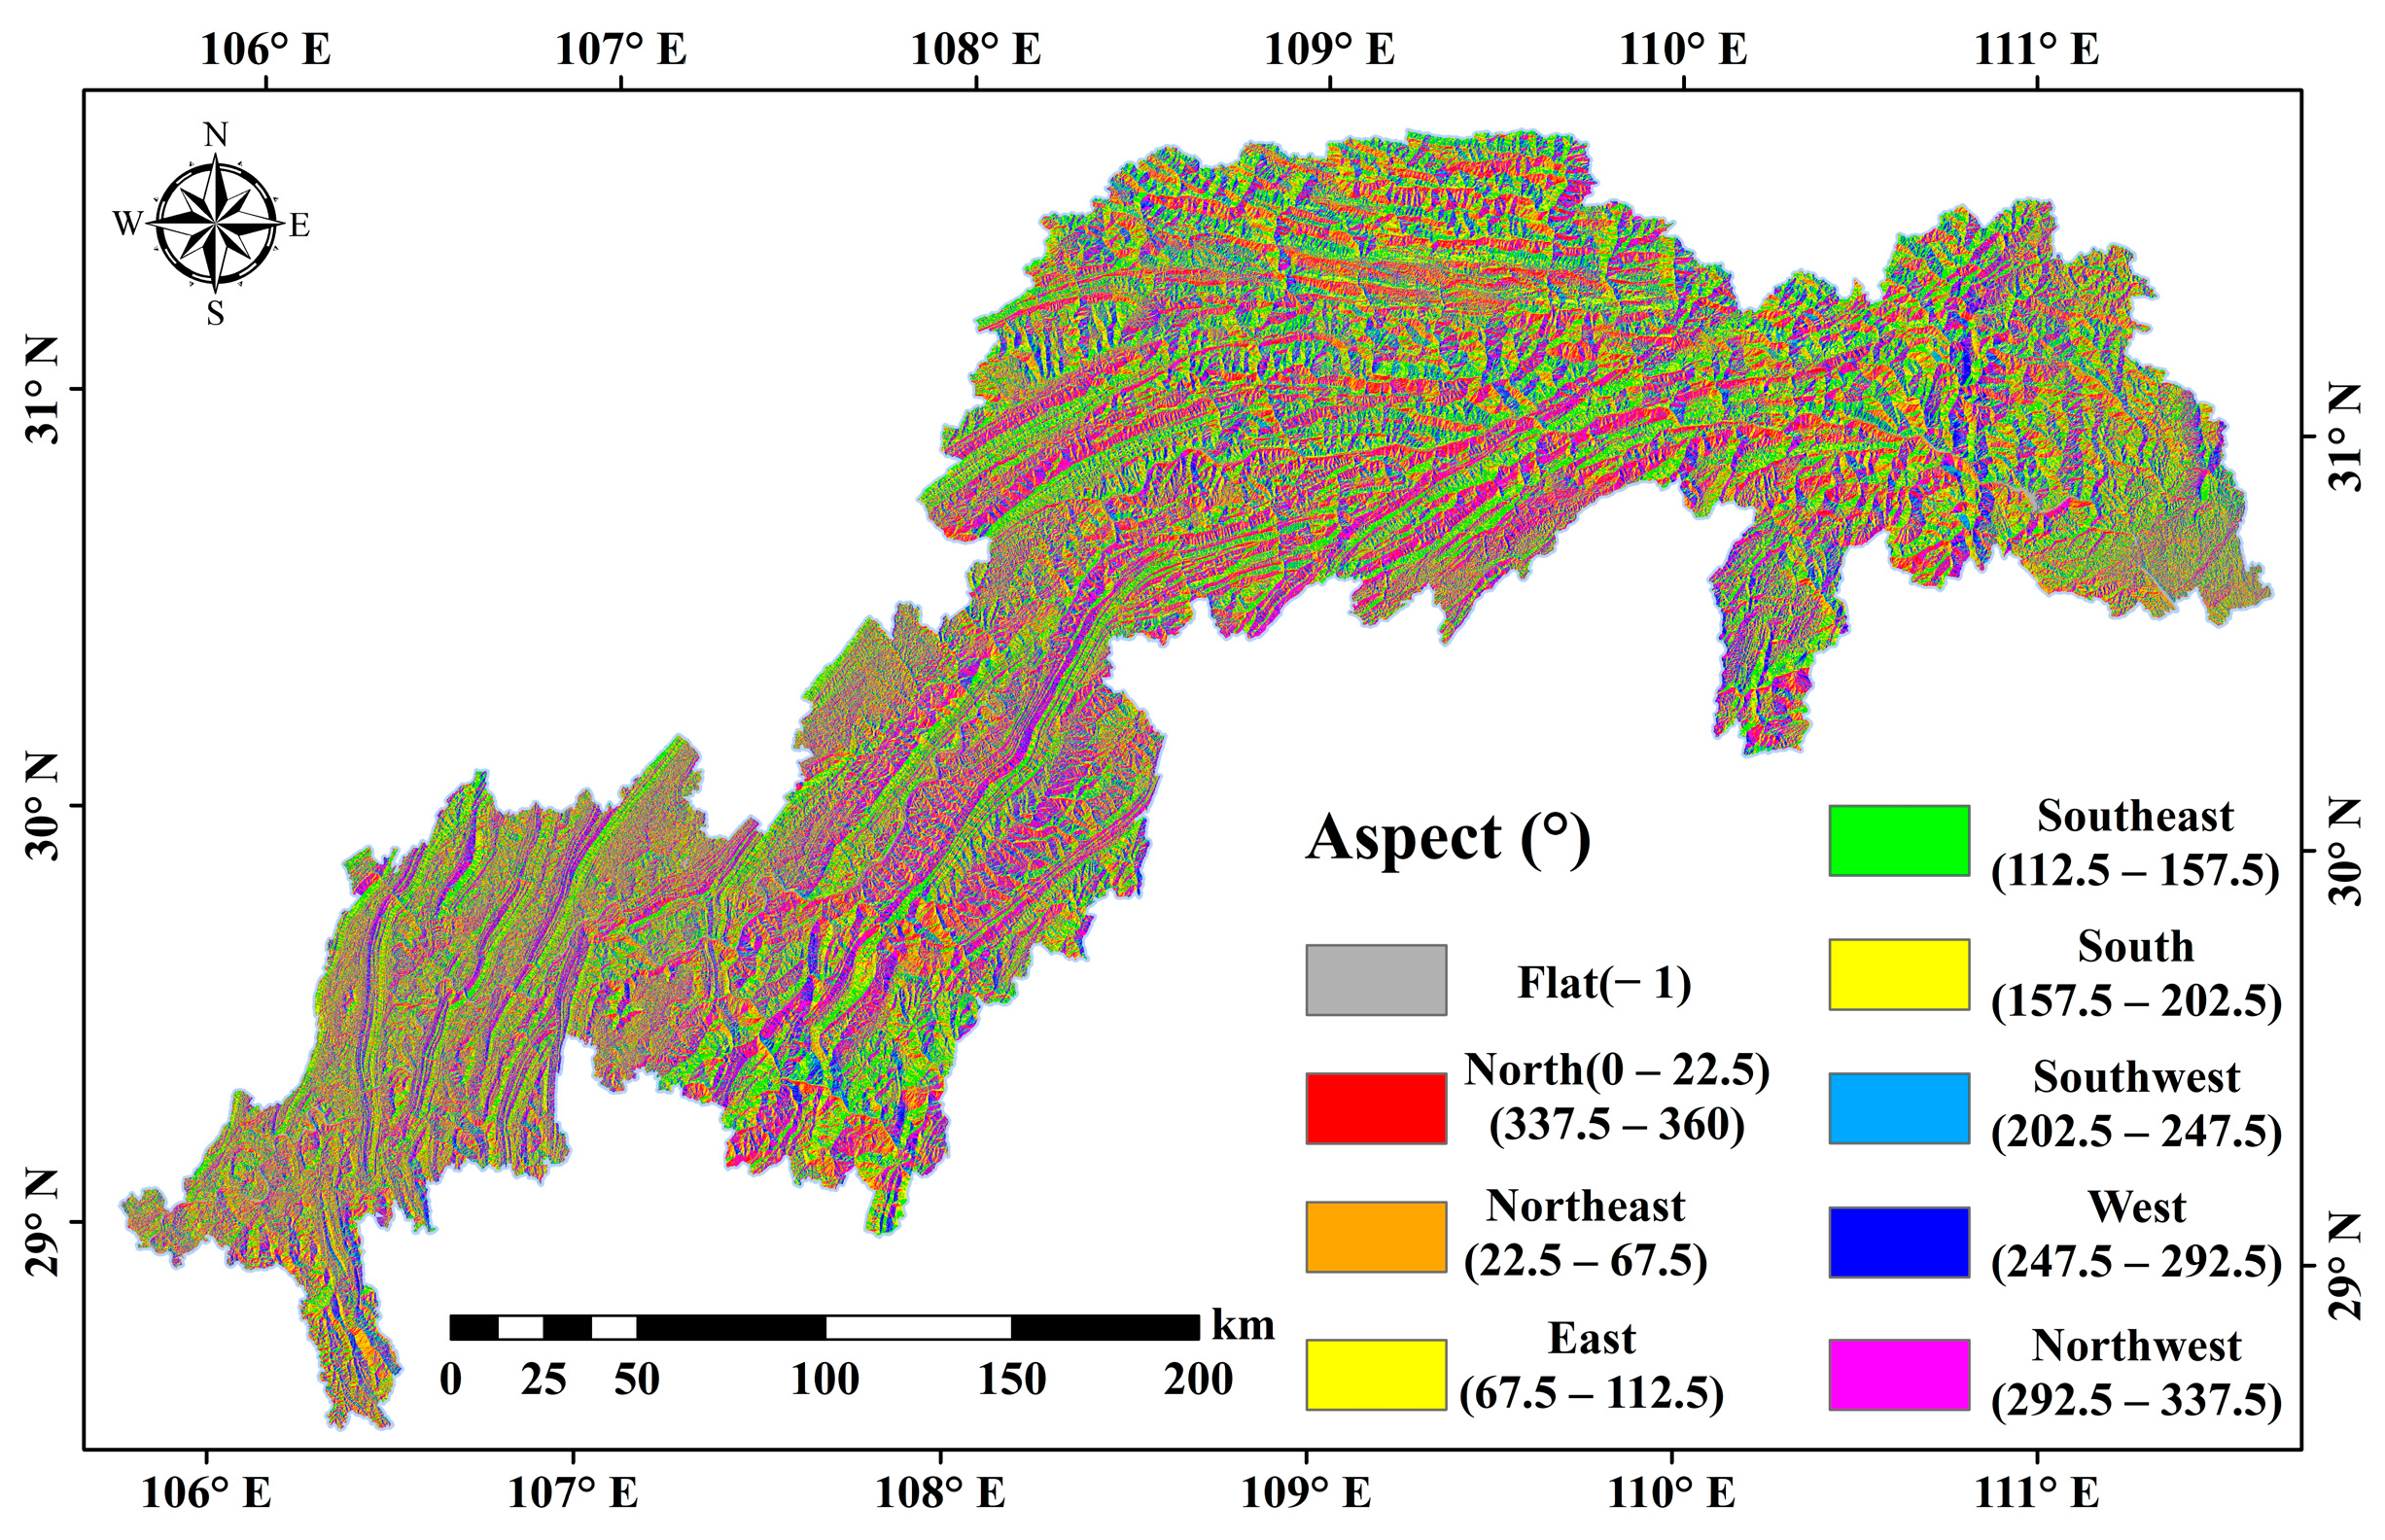
Aspect: There is a close relationship between solar radiation and the aspect. Different aspects result in varying intensities of solar radiation and weathering, which affect factors such as vegetation cover, water evaporation, and soil moisture. These lead to changes in pore pressure distribution as well as the physical and mechanical properties of groundwater in rocks and soil mass, thus indirectly affecting the stability of the slope. The aspect factors are extracted from the DEM data in this paper (see Figure 3).

Figure 3.
Aspect distribution in the TGRA. The slope was divided into nine directions: flat, north, northeast, east, southeast, south, southwest, west, and northwest, with each of the other eight directions taking 45°, except the flat one.
2.3.2. Geological Factors
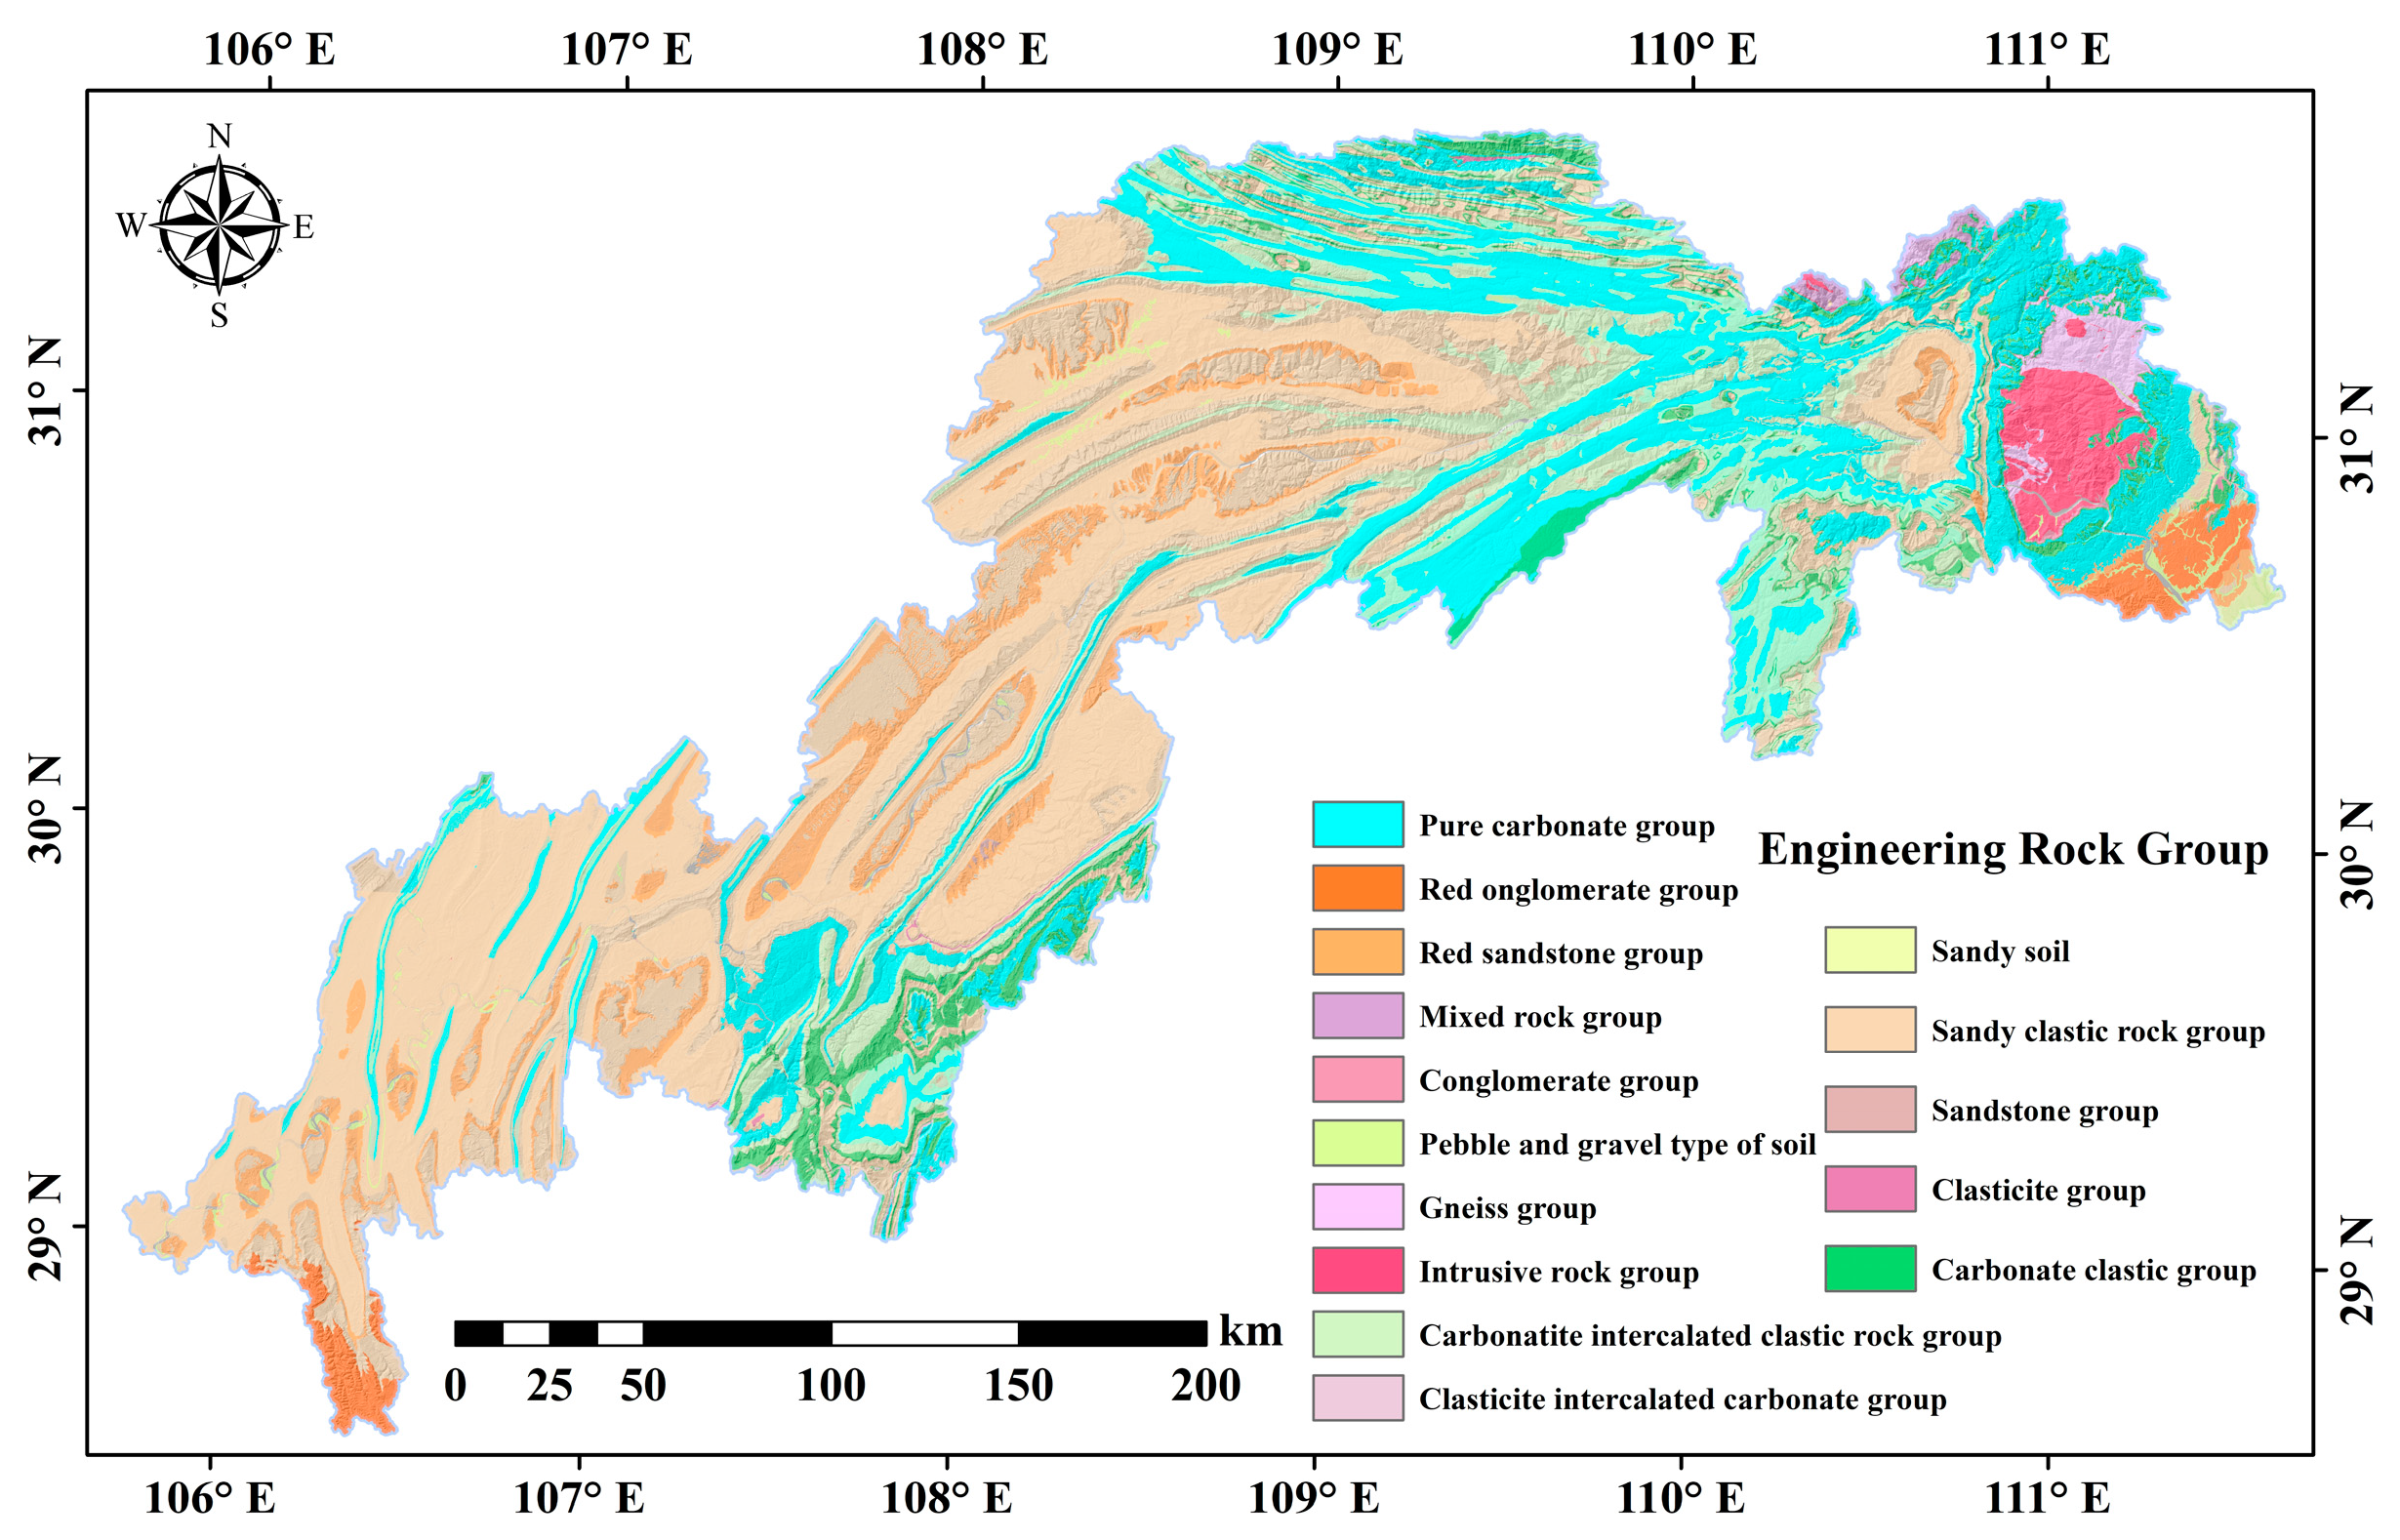
Engineering rock groups: Statistics show that mineral hardness has a strong relationship with the spatial distribution of landslides in the study area. In areas with relatively strong rocks, it is hard for the slope to be deformed and destructed, so landslides are difficult to form. In areas with soft rocks, the slope is more easily deformed and destructed, making landslides more likely. Based on the 1:200,000 geological base map, the strata exposed in the TGRA were classified into different lithology groups according to their geotechnical properties. Strata with identical or similar petrophysical and mechanical properties were classified into the same engineering rock group. Landslides are greatly affected by unstable strata, which occur in stratified layers with soft surfaces or weak layers (belts). They are mainly clastic rocks (sandstone with a soft and hard interlayer, mudstone, and weak mudstone) belonging to Jurassic Penglaizhen Formation, Suining Formation, Shaximiao Formation, Xintiangou Formation, and Triassic Badong Formation. The factor of engineering rock groups after informatization is shown in Figure 4.
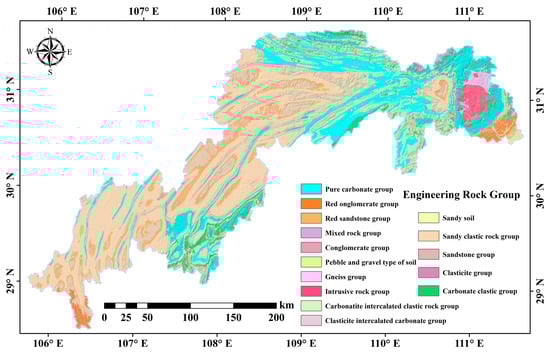
Figure 4.
Engineering rock groups’ distribution in TGRA.
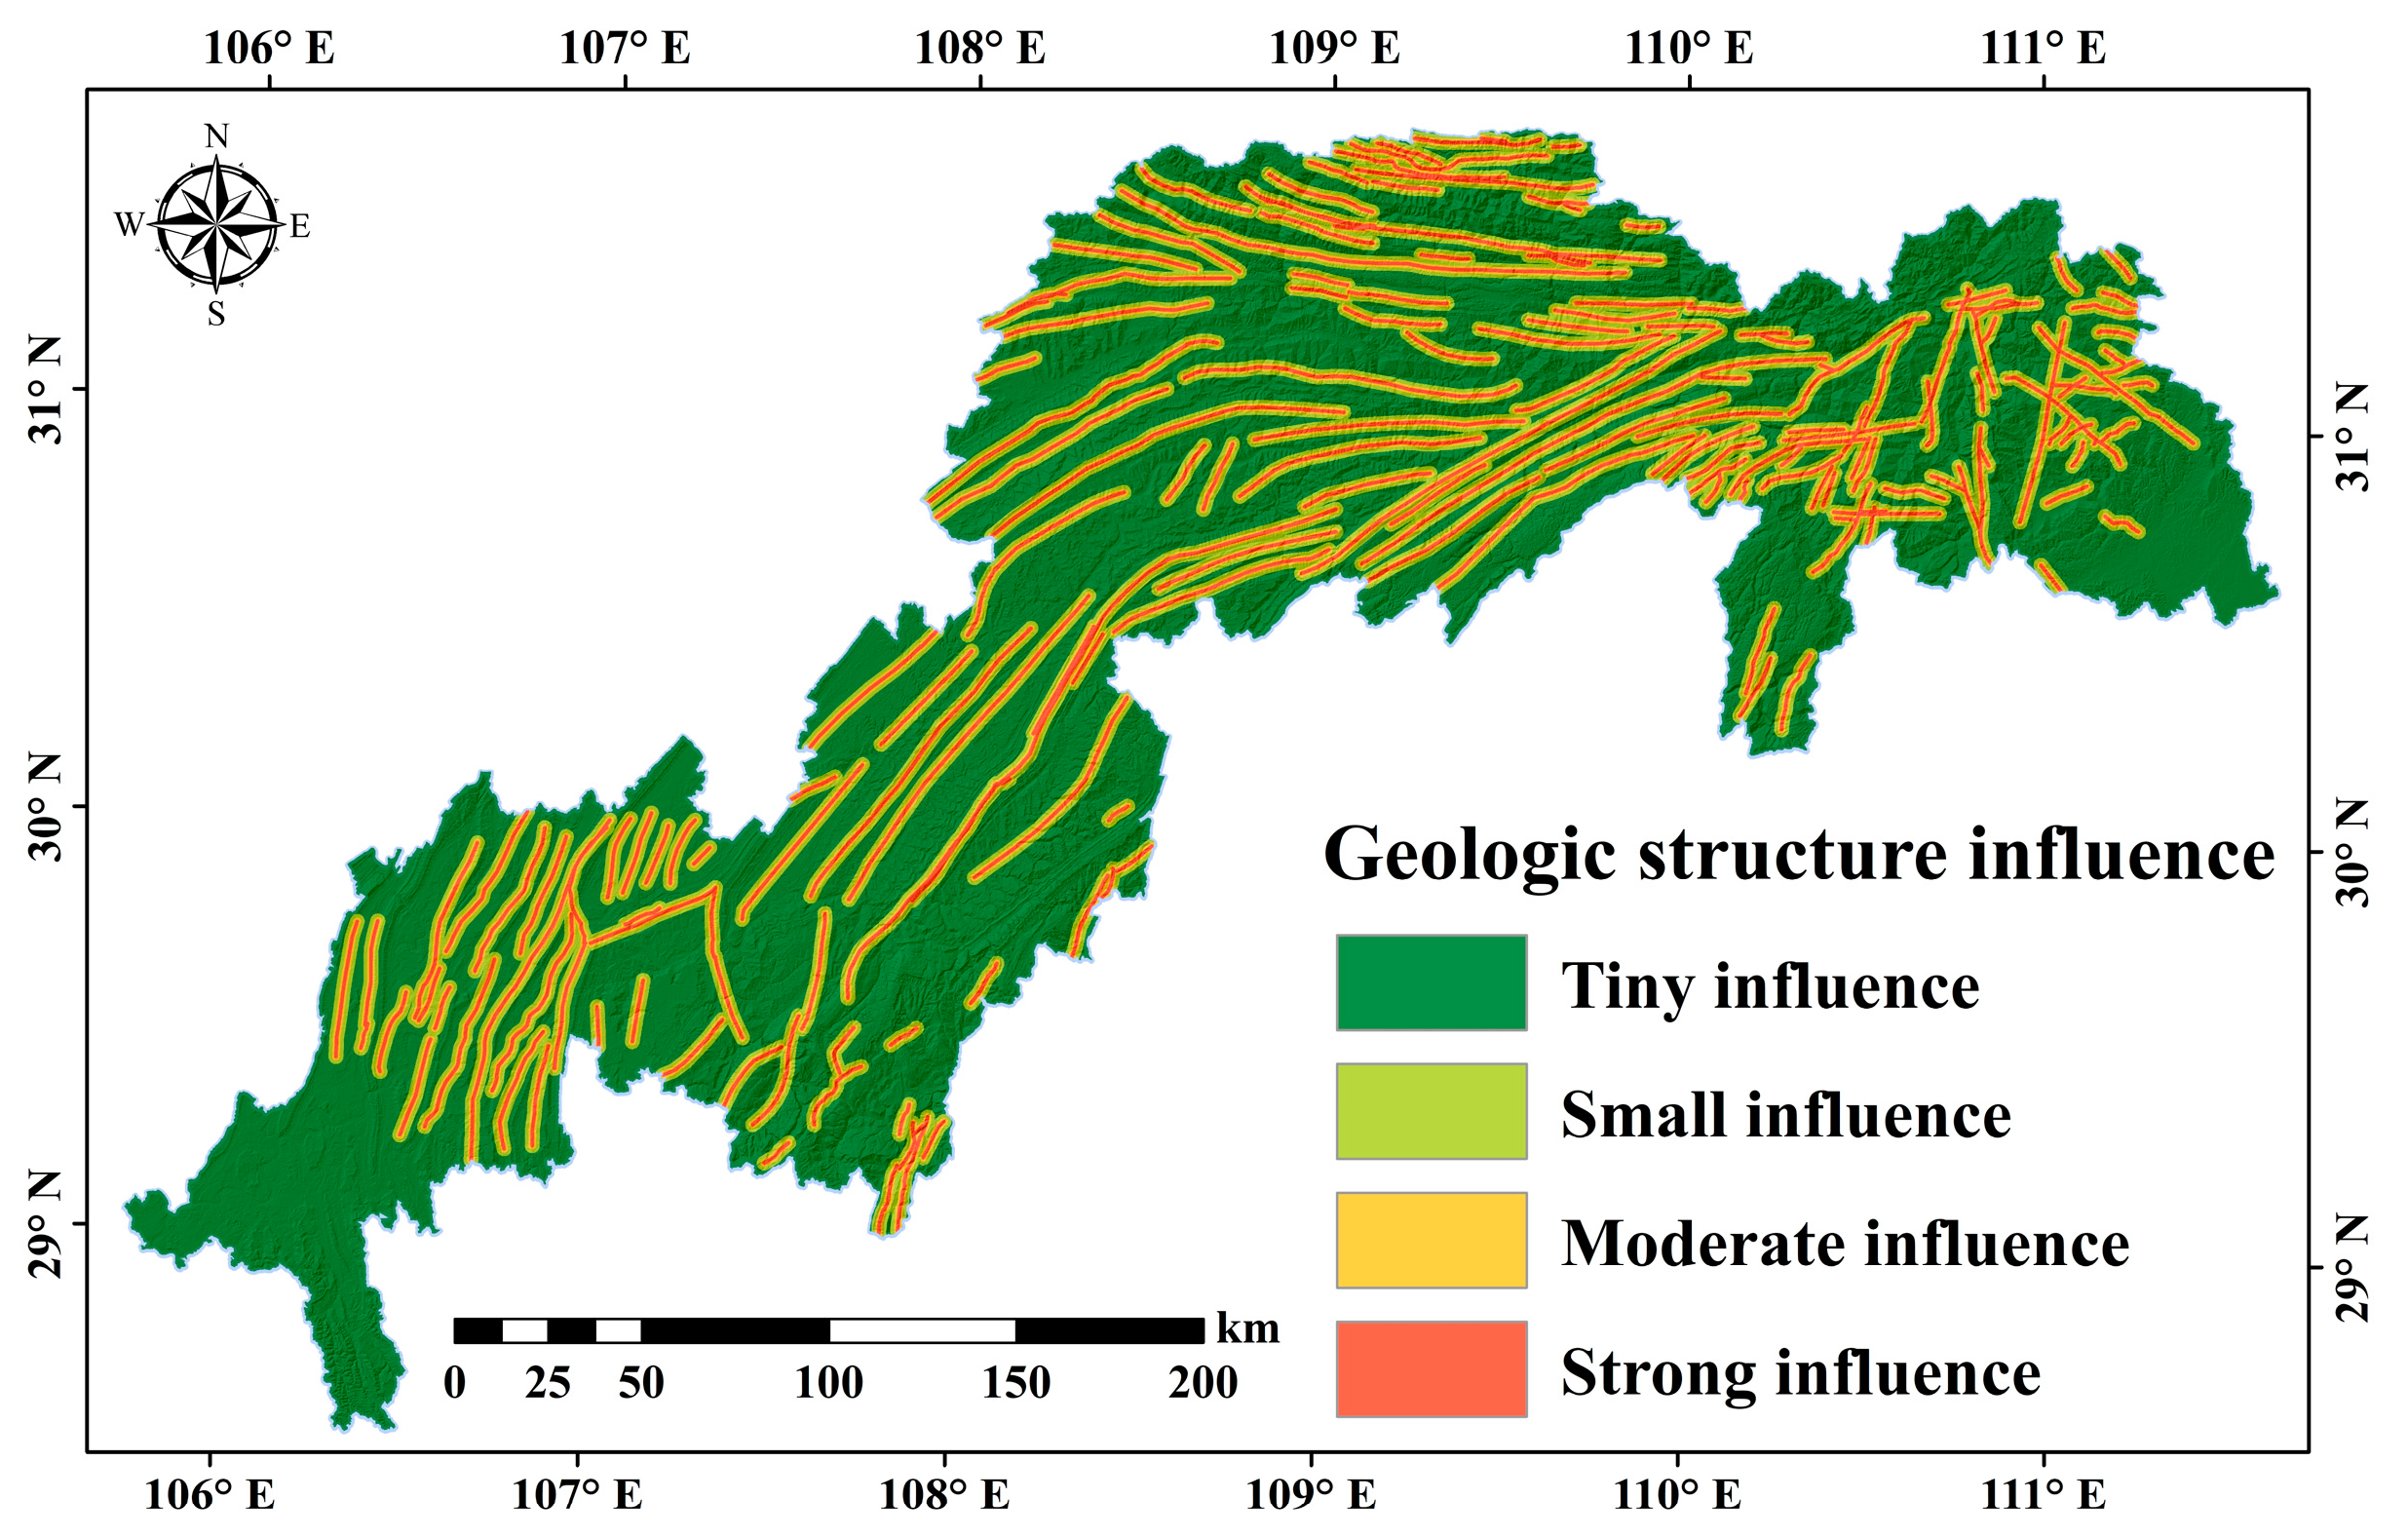
Influence intensity of geological structures. The formation and development of landslides are closely related to tectonic movements, and geological structures are the fundamentals that control the formation and development of landslides. The magnitude, main slide direction, and spatial distribution of landslides are all controlled by the geological structure. It also regulates the formation and combination of soft and weak structural surfaces, the degree of rock weathering, topographic and geomorphological features, and the recharge of groundwater in landslide areas. Therefore, the geological structure is one of the crucial factors influencing landslide stability. In this study, a multilevel buffer zone was established to determine the intensity of tectonic influence depending on the distance from the geological structure to the landslides (see Figure 5).
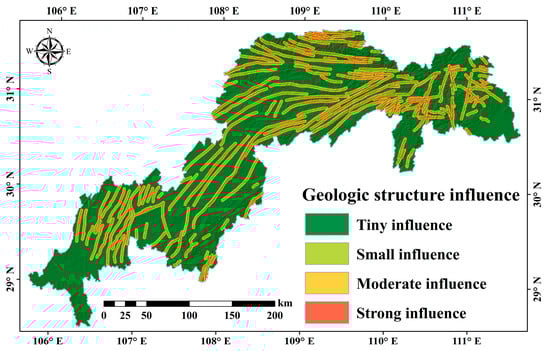
Figure 5.
Influence intensity distribution of geological structures in the TGRA. Based on the distance from the geological structure to the landslides, there are four categories: strong influence, moderate influence, small influence, and tiny influence.
2.3.3. Land Cover Type
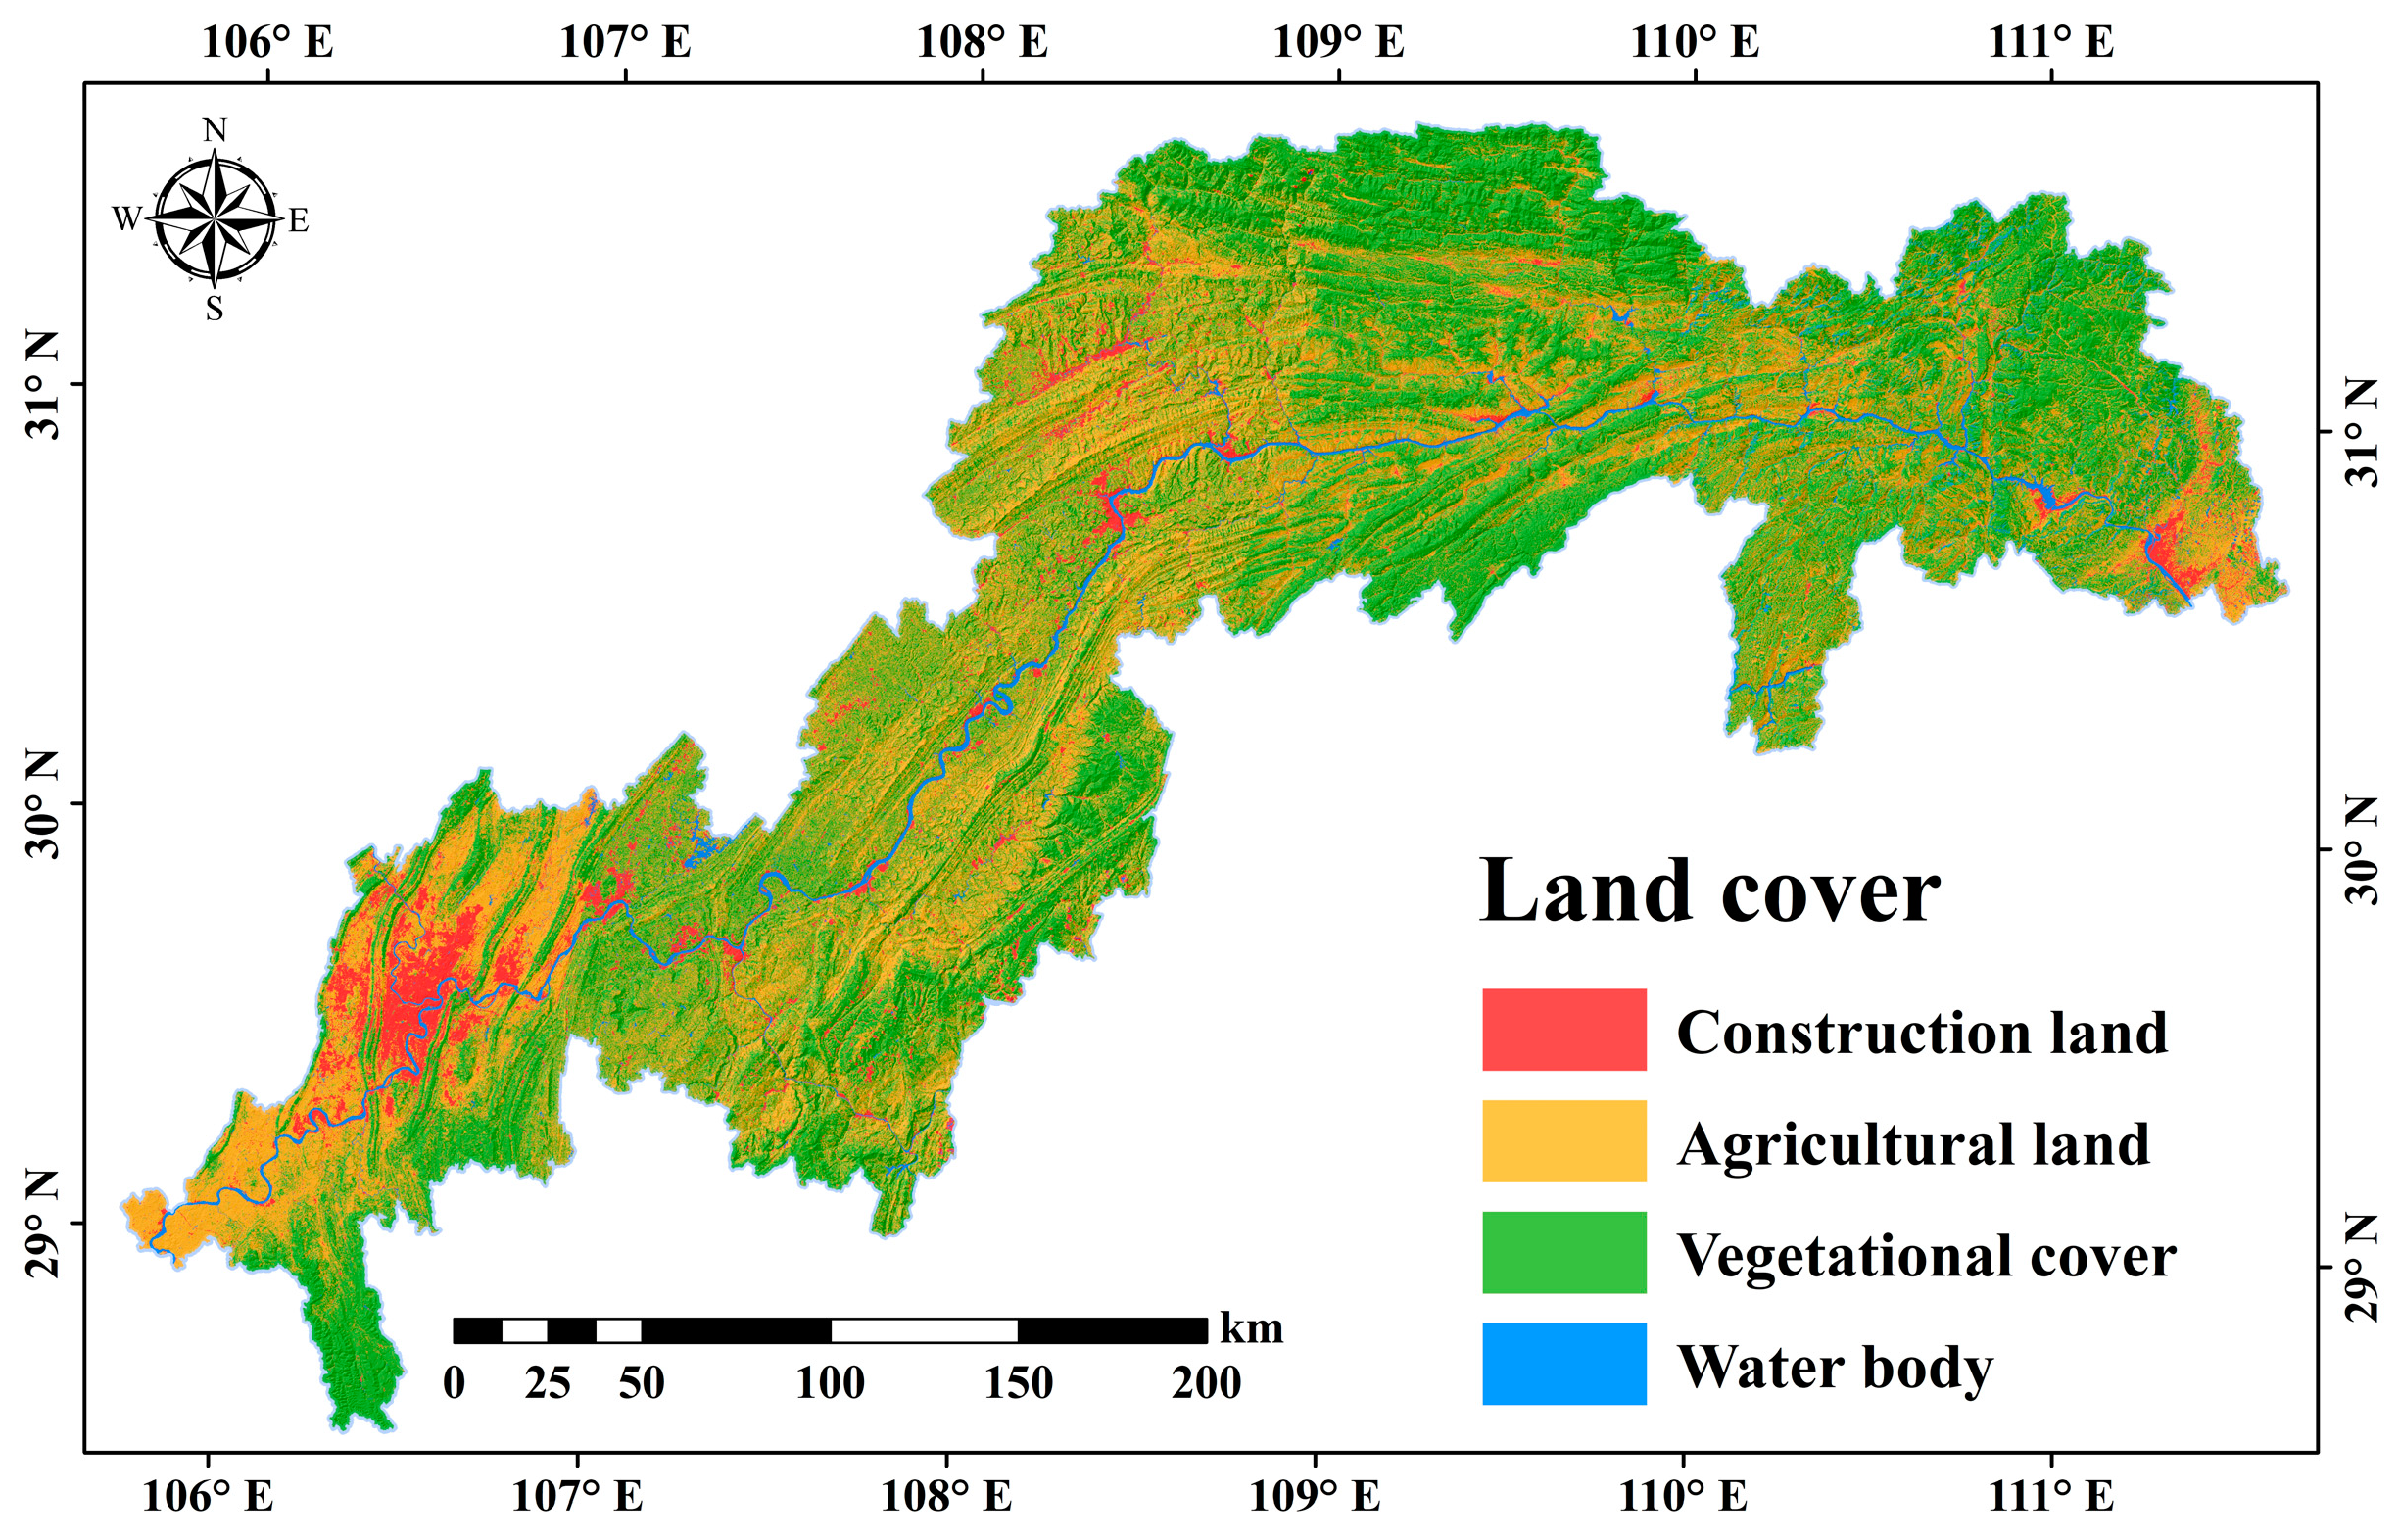
Human demand for land has increased tremendously due to the need for production and construction. And land has been changed significantly. Slopes must be cleared and land developed for infrastructure construction, which reduces slope stability and makes landslides more likely. Slope stability in terms of surface runoff and slope structure are affected by factors such as vegetation type and degree of cover, which vary from land to land. The land cover types in this paper were formed through supervised classification using multispectral data from the Landsat 8 resource satellite OLI and were divided into four categories: construction land, agricultural land, vegetation cover, and water body (see Figure 6).
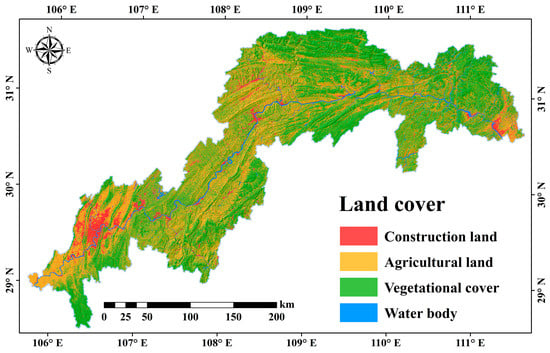
Figure 6.
Land cover map of TGRA.
2.3.4. Influence Intensity of River Systems
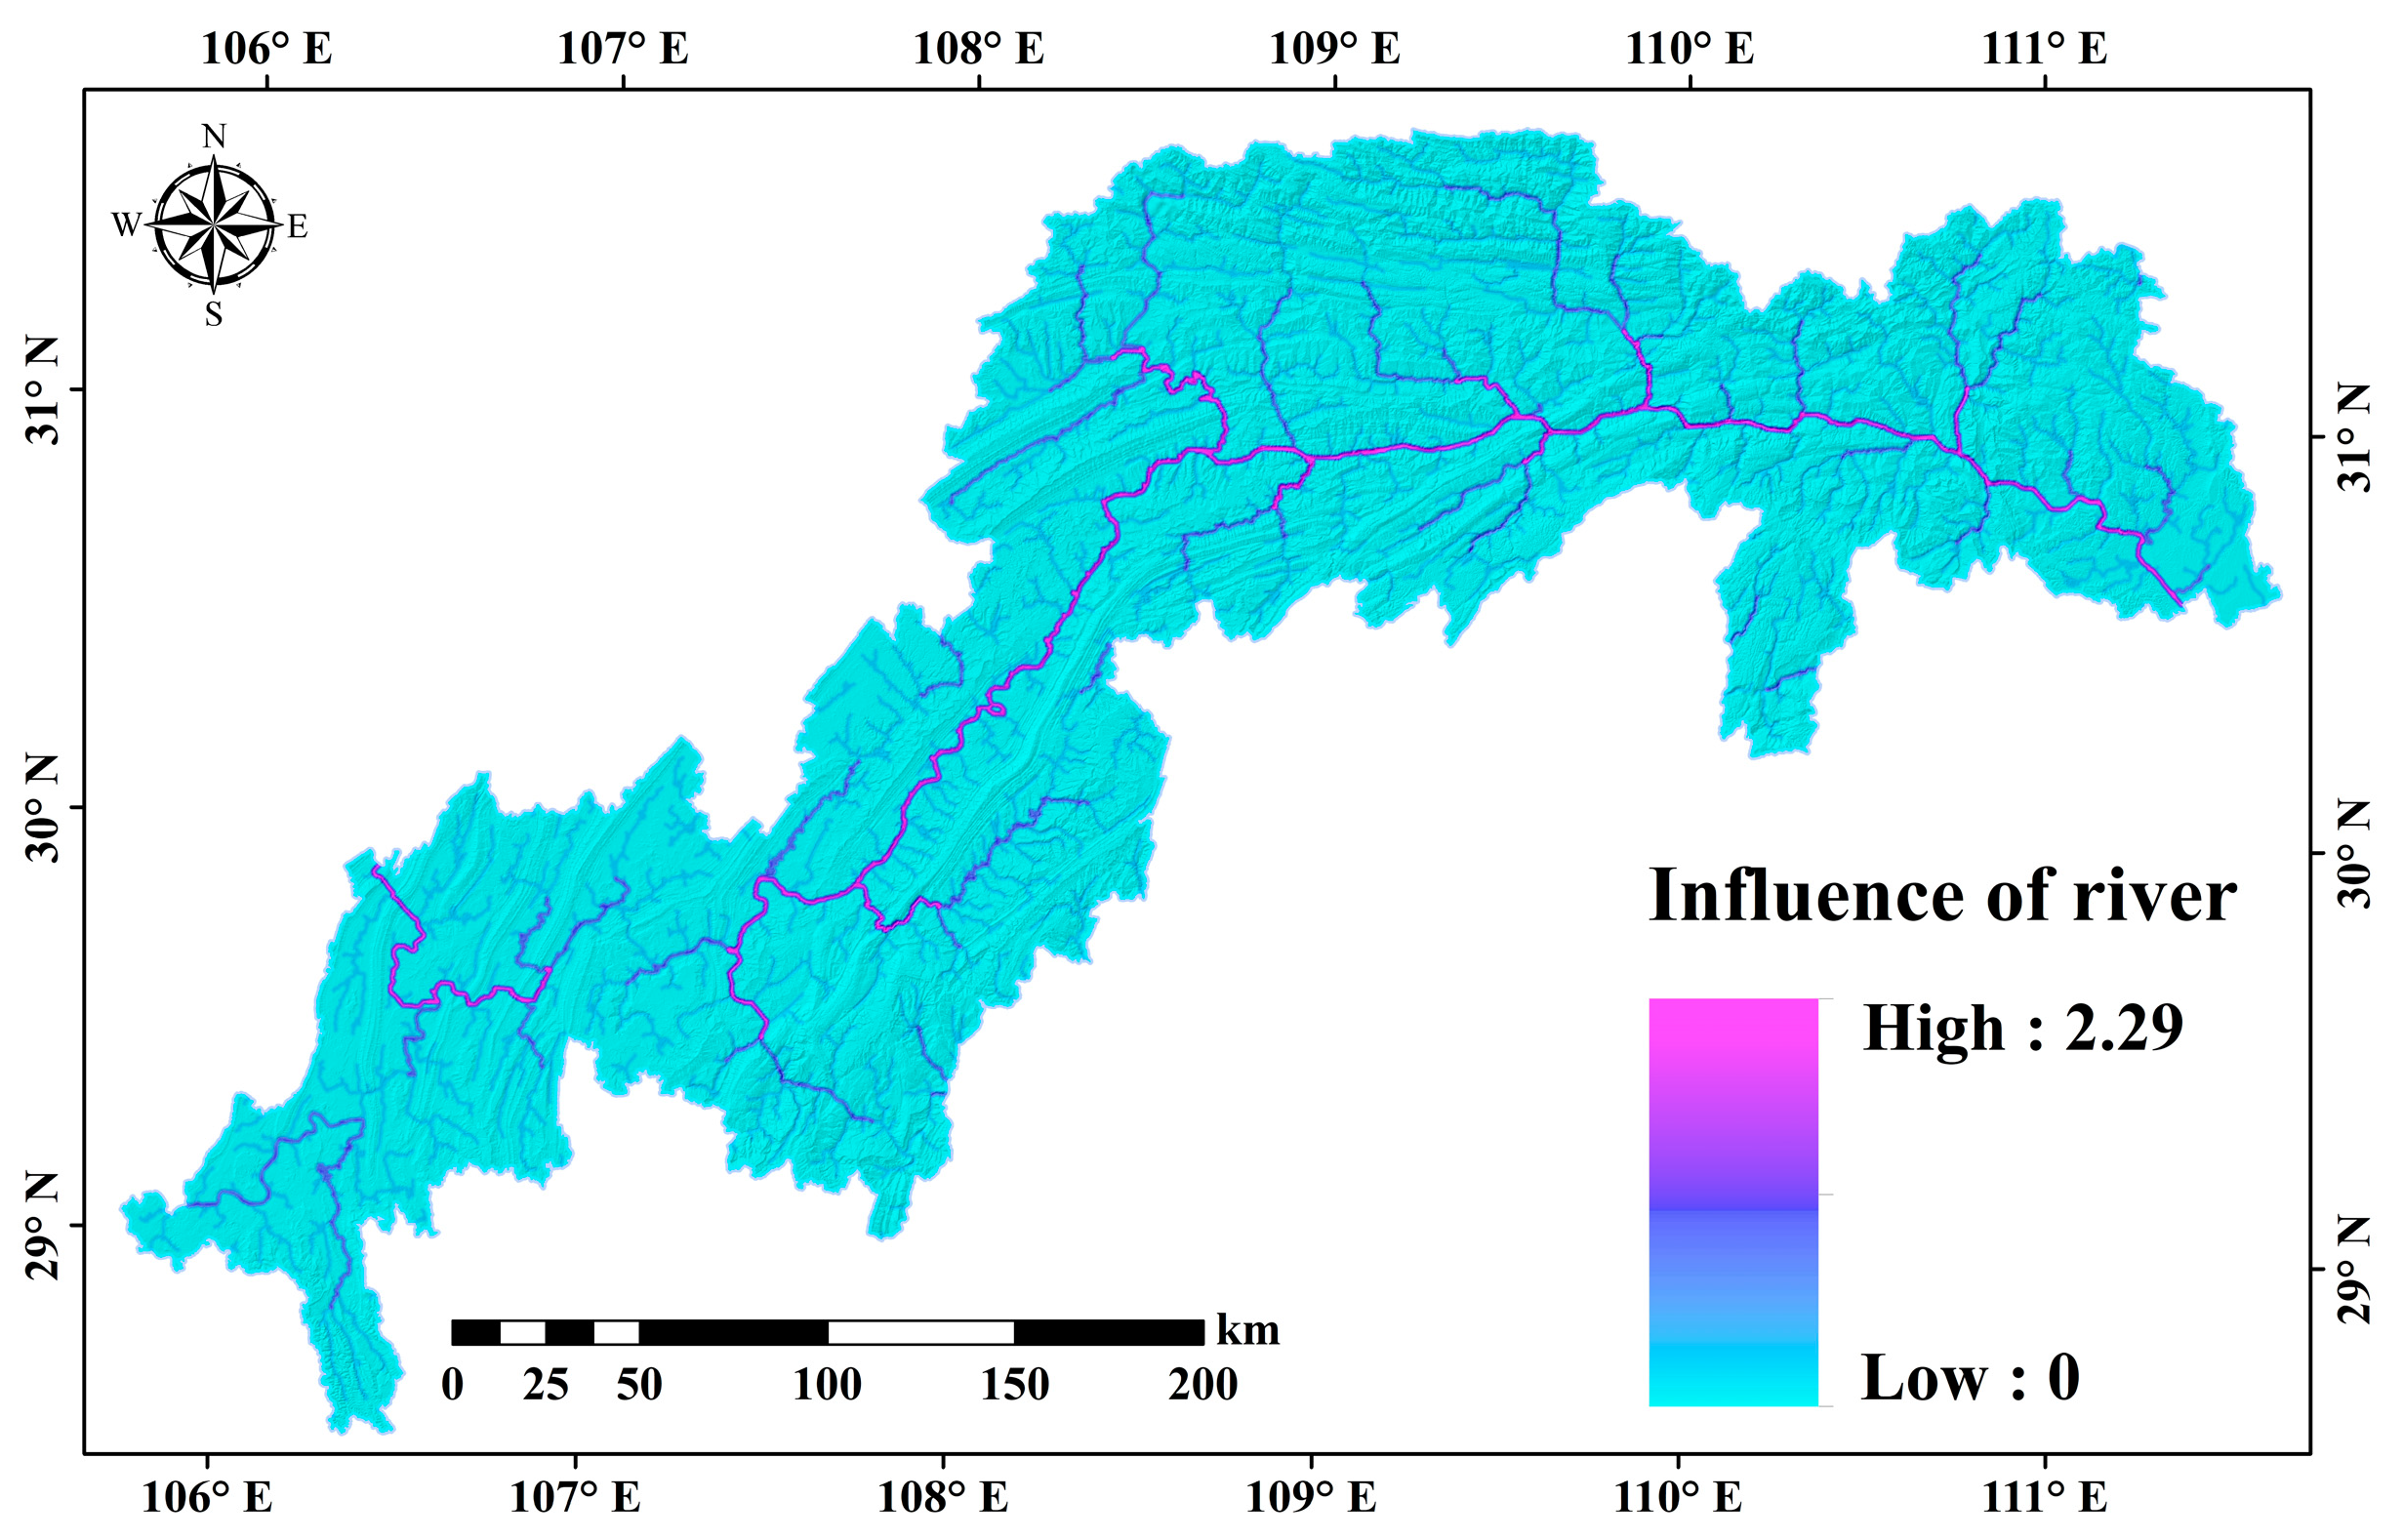
Rock and soil mass near the river are prone to softening due to the inundation of the river. At the same time, the underlying rock layer in the river is eroded by the water flow, resulting in the suspension of the landslide mass. As a result, water flow has a negative impact on the stability of the geotechnical slope mass. Landslides are more likely to occur in areas near water. The intensity of the water influence involves both the distance from the landslides to water and the river grade. This article used remote sensing images taken from GEE to identify and extract information about the surface of the water system (see Figure 7).

Figure 7.
Influence intensity distribution of river system in TGRA.
2.3.5. Normalized Difference Vegetation Index (NDVI)
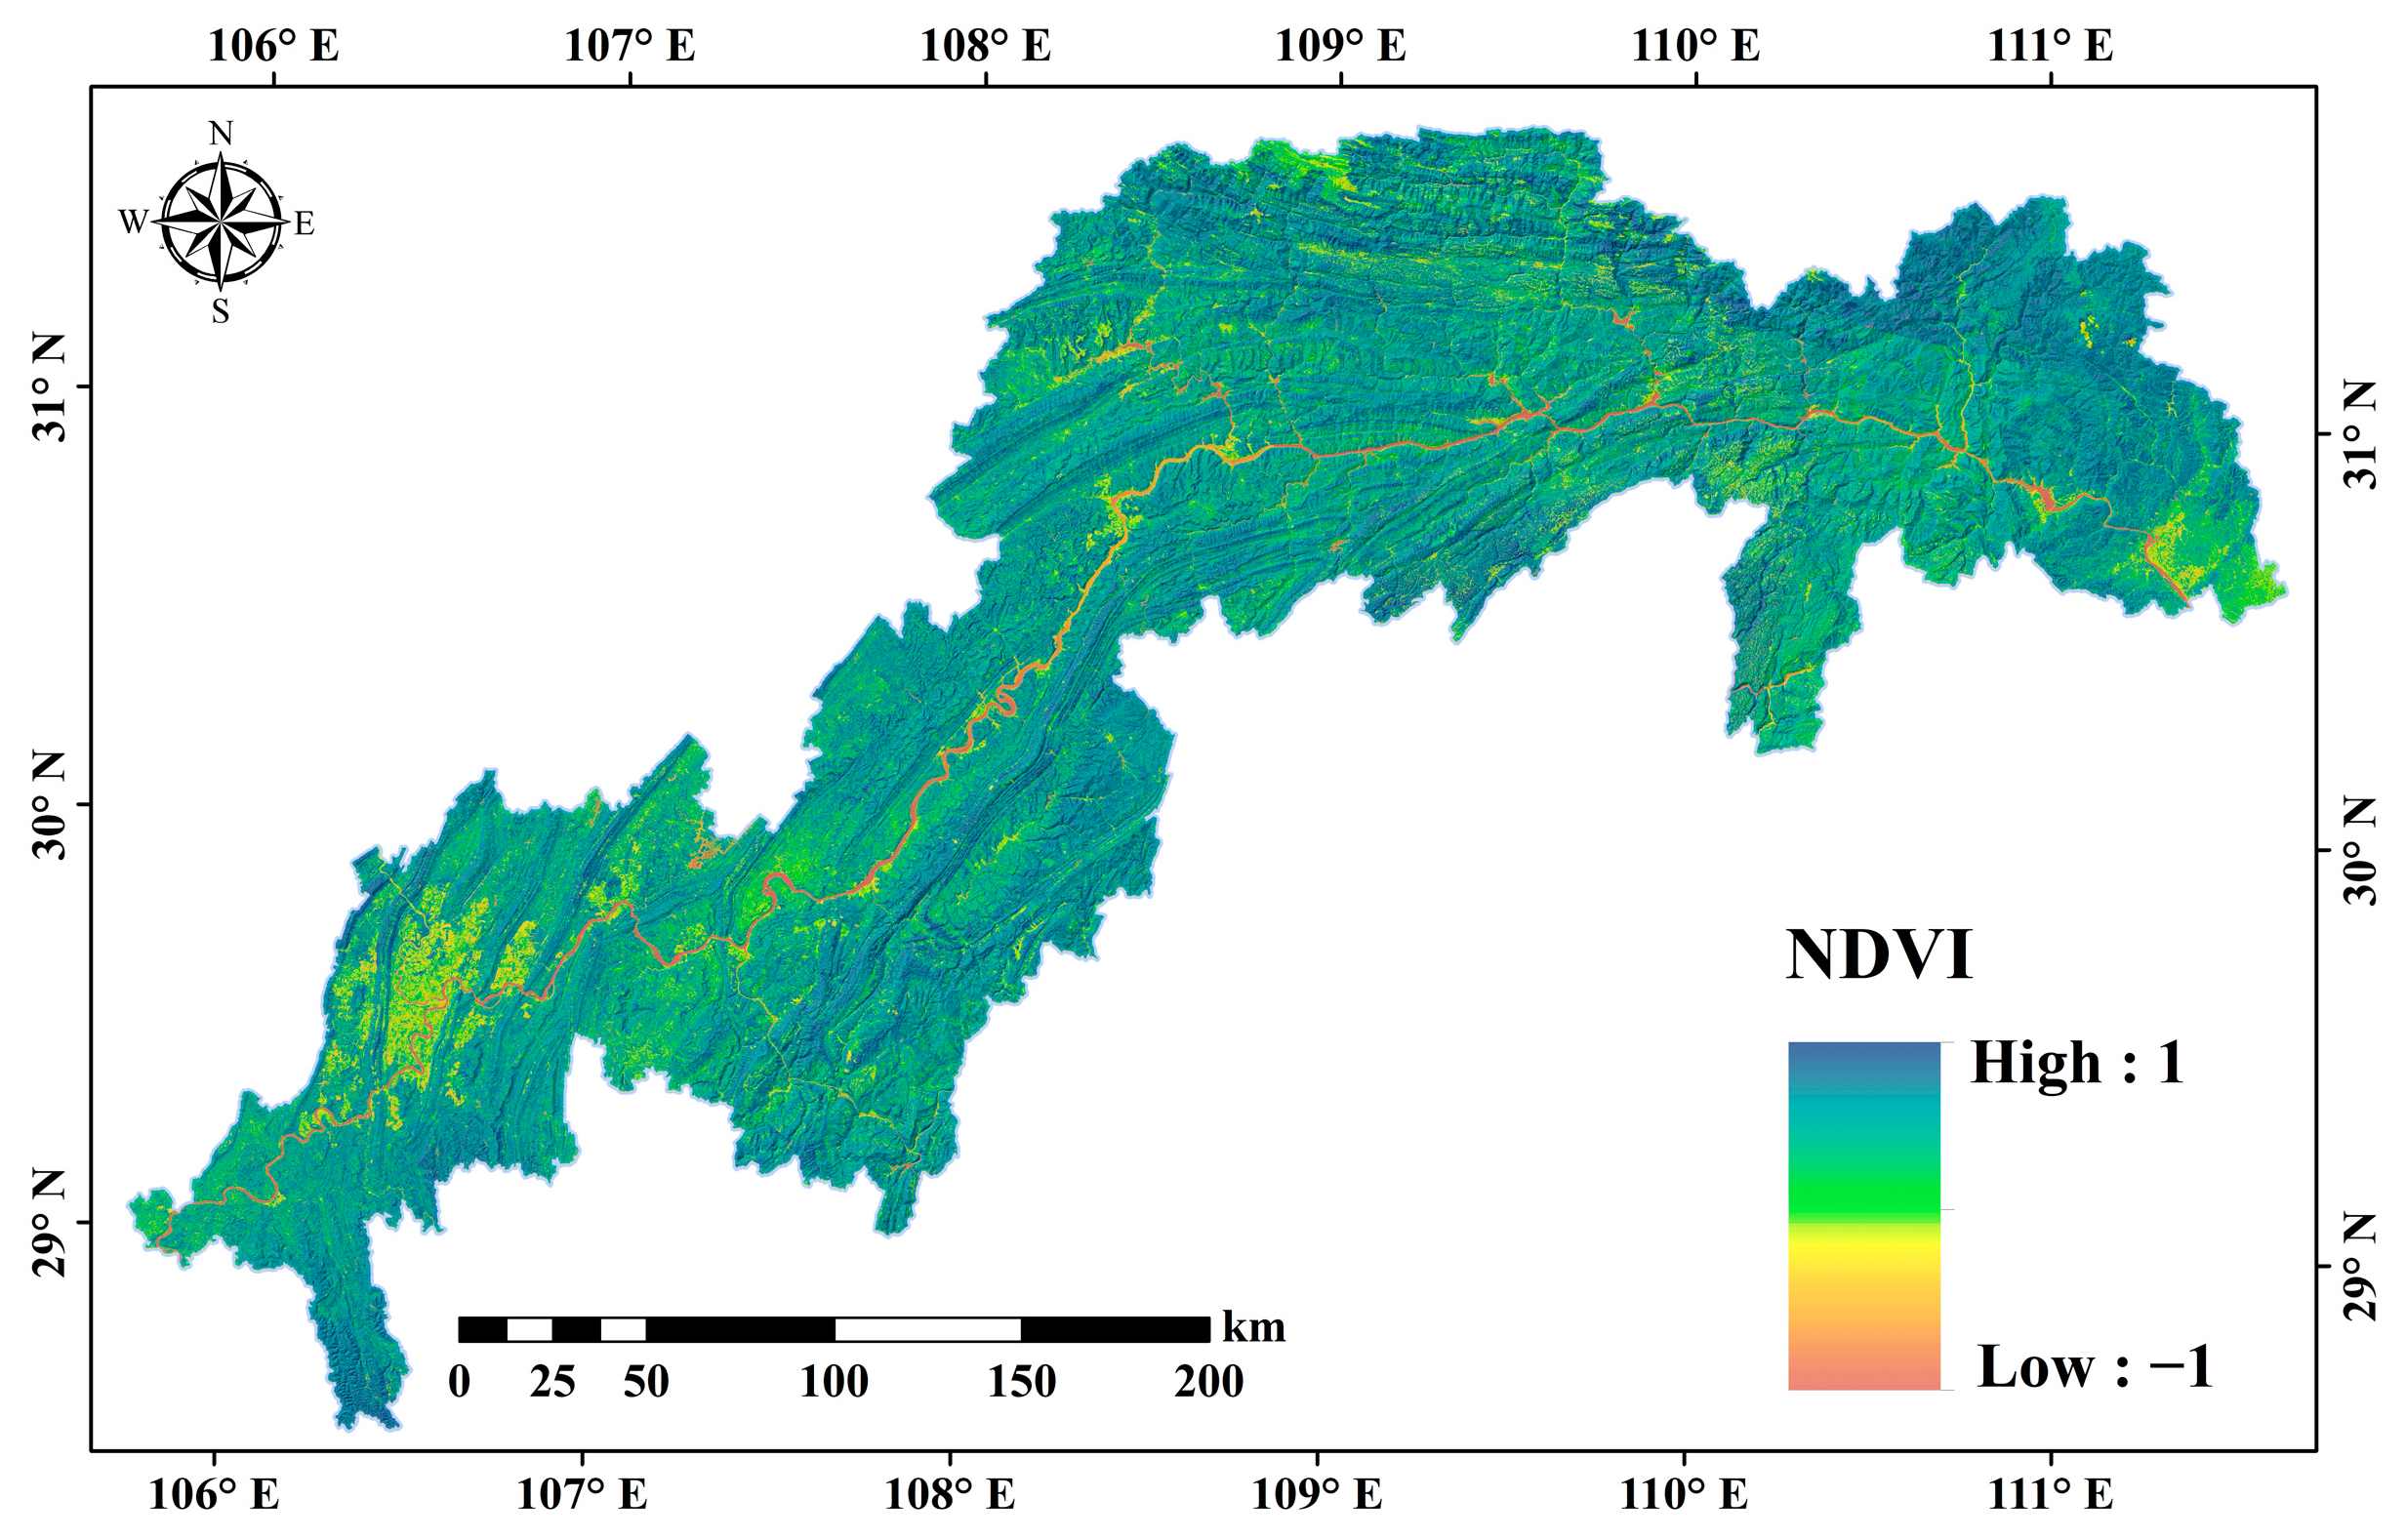
Vegetation plays a vital role in geological disasters because its root system increases the shear strength of the slope, reduces the impact of rain on the slope, and makes it more stable. At the same time, the leaves can help resist the erosion of rainwater, reduce the impact of rainwater on the slope, reduce surface runoff, and increase soil infiltration. The NDVI is defined as (RNIR − RRED)/(RNIR + RRED). It is obtained through the inversion of remote sensing images from GEE, and it indicates the vegetation coverage and growth status (see Figure 8).
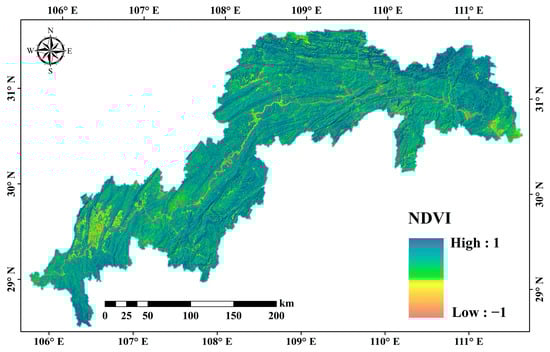
Figure 8.
Normalized difference vegetation index distribution in the TGRA. The NDVI value ranges from −1 to 1. Higher values indicate higher vegetation cover for agricultural land, grassland, and forests, while lower values indicate lower vegetation cover for construction land, water bodies, or bare land.
2.3.6. Average Annual Precipitation
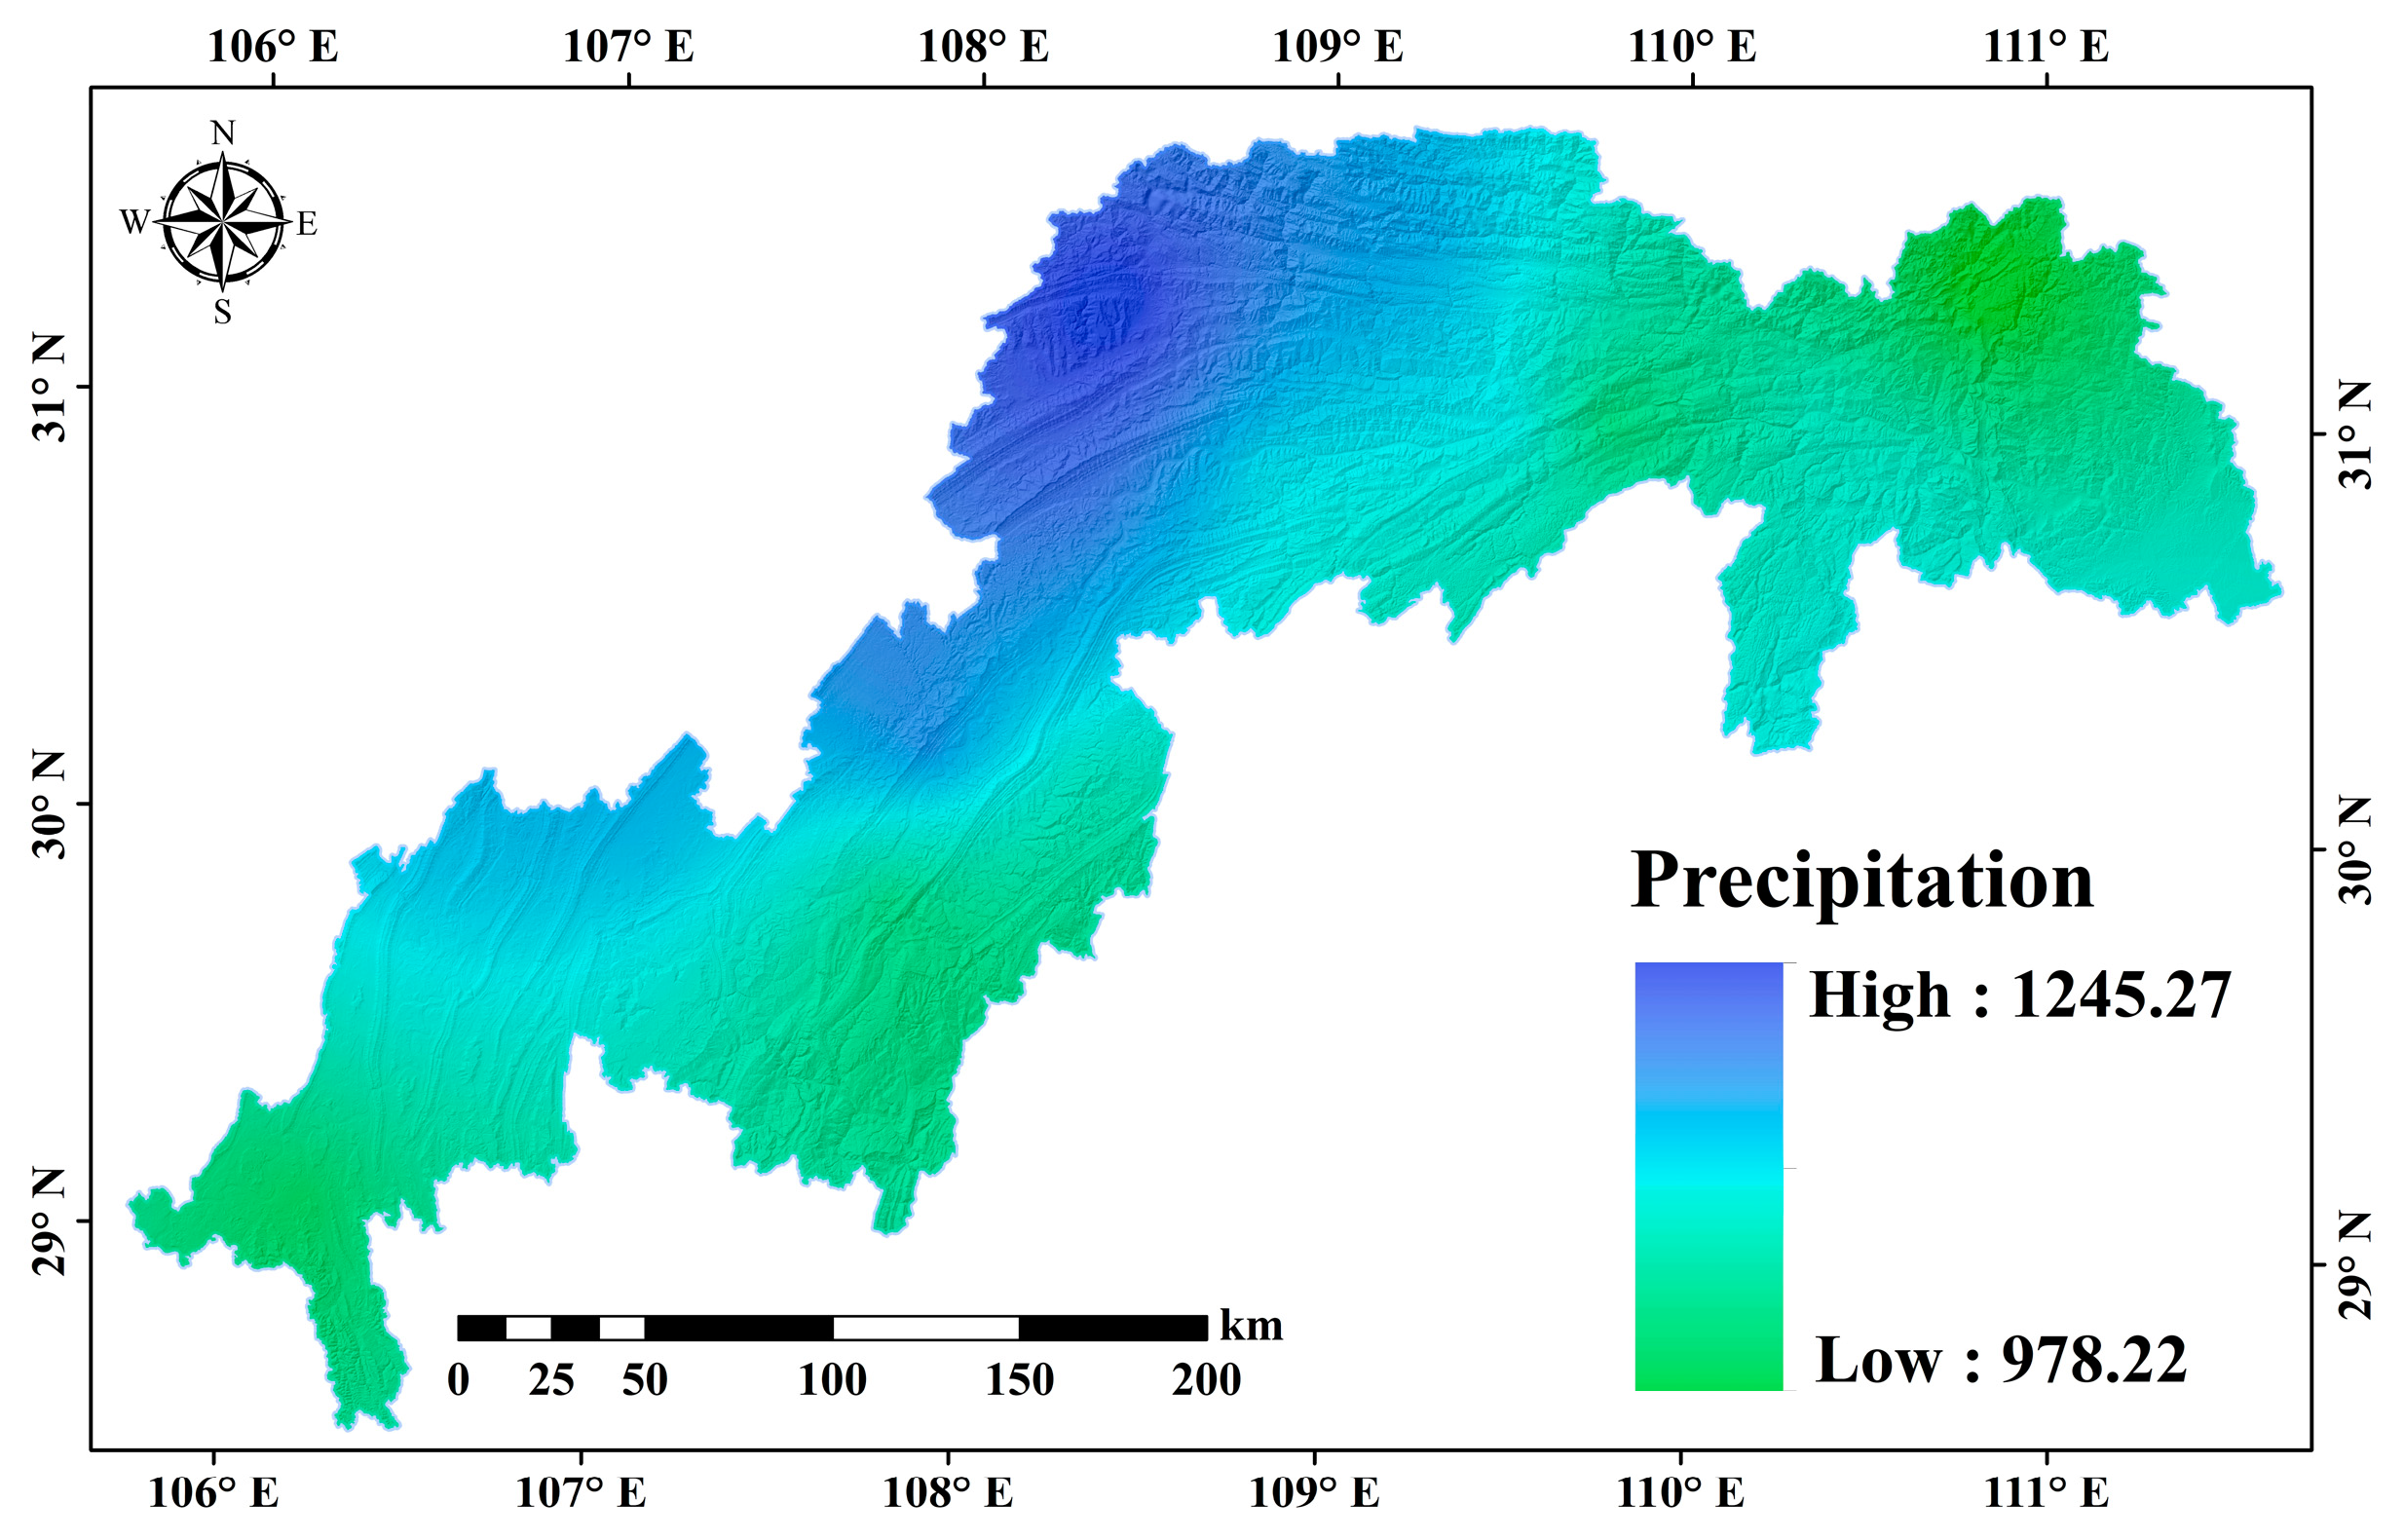
Rainfall is one of the factors that causes slope instability and landslides. The risk of landslides is higher during the rainy season. Rainfall infiltration increases the dead weight of the slope, weakens the shear strength, and unbalances the previously stable slope. Moreover, rainwater cannot percolate quickly enough during heavy rain events, so it converges in the valleys to form floods, which severely erode the slopes and lead to landslides. The average annual precipitation data came from NASA’s Global Precipitation Measurement (GPM) through GEE (see Figure 9).
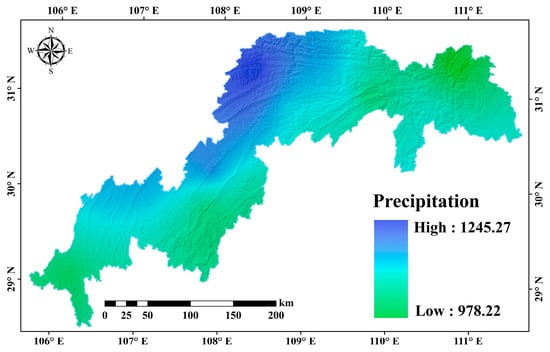
Figure 9.
The average annual precipitation of the TGRA. The average annual precipitation ranges from 978.22 to 1245.27, with more rain in the middle and less at the two ends.
2.3.7. Soil Moisture Index
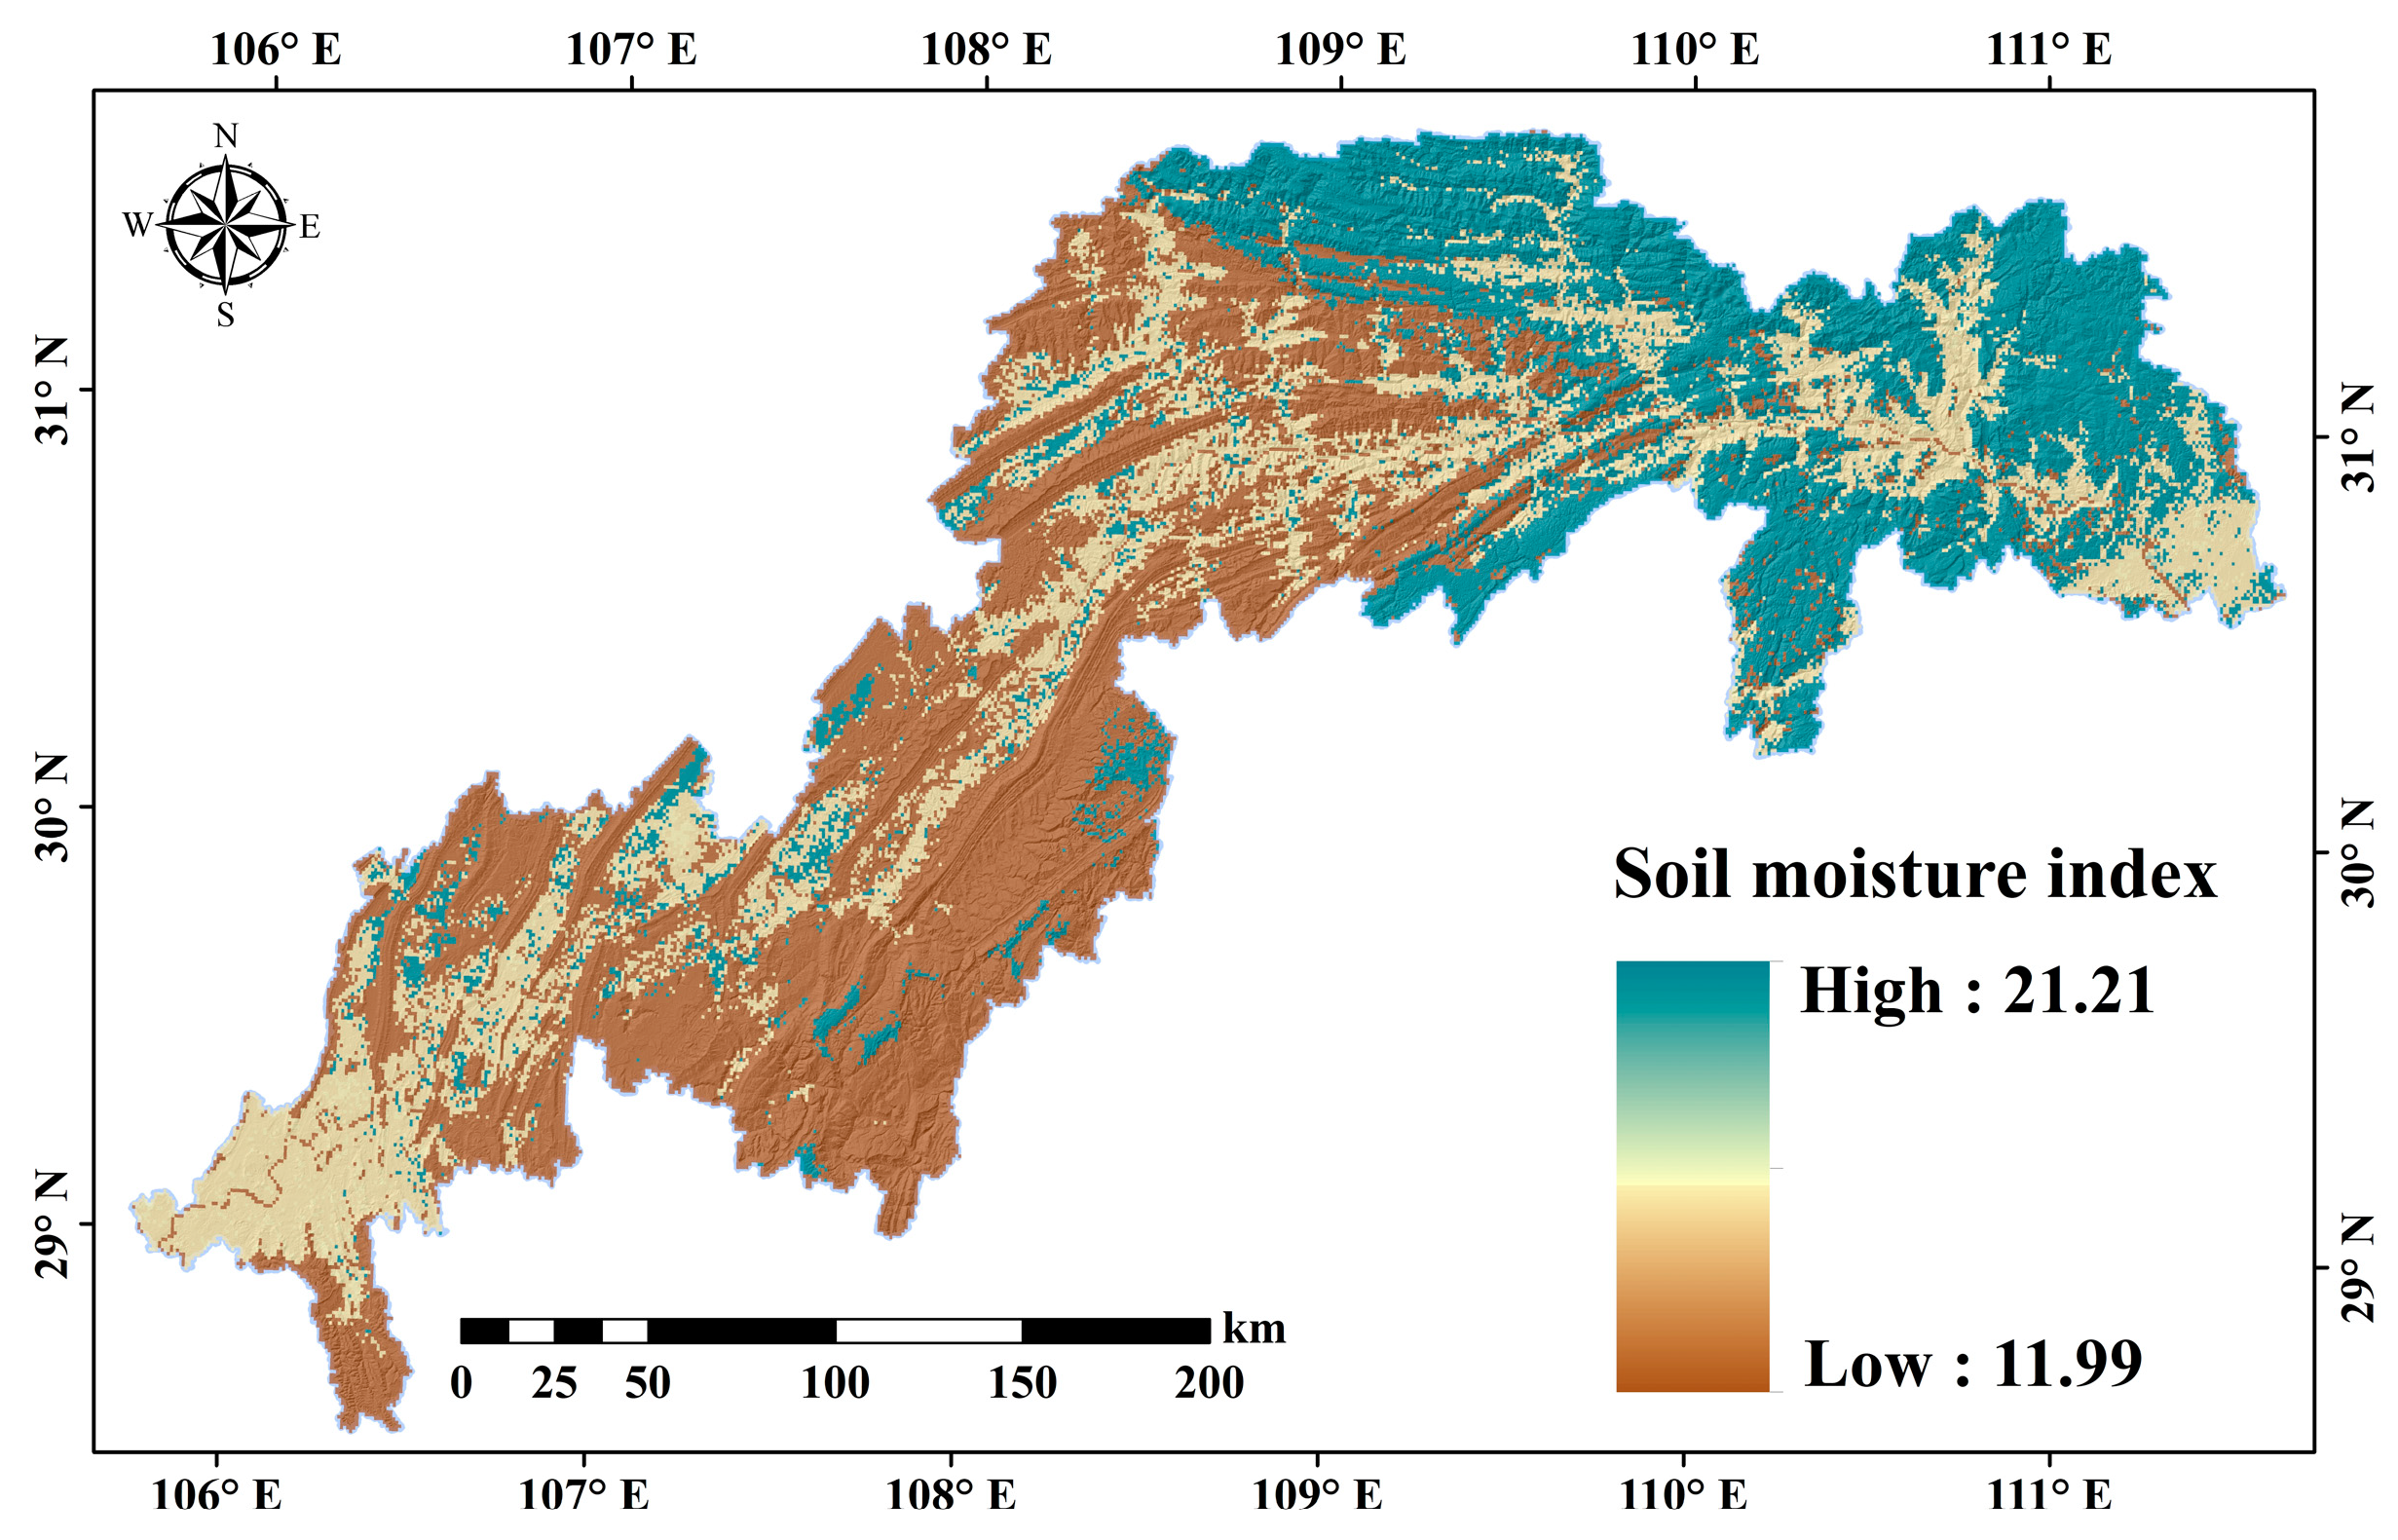
The soil’s water content affects the shear strength of soil. The percentage of sand and the porosity affects the formation of landslides, especially as the clay at the interface acts as a lubricant during the interaction of rainwater. As a result, landslides link intimately with soil moisture. Landslides are most common in areas with high soil moisture. The soil moisture index was determined on the GEE cloud platform. The spatial resolution of the soil moisture data is 0.25°, allowing for the determination of soil moisture distribution on the surface and in the subsurface, as well as data of abnormal soil moisture (see Figure 10).

Figure 10.
Soil moisture index distribution of the TGRA.
3. Methodology
Figure 11 illustrates the comprehensive process of landslide risk assessment using the Google Earth Engine cloud computing platform. The process begins with the collection of landslide and remote sensing data, including data from Landsat OLI and Google Earth for geographic and land cover information, as well as precipitation data from sources such as GPM, TRMM, and CHIRPS. These data inputs feed into an analysis of various landslide factors, categorized into geology, hydrology, geomorphology, and meteorology, which are essential in understanding the conditions contributing to landslide susceptibility.
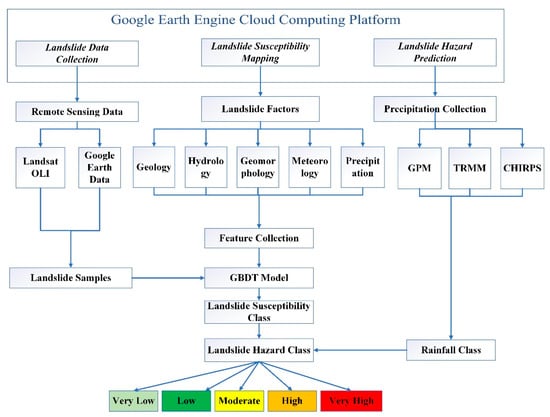
Figure 11.
Flowchart of study.
The collected data are then processed and compiled into a set of features that are used to train the Gradient Boosting Decision Tree (GBDT) model. This model predicts the susceptibility of different areas to landslides, classifying them into categories ranging from very low to very high susceptibility. The output from the GBDT model is integrated with current or historical rainfall data to predict and classify the landslide risk levels. This integration aids in producing a dynamic and spatially aware map of landslide risk, crucial for effective disaster management and mitigation planning. The diagram effectively conveys a systematic approach to leveraging advanced data collection and modeling techniques to assess and predict landslide risks using the capabilities of cloud computing for real-time analysis and decision support.
3.1. Basic Landslide Interpretation Method
It is necessary to learn the formation law of landslides before interpreting rainfall-induced landslides to avoid blindness in interpretation and to facilitate interpretation. From a morphological standpoint, when a landslide occurs, micro-geomorphic features of a circle chair shape with a steep surrounding and gentle middle tend to appear on the slope. A fully developed landslide usually has elements such as landslide mass, landslide perimeter, landslide cliff, landslide terrace, landslide tongue, landslide spindle, landslide drumlins, landslide cracks, sliding surface, sliding zone, and sliding bed. In reality, landslides have different shapes and often do not have all of the above elements, but landslide cliff, landslide mass, landslide perimeter, sliding zone, and landslide bed are present in all landslides [43,44,45]. As for remote sensing observations, the only basic elements that can be interpreted are the surface landslide cliff and landslide perimeter. Starting from the basic image characteristics of landslides, this paper establishes the remote sensing interpretation markers of rainfall-induced landslides in the TGRA: (1) Landslides are mainly flat or have irregular shapes such as a dustpan, tongue, and pear. Larger-scale landslides can have micro-topographic shapes such as landslide cliffs, landslide terraces, landslide drumlins, closed depressions, landslide tongues, and landslide cracks. (2) Landslides often manifest as sudden destruction of the continuous landforms. They are composed of two types of geomorphic units: steep slopes and gentle slopes. Due to the compression of the soil, uneven landforms can sometimes be seen below the slope. The gentle slopes often have relatively deep gullies developed, and the terrain is relatively fragmented. (3) Landslides are more often formed in the gentle slopes of the canyons and the shady slopes of the watershed. They can also form at the intersection of the main and branch ditches, where the erosion base level changes sharply, and at the head of the ditch.
3.2. Gradient Boosting Decision Tree Model
The Gradient Boosting Decision Tree (GBDT) model is one of the more successful algorithms in the boosting family and can be used for classification and regression [17]. It creates a decision tree from an initial value. The leaves of the tree show the predicted value and the residual, and the next decision tree is learned based on this residual. Each iteration improves on the previous result, reduces the residual of the previous model, and builds a new combinatorial model in the direction of the gradient of residual reduction. In the iteration of the GBDT, we assume that the strong classifier that we obtained in the previous step is , and the loss function at this point is . Then, the next step is to find a weak classifier . On the one hand, this classifier is part of the CART regression tree model; on the other hand, it can minimize the loss function:
where is the model prediction at iteration t for input . is the weak learner (e.g., a decision tree) added at iteration t. is the loss function.
For the -th iteration of sample , the negative gradient of the loss function can be expressed as follows:
A regression tree can be fitted using , where the leaf nodes of the regression tree are . is the number of leaf nodes.
For each sample of a leaf node, the best-fitting leaf node can be expressed as follows:
Therefore, the decision tree function for this iteration can be obtained as follows:
For a binary classification problem, the binary loss function of the GBDT can be described as follows:
The negative gradient error can be described as follows:
where is the negative gradient of the loss function for sample at iteration , which serves as the pseudo-response for the next learner to fit.
The optimal residual fit of each leaf node (Leaf Node) of the final decision tree can be expressed as follows:
where is the value for leaf of the new tree, which minimizes the loss when added to the existing model.
Using the Newton–Raphson formula, the above formula can be further approximated in the following form:
The final obtained is related to log-odds and can be used to perform probability calculations:
where is the probability of landslide occurrence of sample .
3.3. Rainfall Intensity–Duration Indicator
Rainfall is an important factor in the formation of landslides. When landslide accumulation is unsaturated, the infiltration of rainfall increases the weight of the landslide body. The influence of rainfall on the landslide body is determined by both the slope body’s infiltration capacity and rainfall intensity [46]. The infiltration capacity of a landslide body is related to the material composition and structure of the slope. When the rainfall intensity is low, all of the rainfall will infiltrate into the slope body; when the rainfall intensity is high, part of the rainfall infiltrates into the slope body, and the other part becomes surface runoff [47]. Rainfall intensity is mainly indicated by two factors: the amount of rainfall and rainfall duration. The Rainfall Intensity–Duration Index (I-D) takes the effects of these two factors into account. If the cumulative amount of rainfall at a given time exceeds a certain threshold, it is assumed that the rainfall at this specific time and location may cause a landslide. If the susceptibility to landslides at that location is high, then a landslide is very likely to occur at that time [48]. We use the cumulative 7-day rainfall as the measurement index and combine the rainfall threshold with the landslide susceptibility to obtain the hazard assessment results.
3.4. Dynamic Hazard Assessment System of Landslide Based on GEE (DHAS)
We created a DHAS system to make better use of the relevant data from the GEE cloud platform. The system uses JavaScript as the development language to conduct a dynamic hazard assessment of rainfall-induced landslides based on the GEE cloud platform. We extracted various factors related to landslide hazards in the TGRA on the GEE cloud platform, primarily the factor layers of elevation, slope, slope direction, rainfall, and NDVI [49,50]. We uploaded the stratigraphic lithology, geological structure, land cover type, and documented landslide data from our local system to the GEE cloud platform. The mighty computing power of the GEE cloud platform facilitates the dynamic landslide hazard assessment calculation. The results are displayed in real-time on the DASH system using big data visualization technology. This system enables dynamic monitoring and predictions in near-real time of rainfall-induced landslide hazards in the TGRA [28,51].
4. Results
4.1. Susceptibility Mapping of Rainfall-Induced Landslides
Landslide susceptibility mapping (LSM) is the prerequisite for hazard assessment. The basic idea behind landslide susceptibility mapping is to use the relationship between landslide occurrence and the factors influencing it to build a mathematical model and then to use it to calculate the probability of landslide occurrence in areas with the same geological environment, allowing for landslide spatial prediction. Quantitative landslide susceptibility mapping methods include physical-based methods and data-driven methods. This study uses the popular ensemble learning method, the GBDT, for landslide susceptibility mapping, which is a data-driven method. It is robust and can handle data of various types (continuous data or discrete data) flexibly. It has high prediction accuracy with only a few fitting parameters. The following are the main steps in implementing LSM:
(1). Selection of mapping unit. The mapping unit determines the amount of input data that we use in the model and the spatial resolution of the resulting graph. According to the needs of mapping at different scales, there are four commonly used LSM units: grid units, geographic units, slope units, and sub-watershed units. In this study, we chose the grid unit for mapping due to the large extent of the study area and discrete landslide locations. The spatial resolution of the grid was set to 30 m × 30 m, consistent with the spatial resolution of GEE online remote sensing data. Survey data such as engineering rock groups and average annual precipitation were resampled to 30 m. There was a total of 7,480,817 mapping units for the study area.
(2). Creation of sample dataset. In this study, we initiated our research by constructing an imbalanced dataset where positive samples (labeled 1) comprised all 5008 rainfall-induced landslides in the TGRA, along with the values of 10 influencing factors at their respective spatial locations. To provide a contrast, 15,024 random points were generated in areas devoid of landslides, with the values of the same 10 influencing factors constituting the negative samples (labeled 0). This led to the creation of a 20,032 × 11 (one label, ten features) two-dimensional sample dataset by merging these positive and negative samples. To maximize the utilization of information from non-landslide areas and to ensure a robust analysis, the dataset was deliberately imbalanced with fewer landslide than non-landslide samples. Further data processing involved extracting values from various landslide factor layers to the landslide samples using the ‘Extract Multi Values to Points’ function in ArcGIS. The data compiled into a two-dimensional decision table were then subjected to several preprocessing steps: handling missing values, normalizing the data to ensure a uniform scale, analyzing multicollinearity to identify and correct highly correlated variables, and reducing data dimensionality. These preprocessing measures were essential to enhance the data’s representativeness and the robustness of the predictive model, ensuring accurate landslide risk assessment.
(3). Building the prediction model. The sample data were randomly divided into a training set (80%) and a test set (20%). The training set was used to create the optimal model, and the test set was used to test how well the model could be generalized. We chose the log-likelihood function “deviance” as the loss function. The initial learning rate was 0.1, and the optimal hyperparameters of the model were determined step by step using the grid search method.
To provide a more comprehensive understanding of the performance metrics used to evaluate the GBDT model in our study, here are the formulas for accuracy, precision, recall, and F1 score:
Accuracy measures the proportion of true results (both true positives and true negatives) among the total number of cases examined. Here, (true positives) is the number of correct predictions when an instance is positive, (true negatives) is the number of correct predictions when an instance is negative, (false positives) is the number of incorrect predictions when an instance is positive, and (false negatives) is the number of incorrect predictions when an instance is negative.
Recall is the ratio of correctly predicted positive observations to all observations in the actual class. It is a measure of the model’s ability to find all of the relevant cases within a dataset.
Precision is the ratio of correctly predicted positive observations to the total predicted positives. It is a measure of the accuracy of the positive predictions.
The F1 score is the weighted average of precision and recall. This score takes both false positives and false negatives into account. It is particularly useful when the classes are very imbalanced. The F1 score is a way of combining the precision and recall of the model, and it is defined as the harmonic mean of the model’s precision and recall.
According to the prediction results on the test set, the accuracy, recall, precision, and F1 scores of the GBDT model were 0.951, 0.862, 0.957, and 0.907, respectively. This model had good accuracy and could be used to perform LSM.
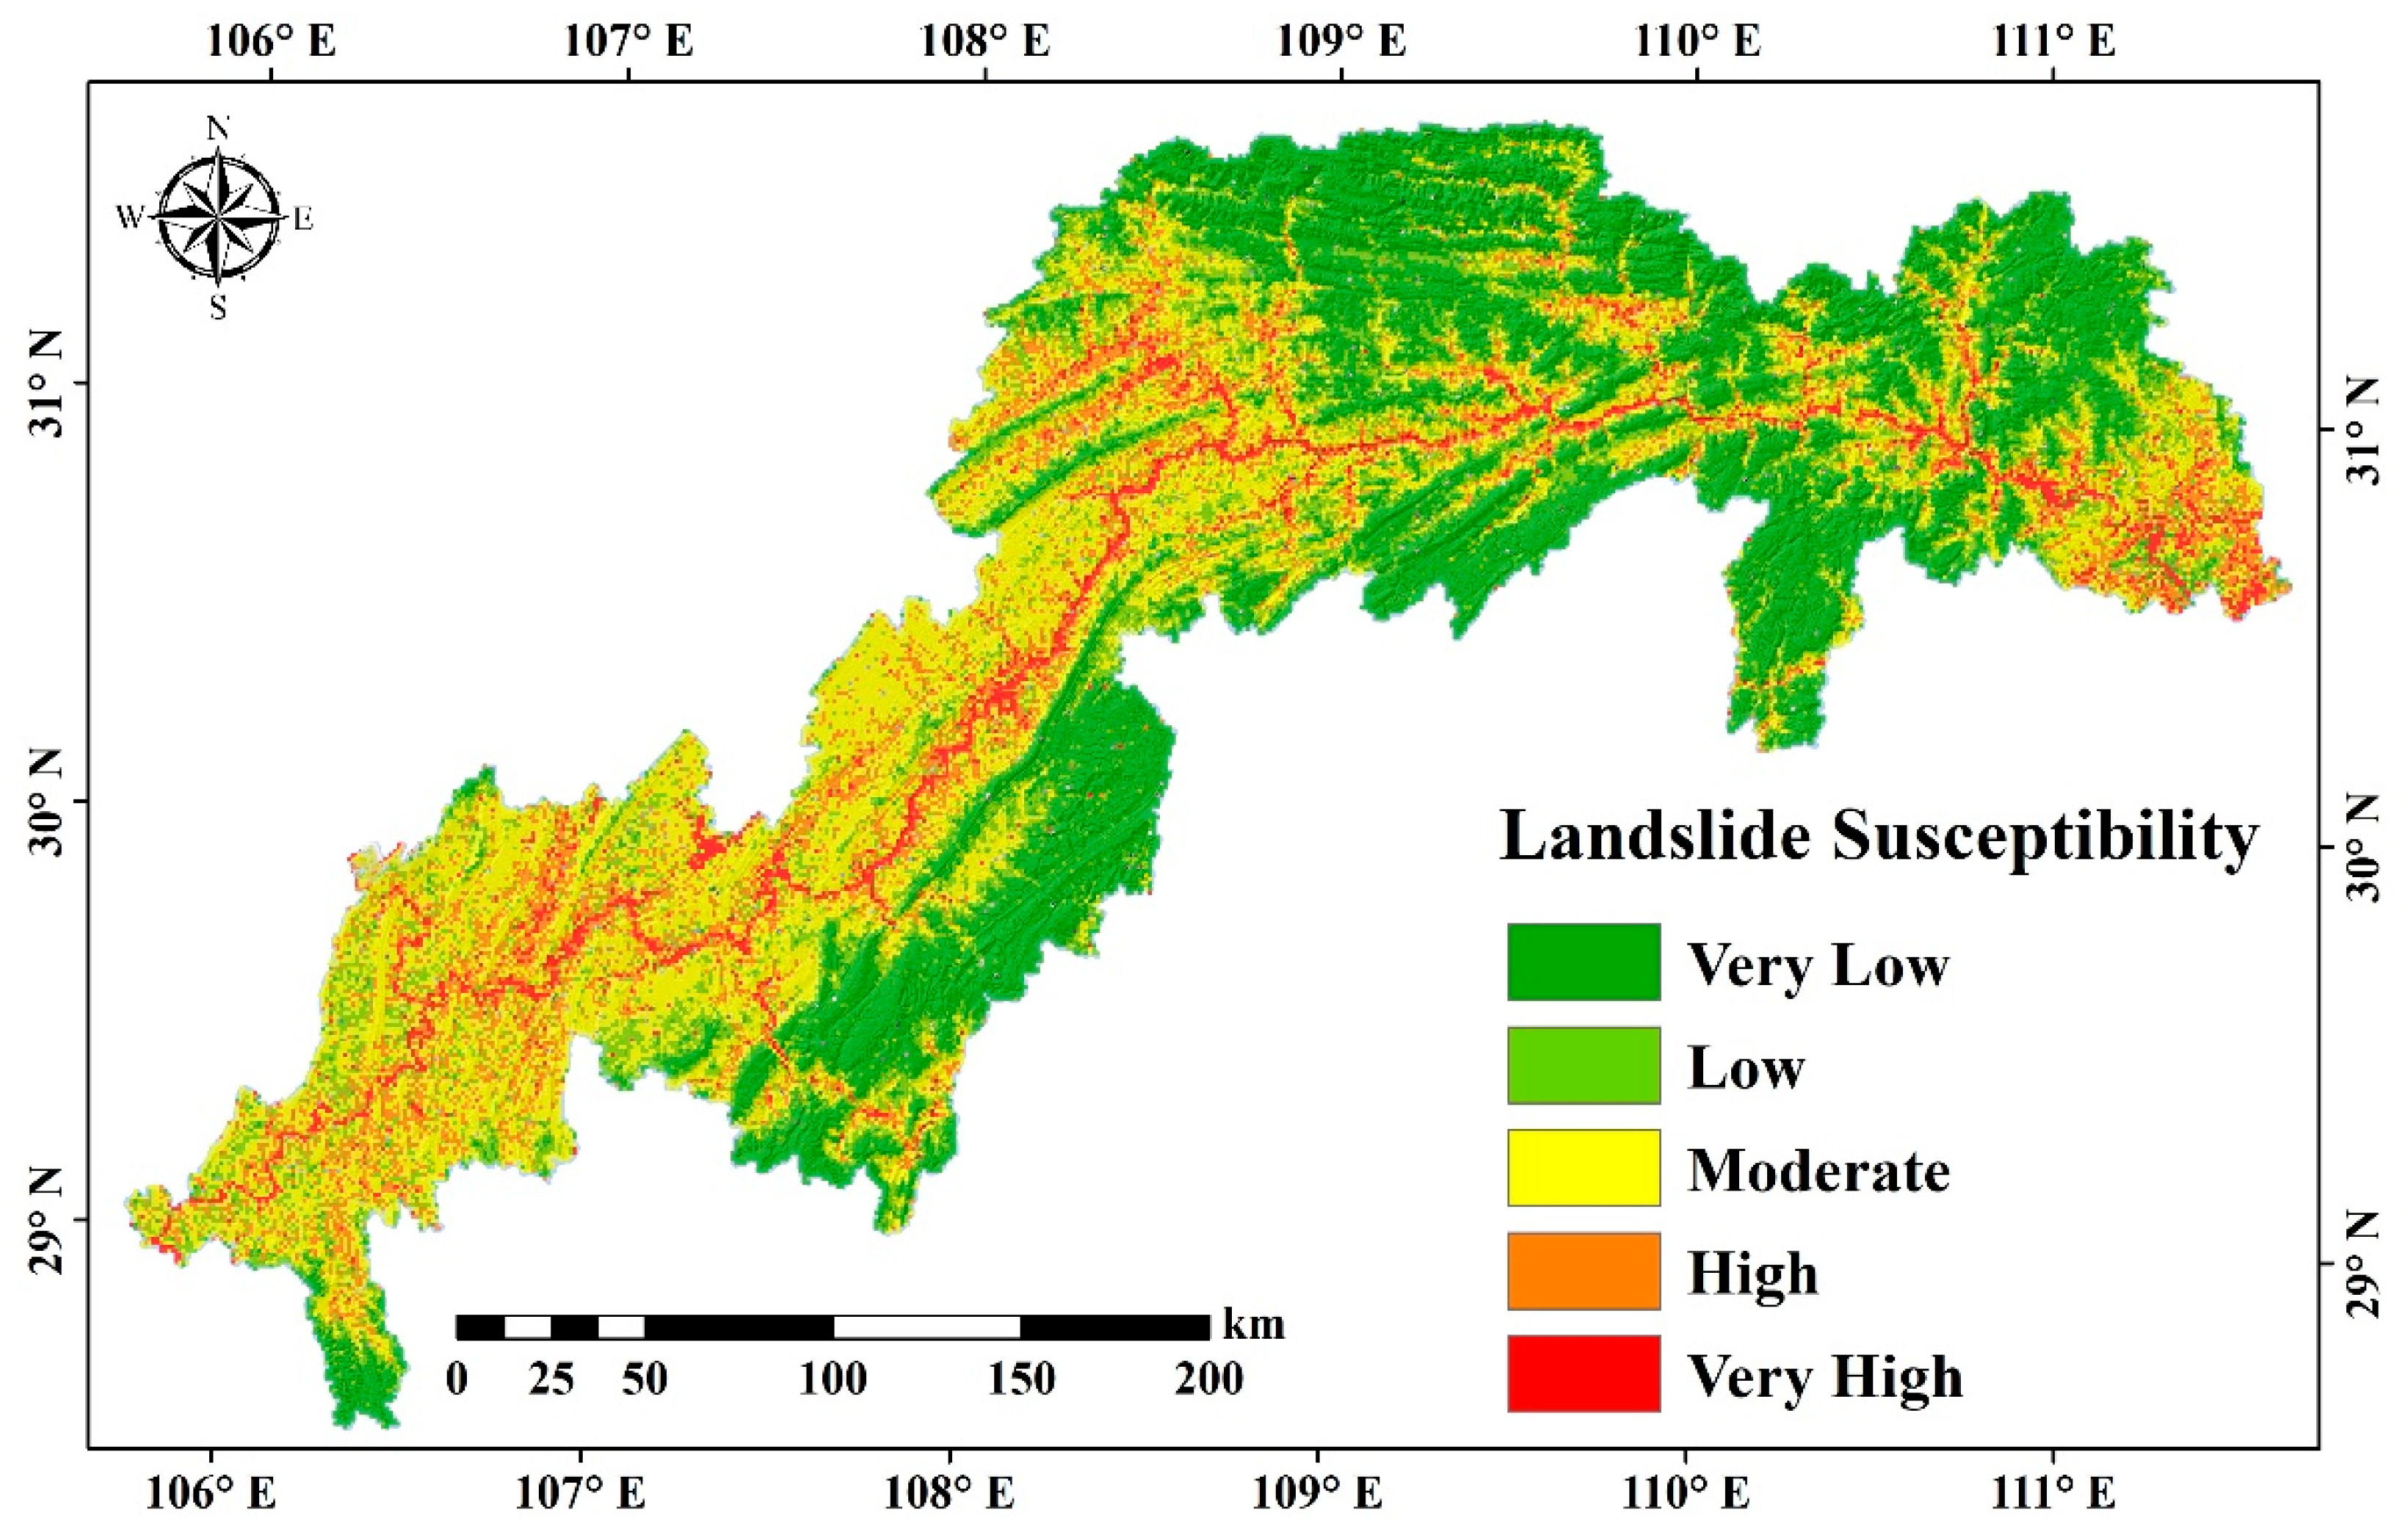
(4). Application of the model. The influencing factor values of all grid units in the study area were derived based on their spatial position to produce the dataset to be predicted. The best model that passed the test was used on the dataset and generated the landslide probability on each grid unit. The landslide prediction index (LPI) map was then created based on the latitude and longitude of each grid unit. Using the natural breakpoint method, the LPI was classified into five categories: very low, low, moderate, high, and very high, representing the degree of landslide susceptibility. The corresponding LPI ranges were 0–0.148, 0.148–0.327, 0.327–0.576, 0.576–0.797, and 0.797–1 (see Figure 12).

Figure 12.
Susceptibility mapping of rainfall-induced landslides in the TGRA.
From the landslide susceptibility map (see Figure 12) and the distribution characteristics of the water system, we can conclude that the highly susceptible areas in terms of geological disasters in the TGRA are concentrated along the mainstream of the Yangtze River and its major tributaries, namely Xiangxi, Qinggan, Daning, Meixi, and Tangxi. Geological disasters are concentrated in the Zigui Basin and northeastern Chongqing. Based on the engineering rock group layers and landslide susceptibility mapping, we found that clastic rock areas, including the Jurassic strata and the Triassic Badong strata, are all located in the moderate or high landslide susceptible areas. For the overall distribution, susceptibility to landslides in the TGRA was primarily determined based on engineering rock groups, topography, and rivers. At the local level, landslides were influenced by geomorphic type and land cover.
4.2. Dynamic Hazard Assessment of Rainfall-Induced Landslides
In this paper, regional landslide susceptibility levels and cumulative rainfall levels are used to assess the risk of landslide disasters. Landslide susceptibility mapping provided the spatial probability of landslides, and the temporal probability of landslides was obtained from the temporal rainfall accumulation. Combining the spatial and temporal probabilities, we could simulate the dynamic distribution on the time series of landslide hazards in the region using near-real-time spatial rainfall data provided by the GEE cloud platform.
4.2.1. Temporal Rainfall Accumulation Grading
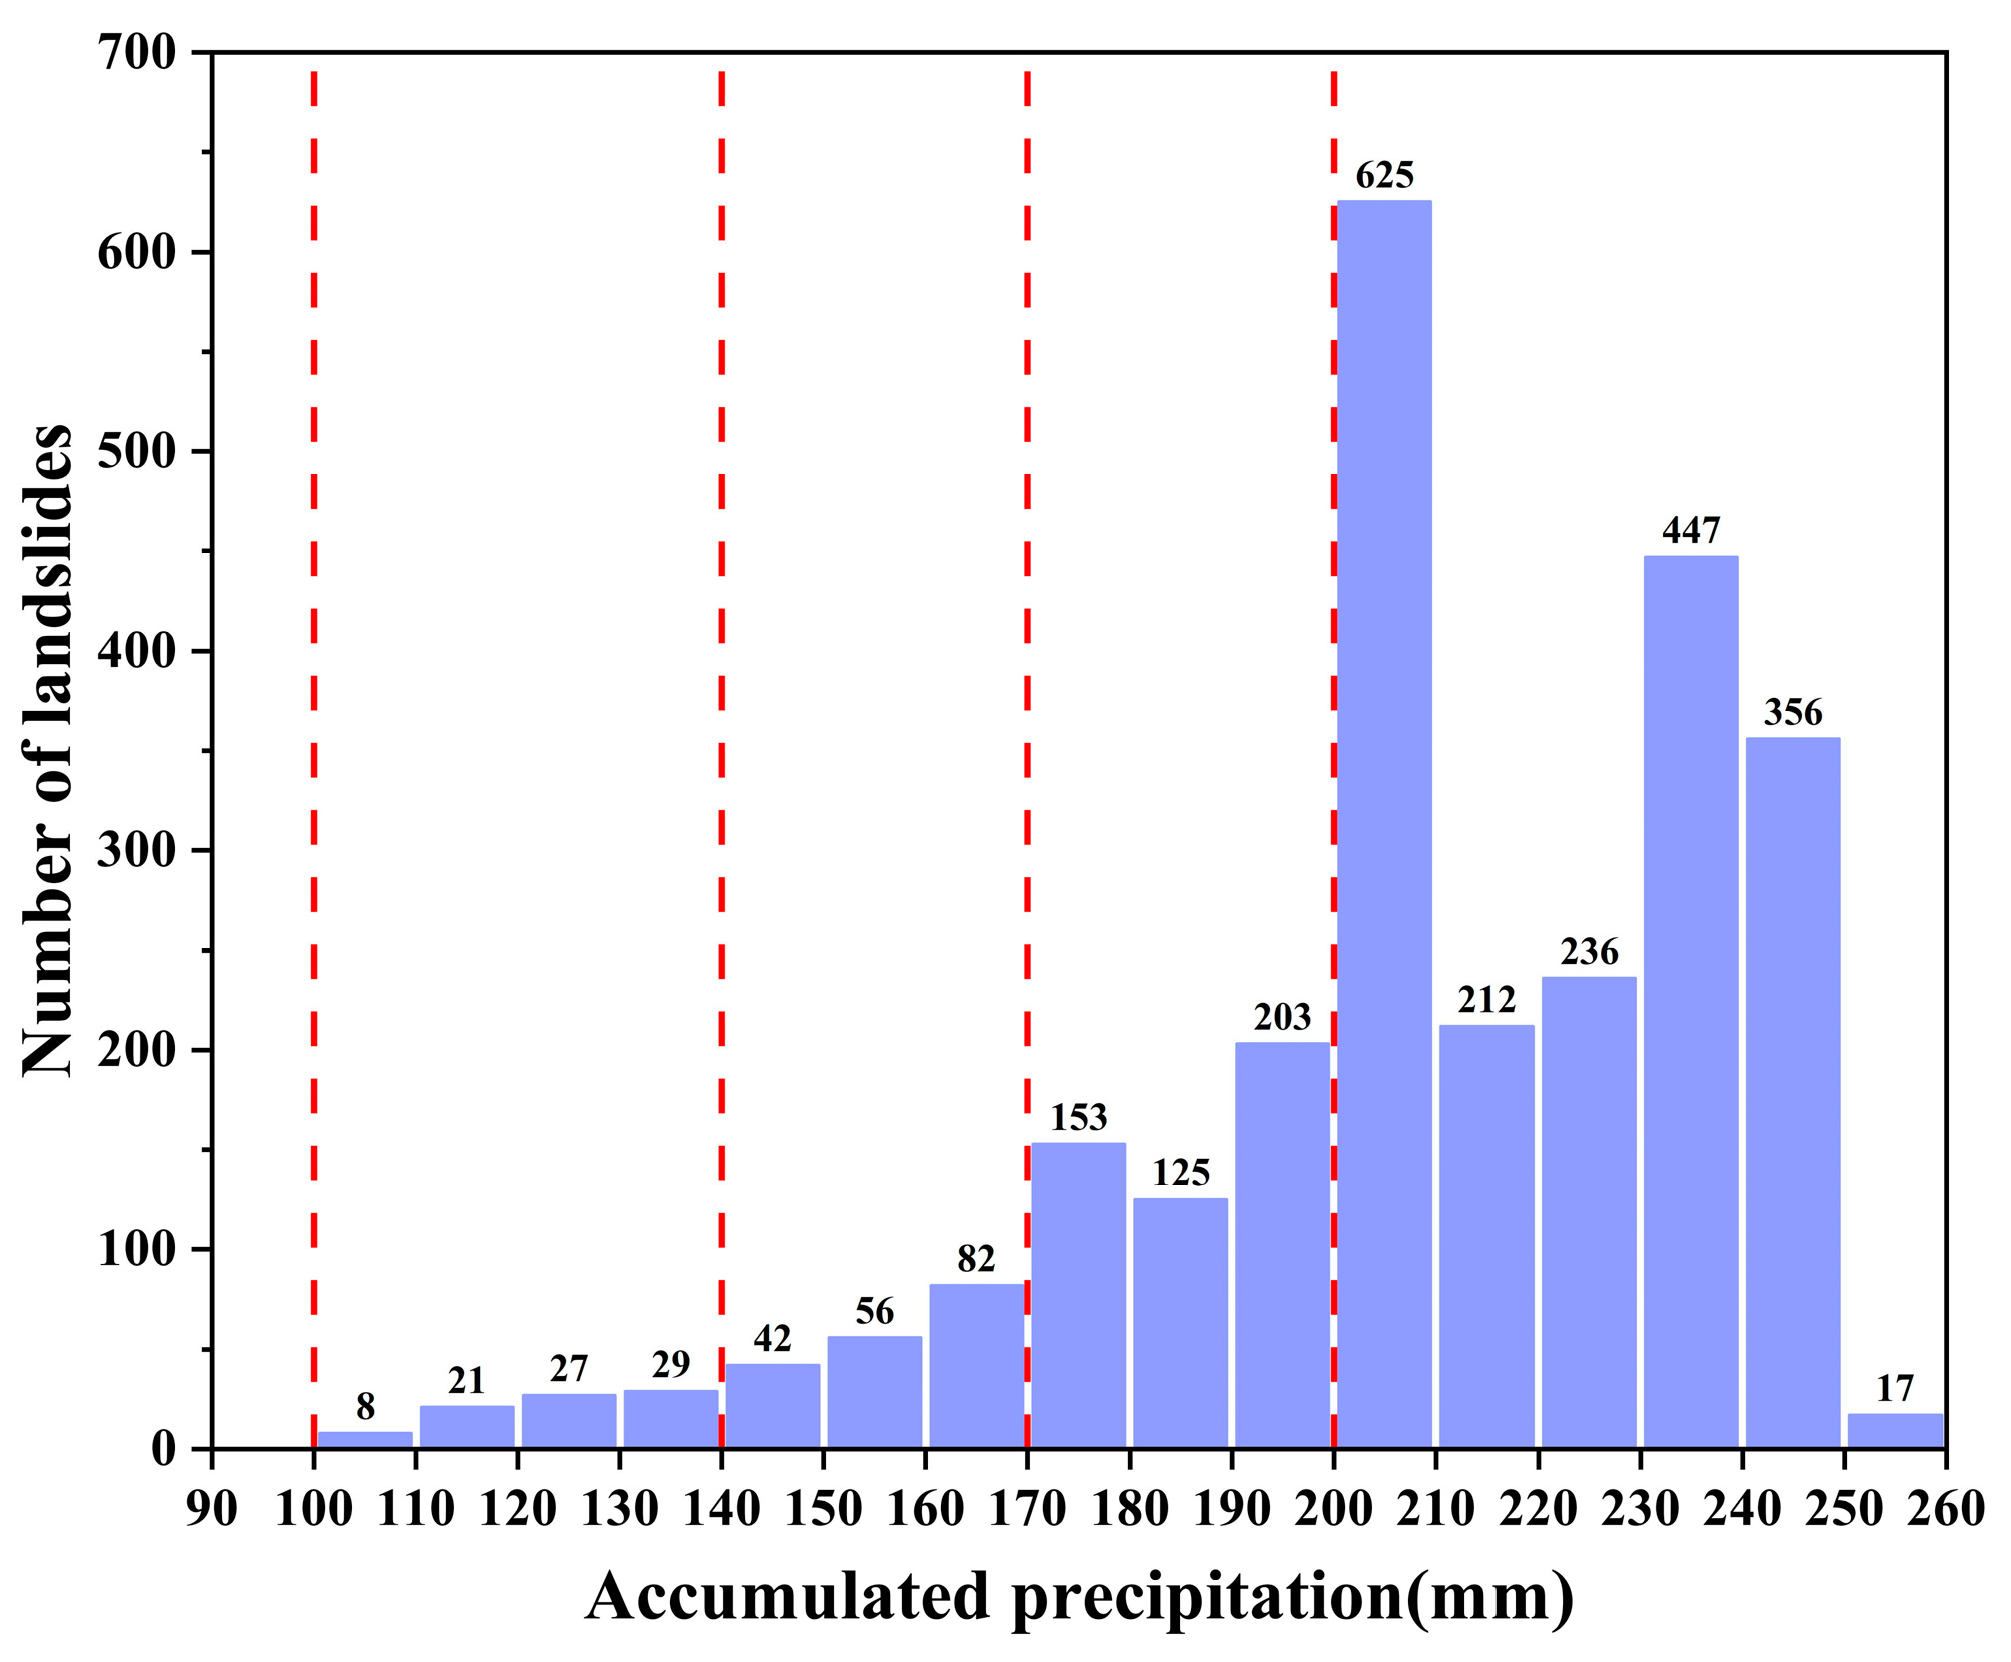
In this paper, the method for determining the gradings of temporal rainfall accumulation used the Rainfall–Duration (I-D) Indicator. This method is an empirical mathematical–statistical model that builds on the relationship between rainfall accumulation and landslides in the real world, using the rainfall accumulation data from seven days before the occurrence of landslides as the measurement standard. There were a total of 5008 rainfall-induced landslides cataloged, with 2639 landslides with exact occurrence dates after 1980 occurring between 8 July 1980 and 4 September 2012 (see Figure 13). NOAA’s National Centers for Environmental Information (NCEI) Global Summary of the Day provided the daily rainfall data from precipitation monitoring stations in the TGRA. Daily rainfall data from central monitoring stations were available from 1 January 1951 to the present. Each landslide was associated with the nearest precipitation monitoring station based on its spatial position, and precipitation accumulation data for the seven days before each landslide were obtained using the ArcGIS Python script. From the statistical relationship between historical landslides and rainfall accumulation (Figure 14), we can see that the accumulated 7-day rainfall that induced landslides could be divided into five levels, namely no occurrence of landslides, random occurrence, local occurrence, group occurrence, and massive occurrence. The accumulated precipitation levels were <100 mm, 100–140 mm, 140–170 mm, 170–200 mm, and >200 mm, respectively.
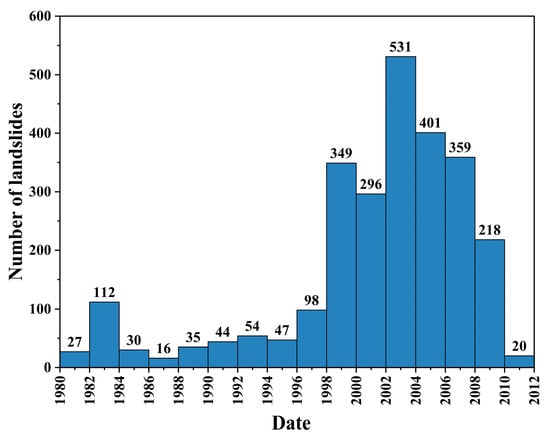
Figure 13.
Temporal distribution of rainfall-induced landslides in TGRA.

Figure 14.
Statistical relationship between historical landslides and 7-day accumulative precipitation in TGRA.
4.2.2. Dynamic Hazard Assessment of Rainfall-Induced Landslides
Combining the grading of temporal rainfall accumulation with the landslide susceptibility classification yielded a semiquantitative classification table for landslide hazard assessment. The hazard of landslides can be classified into five categories, namely very high, high, moderate, low, and very low, corresponding to different susceptibilities of landslides and the threshold of temporal rainfall accumulation. These five levels are red, orange, light green, blue, and purple, as shown in Table 2. Based on this table, we can intuitively assess the hazard level of rainfall-induced landslides in any time series at any spatial position in the study area using the precipitation radar satellite data, which are updated in near-real time, to prevent and mitigate disasters in real time.
Table 2.
Classification sheet of landslide risk based on gradings of temporal rainfall accumulation. Red, orange, light green, light blue, and dark blue respectively denote the five levels of landslide hazard: very high, high, moderate, low, and very low.
After completing the modeling of the hazard assessment of rainfall-induced landslides, this paper selected a typical rainfall event in the TGRA. Based on the temporal and spatial distribution of rainfall in the study area, we successfully conducted a dynamic assessment of the risk of rainfall-induced landslides in this case and analyzed the temporal and spatial variation law of the rainfall-induced landslide hazards in the TGRA.
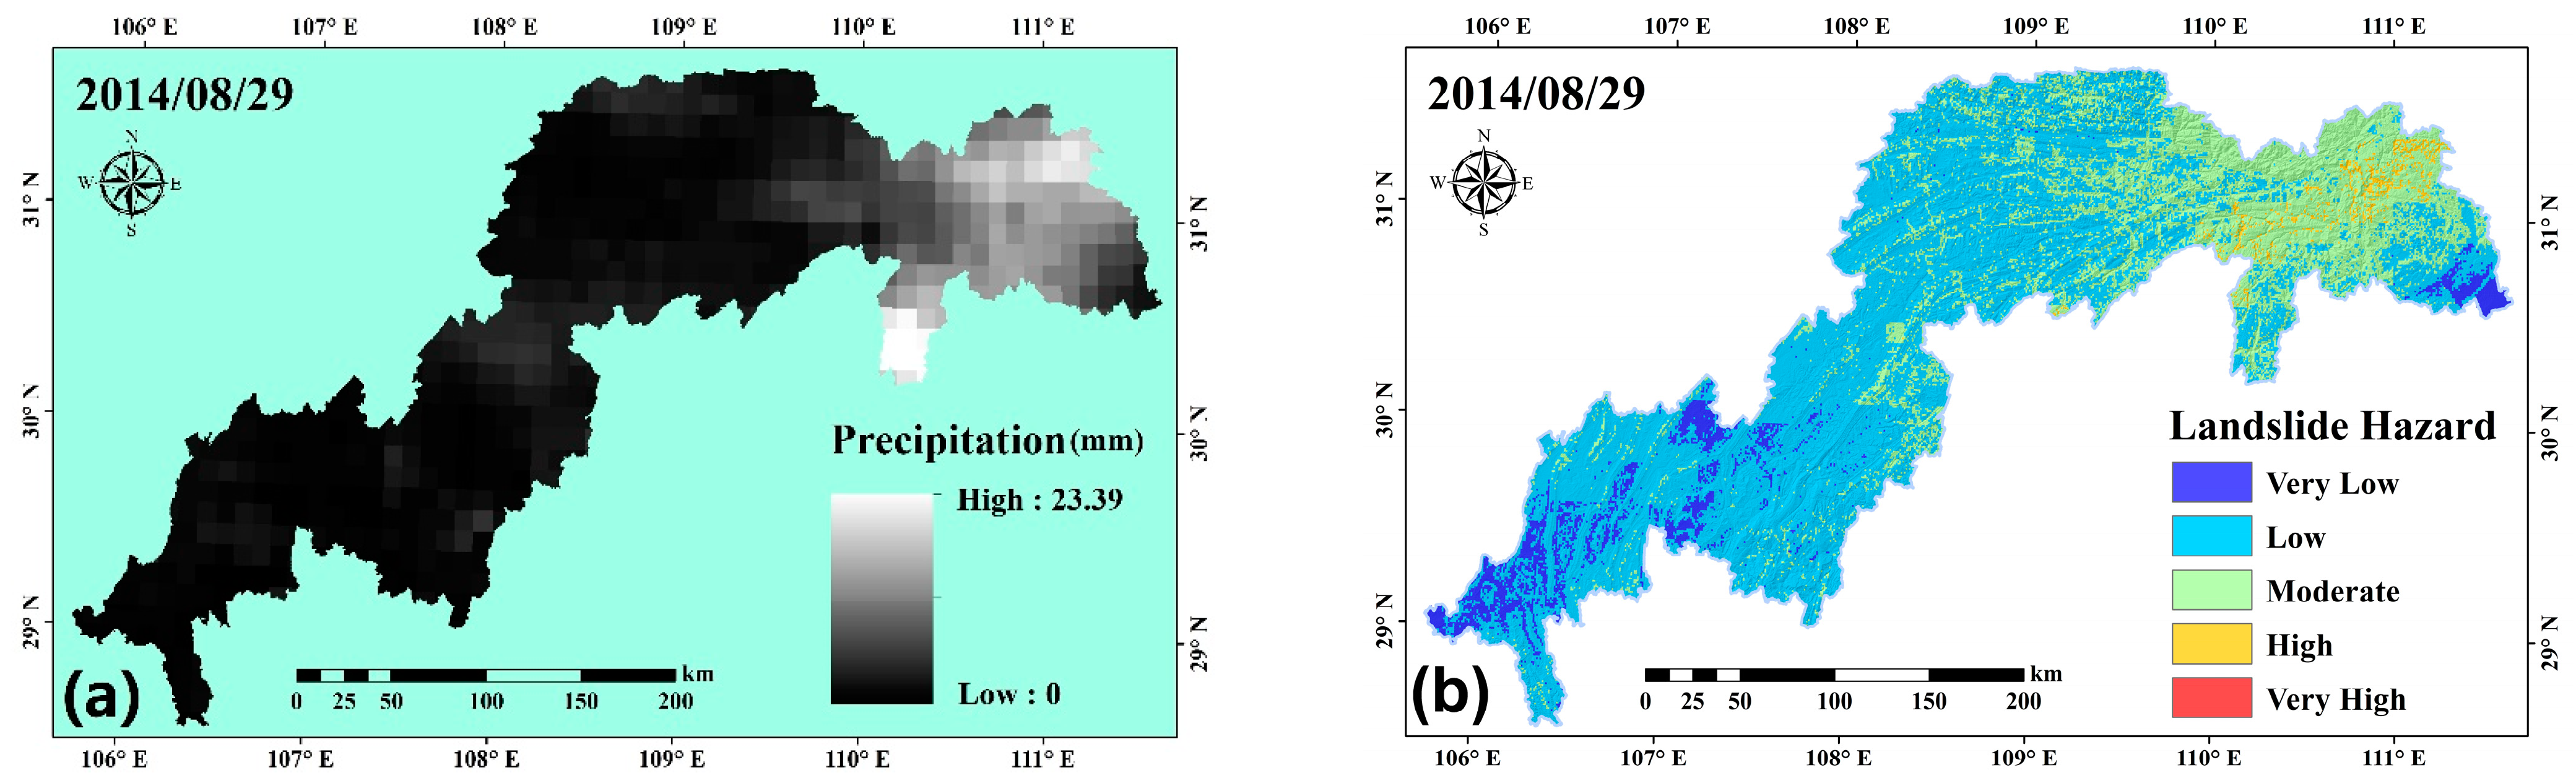
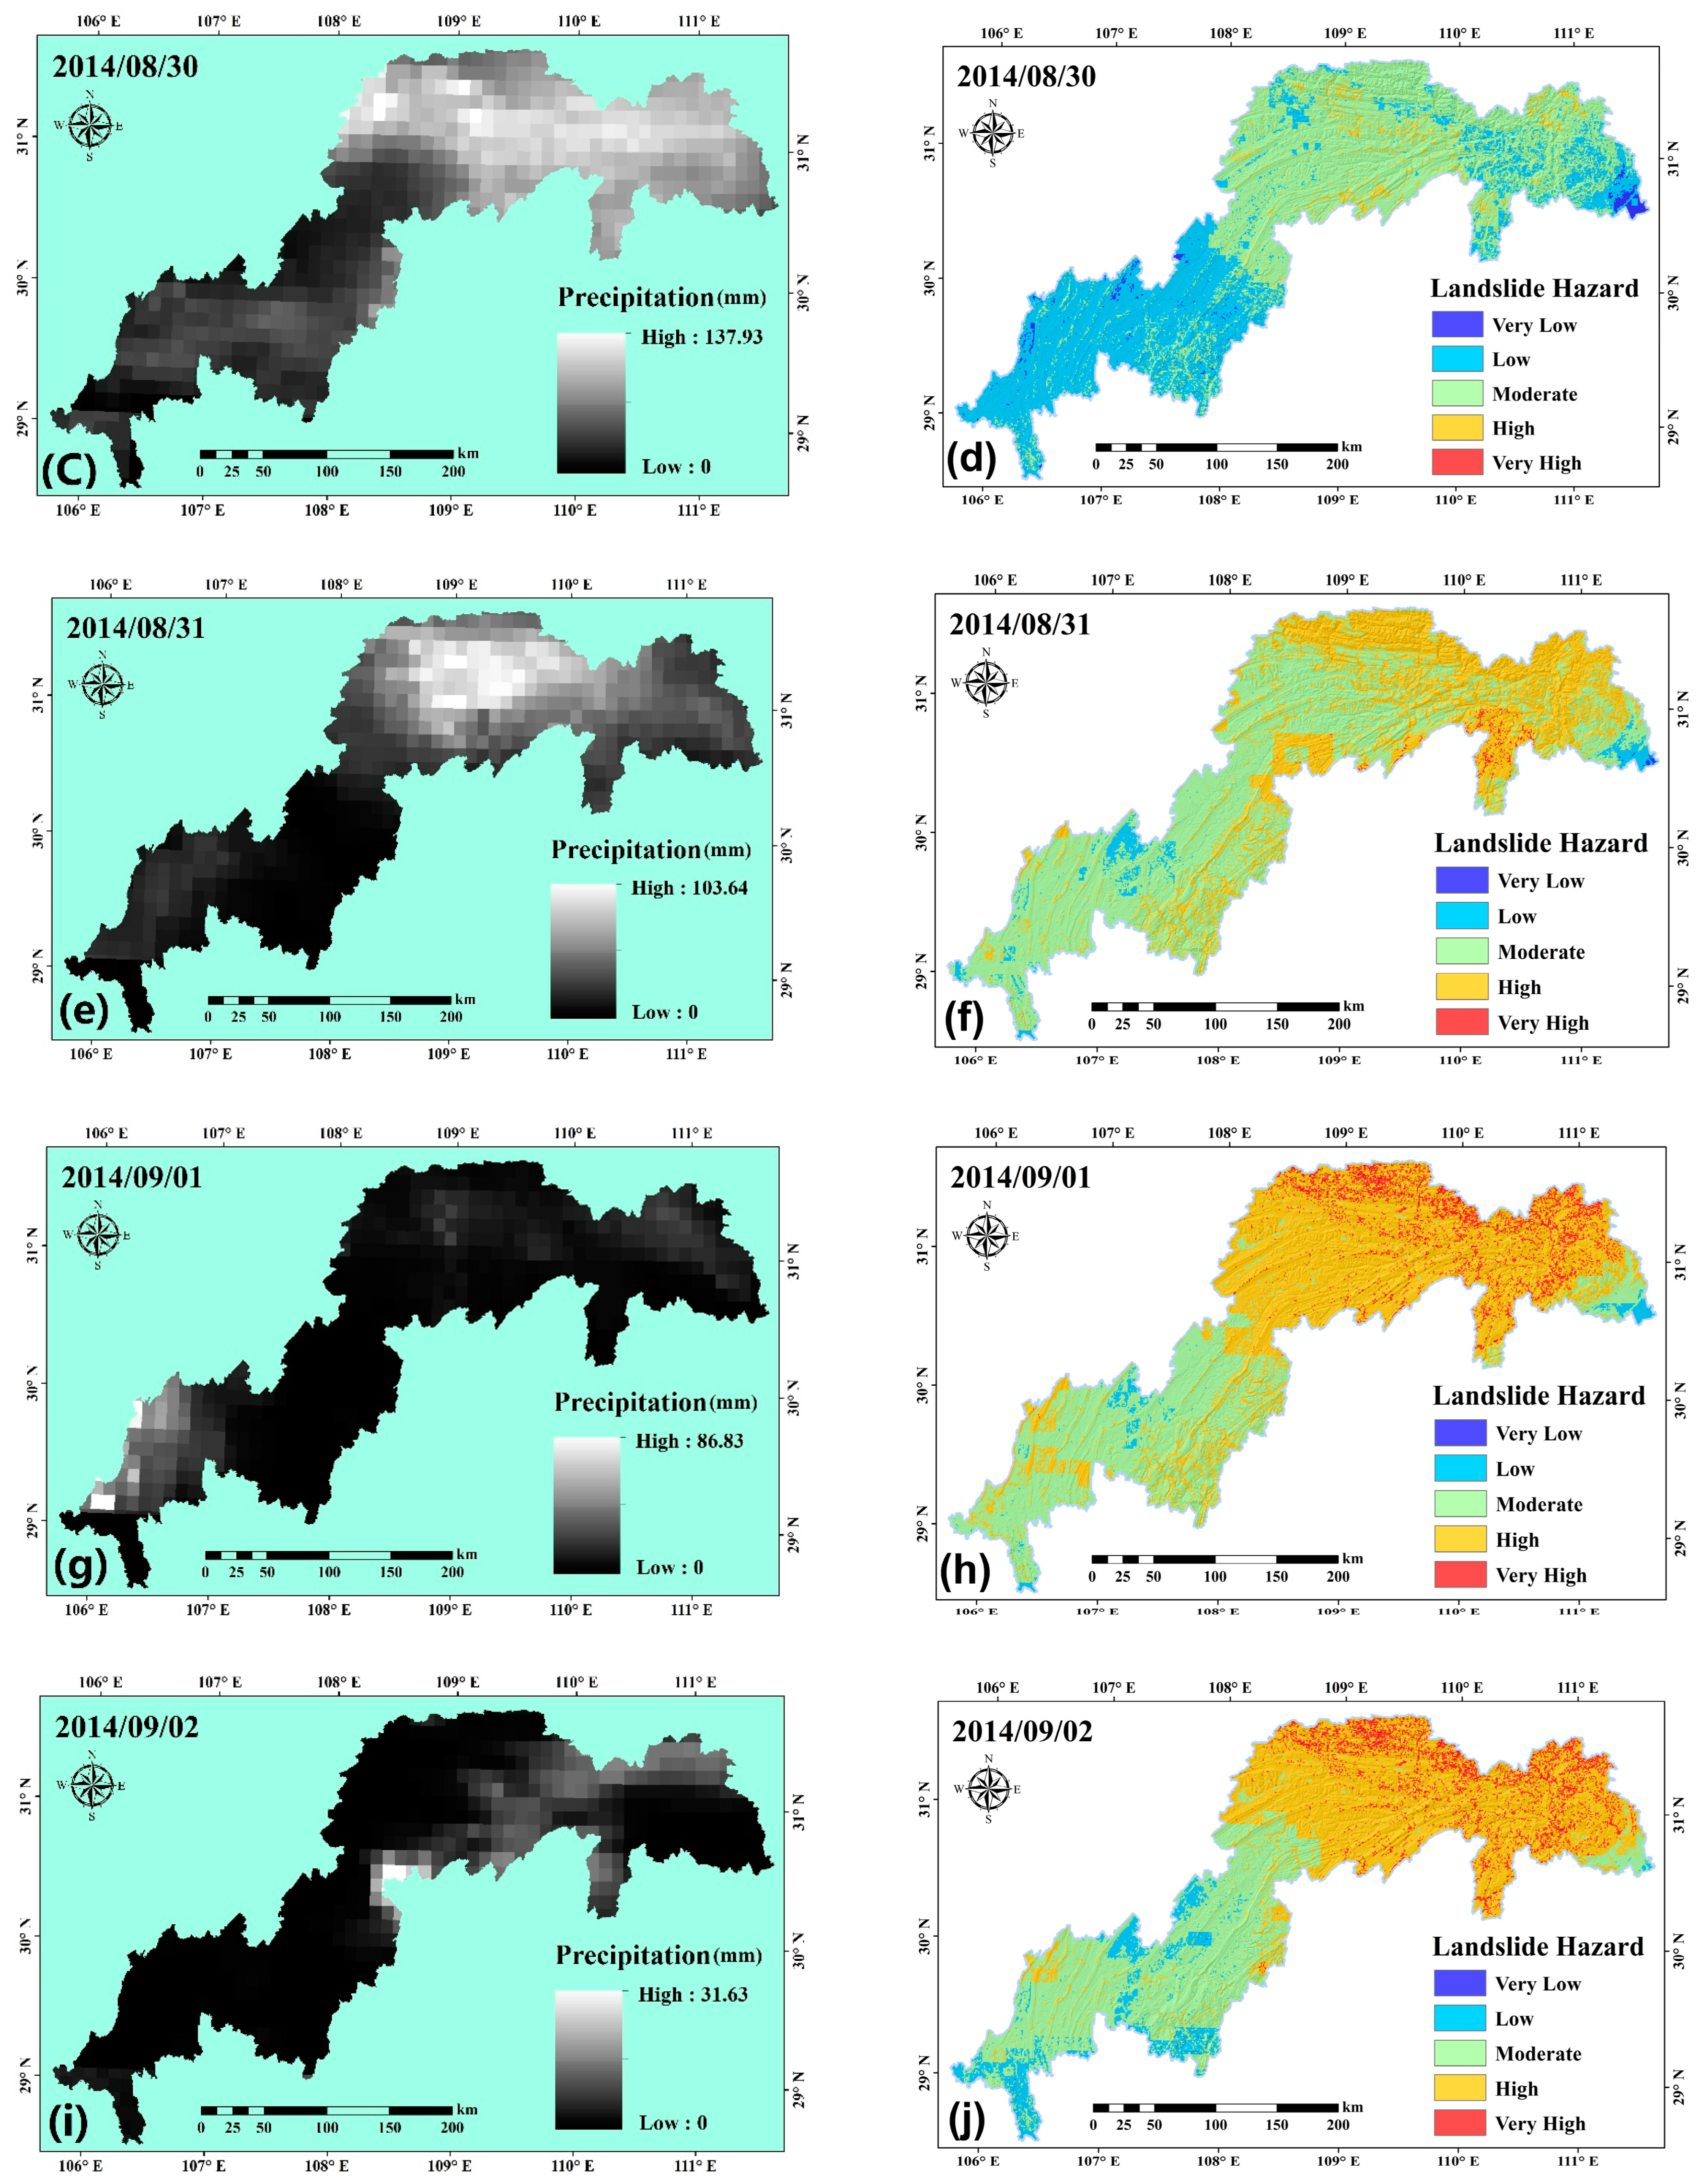
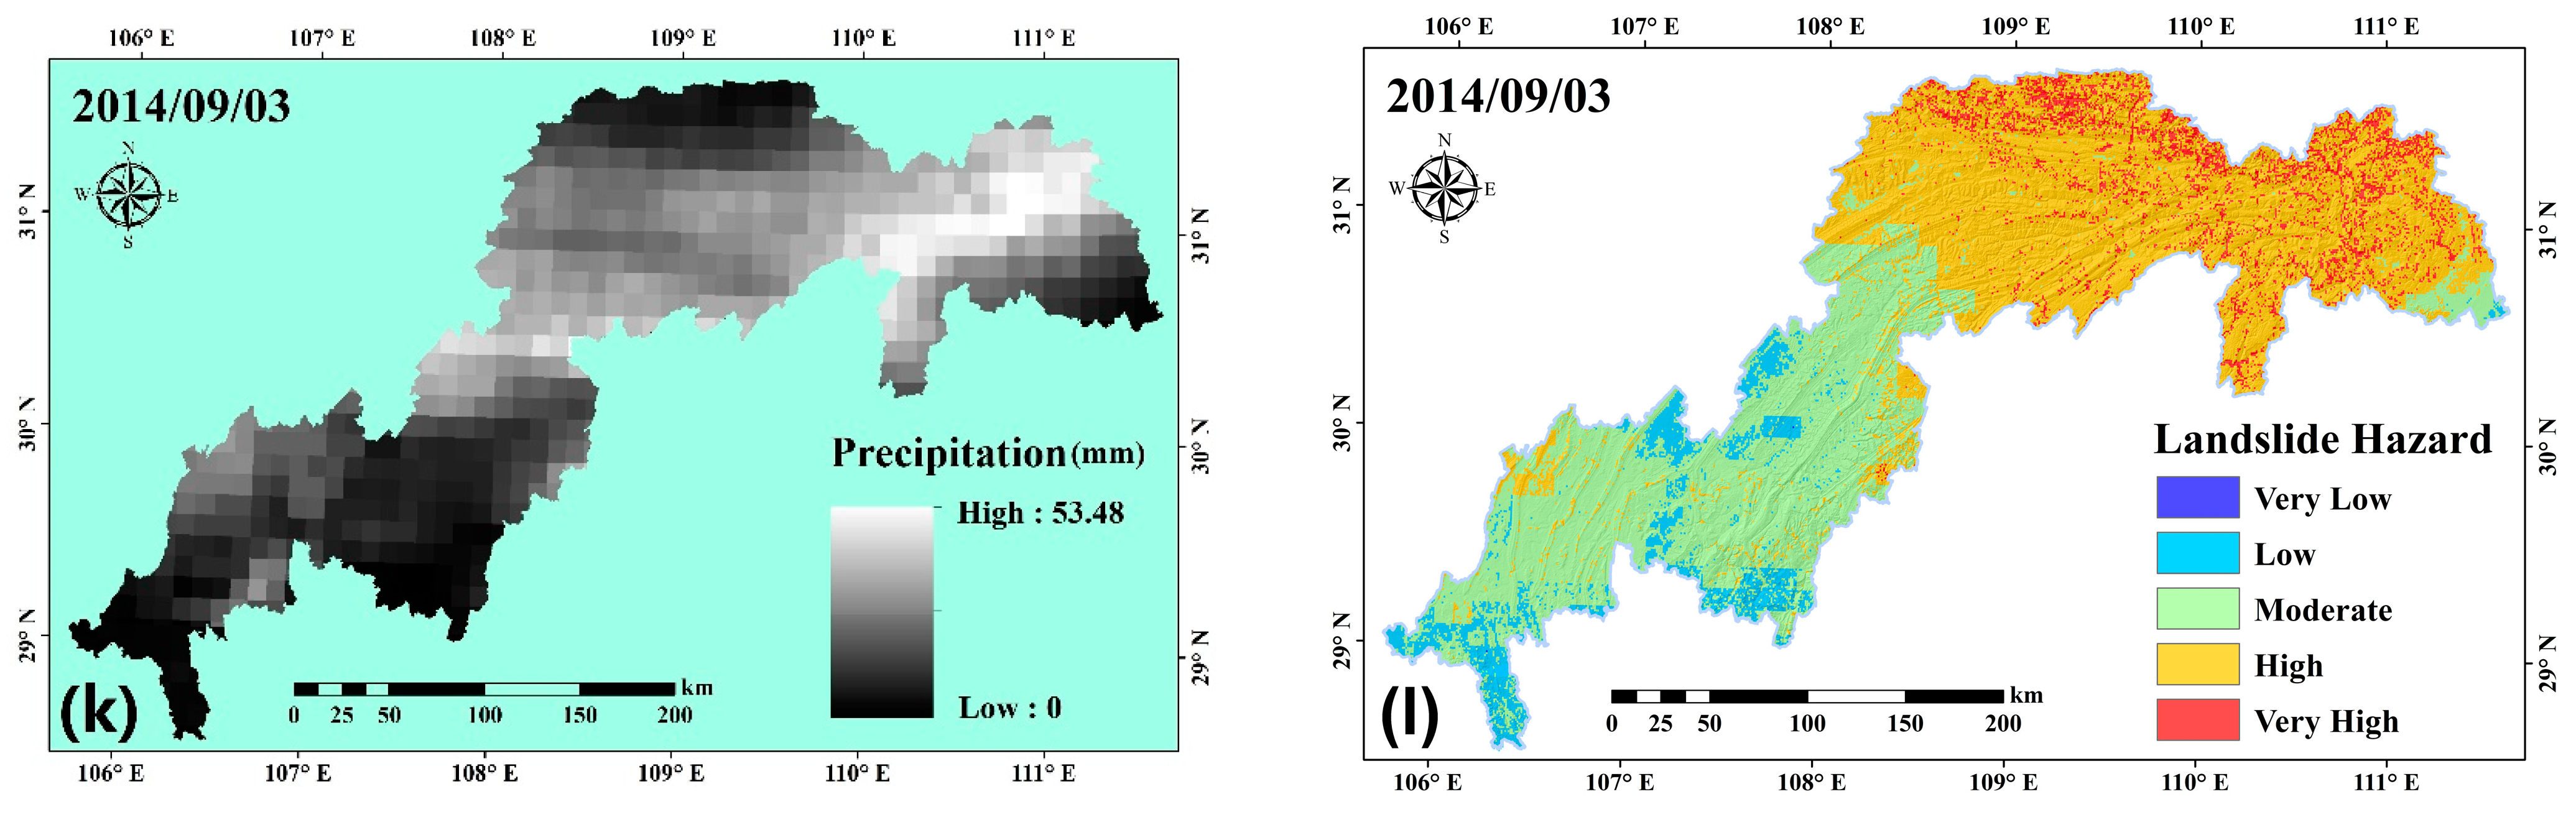
The majority of the TGRA experienced intense continuous rainfall from 29 August to 3 September 2014. The Global Precipitation Measurement (GPM) obtained from the GEE cloud platform recorded the daily meteorological distribution in the study area (see Figure 15a,c,e,g,i,k), providing data for the dynamic hazard assessment of landslides. Based on the above landslide hazard assessment model, the DHAS system developed in this paper was used to produce daily updated landslide hazard assessment maps from 29 August to 3 September 2014 (see Figure 15b,d,f,h,j,l).
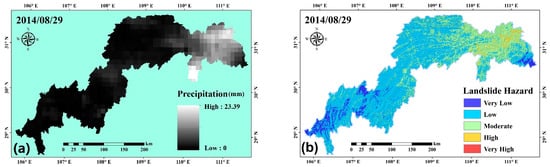
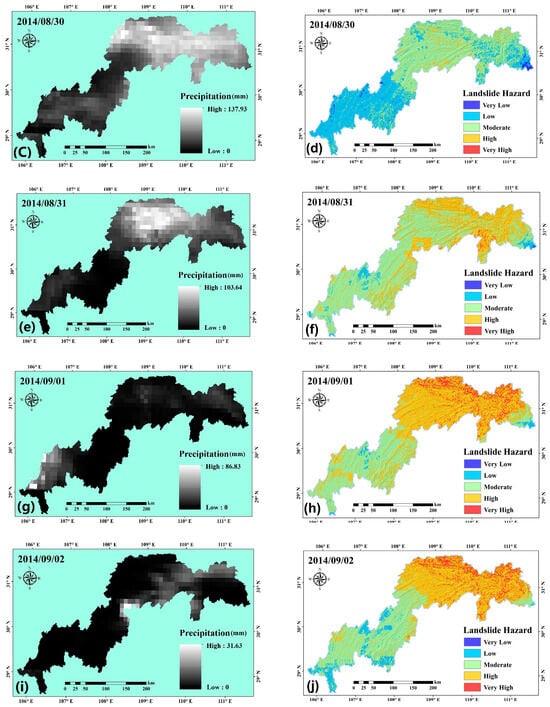
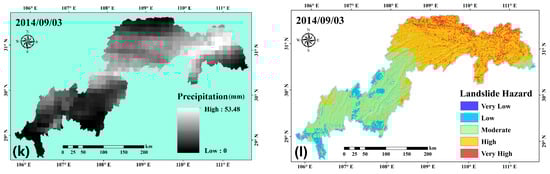
Figure 15.
The distribution of daily precipitation and its corresponding landslide hazard distribution in the TGRA. (a,c,e,g,i,k) denote the spatial distribution of precipitation for each day of the rainfall duration; (b,d,f,h,j,l) denote the spatial distribution of landslide hazards for each day of the rainfall duration.
The landslide hazard assessment map shows that accumulated precipitation was up to 23 mm in the seven days preceding 29 August. The landslide risk in the entire TGRA was mostly low or very low. The local area had a moderate risk because the landslides had a relatively high susceptibility in this area and were thus easily influenced by rainfall. On 30 August, the accumulated precipitation exceeded 100 mm in Kaixian, Fengjie, Wushan, Badong, Zigui, and other places. The maximum local precipitation in some areas reached 138 mm. The low-risk areas gradually faded away, and the moderate-risk areas occupied the central and east of the reservoir area. Very-high-risk areas appeared sporadically in some areas. Fengjie County, Kaizhou County, northern Yunyang County, and southern Wuxi County in northeastern Chongqing received the most rainfall on 31 August. The daily maximum rainfall was 104 mm, with accumulated precipitation exceeding 200 mm. The low- and very-low-risk areas vanished. The risk of landslides was high in most areas, and some areas reached a very high risk level. Rainfall in northeast Chongqing, Zigui, and Badong decreased significantly from 1 to 3 September, with daily rainfall less than 20 mm. Some areas in southwest China gradually returned to being low-risk areas again, and the overall risk decreased. However, from the time-series map of hazard zones, the risk in Wushan, Fengjie, Yunyang, Wuxi, and other areas in northeast Chongqing had increased day by day since 30 August 2014, and remained at the very high landslide hazard level from 1 to 3 September, although rainfall decreased significantly during those days. This was mainly because the delay in the influence of rainfall on landslides was considered when calculating the landslide risk. The previous rainfall greatly influenced landslide risk, and the landslide risk was still high after the rainstorm, which was also the reason for the accumulated precipitation in the first seven days before the draft. Detailed hazard classes’ sub-area statistics are shown in Table 3.
Table 3.
Landslide hazard assessment result zoning statistics from 29 August 2014 to 3 September 2014.
5. Discussion
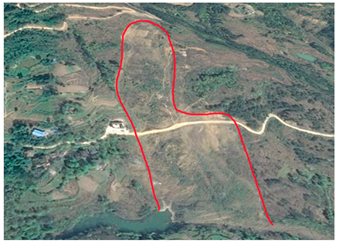
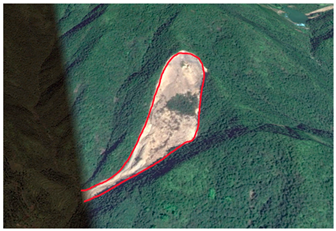
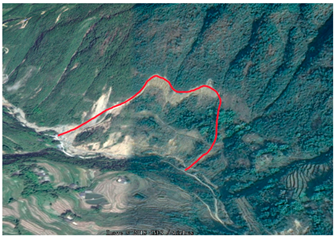
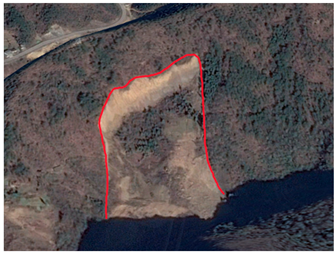
The dynamic hazard assessment of rainfall-induced landslides is essential for the government to formulate disaster prevention and mitigation policies. The accuracy of the assessment results is directly related to the safety of the life and property of people in the hazard area, which should withstand the factual arguments. To verify the generalizability of the above assessment method and the validity of the assessment results, this paper used the remote sensing interpretation method of rainfall-induced landslides to identify the TGRA landslides induced by the rainstorm of 31 August 2014. The data came from the aerial images of UAVs and high-resolution satellite images before and after the rainstorm. By comparing the temporal remote sensing images of before and after, we found that the vegetation, houses, roads, and farmlands in the slope area with large-scale landslides after the heavy rainfall were destroyed. The land texture was remarkably different from the area where no landslides occurred. The deformation features of the landslide mass were prominent, and the geotechnical structure was disrupted. Cracks of different types, such as tensile cracks at the trailing edge, landslide depression, and chair-like cracks, steep ridges, or noticeable landslide cliffs were observed. In general, satellite images of the landslide areas were light in color, with exposed rocks and soil that were easy to identify (see Table 4).
Table 4.
Remote sensing interpretation of landslides induced by extreme rainfall in “8–31” rainstorm in 2014.
This study identified a total of 622 landslides after the rainfall, with 353 in Yunyang County and 279 in Fengjie County, after excluding human intervention and analyzing remote sensing images. Analysis of the spatial location of landslides and the accumulated precipitation (Figure 16a) showed that landslides mainly occurred in areas with accumulated precipitation of more than 200 mm, indicating that the distribution of landslides correlated well with accumulated precipitation and rainfall intensity. From the distribution of landslides in the hazard assessment map, the interpreted landslides were all in high- or very-high-risk areas. Among them, 70.3% and 29.7% of the landslides were in the high- and very-high-risk areas, respectively, in Yunyang County. A total of 53% and 47% of the landslides were in the high- and very-high-risk areas in Fengjie County. This result confirmed the timeliness and accuracy of the hazard assessment.
Figure 16.
(a) Spatial distribution of landslides and accumulated rainfall interpreted by remote sensing in Yunyang and Fengjie. (b) Spatial distribution of nascent landslides and documented landslides in Yunyang and Fengjie.
We further analyzed the influencing factors of the interpreted rainfall-induced landslides and found that landslides were more common on slopes with summit elevations between 1000 m and 1500 m, topographic slopes of about 25°, and sunny slopes. Landslides occurred in an elevation range from 200 m to 1350 m. The number of landslides first increased and then decreased with increasing elevation. Landslides were concentrated in the elevation range of 400–700 m. Landslide development strata are mainly Jurassic and Triassic Middle Badong Formation. The primary lithology consists of sandstone, siltstone, marl, mudstones, and shales of different layer thicknesses. The strata belong to soft and hard rock groups. As for the scale of landslides, small and medium landslides dominated, accounting for 90.7% of all landslides.
Another important finding is that 83% of the landslides interpreted in this experiment were not documented (see Figure 16b) and were nascent landslides induced by this rainstorm. Some of the old landslides were found to be severely deformed or even massively slid under the influence of heavy rainfall. These findings indicate that the hazard assessment could help reveal the development direction of historical landslides as well as identify new landslides.
The severe rainstorm resulted in numerous fatalities and missing persons, as well as significant damage to critical infrastructure including roads and bridges. Furthermore, the event forced thousands of families to evacuate their homes devastated by landslides. Agricultural fields and crops suffered extensive damage, which in turn caused substantial disruptions in transportation and halted production activities, leading to considerable socio-economic losses. The implementation of the dynamic landslide hazard assessment method proposed in this study during a heavy rainstorm could be crucial. By accurately predicting high-risk landslide zones and swiftly identifying emerging landslides, this method can significantly mitigate both human and economic losses in vulnerable areas, thereby greatly enhancing the safety of the affected populations.
Prompt dynamic hazard assessment of rainfall-induced landslides is an urgent and practical research topic because landslide evolution is a complex nonlinear process that still requires new theoretical support, and the assessment results have obvious realistic significance. The landslide hazard assessment process requires a large amount of foundational environmental data and remote sensing images. Researchers have encountered a lot of difficulties in previous landslide hazard studies in the TGRA due to the large study area. A lot of time and effort was wasted on data acquisition and preprocessing. Therefore, based on the powerful computing power and massive image data of the GEE cloud platform, the prediction system developed in this study that integrates the GBDT machine learning model and basic data processing functions provides reliable data and technical support for landslide hazard assessment on a large regional scale. The dynamic assessment of landslide hazard requires real-time rainfall data, and GEE provides a variety of global meteorological satellite databases to offer precipitation data with a temporal resolution of 0.5 h, providing near-real-time data support for this dynamic landslide hazard assessment system. It should be noted that the dynamic hazard assessment method used in this study is semiquantitative and necessitates prior knowledge of empirical mathematical statistics on the occurrence of historical landslides and temporal rainfall accumulation in the study area, which is difficult to obtain in areas lacking historical landslide data. In a follow-up study, our goal is to create a quantitative study on dynamic hazard assessment using non-graded temporal accumulated precipitation and susceptibility mapping.
6. Conclusions
The powerful ability of machine learning to handle nonlinear relationships has led to its widespread application in areas such as groundwater prediction [52,53,54], landslide prediction [17,19], and land use mapping. This study introduces a novel near-real-time approach using the Google Earth Engine (GEE) platform combined with the Gradient Boosting Decision Tree (GBDT) model for dynamic hazard assessment of large-area rainfall-induced landslides. By applying the GBDT model based on various geological environmental factors, potential landslide locations were effectively predicted. Leveraging the powerful computing capabilities of GEE along with its up-to-date remote sensing and rainfall data, a dynamic evaluation of landslide risks was achieved.
Our results emphasize the effectiveness of combining cloud computing with machine learning to enhance landslide risk assessment. Specifically, the method successfully predicted landslide susceptibility with high precision, achieving a prediction accuracy of 86.2% and a recall rate of 95.7%, significantly improving the capability to predict and mitigate landslide disasters almost in real time during heavy rainfall events. For instance, the spatial and temporal analysis of the “8–31” 2014 rainstorm event in the Three Gorges Reservoir area highlighted the practical application of the model, providing closely related assessments for subsequent landslide events.
However, this study has its limitations. The accuracy of disaster prediction largely depends on the quality and resolution of the input data, and the model’s performance may be compromised if applied outside the Three Gorges Reservoir area without appropriate adjustments and calibration. Moreover, although the model effectively handles the nonlinear relationships between multiple factors and landslide events, its predictive power is still limited by the inherent uncertainties of meteorological data and the dynamic nature of land cover and geological conditions.
Looking forward, the scalability and efficiency of the proposed method are expected to find broader applications in geological disaster prediction and management. Future research will focus on enhancing the model’s universality across different geographic settings and exploring the integration of more diverse data types, such as real-time satellite imagery and IoT sensor data, to improve prediction accuracy. Future studies will also aim to refine the temporal resolution of hazard assessments to enable quicker responses to imminent landslide risks.
In conclusion, the integration of GEE and the GBDT for dynamic landslide hazard assessment represents a significant advancement in the field of geohazard analysis. By harnessing advanced computing and machine learning, this approach provides a powerful tool for disaster risk management and mitigation planning, making a significant contribution to the safety and resilience of vulnerable areas.
Author Contributions
K.Y. and Y.S. implemented all of the proposed methods and conducted the experiments. K.Y. finished the first draft. R.N. and Y.S. supervised the study and contributed to the editing and reviewing of the manuscript. J.D., H.Z. and J.C. discussed some key issues in the proposed model and provided very useful suggestions for improving our work. All authors have read and agreed to the published version of the manuscript.
Funding
This study was jointly funded by the Three Gorges follow-up work geological disaster prevention and control project, grant numbers 0001212020CC60002, 0001212018CC6000010, 0001212012AC50021 and Open Fund from Engineering Research Center for Seismic Disaster Prevention and Engineering Geological Disaster Detection of Jiangxi Province (No.SDGD202203).
Data Availability Statement
Data are contained within the article.
Acknowledgments
The authors are grateful for the data and materials provided by the Headquarters for Prevention and Control of Geological Disasters in the Three Gorges Reservoir. Also, the authors would like to thank the handling editors and the three anonymous reviewers for their valuable comments and suggestions which significantly improved the quality of this paper. We would like to express our gratitude to Runqing Ye for his assistance in providing a background in geology.
Conflicts of Interest
The authors declare no conflicts of interest.
References
- Keqiang, H.; Shangqing, W.; Wen, D.; Sijing, W. Dynamic Features and Effects of Rainfall on Landslides in the Three Gorges Reservoir Region, China: Using the Xintan Landslide and the Large Huangya Landslide as the Examples. Environ. Earth Sci. 2010, 59, 1267–1274. [Google Scholar] [CrossRef]
- XIA, M.; REN, G.M.; MA, X.L. Deformation and Mechanism of Landslide Influenced by the Effects of Reservoir Water and Rainfall, Three Gorges, China. Nat. Hazards 2013, 68, 467–482. [Google Scholar] [CrossRef]
- Dahal, R.K.; Hasegawa, S. Representative Rainfall Thresholds for Landslides in the Nepal Himalaya. Geomorphology 2008, 100, 429–443. [Google Scholar] [CrossRef]
- Rosi, A.; Peternel, T.; Jemec-Auflič, M.; Komac, M.; Segoni, S.; Casagli, N. Rainfall Thresholds for Rainfall-Induced Landslides in Slovenia. Landslides 2016, 13, 1571–1577. [Google Scholar] [CrossRef]
- Zhou, C.; Ai, D.; Huang, W.; Xu, H.; Ma, L.; Chen, L.; Wang, L. Emergency Survey and Stability Analysis of a Rainfall-Induced Soil-Rock Mixture Landslide at Chongqing City, China. Front. Earth Sci. 2021, 9, 774200. [Google Scholar] [CrossRef]
- Hu, M.; Wang, R.; Shen, J. Rainfall, Landslide and Debris Flow Intergrowth Relationship in Jiangjia Ravine. J. Mt. Sci. 2011, 8, 603–610. [Google Scholar] [CrossRef]
- Guzzetti, F.; Cardinali, M.; Reichenbach, P.; Cipolla, F.; Sebastiani, C.; Galli, M.; Salvati, P. Landslides Triggered by the 23 November 2000 Rainfall Event in the Imperia Province, Western Liguria, Italy. Eng. Geol. 2004, 73, 229–245. [Google Scholar] [CrossRef]
- Lee, C.-T. Statistical Seismic Landslide Hazard Analysis: An Example from Taiwan. Eng. Geol. 2014, 182, 201–212. [Google Scholar] [CrossRef]
- Wang, Z.; Wang, D.; Guo, Q.; Wang, D. Regional Landslide Hazard Assessment through Integrating Susceptibility Index and Rainfall Process. Nat. Hazards 2020, 104, 2153–2173. [Google Scholar] [CrossRef]
- Golovko, D.; Roessner, S.; Behling, R.; Wetzel, H.-U.; Kleinschmit, B. Evaluation of Remote-Sensing-Based Landslide Inventories for Hazard Assessment in Southern Kyrgyzstan. Remote Sens. 2017, 9, 943. [Google Scholar] [CrossRef]
- Samia, J.; Temme, A.; Bregt, A.; Wallinga, J.; Guzzetti, F.; Ardizzone, F.; Rossi, M. Do Landslides Follow Landslides? Insights in Path Dependency from a Multi-Temporal Landslide Inventory. Landslides 2017, 14, 547–558. [Google Scholar] [CrossRef]
- Qiu, D.D.; Niu, R.Q.; Zhao, Y.N. Landslide Susceptibility Zonation Based on the Analytic Hierarchy Process and Information Method. Appl. Mech. Mater. 2014, 580–583, 2658–2662. [Google Scholar] [CrossRef]
- Maharaj, R.J. Landslide Processes and Landslide Susceptibility Analysis from an Upland Watershed: A Case Study from St. Andrew, Jamaica, West Indies. Eng. Geol. 1993, 34, 53–79. [Google Scholar] [CrossRef]
- Lee, S.; Min, K. Statistical Analysis of Landslide Susceptibility at Yongin, Korea. Environ. Geol. 2001, 40, 1095–1113. [Google Scholar] [CrossRef]
- Ayalew, L.; Yamagishi, H. The Application of GIS-Based Logistic Regression for Landslide Susceptibility Mapping in the Kakuda-Yahiko Mountains, Central Japan. Geomorphology 2005, 65, 15–31. [Google Scholar] [CrossRef]
- Zhao, L.; Wu, X.; Niu, R.; Wang, Y.; Zhang, K. Using the Rotation and Random Forest Models of Ensemble Learning to Predict Landslide Susceptibility. Geomat. Nat. Hazards Risk 2020, 11, 1542–1564. [Google Scholar] [CrossRef]
- Song, Y.; Niu, R.; Xu, S.; Ye, R.; Peng, L.; Guo, T.; Li, S.; Chen, T. Landslide Susceptibility Mapping Based on Weighted Gradient Boosting Decision Tree in Wanzhou Section of the Three Gorges Reservoir Area (China). ISPRS Int. J. Geo-Inf. 2018, 8, 4. [Google Scholar] [CrossRef]
- Zhou, C.; Yin, K.; Cao, Y.; Ahmed, B.; Li, Y.; Catani, F.; Pourghasemi, H.R. Landslide Susceptibility Modeling Applying Machine Learning Methods: A Case Study from Longju in the Three Gorges Reservoir Area, China. Comput. Geosci. 2018, 112, 23–37. [Google Scholar] [CrossRef]
- Xu, S.; Niu, R. Displacement Prediction of Baijiabao Landslide Based on Empirical Mode Decomposition and Long Short-Term Memory Neural Network in Three Gorges Area, China. Comput. Geosci. 2018, 111, 87–96. [Google Scholar] [CrossRef]
- Rong, G.; Alu, S.; Li, K.; Su, Y.; Zhang, J.; Zhang, Y.; Li, T. Rainfall Induced Landslide Susceptibility Mapping Based on Bayesian Optimized Random Forest and Gradient Boosting Decision Tree Models—A Case Study of Shuicheng County, China. Water 2020, 12, 3066. [Google Scholar] [CrossRef]
- Bogaard, T.; Greco, R. Invited Perspectives: Hydrological Perspectives on Precipitation Intensity-Duration Thresholds for Landslide Initiation: Proposing Hydro-Meteorological Thresholds. Nat. Hazards Earth Syst. Sci. 2018, 18, 31–39. [Google Scholar] [CrossRef]
- Saito, H.; Korup, O.; Uchida, T.; Hayashi, S.; Oguchi, T. Rainfall Conditions, Typhoon Frequency, and Contemporary Landslide Erosion in Japan. Geology 2014, 42, 999–1002. [Google Scholar] [CrossRef]
- Abraham, M.T.; Satyam, N.; Rosi, A.; Pradhan, B.; Segoni, S. The Selection of Rain Gauges and Rainfall Parameters in Estimating Intensity-Duration Thresholds for Landslide Occurrence: Case Study from Wayanad (India). Water 2020, 12, 1000. [Google Scholar] [CrossRef]
- Cannon, S.H.; Boldt, E.M.; Laber, J.L.; Kean, J.W.; Staley, D.M. Rainfall Intensity–Duration Thresholds for Postfire Debris-Flow Emergency-Response Planning. Nat. Hazards 2011, 59, 209–236. [Google Scholar] [CrossRef]
- Peruccacci, S.; Brunetti, M.T.; Luciani, S.; Vennari, C.; Guzzetti, F. Lithological and Seasonal Control on Rainfall Thresholds for the Possible Initiation of Landslides in Central Italy. Geomorphology 2012, 139–140, 79–90. [Google Scholar] [CrossRef]
- Ke, Q.; Tian, X.; Bricker, J.; Tian, Z.; Guan, G.; Cai, H.; Huang, X.; Yang, H.; Liu, J. Urban Pluvial Flooding Prediction by Machine Learning Approaches—A Case Study of Shenzhen City, China. Adv. Water Resour. 2020, 145, 103719. [Google Scholar] [CrossRef]
- Deng, Y.; Jiang, W.; Tang, Z.; Ling, Z.; Wu, Z. Long-Term Changes of Open-Surface Water Bodies in the Yangtze River Basin Based on the Google Earth Engine Cloud Platform. Remote Sens. 2019, 11, 2213. [Google Scholar] [CrossRef]
- Salcedo-Sanz, S.; Ghamisi, P.; Piles, M.; Werner, M.; Cuadra, L.; Moreno-Martínez, A.; Izquierdo-Verdiguier, E.; Muñoz-Marí, J.; Mosavi, A.; Camps-Valls, G. Machine Learning Information Fusion in Earth Observation: A Comprehensive Review of Methods, Applications and Data Sources. Inf. Fusion 2020, 63, 256–272. [Google Scholar] [CrossRef]
- Sun, Z.; Sandoval, L.; Crystal-Ornelas, R.; Mousavi, S.M.; Wang, J.; Lin, C.; Cristea, N.; Tong, D.; Carande, W.H.; Ma, X.; et al. A Review of Earth Artificial Intelligence. Comput. Geosci. 2022, 159, 105034. [Google Scholar] [CrossRef]
- Hu, Q.; Zhou, Y.; Wang, S.; Wang, F. Machine Learning and Fractal Theory Models for Landslide Susceptibility Mapping: Case Study from the Jinsha River Basin. Geomorphology 2020, 351, 106975. [Google Scholar] [CrossRef]
- Farahmand, A.; AghaKouchak, A. A Satellite-Based Global Landslide Model. Nat. Hazards Earth Syst. Sci. 2013, 13, 1259–1267. [Google Scholar] [CrossRef]
- Hong, Y.; Adler, R.; Huffman, G. Evaluation of the Potential of NASA Multi-Satellite Precipitation Analysis in Global Landslide Hazard Assessment. Geophys. Res. Lett. 2006, 33, L22402. [Google Scholar] [CrossRef]
- Wu, W.; Zhang, Q.; Singh, V.P.; Wang, G.; Zhao, J.; Shen, Z.; Sun, S. A Data-Driven Model on Google Earth Engine for Landslide Susceptibility Assessment in the Hengduan Mountains, the Qinghai–Tibetan Plateau. Remote Sens. 2022, 14, 4662. [Google Scholar] [CrossRef]
- Singh, P.; Maurya, V.; Dwivedi, R. Pixel based landslide identification using Landsat 8 and GEE. Int. Arch. Photogramm. Remote Sens. Spat. Inf. Sci. 2021, XLIII-B3-2021, 721–726. [Google Scholar] [CrossRef]
- Tang, H.; Wasowski, J.; Juang, C.H. Geohazards in the Three Gorges Reservoir Area, China—Lessons Learned from Decades of Research. Eng. Geol. 2019, 261, 105267. [Google Scholar] [CrossRef]
- Tang, H.; Li, C.; Hu, X.; Wang, L.; Criss, R.; Su, A.; Wu, Y.; Xiong, C. Deformation Response of the Huangtupo Landslide to Rainfall and the Changing Levels of the Three Gorges Reservoir. Bull. Eng. Geol. Environ. 2015, 74, 933–942. [Google Scholar] [CrossRef]
- Fang, Z.; Hang, D.; Xinyi, Z. Rainfall Regime in Three Gorges Area in China and the Control Factors. Int. J. Climatol. 2010, 30, 1396–1406. [Google Scholar] [CrossRef]
- Wang, J.; Sheng, Y.; Tong, T.S.D. Monitoring Decadal Lake Dynamics across the Yangtze Basin Downstream of Three Gorges Dam. Remote Sens. Environ. 2014, 152, 251–269. [Google Scholar] [CrossRef]
- Xiao, Y.; Xiao, Q.; Xiong, Q.; Yang, Z. Effects of Ecological Restoration Measures on Soil Erosion Risk in the Three Gorges Reservoir Area Since the 1980s. GeoHealth 2020, 4, e2020GH000274. [Google Scholar] [CrossRef]
- Huang, C.; Huang, X.; Peng, C.; Zhou, Z.; Teng, M.; Wang, P. Land Use/Cover Change in the Three Gorges Reservoir Area, China: Reconciling the Land Use Conflicts between Development and Protection. CATENA 2019, 175, 388–399. [Google Scholar] [CrossRef]
- Huang, D.; Gu, D.M.; Song, Y.X.; Cen, D.F.; Zeng, B. Towards a Complete Understanding of the Triggering Mechanism of a Large Reactivated Landslide in the Three Gorges Reservoir. Eng. Geol. 2018, 238, 36–51. [Google Scholar] [CrossRef]
- DZ/T 0261-2014; Landslide, Collapse, and Debris Flow Hazard Investigation Standard (1:50,000). China Geological Environment Monitoring Institute, Ministry of Land and Resources of the People’s Republic of China: Beijing, China, 2014.
- Fiorucci, F.; Cardinali, M.; Carlà, R.; Rossi, M.; Mondini, A.C.; Santurri, L.; Ardizzone, F.; Guzzetti, F. Seasonal Landslide Mapping and Estimation of Landslide Mobilization Rates Using Aerial and Satellite Images. Geomorphology 2011, 129, 59–70. [Google Scholar] [CrossRef]
- Nichol, J.E.; Shaker, A.; Wong, M.-S. Application of High-Resolution Stereo Satellite Images to Detailed Landslide Hazard Assessment. Geomorphology 2006, 76, 68–75. [Google Scholar] [CrossRef]
- Sato, H.P.; Hasegawa, H.; Fujiwara, S.; Tobita, M.; Koarai, M.; Une, H.; Iwahashi, J. Interpretation of Landslide Distribution Triggered by the 2005 Northern Pakistan Earthquake Using SPOT 5 Imagery. Landslides 2007, 4, 113–122. [Google Scholar] [CrossRef]
- Montrasio, L.; Valentino, R.; Losi, G.L. Towards a Real-Time Susceptibility Assessment of Rainfall-Induced Shallow Landslides on a Regional Scale. Nat. Hazards Earth Syst. Sci. 2011, 11, 1927–1947. [Google Scholar] [CrossRef]
- Gomi, T.; Sidle, R.C.; Miyata, S.; Kosugi, K.; Onda, Y. Dynamic Runoff Connectivity of Overland Flow on Steep Forested Hillslopes: Scale Effects and Runoff Transfer. Water Resour. Res. 2008, 44, 2007WR005894. [Google Scholar] [CrossRef]
- Kirschbaum, D.; Stanley, T. Satellite-Based Assessment of Rainfall-Triggered Landslide Hazard for Situational Awareness. Earth’s Future 2018, 6, 505–523. [Google Scholar] [CrossRef] [PubMed]
- Hu, Y.; Dong, Y.; Batunacun. An Automatic Approach for Land-Change Detection and Land Updates Based on Integrated NDVI Timing Analysis and the CVAPS Method with GEE Support. ISPRS J. Photogramm. Remote Sens. 2018, 146, 347–359. [Google Scholar] [CrossRef]
- Peng, Y.; He, G.; Wang, G.; Cao, H. Surface Water Changes in Dongting Lake from 1975 to 2019 Based on Multisource Remote-Sensing Images. Remote Sens. 2021, 13, 1827. [Google Scholar] [CrossRef]
- Padarian, J.; Minasny, B.; McBratney, A.B. Using Google’s Cloud-Based Platform for Digital Soil Mapping. Comput. Geosci. 2015, 83, 80–88. [Google Scholar] [CrossRef]
- Mohaghegh, A.; Farzin, S.; Anaraki, M.V. A New Framework for Missing Data Estimation and Reconstruction Based on the Geographical Input Information, Data Mining, and Multi-Criteria Decision-Making; Theory and Application in Missing Groundwater Data of Damghan Plain, Iran. Groundw. Sustain. Dev. 2022, 17, 100767. [Google Scholar] [CrossRef]
- Farrokhi, A.; Farzin, S.; Mousavi, S.-F. Meteorological Drought Analysis in Response to Climate Change Conditions, Based on Combined Four-Dimensional Vine Copulas and Data Mining (VC-DM). J. Hydrol. 2021, 603, 127135. [Google Scholar] [CrossRef]
- Achite, M.; Farzin, S.; Elshaboury, N.; Valikhan Anaraki, M.; Amamra, M.; Toubal, A.K. Modeling the Optimal Dosage of Coagulants in Water Treatment Plants Using Various Machine Learning Models. Environ. Dev. Sustain. 2022, 26, 3395–3421. [Google Scholar] [CrossRef]


Disclaimer/Publisher’s Note: The statements, opinions and data contained in all publications are solely those of the individual author(s) and contributor(s) and not of MDPI and/or the editor(s). MDPI and/or the editor(s) disclaim responsibility for any injury to people or property resulting from any ideas, methods, instructions or products referred to in the content. |
© 2024 by the authors. Licensee MDPI, Basel, Switzerland. This article is an open access article distributed under the terms and conditions of the Creative Commons Attribution (CC BY) license (https://creativecommons.org/licenses/by/4.0/).