

Rainfall-Triggered Landslides and Numerical Modeling of Subsequent Debris Flows at Kalli Village of Suntar Formation in the Lesser Himalayas in Nepal


Abstract
:1. Introduction
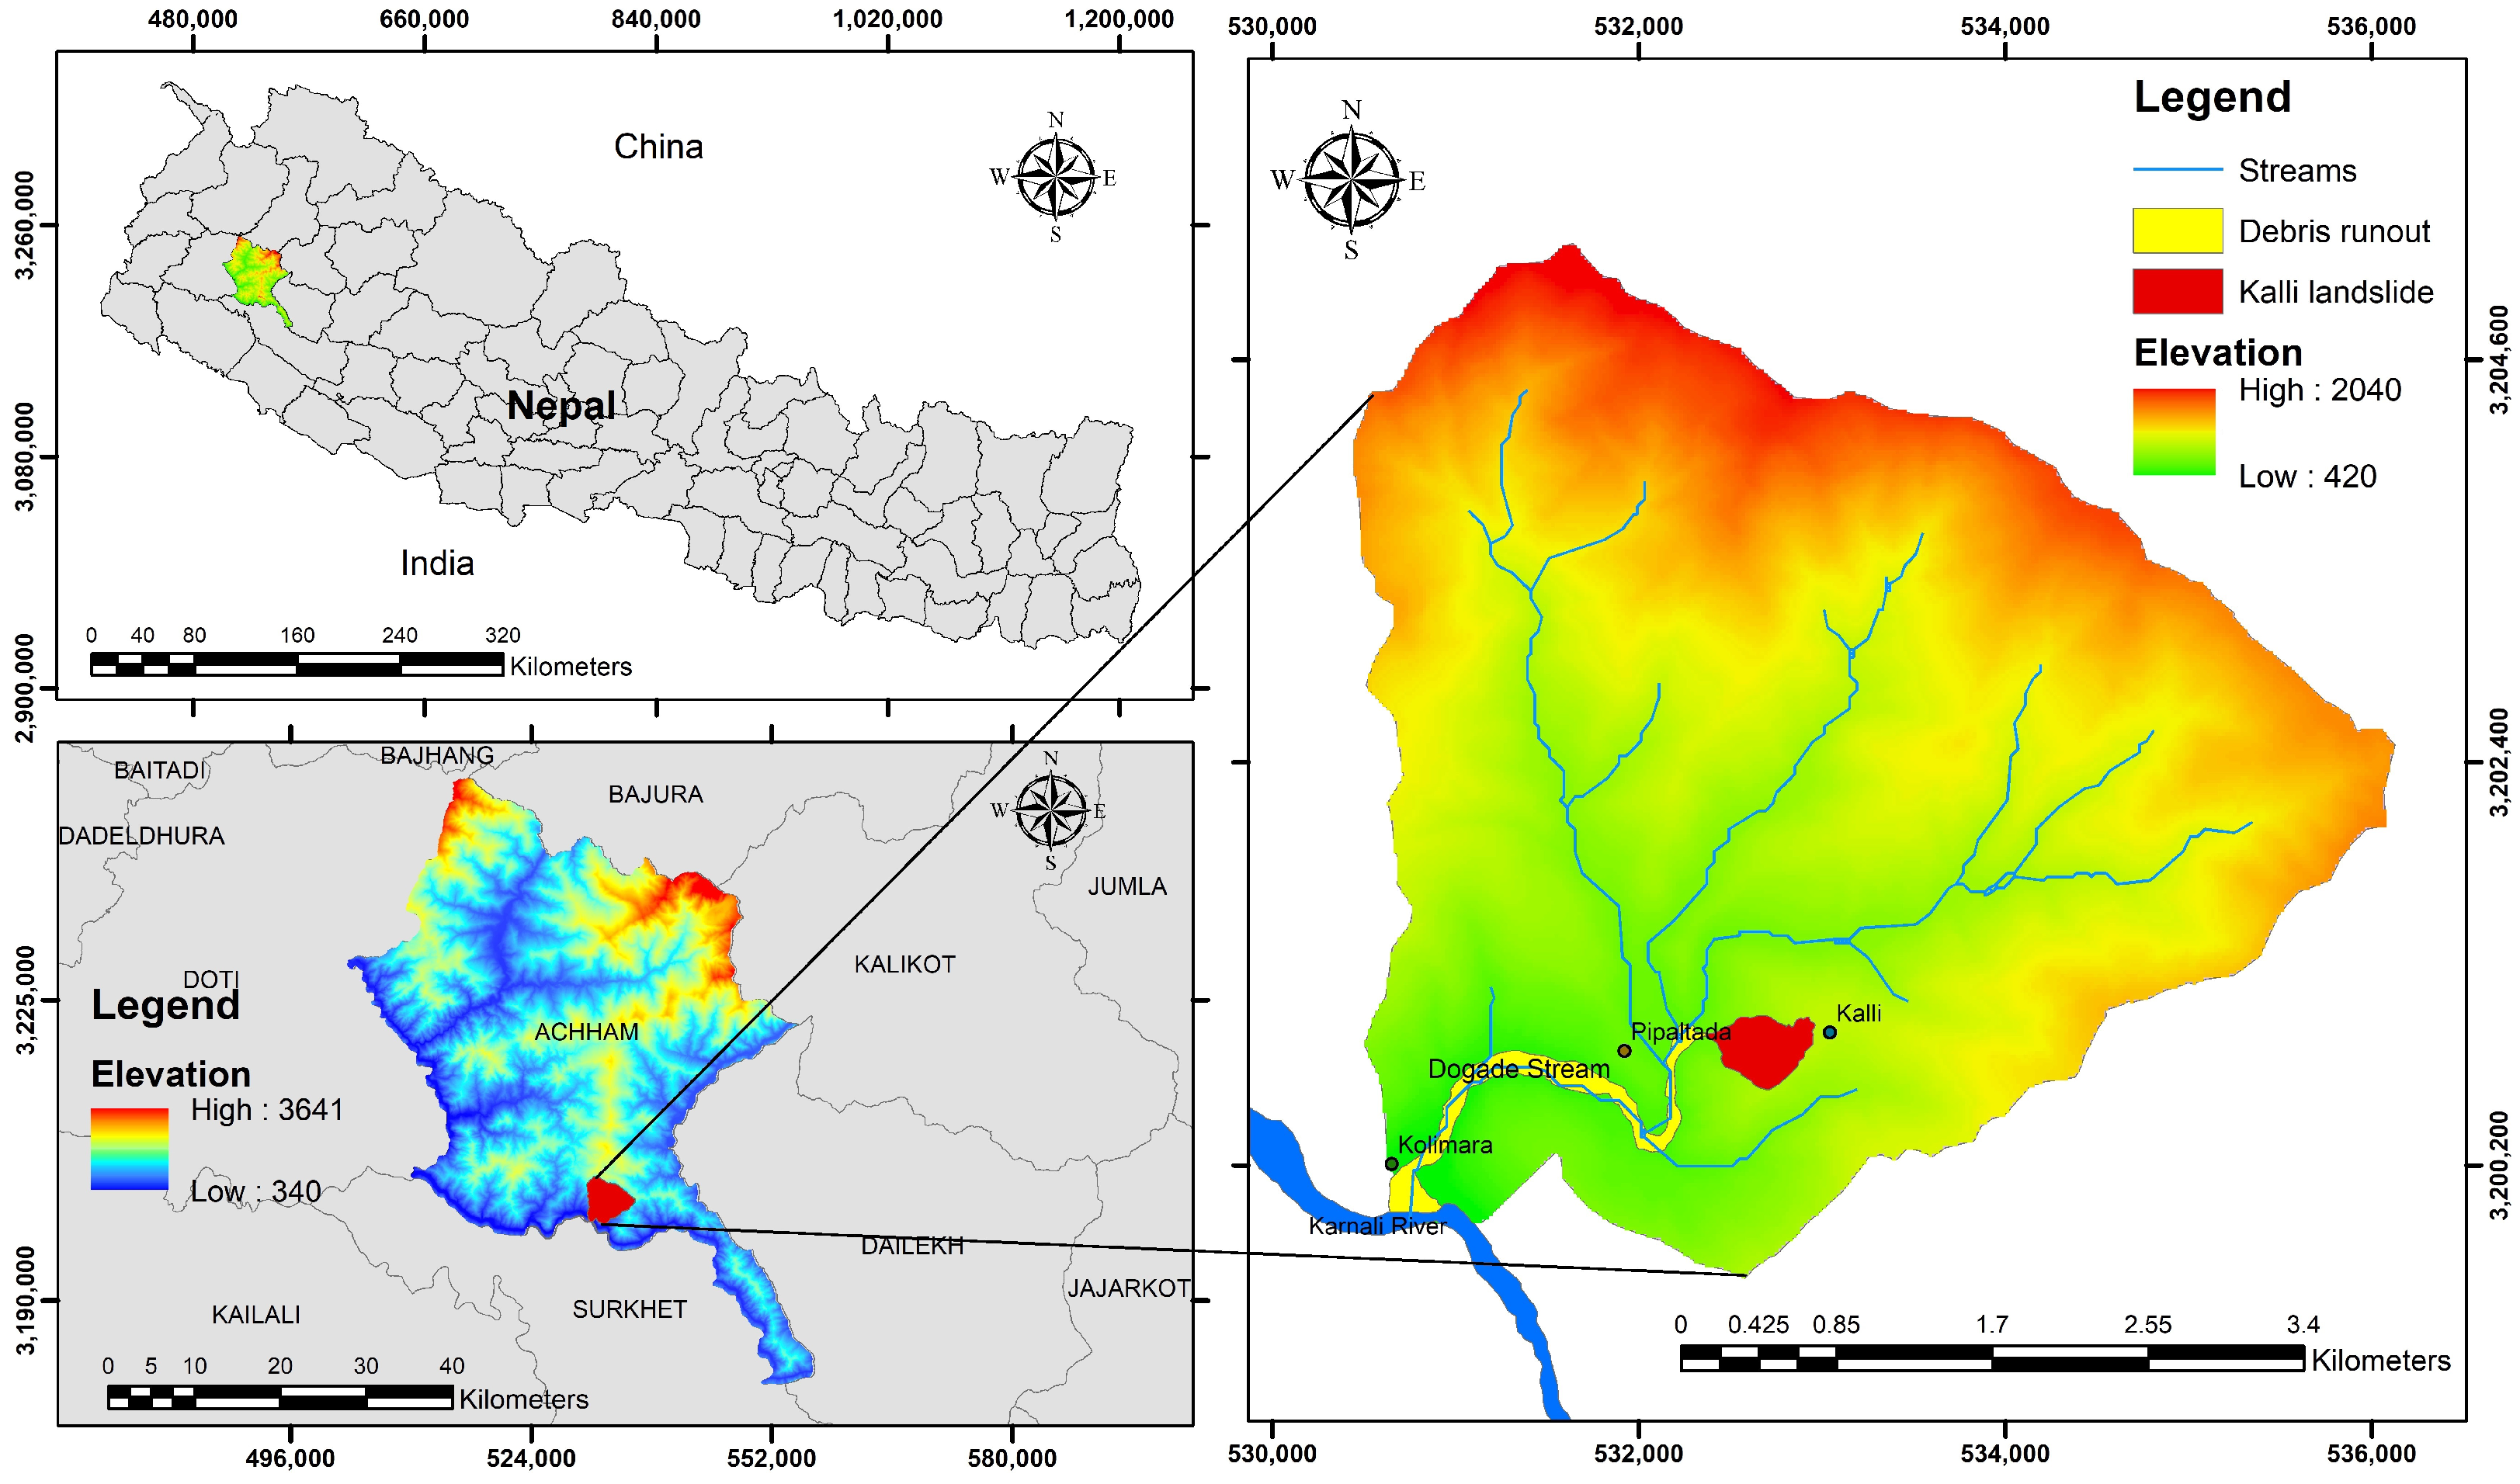
2. Study Area
3. Mass Movements in the Area
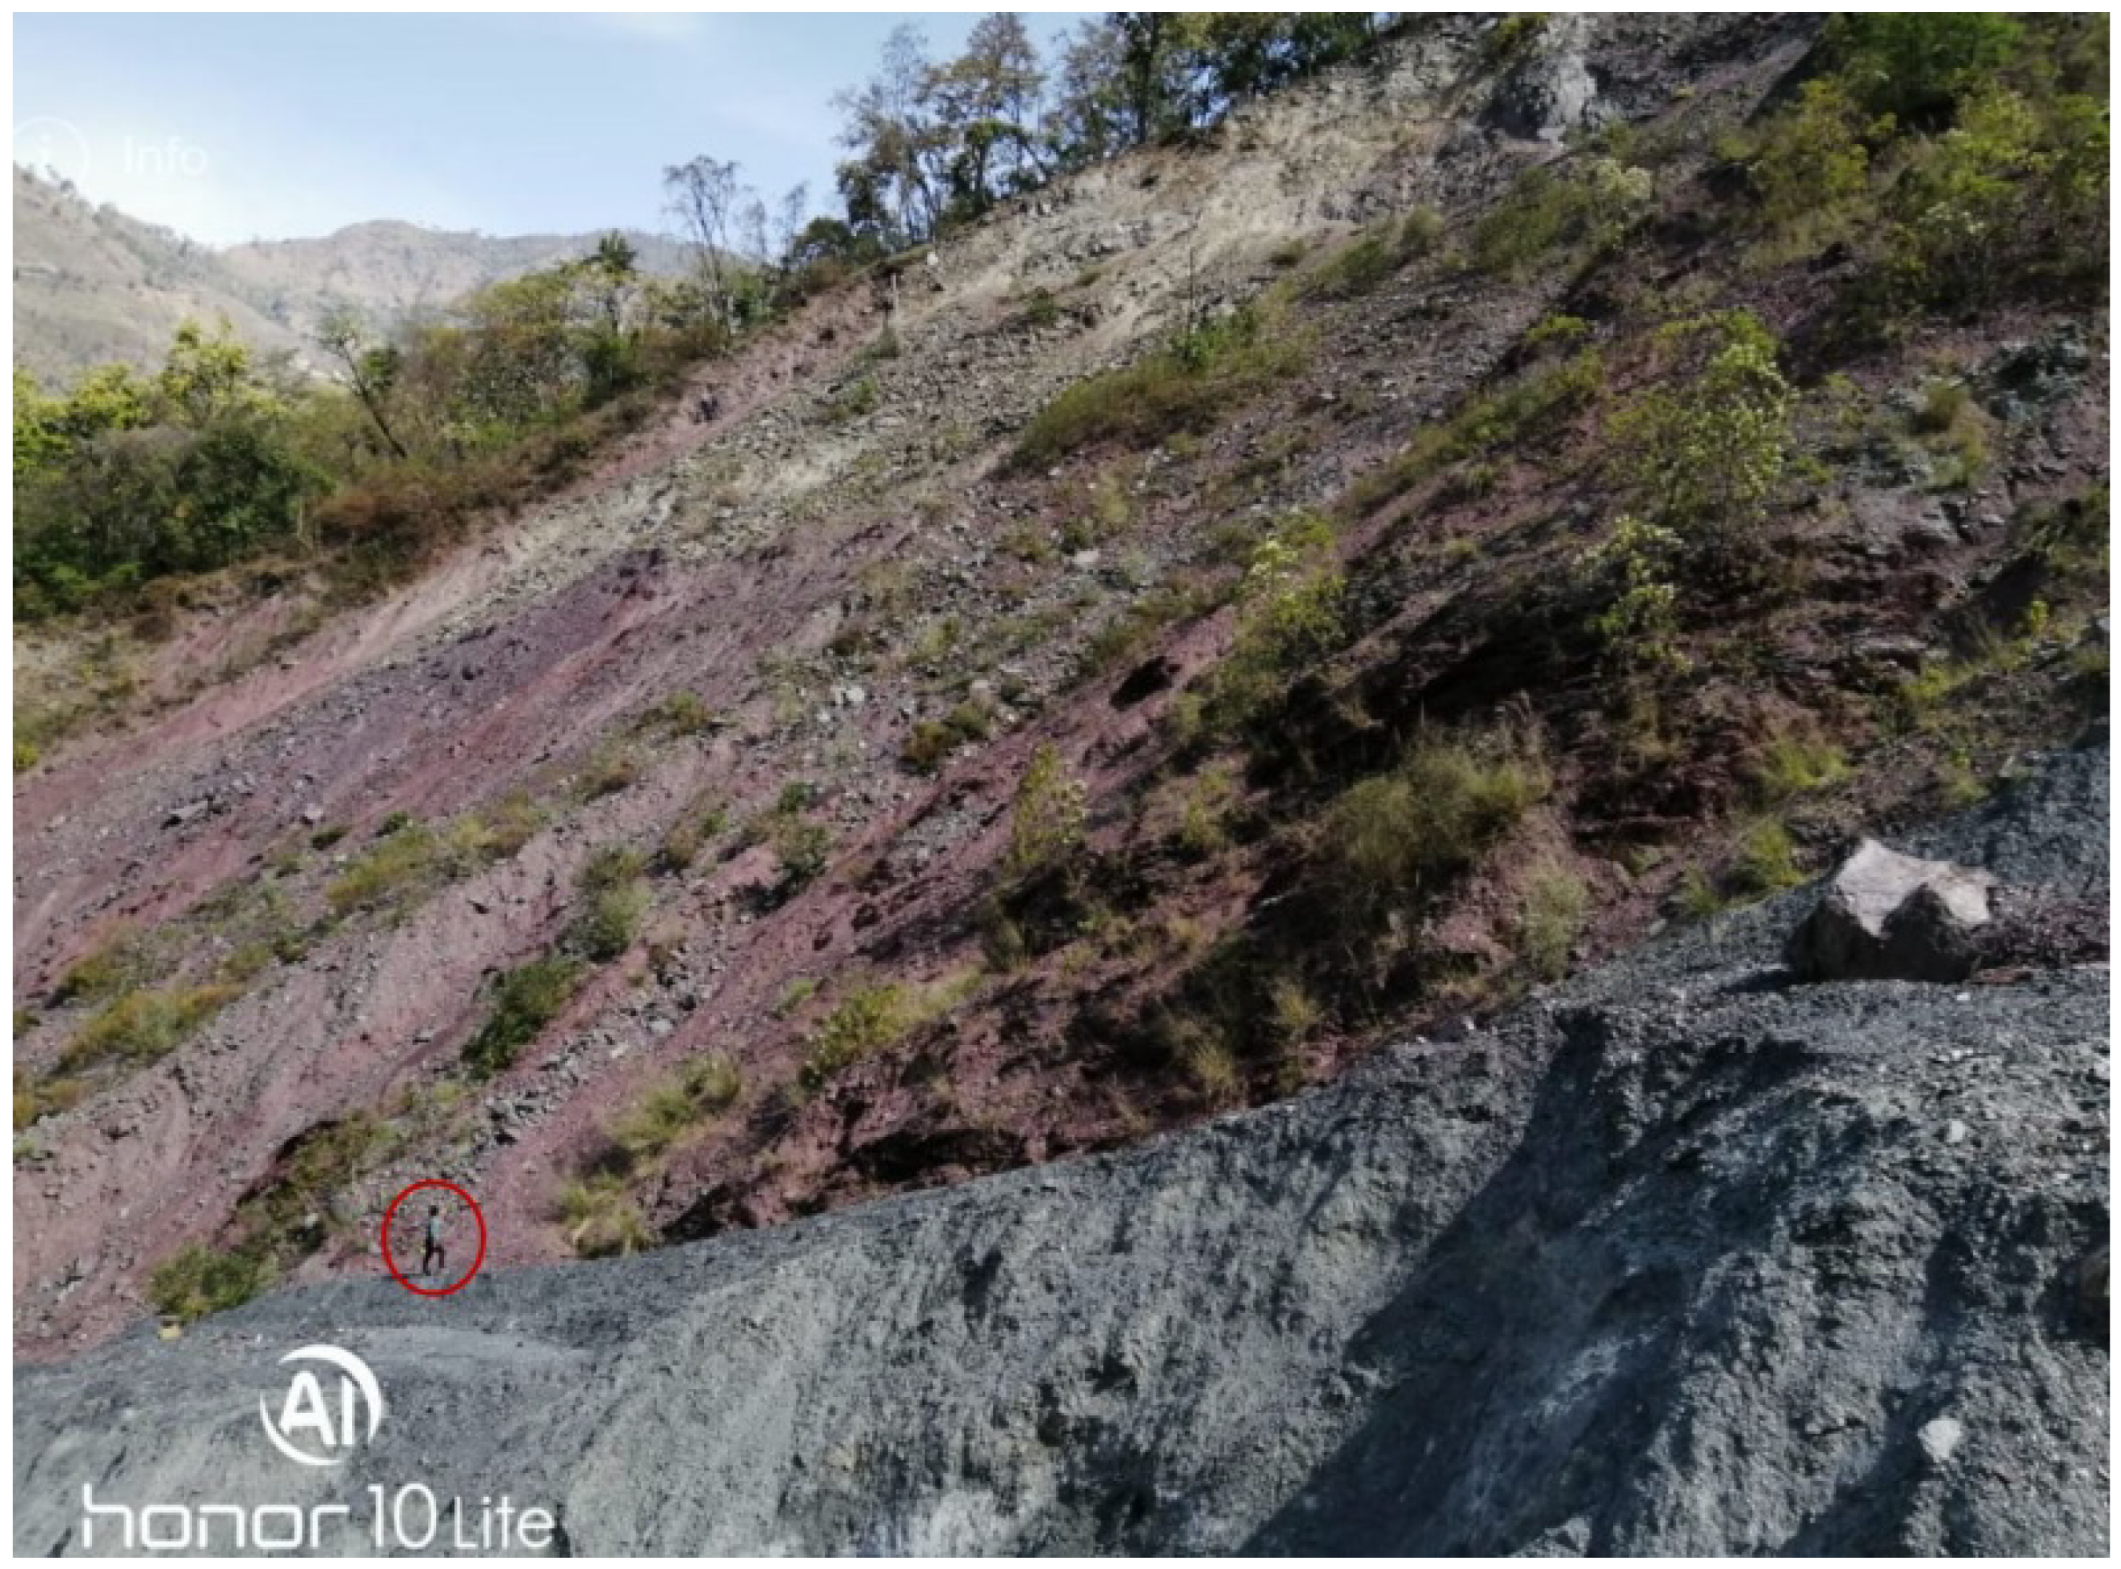
3.1. Landslide and Debris Flows Events
3.2. Rock and Soil Properties
3.3. Present and Potential Future Landslides and Debris Flows
4. Numerical Simulations
4.1. Modeling Background Parameters of the Two-Stage Debris Flow Development
4.2. Stage 1 Numerical Simulations
4.2.1. Modeling Debris Flow Development during the First Stage
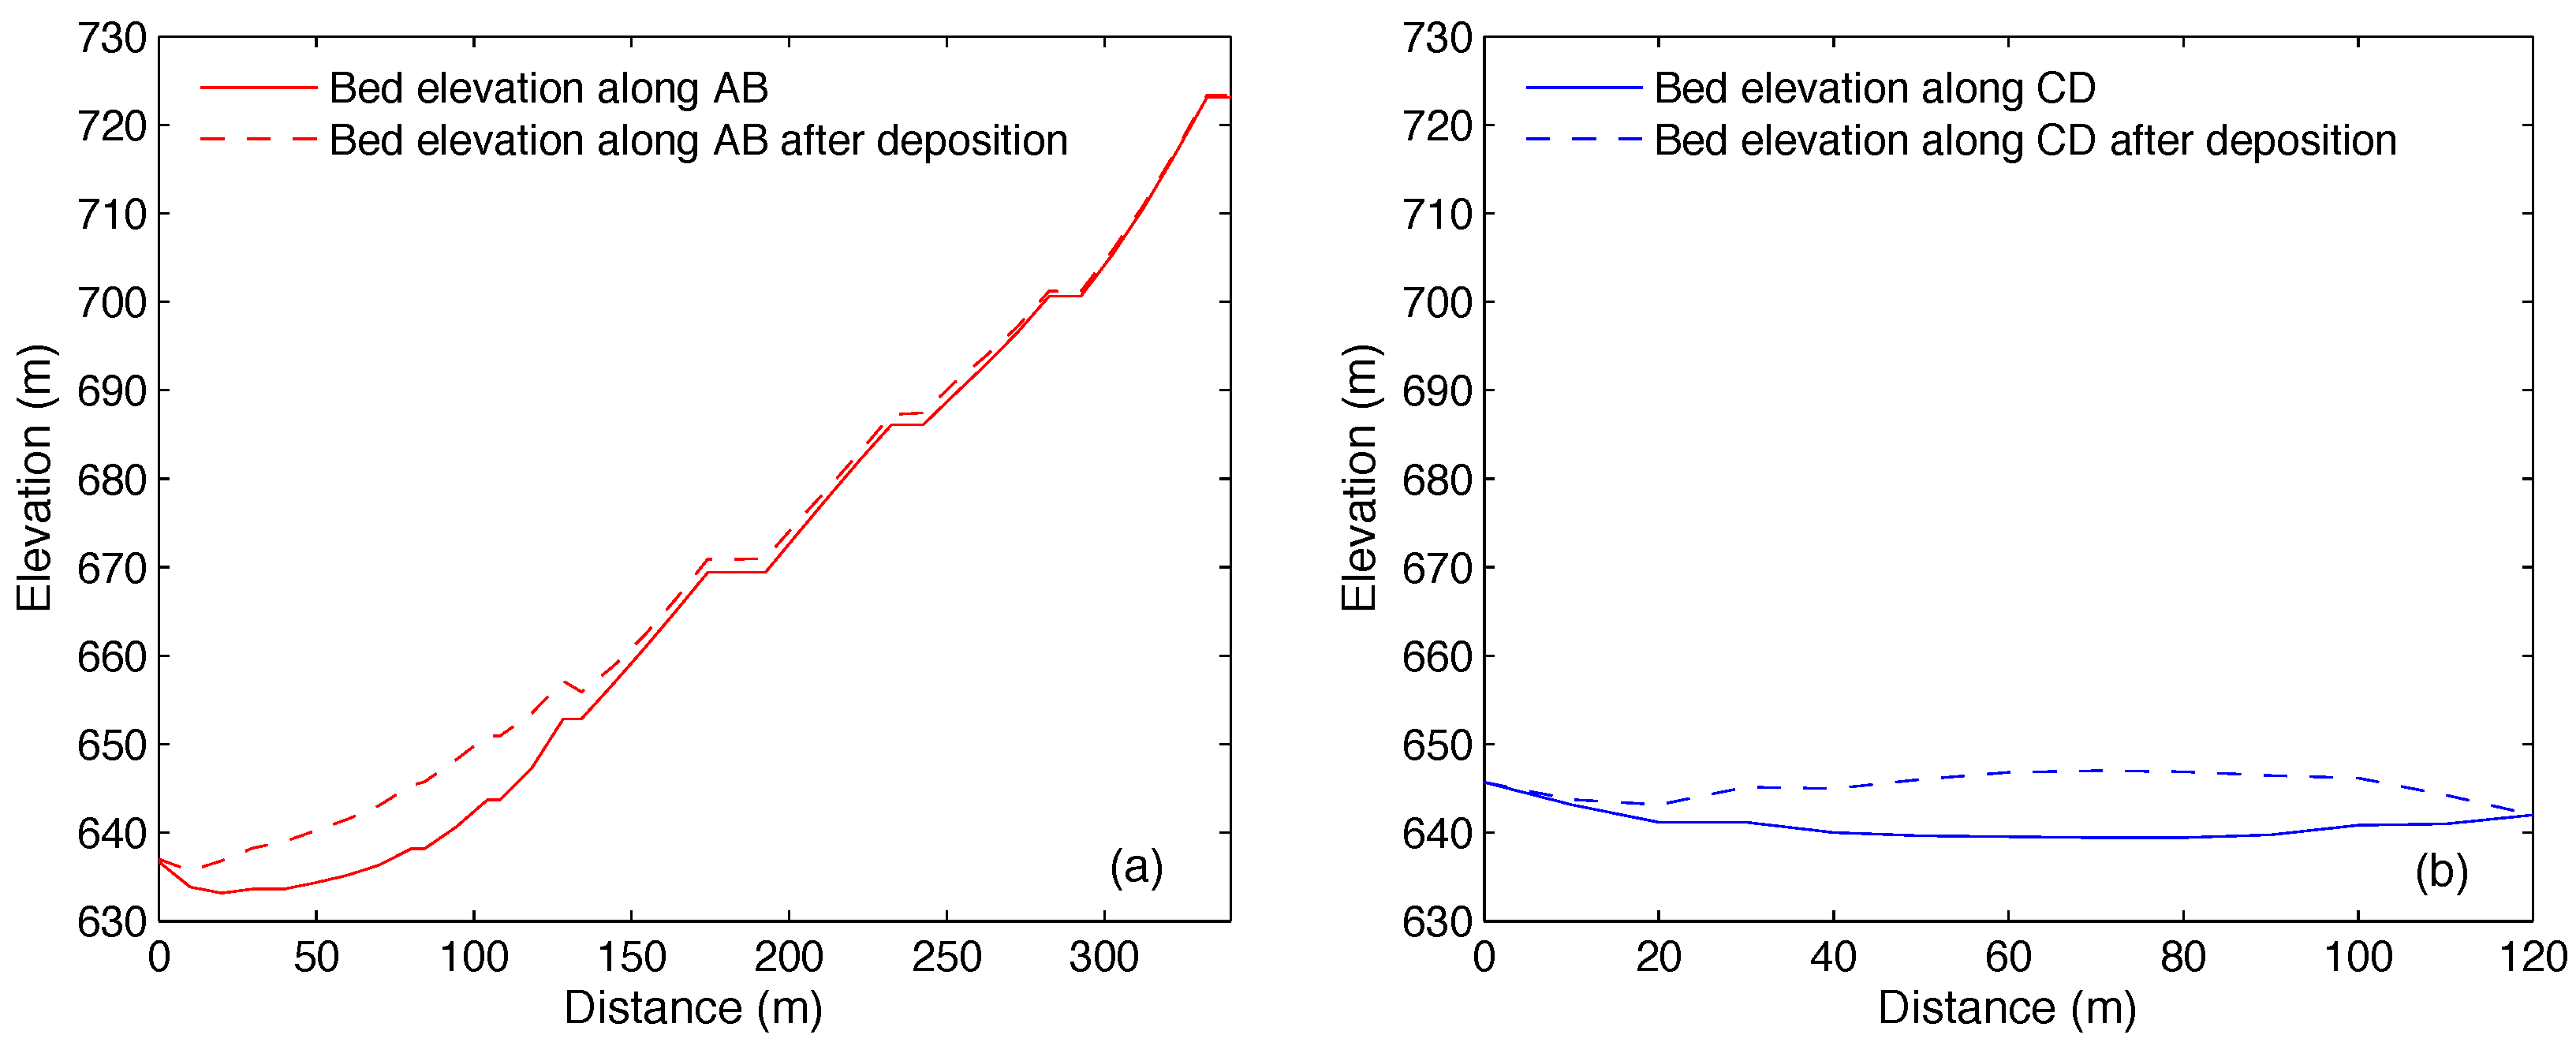
4.2.2. Simulation Results
4.3. Stage 2 Numerical Simulations
4.3.1. Modeling Debris Flow Development during the Second Stage
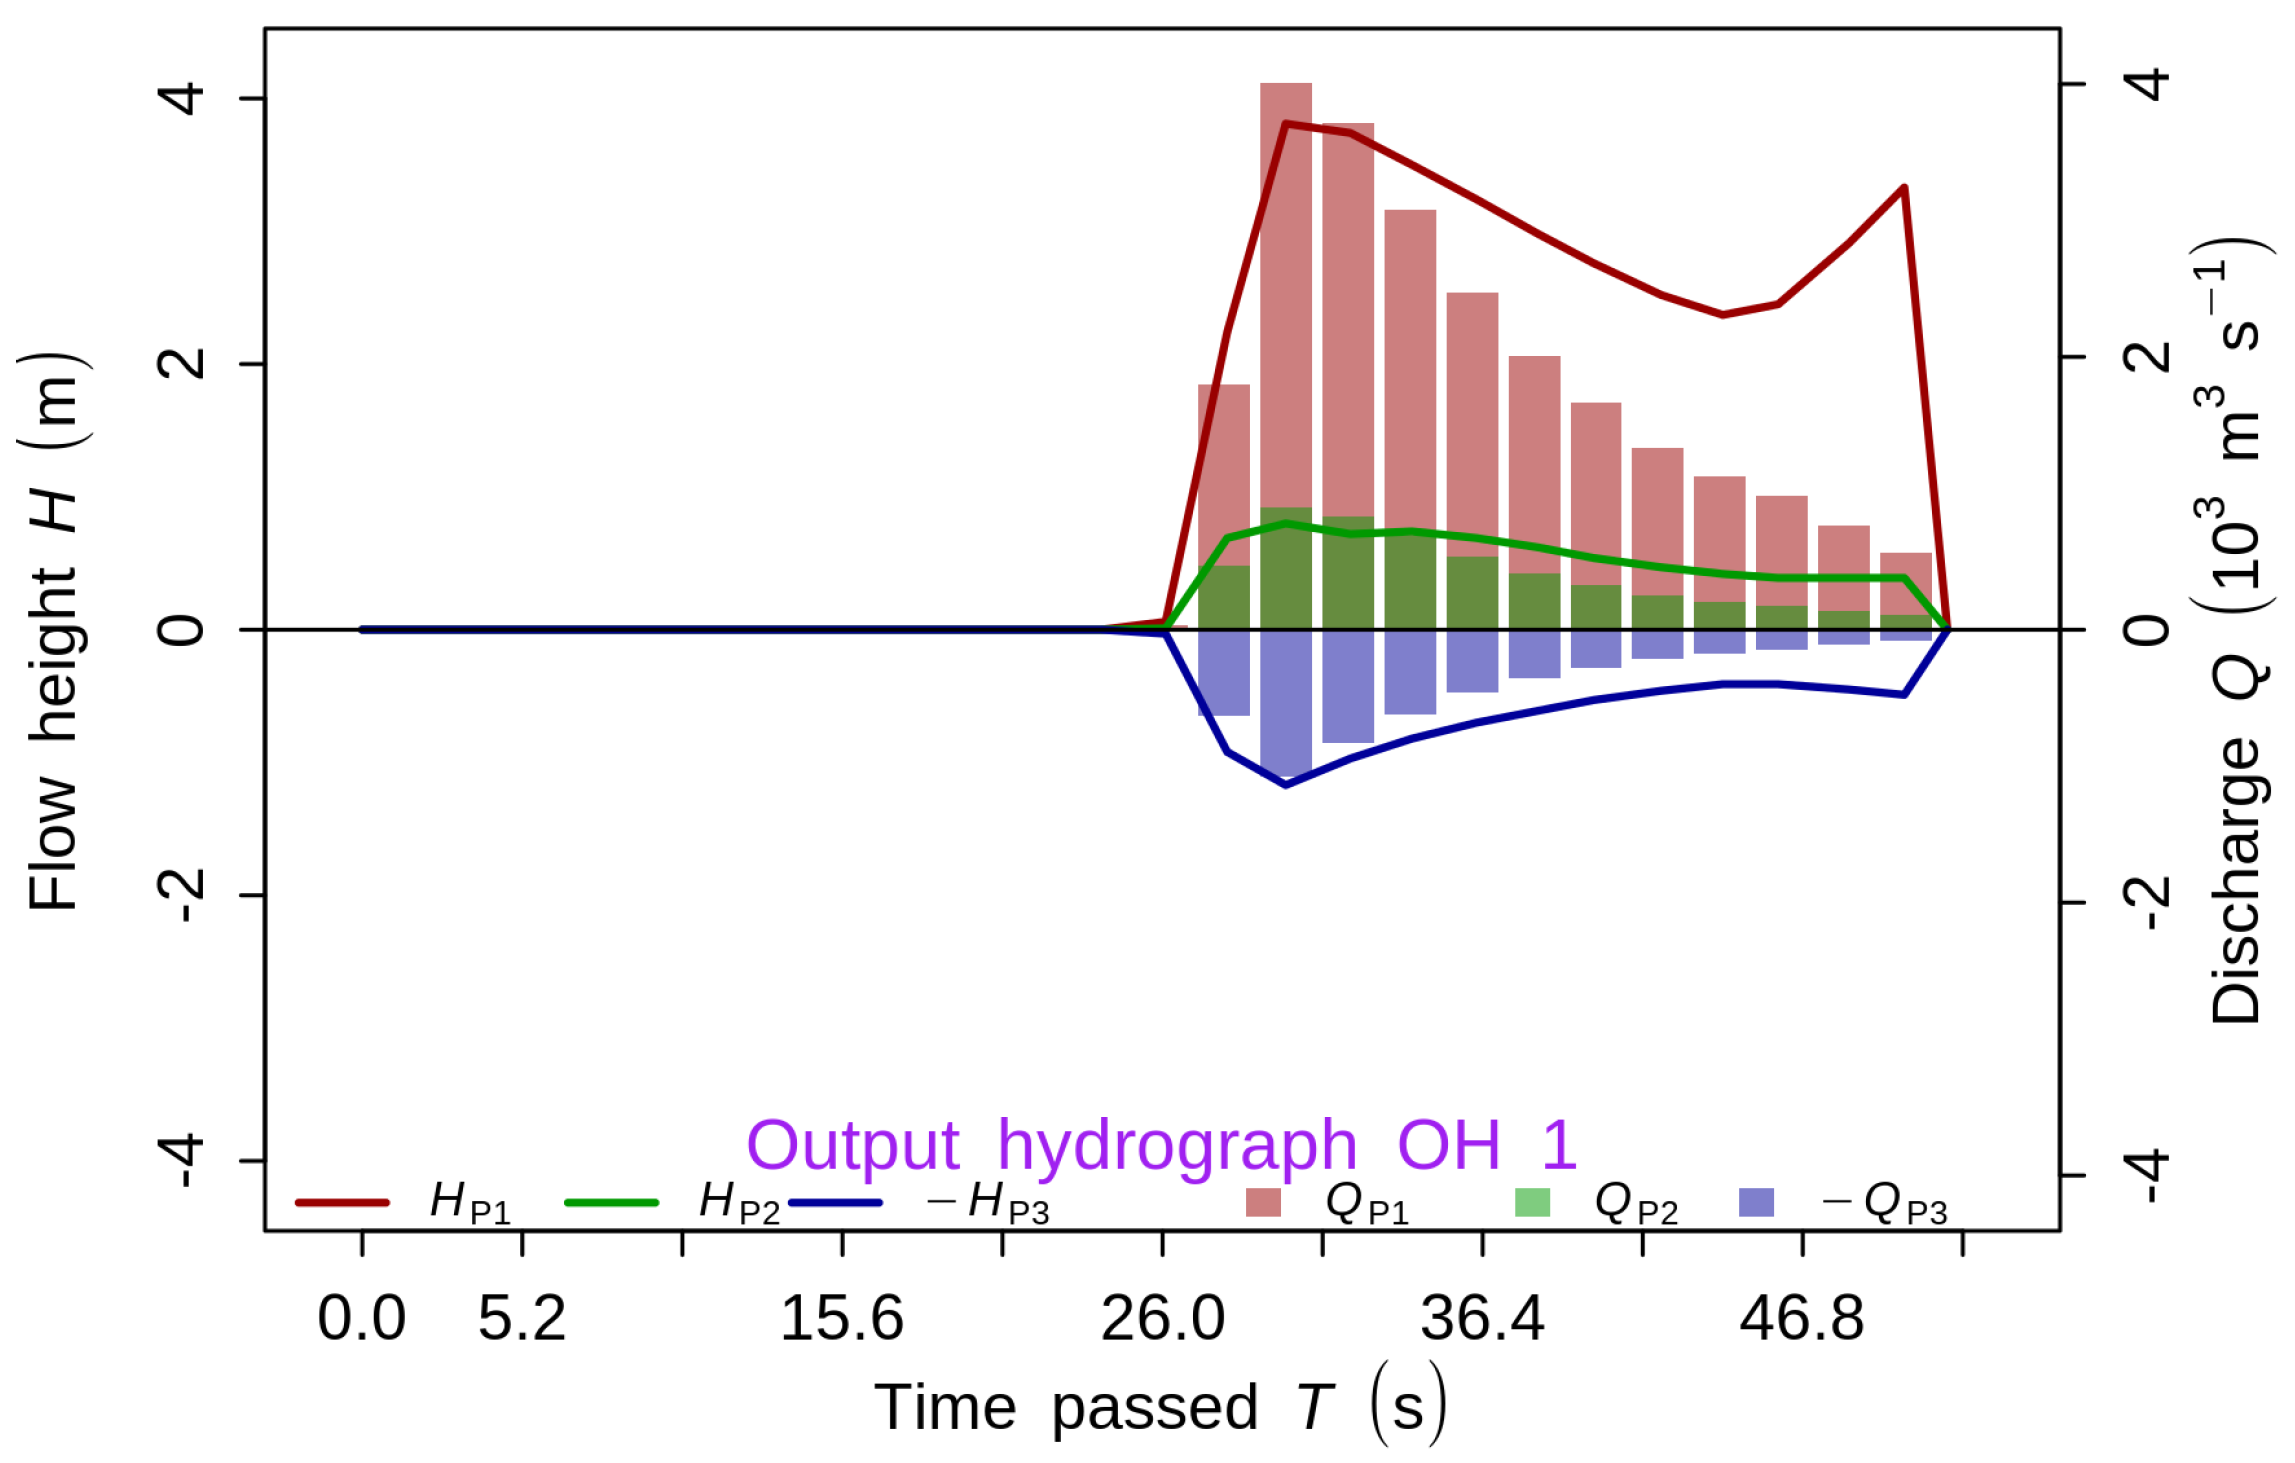
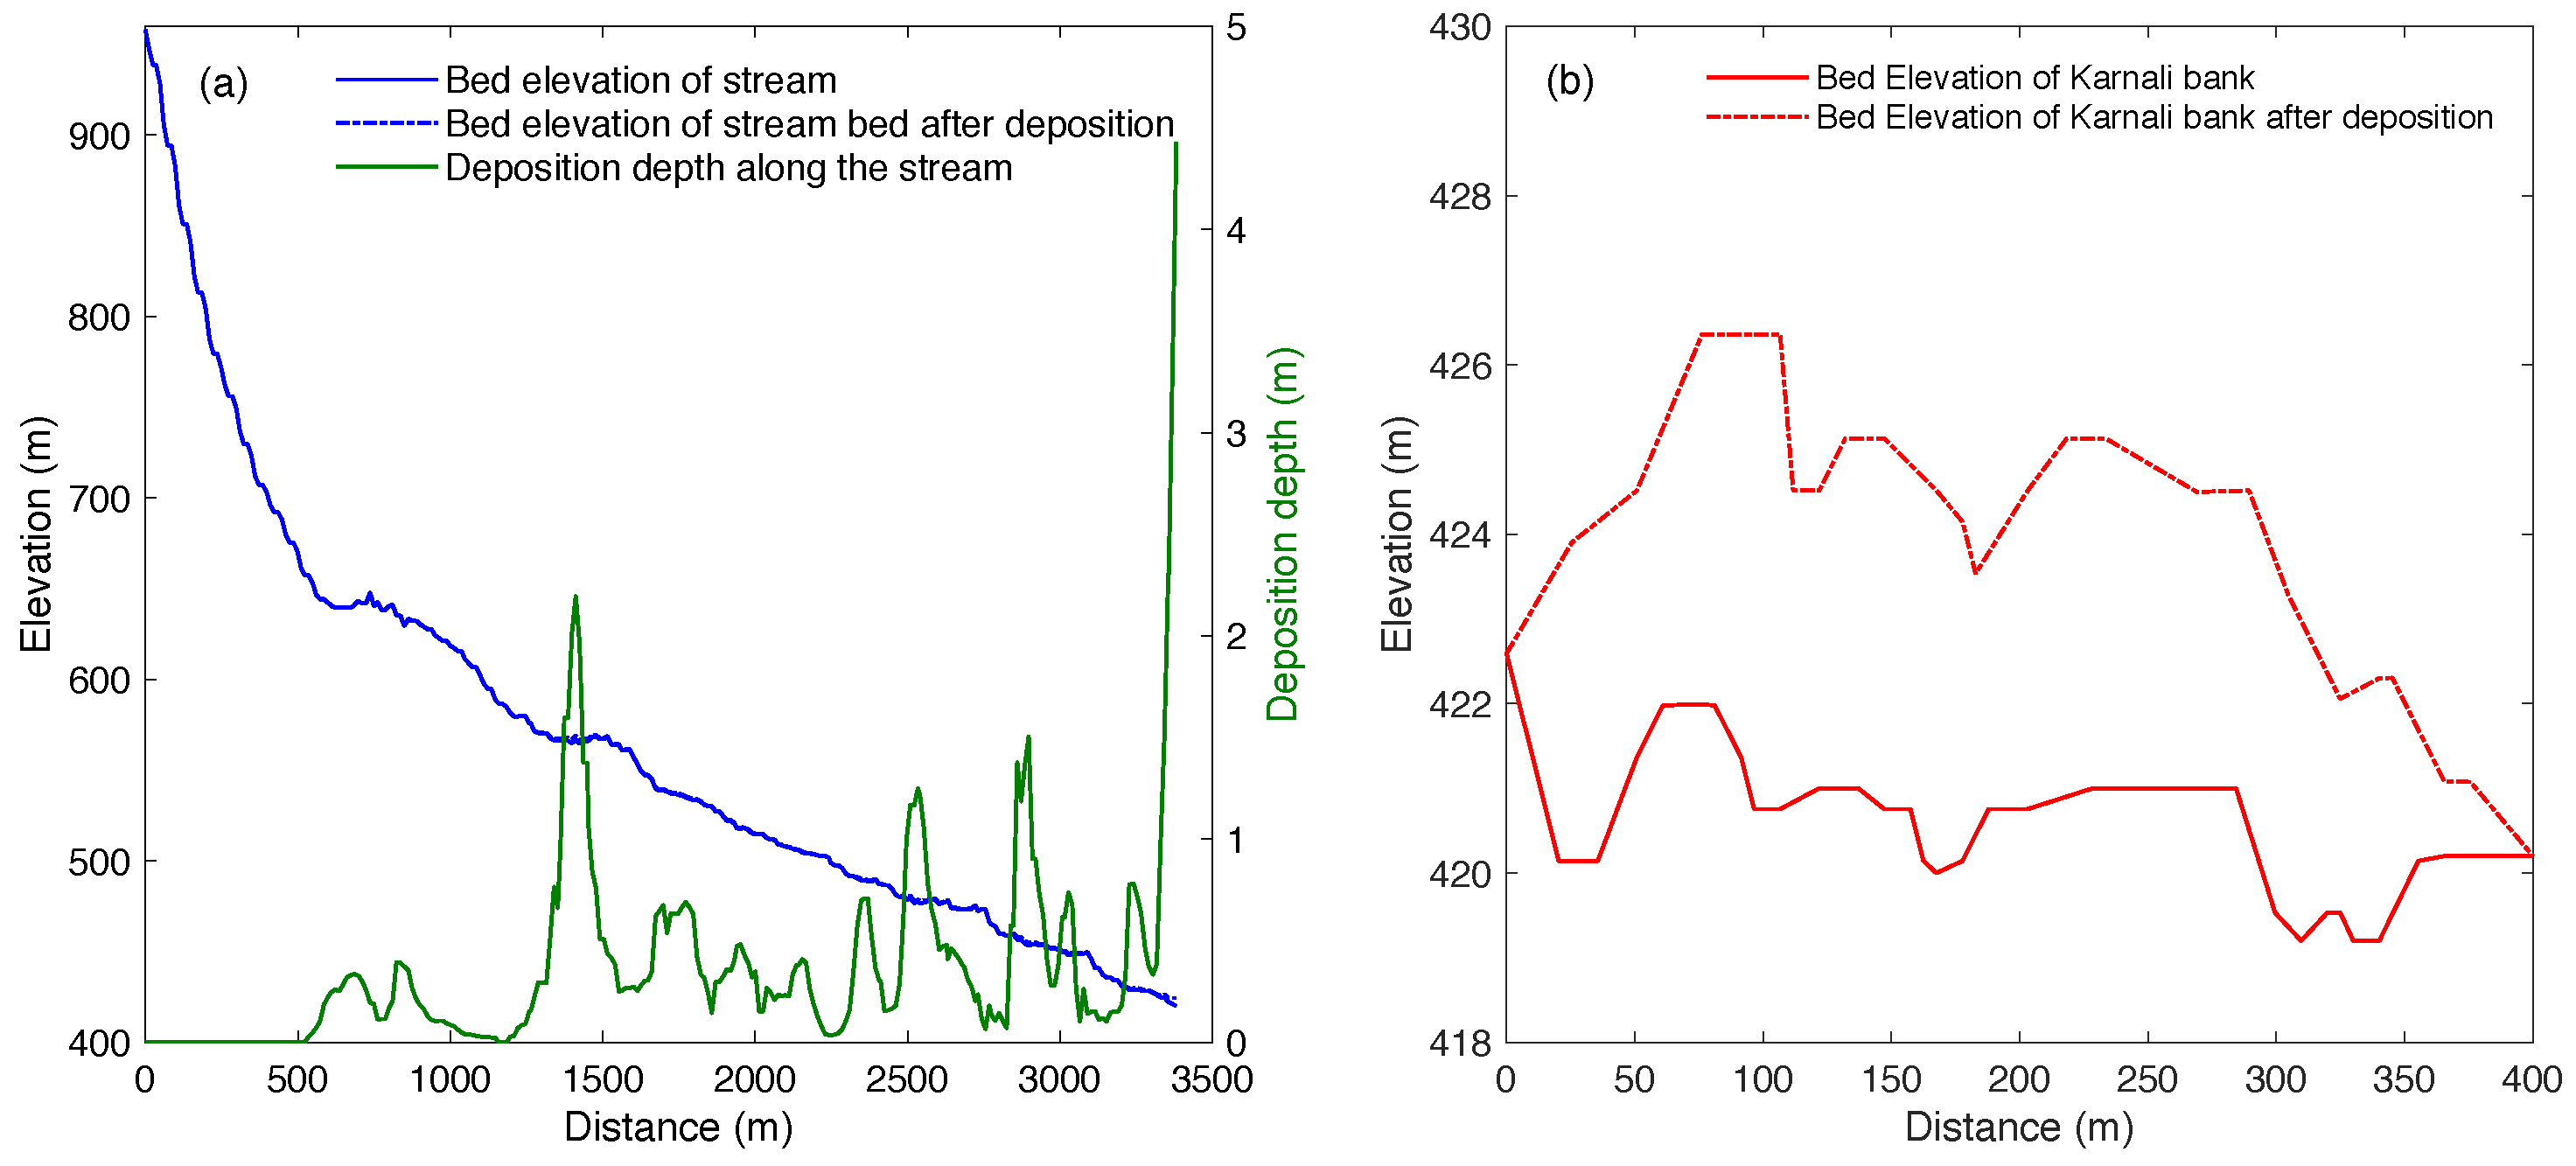
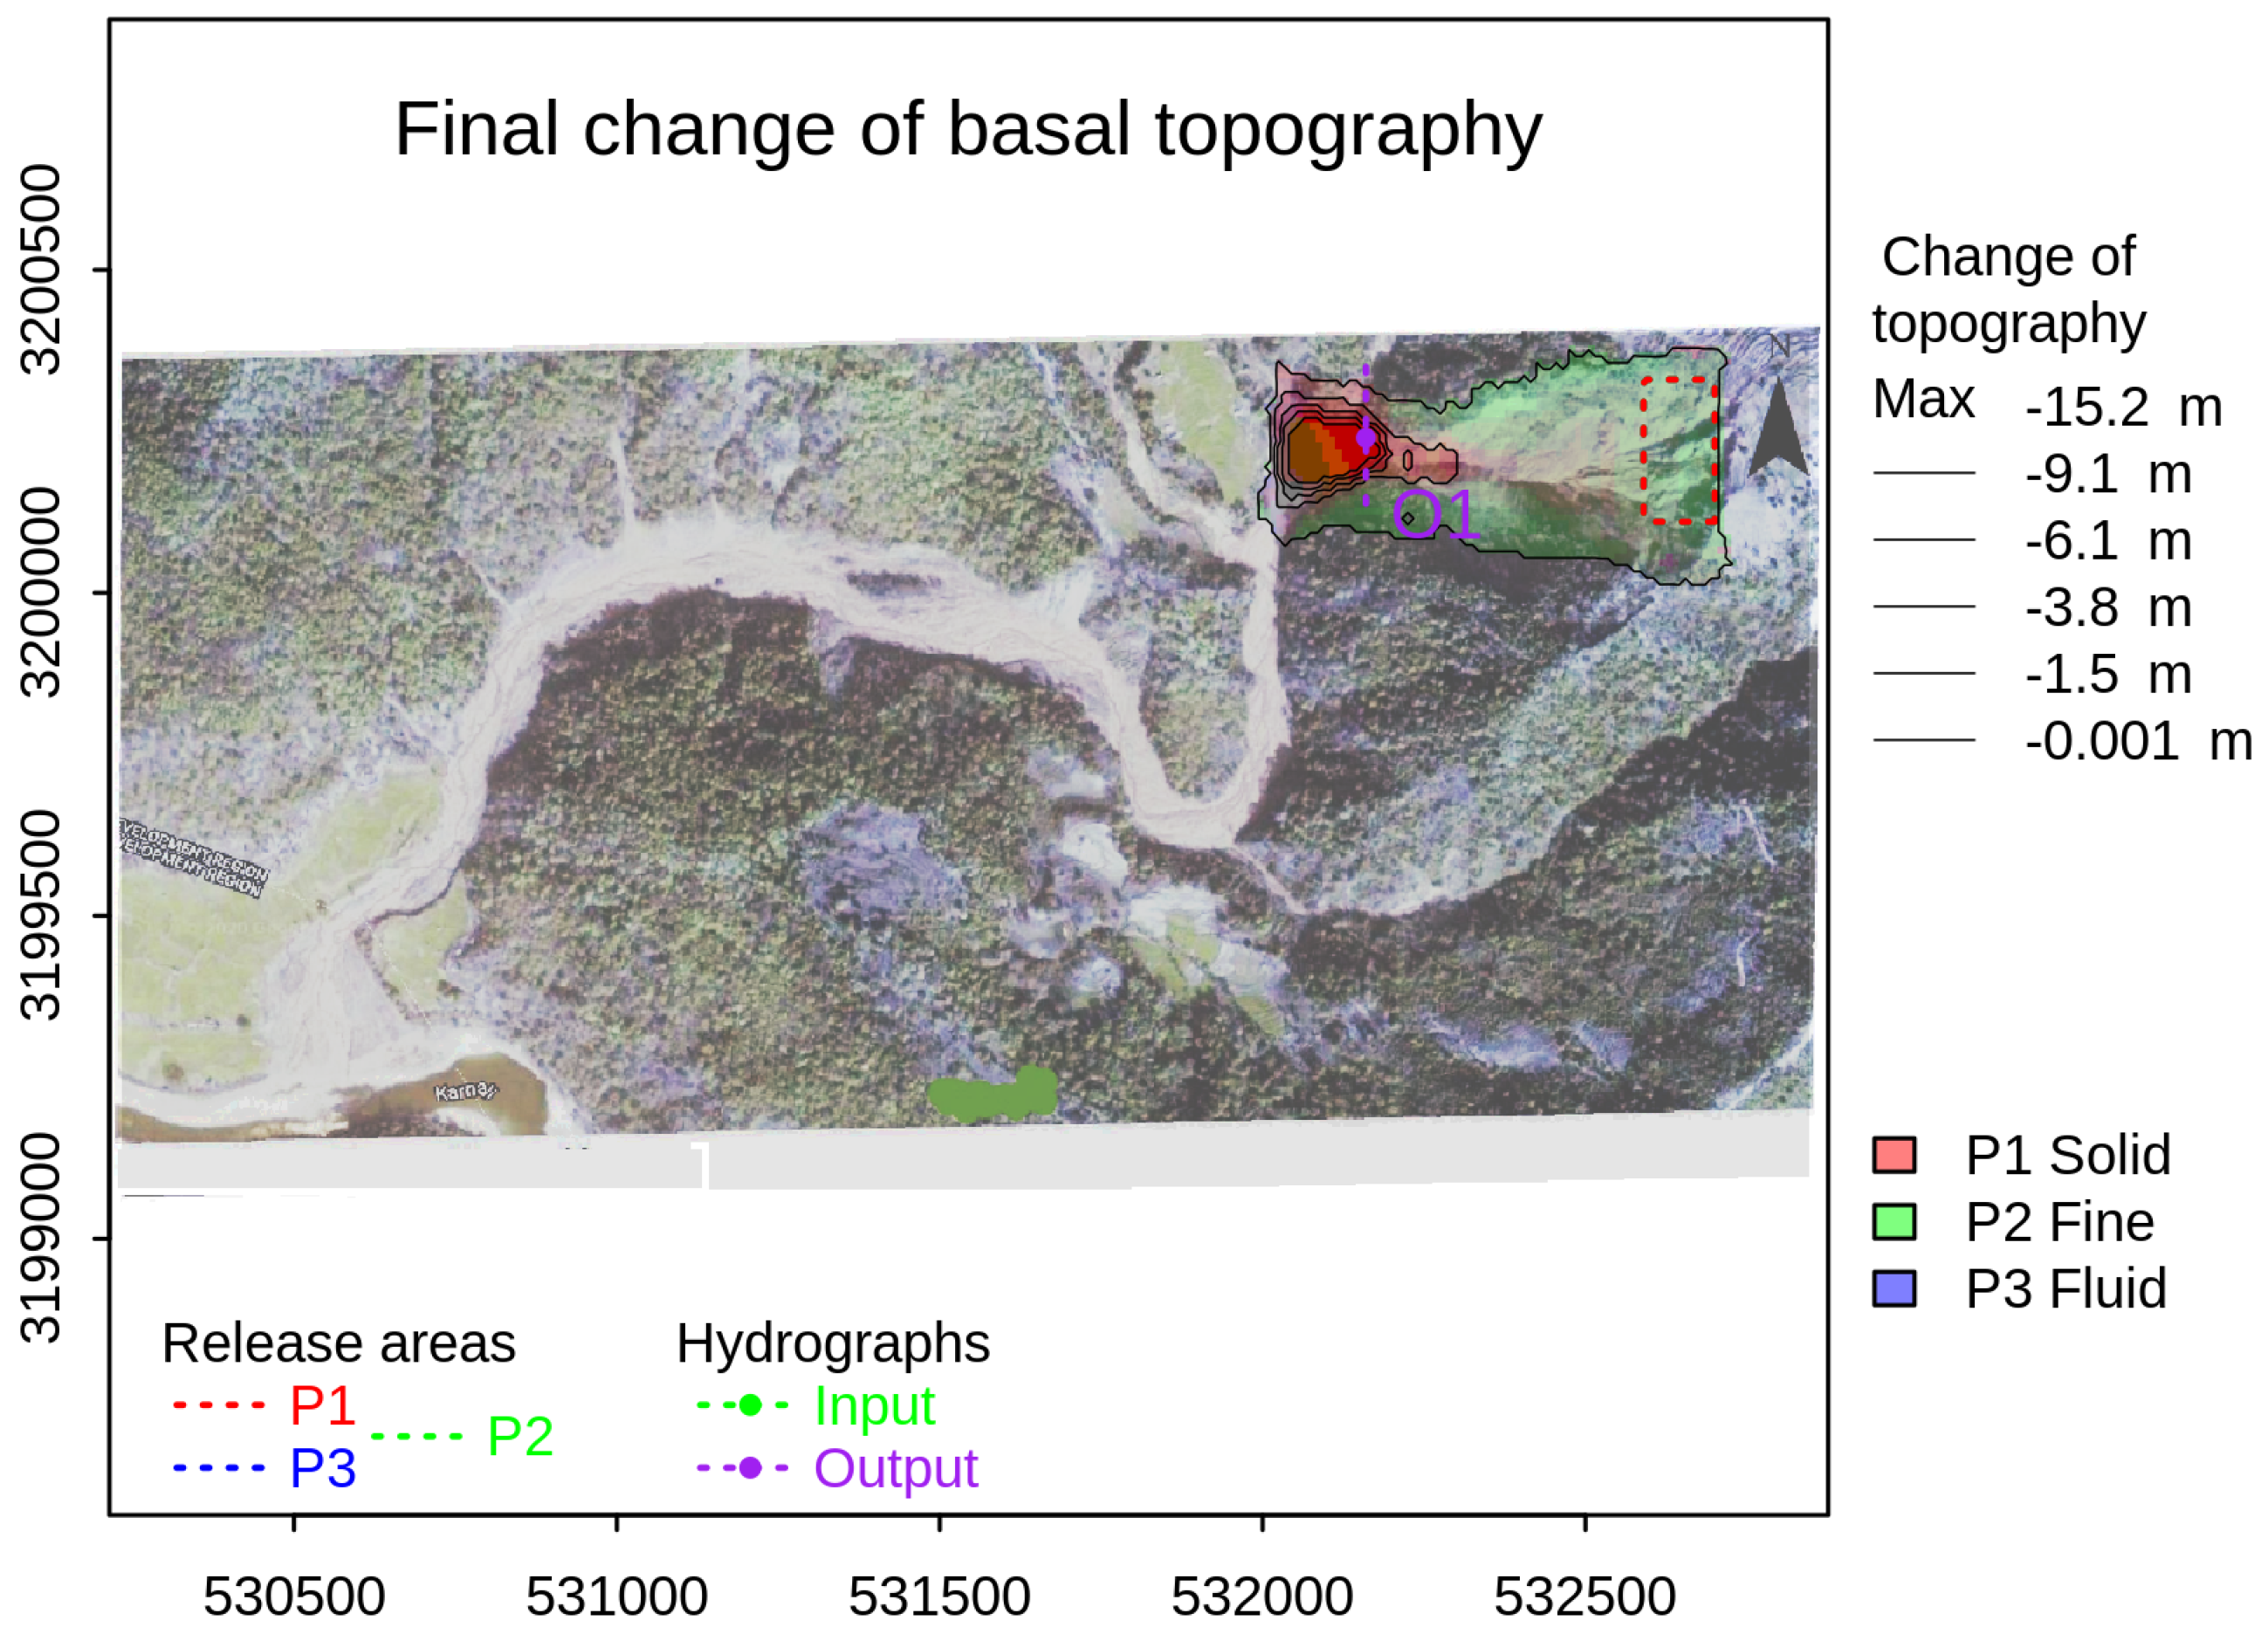
4.3.2. Simulation Results
5. Discussion
6. Conclusions
Author Contributions
Funding
Data Availability Statement
Acknowledgments
Conflicts of Interest
References
- Bilham, R.; Larson, K.; Freymueller, J. GPS measurements of present-day convergence across the Nepal Himalaya. Nature 1997, 386, 61–64. [Google Scholar] [CrossRef]
- Upreti, B.N.; Dhital, M.R. Landslide Studies and Management in Nepal; International Center for Integrated Mountain Development: Kathmandu, Nepal, 1996. [Google Scholar]
- Watanabe, T.; Dali, L.; Shiraiwa, T. Slope denudation and the supply of debris to cones in Langtang Himal, Central Nepal Himalaya. Geomorphology 1998, 26, 185–197. [Google Scholar] [CrossRef]
- Adhikari, D.P.; Koshimizu, S. Debris flow disaster at Larcha, upper Bhotekoshi Valley, central Nepal. Isl. Arc 2005, 14, 410–423. [Google Scholar] [CrossRef]
- Kayastha, P.; Dhital, M.R.; De-Smedt, F. Landslide susceptibility mapping using the weight of evidence method in the Tinau watershed, Nepal. Nat. Hazard 2012, 63, 479–498. [Google Scholar] [CrossRef]
- Pyakurel, A.; KC, D.; Dahal, B.K. Enhancing co-seismic landslide susceptibility, building exposure, and risk analysis through machine learning. Sci. Rep. 2024, 14, 5902. [Google Scholar] [CrossRef]
- Dahal, R.K.; Hasegawa, S. Representative rainfall thresholds for landslides in the Nepal Himalaya. Geomorphology 2008, 100, 429–443. [Google Scholar] [CrossRef]
- Bhandari, B.P.; Dhakal, S. Evolutional characteristics of debris flow in the Siwalik Hills of Nepal. Int. J. Geosci. 2019, 10, 1049–1067. [Google Scholar] [CrossRef]
- Dangi, H.; Bhattarai, T.N.; Thapa, P.B. An approach of preparing earthquake induced landslide hazard map: A case study of Nuwakot District, central Nepal. J. Nepal Geol. Soc. 2019, 58, 153–162. [Google Scholar] [CrossRef]
- KC, D.; Dangi, H.; Hu, L. Assessing landslide susceptibility in the northern stretch of Arun Tectonic Window, Nepal. CivilEng 2022, 3, 525–540. [Google Scholar] [CrossRef]
- Abbasi, A.; Khan, M.A.; Ishfaq, M.; Moon, P.K. Slope failure and landslide mechanism in Murree area, North Pakistan. Geol. Bull. Univ. Peshawar 2002, 35, 125–137. [Google Scholar]
- Khan, A.N.; Collins, A.E.; Qazi, F. Causes and extent of environmental impacts of landslide hazard in the Himalayan region: A case study of Murree, Pakistan. Nat. Hazard. 2011, 57, 413–434. [Google Scholar]
- Regmi, A.D.; Devkota, K.C.; Yoshida, K.; Pradhan, B.; Pourghasemi, H.R.; Kumamoto, T.; Akgun, A. Application of frequency ratio, statistical index, and weights-of-evidence models and their comparison in landslide susceptibility mapping in Central Nepal Himalaya. Arab. J. Geosci. 2014, 7, 725–742. [Google Scholar] [CrossRef]
- Gnyawali, K.R.; Shrestha, R.; Bhattarai, A.; Magar, P.R.; Dhungana, A.R.; Sukupayo, I.; Dumaru, R. Rockfall characterization and structural protection in the Siddhababa section of Siddhartha highway H10, Nepal. J. Inst. Eng. 2015, 11, 1–11. [Google Scholar] [CrossRef]
- Dahal, R.K. Initiatives for rockfall hazard mitigation in Nepal. Bull. Nepal Geol. Soc. 2016, 33, 51–56. [Google Scholar]
- Alsabhan, A.H.; Singh, K.; Sharma, A.; Alam, S.; Pandey, D.D.; Rahman, S.A.S.; Khursheed, A.; Munshi, F.M. Landslide susceptibility assessment in the Himalayan range based along Kasauli-Parwanoo road corridor using weight of evidence, information value, and frequency ratio. J. King Saud Univ.-Sci. 2022, 34, 101759. [Google Scholar] [CrossRef]
- DeLeon, A.A.; Jeppson, R.W. Hydraulic and Numerical Solutions of Steady-State but Spatially Varied Debris Flow; Utah Water Research Laboratory, Utah State University: Logan, UT, USA, 1982; pp. 4–24. [Google Scholar]
- Takahashi, T.; Tsujimoto, H. Delineation of the debris flow hazardous zone by a numerical simulation method. In Proceedings of the International Symposium on Erosion, Debris Flow and Disaster Prevention, Tsukuba, Japan, 3–5 September 1985; pp. 457–462. [Google Scholar]
- O’Brien, J.S. Physical Processes, Rheology and Modeling of Mudflows. Ph.D. Thesis, Colorado State University, Fort Collins, CO, USA, 1986. [Google Scholar]
- Savage, S.B.; Hutter, K. The motion of a finite mass of granular material down a rough incline. J. Fluid Mech. 1989, 199, 177–215. [Google Scholar] [CrossRef]
- Ancey, C. Dry granular flows down an inclined channel: Experimental investigations on the frictional-collisional regime. Phys. Rev. 2001, 65, 011304. [Google Scholar] [CrossRef] [PubMed]
- Midi, G.D.R. On dense granular flows. Eur. Phys. J. 2001, 14, 341–365. [Google Scholar]
- Parez, S.; Aharonov, E.; Toussaint, R. Unsteady granular flows down an inclined plane. Phys. Rev. 2016, 93, 042902. [Google Scholar] [CrossRef]
- Jop, P.; Forterre, Y.; Pouliquen, O. A constitutive law for dense granular flows. Nature 2006, 441, 727–730. [Google Scholar] [CrossRef]
- Denlinger, R.P.; Iverson, R.M. Flow of variably fluidized granular masses across three dimensional terrain: 2. Numerical predictions and experimental tests. J. Geophys. Res. Solid Earth 2001, 106, 553–566. [Google Scholar] [CrossRef]
- Pitman, E.B.; Le, L. A two-fluid model for avalanche and debris flows. Philos. Trans. R. Soc. Lond. Ser. 2005, 363, 1573–1601. [Google Scholar] [CrossRef]
- Hutter, K.; Schneider, L. Important aspects in the formulation of solid-fluid debris-flow models. Part I: Thermodynamic implications. Contin. Mech. Thermodyn. 2010, 22, 363–390. [Google Scholar] [CrossRef]
- Luca, I.; Tai, Y.C.; Kuo, C.Y. Shallow Geophysical Mass Flows down Arbitrary Topography; Springer: Berlin/Heidelberg, Germany, 2016; pp. 203–250. [Google Scholar]
- Pudasaini, S.P. A general two-phase debris flow model. J. Geophys. Res. Earth Surf. 2012, 117, F03010. [Google Scholar] [CrossRef]
- Thiessen, A.H. Precipitation averages for large areas. Mon. Weather Rev. 1911, 39, 1082–1084. [Google Scholar] [CrossRef]
- Department of of Mines and Geology (DMG). Geological Map of Far-Western Nepal; Department of of Mines and Geology (DMG): Kathmadu, Nepal, 1987. [Google Scholar]
- Neupane, B.; Zhao, J.; Ju, Y.; Baral, U. Occurrence of unconventional hydrocarbon deposits and its structural relation in Nepal Himalaya: Implication for future exploration. Arab. J. Geosci. 2020, 13, 81. [Google Scholar] [CrossRef]
- Kayastha, N.B. Stratigraphy of the lower Tertiary rocks of Nepal Himalaya. J. Nepal Geol. Soc. 1992, 8, 21–30. [Google Scholar] [CrossRef]
- Jakob, M.; Hungr, O. Debris-Flow Hazards and Related Phenomena; Springer: Berlin/Heidelberg, Germany, 2005. [Google Scholar]
- KC, D. Post Wildfire Debris Flows: Mechanisms of Enhanced Overland Flow and Erosion and Numerical Simulations. Ph.D. Thesis, University of Toledo, Toledo, OH, USA, 2023. [Google Scholar]
- Diwakar, K.C.; Dangi, H.; Naqvi, M.W.; Kadel, S.; Hu, L.B. Recurring landslides and debris flows near Kalli Village in the Lesser Himalayas of Western Nepal. Geotech. Geol. Eng. 2023, 41, 3151–3168. [Google Scholar] [CrossRef]
- Ojha, S. Rehabilitation of Sunkoshi Small Hydropower Plant (2.6 MK), Nepal after Sequences of Natural Disaster. Int. J. Eng. Technol. Sci. 2018, 5, 75–90. [Google Scholar] [CrossRef]
- IS 1943-1979; Method for Determination of Unconfined Compressive Strength of Rock Materials. Department of Consumer Affairs: New Delhi, India, 2016.
- IS 2720; Method of Test for Soils Part 4, Grain Size Analysis. Department of Consumer Affairs: New Delhi, India, 2006.
- IS 2720; Method of Test for Soils Part 5, Determination of Liquid Limit and Plastic Limit. Department of Consumer Affairs: New Delhi, India, 2006.
- Alyamani, M.S.; Sen, Z. Determination of hydraulic conductivity from complete grain-size distribution curves. Ground Water 1993, 31, 551–555. [Google Scholar] [CrossRef]
- Mergili, M.; Jaboyedoff, M.; Pullarello, J.; Pudasaini, S.P. Back calculation of the 2017 piz cengalo-bondo landslide cascade with r.avaflow: What we can do and what we can learn. Nat. Hazards Earth Syst. Sci. 2020, 20, 505–520. [Google Scholar] [CrossRef]
- Pudasaini, S.P.; Mergili, M. A multi-phase mass flow model. J. Geophys. Res. Earth Surf. 2019, 124, 2920–2942. [Google Scholar] [CrossRef]
- Iverson, R.M.; Denlinger, R.P. Flow of variably fluidized granular masses across three-dimensional terrain: 1. Coulomb mixture theory. J. Geophys. Res. 2001, 106, 537–552. [Google Scholar] [CrossRef]
- Alaska Satellite Facility (ASF). Available online: https://search.asf.alaska.edu/ (accessed on 10 January 2022).
- Davies, T.R.H. Large debris flows: A macro-viscous phenomenon. Acta Mech. 1986, 63, 161–178. [Google Scholar] [CrossRef]
- Chen, H.X.; Zhang, L.M.; Chang, D.S.; Zhang, S.D. Mechanisms and runout characteristics of the rainfall-triggered debris flow in Xiaojiagou in Sichuan Province, China. Nat. Hazards 2019, 62, 1037–1057. [Google Scholar] [CrossRef]
- Morino, C.; Conway, S.J.; Balme, M.R.; Hillier, J.; Jordan, C.; Sæmundsson, þ.; Argles, T. Debris-flow release processes investigated through the analysis of multi-temporal LiDAR datasets in north-western Iceland. Earth Surf. Process. Landforms 2019, 44, 144–159. [Google Scholar] [CrossRef]
- Al-Shayea, N. The combined effect of clay and moisture content on the behavior of remolded unsaturated soils. Eng. Geol. 2001, 62, 319–342. [Google Scholar] [CrossRef]
- Komu, M.P.; Nefeslioglu, H.A.; Gokceoglu, C. Modeling shallow landslide runout distance in Eocene Flysch Facies using empirical-statistical models (Western Black Sea Region of Türkiye). ISPRS Int. J. Geo-Inf. 2024, 13, 84. [Google Scholar] [CrossRef]


| Property | Value |
|---|---|
| Rock | |
| Uniaxial compressive strength | 52.1 MPa |
| Modulus of elasticity | 38.5 GPa |
| Modulus of rigidity | 16.2 GPa |
| Poisson’s ratio | 0.19 |
| Soil | |
| Coefficient of uniformity | 28.57 |
| Coefficient of curvature | 0.45 |
| Liquid limit | 32 |
| Plastic limit | 26 |
| Plasticity index | 6 |
| Hydraulic conductivity | m/s |
| Parameter | Value |
|---|---|
| Solid | |
| Density | 2650 |
| Internal friction angle | 30° |
| Basal friction angle | 25° (stage 1) |
| 6° (stage 2) | |
| Drag coefficient | 0.02 |
| Fine solid | |
| Density | 2000 |
| Internal friction angle | 15° (stage 1) |
| Basal friction angle | 5° (stage 1) |
| 3° (stage 2) | |
| Kinematic viscosity | 100 |
| Fluid | |
| Density | 1000 |
| Kinematic viscosity | 0.001 |
| Fluid friction coefficient | 0.01 |
Disclaimer/Publisher’s Note: The statements, opinions and data contained in all publications are solely those of the individual author(s) and contributor(s) and not of MDPI and/or the editor(s). MDPI and/or the editor(s) disclaim responsibility for any injury to people or property resulting from any ideas, methods, instructions or products referred to in the content. |
© 2024 by the authors. Licensee MDPI, Basel, Switzerland. This article is an open access article distributed under the terms and conditions of the Creative Commons Attribution (CC BY) license (https://creativecommons.org/licenses/by/4.0/).
Share and Cite
KC, D.; Naqvi, M.W.; Dangi, H.; Hu, L. Rainfall-Triggered Landslides and Numerical Modeling of Subsequent Debris Flows at Kalli Village of Suntar Formation in the Lesser Himalayas in Nepal. Water 2024, 16, 1594. https://doi.org/10.3390/w16111594
KC D, Naqvi MW, Dangi H, Hu L. Rainfall-Triggered Landslides and Numerical Modeling of Subsequent Debris Flows at Kalli Village of Suntar Formation in the Lesser Himalayas in Nepal. Water. 2024; 16(11):1594. https://doi.org/10.3390/w16111594
Chicago/Turabian StyleKC, Diwakar, Mohammad Wasif Naqvi, Harish Dangi, and Liangbo Hu. 2024. "Rainfall-Triggered Landslides and Numerical Modeling of Subsequent Debris Flows at Kalli Village of Suntar Formation in the Lesser Himalayas in Nepal" Water 16, no. 11: 1594. https://doi.org/10.3390/w16111594
APA StyleKC, D., Naqvi, M. W., Dangi, H., & Hu, L. (2024). Rainfall-Triggered Landslides and Numerical Modeling of Subsequent Debris Flows at Kalli Village of Suntar Formation in the Lesser Himalayas in Nepal. Water, 16(11), 1594. https://doi.org/10.3390/w16111594