
Enhanced Biological Nitrate Removal from Groundwater in Humid Tropical Regions Using Corn Cob-Based Permeable Reactive Barriers: A Case Study from Panama

 ,
,  and
and 
Abstract
1. Introduction
State of the Art
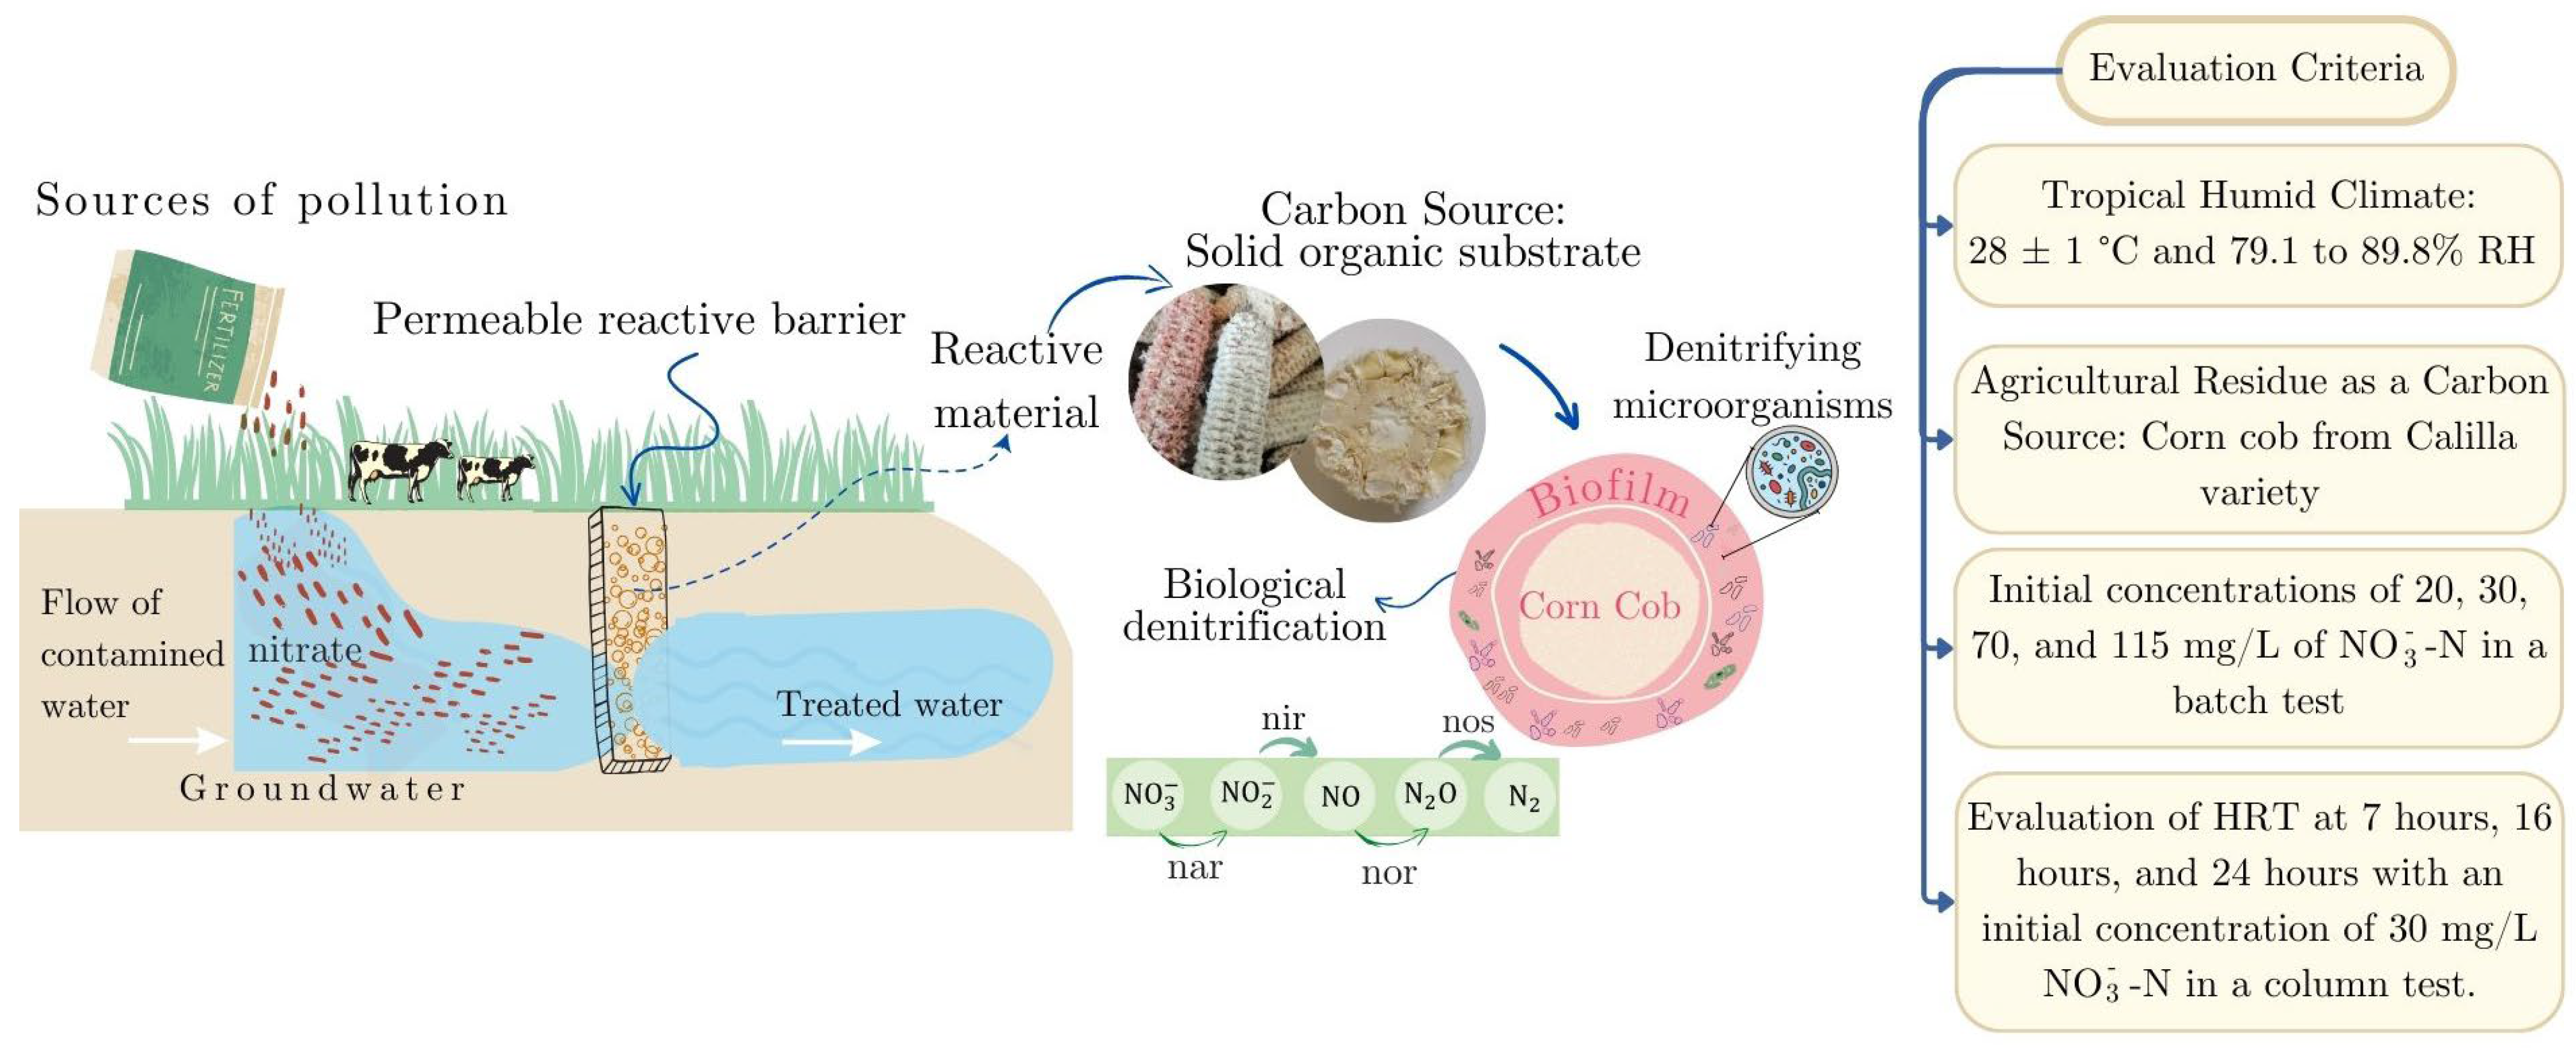
2. Materials and Methods
2.1. Harvesting the Corn Cob
2.2. Physical and Chemical Characterization of Corn Cobs
2.3. Determination of Nitrate Removal Capacity
2.3.1. Leaching Test
2.3.2. Batch Test
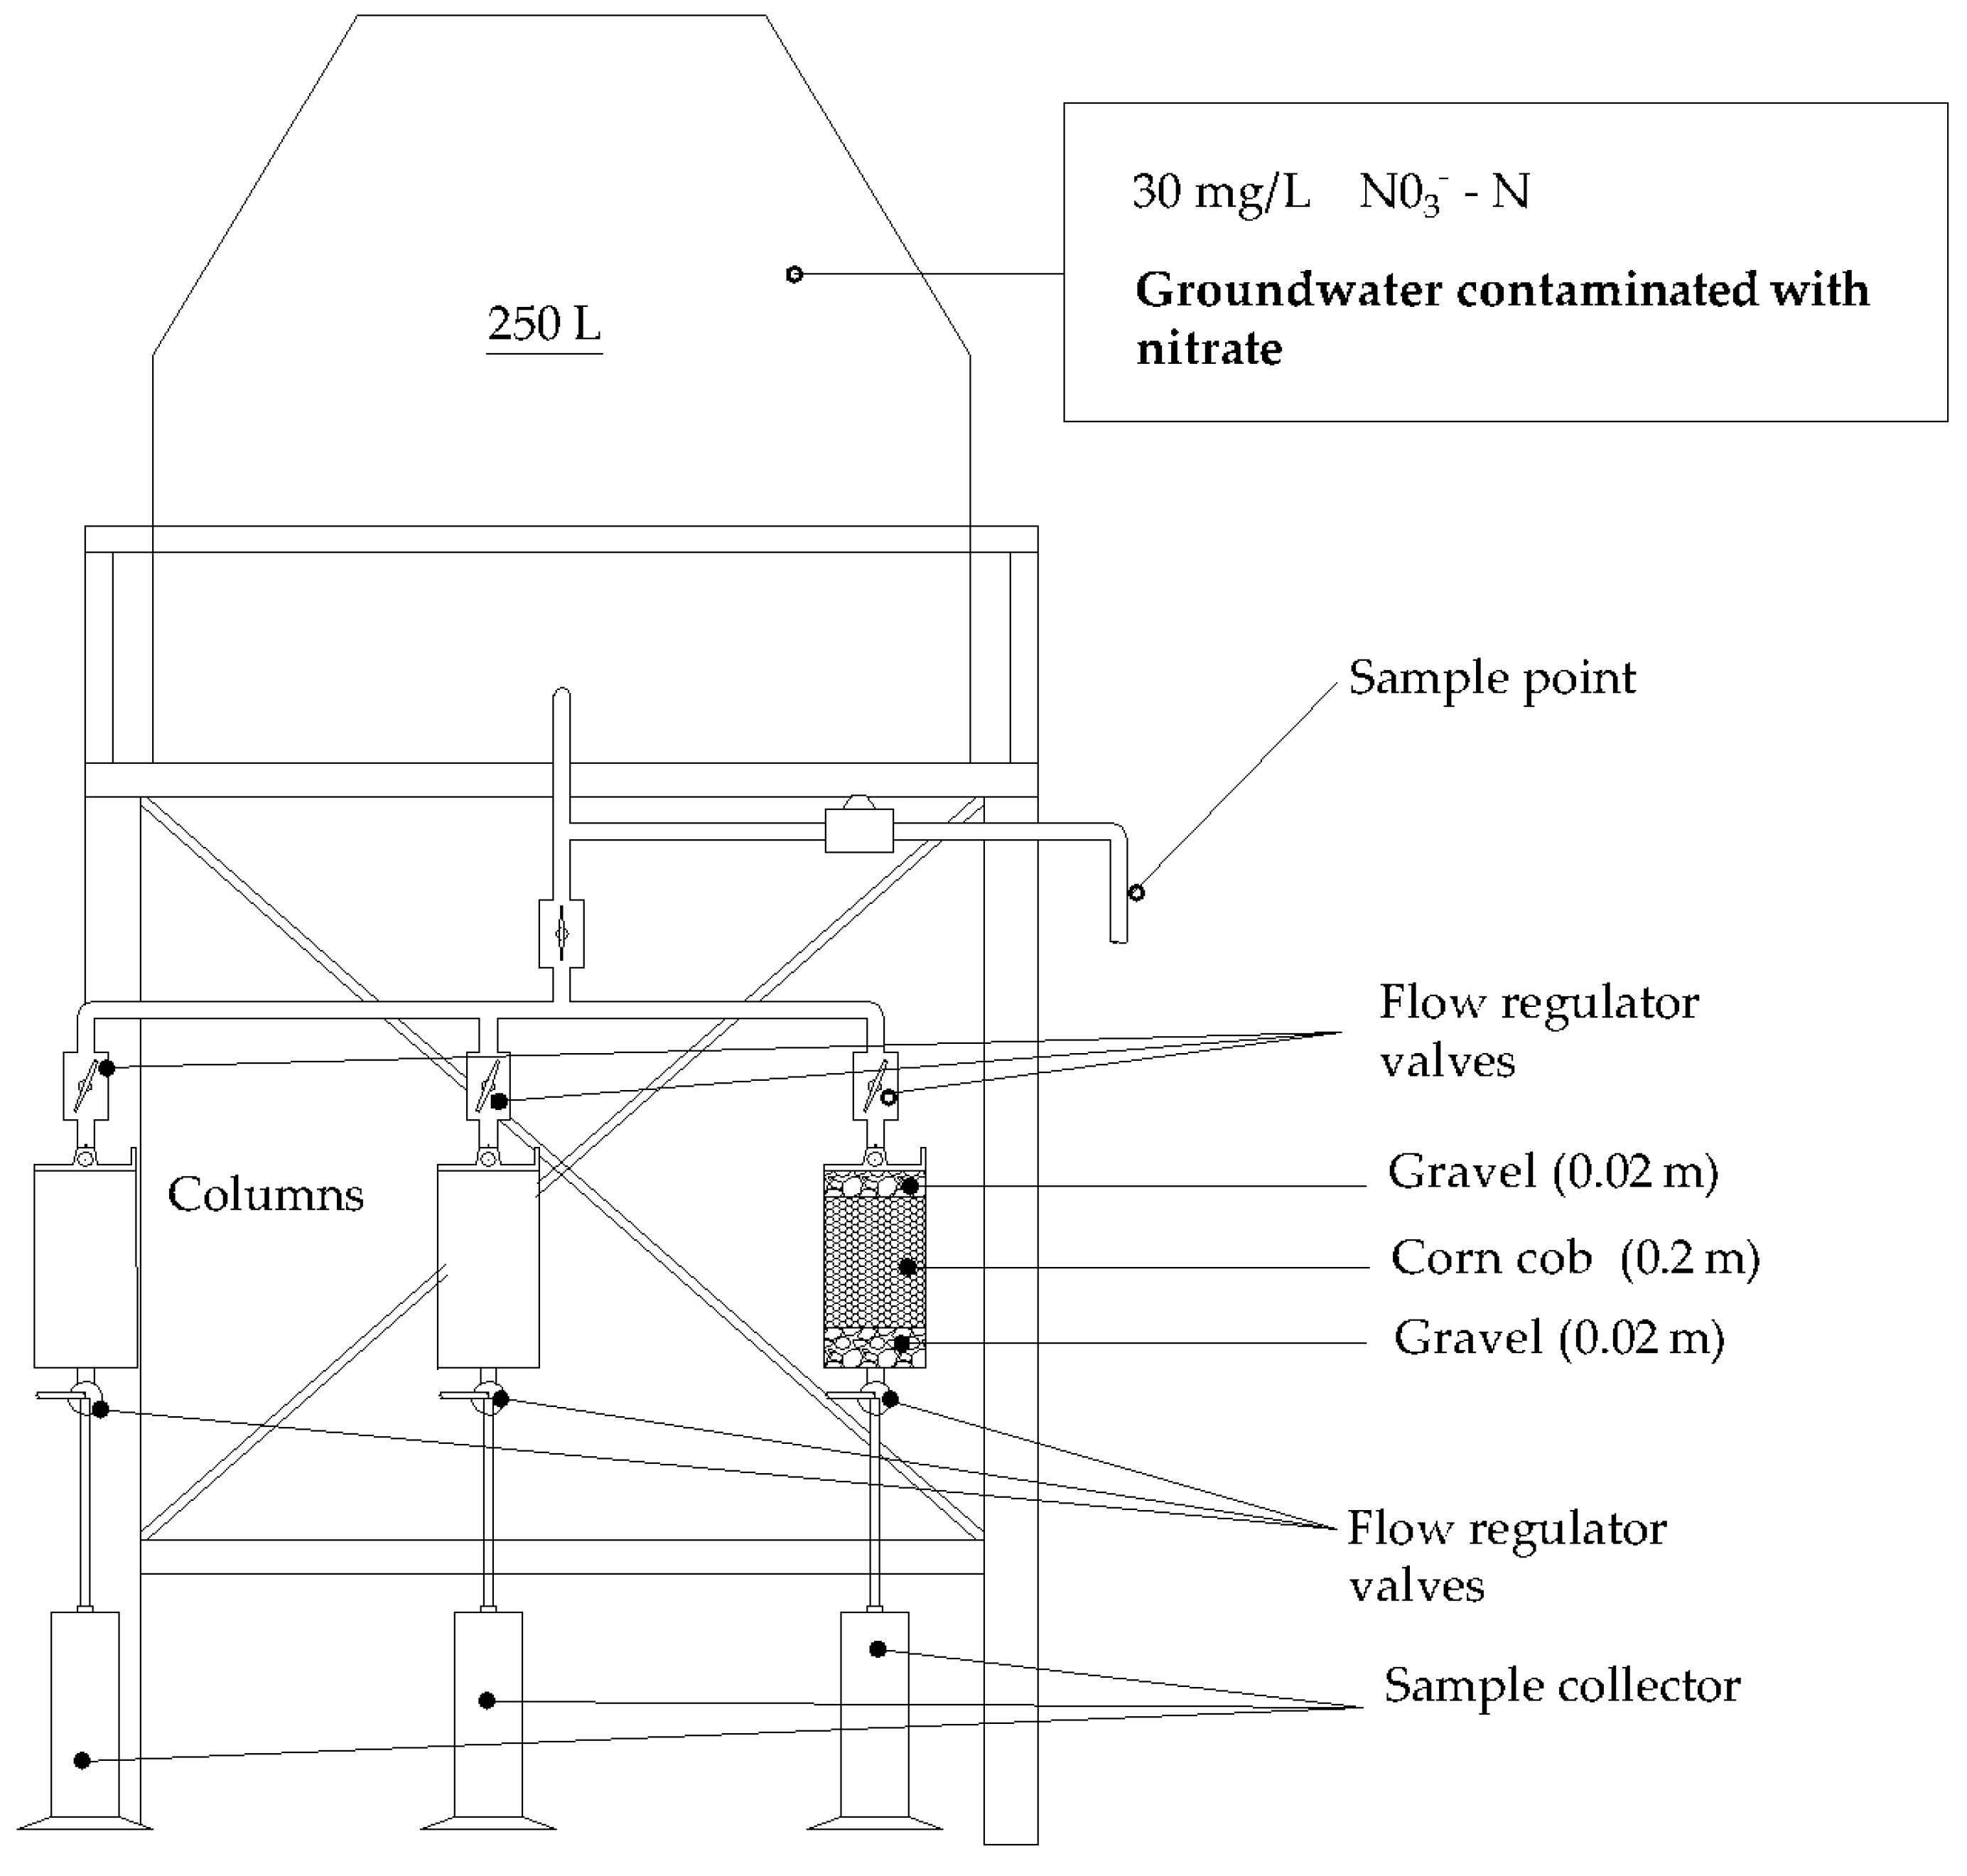
2.3.3. Column Test
2.4. Analytical Techniques
Kinetic Model and Denitrification Rate
3. Results and Discussion
3.1. Physical and Chemical Characterization of Corn Cob
3.2. Determination of Contaminant Removal Capacity Using Corn Cob
3.2.1. Leaching Assay
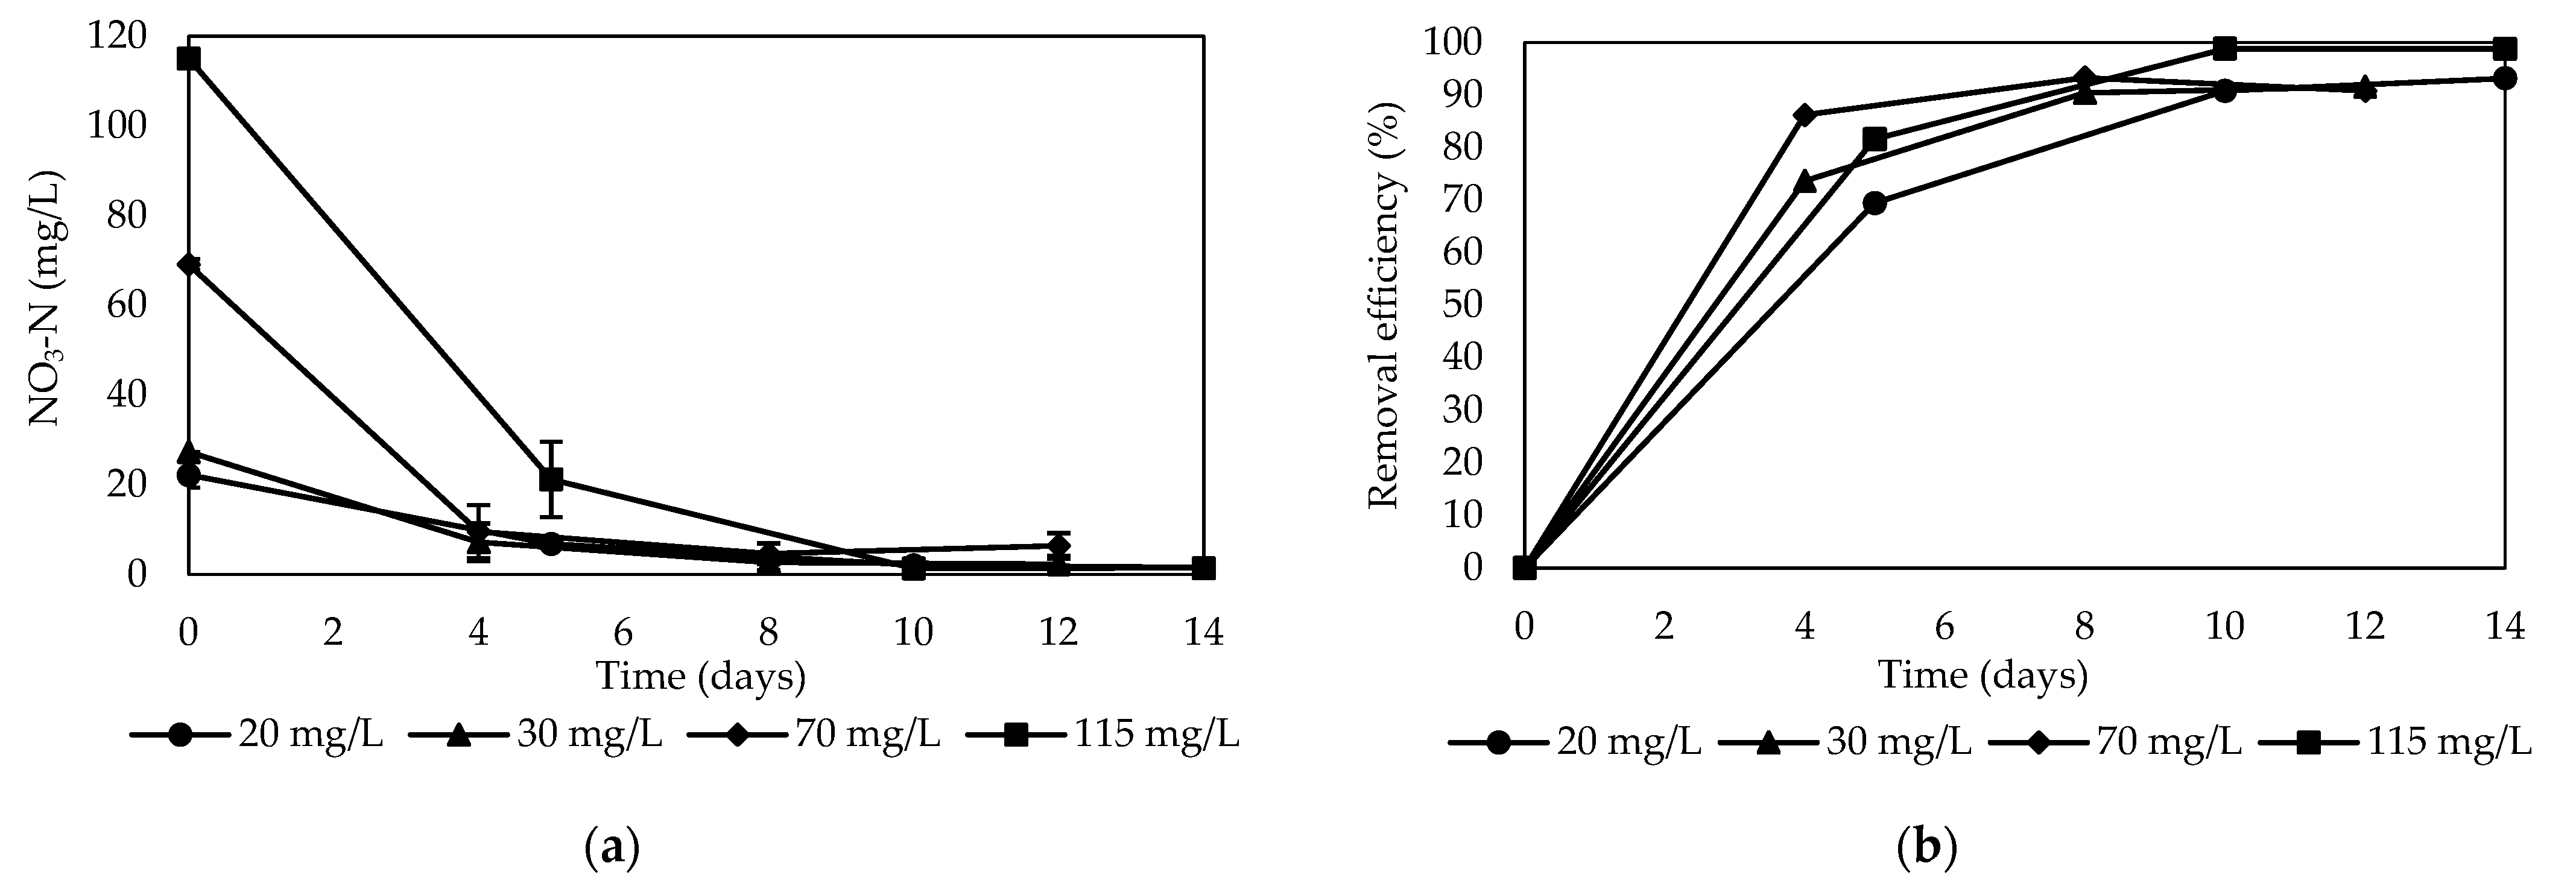
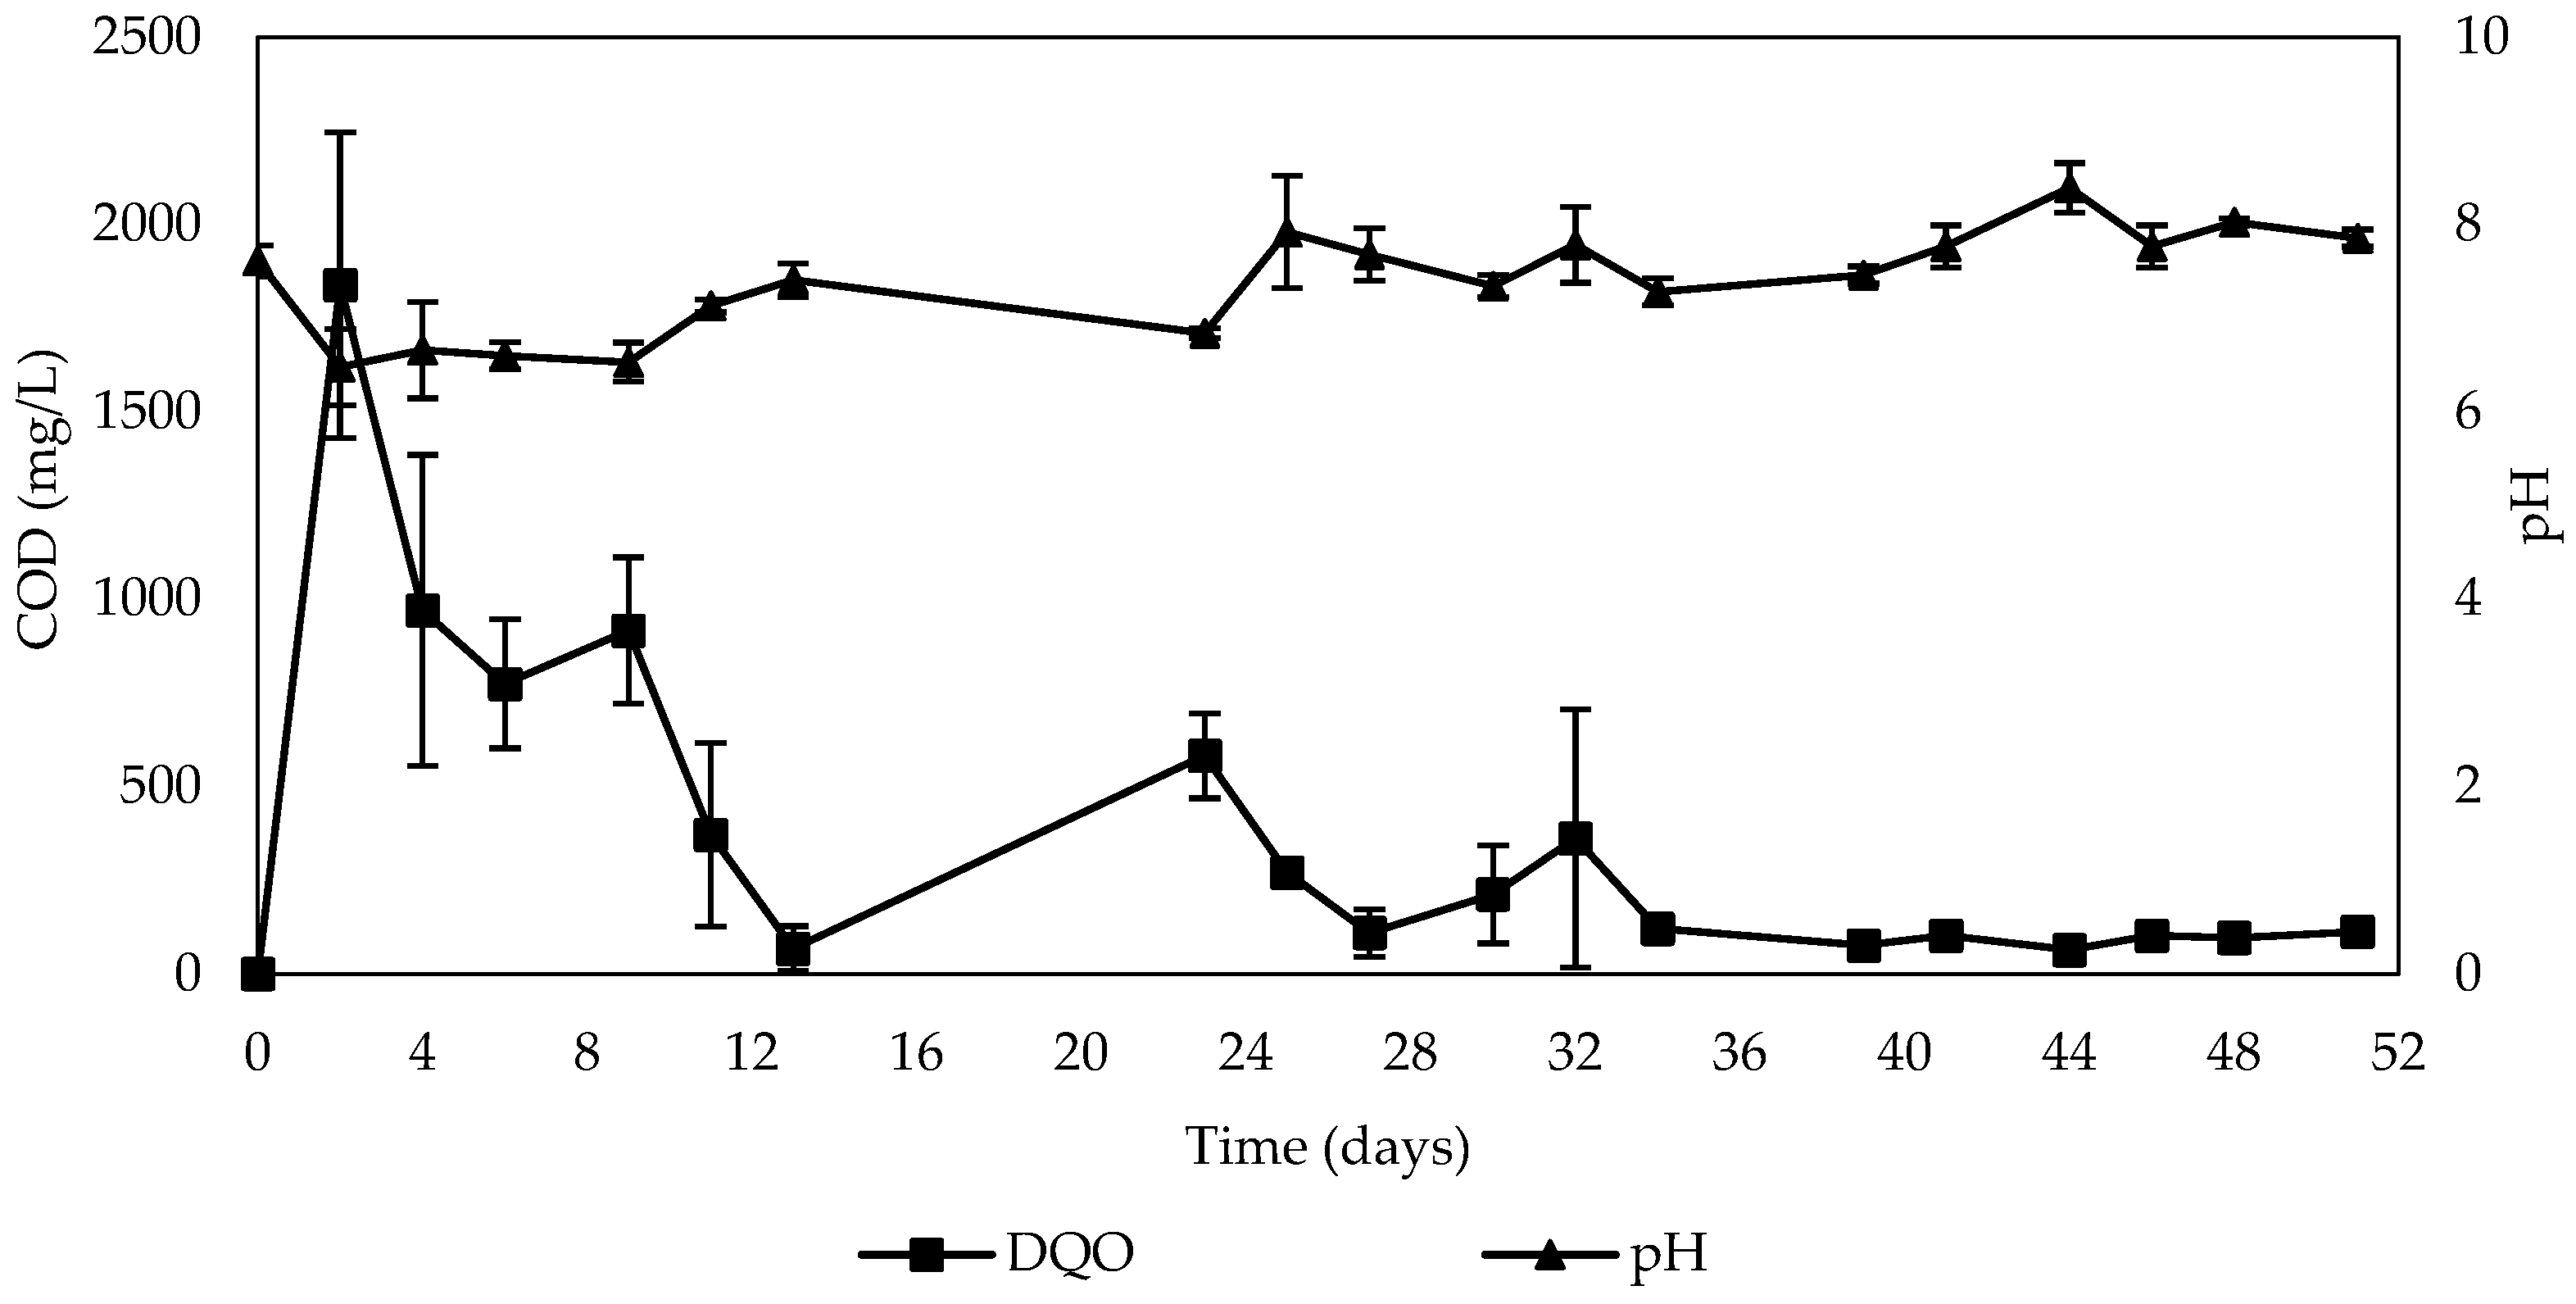
3.2.2. Batch Test
- Denitrification performance
- Formation of nitrite and ammonium
- Features of carbon release
- Environmental conditions during nitrate removal
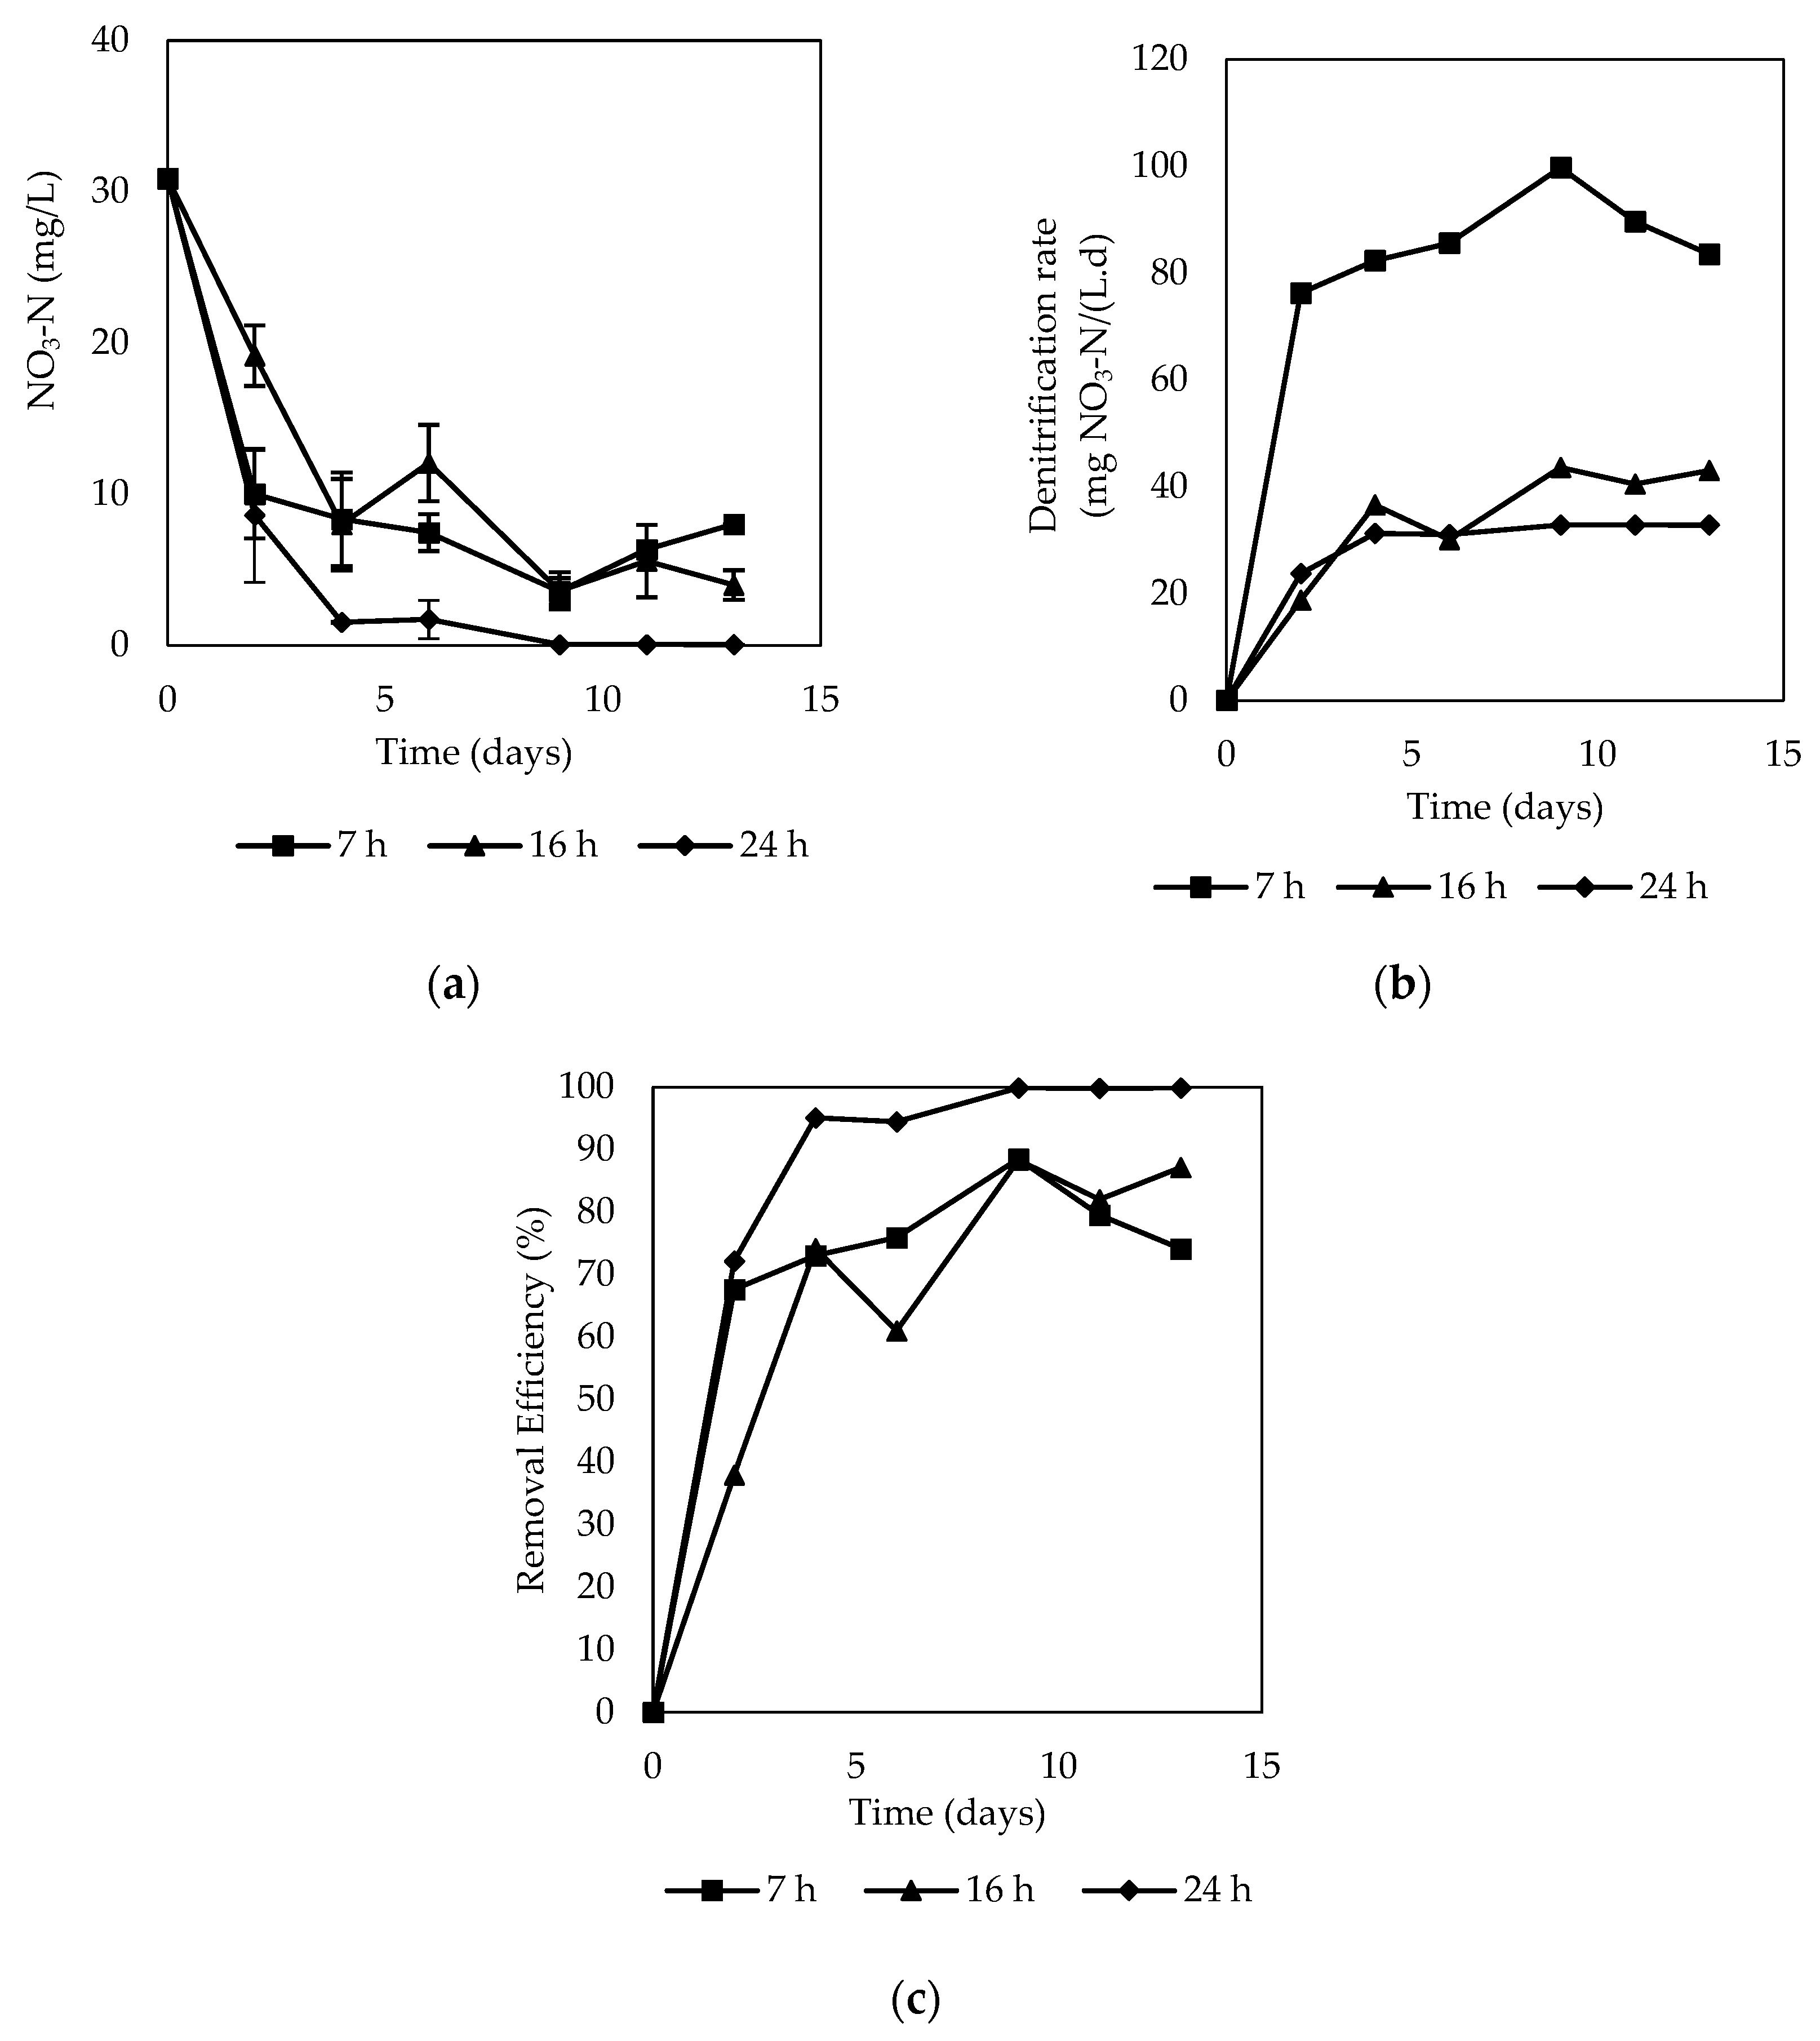
3.2.3. Column Test
- Denitrification performance
- Formation of nitrite and ammonium during denitrification
- Characteristics of carbon release
3.3. Surface Characteristics of the Carbon Source
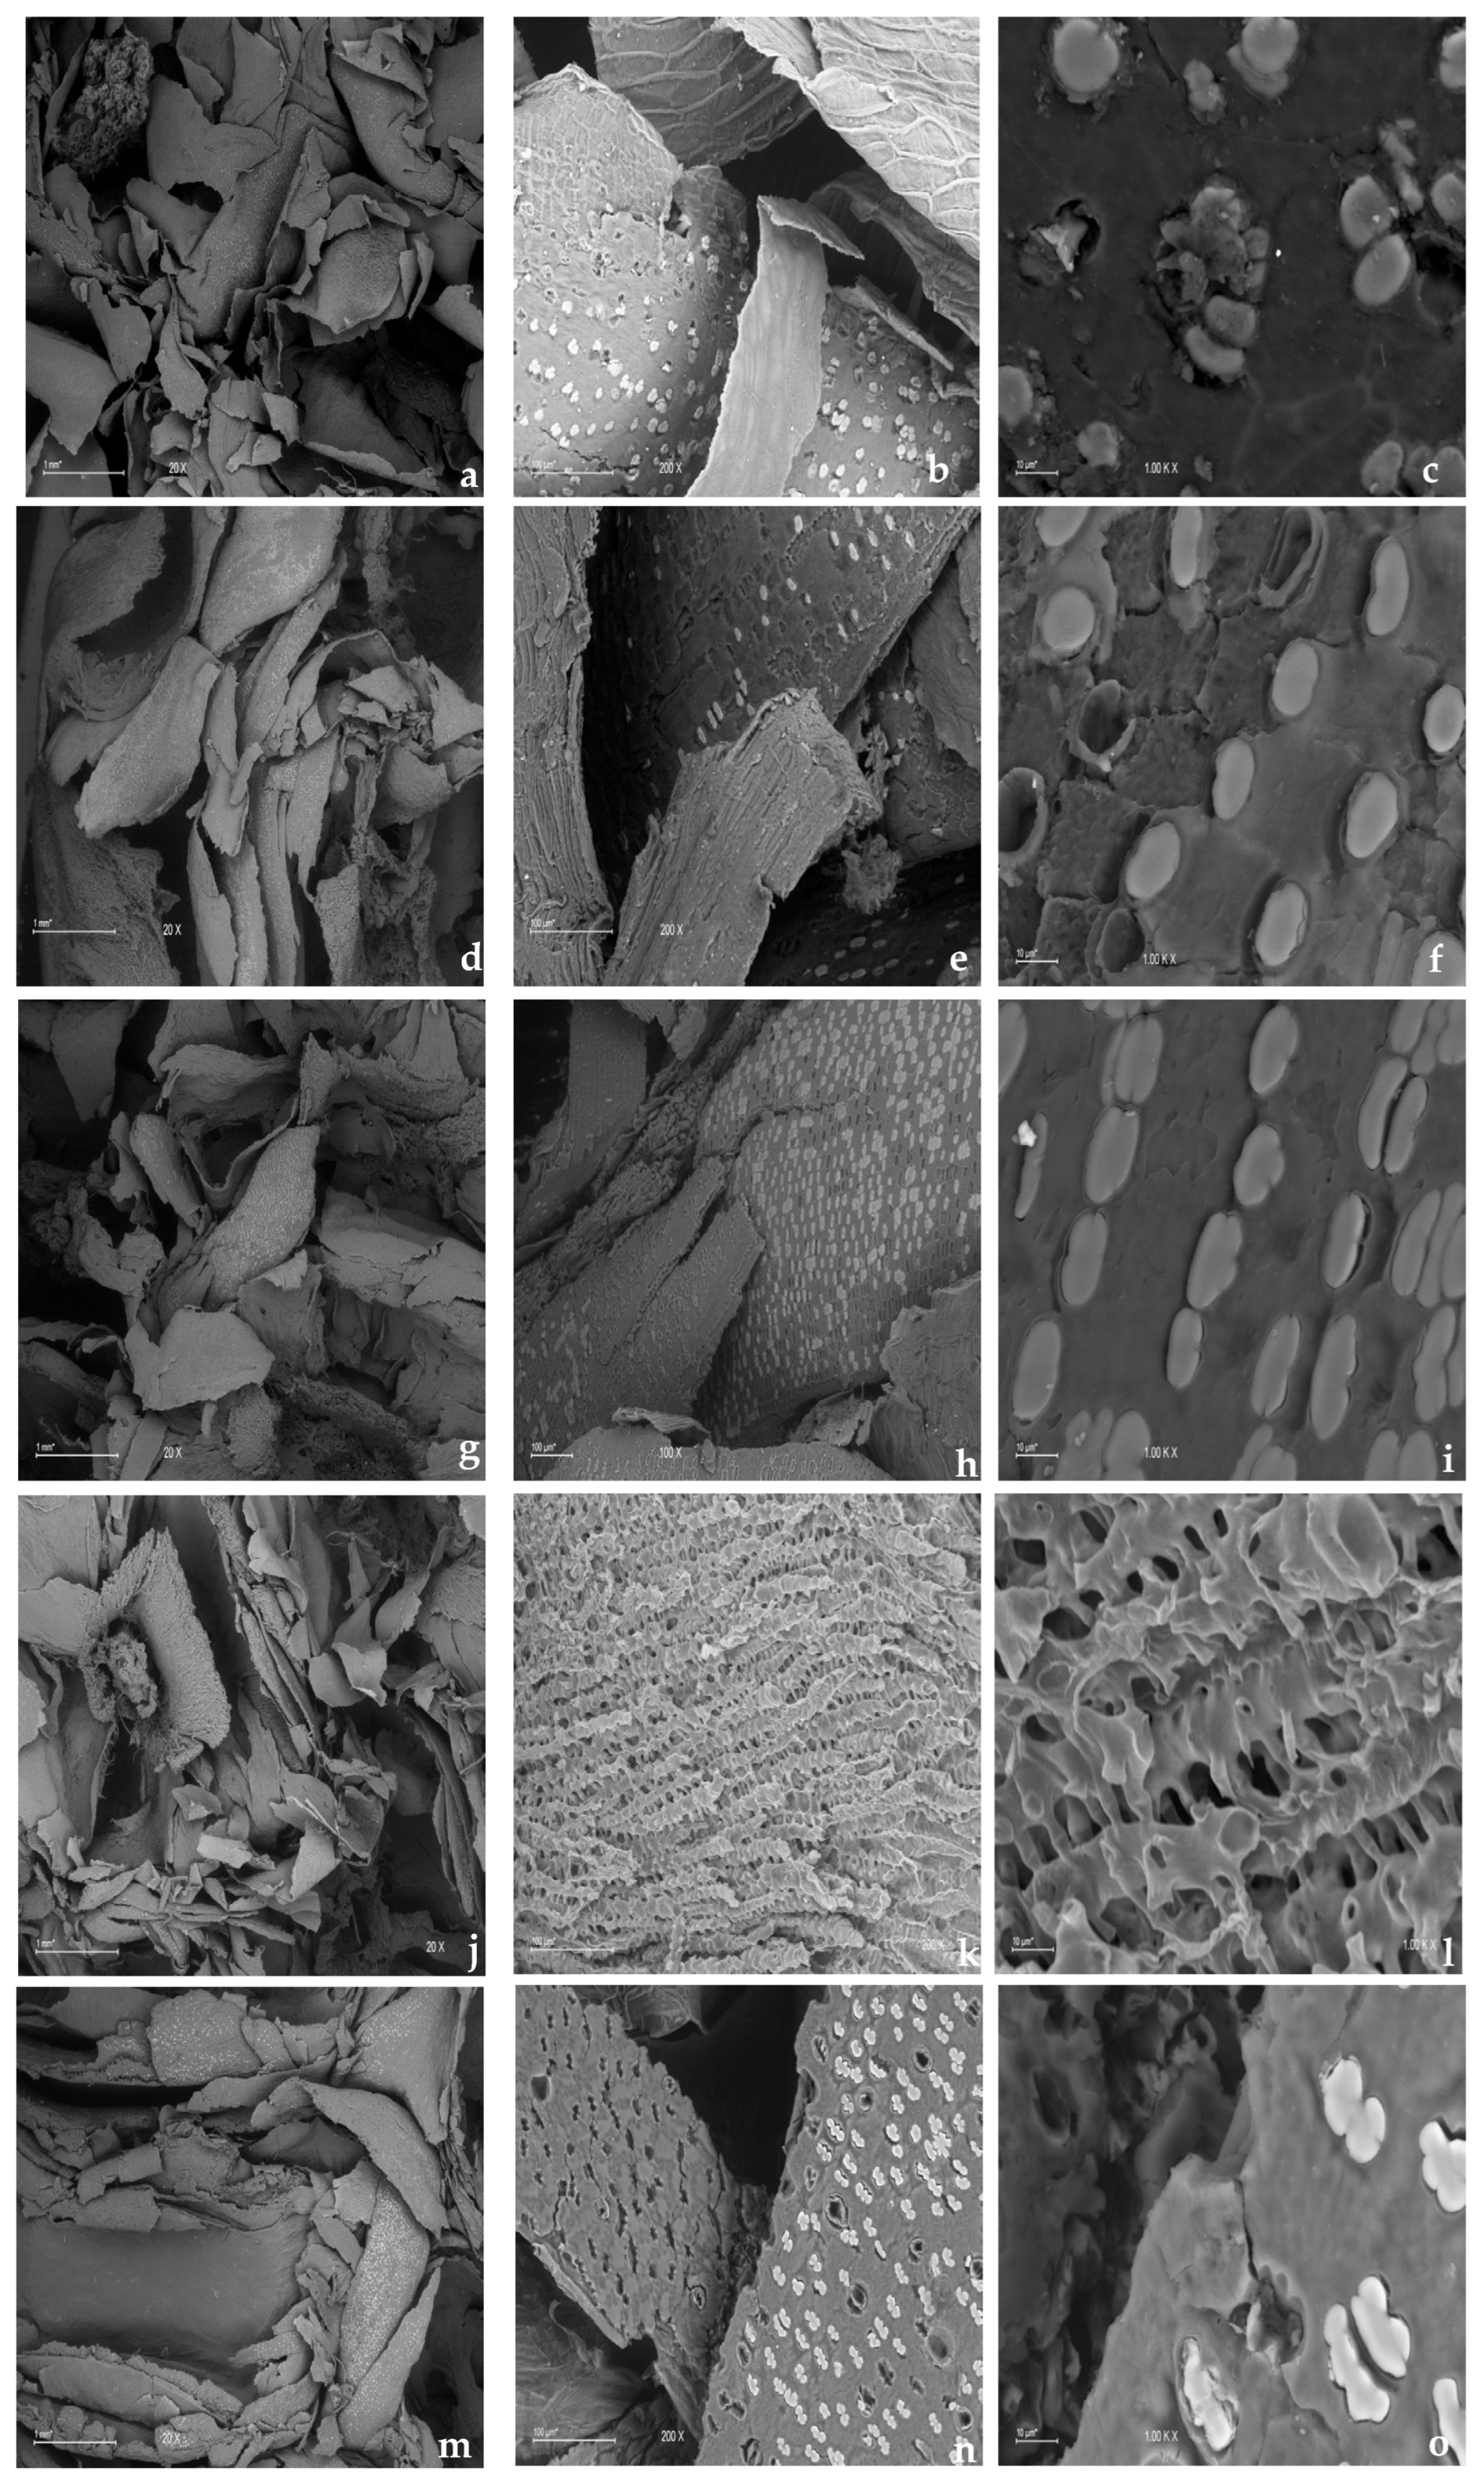
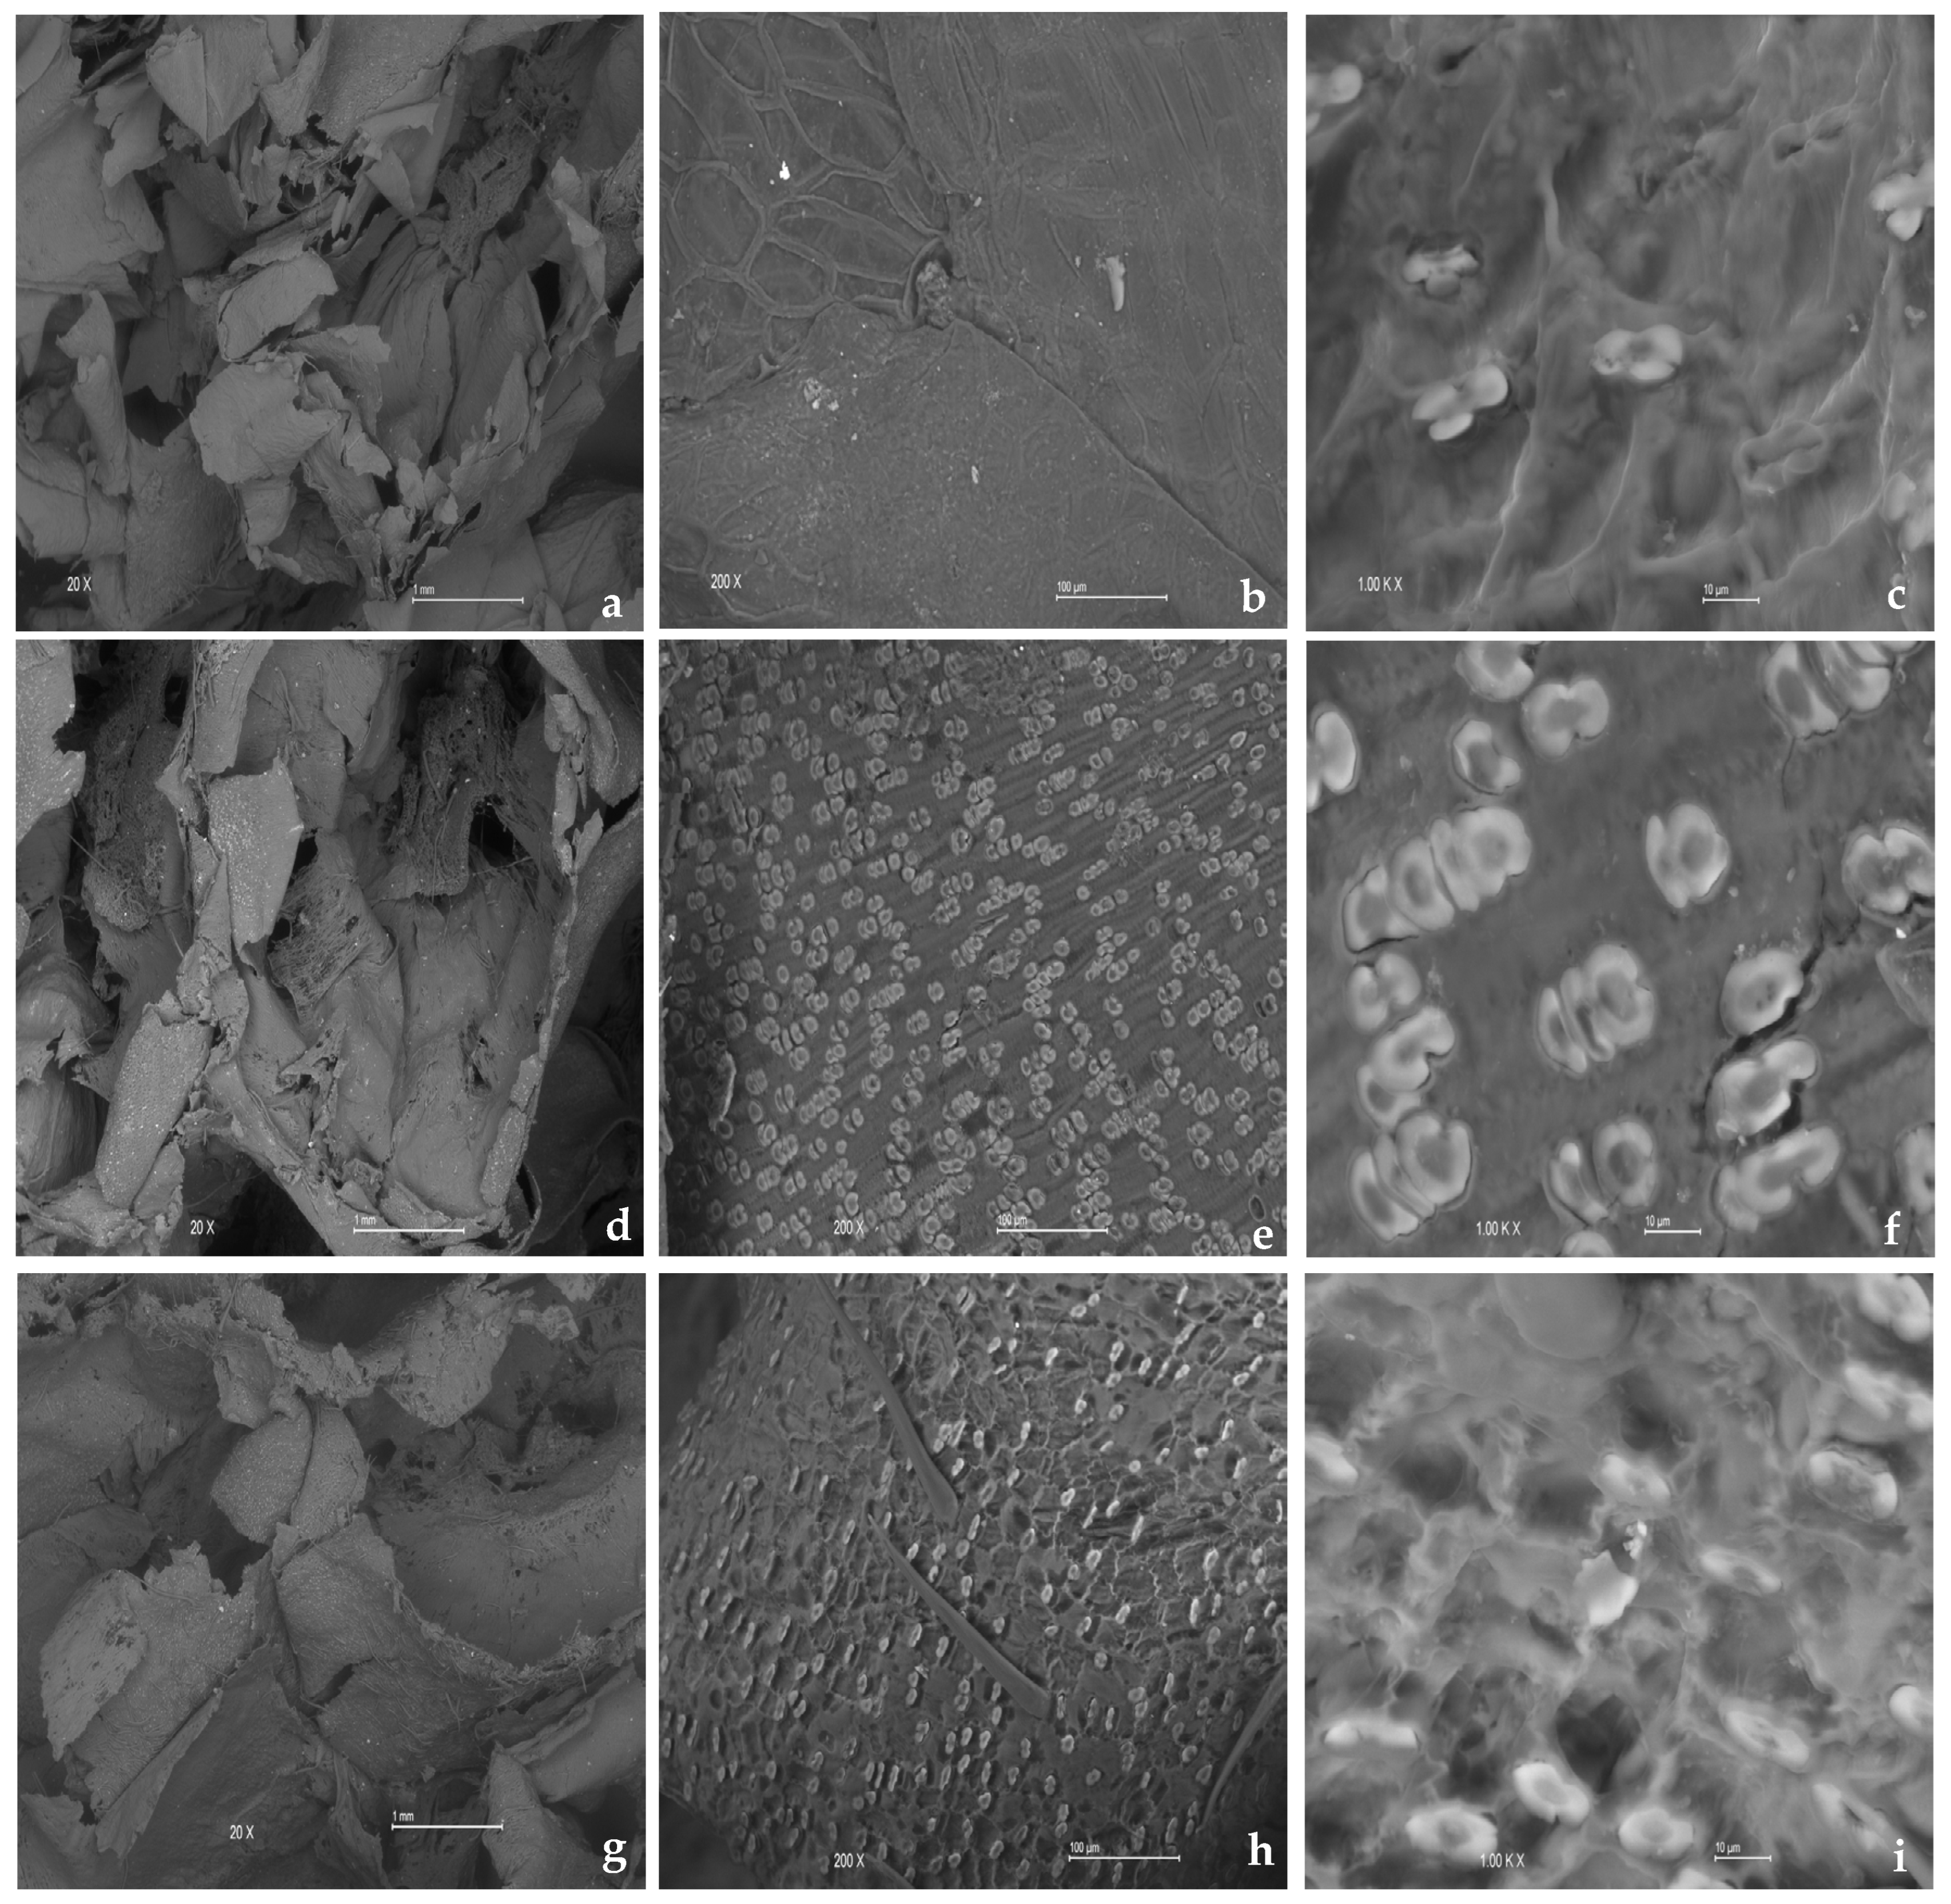
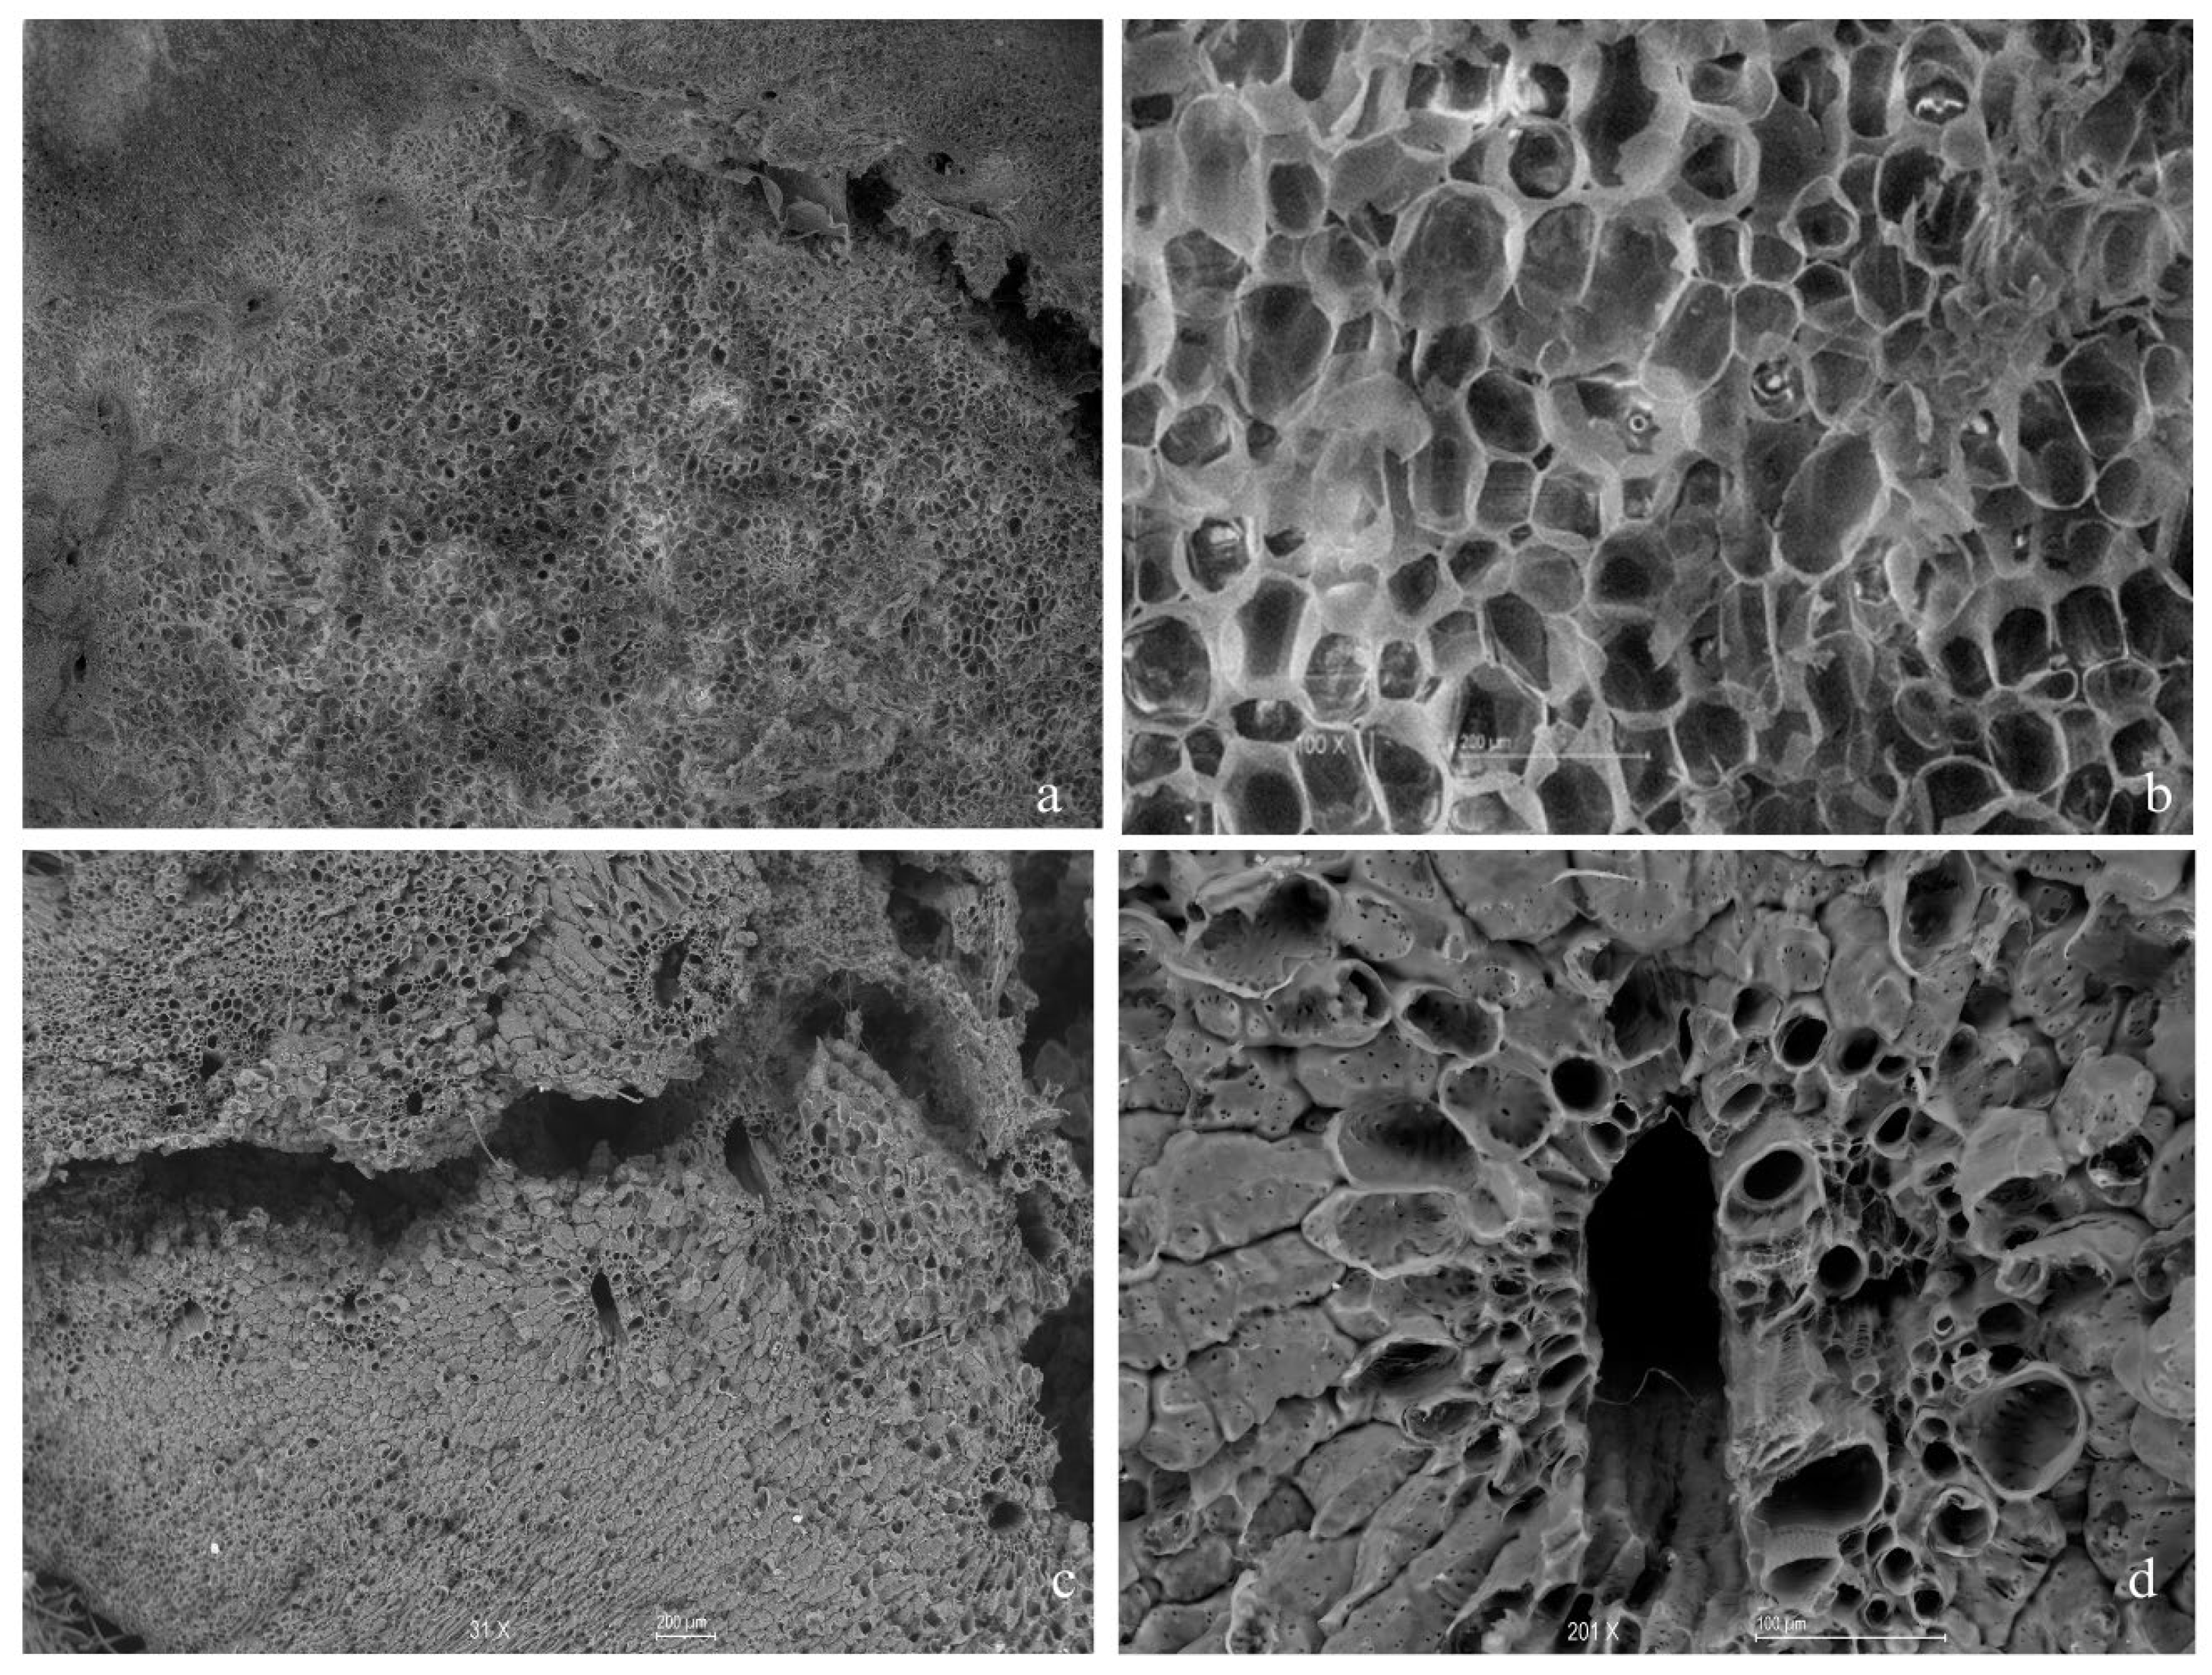
3.3.1. Scanning Electron Microscopy
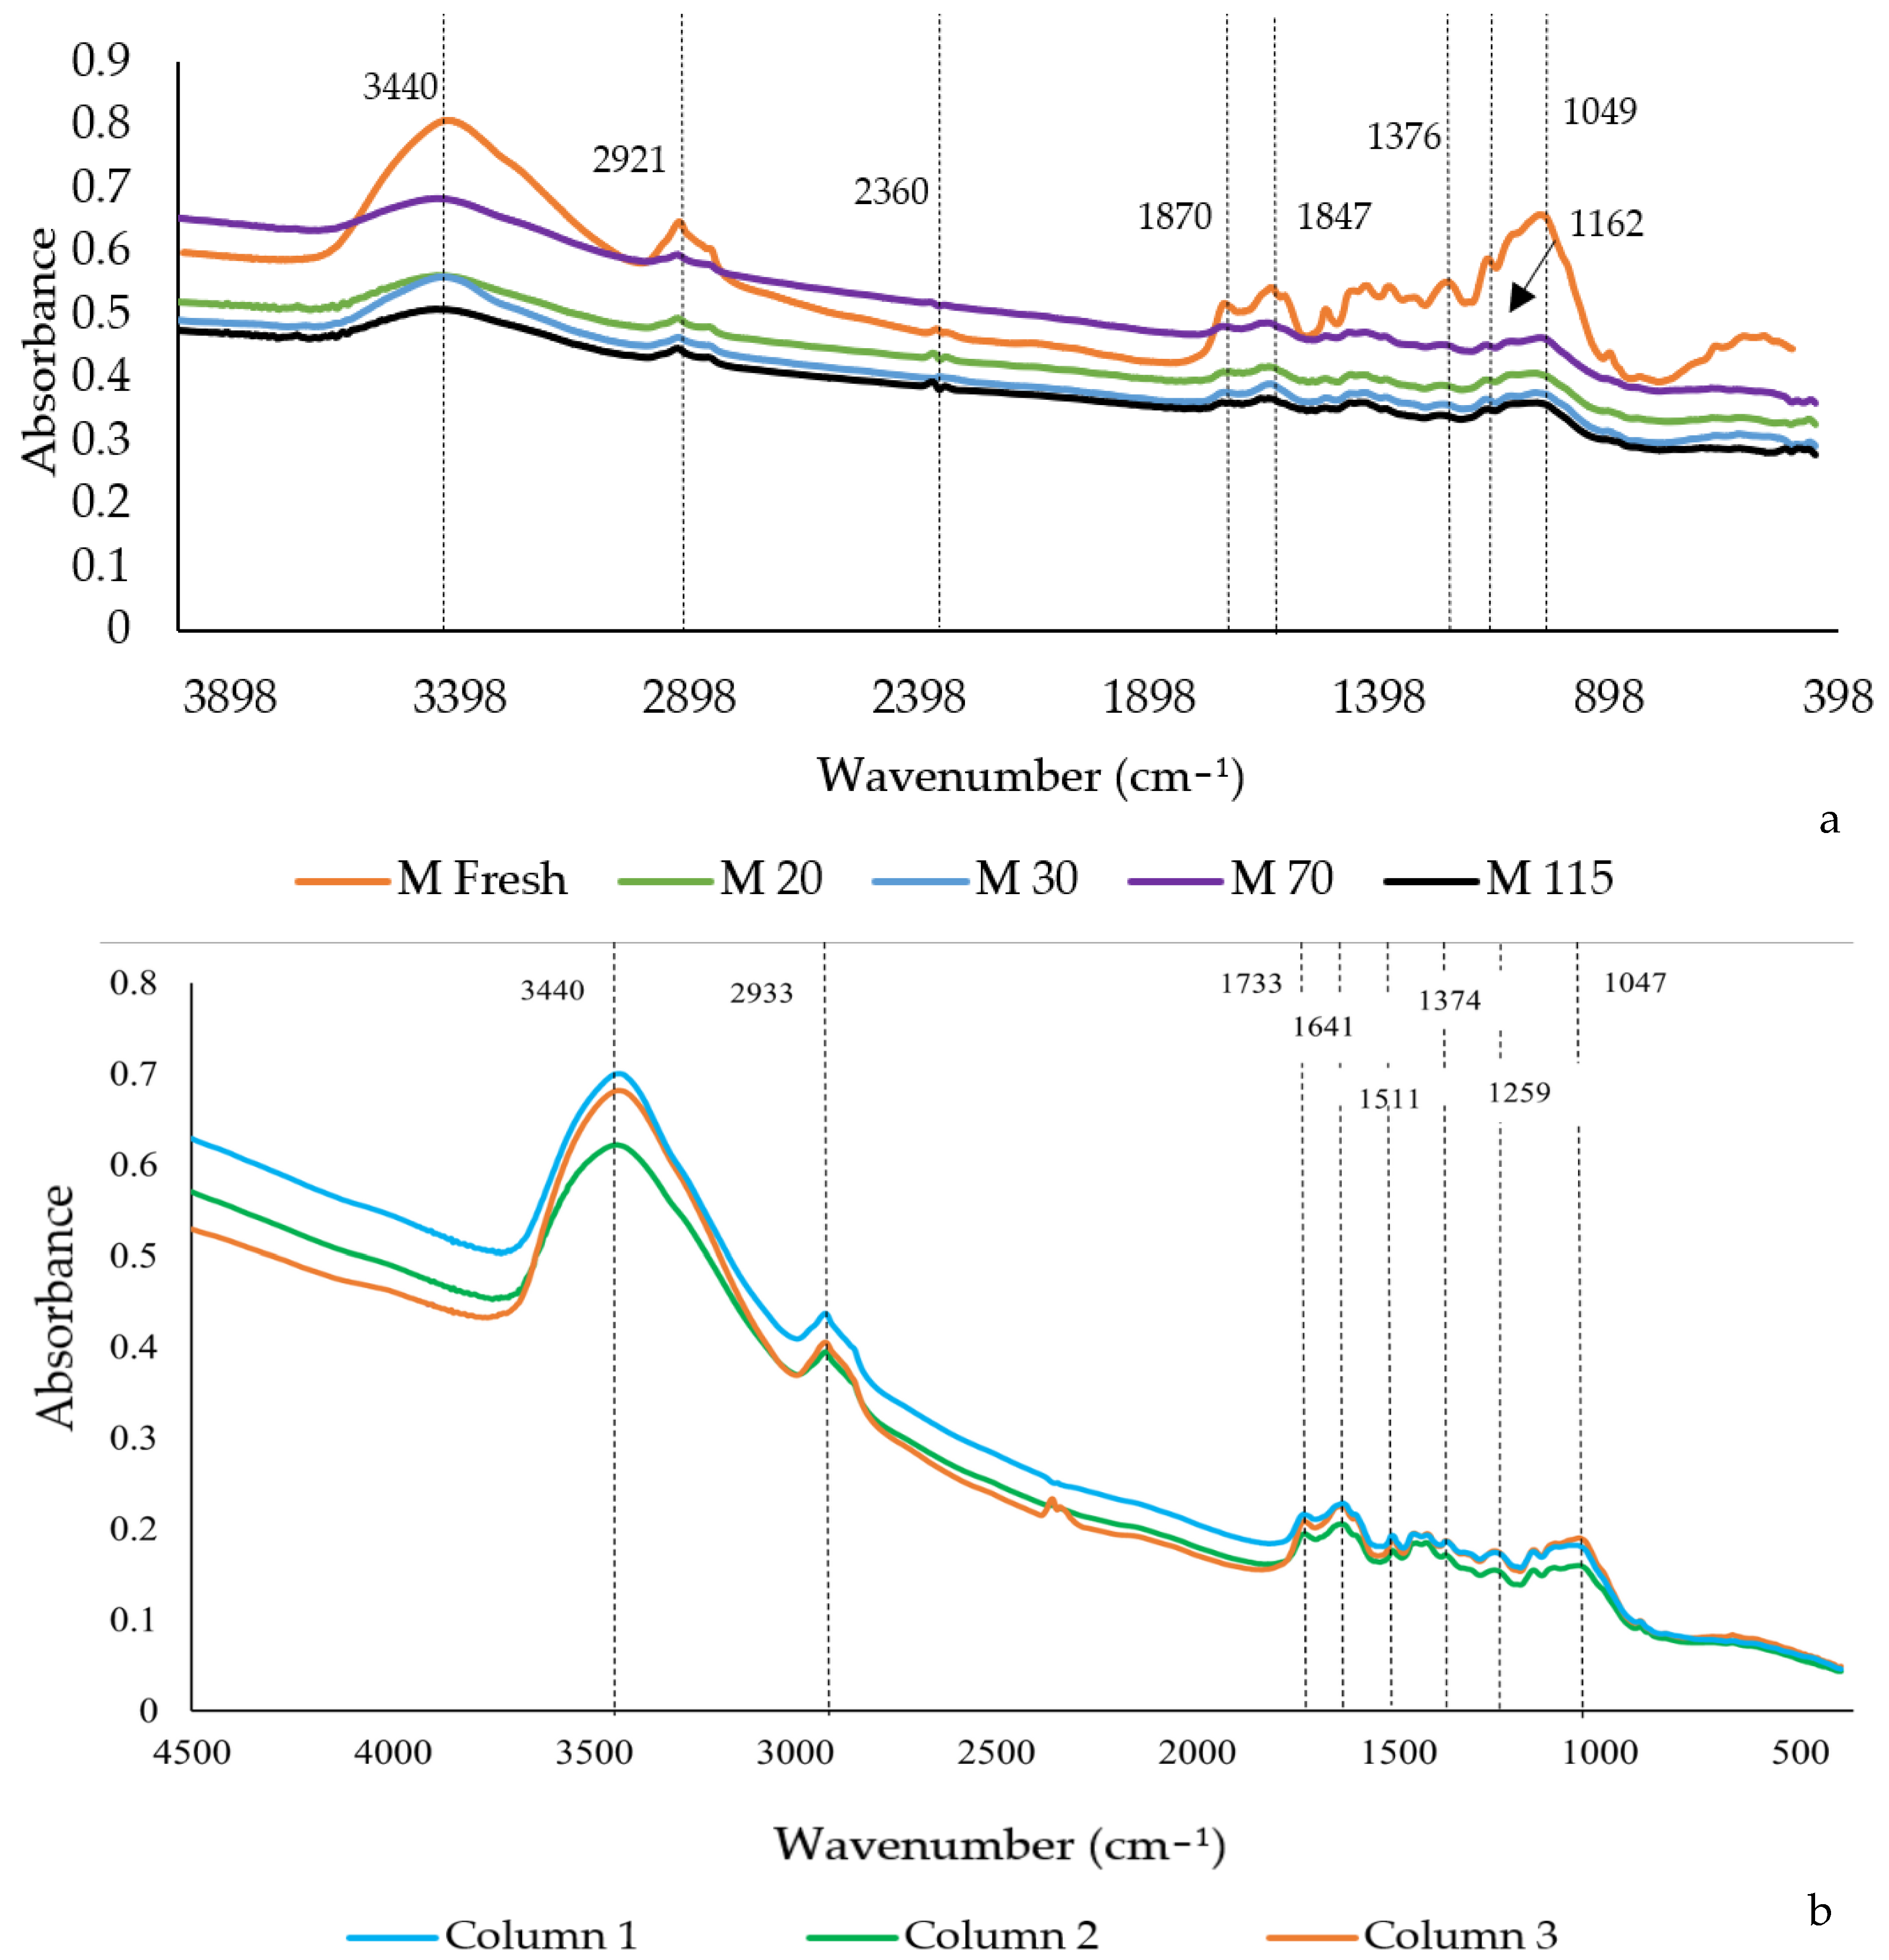
3.3.2. Spectroscopy and Fourier Transform Infrared (FTIR)
4. Conclusions
Author Contributions
Funding
Data Availability Statement
Acknowledgments
Conflicts of Interest
References
- Huno, S.K.M.; Rene, E.R.; Van Hullebusch, E.D.; Annachhatre, A.P. Nitrate Removal from Groundwater: A Review of Natural and Engineered Processes. J. Water Supply Res. Technol. AQUA 2018, 67, 885–902. [Google Scholar] [CrossRef]
- Xin, J.; Wang, Y.; Shen, Z.; Liu, Y.; Wang, H.; Zheng, X. Critical Review of Measures and Decision Support Tools for Groundwater Management: A Surface-to-Groundwater Profile Perspective. J. Hydrol. 2021, 598, 126386. [Google Scholar] [CrossRef]
- Abascal, E.; Gómez-Coma, L.; Ortiz, I.; Ortiz, A. Global Diagnosis of Nitrate Pollution in Groundwater and Review of Removal Technologies. Sci. Total. Environ. 2021, 810, 152233. [Google Scholar] [CrossRef] [PubMed]
- Gibert, O.; Pomierny, S.; Rowe, I.; Kalin, R.M. Selection of Organic Substrates as Potential Reactive Materials for Use in a Denitrification Permeable Reactive Barrier (PRB). Bioresour. Technol. 2008, 99, 7587–7596. [Google Scholar] [CrossRef] [PubMed]
- FAO. Inorganic Fertilizers 1990–2020; FAOSTAT Analytical Briefs; FAO: Rome, Italy, 2022; pp. 1–13. [Google Scholar] [CrossRef]
- Gutiérrez, M.; Biagioni, R.N.; Alarcón-Herrera, M.T.; Rivas-Lucero, B.A. An Overview of Nitrate Sources and Operating Processes in Arid and Semiarid Aquifer Systems. Sci. Total Environ. 2018, 624, 1513–1522. [Google Scholar] [CrossRef] [PubMed]
- FAO. PNUMA Evaluación Mundial de La Contaminación Del Suelo—Resumen Para Los Formuladores de Políticas; FAO: Roma, Italy, 2022. [Google Scholar]
- Guan, Q.; Li, F.; Chen, X.; Tian, C.; Liu, C.; Liu, D. Assessment of the Use of a Zero-Valent Iron Permeable Reactive Barrier for Nitrate Removal from Groundwater in the Alluvial Plain of the Dagu River, China. Environ. Earth Sci. 2019, 78, 244. [Google Scholar] [CrossRef]
- World Health organization. Guidelines for Drinking-Water Quality; World Health Organization: Geneva, Switzerland, 2004; Volume 1.
- Misstear, B.; Banks, D.; Clark, L. Appendix 5 FAO Irrigation Water Quality Guidelines. In Vater Wells and Boreholes; Wiley: Hoboken, NJ, USA, 2017; pp. 473–474. [Google Scholar]
- Obiri-Nyarko, F.; Grajales-Mesa, S.J.; Malina, G. An Overview of Permeable Reactive Barriers for in Situ Sustainable Groundwater Remediation. Chemosphere 2014, 111, 243–259. [Google Scholar] [CrossRef] [PubMed]
- Wang, W.; Jia, J.; Zhang, B.; Xiao, B.; Yang, H.; Zhang, S.; Gao, X.; Han, Y.; Zhang, S.; Liu, Z.; et al. A Review of Sustained Release Materials for Remediation of Organically Contaminated Groundwater: Material Preparation, Applications and Prospects for Practical Application. J. Hazard. Mater. Adv. 2024, 13, 100393. [Google Scholar] [CrossRef]
- Zhang, W.; Shan, N.; Bai, Y.; Yin, L. The Innovative Application of Agriculture Straw in in Situ Field Permeable Reactive Barrier for Remediating Nitrate-Contaminated Groundwater in Grain-Production Areas. Biochem. Eng. J. 2020, 164, 107755. [Google Scholar] [CrossRef]
- Fan, Y.; Zhuang, J.; Essington, M.; Jagadamma, S.; Schwartz, J.; Lee, J. Global Significance of Substrates for Nitrate Removal in Denitrifying Bioreactors Revealed by Meta-Analysis. Engineering 2023, 21, 214–226. [Google Scholar] [CrossRef]
- Sánchez Hidalgo, G.C.; Deago, E.; De Los Ángeles Ortega Del Rosario, M. Permeable Reactive Barriers for in Situ Remediation of Nitrate-Contaminated Groundwater: A Review. In Proceedings of the 2022 8th International Engineering, Sciences and Technology Conference (IESTEC), Panama City, Panama, 19–21 October 2022; pp. 469–476. [Google Scholar]
- Guo, C.; Qi, L.; Bai, Y.; Yin, L.; Li, L.; Zhang, W. Geochemical Stability of Zero-Valent Iron Modified Raw Wheat Straw Innovatively Applicated to in Situ Permeable Reactive Barrier: N2 Selectivity and Long-Term Denitrification. Ecotoxicol. Environ. Saf. 2021, 224, 112649. [Google Scholar] [CrossRef] [PubMed]
- Gibert, O.; Assal, A.; Devlin, H.; Elliot, T.; Kalin, R.M. Performance of a Field-Scale Biological Permeable Reactive Barrier for in-Situ Remediation of Nitrate-Contaminated Groundwater. Sci. Total Environ. 2019, 659, 211–220. [Google Scholar] [CrossRef] [PubMed]
- Özkaraova, E.B.; Aydin, S.; Gemechu, A.U. Screening of Organic Substrates for a Permeable Biobarrier to Remediate Nitrate Contaminated Groundwater. Water Environ. J. 2022, 36, 43–55. [Google Scholar] [CrossRef]
- Deago, E.M.; Pizarro, G.E. Denitrification of Drinking Water Using Saccharum spontaneum L. as a Natural Organic Solid Substrate. J. Water Supply Res. Technol. AQUA 2013, 62, 477–486. [Google Scholar] [CrossRef]
- Liu, Y.; Liu, Y.; Ma, L.; Gong, Y.; Qian, J. Corncob PRB for On-Site Nitrate Removal in Groundwater. Arab. J. Geosci. 2020, 13, 1084. [Google Scholar] [CrossRef]
- Xu, Z.; Shao, L.; Yin, H.; Chu, H.; Yao, Y. Biological Denitrification Using Corncobs as a Carbon Source and Biofilm Carrier. Water Environ. Res. 2009, 81, 242–247. [Google Scholar] [CrossRef] [PubMed]
- Li, G.; Chen, J.; Yang, T.; Sun, J.; Yu, S. Denitrification with Corncob as Carbon Source and Biofilm Carriers. Water Sci. Technol. 2012, 65, 1238–1243. [Google Scholar] [CrossRef] [PubMed]
- Yuan, T.X.; Chen, T.; Liang, S.; Yu, L.J.; Wang, H.J.; Inc, D.P. Effect of Corncobs as External Carbon Sources on Nitrogen Removal in Constructed Wetlands Treating Micro-Polluted River Water. In Proceedings of the 2016 International Conference on Environmental Science and Engineering (ESE 2016), Guilin, China, 15–17 April 2016; pp. 167–172. [Google Scholar]
- FAOSTAT Food and Agriculture Organisation Statistics. Available online: https://www.fao.org/faostat/en/#rankings/countries_by_commodity (accessed on 27 June 2023).
- Górdon Mendoza, R. El Maíz En Panamá: Características, Requerimientos y Recomendacions Para Su Producción En Ambientes Con Alta Variabilidad Climática. Instituto de Investigación Agropecuaria de Panamá: Panama City, Panama, 2022. [Google Scholar]
- Larsen, M.C. Water Supply and Water Quality Challenges in Panama. In Advances in Water Purification Techniques: Meeting the Needs of Developed and Developing Countries; Elsevier: Amsterdam, The Netherlands, 2019; pp. 41–66. [Google Scholar] [CrossRef]
- Ruz Vargas, C.; Samaniego, L.; Rangel Medina, M. Estado Actual Del Monitoreo de Agua Subterránea En América Latina e Introducción al Programa GGMN. Agua-LAC 2020, 12, 118–126. [Google Scholar]
- Comité de Alto Nivel de Seguridad Hídrica 2016. Plan Nacional de Seguridad Hídrica 2015–2050: Agua Para Todos. Primera Edición. Panamá, Noviembre 2016. Available online: https://www.senacyt.gob.pa/wp-content/uploads/2018/12/3.-Plan-Nacional-de-Seguridad-Hidrica-2015-2050-Agua-para-Todos.pdf (accessed on 10 June 2022).
- Naciones Unidas Objetivos de Desarollo Sostenible: ODS 6 Agua Limpia y Saneamiento. Available online: https://www.undp.org/es/sustainable-development-goals#agua-limpia-saneamiento (accessed on 9 May 2022).
- Xie, Y.; Zhang, D.; Lou, S.; He, F.; Yin, L. Slowly Released Carbon Source from Composite Materials System for Removing Nitrate Pollution in Groundwater. RSC Adv. 2017, 7, 10215–10220. [Google Scholar] [CrossRef]
- Ling, Y.; Yan, G.; Wang, H.; Dong, W.; Wang, H.; Chang, Y.; Chang, M.; Li, C. Release Mechanism, Secondary Pollutants and Denitrification Performance Comparison of Six Kinds of Agricultural Wastes as Solid Carbon Sources for Nitrate Removal. Int. J. Environ. Res. Public Health 2021, 18, 1232. [Google Scholar] [CrossRef] [PubMed]
- Capodici, M.; Avona, A.; Laudicina, V.A.; Viviani, G. Biological Groundwater Denitrification Systems: Lab-Scale Trials Aimed at Nitrous Oxide Production and Emission Assessment. Sci. Total Environ. 2018, 630, 462–468. [Google Scholar] [CrossRef] [PubMed]
- Kwame Amoako-Nimako, G.; Yang, X.; Chen, F. Denitrification Using Permeable Reactive Barriers with Organic Substrate or Zero-Valent Iron Fillers: Controlling Mechanisms, Challenges, and Future Perspectives. Environ. Sci. Pollut. Res. 2021, 28, 21045–21064. [Google Scholar] [CrossRef]
- Li, C.; Wang, H.; Yan, G.; Dong, W.; Chu, Z.; Wang, H.; Chang, Y.; Ling, Y.; Zhang, Y. Initial Carbon Release Characteristics, Mechanisms and Denitrification Performance of a Novel Slow Release Carbon Source. J. Environ. Sci. 2022, 118, 32–45. [Google Scholar] [CrossRef] [PubMed]
- Feng, Y.; Wang, L.; Yin, Z.; Cui, Z.; Qu, K.; Wang, D.; Wang, Z.; Zhu, S.; Cui, H. Comparative Investigation on Heterotrophic Denitrification Driven by Different Biodegradable Polymers for Nitrate Removal in Mariculture Wastewater: Organic Carbon Release, Denitrification Performance, and Microbial Community. Front. Microbiol. 2023, 14, 1141362. [Google Scholar] [CrossRef] [PubMed]
- Google Earth Google Earth. Available online: https://earth.google.com/web/@8.03367984,-80.94951597,87.83271576a,98.27596484d,35y,31.28788225h,40.65038569t,0r (accessed on 22 August 2023).
- Chandler, J.A.; Jewell, W.J.; Gossett, J.M.; Vansoest, P.J.; Robertson, J.B. Predicting Methane Fermentation Biodegradability. Biotechnol. Bioeng. 1980, 22, 93–107. [Google Scholar]
- APHA. Standard Methods for the Examination of Water and Waste Water, 22nd ed.; American Public Health Association, American Water Works Association, Eds.; Water Environment Federation: Alexandria, VA, USA, 2012. [Google Scholar]
- Grajales-Mesa, S.J.; Malina, G. Pilot-Scale Evaluation of a Permeable Reactive Barrier with Compost and Brown Coal to Treat Groundwater Contaminated with Trichloroethylene. Water 2019, 11, 1922. [Google Scholar] [CrossRef]
- Zou, Y.; Fu, J.; Chen, Z.; Ren, L. The Effect of Microstructure on Mechanical Properties of Corn Cob. Micron 2021, 146, 103070. [Google Scholar] [CrossRef] [PubMed]
- Pike Technologies, I. Evacuable KBr Die Kit for Preparation of High Quality Pallets-Manual. 2010. Available online: https://www.ursinus.edu/live/files/3447-pike-technologies-13mm-die-kit-manual (accessed on 15 August 2023).
- Guan, X.; Ji, G.; Xu, S.; Yun, Y.; Liu, H. Selection of Agricultural Straws as Sustained-Release Carbon Source for Denitrification in a Drawer-Type Biological Filter. Water Air Soil Pollut. 2019, 230, 18. [Google Scholar] [CrossRef]
- Gavaskar, A.R. Design and Construction Techniques for Permeable Reactive Barriers. J. Hazard. Mater. 1999, 68, 41–71. [Google Scholar] [CrossRef]
- Castillo, K.; Rodríguez, L.; Deago, E. Modelo Físico y Matemático de Columnas Desnitrificantes Usando Saccharum spontaneum L. Como Fuente de Carbono Orgánico. Bachelor’s Thesis, Universidad Tecnologíaca de Panamá, Panama City, Panama, 2018. [Google Scholar]
- González-Valoys, A.C.; Vargas-Lombardo, M.; Higueras, P.; García-Navarro, F.J.; García-Ordiales, E.; Jiménez-Ballesta, R. Hydrochemistry of Groundwater from Tocumen Sector, Panamá City: An Assessment of Its Possible Usage during Emergency Events. Environ. Earth Sci. 2021, 80, 176. [Google Scholar] [CrossRef]
- HACH Company. Water Analysis Handbook, 7th ed.; HACH Company: Loveland, CO, USA, 2012. [Google Scholar]
- Vassilev, S.V.; Baxter, D.; Vassileva, C.G. An Overview of the Behaviour of Biomass during Combustion: Part I. Phase-Mineral Transformations of Organic and Inorganic Matter. Fuel 2013, 112, 391–449. [Google Scholar] [CrossRef]
- Zou, Y.; Fu, J.; Chen, Z.; Ren, L. Field Decomposition of Corn Cob in Seasonally Frozen Soil and Its Intrinsic Influencing Factors: The Case of Northeast China. Agriculture 2021, 11, 556. [Google Scholar] [CrossRef]
- Gibert, O.; De Pablo, J.; Luis Cortina, J.; Ayora, C. Chemical Characterisation of Natural Organic Substrates for Biological Mitigation of Acid Mine Drainage. Water Res. 2004, 38, 4186–4196. [Google Scholar] [CrossRef] [PubMed]
- Sánchez, G.; Ramírez, J.; James, A.; Deago, E.; Villarreal, J. Evaluación Del Potencial de Lodos Orgánicos Carbonizados de Una Planta de Tratamiento de Aguas Residuales Para El Mejoramiento de Suelos. In Proceedings of the 2021 National Congress of Science and Technology—APANAC, Panama City, Panama, 23–25 June 2021; pp. 292–299. [Google Scholar] [CrossRef]
- Kijjanapanich, P.; Yaowakun, Y. Enhancement of Nitrate-Removal Efficiency Using a Combination of Organic Substrates and Zero-Valent Iron as Electron Donors. J. Environ. Eng. 2019, 145, 04019006. [Google Scholar] [CrossRef]
- Vassilev, S.V.; Vassileva, C.G.; Bai, J. Content, Modes of Occurrence, and Significance of Phosphorous in Biomass and Biomass Ash. J. Energy Inst. 2023, 108, 101205. [Google Scholar] [CrossRef]
- Yang, X.L.; Jiang, Q.; Song, H.L.; Gu, T.T.; Xia, M.Q. Selection and Application of Agricultural Wastes as Solid Carbon Sources and Biofilm Carriers in MBR. J. Hazard. Mater. 2015, 283, 186–192. [Google Scholar] [CrossRef] [PubMed]
- Zhang, J.; Feng, C.; Hong, S.; Hao, H.; Yang, Y. Behavior of Solid Carbon Sources for Biological Denitrification in Groundwater Remediation. Water Sci. Technol. 2012, 65, 1696–1704. [Google Scholar] [CrossRef] [PubMed]
- Özkaraova, E.B.; Kalin, R.M.; Gkiouzepas, S.; Knapp, C.W. Industrial and Agricultural Wastes as a Potential Biofilter Media Fogroundwater Nitrate Remediation. Desalination Water Treat. 2019, 172, 330–343. [Google Scholar] [CrossRef]
- Qi, L.; Li, L.; Yin, L.; Zhang, W. Study on the Properties of Denitrifying Carbon Sources from Cellulose Plants and Their Nitrogen Removal Mechanisms. Water Sci. Technol. 2022, 85, 719–730. [Google Scholar] [CrossRef] [PubMed]
- Deago, E.; Pizarro, G. Typha angustifolia L. Evaluada Como Sustrato Solido Orgánico Natural Para Biorremediar Agua Subterránea Contaminada Con Nitrato. I+D Tecnológico 2015, 11, 41–54. [Google Scholar]
- Li, B.; Hao, R.-X. Comparison and optimization of cellulose carbon source for denitrification filter. Huan Jing Ke Xue Huanjing Kexue 2013, 34, 1428–1434. [Google Scholar] [PubMed]
- Capodici, M.; Morici, C.; Viviani, G. Batch Test Evaluation of Four Organic Substrates Suitable for Biological Groundwater Denitrification. Chem. Eng. Trans. 2014, 38, 43–48. [Google Scholar] [CrossRef]
- Zhong, H.; Cheng, Y.; Ahmad, Z.; Shao, Y.; Zhang, H.; Lu, Q.; Shim, H. Solid-Phase Denitrification for Water Remediation: Processes, Limitations, and New Aspects. Crit. Rev. Biotechnol. 2020, 40, 1113–1130. [Google Scholar] [CrossRef] [PubMed]
- Feng, L.; Chen, K.; Han, D.; Zhao, J.; Lu, Y.; Yang, G.; Mu, J.; Zhao, X. Comparison of Nitrogen Removal and Microbial Properties in Solid-Phase Denitrification Systems for Water Purification with Various Pretreated Lignocellulosic Carriers. Bioresour. Technol. 2017, 224, 236–245. [Google Scholar] [CrossRef] [PubMed]
- Zhang, D.; Yang, H.; Lan, S.; Li, X.; Guo, Q.; Xie, Y. An Innovative Bilayer Solid Carbon Source for Tertiary Denitrification: Synthesis, Performance, and Microbial Diversity Analysis. J. Water Process Eng. 2023, 54, 103931. [Google Scholar] [CrossRef]
- Wang, Q.; Feng, C.; Zhao, Y.; Hao, C. Denitrification of Nitrate Contaminated Groundwater with a Fiber-Based Biofilm Reactor. Bioresour. Technol. 2009, 100, 2223–2227. [Google Scholar] [CrossRef] [PubMed]
- Zhang, W.; Bai, Y.; Ruan, X.; Yin, L. The Biological Denitrification Coupled with Chemical Reduction for groundwater Nitrate Remediation via Using SCCMs as Carbon Source. Chemosphere 2019, 234, 89–97. [Google Scholar] [CrossRef]
- Cao, X.; Zhou, X.; Xue, M.; Chen, J.; Li, S. Evaluation of Nitrogen Removal and N2O Emission in a Novel Anammox Coupled with Sulfite-Driven Autotrophic Denitrification System: Influence of PH. J. Clean. Prod. 2021, 321, 128984. [Google Scholar] [CrossRef]
- Menció, A.; Madaula, E.; Meredith, W.; Casamitjana, X.; Quintana, X.D. Nitrogen in Surface Aquifer—Coastal Lagoons Systems: Analyzing the Origin of Eutrophication Processes. Sci. Total Environ. 2023, 871, 161947. [Google Scholar] [CrossRef] [PubMed]
- Zhang, S.; Pang, S.; Wang, P.; Wang, C.; Guo, C.; Addo, F.G.; Li, Y. Responses of Bacterial Community Structure and Denitrifying Bacteria in Biofilm to Submerged Macrophytes and Nitrate. Sci. Rep. 2016, 6, 36178. [Google Scholar] [CrossRef] [PubMed]
- He, Q.; Feng, C.; Peng, T.; Chen, N.; Hu, Q.; Hao, C. Denitrification of Synthetic Nitrate-Contaminated Groundwater Combined with Rice Washing Drainage Treatment. Ecol. Eng. 2016, 95, 152–159. [Google Scholar] [CrossRef]
- Grajales-Mesa, S.J.; Malina, G.; Kret, E.; Szklarczyk, T. Designing a Permeable Reactive Barrier to Treat TCE Contaminated Groundwater: Numerical Modelling. Inst. Mex. Tecnol. Agua 2020, 11, 78–106. [Google Scholar] [CrossRef]
- Wang, H.; Chen, N.; Feng, C.; Deng, Y.; Gao, Y. Research on Efficient Denitrification System Based on Banana Peel Waste in Sequencing Batch Reactors: Performance, Microbial Behavior and Dissolved Organic Matter Evolution. Chemosphere 2020, 253, 126693. [Google Scholar] [CrossRef] [PubMed]
- Shi, Y.; Hu, Y.; Liang, D.; Wang, G.; Xie, J.; Zhu, X. Enhanced Denitrification of Sewage via Bio-Microcapsules Embedding Heterotrophic Nitrification-Aerobic Denitrification Bacteria Acinetobacter pittii SY9 and Corn Cob. Bioresour. Technol. 2022, 358, 127260. [Google Scholar] [CrossRef] [PubMed]
- Guo, Y.; Guo, L.; Jin, C.; Zhao, Y.; Gao, M.; Ji, J.; She, Z.; Giesy, J.P. Comparison of Primary and Secondary Sludge Carbon Sources Derived from Hydrolysis or Acidogenesis for Nitrate Reduction and Denitrification Kinetics: Organics Utilization and Microbial Community Shift. Environ. Res. 2022, 212, 113403. [Google Scholar] [CrossRef] [PubMed]
- Gan, F.; Wu, K.; Ma, F.; Du, C. In Situ Determination of Nitrate in Water Using Fourier Transform Mid-Infrared Attenuated Total Reflectance Spectroscopy Coupled with Deconvolution Algorithm. Molecules 2020, 25, 5838. [Google Scholar] [CrossRef] [PubMed]
- Lázaro, L.; Arauzo, J. Aprovechamiento de Residuos de La Industria de Conservas de Vegetales: Hidrólisis Enzimática. Zubía 1994, 12, 227–240. [Google Scholar]
- Liu, S.; Gao, B.; Xuan, K.; Ma, W.; Chen, N.; Jia, M. Denitrification Performance and Mechanism of Permeable Reactive Barrier Technology with a Sulfur Autotrophic Denitrification Composite Filler in Rare Earth Mine Engineering Applications. Water Air Soil Pollut. 2023, 234, 76. [Google Scholar] [CrossRef]
- Cui, H.; Feng, Y.; Yin, Z.; Qu, K.; Wang, L.; Li, J.; Jin, T.; Bai, Y.; Cui, Z. Organic Carbon Release, Denitrification Performance and Microbial Community of Solid-Phase Denitrification Reactors Using the Blends of Agricultural Wastes and Artificial Polymers for the Treatment of Mariculture Wastewater. Ecotoxicol. Environ. Saf. 2023, 255, 114791. [Google Scholar] [CrossRef]


| Parameter | Value |
|---|---|
| Ash (%) | 1.98 |
| Lignin (%) | 6 |
| Hemicellulose (%) | 50.8 |
| Cellulose (%) | 34 |
| Dry Matter % | 92.07 |
| Moisture % | 7.95 |
| Volatile Solids (%) | 84.47 ± 2.88 |
| Biodegradable Fraction | 0.63 ± 0.01 |
| Bulk Density (kg/m3) | 139.45 |
| Porosity | 0.46 |
| Hydraulic Conductivity (m/s) | 5.69 × 10⁻⁵ |
| Nitrogen (N) % | 0.07 |
| Phosphorus (P) % | 0.06 |
| Potassium (K) % | 1.98 |
| Calcium (Ca) % | 0.04 |
| Magnesium (Mg) % | 0.02 |
| Iron (Fe) mg/L = ppm | 360.17 |
| Copper (Cu) mg/L = ppm | 2.09 |
| Manganese (Mn) mg/L = ppm | 0 |
| Zinc (Zn) mg/L = ppm | 96.50 |
| Sodium (Na) mg/L = ppm | 9.31 |
| Parameter (µg/L) | K | Ca | S | Ti | Cr | Cl | Fe | Ni | Cu | Zn | Ga | Br | Ba |
|---|---|---|---|---|---|---|---|---|---|---|---|---|---|
| Leaching | 12,310 | 550 | 511 | No det. | 12.4 | 3730 | 86.6 | 7.7 | 11.7 | 13.2 | 100 | 18.5 | 17.2 |
Disclaimer/Publisher’s Note: The statements, opinions and data contained in all publications are solely those of the individual author(s) and contributor(s) and not of MDPI and/or the editor(s). MDPI and/or the editor(s) disclaim responsibility for any injury to people or property resulting from any ideas, methods, instructions or products referred to in the content. |
© 2024 by the authors. Licensee MDPI, Basel, Switzerland. This article is an open access article distributed under the terms and conditions of the Creative Commons Attribution (CC BY) license (https://creativecommons.org/licenses/by/4.0/).
Share and Cite
Sánchez Hidalgo, G.C.; Ortega, M.D.L.Á.; Deago, E. Enhanced Biological Nitrate Removal from Groundwater in Humid Tropical Regions Using Corn Cob-Based Permeable Reactive Barriers: A Case Study from Panama. Water 2024, 16, 1668. https://doi.org/10.3390/w16121668
Sánchez Hidalgo GC, Ortega MDLÁ, Deago E. Enhanced Biological Nitrate Removal from Groundwater in Humid Tropical Regions Using Corn Cob-Based Permeable Reactive Barriers: A Case Study from Panama. Water. 2024; 16(12):1668. https://doi.org/10.3390/w16121668
Chicago/Turabian StyleSánchez Hidalgo, Graciela Cecilia, Maria De Los Ángeles Ortega, and Euclides Deago. 2024. "Enhanced Biological Nitrate Removal from Groundwater in Humid Tropical Regions Using Corn Cob-Based Permeable Reactive Barriers: A Case Study from Panama" Water 16, no. 12: 1668. https://doi.org/10.3390/w16121668
APA StyleSánchez Hidalgo, G. C., Ortega, M. D. L. Á., & Deago, E. (2024). Enhanced Biological Nitrate Removal from Groundwater in Humid Tropical Regions Using Corn Cob-Based Permeable Reactive Barriers: A Case Study from Panama. Water, 16(12), 1668. https://doi.org/10.3390/w16121668