Article

Investigating Algal Sensor Utilization Methods for Three-Dimensional Algal Control Technology Evaluation

1
Department of Biology, Kyungpook National University, Daegu 41566, Republic of Korea
2
Korea Water Resources Corporation (K-Water), Daejeon 34350, Republic of Korea
*
Authors to whom correspondence should be addressed.
Water 2024, 16(12), 1679; https://doi.org/10.3390/w16121679
Submission received: 9 May 2024 / Revised: 5 June 2024 / Accepted: 7 June 2024 / Published: 12 June 2024

Abstract

:
There are physical, chemical, and biological methods to control algae, and their efficiency requires evaluation. In the field, monitoring and evaluating the overall algal concentration is challenging due to factors such as the flow rate, inhomogeneous distribution of algae in the water body, and limitations in the number of samples for microscopic analysis. In this study, we analyzed total and cyanobacterial chlorophyll a (Chl-a) using a FluoroProbe sensor and microscopic data collected from March to November 2019. The Pearson correlation coefficient of log(x + 1) values revealed a significant positive correlation between four harmful cyanobacteria and cyanobacterial Chl-a (r = 0.618, p < 0.01). Furthermore, we explored the potential of evaluating the efficiency of algal control using sensors by acquiring three-dimensional, spatially continuous data for an algal fence, a physical algae control technology installed at the Daecheong Dam in 2021. The results confirmed that sensors can effectively evaluate algal control technology. This study demonstrates the effectiveness of using sensors to assess the efficiency of physical algal control.

1. Introduction

Blue-green algae are prokaryotic organisms characterized by their possession of chlorophyll a (Chl-a), a green photosynthetic pigment, and their ability to produce oxygen via oxygenic photosynthesis [1,2,3].
Rising temperatures induced by climate change are increasing and intensifying water stratification. Moreover, temperature increases are causing changes in rainfall, including increased rainfall pattern variability [4,5,6]. Additionally, primary production or eutrophication is accelerating because of increased nutrient levels (e.g., nitrogen and phosphorus) in water bodies as a consequence of industrial development and the use of agricultural fertilizers [7]. This phenomenon is expected to occur more frequently [5,8,9]. By increasing nutrient inputs and inhibiting vertical mixing, toxic cyanobacteria proliferate, and blue-green algal growth is promoted [6,10,11].
The economic impacts of managing blue-green algae involve expenses related to water treatment resulting from algal metabolites (taste, odor, and toxicity), recreational disruptions caused by blooms, and additional monitoring requirements [12]. In addition, the risks of crop contamination, disruption of ecosystems, and restriction of recreational use resulting from toxin production are detrimental to both animals and humans; therefore, countries are implementing various control measures (i.e., physical, chemical, biological, and combined measures) and monitoring activities to reduce the cell numbers of harmful algal blooms [13,14,15,16,17,18,19,20,21].
Global efforts are underway to decrease pollution sources, and the Water Framework Directive (WFD, Directive 2000/60/EC) is intensifying monitoring efforts in rivers and reservoirs [14,22,23]. The World Health Organization (WHO) and several countries (e.g., Canada and Australia) have established alert levels to minimize the risk of harmful cyanobacterial metabolites contaminating treated water supply systems [24]. Microscopic observation is used in South Korea to monitor four genera of harmful blue-green algae: Microcystis, Aphanizomenon, Anabaena, and Oscillatoria. Standards have also been established to guide appropriate responses (Table 1).
According to Song et al. [25], controlling harmful algal blooms can be categorized into either prevention or mitigation methods. Prevention methods encompass various approaches to reduce incoming pollutant sources, such as point source control, real-time measurement, and early warning systems based on predictive modeling. Mitigation methods include hydrological techniques such as flushing, internal nutrient reduction (e.g., dredging and sediment capping), physical methods (e.g., mechanical harvesting and floc and sink), and biomanipulation (e.g., adding filter-feeding organisms) [26]. In addition to hydrological methods, mitigation strategies encompass physical, chemical, and biological approaches [27]. Physical methods include the use of submerged aerators [28], aeration systems [29], algal fences [30,31], flushing, floc, and sink [32,33], and sonication [34]. In contrast, chemical methods involve the use of chitosan [35], copper sulfate, and aluminum sulfate [36]. Other complex technologies for controlling algae include a cyclonic dissolved air flotation (DAF) system [37], as well as the use of ozone and permanganate [38].
However, analyzing the effectiveness of the developed algae control technologies in managing algae in water bodies remains a challenge. Chemical algae control evaluation assays can be quantified in a closed space (e.g., a 2-L beaker) using jar tests at the laboratory scale [39,40]. However, evaluating these assays in the field is difficult because of the open nature of the field. Physical methods must be evaluated using various approaches because of the distinct control methods employed by different devices. Furthermore, the absence of a pilot-level space poses challenges in analyzing the effects within a confined space.
Among the monitoring methods, point-by-point analysis may not be representative of the sampling site because of possible inhomogeneous algal distributions. Moreover, when assessing chemical control efficiency, conflicting results may arise. Remote sensing has been employed to address the growing demand for area-scale monitoring; however, determining the distribution by depth remains a limitation [41]. Nevertheless, certain algae species exhibit spatial distribution characteristics at specific depths contingent upon the surrounding environment and produce byproducts such as toxins. Therefore, depth-specific surveys are essential for effective analysis when implementing algae control methods via water mixing [42,43].
Microscopic analysis of algae is the primary method for assessing algae control, which involves several different processes, such as imaging, pigmentation, and molecular biological analysis, depending on the specific objective. Among the methods using pigments, various studies have utilized sensors. Brient et al. [2] established a correlation between the phycocyanin content and cyanobacterial biomass using approximately 800 natural samples. This correlation was further validated by Catherine et al. [14] using field data (n = 50), demonstrating its applicability in rivers and lakes. In addition, previous studies conducted in the field have demonstrated strong correlations between sensor data and cell counts in single phytoplankton assemblages: Planktothrix rubescens, r = 0.899, n = 110 [44]; Fragilaria crotonensis, r2 = 0.70, n = 25 [45]; and Ceratium sp., r = 0.984, n = 19 [46]. Ziemińska-Stolarska et al. [47] examined a dataset of 650–700 data points, of which only 30 were analyzed in the laboratory. Consequently, obtaining sensor data via conventional laboratory analysis methods (e.g., microscopy) is limited and inefficient in terms of analyses, expenses, and time. However, most existing evaluation studies have conducted point-by-point analyses of control and test groups using laboratory analysis methods. Moreover, few studies have evaluated the three-dimensional efficiency of algal control technologies installed in the field.
In this study, we aimed to overcome the limitations of conventional microscopic analysis by utilizing sensors to conduct a three-dimensional analysis of an algal fence, a physical algal control device. The device physically blocks the inflow of algae during algal blooms based on the flow rate, similar to the function of an oil fence in preventing the outflow of oil. The barrier extends to greater depths than an oil fence and prevents the spread of algae that have formed a surface layer. To accomplish our objective, we acquired a large amount of data within the surveyed area and calculated the quantity of algae, which was then used to evaluate efficiency. We also attempted to estimate the quantity of algae that could be collected.

2. Materials and Methods

2.1. Algal Control Assessment Analysis in Relation to Pigments
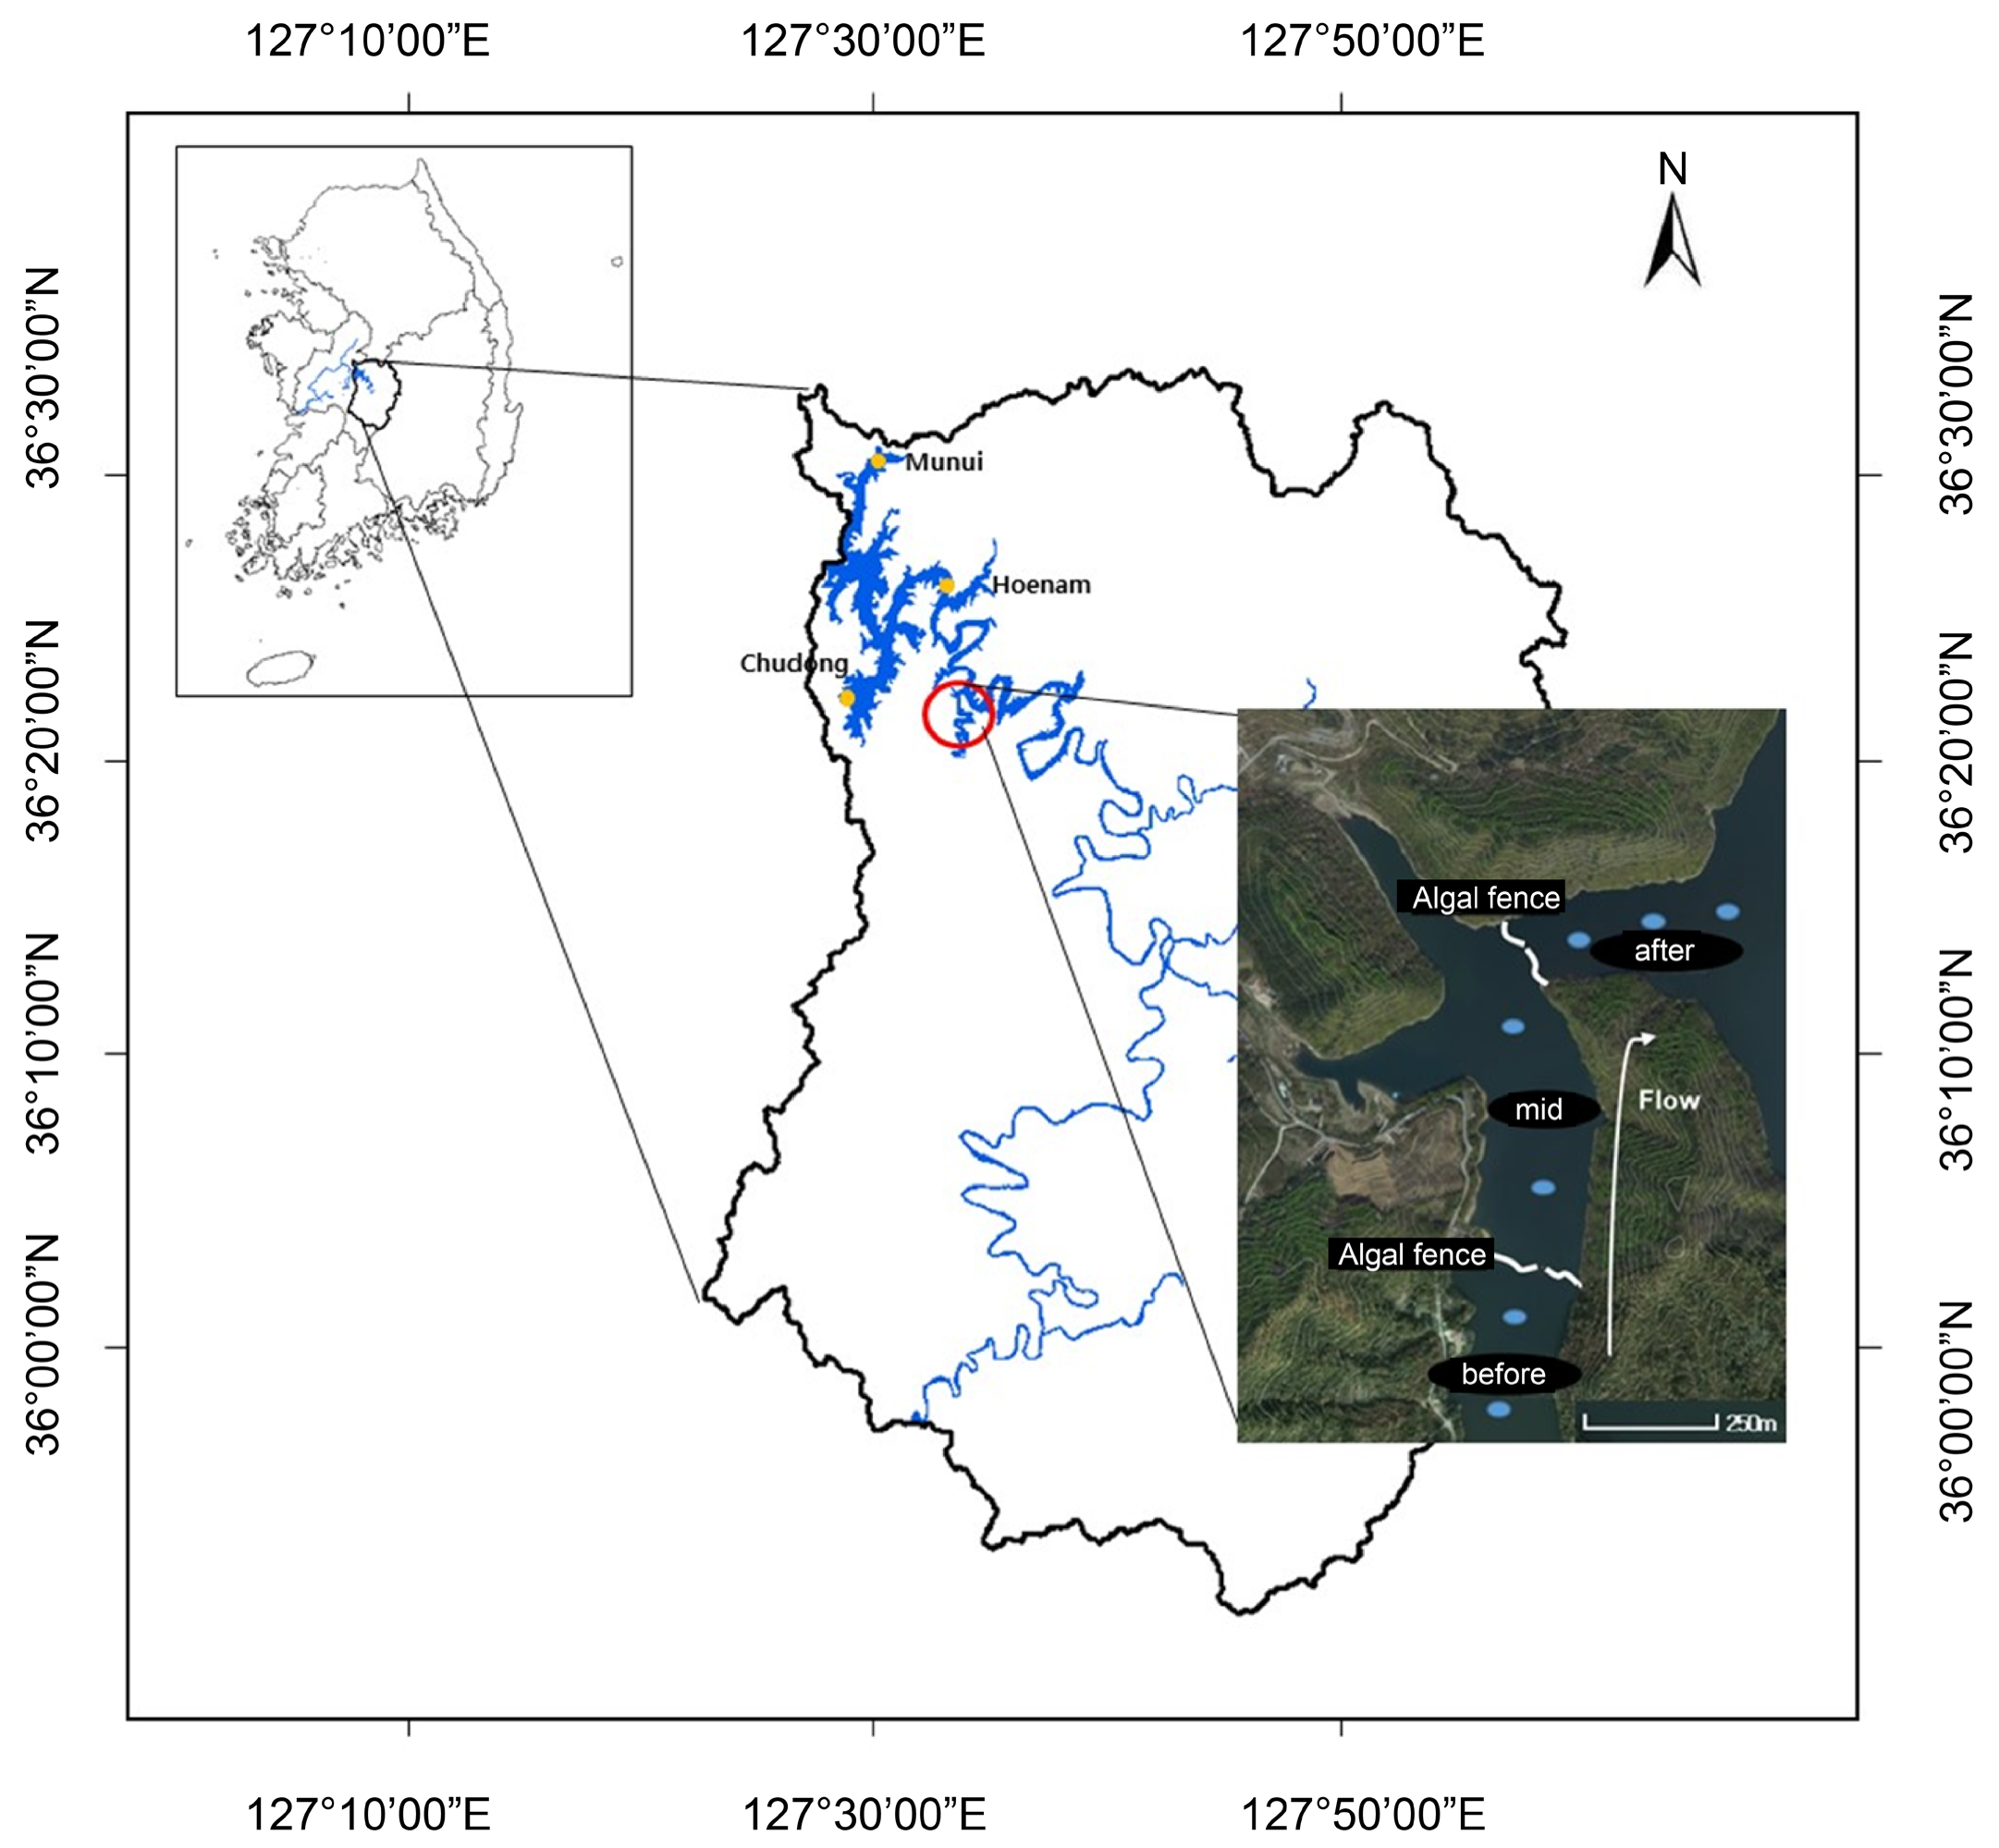
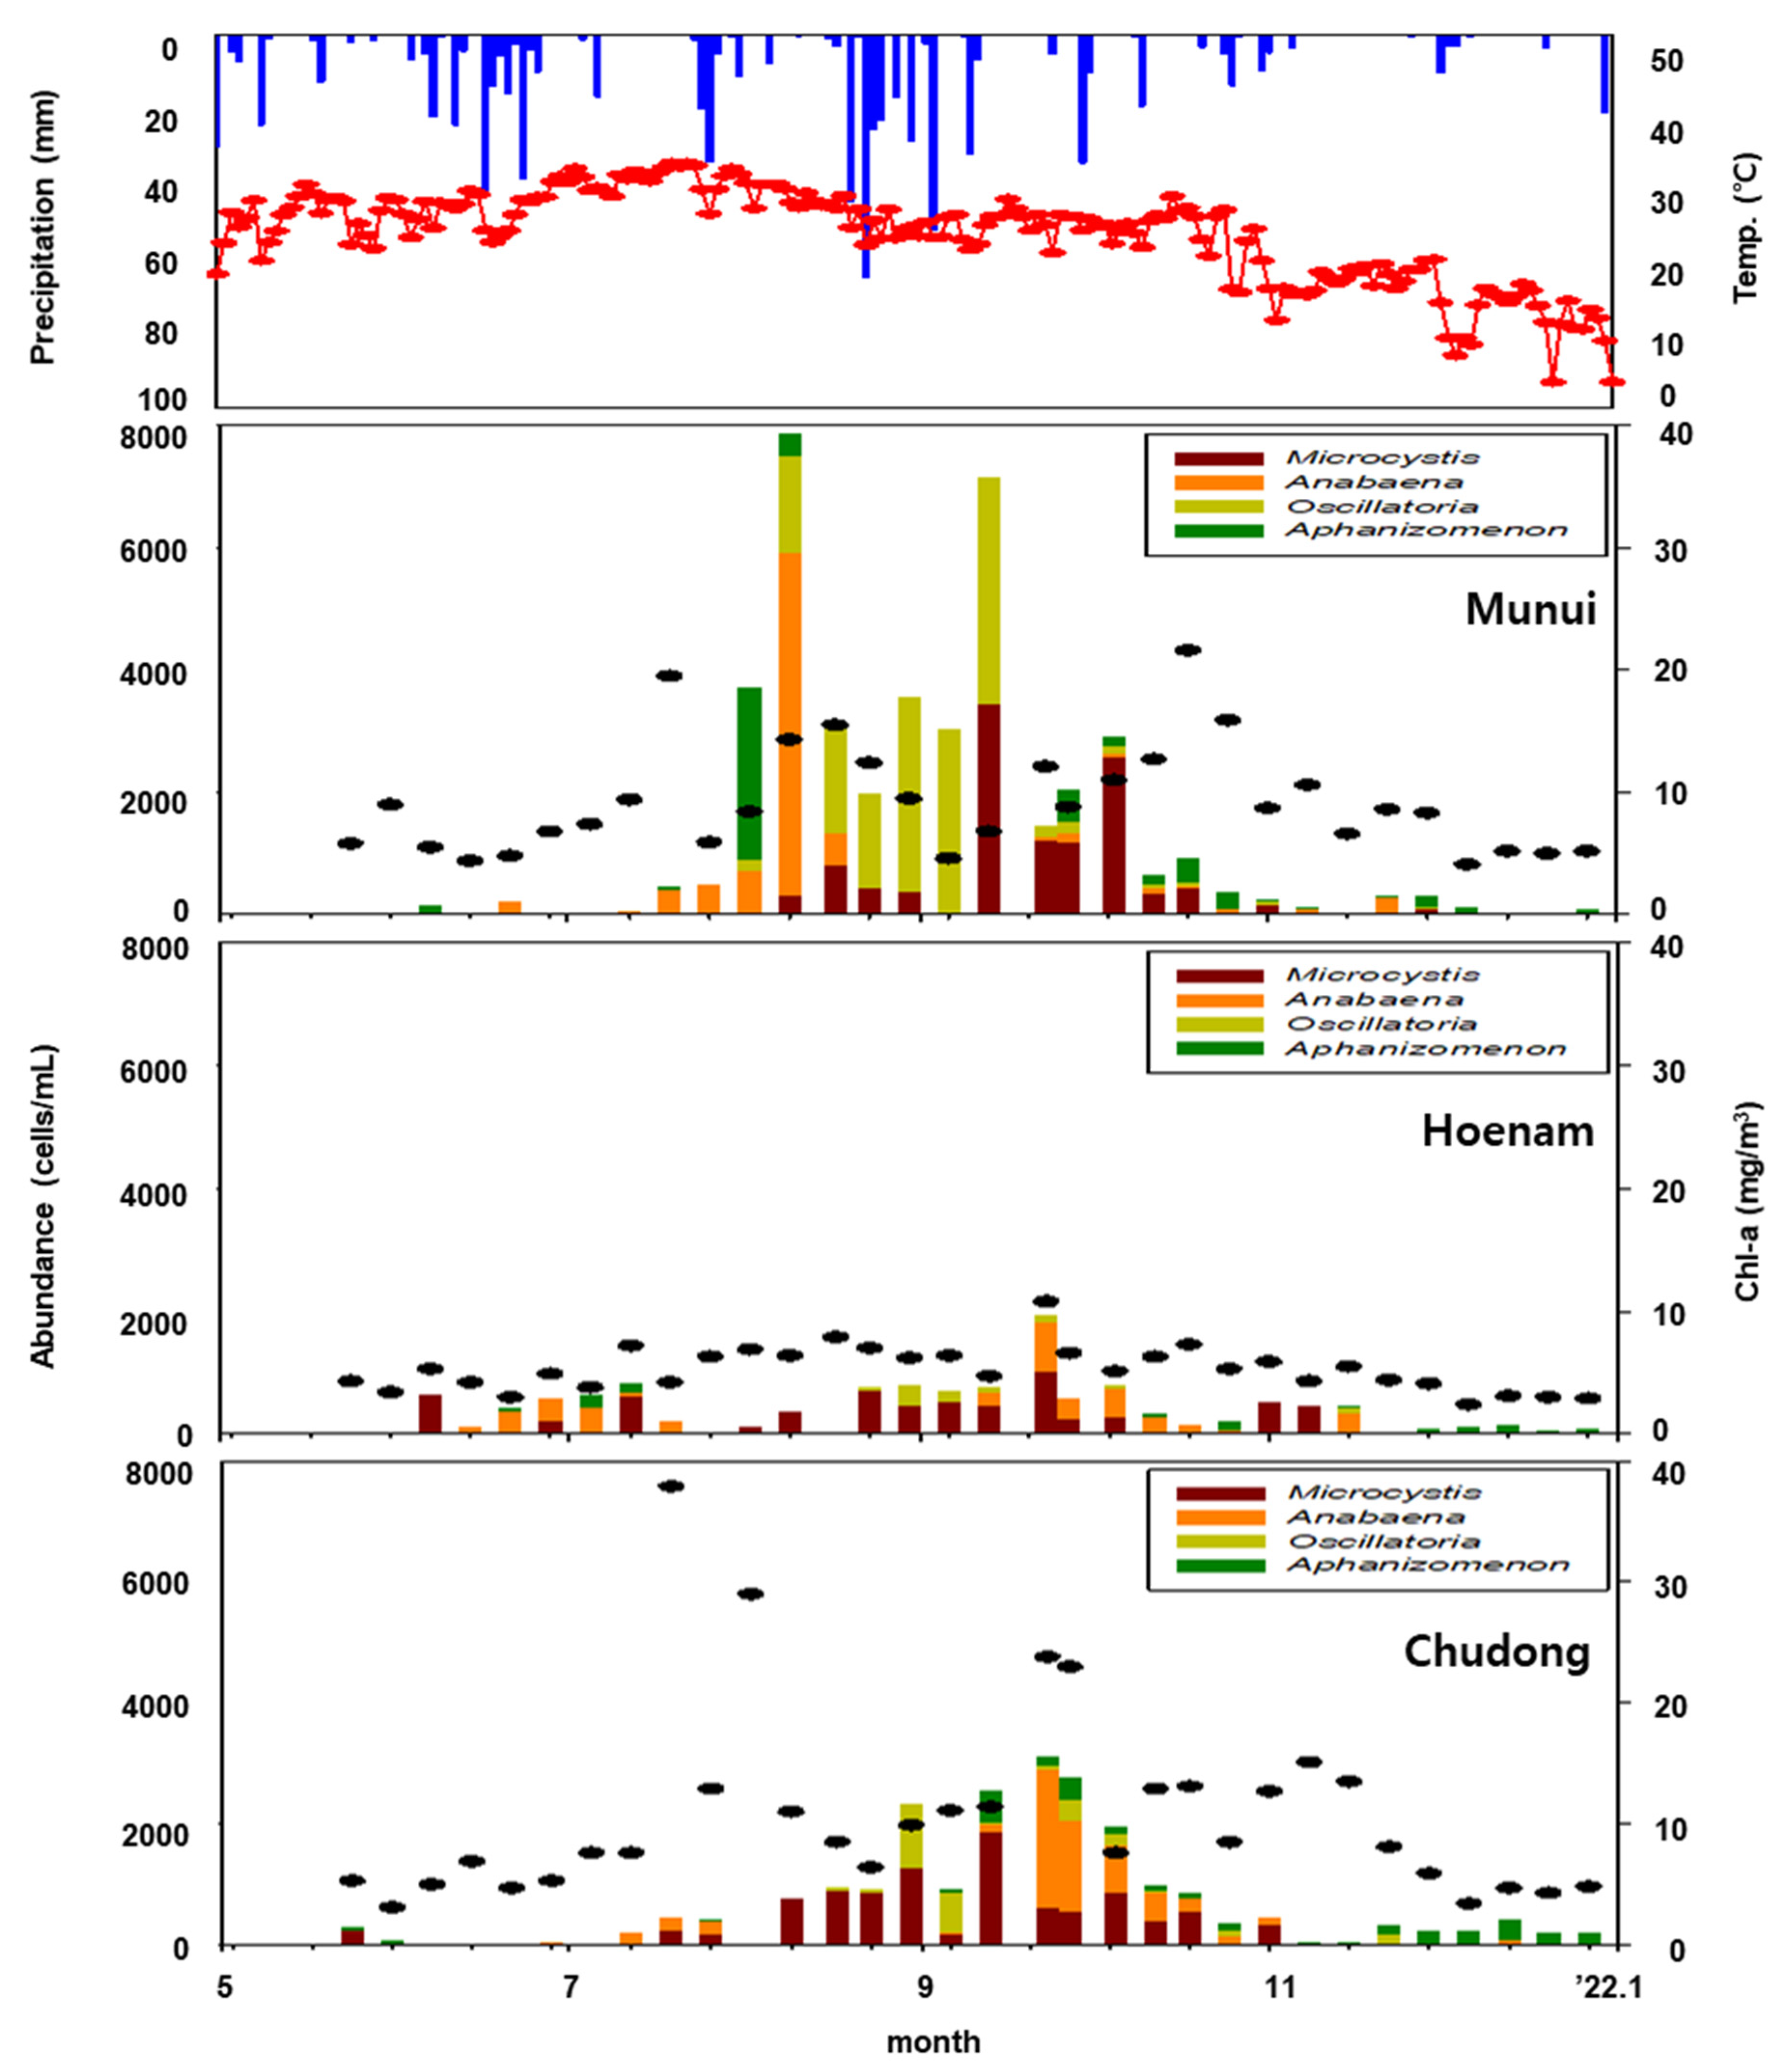
Microscopic methods for assessing algal control require specialized analysis and considerable time to analyze a single sample. To address these challenges, methods using pigments have been employed as indirect markers of algae, and the studies listed in Table 2 utilized pigments to evaluate algal control technologies.
Among these technologies, laboratory analyzers are difficult to use in the field; therefore, portable sensors have been developed [65,66]. Complementing traditional microscopic analysis, sensor-based measurements enable real-time monitoring, depth-specific measurements, and horizontal assessments [67]. In addition, depth-specific sensor measurements are important for assessing trophic status and primary production [68]; therefore, sensors were utilized in this study. Among the sensors, the FluoroProbe (FP) sensor is known for its effectiveness in determining phytoplankton trends. It consists of five light-emitting diodes (LEDs; 470, 525, 570, 590, and 610 nm) to measure the chlorophyll a (Chl-a) concentrations of four algal phyla (green algae, blue-green algae, diatoms, and Cryptophyta), which includes blue-green algae. In addition, the sum of these concentrations constitutes the total Chl-a value [69].

2.2. Field Sampling

The two study sites were Daecheong Dam (Daejeon, South Korea; 36°22′20 S, 127°33′44 E) in Geumgang River Basin and Bohyunsan Dam (Gyeongsangbuk-do, South Korea; 36°07′34 S, 128°56′56 E) in Nakdong River Basin, South Korea. Two algal fences were installed at Daecheong Dam, and the specific location of the installation is shown in Figure 1. The algal fence used in this study was made of polyester and had a depth of 7 m. The field data was collected between March 2019 and October 2021, with variations in the number of survey items and the survey timing specific to each site. The data quantity per item and the survey schedule are provided in Table 3.
The sensor measurements within the dam were carried out in the field using an FP sensor (bbe Moldaenke GmbH, Schwentinental, Germany). During the survey, the sensors were used to take depth measurements at intervals of less than 1 m, while surface data were collected using a vessel. The collected data were stored on a handheld device or laptop. For some of the points measured by the sensors, 2-L samples were taken from both the surface and at depth using a Van Dorn water sampler. These were then analyzed in the laboratory according to the method described below (Section 2.3). In addition, data on Chl-a and four harmful cyanobacteria for May–October 2021, obtained from the Water Environment Information System (https://water.nier.go.kr/web (accessed on 29 March 2024)) about the survey sites of Daecheong Dam, were used.

2.3. Laboratory Experiments

Samples were analyzed for phytoplankton cell counts (ES 04705.1b) according to the water pollution process test method. To determine algal cell counts, the samples were placed in a mass cylinder and allowed to settle for at least 24 h after adding the Lugol solution. The concentrated samples were examined in a Sedgewick–Rafter (SR) chamber, and the cell counts were subsequently converted and calculated [70]. The Surfer 19 program was used to calculate point-to-point concentrations and generate images to visualize the location data and field-based values. Google Maps was used to integrate the Surfer results with the field data, providing an area-by-area breakdown of the point-to-point measurements.

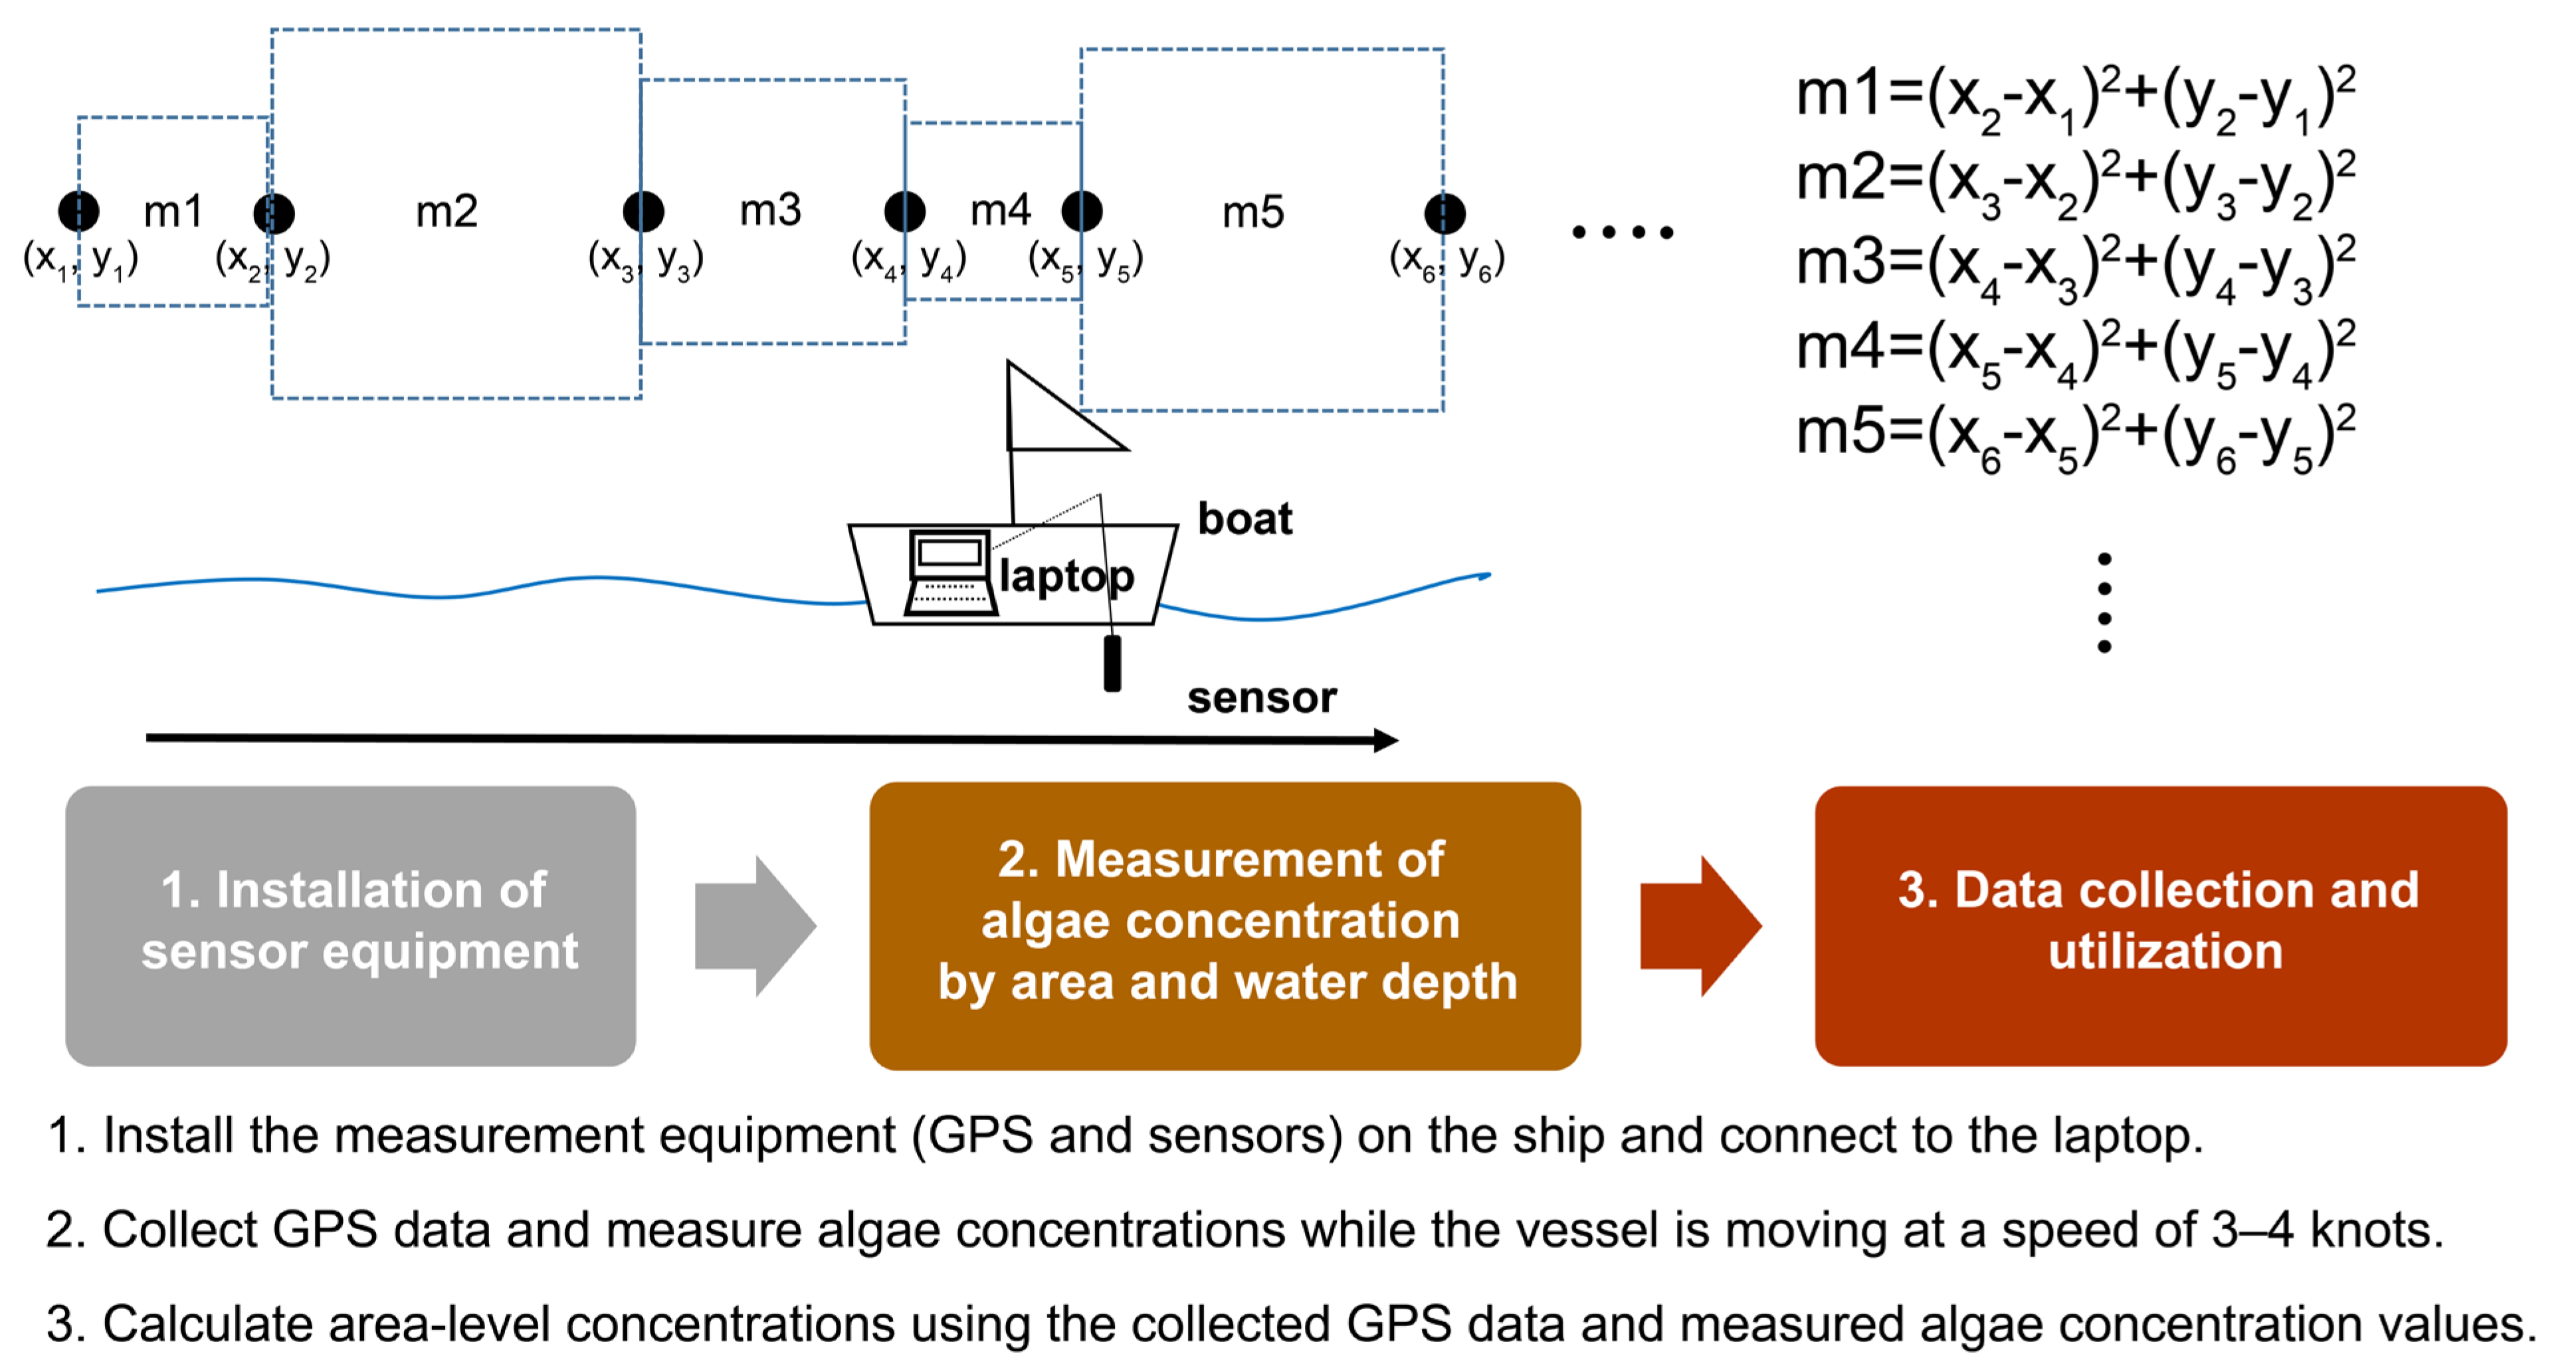
2.4. Three-Dimensional Algal Concentration Analysis along a Depth Gradient

The global positioning system (GPS) coordinates of the measurement points were used to calculate the distance. If the concentration in the area corresponding to the distance traveled was identical, the reference value was established using the average value of the two measured surface points (Figure 2). From the baseline values, we calculated the proportion of algae distribution by depth using the depth-specific measurements taken in the field. Subsequently, we used these values to estimate the quantity of algae in 1-m intervals. The total amount of algae (mg) was determined by calculating the concentration of algae per 1 m3 and multiplying the sum of the measured areas (m1 + m2 + m3 + …) by the water depth, considering the different distances traveled by GPS. Subsequently, the final value was calculated (mg/m3) by dividing the algal concentration by the volume.

2.5. Statistical Analysis

Log transformations (x + 1) were performed on the results obtained from the probe and cell counts to normalize the data. Correlation analysis and simple linear regression were performed using the SPSS 21 software (Statistical Package for the Social Sciences, IBM). The corresponding Pearson correlation coefficient (R) from the regression analysis and the level of significance (p) from the t-test are presented. To determine significant differences between locations before, between, and after the two algal fences, we employed the one-way analysis of variance (ANOVA) with Tukey’s HSD test. All data were analyzed using a significance level of p < 0.05, with statistical significance indicated by an asterisk (*).

3. Results

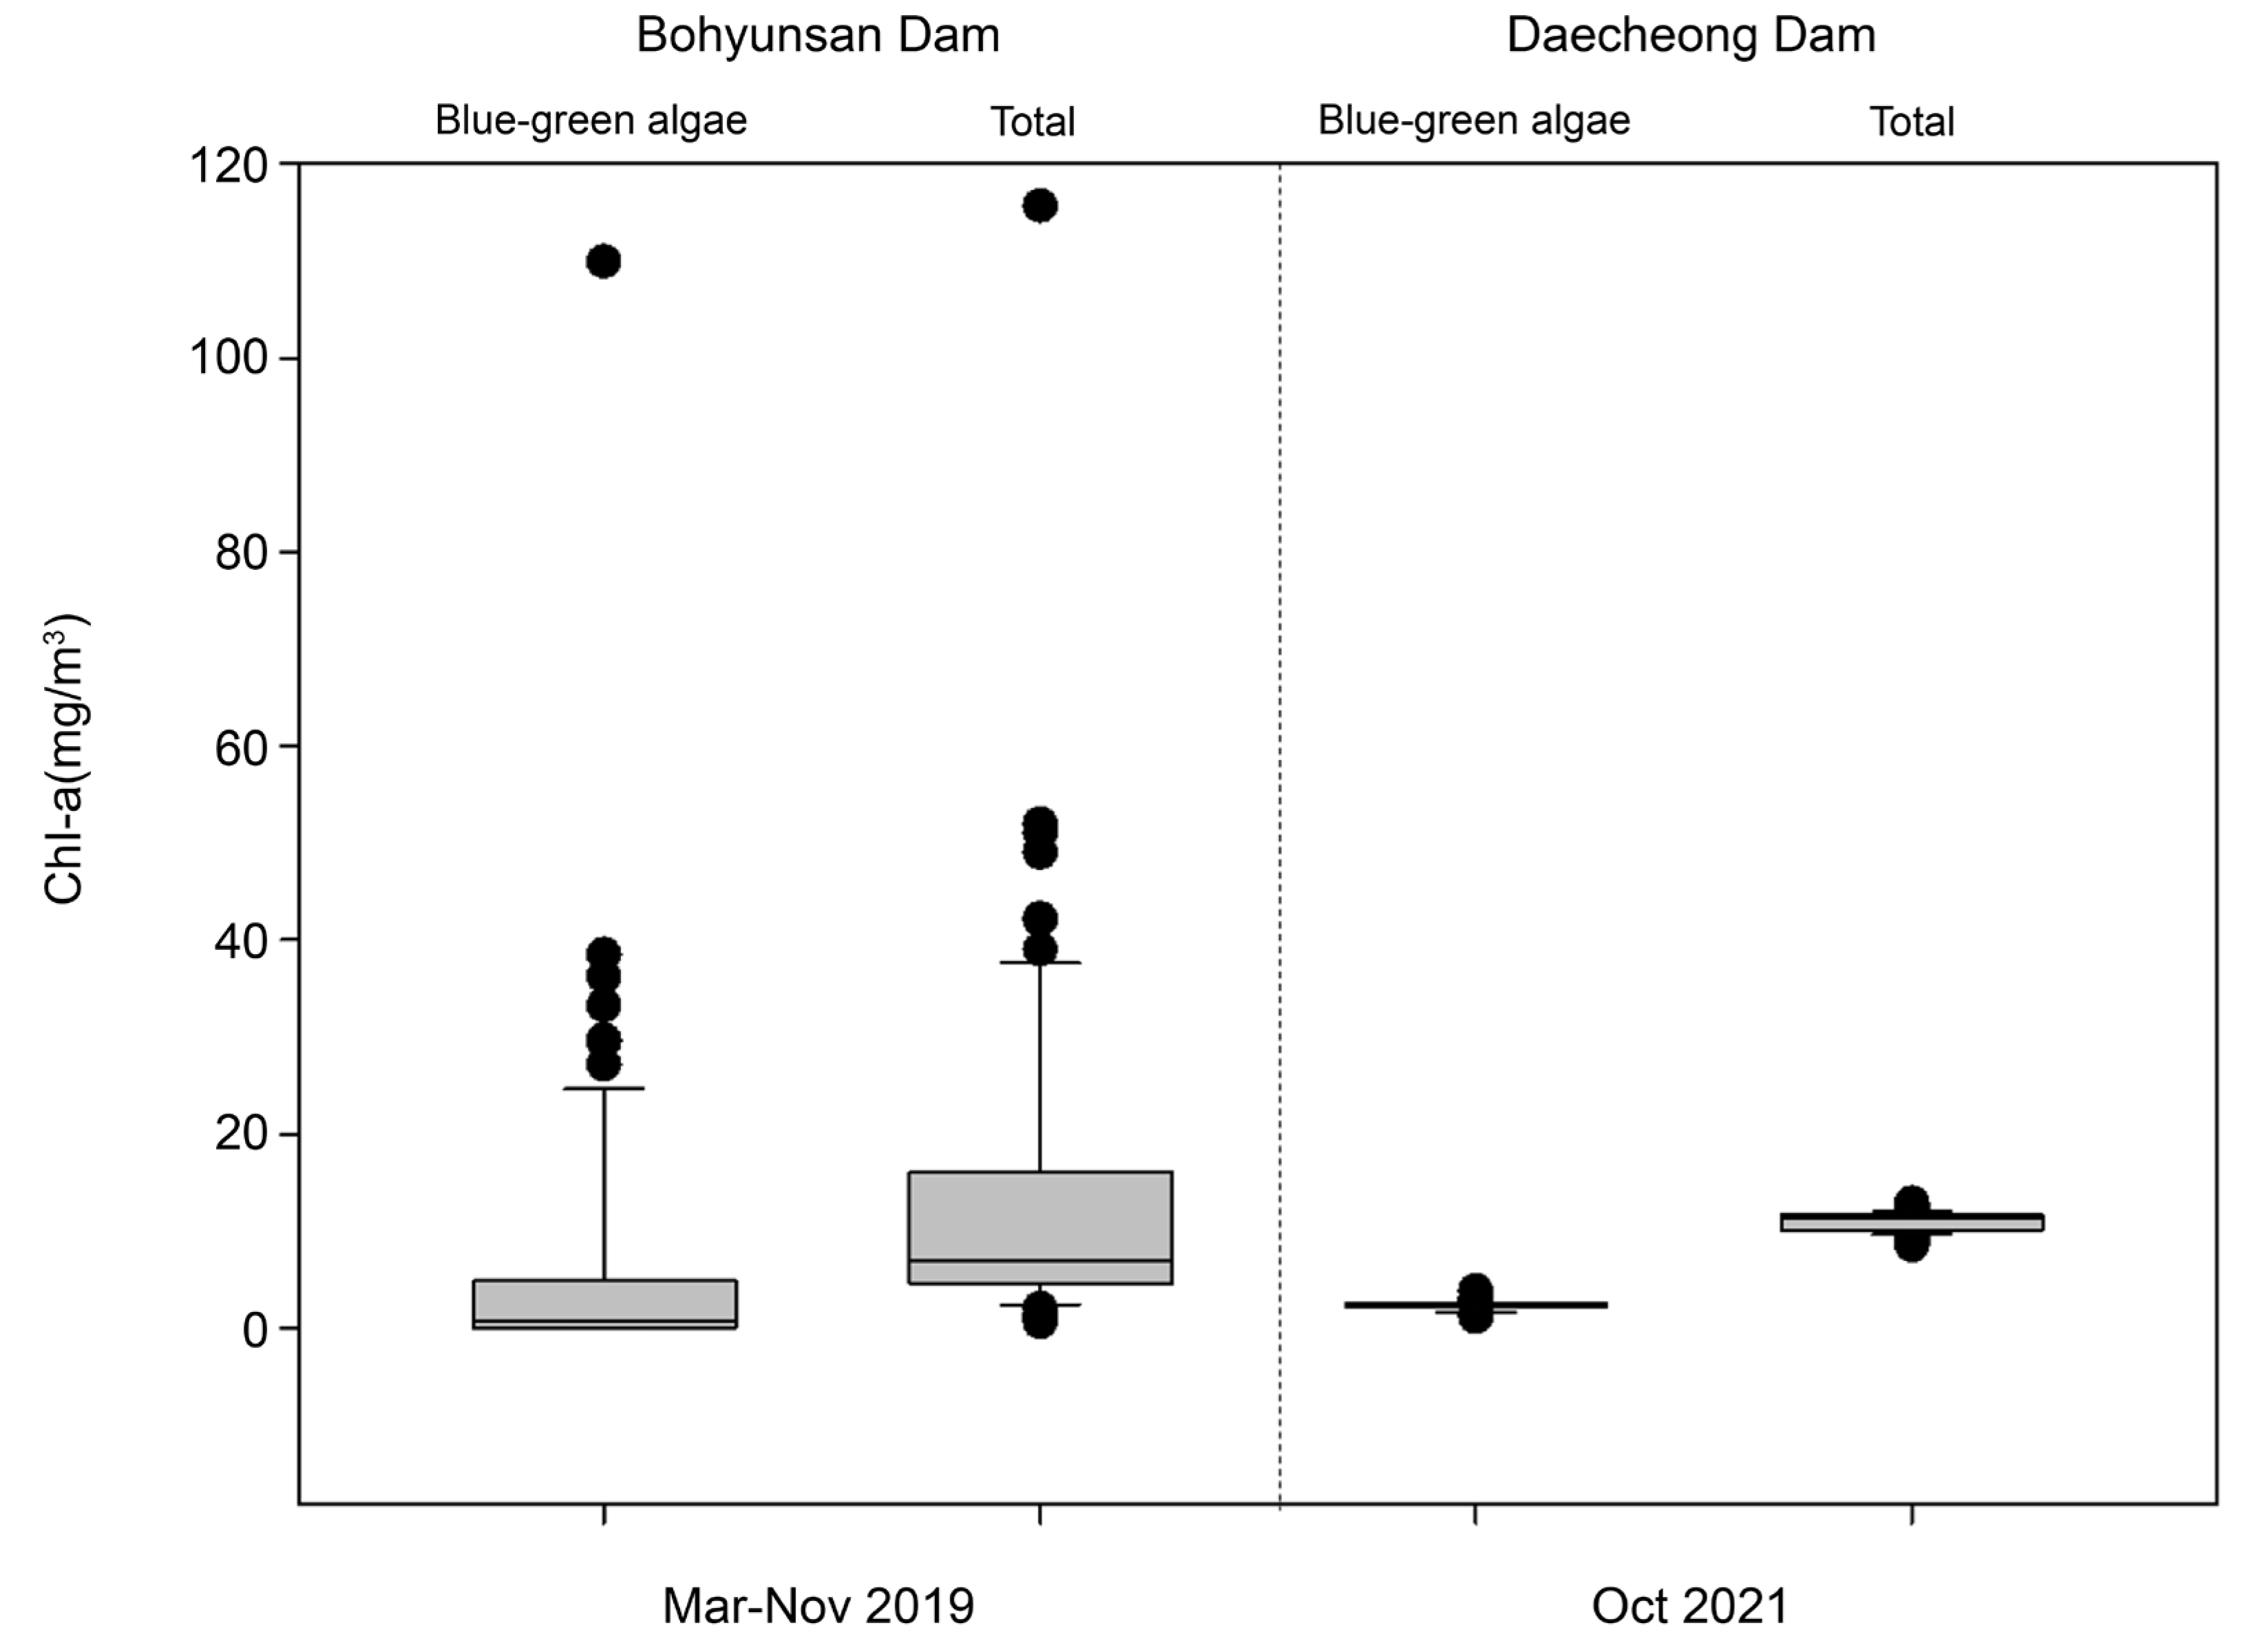
3.1. Examination of Sensor Utilization Possibilities

During the survey period, the total algal Chl-a concentration recorded by the sensors was 115.61 mg/m3 at Bohyunsan Dam and 12.96 mg/m3 at Daecheong Dam. Moreover, the median Chl-a of blue-green algae was 0.77 mg/m3 at Bohyunsan Dam and 2.43 mg/m3 at Daecheong Dam (Figure 3). According to microscopic analysis, a total of 69 species were recorded at Bohyunsan Dam during the survey period, consisting of 24 green algae (Chlorophyta), 32 diatoms (Bacillariophyta), seven blue-green algae (Cyanophyta), and six other algae (Table 4). Species abundance varied among taxonomic groups, with blue-green algae (Cyanophyta) comprising the highest percentage of total cell counts at each dam (71.7%), followed by diatoms (Bacillariophyta; 19.7%) and green algae (Chlorophyta) (7.5%). Microcystis species dominated with a high cell count of 67.4%, surpassing other taxa. In addition, three genera of blue-green algae were represented among the algae alert harmful algae, collectively making up 98.5% of the total blue-green algae.
The Pearson correlation coefficient of the log(x + 1) value revealed a significant positive correlation between the total algal cell count and the total Chl-a sensor value (r = 0.629, p < 0.01). Similarly, a significant positive correlation was observed between the sum of the four harmful cyanobacteria and cyanobacterial Chl-a (r = 0.618, p < 0.01). These findings confirm that sensors can be effectively utilized as a complement to microscopy (Table 5).
Based on the sensor value, the number of harmful cyanobacterial cells was calculated as follows:
Harmful cyanobacterial cells (cells/mL) = (cyanobacteria Chl-a mg/m3 × 572.06) – 537.54 × Sum of Microcystis, Anabaena, Aphanizomenon, and Oscillatoria.
A sensor with cell counts of approximately 1000 cells/mL had a cyanobacterial Chl-a value of 2.69 mg/m3, whereas a sensor with approximately 10,000 cells/mL had a value of 18.45 mg/m3.

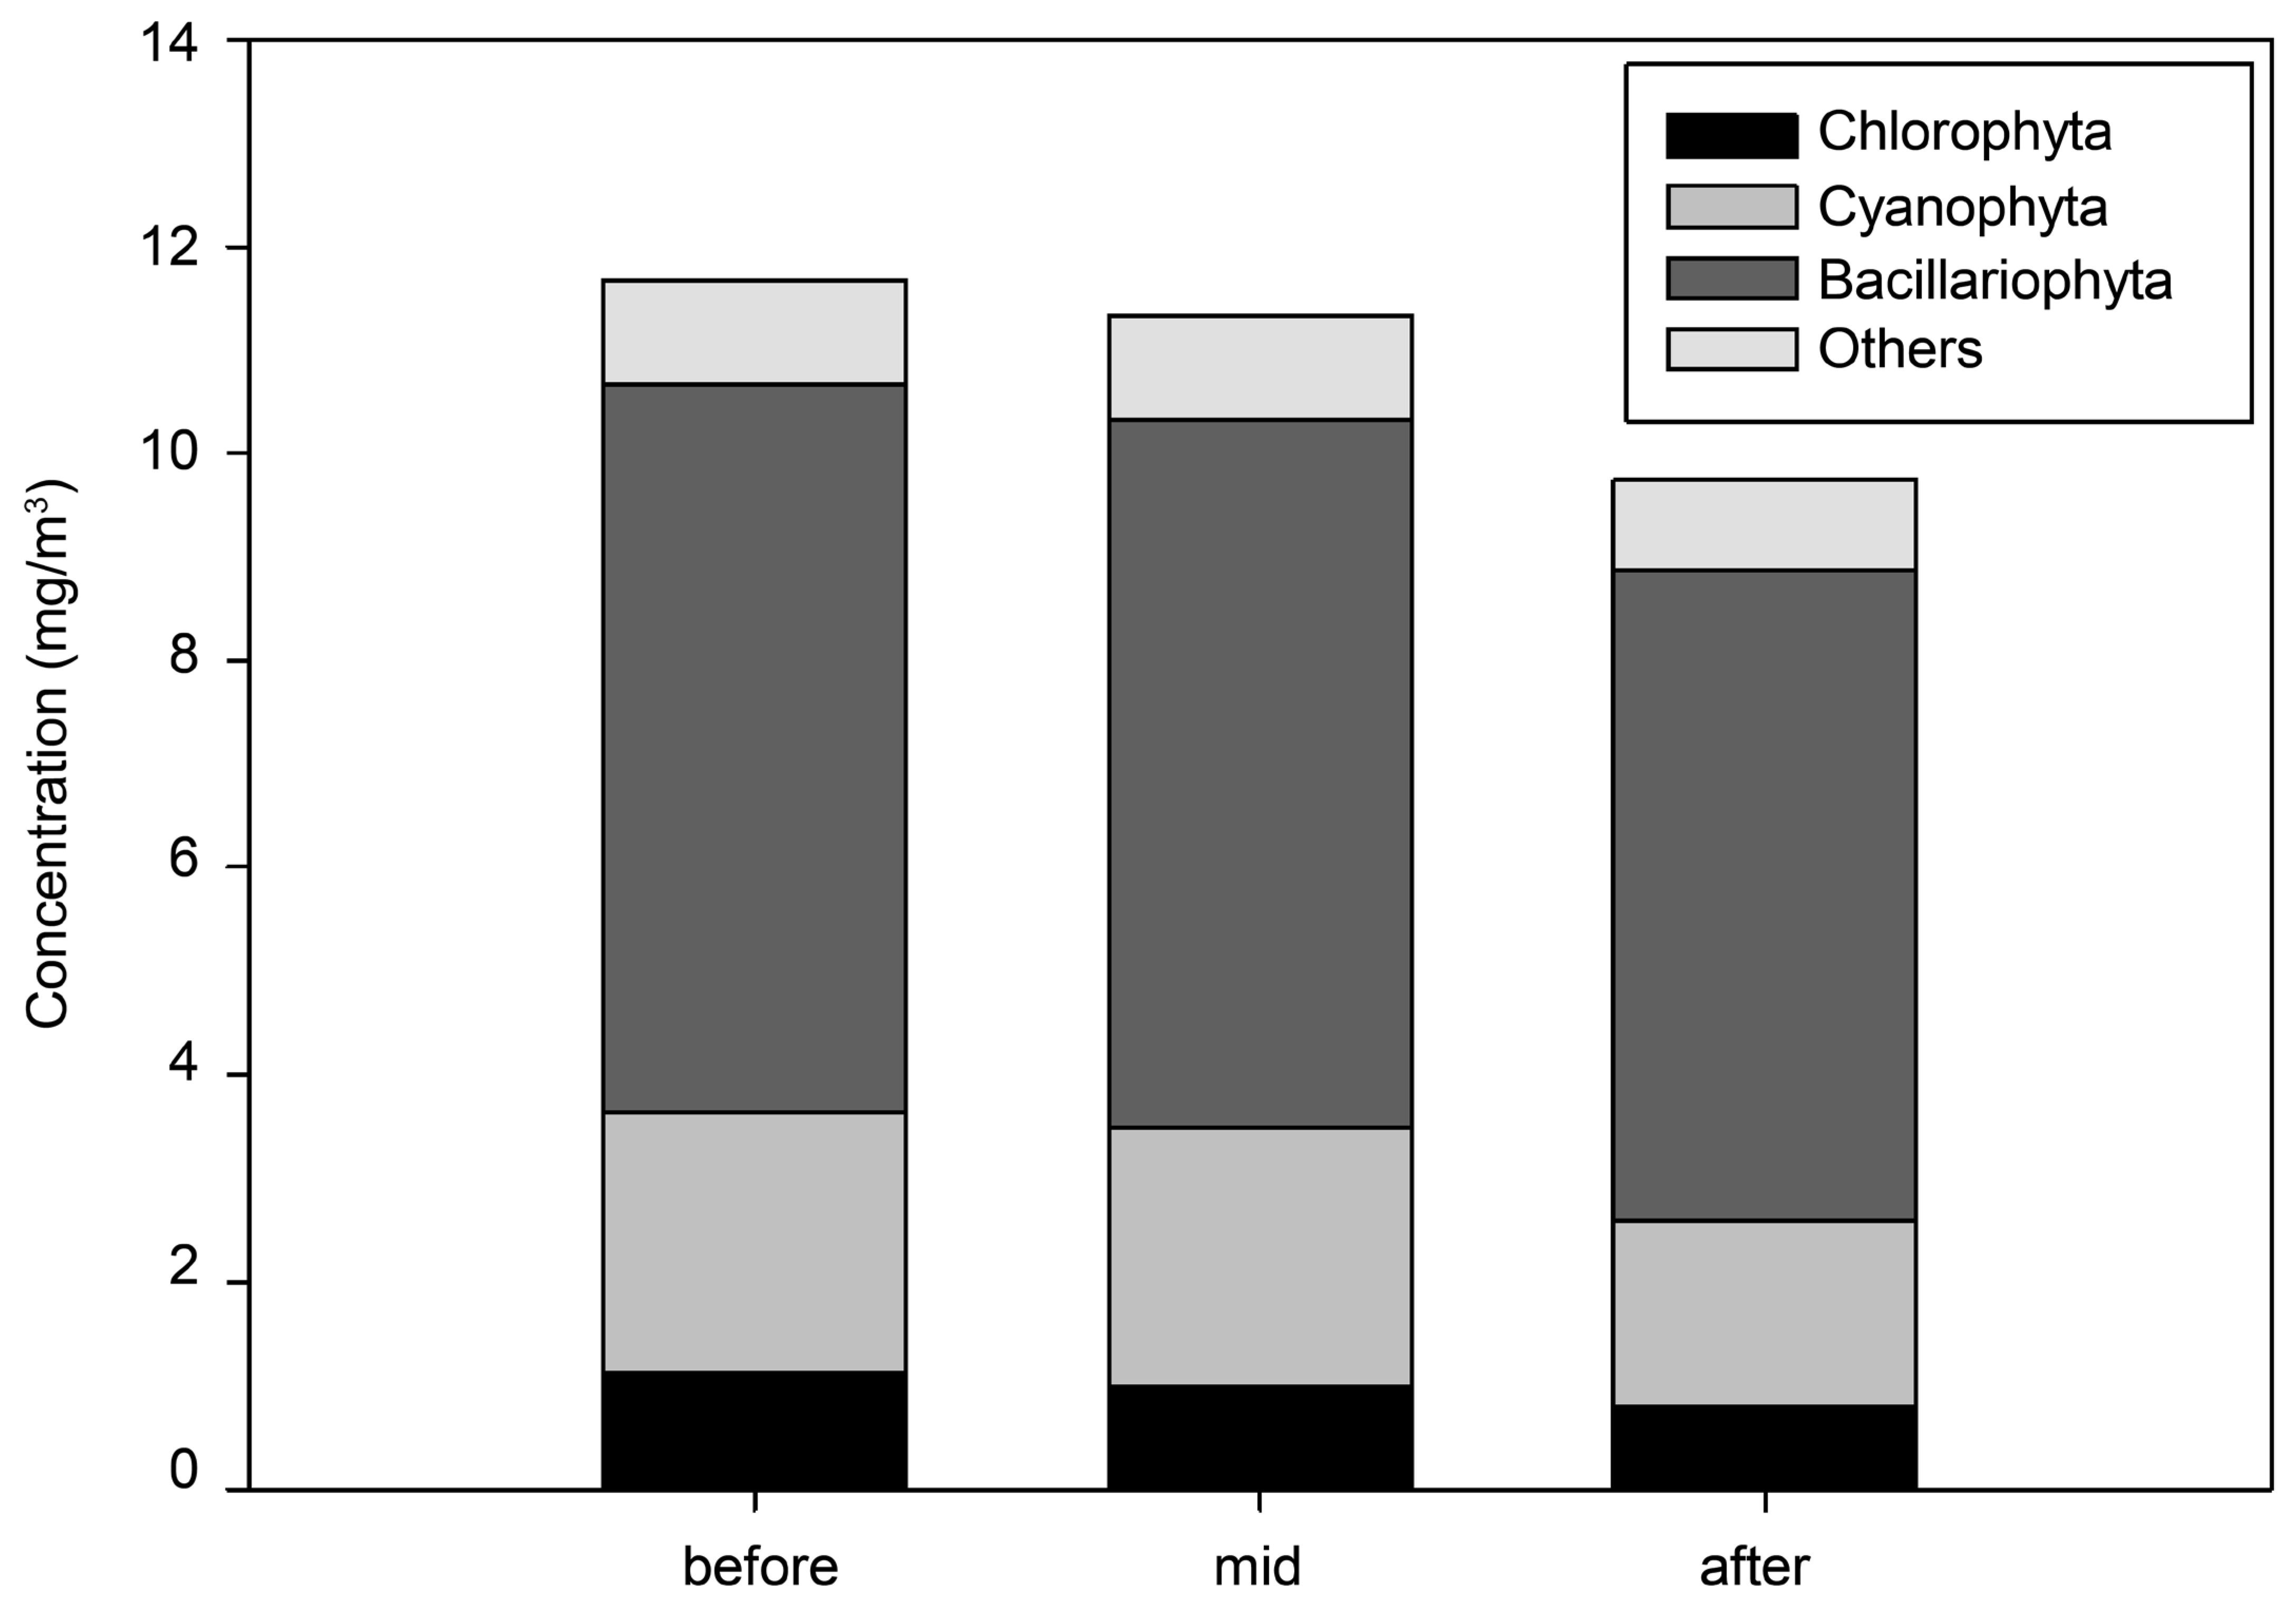
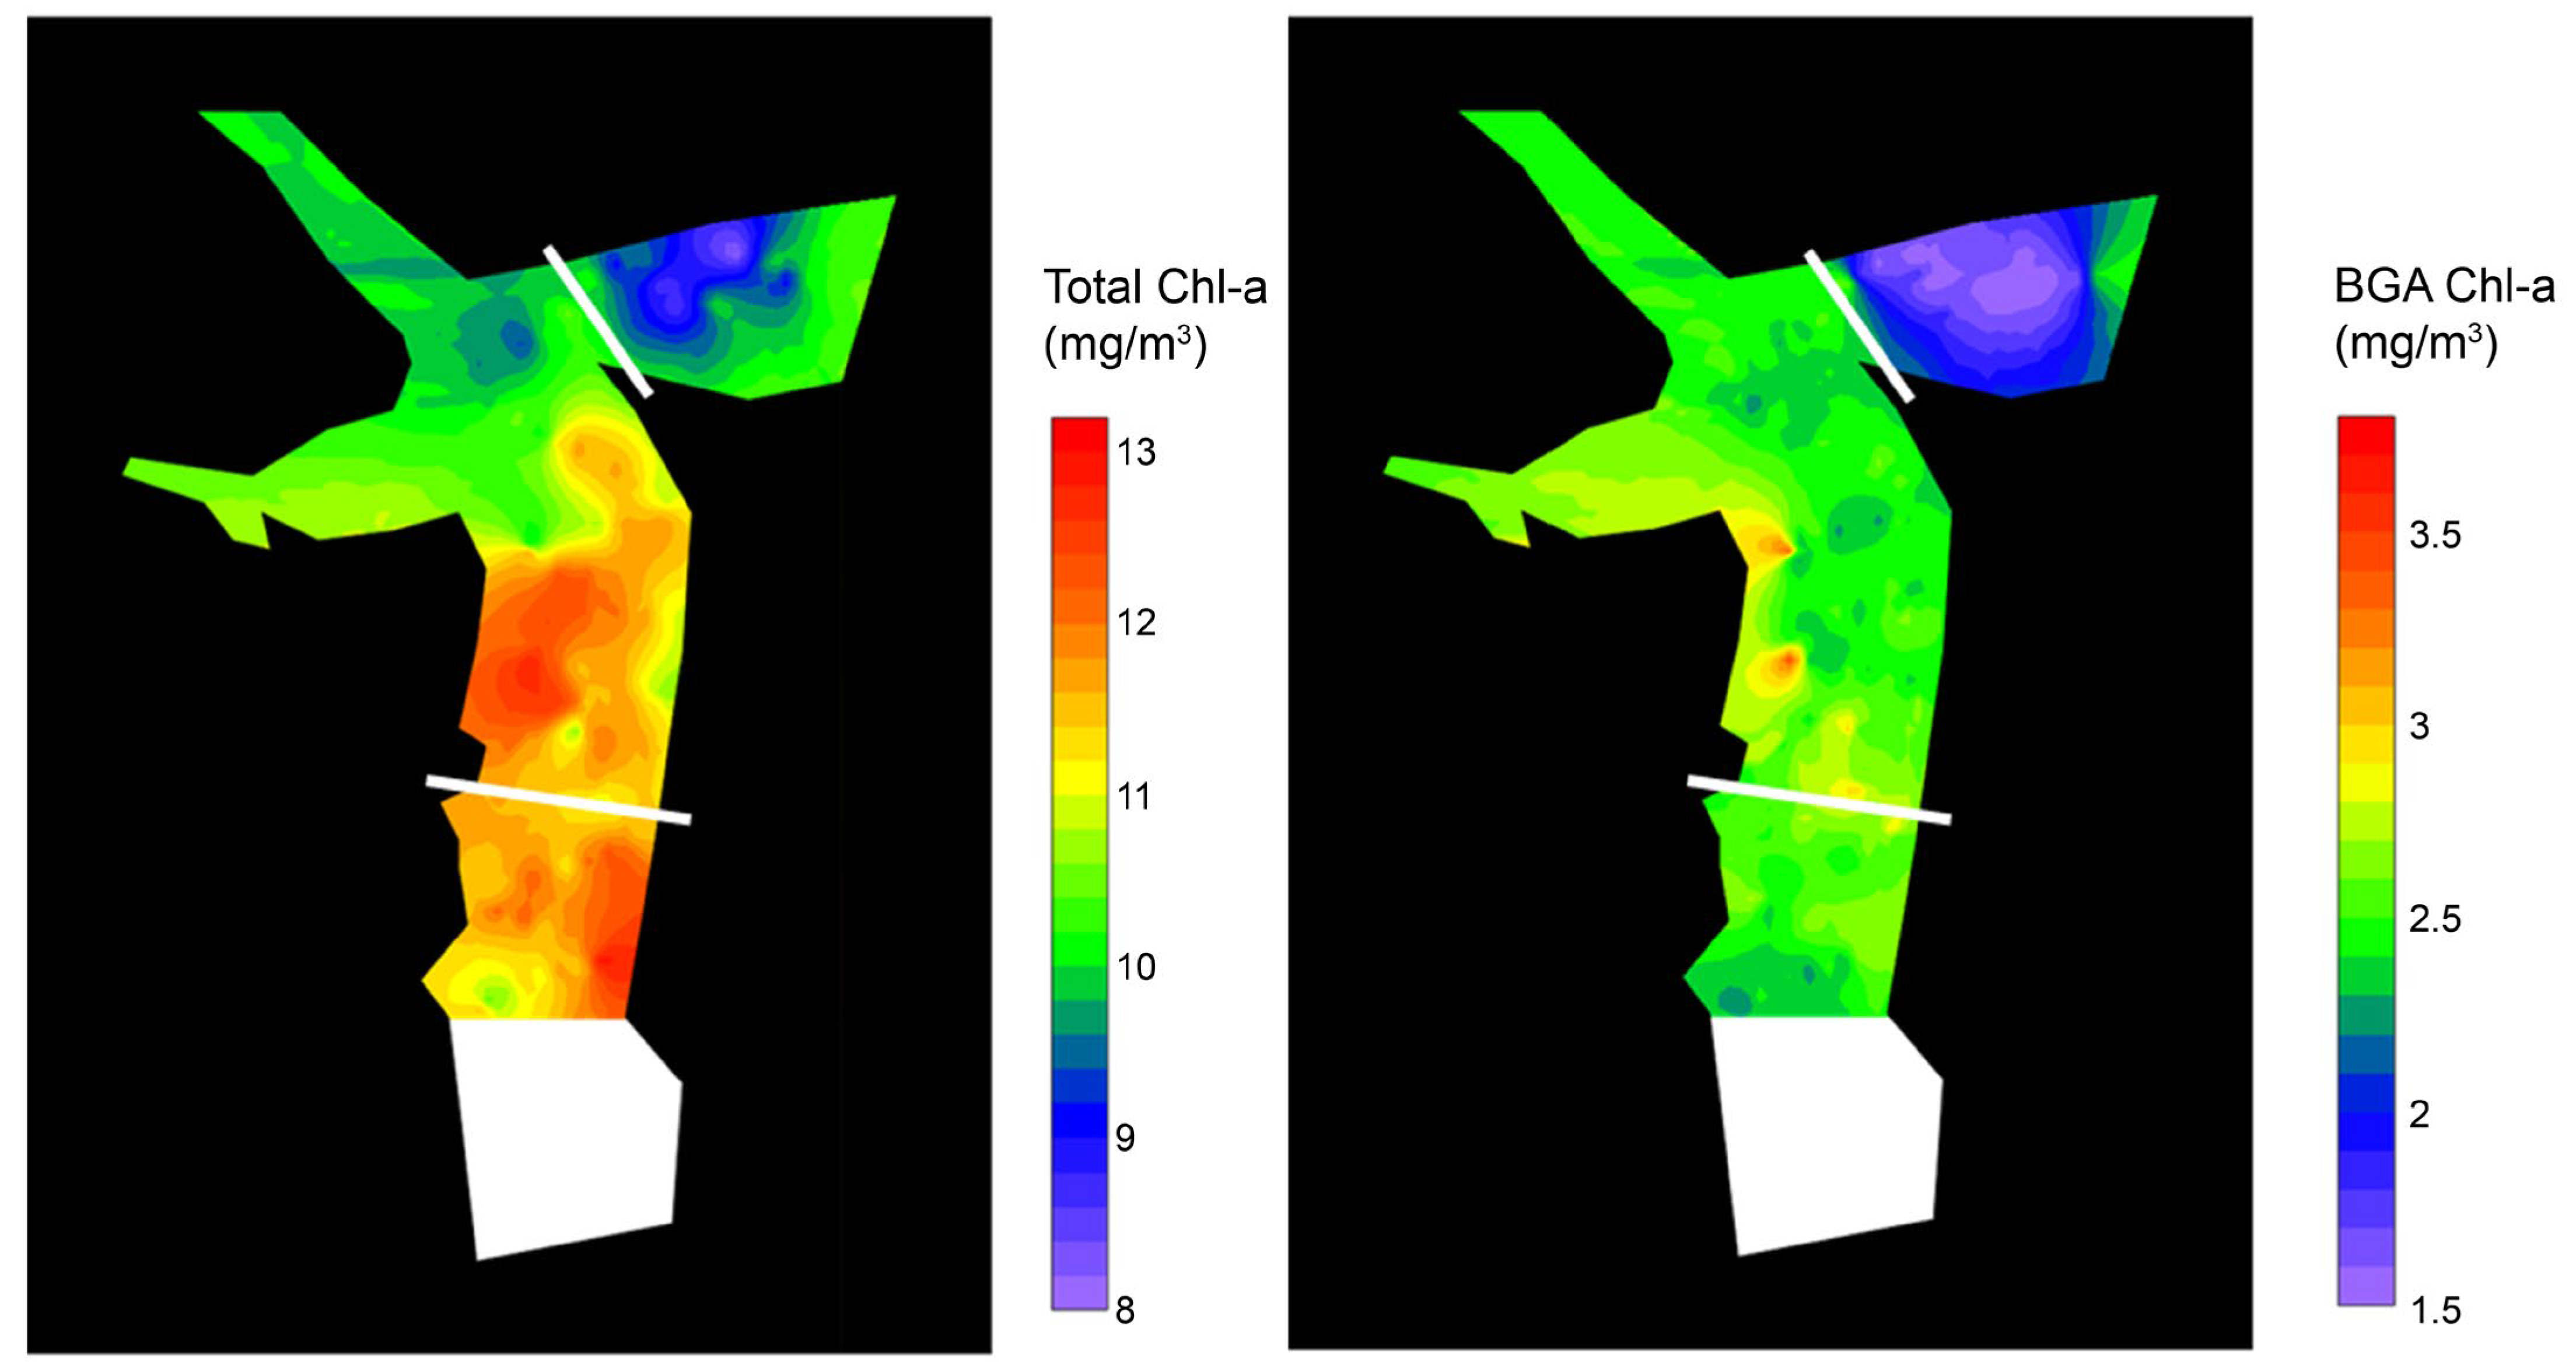
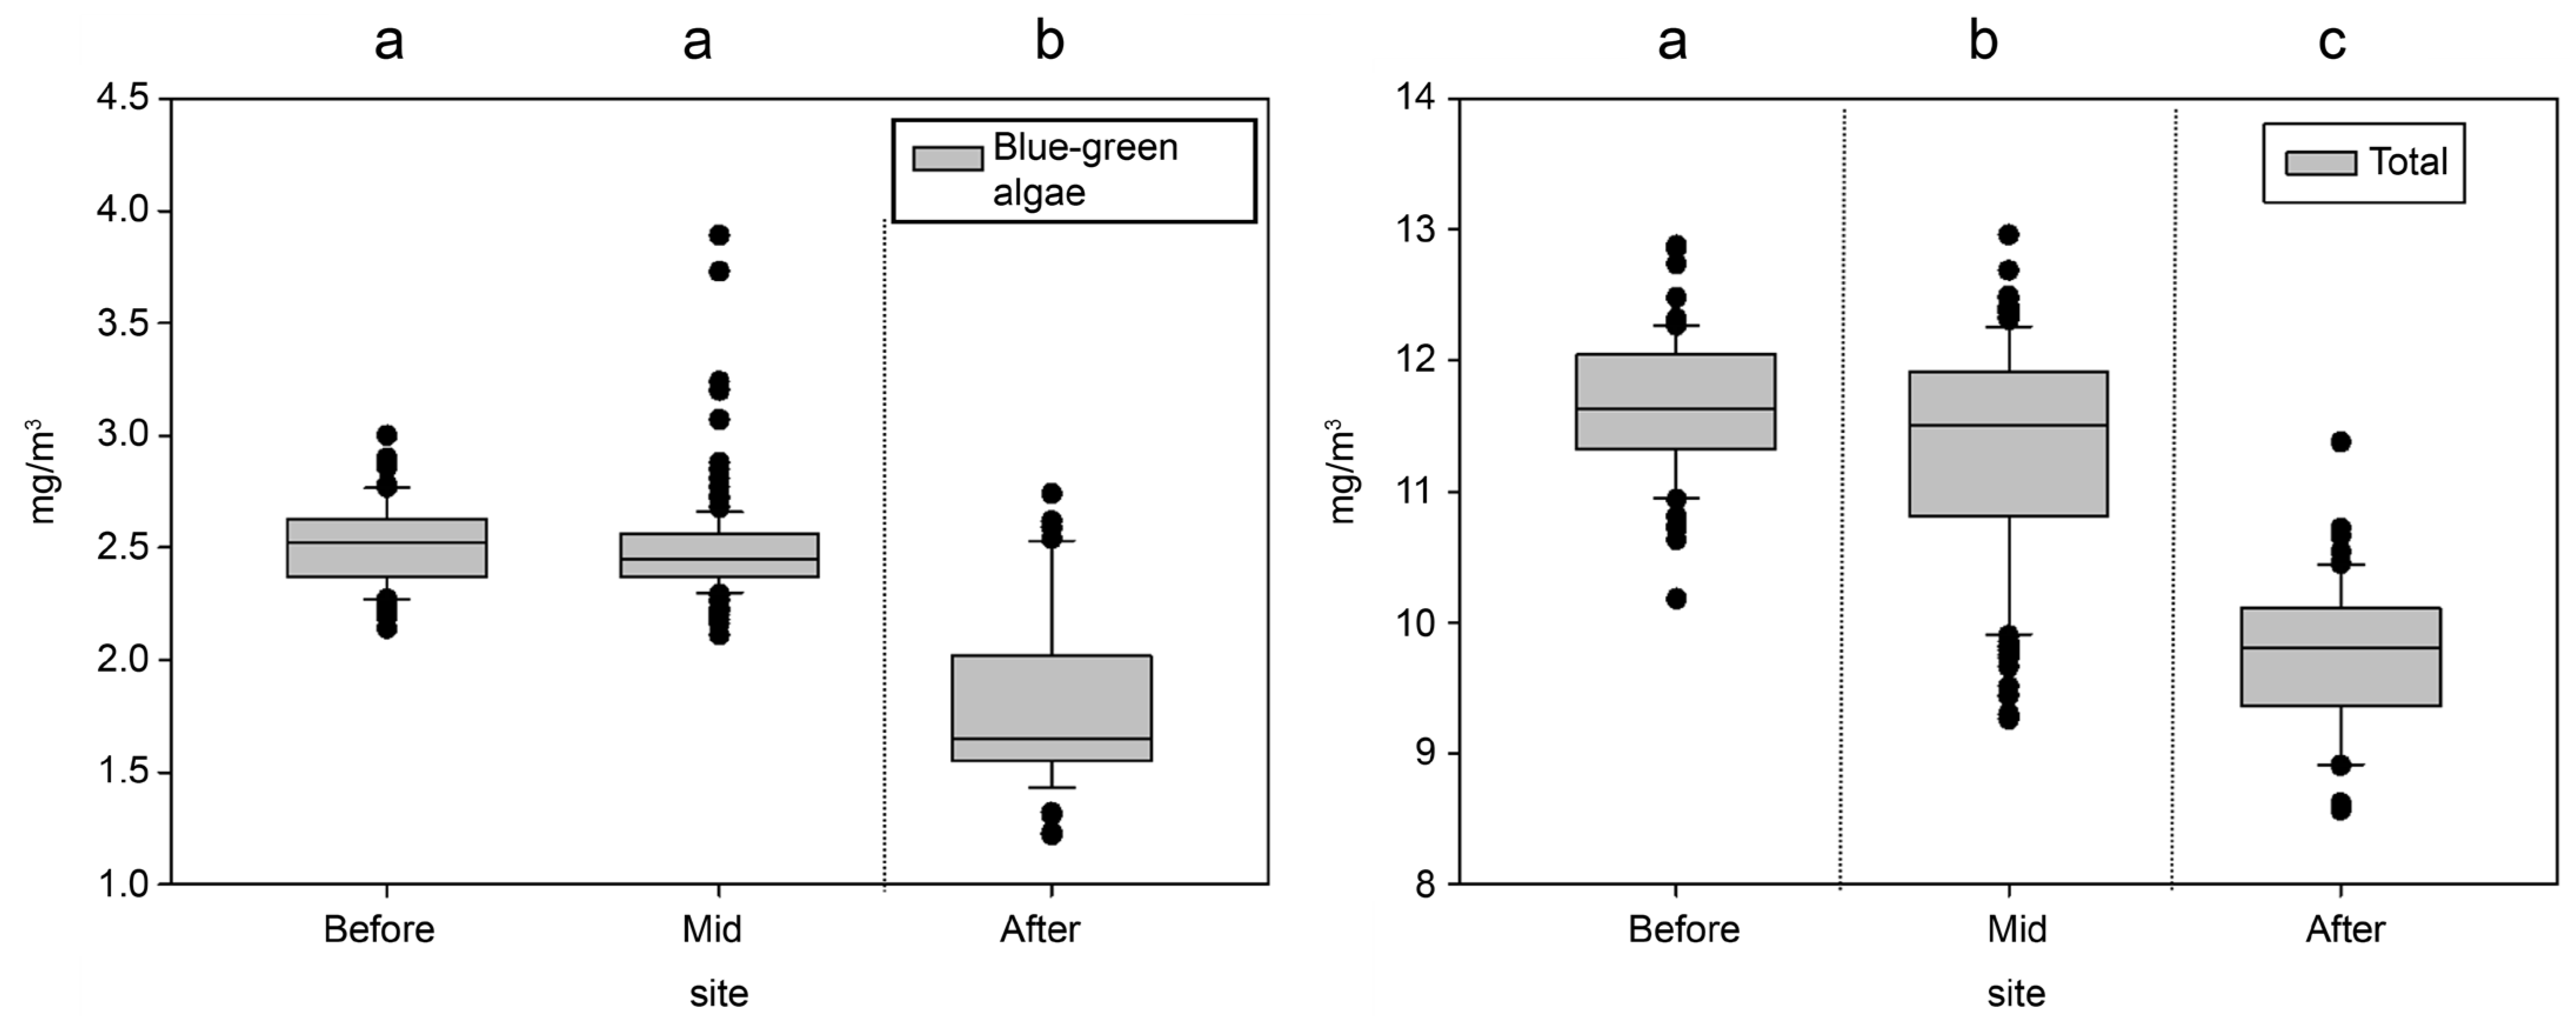
3.2. Analysis of the Spatial Effects of the Algal Fences

Four species of harmful blue-green algae were initially detected at three sites (Munui, Hoenam, and Chudong) at Daecheong Dam between May and October 2021. These algae first appeared at the dam towards the end of May and were present at all sites from June onward (Figure 4). The maximum concentration of blue-green algae was highest at the Munui site, with a maximum of 7866 cells/mL. The concentration remained high at other times of the year, except for a maximum of 1940 cells/mL at the Hoenam site, which was consistently below 1000 cells/mL. In addition, a comparison of the maximum values of the four species at each site showed that the Anabaena genus exhibited the highest values of 5614 and 2280 cells/mL at the Munui and Chudong sites, respectively. Moreover, the abundance of the Microcystis genus was the highest (1000 cells/mL) at the Hoenam site. The difference in concentrations among the survey points within Daecheong Dam was significant because of its substantial size, encompassing a reservoir area of 72.8 km2 and a total reservoir capacity of 1490 million m3 (www.water.or.kr (accessed on 22 March 2024)).
Figure 5 presents the values obtained from the FluoroProbe sensor at the algal fences installed at Daecheong Dam. Compared to the average, the distribution of diatoms (Bacillariophyta) was the highest at 60.2–64.6%, whereas that of blue-green algae (Cyanophyta) was relatively high at 18.2–22.0% of all taxa.
The depth-specific concentrations of the algal bloom were measured at two sites before (before1 and before2), two sites in between (mid1 and mid2), and three sites after (after1, after2, and after3) the fences. The mean values of the measurements at each site exhibited a distribution based on depth: 1.6–2.6 mg/m3 from the surface to 7 m, 1.9–2.4 mg/m3 between 8–14 m, and 1.1–1.7 mg/m3 from 15 m. The difference between the before- and after-fence mean values of Chl-a concentrations for blue-green algae was the highest at 3–7 m and the lowest at 8–14 m. The difference between the before- and after-fence mean values for Chl-a concentrations was the highest at 0.9 mg/m3 and the lowest at 0.4 mg/m3. As the fences were installed to a depth of 7 m, their effect below 7 m was likely reduced. The concentration of the measured values varied by as much as 0.4 mg/m3 at different points. It is necessary to increase the frequency of the measurement points to accurately evaluate efficiency because different results are obtained depending on the sampling point (Table 6).
Based on the area-by-area analysis of the surface layer, which revealed a decrease in concentration after the fence, we concluded that it effectively prevented the passage of blue-green algae downstream (Figure 6). The results of point-by-point measurements demonstrated that the values varied based on the frequency and location of the measurements. Therefore, it is advisable to conduct basin-wide measurements to obtain accurate data.
An ANOVA on the sensor values measured at each time point revealed no significant difference in blue-green algal concentrations between the before and midpoints. However, there was a significant difference after the fence. Total algae values were significantly different (p < 0.05) before, in between, and after the fences (Figure 7). This confirms that the presence of algae decreased subsequently after traversing the two fences.

3.3. Estimation of Algae Distribution by Water Depth

Given that some of the algae collected by the algal fences can be removed using a skimmer, we calculated the algal distribution to estimate the amount of removal (Table 7). The water depths at these points were measured and exhibited high consistency at 21.04–22.67 m. Therefore, the water depth was standardized to 22 m to calculate the value. The surface layer ratio varied before, in between, and after the fences. When calculating the distribution of algae at different ratio values, algae accounted for 13.2–13.6% of the total algae concentration up to a depth of 3 m and 50.6–53.9% of the total algae concentration up to depths of 10–11 m. Based on this, the algal concentration per volume by depth ranged between 2.1 and 3.7 mg/m3 before, in between, and after the fences for 0–3 m and 0.7–2.5 mg/m3 per m3. For a 22-m3 volume, corresponding to 1 m2 of surface layer × 22 m of water depth, the sum of the algae concentrations before, in between, and after the fences were 53.9, 58.9, and 43.3 mg, respectively.
When 1 m2 of the barrier’s surface layer was removed at a depth of 1 m, 2.4, 2.5, and 1.9 mg of algae were removed before, in between, and after the fences, respectively. By converting the cell counts to 551–902 cells/mL, we determined that 550,945,897–902,413,271 cells/m3 were collected.

4. Discussion

In this study, we aimed to assess the feasibility of utilizing a sensor by comparing its results with those of microscopic analysis and evaluate the efficiency of an algal fence compared to other algal control technologies.
The sum of four harmful cyanobacteria species well correlated with blue-green algal Chl-a (n = 75; r = 0.618) and total Chl-a (n = 75; r = 0.629). Moreover, the correlation with the cell count was confirmed even when other sensors were utilized. Hodges [71] demonstrated a strong correlation (r2 = 0.70~0.76) between PC and CYCLOPS-7 probes (T926 and T927) as well as the YSI sensor. In addition, a study on temperature differences revealed that at 4 °C, the temperature at which most blue-green algae are dominant, fluorescence values for the same cell count were similarly measured at medium and high concentrations. This confirms that sensors can be effectively utilized in the field.
Brient [2] showed a significant correlation (r2 = 0.73, n = 800) between phycocyanin and blue-green algal biomass when measured using the TriOS microFlu-blue sensor (TriOS Optical Sensor, Rastede, Germany). Moreover, the limits of detection and quantification (LQ) of Planktothrix agardhii cultures were 0.531 μg/L, equivalent to approximately 1700 cells/mL when converted to cell count. In Kong et al. [72], the relationship between blue-green algal fluorescence and cell concentration was strongly correlated, with r2 = 0.9. Similarly, the correlation with biovolume was also high, with r2 = 0.9. The relationship remained strong after bloom formation, with r2 = 0.8. However, the correlation was stronger before bloom formation (r2 = 0.9).
Sensor-specific differences are unlikely to be an issue for evaluating algal control technologies employing the same sensor at the same location, and sensor-based measurements can adequately substitute spectrophotometric measurements [73].
In addition, depending on the environmental influences [2,74,75,76], studies have shown that fluorescence can be affected by turbidity or other algae [22]. A study using a submersible fluorescent phycocyanin probe also showed that measuring phycocyanin fluorescence in situ may be ineffective when turbidity exceeds 50 NTU. Furthermore, the spectrum of blue-green algae is influenced by ambient conditions; therefore, environmental and technical interference must be considered when utilizing sensors [69].
The correlation between blue-green algae and sensors in the field can vary depending on the region or time of year. This is because the pigment ratios within a species are influenced by factors such as the light regime, nutrients, physiological state (e.g., growth stage), phylogenetic dominance, and other environmental conditions [65,69,77,78,79]. Various species coexist in the field, making it difficult to accurately determine their biomass. Furthermore, even within the same species, phycocyanin concentrations show higher phycocyanin values as cells age [80] and lower phycocyanin contents at higher growth rates [81].
However, in the presence of a single species, both biovolume and cell counts were highly correlated [82]. Given that periods of algal control are typically dominated by a single species (e.g., the genus Microcystis) and occur at the same time of year (e.g., log phase and death phase), sensors can be utilized and evaluated in the field. In this study, microscopic analysis of Bohyeonsan Dam showed that the genus Microcystis was observed 36 times across 75 surveys. Furthermore, it was identified as the dominant species in 22 instances.
Sensors can monitor water quality changes consistently and continuously [83,84]. To fully understand the impacts of eutrophication, large-scale systems, sophisticated modeling approaches, and long-term time series data are needed [8]; therefore, sensors can be an effective tool. Researchers have conducted studies on sensors that target specific species and their byproducts, such as toxins or odorants [42,67,76]; however, further research is required before sensors can assess algal control.
In this study, we found that diatom concentrations were higher than Chl-a concentrations of blue-green algae. Although blue-green algae concentrations were not high in the upper layers due to differences in algal species characteristics, these algae have the ability to form scum under conditions of increased temperatures and reduced wind mixing [85]. This enables the elimination of algae in the upper layers, which is linked to treatment costs and requires precise quantification. Furthermore, advances in automation technology have made it possible to increase the frequency of depth and area measurements. Consequently, the quantity of algae collected can be estimated in advance by employing skimmers or algaecide boats to remove algae and utilizing sensors to monitor the removal process.
By utilizing the data values on the area between the fences at our survey site, we compared the differences in algal concentrations based on depth using the results of the 2020 survey at the Daecheong Dam gate. In July, blue-green algae concentrations were low, at 0–0.9 mg/m3; however, in August and September, algae were highly distributed in the surface layer, at 19.8 and 21.3 mg/m3, respectively. Below 3 m, blue-green algae concentrations decreased sharply to 2.0 and 2.6 mg/m3 in August and September, respectively. Up to 3 m depth, the percentage of total algal concentrations varied with water depth, reaching 18.9, 86.8, and 86.3% in July, August, and September, respectively. Our results confirmed that most of the blue-green algae were distributed within 3 m in August and September; therefore, it is expected that the collection efficiency of algae from scum formation in summer is higher for the same depth. The installation of algal fences at alert monitoring sites is expected to potentially impact alert levels based on the cell count concentration prior to the installation of such fences.
However, devices that remove algae by circulating water, such as water circulation devices and water surface disposal devices, are not suitable for accurately determining the quantity of algae based on depth. This is because the quantity of algae can vary over time depending on various factors, such as the device’s operating time in the water body and the pump’s capacity. Therefore, it is imperative to determine the radius of the experimental group based on the area of the surface layer and evaluate depth-specific data to compare the distribution with the control group.
Current domestic algae alert monitoring has limitations that restrict its frequency to twice a week. However, laboratory sensor experiments correlate well with algal and cyanobacterial abundance and can be used for real-time in-situ water management [77]. Currently, research on water quality monitoring utilizes unmanned surface vehicles, and technology capable of acquiring real-time data is continuously being developed. Consequently, the frequency of algal monitoring using sensors is expected to increase [86]. Therefore, Chl-a and PC sensors can be utilized as complementary measurement tools to manage blue-green algae, including the four harmful cyanobacteria currently under management in South Korea.
Different management strategies must be established for individual watersheds to manage blue-green algae [9]. Species analysis using sensors yields less accurate results than microscopic analysis and may be subject to environmental and physiological influences. Additionally, although more verification related to sensors has to be performed, sensors are the most efficient for use in three-dimensional analysis.
From this perspective, the results of this study can be utilized to evaluate the efficiency of algal fences in basins and calculate the quantity of algae collected.

Author Contributions

Conceptualization, Y.-J.P., H.-S.K. and H.-S.L.; formal analysis, Y.-J.P. and S.-J.L.; investigation, D.-H.J. and S.-J.Y.; data curation, H.-S.Y.; writing—original draft preparation, Y.-J.P., S.-J.L., H.-S.K. and H.-S.L.; writing—review and editing, H.-S.Y., S.-J.Y., H.-S.K. and H.-S.L.; visualization, D.-H.J.; supervision, H.-S.K. and H.-S.L. All authors have read and agreed to the published version of the manuscript.

Funding

This work was supported by the Korea Water Resources Corporation (No. M180079 and G230159).

Data Availability Statement

All available data are contained within the article.

Conflicts of Interest

The authors declare no competing financial interests. The sponsor had no role in the design, execution, interpretation, or writing of the study.

References

  1. Graham, L.E.; Graham, J.E.; Wilcox, L.W. Algae, 2nd ed.; Pearson Education: London, UK, 2009. [Google Scholar]
  2. Brient, L.; Lengronne, M.; Bertrand, E.; Rolland, D.; Sipel, A.; Steinmann, D.; Baudin, I.; Legeas, M.; Le Rouzic, B.; Bormans, M.; et al. A phycocyanin probe as a tool for monitoring cyanobacteria in freshwater bodies. J. Environ. Monit. 2008, 10, 248–255. [Google Scholar] [CrossRef]
  3. Mohamed, H.I.; El-Beltagi, H.E.-D.S.; Abd-Elsalam, K.A. Plant Growth-Promoting Microbes for Sustainable Biotic and Abiotic Stress Management; Springer: Berlin/Heidelberg, Germany, 2021. [Google Scholar]
  4. Kang, J.-J.; Min, J.-O.; Kim, Y.; Lee, C.-H.; Yoo, H.; Jang, H.-K.; Kim, M.-J.; Oh, H.-J.; Lee, S.-H.; Oh, H.-J.; et al. Vertical distribution of phytoplankton community and pigment production in the Yellow Sea and the East China sea during the late summer season. Water 2021, 13, 3321. [Google Scholar] [CrossRef]
  5. O’Neil, J.M.; Davis, T.W.; Burford, M.A.; Gobler, C.J. The rise of harmful cyanobacteria blooms: The potential roles of eutrophication and climate change. Harmful Algae 2012, 14, 313–334. [Google Scholar] [CrossRef]
  6. Paerl, H.W.; Gardner, W.S.; Havens, K.E.; Joyner, A.R.; McCarthy, M.J.; Newell, S.E.; Qin, B.; Scott, J.T.; Scott, J.T. Mitigating cyanobacterial harmful algal blooms in aquatic ecosystems impacted by climate change and anthropogenic nutrients. Harmful Algae 2016, 54, 213–222. [Google Scholar] [CrossRef]
  7. Xu, H.; Tan, X.; Liang, J.; Cui, Y.; Gao, Q. Impact of agricultural non-point source pollution on river water quality: Evidence from China. Front. Ecol. Evol. 2022, 10, 858822. [Google Scholar] [CrossRef]
  8. Bonsdorff, E. Eutrophication: Early warning signals, ecosystem-level and societal responses, and ways forward: This article belongs to Ambio’s 50th Anniversary Collection. Theme: Eutrophication. Ambio 2021, 50, 753–758. [Google Scholar] [CrossRef] [PubMed]
  9. Paerl, H.W.; Paul, V.J. Climate change: Links to global expansion of harmful cyanobacteria. Water Res. 2012, 46, 1349–1363. [Google Scholar] [CrossRef] [PubMed]
  10. Munoz, M.; Cirés, S.; de Pedro, Z.M.; Colina, J.Á.; Velásquez-Figueroa, Y.; Carmona-Jiménez, J.; Caro-Borrero, A.; Salazar, A.; Santa María Fuster, M.C.; Contreras, D.; et al. Overview of toxic cyanobacteria and cyanotoxins in Ibero-American freshwaters: Challenges for risk management and opportunities for removal by advanced technologies. Sci. Total Environ. 2021, 761, 143197. [Google Scholar] [CrossRef]
  11. Wiley, D.Y.; McPherson, R.A. The role of climate change in the proliferation of freshwater harmful algal blooms in inland water bodies of the United States. Earth Interact. 2024, 28, e230008. [Google Scholar] [CrossRef]
  12. Hamilton, D.P.; Wood, S.A.; Dietrich, D.R.; Puddick, J. Costs of Harmful Blooms of Freshwater Cyanobacteria. Cyanobacteria: An Economic Perspective; Wiley-Blankwell: Hoboken, NJ, USA, 2014; pp. 245–256. [Google Scholar]
  13. Almuhtaram, H.; Kibuye, F.A.; Ajjampur, S.; Glover, C.M.; Hofmann, R.; Gaget, V.; Owen, C.; Wert, E.C.; Zamyadi, A.; Wert, E.C.; et al. State of knowledge on early warning tools for cyanobacteria detection. Ecol. Indic. 2021, 133, 108442. [Google Scholar] [CrossRef]
  14. Catherine, A.; Escoffier, N.; Belhocine, A.; Nasri, A.B.; Hamlaoui, S.; Yéprémian, C.; Bernard, C.; Troussellier, M.; Troussellier, M. On the use of the FluoroProbe®, a phytoplankton quantification method based on fluorescence excitation spectra for large-scale surveys of lakes and reservoirs. Water Res. 2012, 46, 1771–1784. [Google Scholar] [CrossRef] [PubMed]
  15. Pilon, S.; Zastepa, A.; Taranu, Z.E.; Gregory-Eaves, I.; Racine, M.; Blais, J.M.; Poulain, A.J.; Pick, F.R.; Pick, F.R. Contrasting histories of microcystin-producing cyanobacteria in two temperate lakes as inferred from quantitative sediment DNA analyses. Lake Reserv. Manag. 2019, 35, 102–117. [Google Scholar] [CrossRef]
  16. Thawabteh, A.M.; Naseef, H.A.; Karaman, D.; Bufo, S.A.; Scrano, L.; Karaman, R. Understanding the risks of diffusion of cyanobacteria toxins in Rivers, lakes, and potable water. Toxins 2023, 15, 582. [Google Scholar] [CrossRef] [PubMed]
  17. Trainer, V.L.; Hardy, F.J. Integrative monitoring of marine and freshwater harmful algae in Washington State for public health protection. Toxins 2015, 7, 1206–1234. [Google Scholar] [CrossRef] [PubMed]
  18. Zhou, B.; Shang, M.; Wang, G.; Feng, L.; Shan, K.; Liu, X.; Wu, L.; Zhang, X.; Zhang, X. Remote estimation of cyanobacterial blooms using the risky grade index (RGI) and coverage area index (CAI): A case study in the Three Gorges Reservoir, China. Environ. Sci. Pollut. Res. Int. 2017, 24, 19044–19056. [Google Scholar] [CrossRef] [PubMed]
  19. GAO. Water Quality: Agencies Should Take More Actions to Manage Risks from Harmful Algal Blooms and Hypoxia. 2022. Available online: https://www.gao.gov/products/gao-22-104449 (accessed on 11 March 2024).
  20. Newton, A.R.; Melaram, R. Harmful algal blooms in agricultural irrigation: Risks, benefits, and management. Front. Water 2023, 5, 1325300. [Google Scholar] [CrossRef]
  21. Paerl, H.W.; Otten, T.G.; Kudela, R. Mitigating the Expansion of Harmful Algal Blooms across the Freshwater-to-Marine Continuum; ACS Publications: Washington, DC, USA, 2018. [Google Scholar]
  22. Bowling, L.; Ryan, D.; Holliday, J.; Honeyman, G. Evaluation of in situ fluorometry to determine cyanobacterial abundance in the Murray and Lower Darling Rivers, Australia. River Res. Appl. 2013, 29, 1059–1071. [Google Scholar] [CrossRef]
  23. Directive, W.F. Common Implementation Strategy for the Water Framework Directive (2000/60/EC); Guidance document 7; European Communities: Brussels, Belgium, 2003. [Google Scholar]
  24. Chorus, I.; Welker, M. Toxic Cyanobacteria in Water: A Guide to Their Public Health Consequences, Monitoring and Management; Taylor & Francis: Abingdon, UK, 2021. [Google Scholar]
  25. Song, L.; Jia, Y.; Qin, B.; Li, R.; Carmichael, W.W.; Gan, N.; Xu, H.; Shan, K.; Sukenik, A.; Shan, K.; et al. Harmful cyanobacterial blooms: Biological traits, mechanisms, risks, and control strategies. Annu. Rev. Environ. Resour. 2023, 48, 123–147. [Google Scholar] [CrossRef]
  26. Dos Santos Severiano, J.; dos Santos Almeida-Melo, V.L.; Bittencourt-Oliveira, M.D.C.; Chia, M.A.; do Nascimento Moura, A. Effects of increased zooplankton biomass on phytoplankton and cyanotoxins: A tropical mesocosm study. Harmful Algae 2018, 71, 10–18. [Google Scholar] [CrossRef]
  27. Neetu Shahi, S.R.; Richa Pathak, S.K.M.; Veena Pande, B.S. Biocontrol of toxin producing cyanobacterium Microcystis aeruginosa by algicidal bacterium Exiguobacterium acetylicum Strain TM2 isolated from mid-altitudinal Himalayan lake of Northern India. Int. J. Curr. Microbiol. Appl. Sci. 2021, 10, 170–187. [Google Scholar] [CrossRef]
  28. Oh, K.-H.; Jeong, D.-H.; Yang, S.-Y.; Jeon, T.-W.; Cho, Y.-C. Effects of submerged aerator on the growth of algae in Daechung reservoir. J. Korean Soc. Environ. Eng. 2013, 35, 268–275. [Google Scholar] [CrossRef]
  29. Hasan, K.; Alam, K.; Chowdhury, M.S.A. The use of an aeration system to prevent thermal stratification of water bodies: Pond, lake, and water supply reservoir. Appl. Ecol. Environ. Sci. 2014, 2, 1–7. [Google Scholar] [CrossRef]
  30. Jang, M.-H.; Park, S.-B.; Jung, J.-M.; Roh, J.-S.; Joo, G.-J. The application of an algal fence for the reduction of algal intake into the water intake facility. Korean J. Ecol. Environ. 2003, 36, 467–472. [Google Scholar]
  31. Mejica, B.N.; Ebert, D.A.; Tanaka, S.K.; Deas, M.L. Managing cyanobacteria with a water quality control curtain in Iron Gate Reservoir, California. Lake Reserv. Manag. 2023, 39, 291–310. [Google Scholar] [CrossRef]
  32. Yang, Z.; Gao, B.; Yue, Q. Coagulation performance and residual aluminum speciation of Al2(SO4)3 and polyaluminum chloride (PAC) in Yellow River water treatment. Chem. Eng. J. 2010, 165, 122–132. [Google Scholar] [CrossRef]
  33. Sengco, M.R.; Anderson, D.M. Controlling harmful algal blooms through clay flocculation. J. Eukaryot. Microbiol. 2004, 51, 169–172. [Google Scholar] [CrossRef]
  34. Lee, C.S.; Ahn, C.-Y.; La, H.-J.; Lee, S.; Oh, H.-M. Technical and strategic approach for the control of cyanobacterial bloom in fresh waters. Korean J. Environ. Biol. 2013, 31, 233–242. [Google Scholar] [CrossRef]
  35. Lee, H.-S.; Jeong, G.-W.; Choi, C.; Ahn, G.; Nah, J.-W. Flocculation and algicidal effect of mixture of red-soil or clay and chitosan against harmful green-tide. J. Chitin Chitosan 2017, 22, 47–53. [Google Scholar] [CrossRef]
  36. Chow, C.W.K.; Drikas, M.; House, J.; Burch, M.D.; Velzeboer, R.M.A. The impact of conventional water treatment processes on cells of the cyanobacterium Microcystis aeruginosa. Water Res. 1999, 33, 3253–3262. [Google Scholar] [CrossRef]
  37. Oh, H.-S.; Kang, S.-H.; Yang, S.-C.; Nam, S.-H.; Kim, E.-J.; Hwang, T.-M. Comparison of different type coagulants for the removal of harmful algae in Pilot scale cyclonic-DAF system. KSWST J. Water Treat. 2018, 26, 69–80. [Google Scholar] [CrossRef]
  38. Chen, J.-J.; Yeh, H.-H.; Tseng, I.-C. Effect of ozone and permanganate on algae coagulation removal–Pilot and bench scale tests. Chemosphere 2009, 74, 840–846. [Google Scholar] [CrossRef] [PubMed]
  39. Castro-Jiménez, C.C.; Grueso-Domínguez, M.C.; Correa-Ochoa, M.A.; Saldarriaga-Molina, J.C.; García, E.F. A coagulation process combined with a multi-stage filtration system for drinking water treatment: An alternative for small communities. Water 2022, 14, 3256. [Google Scholar] [CrossRef]
  40. Ho, L.; Lambling, P.; Bustamante, H.; Duker, P.; Newcombe, G. Application of powdered activated carbon for the adsorption of cylindrospermopsin and microcystin toxins from drinking water supplies. Water Res. 2011, 45, 2954–2964. [Google Scholar] [CrossRef] [PubMed]
  41. Bosse, K.R.; Sayers, M.J.; Shuchman, R.A.; Fahnenstiel, G.L.; Ruberg, S.A.; Fanslow, D.L.; Stuart, D.G.; Johengen, T.H.; Burtner, A.M.; Johengen, T.H.; et al. Spatial-temporal variability of in situ cyanobacteria vertical structure in western Lake Erie: Implications for remote sensing observations. J. Great Lakes Res. 2019, 45, 480–489. [Google Scholar] [CrossRef]
  42. Bertone, E.; O’halloran, K. Analysis and modelling of taste and odour events in a shallow subtropical reservoir. Environments 2016, 3, 22. [Google Scholar] [CrossRef]
  43. Visser, P.M.; Ibelings, B.W.; Bormans, M.; Huisman, J. Artificial mixing to control cyanobacterial blooms: A review. Aquat. Ecol. 2016, 50, 423–441. [Google Scholar] [CrossRef]
  44. Leboulanger, C.; Dorigo, U.; Jacquet, S.; Le Berre, B.; Paolini, G.; Humbert, J.F. Application of a submersible spectrofluorometer for rapid monitoring of freshwater cyanobacterial blooms: A case study. Aquat. Microb. Ecol. 2002, 30, 83–89. [Google Scholar] [CrossRef]
  45. Znachor, P.; Zapomělová, E.; Řeháková, K.; Nedoma, J.; Šimek, K. The effect of extreme rainfall on summer succession and vertical distribution of phytoplankton in a lacustrine part of a eutrophic reservoir. Aquat. Sci. 2008, 70, 77–86. [Google Scholar] [CrossRef]
  46. Hart, R.C.; Wragg, P.D. Recent blooms of the dinoflagellate Ceratium in Albert Falls Dam (KZN): History, causes, spatial features and impacts on a reservoir ecosystem and its zooplankton. Water S A 2009, 35, 455–468. [Google Scholar] [CrossRef]
  47. Ziemińska-Stolarska, A.; Imbierowicz, M.; Jaskulski, M.; Szmidt, A.; Zbiciński, I. Continuous and periodic monitoring system of surface water quality of an impounding reservoir: Sulejow Reservoir, Poland. Int. J. Environ. Res. Public Health 2019, 16, 301. [Google Scholar] [CrossRef]
  48. Heo, W.-M.; Kim, B. The effect of artificial destratification on phytoplankton in a reservoir. Hydrobiologia 2004, 524, 229–239. [Google Scholar] [CrossRef]
  49. Gao, S.; Du, M.; Tian, J.; Yang, J.; Yang, J.; Ma, F.; Nan, J. Effects of chloride ions on electro-coagulation-flotation process with aluminum electrodes for algae removal. J. Hazard. Mater. 2010, 182, 827–834. [Google Scholar] [CrossRef] [PubMed]
  50. Visser, P.; Ibelings, B.; Van Der Veer, B.; Koedood, J.; Mur, R. Artificial mixing prevents nuisance blooms of the cyanobacterium Microcystis in Lake Nieuwe Meer, the Netherlands. Freshw. Biol. 1996, 36, 435–450. [Google Scholar] [CrossRef]
  51. Lee, H.-S.; Jeong, G.-W.; Choi, C.; Nah, J.-W. Flocculation and algicidal effect of harmful green-tide according to molecular-weight of chitosan. Polymer-Korea 2017, 41, 561–568. [Google Scholar] [CrossRef]
  52. Jang, Y.-J.; Jung, J.-H.; Lim, H.-M.; Yoon, Y.H.; Ahn, K.-H.; Chang, H.-Y.; Kim, W.-J. Decision algorithm of natural algae coagulant dose to control algae from the influent of water works. J. Korea Soc. Environ. Eng. 2016, 38, 482–496. [Google Scholar] [CrossRef]
  53. Lee, B.; Oh, H.-C.; Ahn, J.-H.; Kim, Y.; Kang, H.; Kim, S.-K. Algae and nutrient control by using the mineralized coagulant. KSWST J. Water Treat. 2018, 26, 45–52. [Google Scholar] [CrossRef]
  54. Jeong, K.; Kim, D.-G.; Kim, S.-K.; Kim, W.-J.; Ko, S.-O. Evaluation of operation parameters for the removal of algae by electro-coagulation. J. Korean Soc. Water Environ. 2015, 31, 94–102. [Google Scholar] [CrossRef]
  55. Lürling, M.; van Oosterhout, F. Case study on the efficacy of a lanthanum-enriched clay (Phoslock®) in controlling eutrophication in Lake Het Groene Eiland (The Netherlands). Hydrobiologia 2013, 710, 253–263. [Google Scholar] [CrossRef]
  56. Schaus, M.H.; Vanni, M.J. Effects of gizzard shad on phytoplankton and nutrient dynamics: Role of sediment feeding and fish size. Ecology 2000, 81, 1701–1719. [Google Scholar] [CrossRef]
  57. Robb, M.; Greenop, B.; Goss, Z.; Douglas, G.; Adeney, J. Application of Phoslock TM, an innovative phosphorus binding clay, to two Western Australian waterways: Preliminary findings. In Interact between Sediments Water; Springer: Berlin/Heidelberg, Germany, 2003; pp. 237–243. [Google Scholar]
  58. Zeng, G.; Wang, P.; Wang, Y. Algicidal efficiency and mechanism of Phanerochaete chrysosporium against harmful algal bloom species. Algal Res. 2015, 12, 182–190. [Google Scholar] [CrossRef]
  59. Tongman, I.; Poungcharean, S.; Jitchum, P.; Chaichana, R. A field experiment on restoration of a hyper-eutrophic urban shallow pool using polyaluminium chloride in Thailand. Pol. J. Environ. Stud. 2023, 33, 405–413. [Google Scholar] [CrossRef] [PubMed]
  60. Wert, E.C.; Dong, M.M.; Rosario-Ortiz, F.L. Using digital flow cytometry to assess the degradation of three cyanobacteria species after oxidation processes. Water Res. 2013, 47, 3752–3761. [Google Scholar] [CrossRef] [PubMed]
  61. Shin, J.-K.; Kim, H.; Kim, S.W.; Chong, S.A.; Moon, B.; Lee, S.; Choi, J.W. A practical new technology of removing algal bloom: K-water GATe water combine. Korean J. Ecol. Environ. 2014, 47, 214–218. [Google Scholar] [CrossRef]
  62. Park, M.-H.; Lee, S.J.; Yoon, B.-D.; Oh, H.-M. Effects of CellCaSi and bioflocculant on the control of algal bloom. Korean Environ. Biol. 2001, 19, 129–135. [Google Scholar]
  63. Son, H.-J.; Jung, J.-M.; Kim, S.-G.; Jang, S.-H. Using CuSO4 for preventing algae attachment on the sedimentation basin of industrial water treatment plant. J. Korean Soc. Environ. Eng. 2012, 34, 780–785. [Google Scholar] [CrossRef]
  64. Pakrashi, S.; Dalai, S.; Ritika, B.; Sneha, B.; Chandrasekaran, N.; Mukherjee, A. A temporal study on fate of Al2O3 nanoparticles in a fresh water microcosm at environmentally relevant low concentrations. Ecotoxicol. Environ. Saf. 2012, 84, 70–77. [Google Scholar] [CrossRef] [PubMed]
  65. Ziegmann, M.; Abert, M.; Müller, M.; Frimmel, F.H. Use of fluorescence fingerprints for the estimation of bloom formation and toxin production of Microcystis aeruginosa. Water Res. 2010, 44, 195–204. [Google Scholar] [CrossRef] [PubMed]
  66. Schaap, A.; Rohrlack, T.; Bellouard, Y. Lab on a chip technologies for algae detection: A review. J. Biophotonics 2012, 5, 661–672. [Google Scholar] [CrossRef] [PubMed]
  67. Bastien, C.; Cardin, R.; Veilleux, E.; Deblois, C.; Warren, A.; Laurion, I. Performance evaluation of phycocyanin probes for the monitoring of cyanobacteria. J. Environ. Monit. 2011, 13, 110–118. [Google Scholar] [CrossRef]
  68. Zhao, H.; Zhou, Y.; Wu, H.; Kutser, T.; Han, Y.; Ma, R.; Yao, Z.; Zhao, H.; Xu, P.; Jiang, C.; et al. Potential of Mie–fluorescence–Raman lidar to profile chlorophyll a concentration in inland waters. Environ. Sci. Technol. 2023, 57, 14226–14236. [Google Scholar] [CrossRef]
  69. Beutler, M.; Wiltshire, K.H.; Meyer, B.; Moldaenke, C.; Lüring, C.; Meyerhöfer, M.; Hansen, U.P.; Dau, H.; Dau, H. A fluorometric method for the differentiation of algal populations in vivo and in situ. Photosynth. Res. 2002, 72, 39–53. [Google Scholar] [CrossRef] [PubMed]
  70. Ministry of the Environment. Water Pollution Standard Method; SK: Moe; National Institute of Environmental Research. 2023. Available online: https://law.go.kr/행정규칙/수질오염공정시험기준 (accessed on 22 March 2024).
  71. Hodges, C.M.; Wood, S.A.; Puddick, J.; McBride, C.G.; Hamilton, D.P. Sensor manufacturer, temperature, and cyanobacteria morphology affect phycocyanin fluorescence measurements. Environ. Sci. Pollut. Res. Int. 2018, 25, 1079–1088. [Google Scholar] [CrossRef] [PubMed]
  72. Kong, Y.; Lou, I.; Zhang, Y.; Lou, C.U.; Mok, K.M. Using an online phycocyanin fluorescence probe for rapid monitoring of cyanobacteria in Macau freshwater reservoir. Hydrobiologia 2014, 741, 33–49. [Google Scholar] [CrossRef]
  73. Hodges, C.M. A Validation Study of Phycocyanin Sensors for Monitoring Cyanobacteria in Cultures and Field Samples. Master’s Thesis, University of Waikato, Waikato, New Zealand, 2016. [Google Scholar]
  74. McQuaid, N.; Zamyadi, A.; Prévost, M.; Bird, D.F.; Dorner, S. Use of in vivo phycocyanin fluorescence to monitor potential microcystin-producing cyanobacterial biovolume in a drinking water source. J. Environ. Monit. 2011, 13, 455–463. [Google Scholar] [CrossRef] [PubMed]
  75. Zamyadi, A. The Value of In Vivo Monitoring and Chlorination for the Control of Toxic Cyanobacteria in Drinking Water Production. Ph.D. Thesis, University of École Polytechnique de Montréal, Montreal, Canada, 2011. [Google Scholar]
  76. Zamyadi, A.; Henderson, R.K.; Stuetz, R.; Newcombe, G.; Newtown, K.; Gladman, B. Cyanobacterial management in full-scale water treatment and recycling processes: Reactive dosing following intensive monitoring. Environ. Sci. Water Res. Technol. 2016, 2, 362–375. [Google Scholar] [CrossRef]
  77. Bertone, E.; Burford, M.A.; Hamilton, D.P. Fluorescence probes for real-time remote cyanobacteria monitoring: A review of challenges and opportunities. Water Res. 2018, 141, 152–162. [Google Scholar] [CrossRef] [PubMed]
  78. Seppälä, J.; Ylöstalo, P.; Kaitala, S.; Hällfors, S.; Raateoja, M.; Maunula, P. Ship-of-opportunity based phycocyanin fluorescence monitoring of the filamentous cyanobacteria bloom dynamics in the Baltic Sea. Estuar. Coast. Shelf Sci. 2007, 73, 489–500. [Google Scholar] [CrossRef]
  79. Zamyadi, A.; Choo, F.; Newcombe, G.; Stuetz, R.; Henderson, R.K. A review of monitoring technologies for real-time management of cyanobacteria: Recent advances and future direction. TrAC Trends Anal. Chem. 2016, 85, 83–96. [Google Scholar] [CrossRef]
  80. Gregor, J.; Maršálek, B.; Šípková, H. Detection and estimation of potentially toxic cyanobacteria in raw water at the drinking water treatment plant by in vivo fluorescence method. Water Res. 2007, 41, 228–234. [Google Scholar] [CrossRef]
  81. Lee, T.-y.; Tsuzuki, M.; Takeuchi, T.; Yokoyama, K.; Karube, I. Quantitative determination of cyanobacteria in mixed phytoplankton assemblages by an in vivo fluorimetric method. Anal. Chim. Acta 1995, 302, 81–87. [Google Scholar] [CrossRef]
  82. Bowling, L.C.; Zamyadi, A.; Henderson, R.K. Assessment of in situ fluorometry to measure cyanobacterial presence in water bodies with diverse cyanobacterial populations. Water Res. 2016, 105, 22–33. [Google Scholar] [CrossRef] [PubMed]
  83. GRDA(Grand River Dam Authority). Ecosystems Explorations: Research, Conservation, and Protection. Available online: https://grda.com/wp-content/uploads/2023/08/2021-Algae-Special-Spreads-1.pdf (accessed on 9 March 2024).
  84. Sukenik, A.; Kaplan, A. Cyanobacterial harmful algal blooms in aquatic ecosystems: A comprehensive outlook on current and emerging mitigation and control approaches. Microorganisms 2021, 9, 1472. [Google Scholar] [CrossRef] [PubMed]
  85. Paerl, H.W.; Huisman, J. Climate change: A catalyst for global expansion of harmful cyanobacterial blooms. Environ. Microbiol. Rep. 2009, 1, 27–37. [Google Scholar] [CrossRef] [PubMed]
  86. Jo, W.; Hoaoashi, Y.; Aguilar, L.L.P.; Postigo-Malaga, M.; Garcia-Bravo, J.M.; Min, B.C. A low-cost and small USV platform for water quality monitoring. HardwareX 2019, 6, e00076. [Google Scholar] [CrossRef]
Figure 1. Study area and measurement point locations(red circle: location of the algal fence installation).
Water 16 01679 g001
Figure 2. Area-level concentration analysis method based on surface sensor data measurements (the points marked with dots represent the sensor measurement points).
Water 16 01679 g002
Figure 3. All available data regarding cyanobacteria and total Chl-a in Bohyunsan Dam and Daecheong Dam. The box plots illustrate the data distribution based on the minimum, first quartile, median, third quartile, and maximum values.
Water 16 01679 g003
Figure 4. (A) Precipitation (mm/day) and temperature (°C); (BD) seasonal variation in cyanobacterial (sum of Microcystis, Anabaena, Aphanizomenon, and Oscillatoria) cell abundance (cells/mL), and Chl-a (mg/m3) in the study area at Daecheong Dam from May to December 2021.
Water 16 01679 g004
Figure 5. Taxonomic survey results measured using sensors.
Water 16 01679 g005
Figure 6. Surface-level concentrations of total and blue-green algae (BGA) at points before, in the middle, and after the Daecheong Dam algal fences.
Water 16 01679 g006
Figure 7. ANOVA results of the algal fences installed at Daecheong Dam (left: blue-green algal Chl-a, right: total Chl-a, a, b and c: groups divided by ANOVA results).
Water 16 01679 g007
Table 1. The algae warning system (water source section) shows blue-green algal alert levels in South Korea.
StageCriteria
Water supply source sectionCautionHarmful blue-green algal cell counts greater than 1000 cells/mL and less than 10,000 cells/mL in two consecutive collections 1
WarningHarmful blue-green algal cell counts greater than 10,000 cells/mL and less than 1,000,000 cells/mL in two consecutive collections 2
OutbreakHarmful blue-green algal cell counts of 1,000,000 cells/mL or more in two consecutive collections 2
ClearHarmful blue-green algal cell counts of less than 1000 cells/mL in two consecutive collections
Notes: 1 More than once a week, 2 More than twice a week.
Table 2. Algal control assessment analysis related to pigments.
Algal ControlReferences
Chl-a_UVPhysicalSubmerged aerator
ECF (electro-coagulation-flotation)
Artificial mixing
[28]
[48]
[49]
[50]
[51]
Chemical and biologicalChitosan, red soil/clay
Biological predators
Coagulant
Electro-coagulation
Algicidal substance
Phosphorus insolubilization
Oxidation
Phanerochaete chrysosporium
[52]
[53]
[54]
[35]
[36]
[55]
[56]
[57]
[58]
[59]
[60]
MultipleCyclonic-DAF system
GATe water combination
[37]
[61]
Chl-a_sensor, fluorescence measurementChemical and biologicalBioflocculant
Al2O3 nanoparticle
Algicidal substance
[62]
[63]
[64]
Phycocyanin_UVChemical and biologicalCopper sulfate, aluminum, sulfate[36]
Pigment_HPLC Coagulant[40]
Table 3. Quantity of data per item and point.
LocationStudy DatesMicroscopySensorAlgal Control
Total Chl-a/Cyanobacterial Chl-a
Bohyunsan Dam3 November 20197575-
Daecheong DamOctober 2021-266Algal fence
Table 4. Number of species and cell abundance ratio at Bohyunsan Dam.
Species No.Ratio of Abundance
TaxaChlorophyta247.5%
Bacillariophyta3219.7%
Cyanophyta771.7%
Others61.1%
Table 5. Correlation coefficients of the log(x + 1) sensor value (cyanobacteria and Total Chl-a) against log(x + 1) cyanobacterial abundance at Bohyunsan Dam.
FluoroProbe sensor
log_Cyanolog_Total
Totallog_TotalPearson correlation coefficient0.627 **0.629 **
N7575
log_HcyanoPearson correlation coefficient 0.618 **0.411 **
N7575
Note: ** p < 0.01.
Table 6. Sensor blue-green algal Chl-a concentrations according to the water depth of the algal fence.
Depth/SiteBeforeIn betweenAfter
1212123
0–2 m2.22.11.92.21.41.71.7
3–7 m2.62.62.62.61.61.71.7
8–14 m2.52.22.12.22.11.81.9
≥15 m 1.71.51.81.51.10.91.3
Average0–2 m2.2 ± 0.32.1 ± 0.11.6 ± 0.2
3–7 m2.6 ± 0.12.6 ± 0.21.7 ± 0.2
8–14 m2.4 ± 0.42.2 ± 0.21.9 ± 0.2
≥15 m1.6 ± 0.71.7 ± 0.81.1 ± 0.8
Note: Algal fence depth: approximately 7 m.
Table 7. The sum of algal concentration values per total measuring area and per volume by water depth measured at the algal fences.
Algal FenceMeasuring Area
(m2)
Algal Weight of Total Measuring Area (mg)Algal Concentration per Volume Depending on Water Depth (mg/m3)
Before3822205,91253.9
In between6304371,48158.9
After163470,72743.3
Disclaimer/Publisher’s Note: The statements, opinions and data contained in all publications are solely those of the individual author(s) and contributor(s) and not of MDPI and/or the editor(s). MDPI and/or the editor(s) disclaim responsibility for any injury to people or property resulting from any ideas, methods, instructions or products referred to in the content.

