Article

Dredging Area Ecosystem Restoration Based on Biochar-Improved Sediment and Submerged Plant System

by
Shengqi Zhang
1,2,
Jing Zhang
1,3,
Kun Fang
4,
Ling Liu
1,5 and
Hongjie Wang
1,5,*
1
Hebei Key Laboratory of Close-to-Nature Restoration Technology of Wetlands, School of Eco-Environment, Hebei University, Baoding 071002, China
2
College of Chemistry and Materials Science, Hebei University, Baoding 071002, China
3
Biology Institute, Hebei Academy of Science, Shijiazhuang 050081, China
4
College of Environmental Science and Engineering, Beijing Forestry University, Beijing 100083, China
5
Engineering Research Center of Ecological Safety and Conservation in Beijing-Tianjin-Hebei (Xiong’an New Area) of MOE, Baoding 071002, China
*
Author to whom correspondence should be addressed.
Water 2024, 16(12), 1710; https://doi.org/10.3390/w16121710
Submission received: 13 May 2024 / Revised: 9 June 2024 / Accepted: 11 June 2024 / Published: 16 June 2024

Abstract

:
Ecological restoration in dredging areas has attracted increasing attention. The reconstruction of a submerged plant ecosystem is an important method for aquatic ecosystem restoration. This study has systematically investigated the effect of biochar-improved sediment on the plant growth and decontamination efficiency of a constructed ecosystem. Microbial community composition and structure in the sediment were detected. The results showed that a supplement of 20 mg/g of biochar significantly increased the biomass of the submerged plants compared with other doses (0, 10, and 40 mg/g). The biomass and chlorophyll content were significantly inhibited by supplementing 40 mg/g of biochar. In the Ceratophyllum demersum L. system, TP and NH4+-N concentrations were significantly lower after treatment with 20 mg/g of biochar compared to other doses. In Vallisneria spiralis L. and Hydrilla verticillata (L. f.) Royle systems, NH4+-N, TP, and DO concentrations were significantly different among different biochar treatments. In general, 20 mg/g of biochar improved water quality in different submerged plant systems, while 40 mg/g of biochar had adverse effects on water quality, such as higher NH4+-N and TP concentrations. The dominant microbial community included Proteobacteria, Acidobacteria, Chloroflexi, Actinobacteriota, and Bacteroidota. The structure and function of microbial communities were different among submerged plants and biochar treatments. Our results proposed a construction strategy of submerged plants in the dredging area.

1. Introduction

Dredging is an effective way to control endogenous pollution [1]. After dredging, the submerged plant community will no longer exist in the entire dredging area. Ecological restoration in dredging areas has attracted increasing attention. The physical and chemical properties of sediments may change after dredging, resulting in nutrients’ barrenness and changes in microbial communities, which makes the healthy growth of submerged plants difficult. Submerged plants are primary producers in the ecosystem. They absorb nitrogen, phosphorus, and other harmful substances in eutrophic water through their own metabolism and microbial interaction and resist the growth of algae [2,3].
Submerged plant systems play an important role in increasing the biodiversity of the aquatic ecosystem, promoting the material and energy cycle in the water body, and maintaining the stable state of the water body and ecological service function. The reconstruction of submerged plant ecosystems is an important method for aquatic ecosystem restoration. Microorganisms in soil and sediment are also important for the ecosystem [4], and they are one of the main driving forces of element circulation and transformation. The analysis of changes in the composition and structure of microbial communities in soil and sediment showed that changes in ecosystem function can be resolved, and a theoretical basis can also be provided for formulating measures to protect and rationally use ecological resources [5]. For example, after dredging, the ecologically beneficial microbe quickly responded to the changing physical and chemical characteristics of sediments caused by dredging disturbances, along with the recombination of microbial groups and abundance [6]. Therefore, the microbial communities acted as an indicator to evaluate the impact of dredging on the ecosystem.
Biochar is a kind of carbon-rich solid material produced by the high-temperature pyrolysis of biomass under anoxic or oxygen-limited conditions [7]. It has a large specific surface area, abundant polar functional groups, and a strong cation exchange capacity [8]. At present, biochar has certain development prospects in contaminated soil remediation and water purification. Due to the special structure of biochar, it is used to adsorb nitrogen [9], phosphorus [10], organic matter [11], metal ions [12], and other pollutants [13]. Previous studies have shown that green oxygen-carrying biochar could improve water quality and reduce N2O emissions [14,15]. At the same time, its unique microporous structure provides an ideal habitat for microorganisms [16], and biochar is able to improve the soil micro-environment, soil microorganism, and soil enzyme activities [17,18]. However, biochar may inhibit the growth of microorganisms due to the adsorbed soil organic carbon and other low-molecular-weight organic matter [19]. Significant changes in soil microbial communities and enzyme activities influence soil biogeochemical processes [17,20]. Biochar impacts plant growth [16]. Biochar is applied in aquatic vegetable cultivation, and it not only improves the quality and yield, but also reduces the edible risk [18]. However, Chi et al. [11] suggested that biochar’s amendment to sediments had a negative effect on the growth of Vallisneria spiralis L. In the presence of polycyclic aromatic hydrocarbons (PAHs), the adsorption of biochar made the PAHs more persistent in water [11,20]. Yet, the mechanism behind all these effects was still unclear. Therefore, it is necessary to study the direct and indirect effects of biochar on submerged plants, as well as the impact of biochar on aquatic ecosystems and its mechanism, which is of important instructive significance for the application of biochar in water eutrophication rehabilitation engineering practices.
Dredging is an effective method used to control endogenous pollution. After dredging, the average diffusive flux of NH4+-N was decreased from 3.17 mg∙m−2∙d−1 to 0.752 mg∙m−2∙d−1, and the average diffusive flux of PO43− was decreased from 0.071 mg∙m−2∙d−1 to 0.011 mg∙m−2∙d−1 in the Nanliu Zhuang area in Baiyangdian Lake [21]. To speed up the rapid recovery of the water environment after dredging in some seriously polluted areas in Baiyangdian Lake, the rapid construction of a submerged plant system is a key link in the improvement of water ecology. This study systematically investigated the effect of biochar-improved sediment on the plant growth and decontamination efficiency of three submerged plant systems (Ceratophyllum demersum L., V. spiralis, and Hydrilla verticillata (L. f.) Royle) through field simulation experiments. In total, 12 ecosystems were constructed. The growth of submerged plants and the characteristics of microbial communities were systematically studied. The objectives of this study were as follows: (1) to analyze changes in the water quality and growth of submerged plants in the constructed ecosystem; (2) to evaluate the effect of different doses of biochar on the water quality and growth of submerged plants; and (3) to assess the microbial communities and potential functions in the constructed ecosystems. The different biochar doses affected the construction of the submerged plant system, which is of great significance in exploring the impact of biochar dose on the submerged plant system and is conducive to promoting ecosystem restoration in dredging areas.

2. Materials and Methods

2.1. Production and Characterization of Biochar

Reed (Phragmites Adans) was chosen as the raw material for biochar production, for it is a typical local plant in Baiyangdian Lake (between 115′45″ E–116′03″ E and 37′45″ N–39′00″ N). The method of biochar production was taken from Song et al. [22] with modifications. Dry reed stems were cut into 3–4 cm segments using a cutter and rinsing with deionized water for 2–3 times to clean the ash and other impurities, and then dried in an oven at 75 °C for 3 h. The dried reed rods were crushed into powder with a pulverizer and compacted in a crucible. Then, the powder was pyrolyzed at 500 °C for 1 h in a muffle furnace. The product was soaked in 1 mol/L hydrochloric acid for 1 h and cleaned with deionized water until the pH was neutral. The obtained biochar was dried at 80 °C for 4 h and passed through 40-mesh sieving (0.45 mm aperture) for subsequent experiments.
Scanning electron microscopy (SEM, Quanta 200, FEI, Hillsboro, OR, USA) was used to characterize the morphology of the biochar. The sample was fixed with conductive adhesive, after which the sample surface was sprayed with gold to complete the preparation; the sample exchange chamber was opened to evacuate the vacuum, and then the samples were put into the sample chamber for final observation at 1000, 3000, 5000, and 10,000 times. Fourier transform infrared spectroscopy (FTIR, Nicolet iS20, Thermo Scientific, Waltham, MA, USA) was used to determine functional groups on the surface of the biochar. The sample was processed using KBr, and data were collected using a Fourier FTIR in the range of 400–4000 cm−1. Biochar particle size was determined using a laser particle size analyzer (Mastersizer 3000, Malvern Panalytical, Marvin, UK). The testing conditions were set as follows: the particle refractive index was 2.42, and the refractive index of the dispersant was 1.33.

2.2. Modification of Sediment by Biochar

Experimental sediment was collected from the Nanliu Zhuang area in Baiyangdian Lake (38′90″ N, 115′95″ E). After calculation, the moisture content of the sediment sample was 23.4%. About 26.11 kg of samples (equivalent to 20 kg dry weight) was put into plastic buckets, and 0, 200, 400, and 800 g of biochar were added into the sediment, respectively. To fully mix the biochar and sediment, about 7 L of water was added into each bucket and stirred thoroughly. After standing for 24 h, the excess water was discharged by siphoning. Four biochar-improved sediments were obtained and marked as H1, H2, H3, and H4; the corresponding concentrations of biochar were 0, 10, 20, and 40 mg/g, respectively. About 2 kg of biochar-improved sediment was placed into a plastic square box (19.8 × 15.0 × 6.5 cm) and was used as the substrate for plant growth.

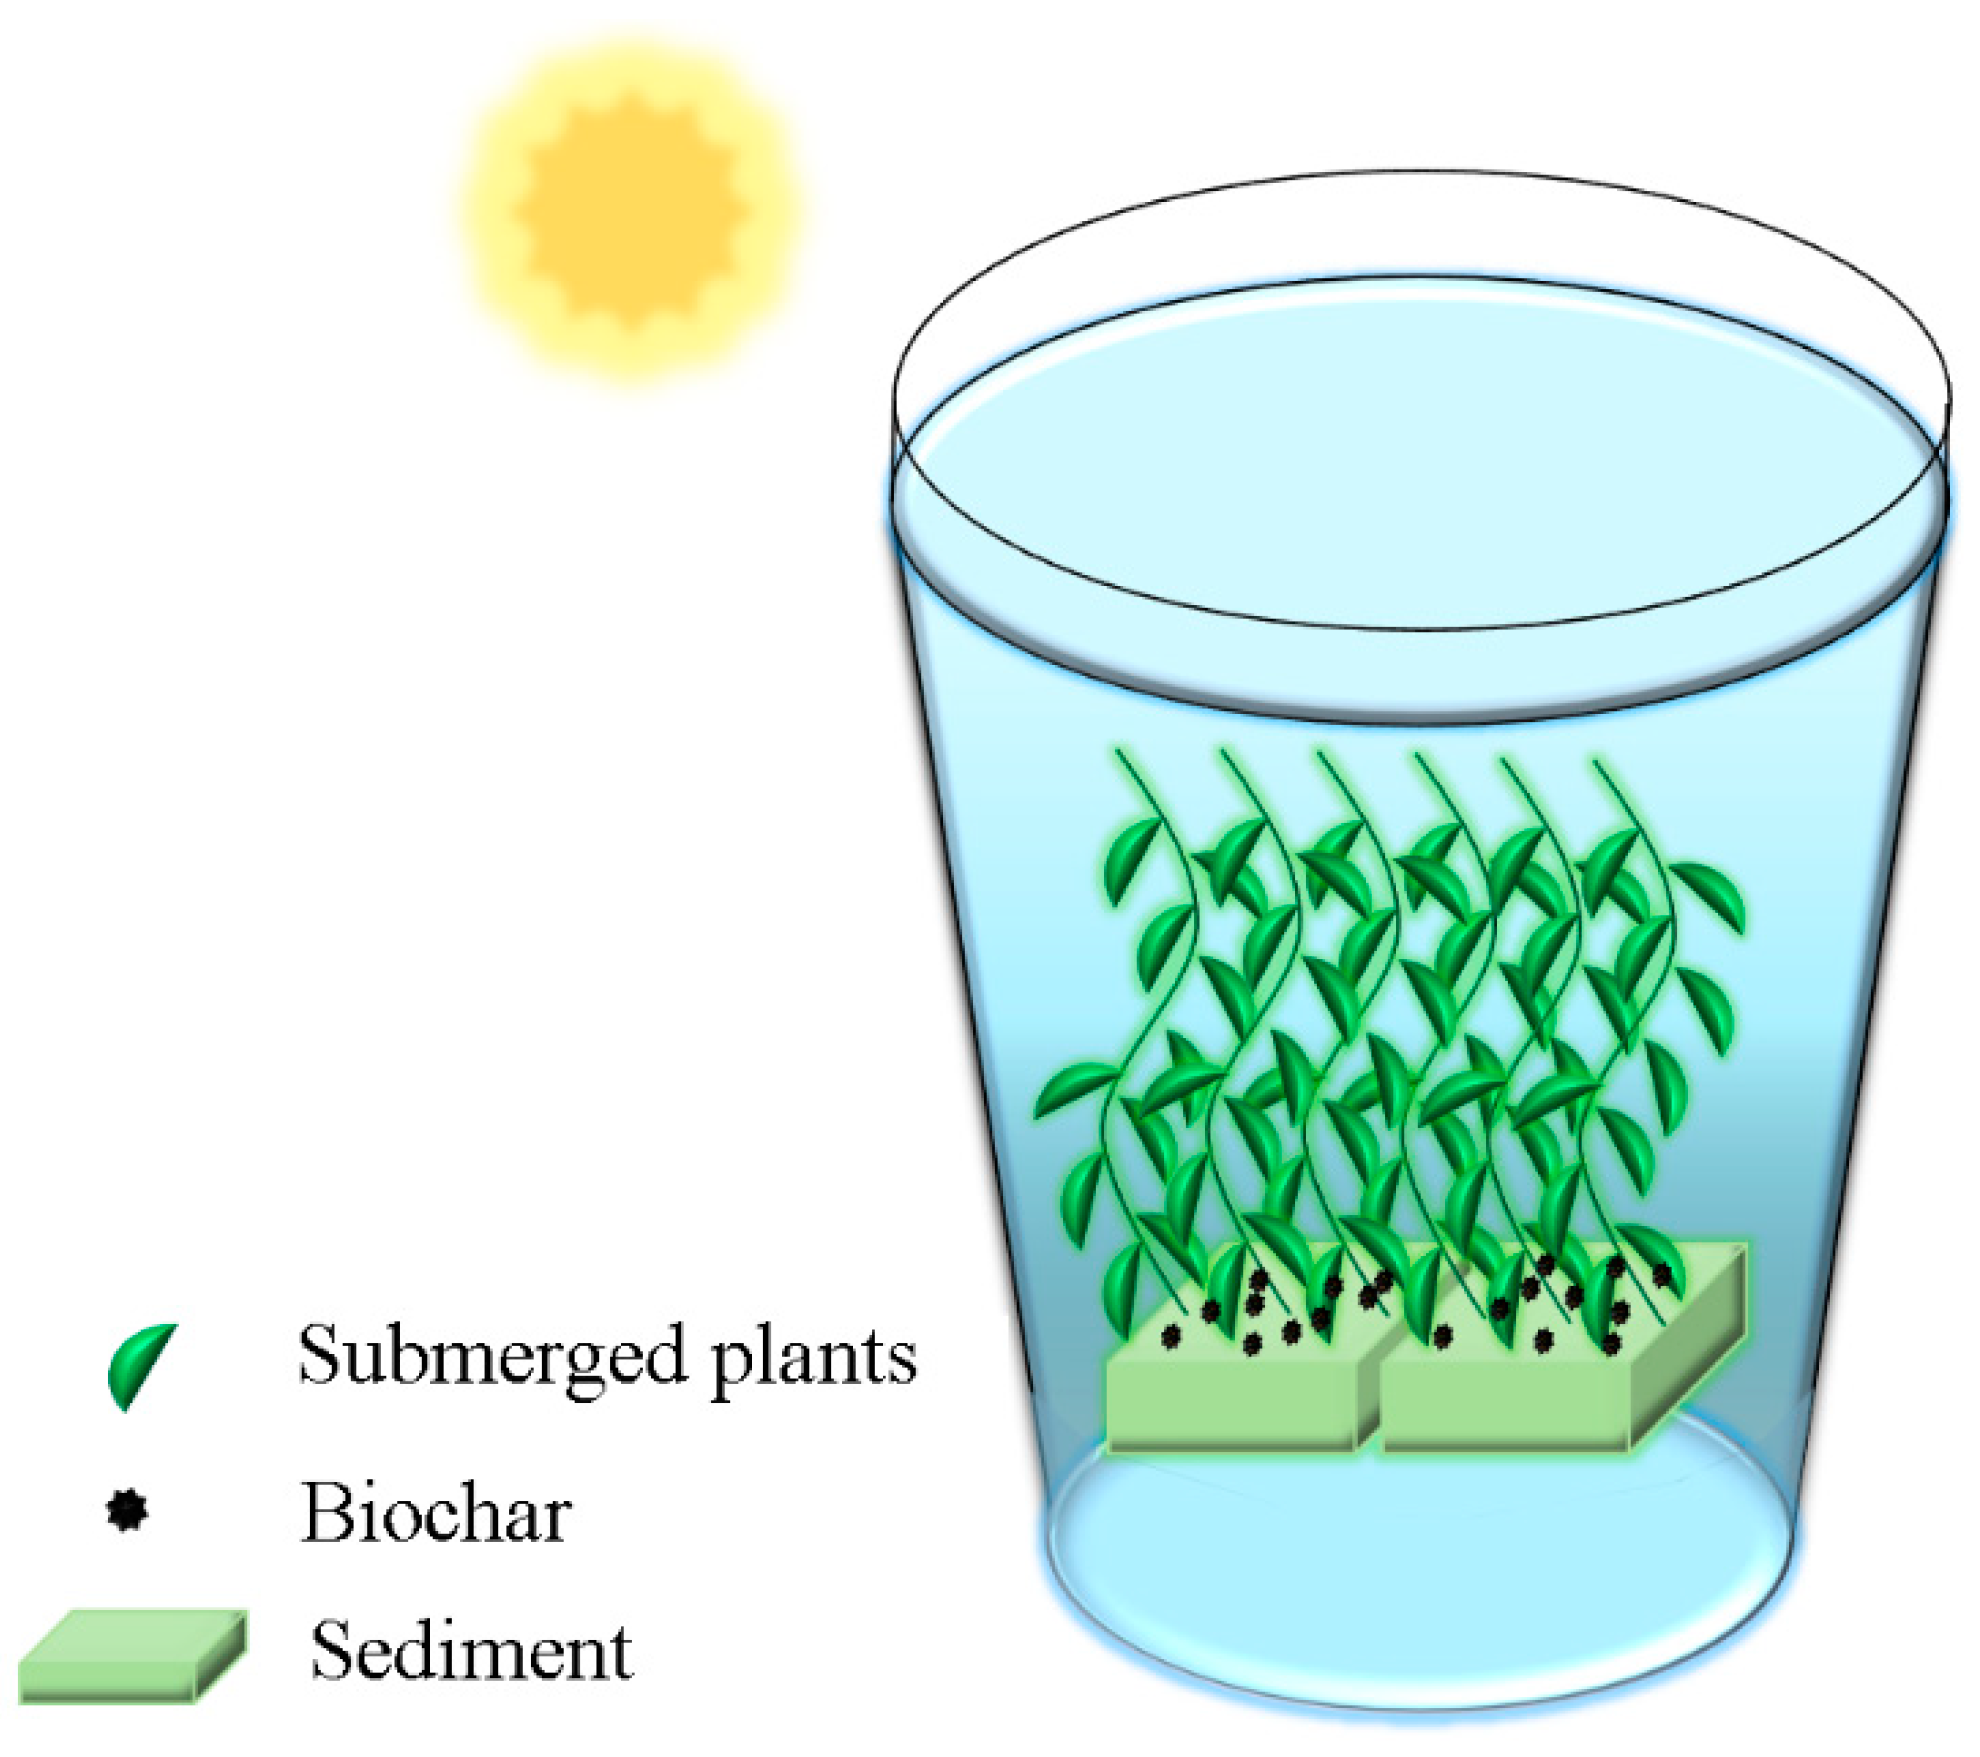
2.3. Construction of Micro-Ecosystem

In total, 12 micro-ecosystems were constructed using three kinds of submerged plants and four kinds of biochar-improved sediments. Three local plants including C. demersum, V. spiralis, and H. verticillata were chosen as experimental submerged plants, as they were easy obtained and famous in improving water quality [23]. The plants were cultivated in four kinds of biochar-improved sediments, with an initial biomass of about 100 g. A square box with plants was put into opaque polyethylene barrels. The upper and bottom diameters of the barrel were 65 and 55 cm, respectively, and the height of the barrel was 75 cm (Figure 1). Experiment water was collected from Baiyangdian Lake (38′90″ N, 115′95″ E), and the water depth was about 65 cm. Light was supplemented to ensure at least 12 h of sunlight every day.

2.4. Analysis Method of Water Quality and Biomass

Concentrations of ammonia nitrogen (NH4+-N), total nitrogen (TN), chemical oxygen demand (COD), and total phosphorus (TP) were detected according to standard methods using an ultraviolet multi-parameter water quality analyzer (LH-3BA, Lianhua Technology, Beijing, China). Dissolved oxygen (DO) was measured using a dissolved oxygen determining meter (JPBJ-608, INESA, Shanghai, China). Biomass was detected at the beginning and end of the experiment. The submerged plants were gently pulled out of the sediment and washed three times with distilled water. After carefully absorbing the surface water using filter paper, the fresh weight of plants was weighed using an electronic balance.
Chlorophyll content was determined through the ethanol extraction method. Briefly, about 1 g of plant tissues were collected and grinded thoroughly using 95% ethanol. After standing for 5 min, the extraction was filtered, and the absorbance value at 665, 649, and 470 nm was determined using an ultraviolet spectrophotometer. The chlorophyll content was calculated by the following formula [16].
C1 = 13.95A665 − 6.8A649
C2 = 24.96A649 − 7.32A665
C3 = (1000A470 − 2.05C1 − 114.8C2)/248
C = 0.001(C1 + C2 + C3)·V·N/m
where:
  • C1—Chlorophyll-a content, mg/L
  • C2—Chlorophyll-b content, mg/L
  • C3—Carotenoid content, mg/L
  • C—Chlorophyll content, mg/g
  • V—Extraction volume, mL
  • N—Dilution ratio
  • M—Sample quality, g
The malondialdehyde (MDA) content of the plants was determined using the thiobarbituric acid method. This method was conducted using BC0025 kit (Beijing Solarbio Science & Technology Co., Ltd., Beijing, China). Briefly, the shoots (0.5 g) of submerged plant were harvested from each experimental group and ground thoroughly with liquid nitrogen. An extraction buffer was added into the sample, and the supernatant was collected through centrifugation (12,000× g for 15 min). The concentration of MDA was analyzed by a spectrometer [24,25].
The relative growth rate was calculated by the following formula [16].
D = ln (Wf/Wi)/t
where:
  • D is the relative growth rate of submerged macrophytes, mg/(g·d)
  • Wf is the wet weight of submerged plants at the end of the experiment, g
  • Wi is the wet weight of submerged plants at the beginning of the experiment, g
  • t is the time, day

2.5. High Throughput Sequencing Analysis

Sediments in the constructed micro-ecosystem were collected in triplicate and stored in a refrigerator at −80 °C after mixing. Genomic DNA was extracted according to the instructions of the E.Z.N.A.® soil DNA kit (Omega Bio-tek, Norcross, GA, USA). The primers 515F (5′-GTGCCAGCMGCCGCGG-3′) and 907R (5′-CCGTCAATTCMTTTRAGTTT-3′) targeting the V4–V5 regions of bacterial 16S rDNA genes were used for bacteria analysis [16]. For the TransStart Fastpfu DNA polymerase analysis, the detection was conducted by PCR apparatus (ABI Gene Amp® 9700, Thermofisher, Waltham, MA, USA) with 20 µL butter solution, which was composed of 4 µL 5× FastPfu Buffer, 2 µL 2.5 mM dNTPs, 0.8 µL 5 µM Forward Primer, 0.8 µL 5 µM Reverse Primer, 0.4 µL FastPfu Polymerase, 0.2 µL BSA, and 10 ng Template DNA, and H2O was added to make up 20 µL. The details of PCR reaction parameters were as follows: 3 min at 95 °C (1 cycle), 30 s at 95 °C, 30 s at 55 °C, 45 s at 72 °C (27 cycles) and 10 min at 72 °C as a final extension; then, the temperature was kept at 10 °C until halted by the user [26]. The PCR product was detected by 2% agarose gel electrophoresis, and the electrophoresis pattern was detected by 3 µL loading. Then, the samples were sent to Majorbio Bio-pharm Technology Company (Shanghai, China) for further analysis. Using Ribosomal Database Project (RDP) classifier Bayesian analysis, sequences with 97% similarity were clustered into operation taxonomic units (OTUs). Considering the validity of the confidence threshold was over 0.7, the normalization sequences in each OTU were compared with the Silva128/16S-bacteria database.

2.6. Statistical Analysis

Data processing, analysis and plotting were completed using SPSS 20 software and Origin Pro 8.5. The differences among groups were analyzed using the one-way analysis of variance (one-way ANOVA) method followed by Duncan’s test and Student’s t-test. The significance analysis between groups was conducted using Student’s t-test. p < 0.05 was set as significant difference.

3. Results and Discussion

3.1. Characteristics of Biochar

Based on the results of SEM (Figure 2A–D), the reed–biochar prepared in this study had a rich-pore structure. Most of the biochar particles were between 10 and 800 μm, accounting for more than 90% of the total particle size (Figure 2E). After calculation, the specific surface area was 135 m2/kg. Due to the existence of macropores and small pores, the specific surface area of biochar increased significantly, which was an important reason for the high adsorption performance of biochar [27]. The porous structure of biochar was not only conductive to the attachment of bacteria but also provided a habitat and carbon source for microorganisms.
The data of FTIR showed there were six characteristic peaks in the range of 400~4000 cm−1 (Figure 2F). The absorption peaks with wave numbers of 805.17 cm−1 and 877.27 cm−1 were suggested as -C-H- on the aromatic ring, and the absorption peak at 1103.11 cm−1 was mainly caused by -C=C- and C=O of carboxylic acid. The stretching oscillation absorption peak of the ether group was at 1584.52 cm−1, and the absorption peak of hydroxyl was at 3639.17 cm−1 [8]. The biochar prepared in this study contained abundant functional groups and was a potential decontaminate material.

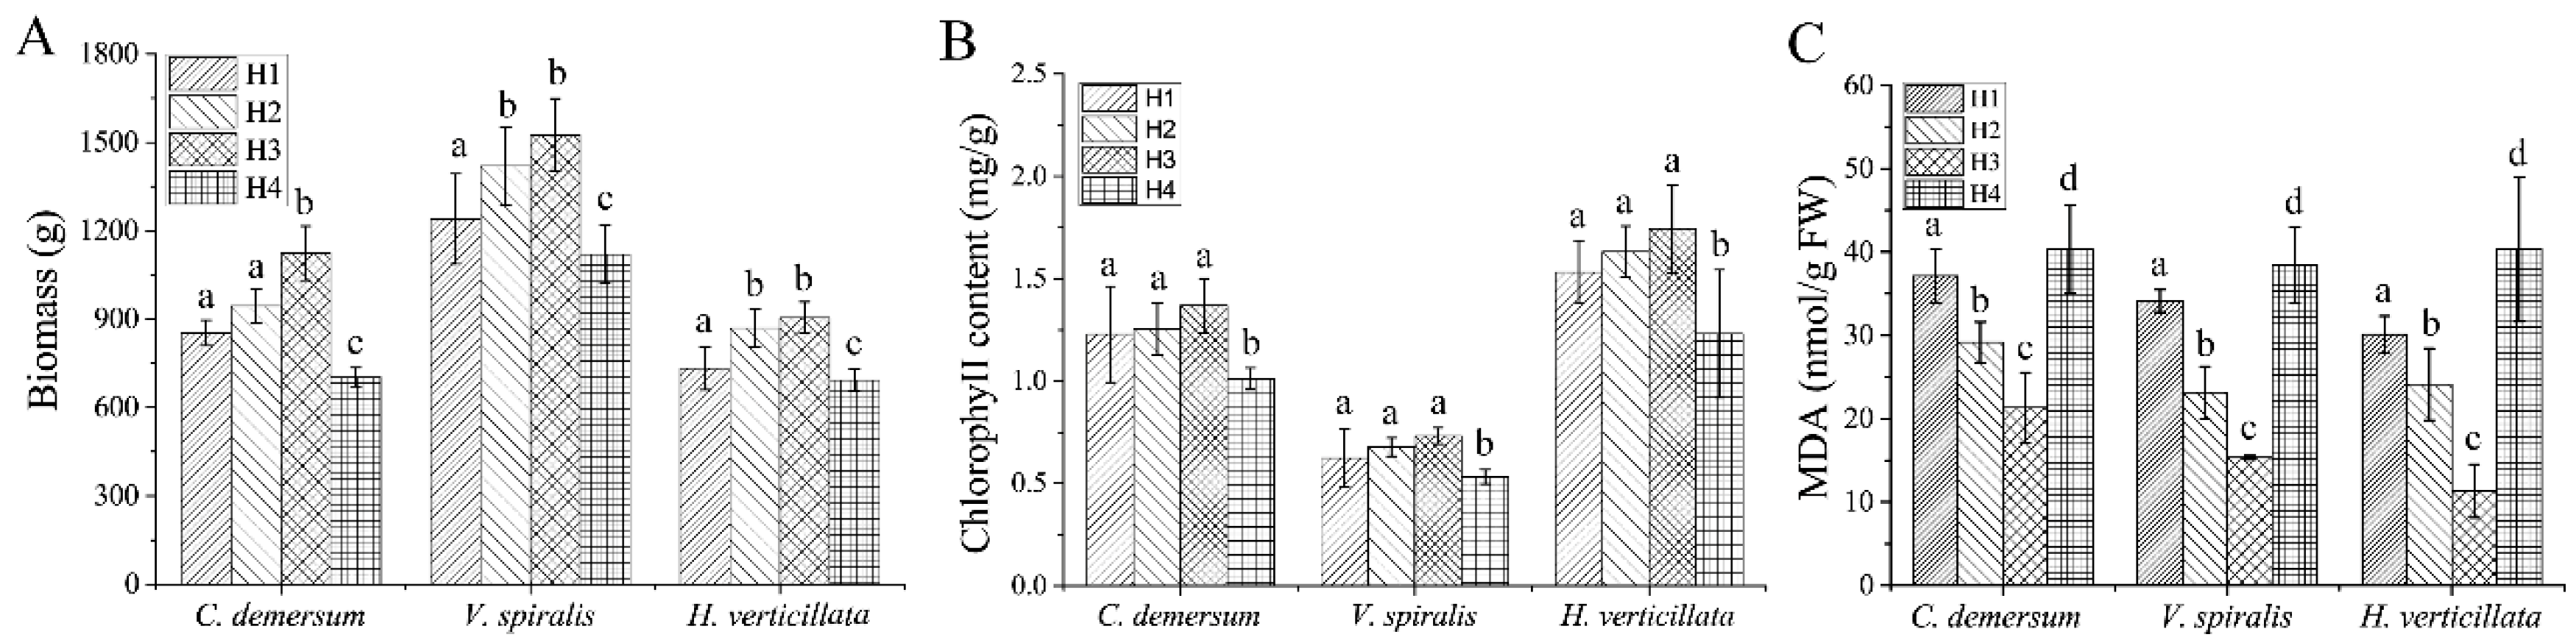
3.2. Effects of Biochar on Submerged Plants

After 30 days of incubation, the biomass of three submerged plants was measured (Figure 3A), and the relative growth rates were calculated (Table 1). The biomass of C. demersum in the H3 group was significantly higher than in other groups, with an average value of 1124.3 ± 92.3 g. A higher concentration of biochar treatment (H4 group) significantly decreased the biomass of C. demersum, with an average value of 703.2 ± 32.1 g. The biomass of V. spiralis reached maximum in group H3, with an average value of 1525.6 ± 123.5 g. There was no significant difference between the 10 mg/g and 20 mg/g of biochar treatment groups. The biomass of V. spiralis in H4 group was significantly lower than in other groups. As for H. verticillata, 20 mg/g of biochar significantly increased the biomass (905.8 ± 53.3 g) compared with other dosages. Moreover, 40 mg/g of biochar decreased the biomass of H. verticillata (693.3 ± 36.5 g). Based on the results of the relative growth rate (Table 1), 20 mg/g of biochar treatment showed the highest relative growth rate in three plants. And V. spiralis displayed a relatively faster growth rate. In general, the biomass of the three submerged plants was significantly increased in the treatment of 20 mg/g of biochar, and significantly decreased in the treatment of 40 mg/g of biochar. This promotion might be caused by the enrichment of nitrogen, phosphorus, potassium, and other elements in biochar, which were beneficial to plant growth. However, the biochar contained various heavy metals, polycyclic aromatic hydrocarbons (PAHs) and persistent free radicals, which inhibit plant growth, especially in the early stages of plant growth [28,29,30]. Thus, a higher dosage of biochar might produce toxic effects in submerged plant growth.
The chlorophyll contents of three plants under different biochar treatments were detected (Figure 3B). The results showed that the chlorophyll contents were slightly increased in groups H2 and H3, compared with in group H1. Notably, in the treatment of 40 mg/g biochar (group H4), the chlorophyll contents were significantly decreased compared with other groups. Chl-a, Chl-b and carotenoids in chlorophyll can combine natural light energy absorption with carbon dioxide to synthesize carbohydrates [31]. Biochar has a large effective surface area and high porosity, properties that enhance the ability to interact with matter through physical or chemical adsorption. Biochar increases the amount of carbon dioxide in water, resulting in an increase in chlorophyll content. Chlorophyll concentration reflected the efficiency of plant photosynthesis, which plays an important role in the process of converting organic matter into chemical energy. These results suggested that the photosynthesis of three submerged plants was inhibited under the treatment of high concentration of biochar (40 mg/g). However, at a higher concentration of biochar, the adsorbed contaminant is toxic to plants.
MDA concentrations of three submerged plants were detected to evaluate the growth status of the plants. The results showed that MDA concentrations were significantly different among different biochar treatments (Figure 3C). The MDA content of C. demersum decreased as the concentration of biochar increased. The concentration of MDA was lowest when treated with 20 mg/g of biochar. In the H4 group, the MDA concentration increased sharply and was significantly higher than in other groups. The tendency of MDA in three submerged plants was similar. MDA worked together with antioxidant enzymes to cope with external stress, such as water depth, light intensity, high temperature, and heavy metal pollution [32]. In order to resist the external stress, the concentration of MDA increased. However, if the plant was under this stress for a long time, the MDA value gradually decreased, and the plant gradually declined [33]. In this study, the MDA content of the H3 group was significantly lower than that of the other three groups. The results indicated that the environment was relatively suitable for the growth of plants, while in group H4, the MDA concentration was significantly increased, indicating that 40 mg/g of biochar was harmful for submerged plants. Combined with the concentrations of biomass, chlorophyll, and MDA, 20 mg/g of biochar was suitable for the growth of three submerged plants. A higher concentration of biochar inhibited the plant growth. A recommended supplement of biochar in the sediment was 20 mg/g.

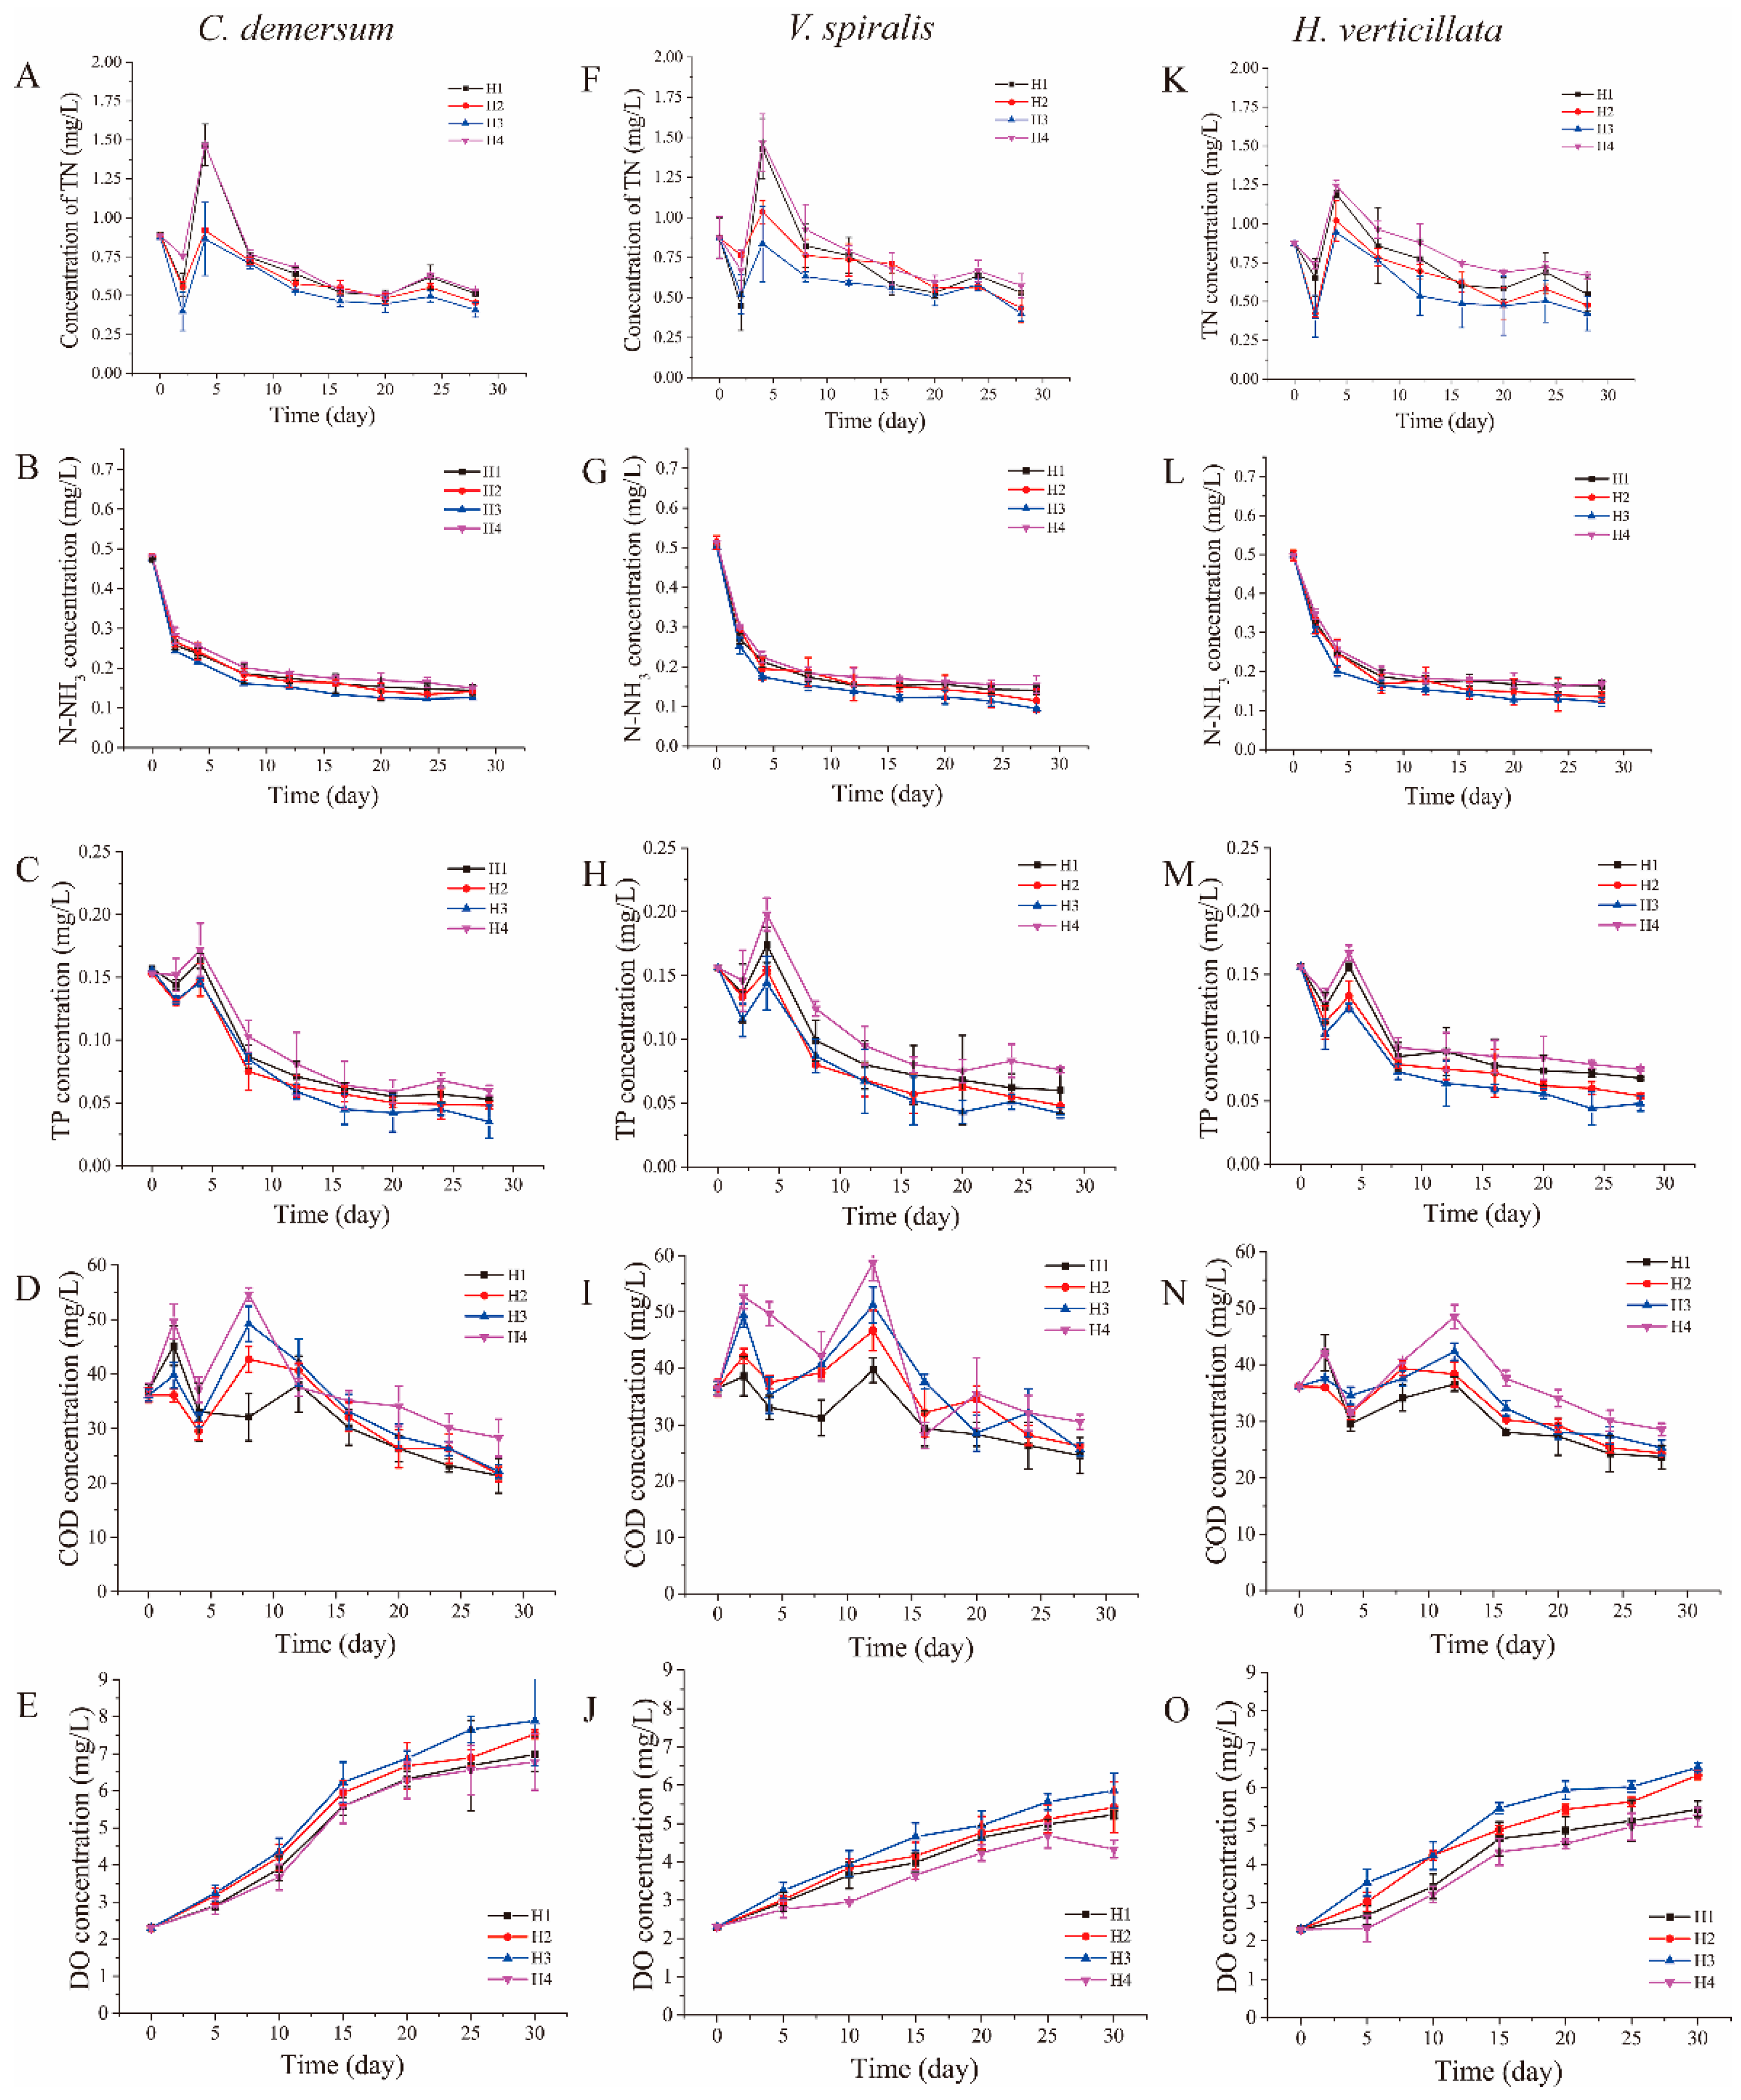
3.3. Effect of Biochar on Decontamination Efficiency of Submerged Plant System

The influence of different biochar doses on the decontamination efficiency of the submerged plant systems was explored. Concentrations of TN, NH4+-N, TP, COD, and DO in the submerged plant systems were detected during the experiments (Figure 4). These systems were stable after 10 days, and decontamination efficiency among groups was compared using data collected from 20 to 30 days. In the C. demersum system (Figure 4A–E), TP and NH4+-N concentrations were significantly different among groups (p < 0.05), in which the H3 group showed significantly lower concentrations of TP and NH4+-N. Additionally, the COD concentration in the H4 group was significantly higher than in the H1 group. In the V. spiralis system (Figure 4F–J), NH4+-N, TP, and DO concentrations were significantly different among groups (p < 0.05). NH4+-N and TP concentrations in the H4 group were significantly higher than those in the H2 and H3 groups, and DO concentration in the H4 group was significantly lower than that in the H2 and H3 groups. As for the H. verticillata system (Figure 4K–O), concentrations of TN, NH4+-N, TP, and DO were significantly different among groups (p < 0.05). NH4+-N, and TP concentrations were significantly lower in the H3 group than that in the H1 and H4 groups. NH4+-N, and TP concentrations were significantly higher in H4 than those in H2. DO concentration was highest in the H3 group and lowest in the H4 group. In a word, the H3 group exhibited lower TN, NH4+-N, and TP concentrations and a higher DO concentration in different submerged plant systems.
Throughout the experiments, 20 mg/g of biochar improved water quality in different submerged plant systems, with significantly lower concentrations of NH4+-N and TP. Compared with the control group, 40 mg/g of biochar improved the pollutant concentrations in these systems. Our results were consistent with previous studies that supplementing low doses of biochar to sediments can improve water quality and promote the growth of submerged plants [34]. The DO concentration of different treatment groups was H3 > H2 > H1 > H4. The effect of biochar on dissolved oxygen was similar to that on other parameters; as the dose of biochar increased, the DO concentration increased at first and then decreased. An appropriate dose of biochar could increase the concentration of DO in water, but excessive addition of biochar reduced the DO concentration. Excessive biochar affected the root environment of submerged plants by producing toxic and harmful substances. These substances inhibited the growth of local submerged plants and affected photosynthesis and the oxygen release ability. Oxygen limitation in roots led to a decrease in aerobic bacteria in the sediment and might reduce the removal efficiency of ammonia nitrogen. Moreover, the effect of the biochar on different submerged plant systems was different. Supplementing 20 mg/g of biochar could significantly decrease the TN, NH4+-N, and TP concentrations in the H. verticillata system. However, in the C. demersum and V. spiralis systems, the addition of 20 mg/g of biochar significantly decreased the NH4+-N and TP concentrations. We suggest that these differences were caused by the species of submerged plants.
In groups supplemented with 20 mg/g of biochar, biochemical properties in different submerged plants systems were compared. The results showed that DO in the C. demersum system was significantly higher among the three groups. Moreover, the biomass of C. demersum was not the highest, which indicated that the C. demersum was a relatively suitable submerged plant in the constructed ecosystem.

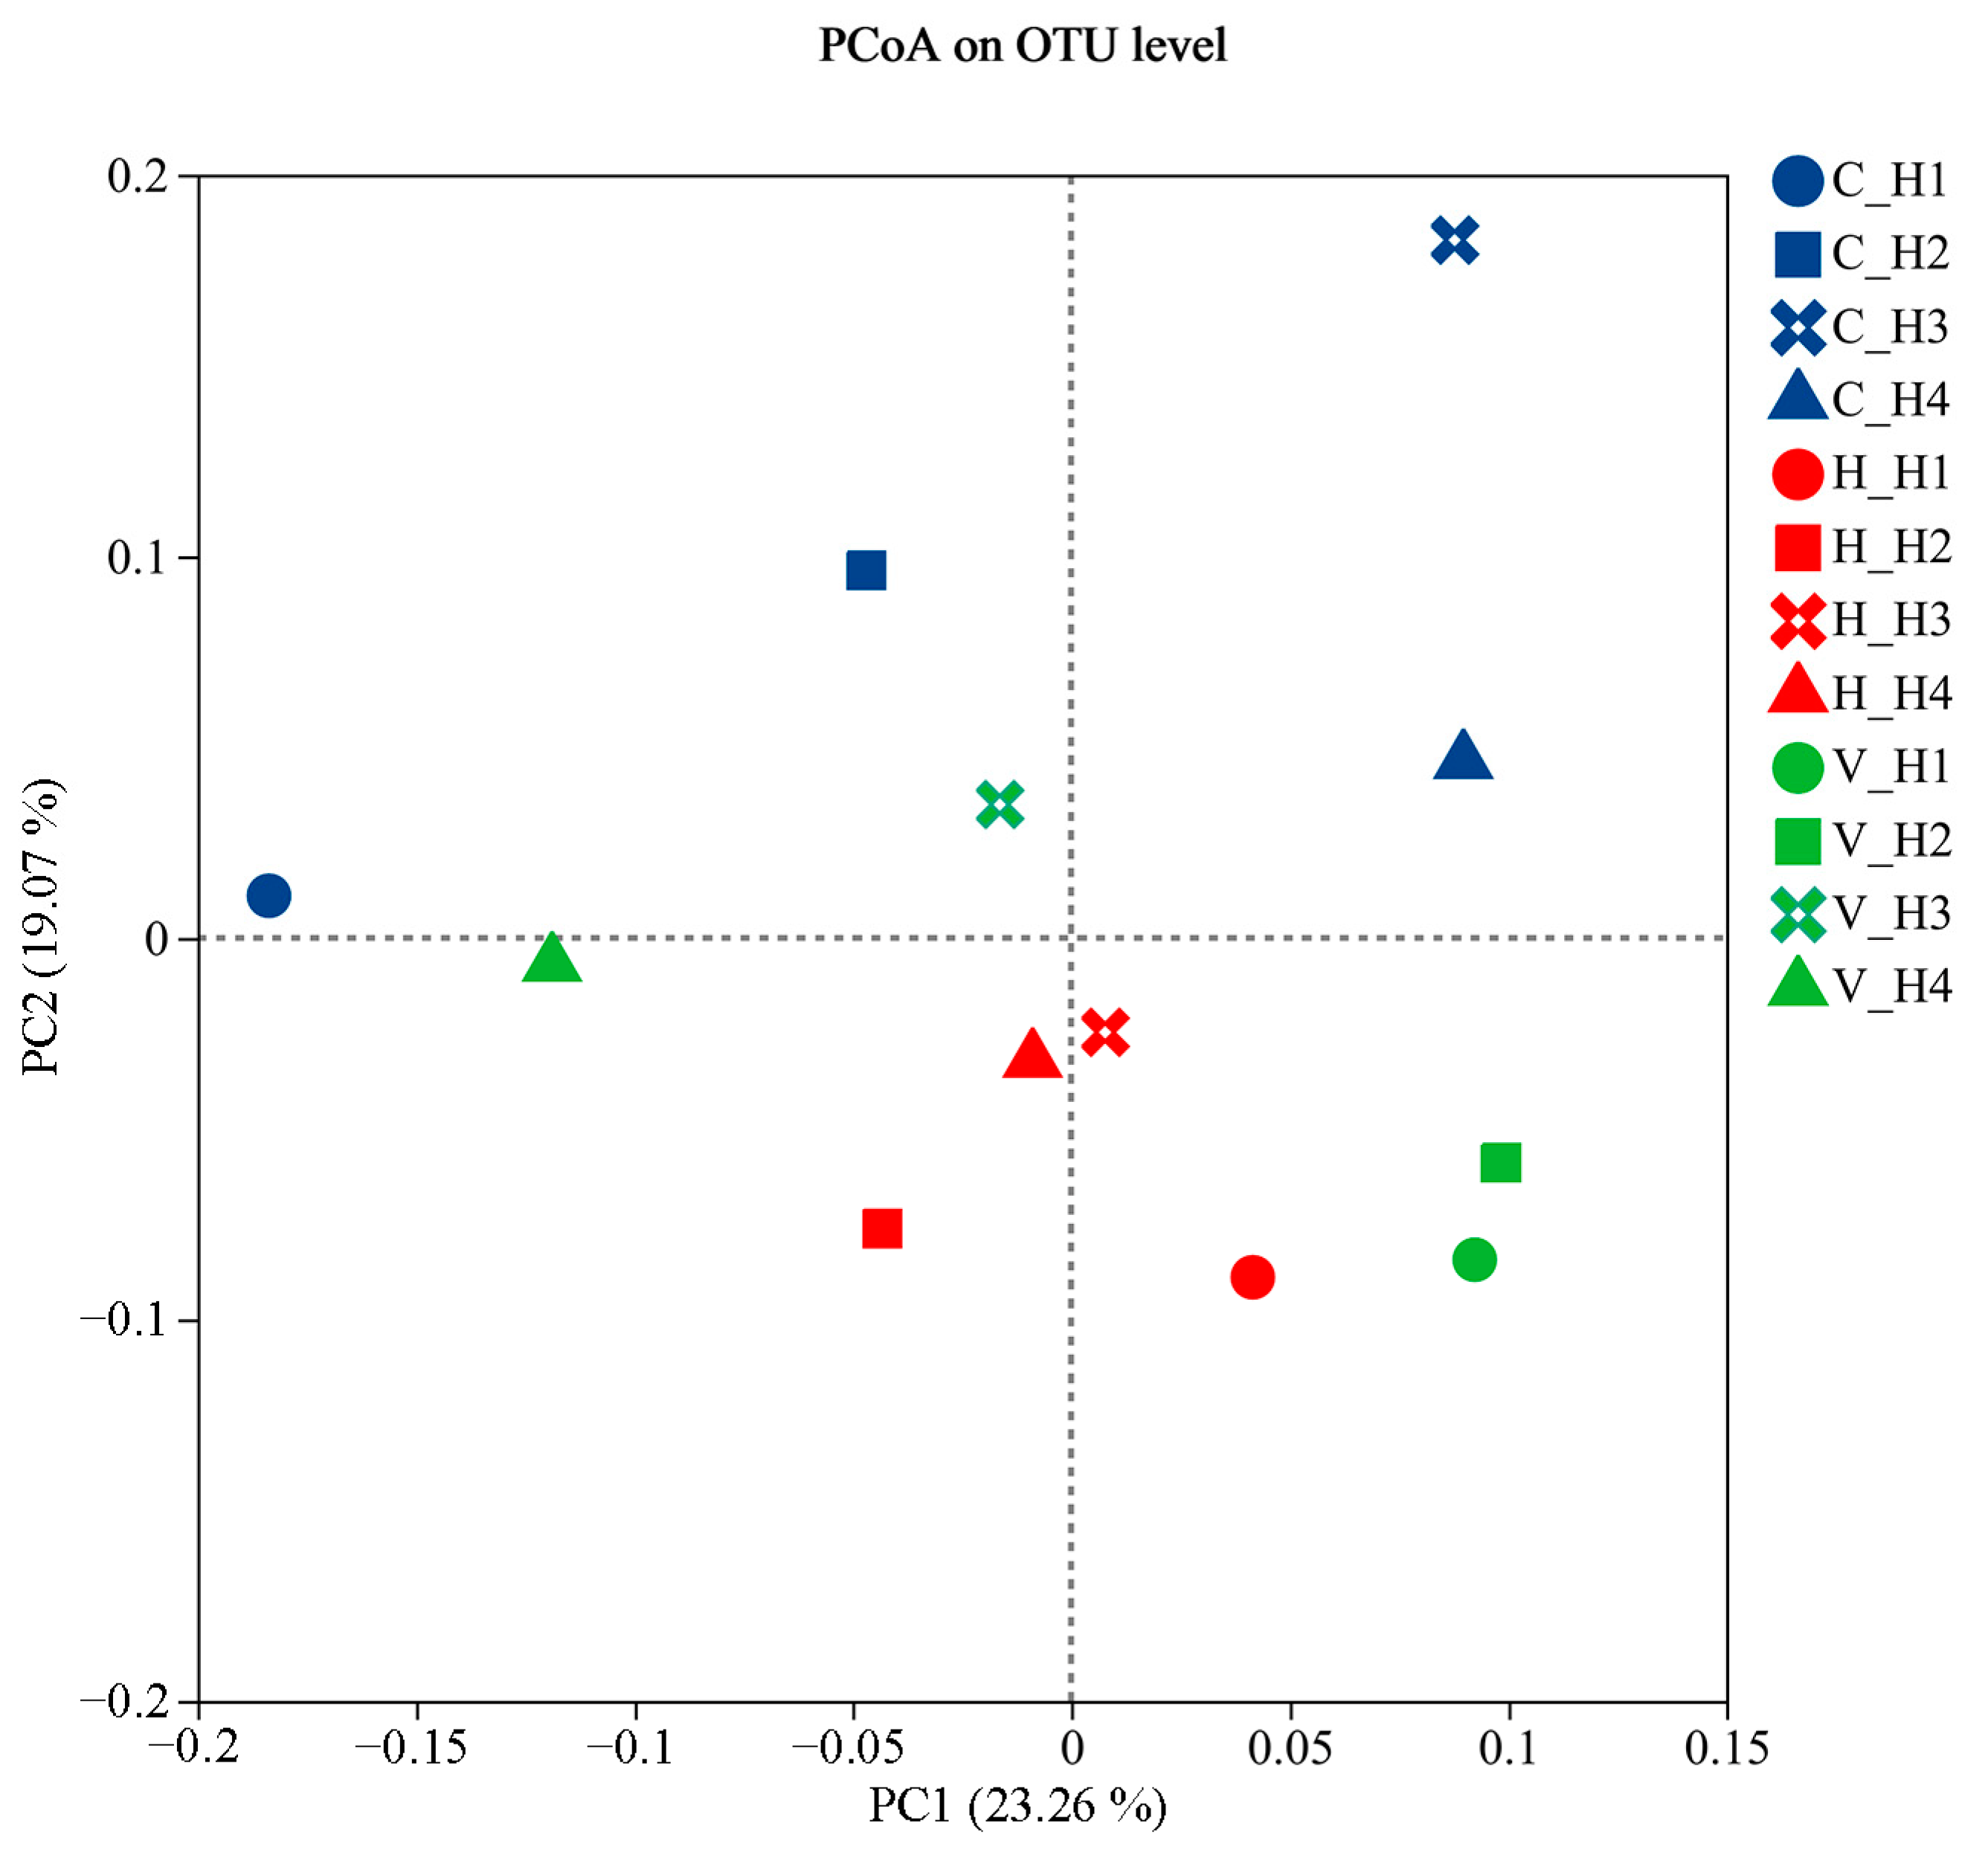
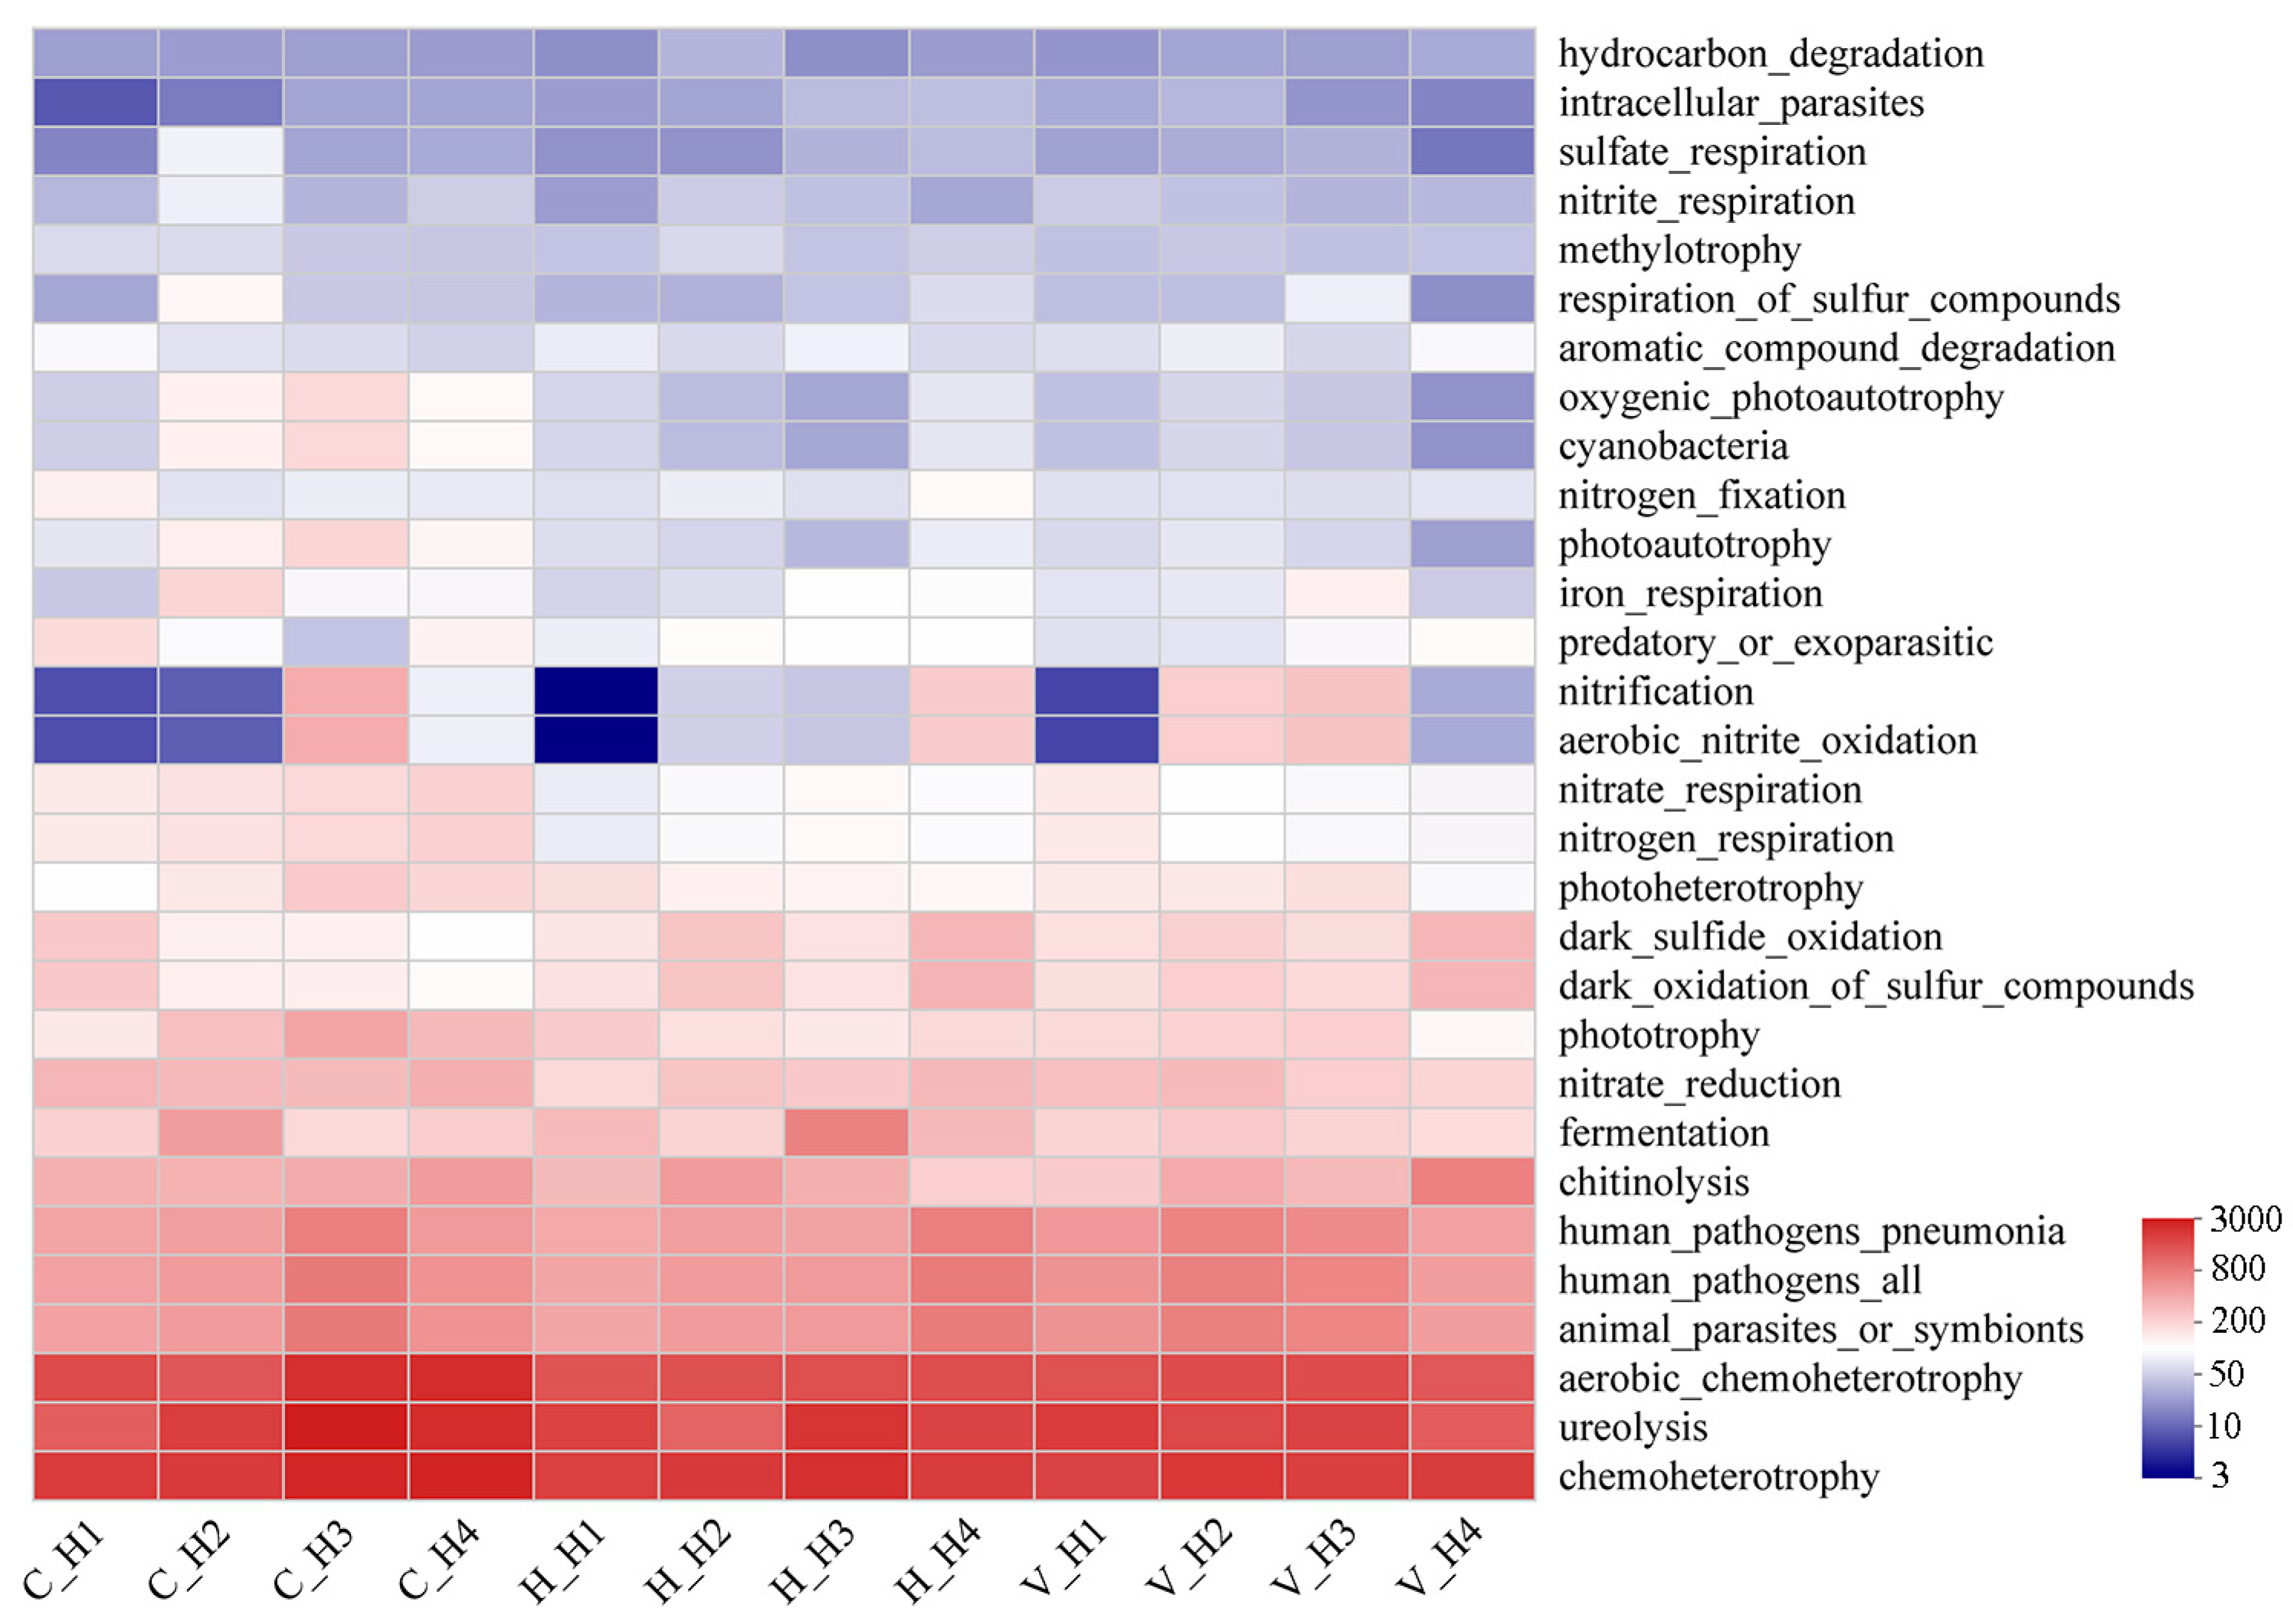
3.4. Analysis of Microbial Community in Constructed Submerged Plant Systems

To fully understand the composition and structure of the microbial community in the constructed submerged plant systems, microbiota in the sediment from different eco-systems were charactered. In total, there were 6391 OTUs obtained from 12 samples, which were assigned to 51 phylum, 164 classes, 367 orders, and 958 genera. The dominant microbial community included Proteobacteria, Acidobacteria, Chloroflexi, Actinobacteriota, Bacteroidota, Gemmatimonadota, Methylomirabilota, and Planctomycetota (Figure 5A). Microorganisms play an indispensable role in the growth and reproduction of plants. Proteobacteria, Acidobacteria and Chloroflexi were the most abundant in this study, and they have been proved to participate in the metabolism of carbon, nitrogen, and sulfur [35]. They can provide nutrition for plants and help plants resist external stress. Additionally, Acidobacteria contains a lot of acidophilic bacteria possessing good phosphorus removal effect [36]. The relative abundance of Proteobacteria in the C. demersum, H. verticillata and V. spiralis system were 26.18%, 23.10%, and 23.78%, respectively. In the C. demersum system, the H3 and H4 groups possessed higher proportions of Proteobacteria. However, in the H. verticillata system, Proteobacteria levels were lowest in the H3 group and highest in the H4 group. The relative abundance of Proteobacteria in the V. spiralis system was almost the same under various biochar treatments. There was not much difference in the relative abundance of Acidobacteria and Chloroflexi among the submerged plants. As for Actinobacteriota, the C. demersum system possessed the highest proportion (9.16%) and the V. spiralis system possessed the lowest proportion (7.93%). The relative abundance of Bacteroidota in the C. demersum, H. verticillata and V. spiralis system were 5.17%, 5.86%, and 6.61%, respectively. The relative abundances of the dominant microbes in different ecosystems were not significantly different, which might due to a relatively shorter domestication time (one month).
At genus level, unclassified genera in the order Vicinamibacterales (4.17%) and Rokubacteriales (3.15%) were the most abundant members, followed by unclassified genera in the family Vicinamibacteraceae (2.86%), Arthrobacter (2.85%), and Massilia (2.83%) (Figure 5B). The relative abundances of Massilia and unclassified members in the family Steroidobacteraceae were highest in the C. demersum system H3 group, with abundances of 5.59% and 3.47%, respectively. Massilia was reported as a regular soil microbe [37] and was effective in the degradation of phenanthrene and BTEX (Benzene, Toluene, Ethylbenzene, Xylene) [38,39]. The higher proportion of Massilia in the C. demersum system might function in the degradation of organic matters in biochar. In addition, Arthrobacter was also reported as a phenol degradation bacterium [40]. The relative abundance of Arthrobacter was higher in the C. demersum and H. verticillata systems, especially in the H3 group. These results indicated that amending biochar might change the composition of microbes in the sediment. However, the differences in our studies were not significant, which might be due to the insufficient experimental time. As the composition of biochar is complex and contains refractory organic matters, the long-term monitoring of these ecosystems is necessary.
The structures of microbial communities in 12 ecosystems were analyzed using Bray–Curtis based on the OTU level. The results showed that the microbial structure was different among submerged plants and biochar treatments (Figure 6). Samples from the H. verticillata systems were relatively clustered, indicating that supplementing biochar barely influenced the structure of the microbiota in this eco-system. However, samples from the C. demersum were relatively dispersed, suggesting a different microbial structure in the sediment. In response to different environments, the microbial community structure will reconstruct and finally reach a new balance [34], while it is difficult to change the stability of microbiota in short-term biochar treatments [41].
The potential functions of microbial community in constructed ecosystems were predicted using FAPROTAX analysis (Figure 7) [42]. The results showed that chemoheterotrophy, ureolysis, and symbiont with other organisms were the most popular functions. Respiration of nitrate and nitrogen were relative higher in the C. demersum system. The application of biochar changed the function groups in each submerged plant system. In the C. demersum system, functions related to human pathogens, phototrophy, nitrification, photoautotrophy, and cyanobacteria were relatively higher in the H3 group. In the H. verticillata system, nitrification was higher in groups supplemented with biochar, especially in group H4. In the V. spiralis system, microbes related to nitrification were higher in groups H2 and H3. The differences in the predicted functions indicated the particularity of submerged plants. The relationships between plant and microbes in the sediment need further exploration. Moreover, the interspecies differences in the sediment microbial communities affected by various biochar dosages need further research [43].

4. Conclusions

In this study, biochar was obtained from reeds, and 12 ecosystems were constructed using C. demersum, V. spiralis, and H. verticillata. The results showed that appropriate biochar (10–20 mg/g) addition to sediment benefited the growth of submerged plants as well as improved the water quality of the ecosystems, while under a higher concentration of biochar (40 mg/g), the improvement effect of water quality was not significant. Based on our results, 20 mg/g of biochar coupled with C. demersum is suggested in aquatic ecosystem restoration projects. Considering that the effect of biochar on the constructed ecosystem is uncertain, a long-term experiment should be carried out to investigate the relationship between microbiota and submerged plants under the treatment of biochar.

Author Contributions

All authors contributed to the study conception and design. S.Z.: Data curation, Writing—Original draft preparation; J.Z.: Visualization, Reviewing and Editing; K.F.: Investigation; L.L.: Methodology; H.W.: Conceptualization, Supervision. All authors have read and agreed to the published version of the manuscript.

Funding

This work was supported by the Key Project of National Natural Science Foundation of China (Grant number 42330705) and the National Natural Science Foundation of China (Grant number 52070064).

Data Availability Statement

Sequence data associated with this study have been deposited in the NCBI under the BioProject of PRJNA1051375.

Acknowledgments

We gratefully acknowledge the support of Collaborative Innovation Center for Baiyangdian Basin Ecological Protection, and Beijing-Tianjin-Hebei Sustainable Development.

Conflicts of Interest

The authors declare no conflict of interest.

References

  1. Yan, J.; Li, F. Effects of sediment dredging on freshwater system: A comprehensive review. Environ. Sci. Pollut. Res. 2023, 30, 119612–119626. [Google Scholar] [CrossRef] [PubMed]
  2. Dai, Y.; Jia, C.; Liang, W.; Hu, S.; Wu, Z. Effects of the submerged macrophyte Ceratophyllum demersum L. on restoration of a eutrophic waterbody and its optimal coverage. Ecol. Eng. 2012, 40, 113–116. [Google Scholar] [CrossRef]
  3. Shehzadi, M.; Afzal, M.; Khan, M.U.; Islam, E.; Mdbin, A.; Anwar, S.; Khan, Q.M. Enhanced degradation of textile effluent in constructed wetland system using Typha domingensis and textile effluent-degrading endophytic bacteria. Water Res. 2014, 58C, 152–159. [Google Scholar] [CrossRef]
  4. Wang, S.; Fu, B.; Gao, G.; Liu, Y.; Zhou, J. Responses of soil moisture in different land cover types to rainfall events in a re-vegetation catchment area of the Loess Plateau, China. Catena 2013, 101, 122–128. [Google Scholar] [CrossRef]
  5. Papanikolaou, N.; Britton, A.J.; Helliwell, R.C.; Johnson, D. Nitrogen deposition, vegetation burning and climate warming act independently on microbial community structure and enzyme activity associated with decomposing litter in low-alpine heath. Global Change Biol. 2010, 16, 3120–3132. [Google Scholar] [CrossRef]
  6. Layglon, N.; Misson, B.; Durieu, G.; Coclet, C.; D’Onofrio, S.; Dang, D.H.; François, D.; Mullot, J.-U.; Mounier, S.; Lenoble, V.; et al. Long-term monitoring emphasizes impacts of the dredging on dissolved Cu and Pb contamination along with ultraplankton distribution and structure in Toulon Bay (NW Mediterranean Sea, France). Mar. Pollut. Bull. 2020, 156, 111196. [Google Scholar] [CrossRef] [PubMed]
  7. Shackley, S.; Carter, S.; Knowles, T.; Middelink, E.; Haefele, S.; Haszeldine, S. Sustainable gasification–biochar systems? A case-study of rice-husk gasification in Cambodia, Part II: Field trial results, carbon abatement, economic assessment and conclusions. Energy Policy 2012, 41, 618–623. [Google Scholar] [CrossRef]
  8. Wu, W.; Yang, M.; Feng, Q.; McGrouther, K.; Wang, H.; Lu, H.; Chen, Y. Chemical characterization of rice straw-derived biochar for soil amendment. Biomass Bioenergy 2012, 47, 268–276. [Google Scholar] [CrossRef]
  9. Dai, Y.; Wang, W.; Lu, L.; Yan, L.; Yu, D. Utilization of biochar for the removal of nitrogen and phosphorus. J. Clean. Prod. 2020, 257, 120573. [Google Scholar] [CrossRef]
  10. Sarfraz, R.; Yang, W.; Wang, S.; Zhou, B.; Xing, S. Short term effects of biochar with different particle sizes on phosphorous availability and microbial communities. Chemosphere 2020, 256, 126862. [Google Scholar] [CrossRef]
  11. Chi, J.; Liu, H. Effects of biochars derived from different pyrolysis temperatures on growth of Vallisneria spiralis and dissipation of polycyclic aromatic hydrocarbons in sediments. Ecol. Eng. 2016, 93, 199–206. [Google Scholar] [CrossRef]
  12. Cairns, S.; Robertson, I.; Sigmund, G.; Street-Perrott, A. The removal of lead, copper, zinc and cadmium from aqueous solution by biochar and amended biochars. Environ. Sci. Pollut. Res. 2020, 27, 21702–21715. [Google Scholar] [CrossRef] [PubMed]
  13. Guo, W.; Lu, S.; Shi, J.; Zhao, X. Effect of corn straw biochar application to sediments on the adsorption of 17alpha-ethinyl estradiol and perfluorooctane sulfonate at sediment-water interface. Ecotoxicol. Environ. Saf. 2019, 174, 363–369. [Google Scholar] [CrossRef] [PubMed]
  14. Li, Y.; Xiong, X.; Zhang, C.; Liu, A. Sustainable restoration of anoxic freshwater using environmentally-compatible oxygen-carrying biochar: Performance and mechanisms. Water Res. 2022, 214, 118204. [Google Scholar] [CrossRef] [PubMed]
  15. Xiong, X.; Li, Y.; Zhang, C.; Zhou, X. Water quality improvement and consequent N2O emission reduction in hypoxic freshwater utilizing green oxygen-carrying biochar. Sci. Total Environ. 2023, 872, 162251. [Google Scholar] [CrossRef] [PubMed]
  16. Deng, C.; Huang, L.; Liang, Y.; Xiang, H.; Jiang, J.; Wang, Q.; Hou, J.; Chen, Y. Response of microbes to biochar strengthen nitrogen removal in subsurface flow constructed wetlands: Microbial community structure and metabolite characteristics. Sci. Total Environ. 2019, 694, 133687. [Google Scholar] [CrossRef] [PubMed]
  17. Lehmann, J.; Rillig, M.C.; Thies, J.; Masiello, C.A.; Hockaday, W.C.; Crowley, D. Biochar effects on soil biota—A review. Soil Biol. Biochem. 2011, 43, 1812–1836. [Google Scholar] [CrossRef]
  18. Wang, X.; Zhao, Y.; Yao, G.; Lin, Z.; Xu, L.; Jiang, Y.; Jin, Z.; Shan, S.; Ping, L. Responses of aquatic vegetables to biochar amended soil and water environments: A critical review. RSC Adv. 2023, 13, 4407–4421. [Google Scholar] [CrossRef] [PubMed]
  19. Jieyun, L.; Husen, Q.; Hong, T.; Jianlin, S.; Jinshui, W. Effects of Biochar Amendment on Soil Microbial Biomass Carbon, Nitrogen and Dissolved Organic Carbon, Nitrogen in Paddy Soils. Environ. Sci. 2019, 40, 3799–3807. [Google Scholar] [CrossRef]
  20. Awad, Y.M.; Blagodatskaya, E.; Ok, Y.S.; Kuzyakov, Y. Effects of polyacrylamide, biopolymer, and biochar on decomposition of soil organic matter and plant residues as determined by 14C and enzyme activities. Eur. J. Soil Biol. 2012, 48, 1–10. [Google Scholar] [CrossRef]
  21. Li, C.Y.; Chen, L.; Wang, T.F.; Li, L.Q.; Liao, G.Y.; Zhang, W.J.; Wang, D.S. Nitrogen and phosphorus diffusive fluxes across the sediment-water interface before and after dredging typical areas of Baiyangdian Lake. Acta Sci. Circumstantiae 2021, 41, 1401–1409. [Google Scholar]
  22. Song, Z.; Shi, X.; Liu, Z.; Sun, D.; Cao, N.; Mo, Y.; Zhao, S.; Zhao, C.; Yang, Y. Synthesis and characterization of reed-based biochar and its adsorption properties for Cu2+ and bisphenol A (BPA). Environ. Chem. 2020, 39, 2196–2205. [Google Scholar]
  23. Jin, S.; Zhou, J.; Bao, W.; Li, D.; Li, Y. Comparison of Nitrogen and Phosphorus Uptake and Water Purification Ability of Five Submerged Macrophytes. Environ. Sci. 2017, 38, 156–161. [Google Scholar]
  24. Zhang, Z.; Liu, H.; Sun, C.; Ma, Q.; Bu, H.; Chong, K.; Xu, Y. A C2H2 zinc-finger protein OsZFP213 interacts with OsMAPK3 to enhance salt tolerance in rice. J. Plant Physiol. 2018, 229, 100–110. [Google Scholar] [CrossRef] [PubMed]
  25. Liu, Y.; Wei, L.; Yu, H.; Cao, X.; Peng, J.; Liu, H.; Qu, J. Negative impacts of nanoplastics on the purification function of submerged plants in constructed wetlands: Responses of oxidative stress and metabolic processes. Water Res. 2022, 227, 119339. [Google Scholar] [CrossRef]
  26. Pérez-Jaramillo, J.E.; de Hollander, M.; Ramírez, C.A.; Mendes, R.; Raaijmakers, J.M.; Carrión, V.J. Deciphering rhizosphere microbiome assembly of wild and modern common bean (Phaseolus vulgaris) in native and agricultural soils from Colombia. Microbiome 2019, 7, 114. [Google Scholar] [CrossRef]
  27. Bing, W.; Shanshan, Z.; Zhijia, Q.; Qiang, G.; Yujie, L.; Shuxia, L. Effect of biochar on adsorption-desorption characteristics of nitrate nitrogen in black soil. J. Agro-Environ. Sci. 2016, 35, 115–121. [Google Scholar] [CrossRef]
  28. Deenik, J.L.; McClellan, T.; Uehara, G.; Antal, M.J.; Campbell, S. Charcoal volatile matter content influences plant growth and soil nitrogen transformations. Soil Sci. Soc. Am. J. 2010, 74, 1259–1270. [Google Scholar] [CrossRef]
  29. Solaiman, Z.M.; Murphy, D.V.; Abbott, L.K. Biochars influence seed germination and early growth of seedlings. Plant Soil 2011, 353, 273–287. [Google Scholar] [CrossRef]
  30. Liao, S.; Pan, B.; Li, H.; Zhang, D.; Xing, B. Detecting free radicals in biochars and determining their ability to inhibit the germination and growth of corn, wheat and rice seedlings. Environ. Sci. Technol. 2014, 48, 8581–8587. [Google Scholar] [CrossRef]
  31. Li, Y.; Huang, M.; Shen, F.; Guo, H.; Qing, W. Phytotoxic Effects of Biochar on Seed Germination and Early Growth of Wheat. Asian J. Ecotoxicol. 2017, 12, 234–242. [Google Scholar]
  32. Xu, W.; Wang, G.; Deng, F.; Zou, X.; Ruan, H.; Chen, H.Y.H.; Aitkenhead, M. Responses of soil microbial biomass, diversity and metabolic activity to biochar applications in managed poplar plantations on reclaimed coastal saline soil. Soil Use Manag. 2018, 34, 597–605. [Google Scholar] [CrossRef]
  33. Wei, H.; Cheng, S.; He, F.; Liang, W.; Wu, Z. Growth responses and adaptations of the emergent macrophyte Acorus calamus Linn. to different water-level fluctuations. J. Freshwater Ecol. 2014, 29, 101–116. [Google Scholar] [CrossRef]
  34. Li, W.; Zhou, J.; Ding, H.; Fu, H.; Liu, J.; Chen, Y.; Dai, T.; Lou, Q.; Zhong, X.; Fan, H.; et al. Low-dose biochar added to sediment improves water quality and promotes the growth of submerged macrophytes. Sci. Total Environ. 2020, 742, 140602. [Google Scholar] [CrossRef] [PubMed]
  35. Dai, Z.; Enders, A.; Rodrigues, J.L.M.; Hanley, K.L.; Brookes, P.C.; Xu, J.; Lehmann, J. Soil fungal taxonomic and functional community composition as affected by biochar properties. Soil Biol. Biochem. 2018, 126, 159–167. [Google Scholar] [CrossRef]
  36. Zhang, H.; Hao, C.; Bai, Z. Advance in acidophile. J. Microbiol. 2006, 26, 68–72. [Google Scholar] [CrossRef] [PubMed]
  37. Baek, J.H.; Baek, W.; Ruan, W.; Jung, H.S.; Lee, S.C.; Jeon, C.O. Massilia soli sp. nov., isolated from soil. Int. J. Syst. Evol. Microbiol. 2022, 72, 005227. [Google Scholar] [CrossRef] [PubMed]
  38. Gu, H.; Yan, K.; You, Q.; Chen, Y.; Pan, Y.; Wang, H.; Wu, L.; Xu, J. Soil indigenous microorganisms weaken the synergy of Massilia sp. WF1 and Phanerochaete chrysosporium in phenanthrene biodegradation. Sci. Total Environ. 2021, 781, 146655. [Google Scholar] [CrossRef]
  39. Son, J.; Lee, H.; Kim, M.; Kim, D.-U.; Ka, J.-O. Massilia aromaticivorans sp. nov., a BTEX Degrading Bacterium Isolated from Arctic Soil. Curr. Microbiol. 2021, 78, 2143–2150. [Google Scholar] [CrossRef]
  40. Lee, G.L.; Zakaria, N.N.; Futamata, H.; Suzuki, K.; Zulkharnain, A.; Shaharuddin, N.A.; Convey, P.; Zahri, K.N.; Ahmad, S.A. Metabolic pathway of phenol degradation of a cold-adapted antarctic bacteria, Arthrobacter sp. Catalysts 2022, 12, 1422. [Google Scholar] [CrossRef]
  41. Calbrix, R.; Barray, S.; Chabrerie, O.; Fourrie, L.; Laval, K. Impact of organic amendments on the dynamics of soil microbial biomass and bacterial communities in cultivated land. Appl. Soil Ecol. 2007, 35, 511–522. [Google Scholar] [CrossRef]
  42. Yang, Z.; Peng, C.; Cao, H.; Song, J.; Gong, B.; Li, L.; Wang, L.; He, Y.; Liang, M.; Lin, J.; et al. Microbial functional assemblages predicted by the FAPROTAX analysis are impacted by physicochemical properties, but C, N and S cycling genes are not in mangrove soil in the Beibu Gulf, China. Ecol. Indic. 2022, 139, 108887. [Google Scholar] [CrossRef]
  43. Kuzyakov, Y.; Subbotina, I.; Chen, H.; Bogomolova, I.; Xu, X. Black carbon decomposition and incorporation into soil microbial biomass estimated by 14C labeling. Soil Biol. Biochem. 2009, 41, 210–219. [Google Scholar] [CrossRef]
Figure 1. Schematic diagram of the experimental device.
Water 16 01710 g001
Figure 2. Characteristics of biochar. (AD), morphology of biochar observed by SEM; (E), particle size distribution of biochar; (F), Fourier infrared spectrum of biochar.
Water 16 01710 g002
Figure 3. Effect of biochar on the biomass (A), chlorophyll (B) and DMA content (C) of different submerged plants. Different letters above the column indicate significant differences between groups (p < 0.05).
Water 16 01710 g003
Figure 4. Purification effect of constructed ecosystem. (AE), Physical and chemical properties of water in the C. demersum systems; (FJ), physical and chemical properties of water in the H. verticillata systems; (KO), physical and chemical properties of water in the V. spiralis systems.
Water 16 01710 g004
Figure 5. Composition of microbial communities in constructed submerged plant ecosystems. (A), at phylum level; (B), at genus level.
Water 16 01710 g005
Figure 6. Structure of microbial community in sediments from different ecosystems.
Water 16 01710 g006
Figure 7. Predicted functions in constructed submerged plant ecosystems.
Water 16 01710 g007
Table 1. Growth rate of submerge plants in different treatment groups [mg/(g·d)].
Dose of Biochar (mg/g)0102040
C. demersum0.0480.0510.0570.041
V. spiralis0.0600.0650.0680.057
H. verticillata0.0430.0480.0510.041
Disclaimer/Publisher’s Note: The statements, opinions and data contained in all publications are solely those of the individual author(s) and contributor(s) and not of MDPI and/or the editor(s). MDPI and/or the editor(s) disclaim responsibility for any injury to people or property resulting from any ideas, methods, instructions or products referred to in the content.

