Abstract
The industrial sector’s water consumption is projected to increase by 400% by 2050, placing significant stress on freshwater reserves. To address this challenge, innovative solutions for water management are crucial. This paper proposes a comprehensive framework for Rainwater Harvesting (RWH) in industrial settings, offering a methodology to assess the potential for RWH implementation across EU industrial sites. The framework integrates internal and publicly available datasets, including EU climate change monthly average rainfall data from the Copernicus Climate Data Store, to create current and prospective scenarios for RWH. The methodology evaluates critical parameters co-created with industrial stakeholders, such as catchment area, water quality, and industrial water requirements. This approach allows for site-specific assessments, enabling industries to reduce freshwater consumption and support sustainability goals within the Horizon 2050 framework. Our findings indicate that implementing RWH systems can significantly contribute to a sustainable and circular economy by reducing annual freshwater consumption, promoting resource reuse, and lowering industrial water costs. This framework provides industries with a tool to assess RWH feasibility, supporting their efforts to prepare for increased water demands and contribute to environmental conservation.
1. Introduction
The increasing stress on freshwater resources poses a significant challenge to global sustainability. This stress is expected to grow, especially within the industrial sector, which anticipates a 400% increase in water consumption by 2050 [1]. The adoption of rainwater harvesting (RWH) practices has emerged as a promising solution, contributing to United Nations Sustainable Development Goal 6: Clean Water and Sanitation [2].
RWH has proven effective in reducing freshwater consumption by utilising alternative sources for various applications, such as toilet flushing, irrigation, and cleaning. This method has primarily been implemented in urban and domestic settings [3,4], with additional benefits in terms of reducing flooding through surface runoff collection [5]. Moreover, RWH can promote groundwater recharge, mitigating urban heat island effects [6,7], and leading to a multipurpose system within urban environments [8,9]. Yet, while RWH has been successfully implemented in large commercial buildings, such as supermarkets, schools, and office buildings [10], its adoption in the industrial sector remains limited. The industrial sector faces key challenges to overcome for RWH adoption. First, the temporal variability of rainfall often mismatches with steady industrial water needs [11,12]. Moreover, the financial viability of RWH systems is often governed by water prices, which can fluctuate [10,13].
However, the need for RWH in the industrial sector is becoming more urgent due to projected water consumption increases. This has led to a growing interest in RWH’s role in industrial applications, with literature studies suggesting its potential for irrigation and cooling [14]. EU legislation, such as Regulation (EU) 2020/741 [15], supports RWH initiatives, especially within the context of a circular economy and climate change adaptation. These regulations encourage industries to explore RWH as part of their sustainability strategy. Ghisi and Schondermark (2013) [16] studied the feasibility of RWH systems and concluded that, in most cases, they are viable when non-potable demand is low. Imteaz et al. (2017) [17] concluded that potential freshwater substitution can be achieved with harvested rainwater; however, its efficacy depends on annual rainfall, freshwater demand, the available catchment area, and rainfall seasonality. Guidelines for designing and assessing RWH systems should incorporate the most up-to-date records of precipitation for the targeted region. The effect of using long-term or short-term temporal rainfall in simulations can potentially impact overall investment; however, Geraldi and Ghisi (2018) [18] determined that the use of short-term temporal series to simulate RWH is valid, but depends on the rainfall characteristics in the target region. To this end, the European Standard EN 16941-1 [19] recommends the use of total annual rainfall for a basic approach, i.e., for regular demand cases, or more complex cases with irregular demand and yield, continuous rainfall temporal spanning a minimum of 5 years should be considered. Whichever approach is followed, the European Standard does not stipulate whether historical or future projections should be used—a criterion for the decision-maker. The concern with employing historical data is that it does not reflect the pressures and risks potentially derived from climate change on a regional basis. As climate change moulds our water cycle, whether through increasing levels of water vapour in the atmosphere, which induces uncertainty regarding availability, making it less foreseeable and leading to more intensive rainfall in a given region. In contrast, other regions will face severe droughts [20].
As observed by Santos et al. (2020) [21], RWH will play an important role in “promoting water use efficiency as well as strengthening and diversifying water sources”. However, the current approach to designing and measuring these aspects for RWH systems based on historical data is insufficient as rainfall patterns will change in the coming years and could hinder their implementation. Santos et al. [21] also considered precipitation data in the light of different climate change scenarios: Representative Concentration Pathways (RCP) 4.5 and RCP 8.5, which account for uncertainties regarding forcing; however, model response and internal variability were not accounted for. This translates into different models returning different results for the same inputs [22]. Other studies have correlated precipitation with the total available catchment area [23], incorporating local water prices to estimate financial feasibility. However, the main limitation of the approach was that it considered historical rainfall data only.
To address the identified gaps and contribute to a more sustainable implementation of RWH systems in the industrial sector, this work presents a self-assessment framework designed to evaluate the potential for implementing RWH systems at industrial sites. This framework relies on internal and publicly available datasets, such as EU climate change monthly average rainfall data from the Copernicus Climate Data Store [24], following RCP scenarios. It projects potential rainfalls for a temporal timescale and the harvestable water volumes, as well as presenting a stepwise approach to increasing harvest area(s) requirement(s) considering the input parameters expected at industrial sites and industrial freshwater consumption patterns. The framework was tested on three industrial sites located in different EU regions: Atlas Concorde (Cheramiche Keope Facility), Italy; Alufluor AB, Sweden; and Tubacex Tubos Inoxidables, Spain.
The aim of this work is to provide industries with a simple and cost-effective tool for evaluating the potential of RWH, encouraging a broader adoption of these systems. This can lead to reduced freshwater consumption, a decreased carbon footprint, and enhanced compliance with sustainability goals. The insights gained from our study can help industries make informed decisions, ultimately contributing to a sustainable and circular economy. This can potentially guide industrial stakeholders through a structured process for RWH implementation, demonstrating its benefits, feasibility, required areas, and potential economic savings. Moreover, it aims to promote sustainable practices within the industrial sector and encourage the adoption of RWH as a viable strategy for water management and conservation.
2. Materials and Methods—Framework
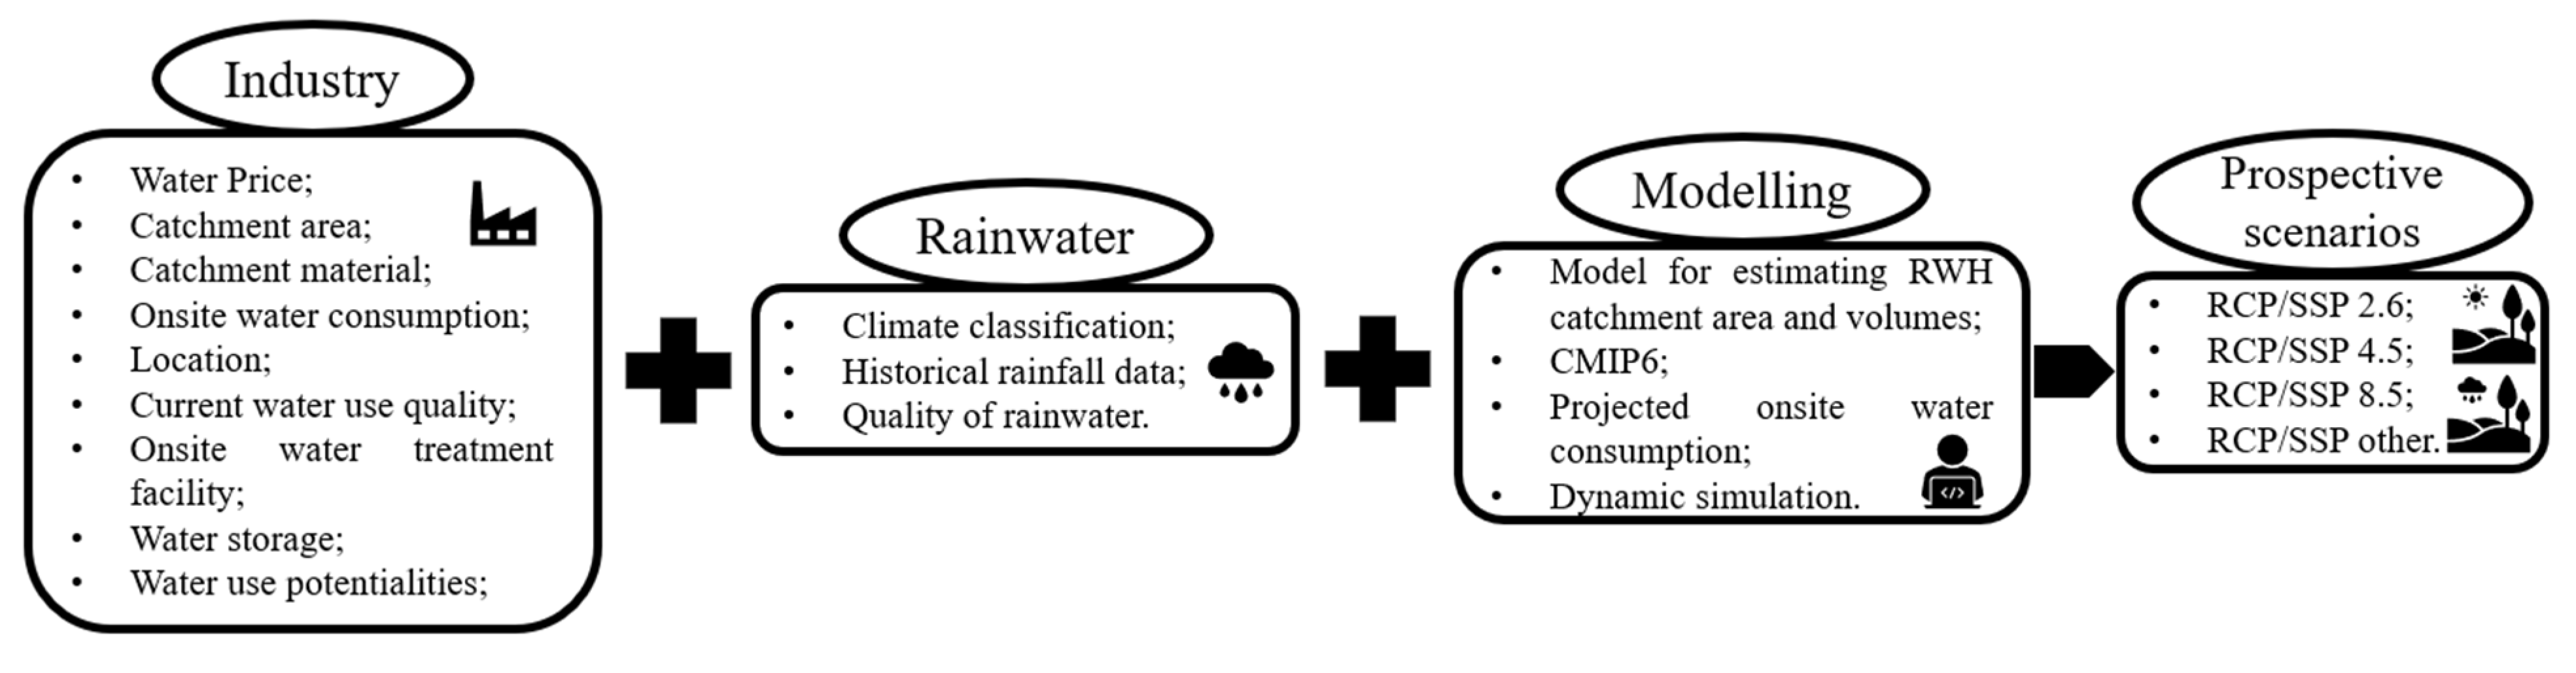
The proposed framework aims to guide the integration of a rainwater harvesting (RWH) system into a given industrial site. It identifies strategies and solutions to facilitate the effective implementation of RWH, focusing on key factors such as industry-specific needs, rainwater input, and projected rainfall. Figure 1 illustrates this framework, which consists of four main steps:
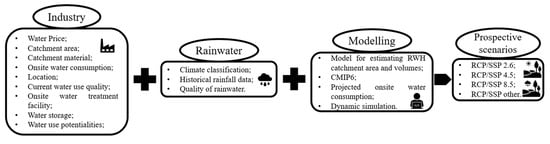
Figure 1.
Framework for assessing the feasibility of RWH in industrial contexts.
- Industry Information: This step gathers data from the industrial site to understand its current operations and water usage. It assesses the site’s existing infrastructure, water requirements, and operational constraints to determine how RWH can be integrated into the existing processes;
- Rainwater Input: This step involves collecting climate and rainwater-related information, focusing on rainfall patterns and potential catchment areas. It involves data from publicly available sources and internal site assessments to estimate the quantity and quality of rainwater available for harvesting;
- Modelling the Catchment Area and Rainwater Volumes: The framework employs modelling techniques to estimate the catchment area and the expected rainwater volumes. This step directly incorporates data from the Coupled Model Intercomparison Project Phase 6 (CMIP6) [25], which provides average monthly rainfall estimates for the 2030 and 2050 time horizons (not limited to). This allows for an understanding of rainwater availability, considering both current and future scenarios;
- Projecting Rainfall and Shared Socioeconomic Pathways (SSPs): Projection of future rainfall based on CMIP6 data, framed within the Intergovernmental Panel on Climate Change (IPCC) Shared Socioeconomic Pathway (SSP) narratives [26]. Global SSP narratives are interpreted on a regional scale for this purpose. These narratives offer different future scenarios, allowing for a more robust and adaptable RWH strategy. By considering SSP projections, the framework can inform optimal RWH solutions that align with broader sustainability goals.
2.1. Industry
The first step in the framework involves gathering site-specific information about the industrial context (Figure 1) and identifying specific characteristics of the targeted industrial park. This step requires data collection from industrial site stakeholders and online open-access information, as summarised in Table 1. By collecting this information, the decision-maker (DM) can assess the requirements for implementing a rainwater harvesting (RWH) system and determine past and current water consumption rates, as well as water expenditure. It is important to collect information, such as the currently available harvest area, as it informs on the potential volume of harvestable rainwater, while water prices can convey the potential economic savings of substituting freshwater with rainwater. These are important drivers when implementing an RWH system.

Table 1.
Description of the industrial step requirements (site-specific characteristics).
The structure and material of the catchment area may affect water quality and can be characterised by the Rooftop Runoff Coefficient (RRC). Most EU industries use concrete or metal/iron materials for rooftops. The RRC measures the efficiency of rainwater collection, typically ranging from 0.7 to 0.9 for shorter rainfall events, depending on factors like climate conditions, shape, and design of the catchment area. During longer rain events, the RRC generally varies between 0.8 and 0.9. Industrial parks with large rooftops are ideal for RWH due to their expansive surface areas. Besides rooftops, other catchment options include photovoltaic panels, which offer solar energy while providing a secondary function, as rainwater collectors can also be considered. Shading structures over parking areas can also serve as catchment surfaces.
The presence of an onsite water treatment facility can simplify the treatment of harvested rainwater, allowing for more flexibility in RWH system design. If such facilities are not present, the feasibility of incorporating water treatment systems to accommodate harvested rainwater should be assessed. By analysing past and current freshwater consumption datasets, it is possible to establish annual water requirements and trends, enabling projections for future water demand. These projections can assist in setting consumption targets in consultation with experts. Additionally, the water quality of the source(s) is evaluated to determine if harvested rainwater can be used directly in the industry, depending on specific industrial processes, cleaning/maintenance, sanitation, gardening, and other uses.
If the industrial site has alternative greywater circuits, reinjection points, or other existing systems, these should also be factored into the framework to optimise RWH strategies. This approach ensures that all potential resources are considered, enabling a more sustainable and efficient implementation of RWH systems in industrial contexts.
2.2. Rainwater
The second step of the framework involves collecting information regarding the rainwater step: characterising the local climate, historical precipitation, and rainwater quality—(Table 2) which determines its suitability for different types of industrial uses.
Table 2.
Description of Rainwater step requirements.
The climate of the industrial area is determined in the first step—the Köppen climate classification system provides high-level information that can be compared with current and historical data. This classification communicates the type of climate group in the region as well as the seasonal precipitation trend and heat level through a 3-letter classification process [27]. Sampling campaigns of rainwater as runoff from the catchment area are recommended to characterise its chemical composition, both during the first-flush and later during the rainfall event. Targeted analysis of the rainwater should be decided on by the industry. The sampling campaign will determine if the rainwater can be directly used, which industrial processes can receive it, and if additional treatment steps are required (indirect use—industrial step). Historical rainfall data should be retrieved from verified sources such as national services, Copernicus, or the European Climate Assessment and Dataset (ECA&D) [28]. Statistical analysis and metrics of historical data will determine the potential volume of water recovered by the catchment area, whether it is economically attractive, or if expanding the catchment area is required.
2.3. Prospective Scenarios
To estimate potential future rainfall volumes, the Intergovernmental Panel on Climate Change (IPCC) framework of Shared Socioeconomic Pathways (SSPs) is used, allowing for the utilisation of Coupled Model Intercomparison Project Phase 6 (CMIP6) model results [25]. This framework provides monthly average rainfall estimates across the entire EU territory through 2100, derived from various regional models available in the Copernicus Climate Change Service datastore [24]. The SSPs originated in the 5th IPCC Assessment Report [29,30,31,32], where they played a central role. These narratives link different levels of CO2 concentration, socioeconomic development trajectories, and collective policy assumptions, creating a foundation for global scenarios designed with internal consistency. The intersection of SSPs with Representative Concentration Pathways (RCPs) forms a comprehensive matrix that represents human influence on the climate system.
This framework is further enriched by integrating shared policy assumptions into the RCP/SSP matrix, enabling the development of policy-driven mitigation scenarios [33,34]. This additional complexity allows for a more nuanced approach to climate change projections, providing a robust structure for examining a wide range of potential futures. In the current research, the monthly rainfall estimates were retrieved from the UKESM1-0-LL model simulations for each scenario [35,36]. Specifically, the study was framed considering the different pathways shown in Table 3.
Table 3.
Applied pathway scenarios for rainfall simulation.
Besides the scenarios outlined in Table 3, industries are also expected to face an increase in water consumption over time. This trend can be projected from historical data on annual operations, allowing us to postulate percentage increases in water demand. These projections consider potential changes in production trends and external factors, such as political, economic, or technological disruptions, that might impact production and water consumption. To simplify the analysis, these projections are extrapolated linearly. These projections can be complexified by industrial operators based on the analysis of their business plan and the envisioned local context evolution regarding water resource access regulations.
2.4. Model Parameters
Data were collected from the industries regarding historical freshwater consumption. Abnormal years were included in the analysis, as these represent potential disruptions to normal operation, i.e., the year 2020 saw a decline in overall world production of consumables and materials due to the COVID-19 pandemic. These events will potentially occur in the future more frequently, with varying impacts, therefore resulting in unforeseeable degrees of disruption in production and overall industrial consumption. The main drivers for pandemic outbreaks can be attributed to several factors, such as increased travel, urbanisation, climate change, etc. [37,38]. Additionally, a report requested by the European Parliament’s Committee on Industry, Research, and Energy (ITRE) demonstrated the effect the COVID-19 pandemic had on industries across the EU [39]. Table 4 presents the proposed model parameters, which involve collecting data from industries to support the decision-making process for implementing RWH. This includes parameters like average annual growth rate (AAGR), maximum water consumption, and rooftop area and runoff coefficient (RRC). Equations are found in the Supplementary Material document (S1 and S2).
Table 4.
Model parameters for Decision Support System (DSS) for implementing RWH solutions.
2.5. Data Processing and Decision Support System (DSS) Techniques
Data retrieved from the Copernicus datastore were aggregated into yearly precipitation for each region regarding each RCP/SSP narrative from 2023 to 2050. Historical precipitation data were retrieved from the European Climate Assessment and Dataset (ECA&D) [28], resulting in the calculation of monthly averages and aggregation into yearly precipitation for each region. Decision support was based on simulation output from historical freshwater consumption data and projected precipitation data bound to the RCP/SSP narrative from 2023 to 2050. Potential savings from employing RWH were based on the current prices of freshwater from the water line. Different scenario simulations were performed to evaluate the tool and potential outcomes for different RWH strategies.
2.6. Decision-Making Process
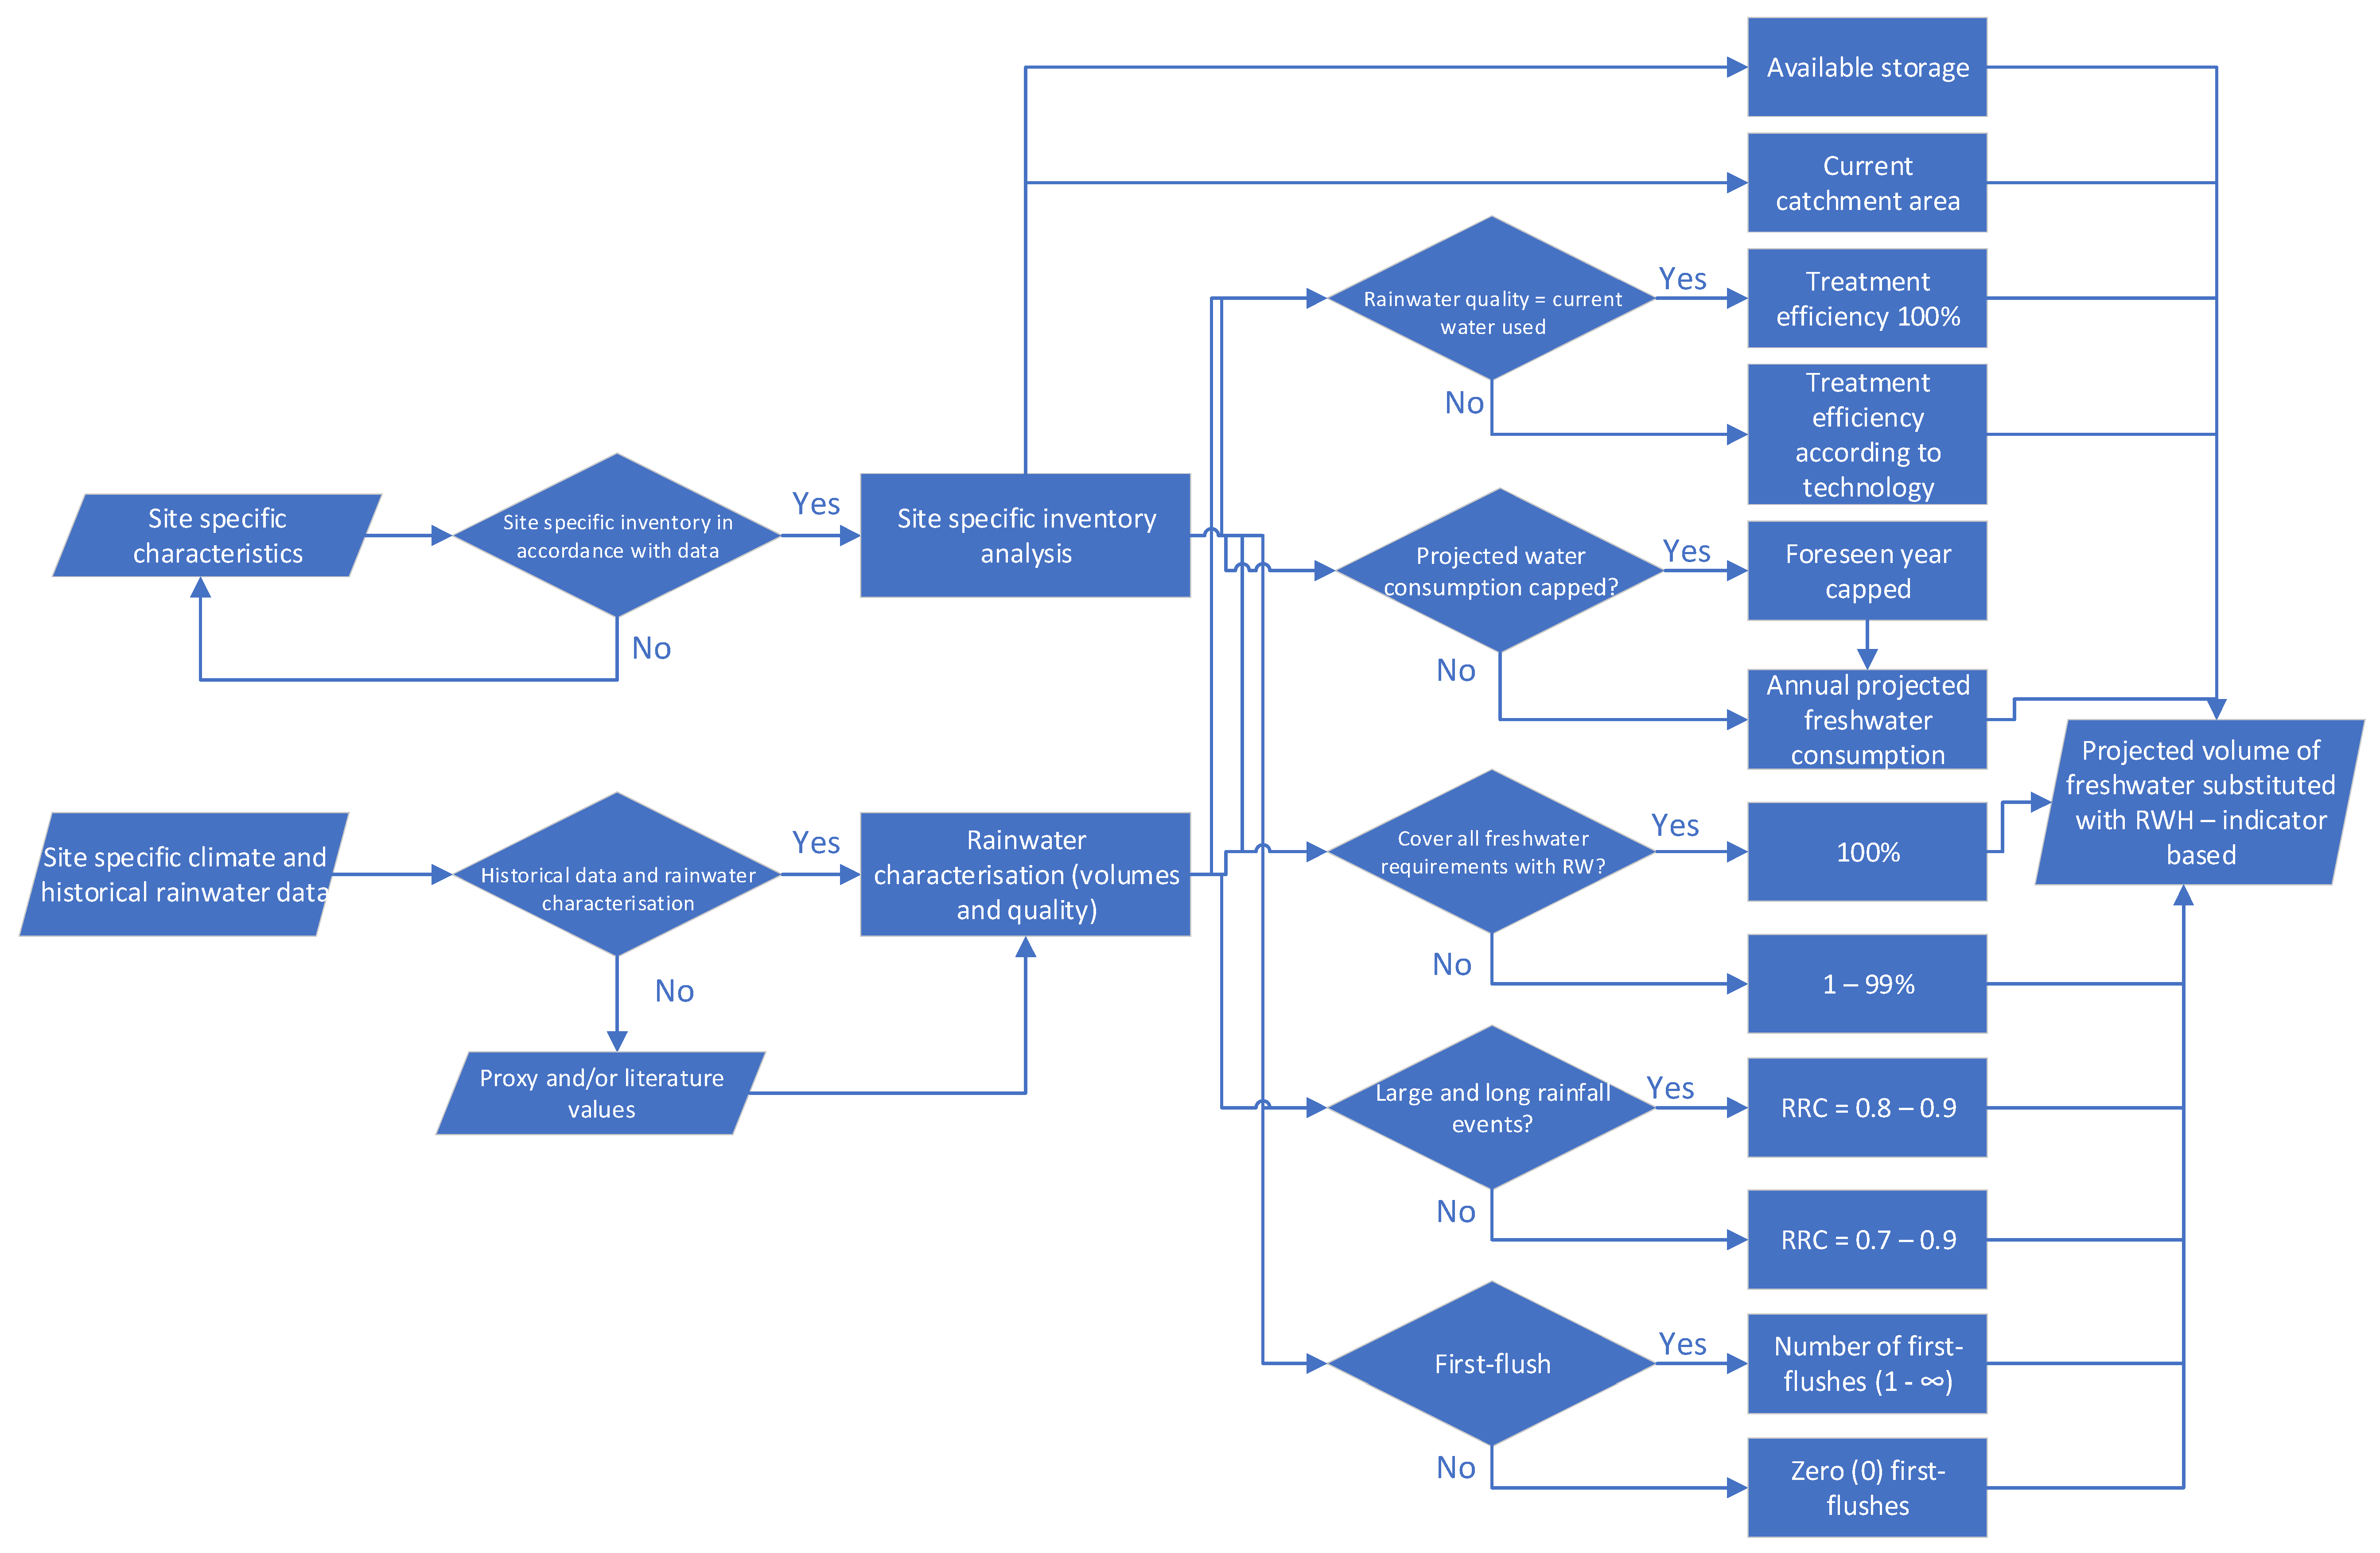
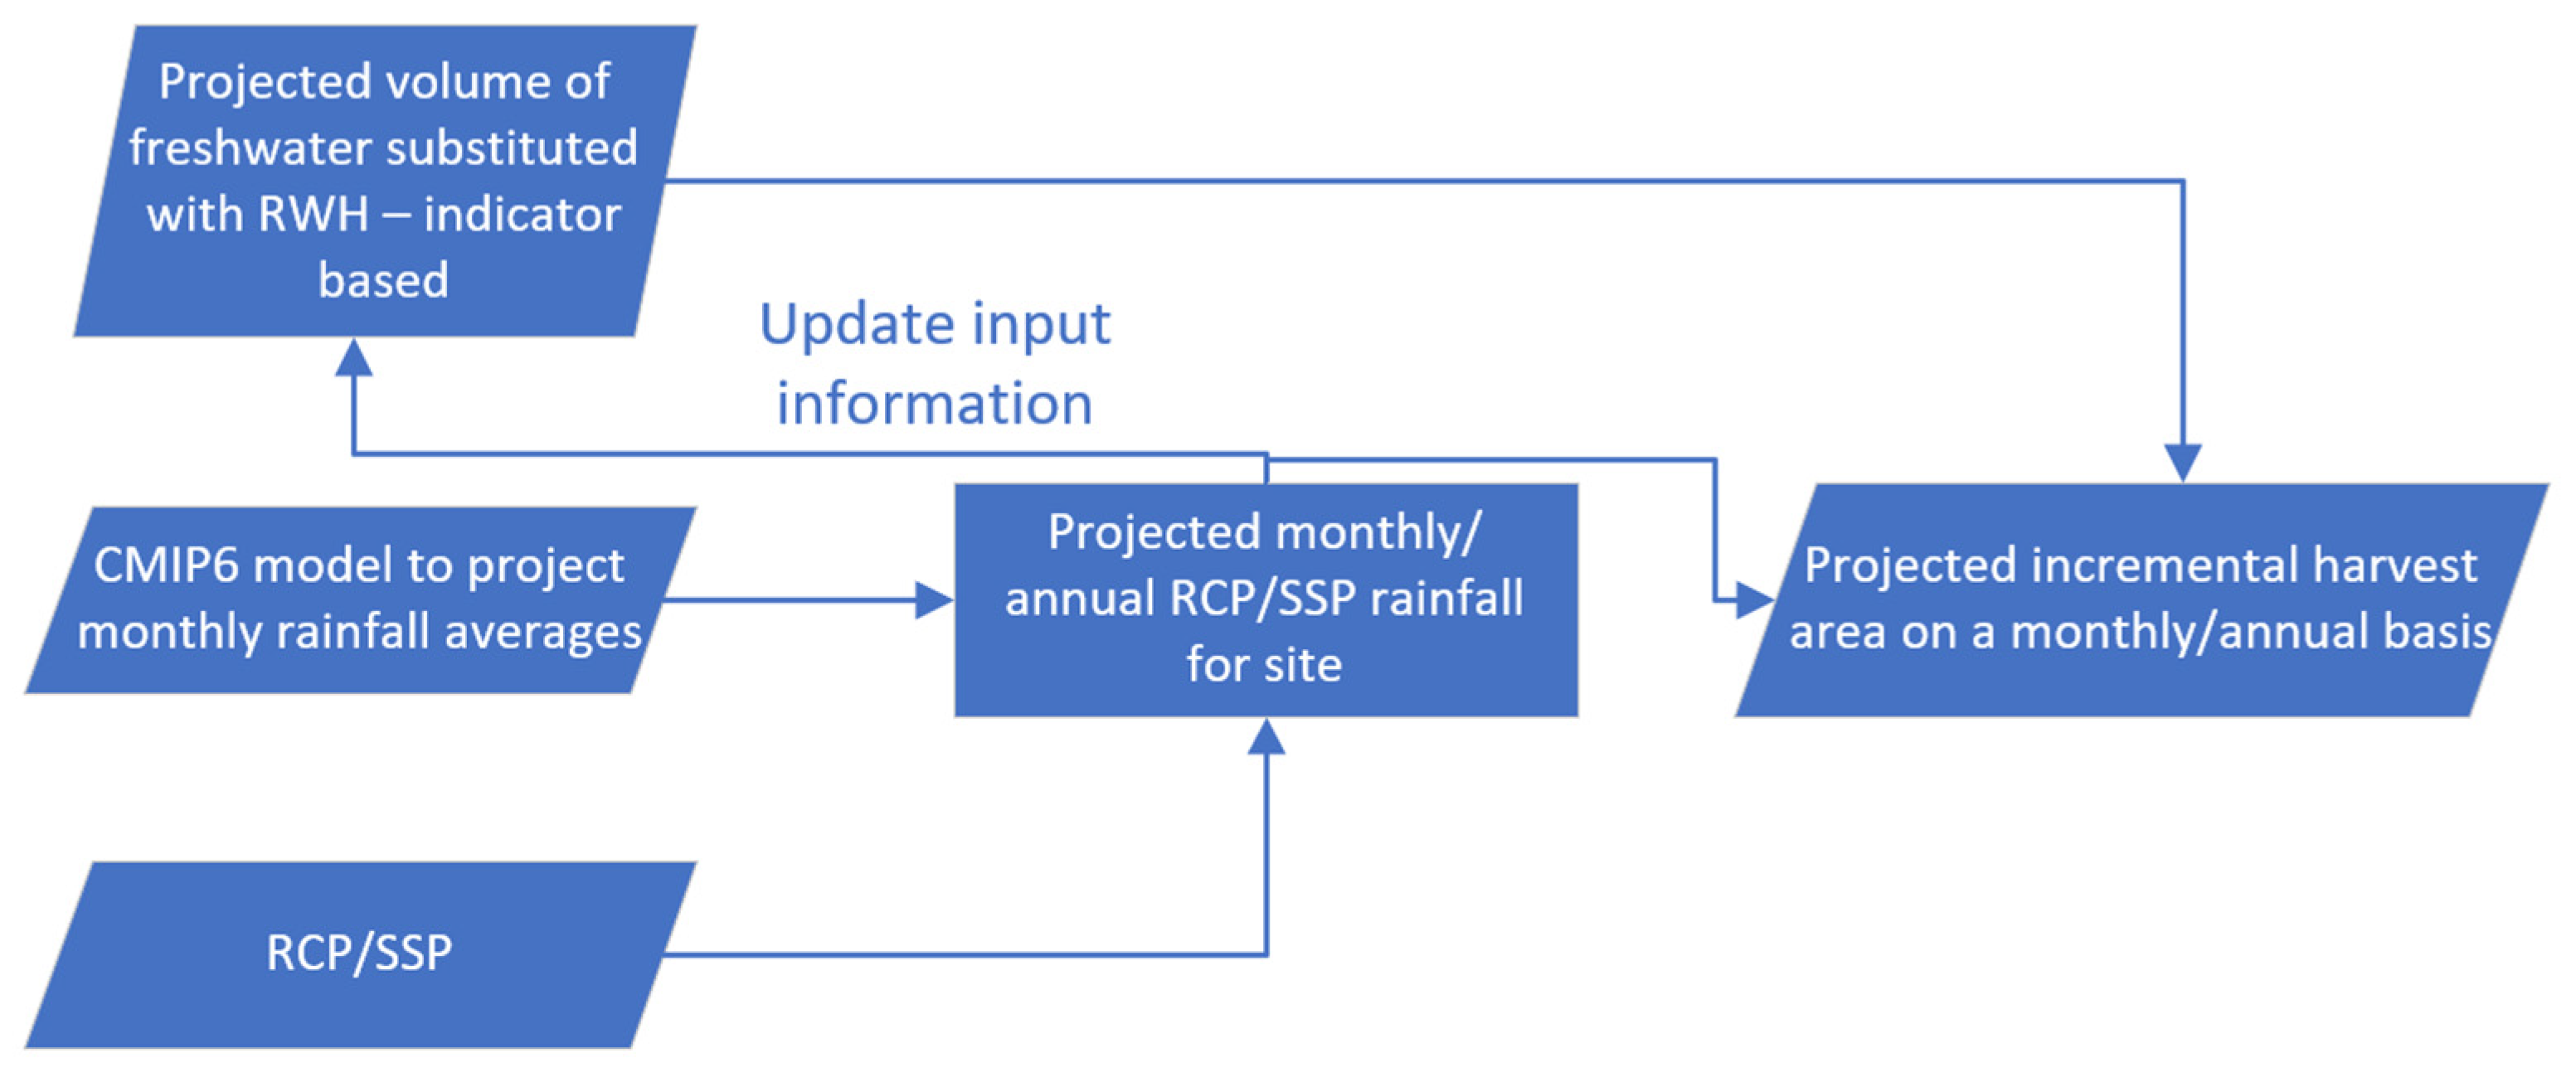
The decision-making process for implementing RWH is outlined in Figure 2, which represents the baseline scenario. This scenario assesses the current state of an industrial site, considering various factors such as existing onsite structures, available catchment areas, rainwater volumes to meet current water requirements, rainwater quality, historical precipitation data, rainfall types, material characteristics, and first-flush. In the baseline scenario, the framework evaluates the feasibility of RWH by examining these key parameters. It starts by analysing the site’s catchment area and comparing it with historical rainfall data to estimate the potential rainwater volume. The quality of rainwater is assessed based on factors like the first-flush, which can affect contamination levels. Material characteristics, such as those of rooftops or other structures, are also considered, as they can impact the efficiency of rainwater collection. Figure 3 expands on Figure 2 by incorporating prospective scenarios based on the Representative Concentration Pathways (RCP) and Shared Socioeconomic Pathways (SSP), using the Coupled Model Intercomparison Project Phase 6 (CMIP6) model from the Copernicus platform. These prospective scenarios consider projected rainfall patterns and volumes for the 2030 and 2050 timeframes, offering a broader perspective on future RWH potential. Projected freshwater consumption is also considered regarding prospective scenarios as well as temporal capping of freshwater consumption. The outputs from these flowcharts indicate the expected volume of freshwater that could be replaced by projected harvested rainwater on a yearly basis. In Figure 3, the flowchart also indicates the required harvest area to achieve the targeted annual water consumption. This step allows decision-makers to determine if the existing catchment areas are sufficient or if additional structures are needed to meet future water requirements.
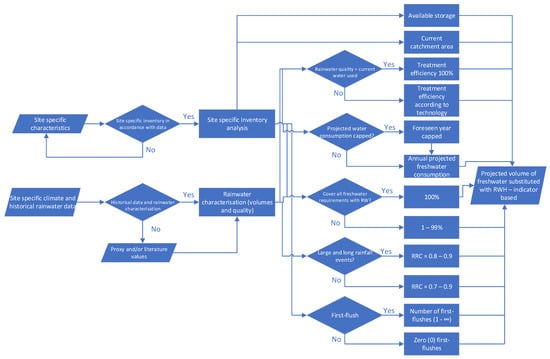
Figure 2.
Flowchart for determining projected rainwater volumes considering current harvest.
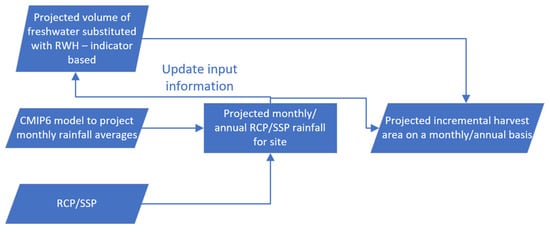
Figure 3.
Expanded flowchart to include scenario analysis following the RCP/SSP pathways and projecting harvest areas.
Furthermore, the framework identifies excess volumes of projected harvested rainwater. This information is valuable for industries aiming to optimise their RWH systems, as it suggests a potential for storage or redistribution of excess rainwater for other purposes. By analysing both baseline and prospective scenarios, the decision-making process provides a comprehensive approach to guide industries in implementing effective RWH systems.
2.7. Industrial Sites
Three industrial sites were assessed using the proposed framework. All three industries are very different and located in different countries in the EU, but they are all water-intensive consumers (Table 5 and Table 6). A short description of the industrial sites and their activities is given in Table 5.
Table 5.
Industrial site and activities.
Table 6.
Data collected to conduct the RWH analysis for the industrial cases.
2.8. Industrial and Rainwater Steps
This section provides a general overview of the three industrial sites evaluated in the study, highlighting their unique characteristics and relevance to rainwater harvesting. The proposed framework was applied to three industrial sites in different European regions (Table 6), testing its adaptability across various contexts while maintaining a standardised methodology.
Information in Table 6 supports steps 1 and 2 of the framework (Figure 1), while data collection involved sampling freshwater sources and local rainwater, following each country’s analytical standards. This approach ensures reliable data for accurate comparisons between sites. Additional information was obtained directly from the industries, providing insights into their infrastructure, water usage, and operational requirements. This comprehensive approach helps evaluate the potential for rainwater harvesting (RWH) in industrial settings. While the focus is on water sources and rainwater quality, other factors, such as metal contamination, are also considered. This flexibility ensures the framework meets industry standards and regulatory compliance, as well as process requirements. By testing the framework across different sites, we demonstrate its versatility and scalability, allowing industries to assess their specific needs and adapt the framework accordingly.
All sites have a drainage connection to discharge rainwater collected on the roof, although this would require modification in order to accommodate an RWH solution. The data in Table 6 indicates that the TTI industrial site has the largest catchment area, aided by the highest average annual precipitation rate, thus suggesting it has the highest potential for rainwater harvesting. By analysing the data collected for each site, the following may be considered:
- CON (Italy): The harvested rainwater’s quality is better than the freshwater source, indicating that no treatment is required. This means that 100% of the harvested rainwater can be used in industrial processes. If treatment were necessary, the onsite water treatment facility could be used, but this would reduce freshwater recovery and increase chemical and energy consumption. The existing rooftop area serves as the catchment zone, and onsite storage tanks are available for rainwater storage.
- ALU (Sweden): The freshwater source has key variables lower than those in the rainwater, such as calcium (Ca) and fluoride (F). Calcium levels below 1 mg/L are required to avoid scaling in industrial processes, indicating a need for treatment to remove calcium from the rainwater. The onsite water treatment facility, a sand filter and softener system, could be used to achieve the required quality for reuse. However, the overall rooftop area available for harvesting is the smallest of the three, contrasting with overall freshwater consumption being the highest of the three.
- TTI (Spain): The quality of rainwater is similar to that of freshwater sources, but treatment may still be necessary to ensure consistent rainwater quality for industrial use. A sand filter might be sufficient to treat the rainwater. Among the three sites, TTI has the largest rooftop structure, providing the greatest catchment area for rainwater harvesting.
By addressing the specific requirements and challenges of each site, the RWH framework can be tailored to meet the unique needs of different industrial environments. This approach allows for flexibility in treatment and storage, optimising the use of harvested rainwater, and supporting sustainable practices within the industrial sector. Analysing historical precipitation data helps estimate the potential for rainwater harvesting and informs economic savings projections by providing an initial estimate of the potential volume of rainwater that can be harvested (assuming 100% recovery) based on the current catchment area. This information is useful for presenting to stakeholders as part of the rainwater harvesting (RWH) planning process. Table 7 shows the estimated volumes of harvestable rainwater for each industrial site and the corresponding potential economic savings (PES). This translates into reducing the costs associated with sourcing freshwater from conventional sources.
Table 7.
Potential volume of harvestable rainwater and potential economic savings based on historical data and the current harvest area available.
2.9. Expected and Projected Industrial Freshwater Consumption
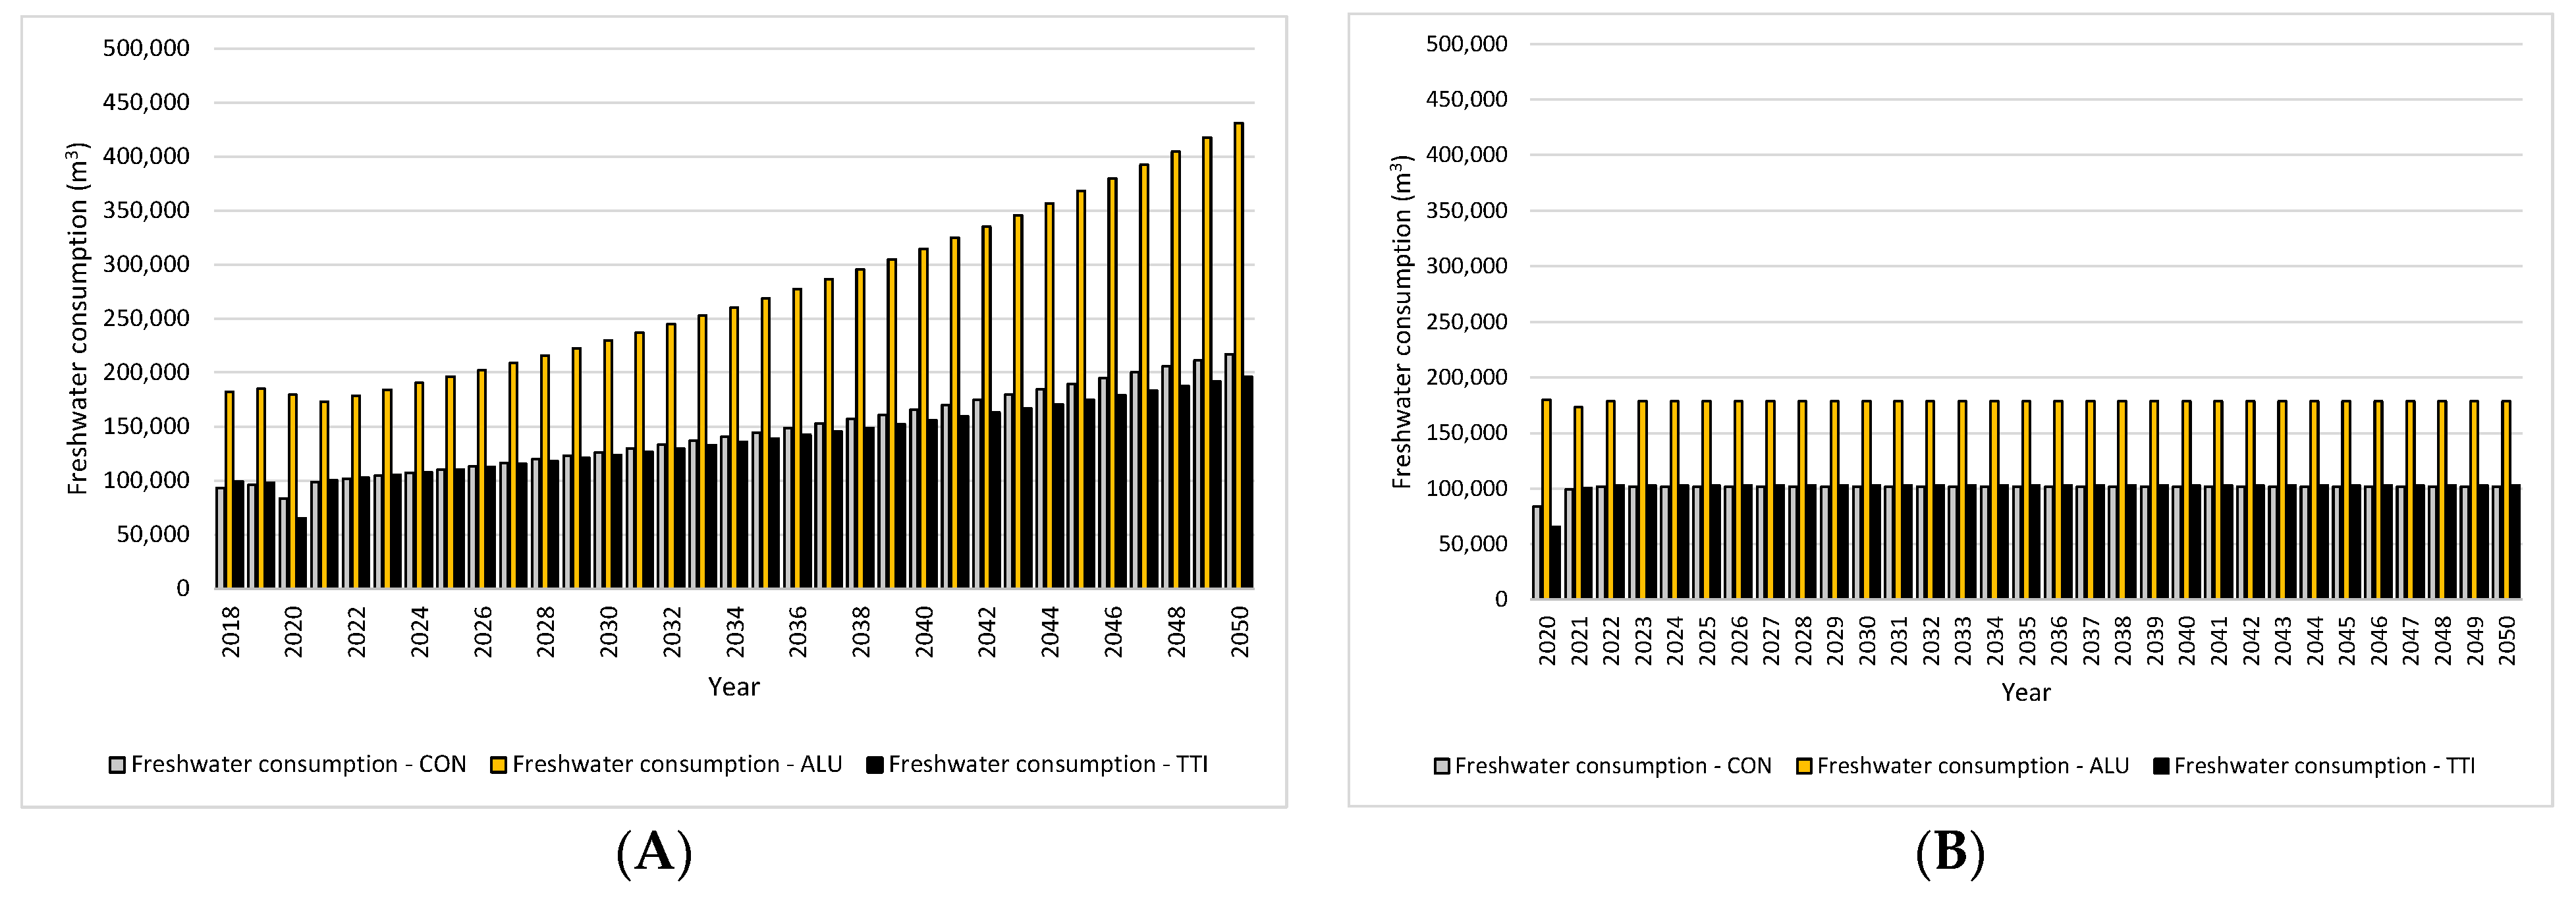
This section projects freshwater consumption for each industrial site, providing insight into future water needs. Historical freshwater consumption data were collected from each industrial site, covering the period 2013–2021. The data also includes abnormal years. Table 8 shows the Average Annual Growth Rate (AAGR), representing the mean increase in the water consumption rate. The AAGR is a linear estimation calculated using the arithmetic mean from historical data following Equations (S1) and (S2) (Supplementary Material). According to Table 8, water consumption by the three industries is expected to increase by an average of 2–3% per year. By 2050, both ALU and TTI are projected to nearly double their freshwater consumption, while CON is expected to more than double its current rate (Figure 4A). However, ALU does not anticipate an increase in water consumption, and its usage has been capped at 2022 levels (Figure 4B). To maintain consistency for comparison’s sake, the water consumption for CON and TTI has also been capped at 2022 rates. This flexibility allows decision-makers to set consumption limits as needed.
Table 8.
AAGR and projected annual freshwater consumption increase (2030, 2040, and 2050).

Figure 4.
(A) Projected industrial freshwater consumption for CON, ALU, and TTI (2020–2050); (B) Projected industrial freshwater consumption for CON, ALU, and TTI (2020–2050) capped from 2022. 2018 and 2022: observed freshwater consumption.
Figure 4 provides the projected freshwater consumption results for the industrial sites until 2050, illustrating the impact of growth rates and capped consumption on overall water use.
2.10. Projected Rainfall Simulation Considering the Representative Concentration Pathway (RCP)
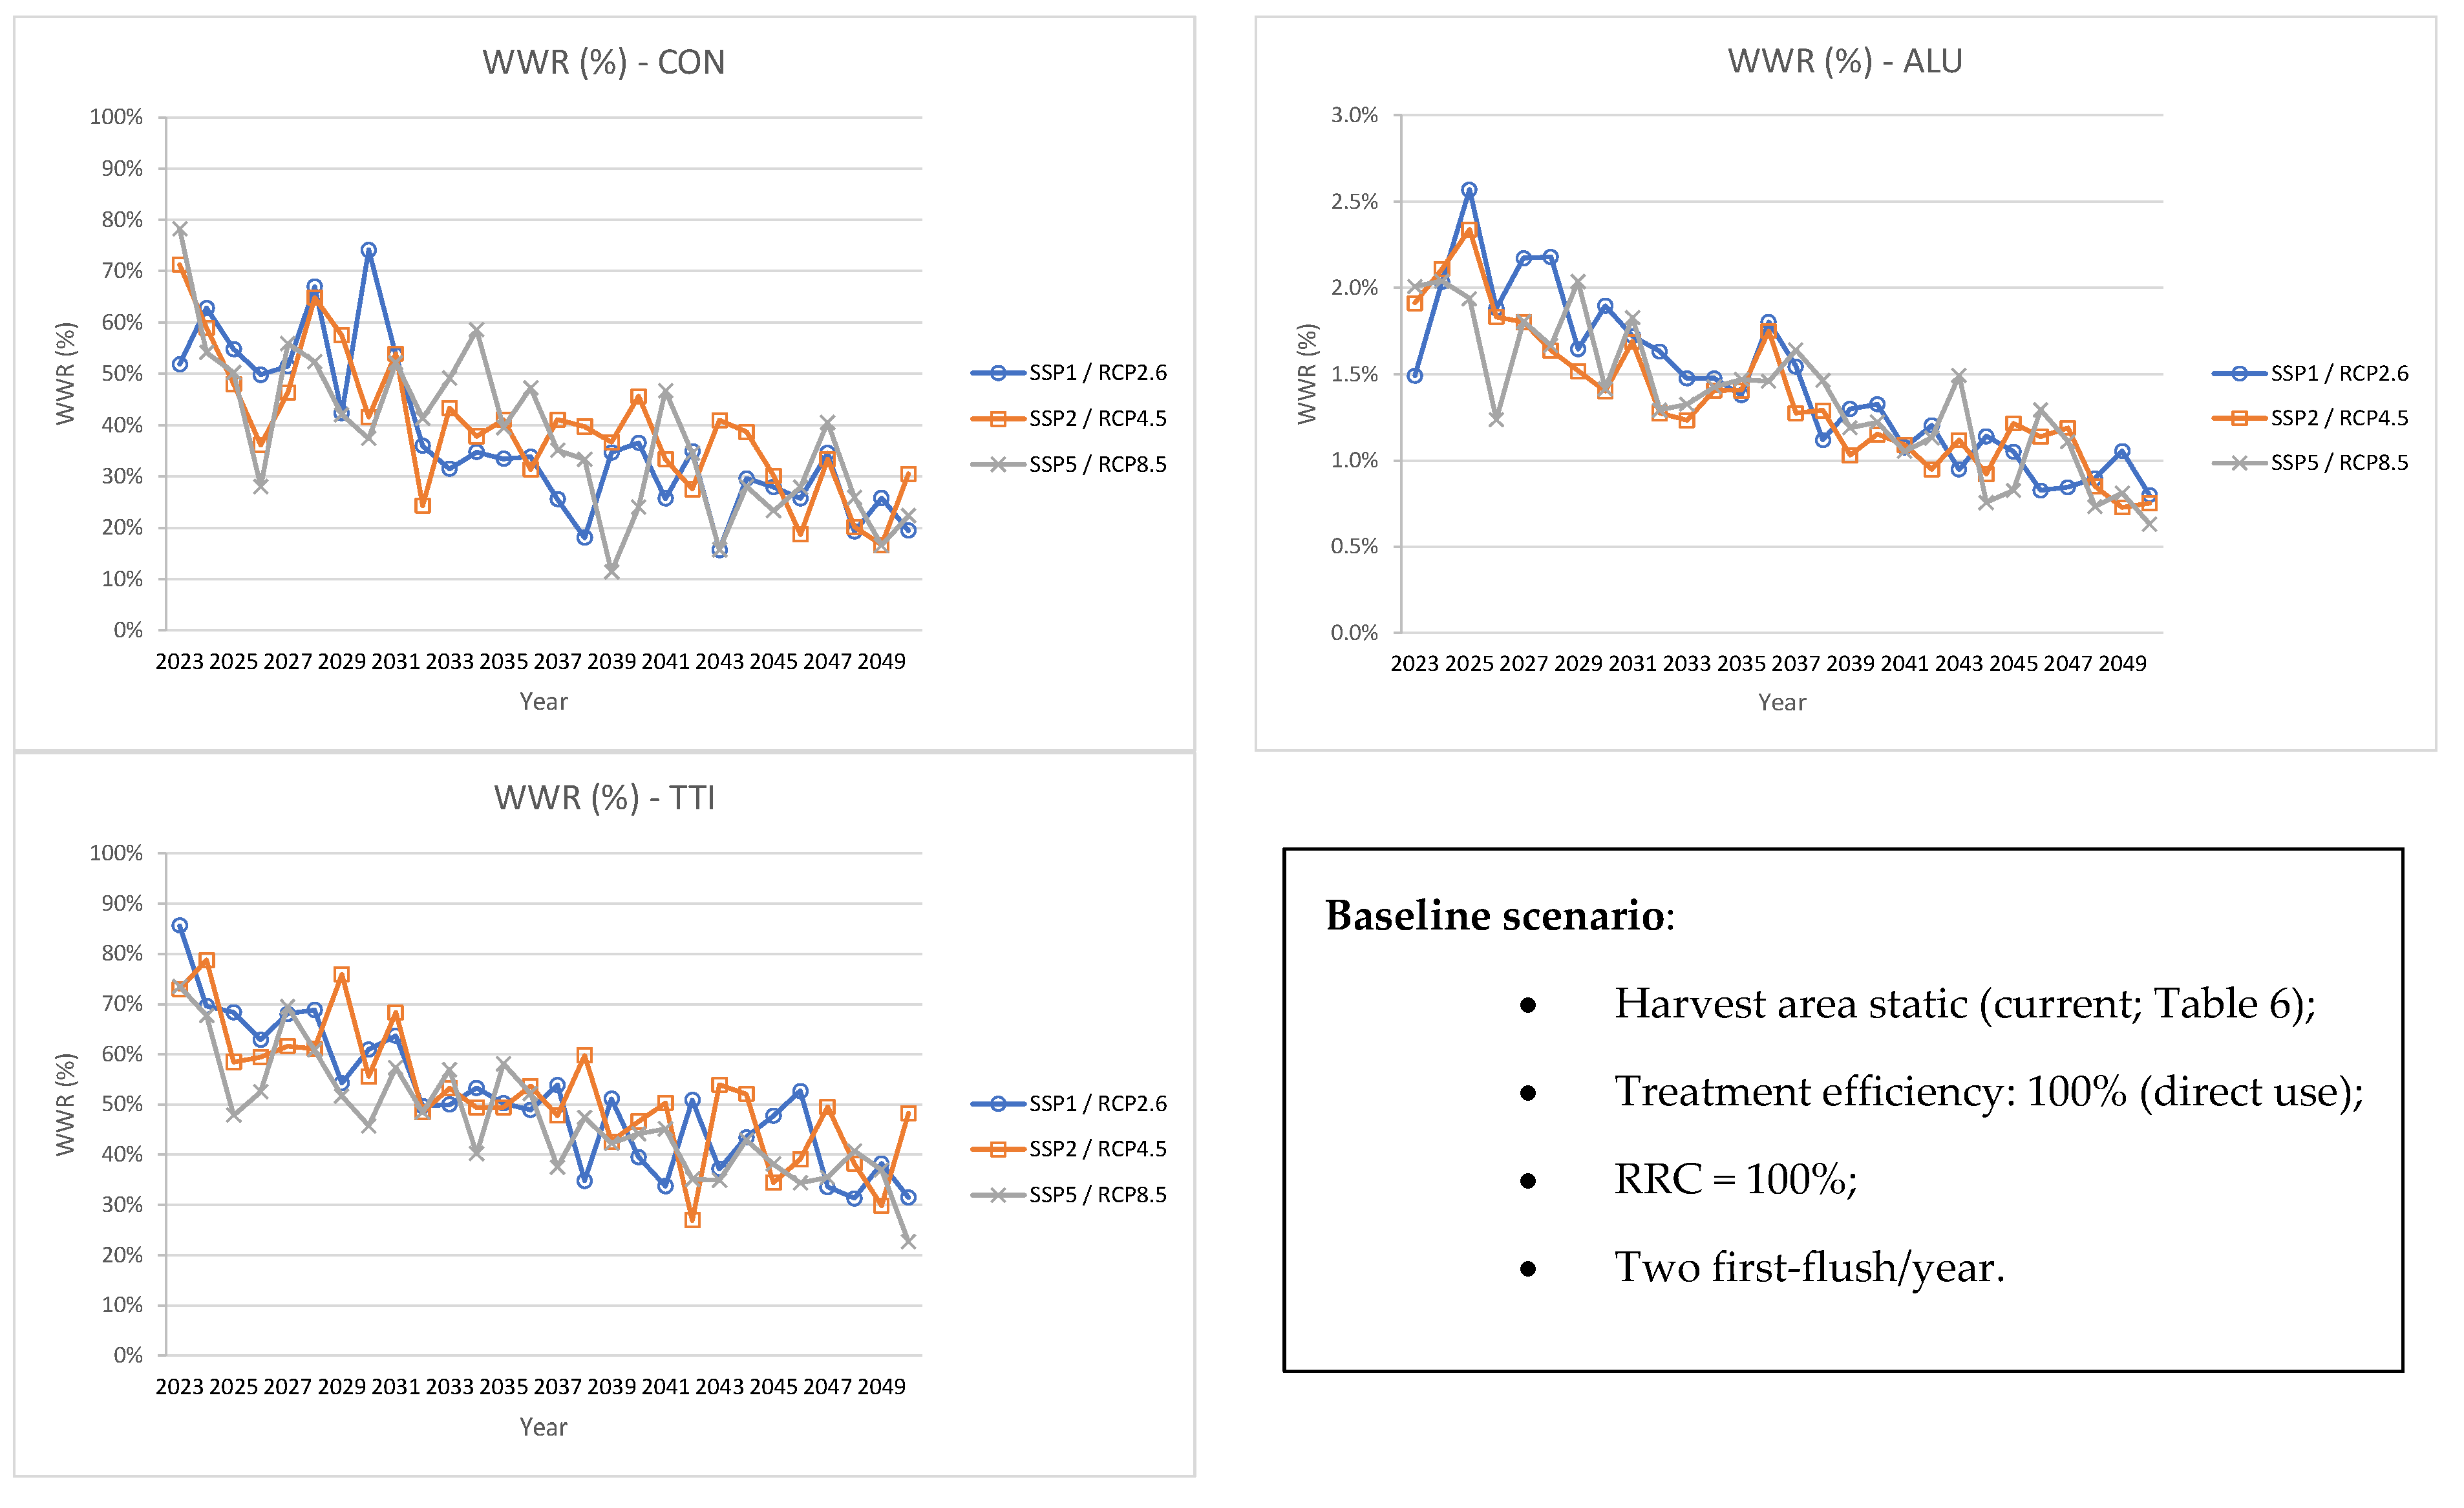
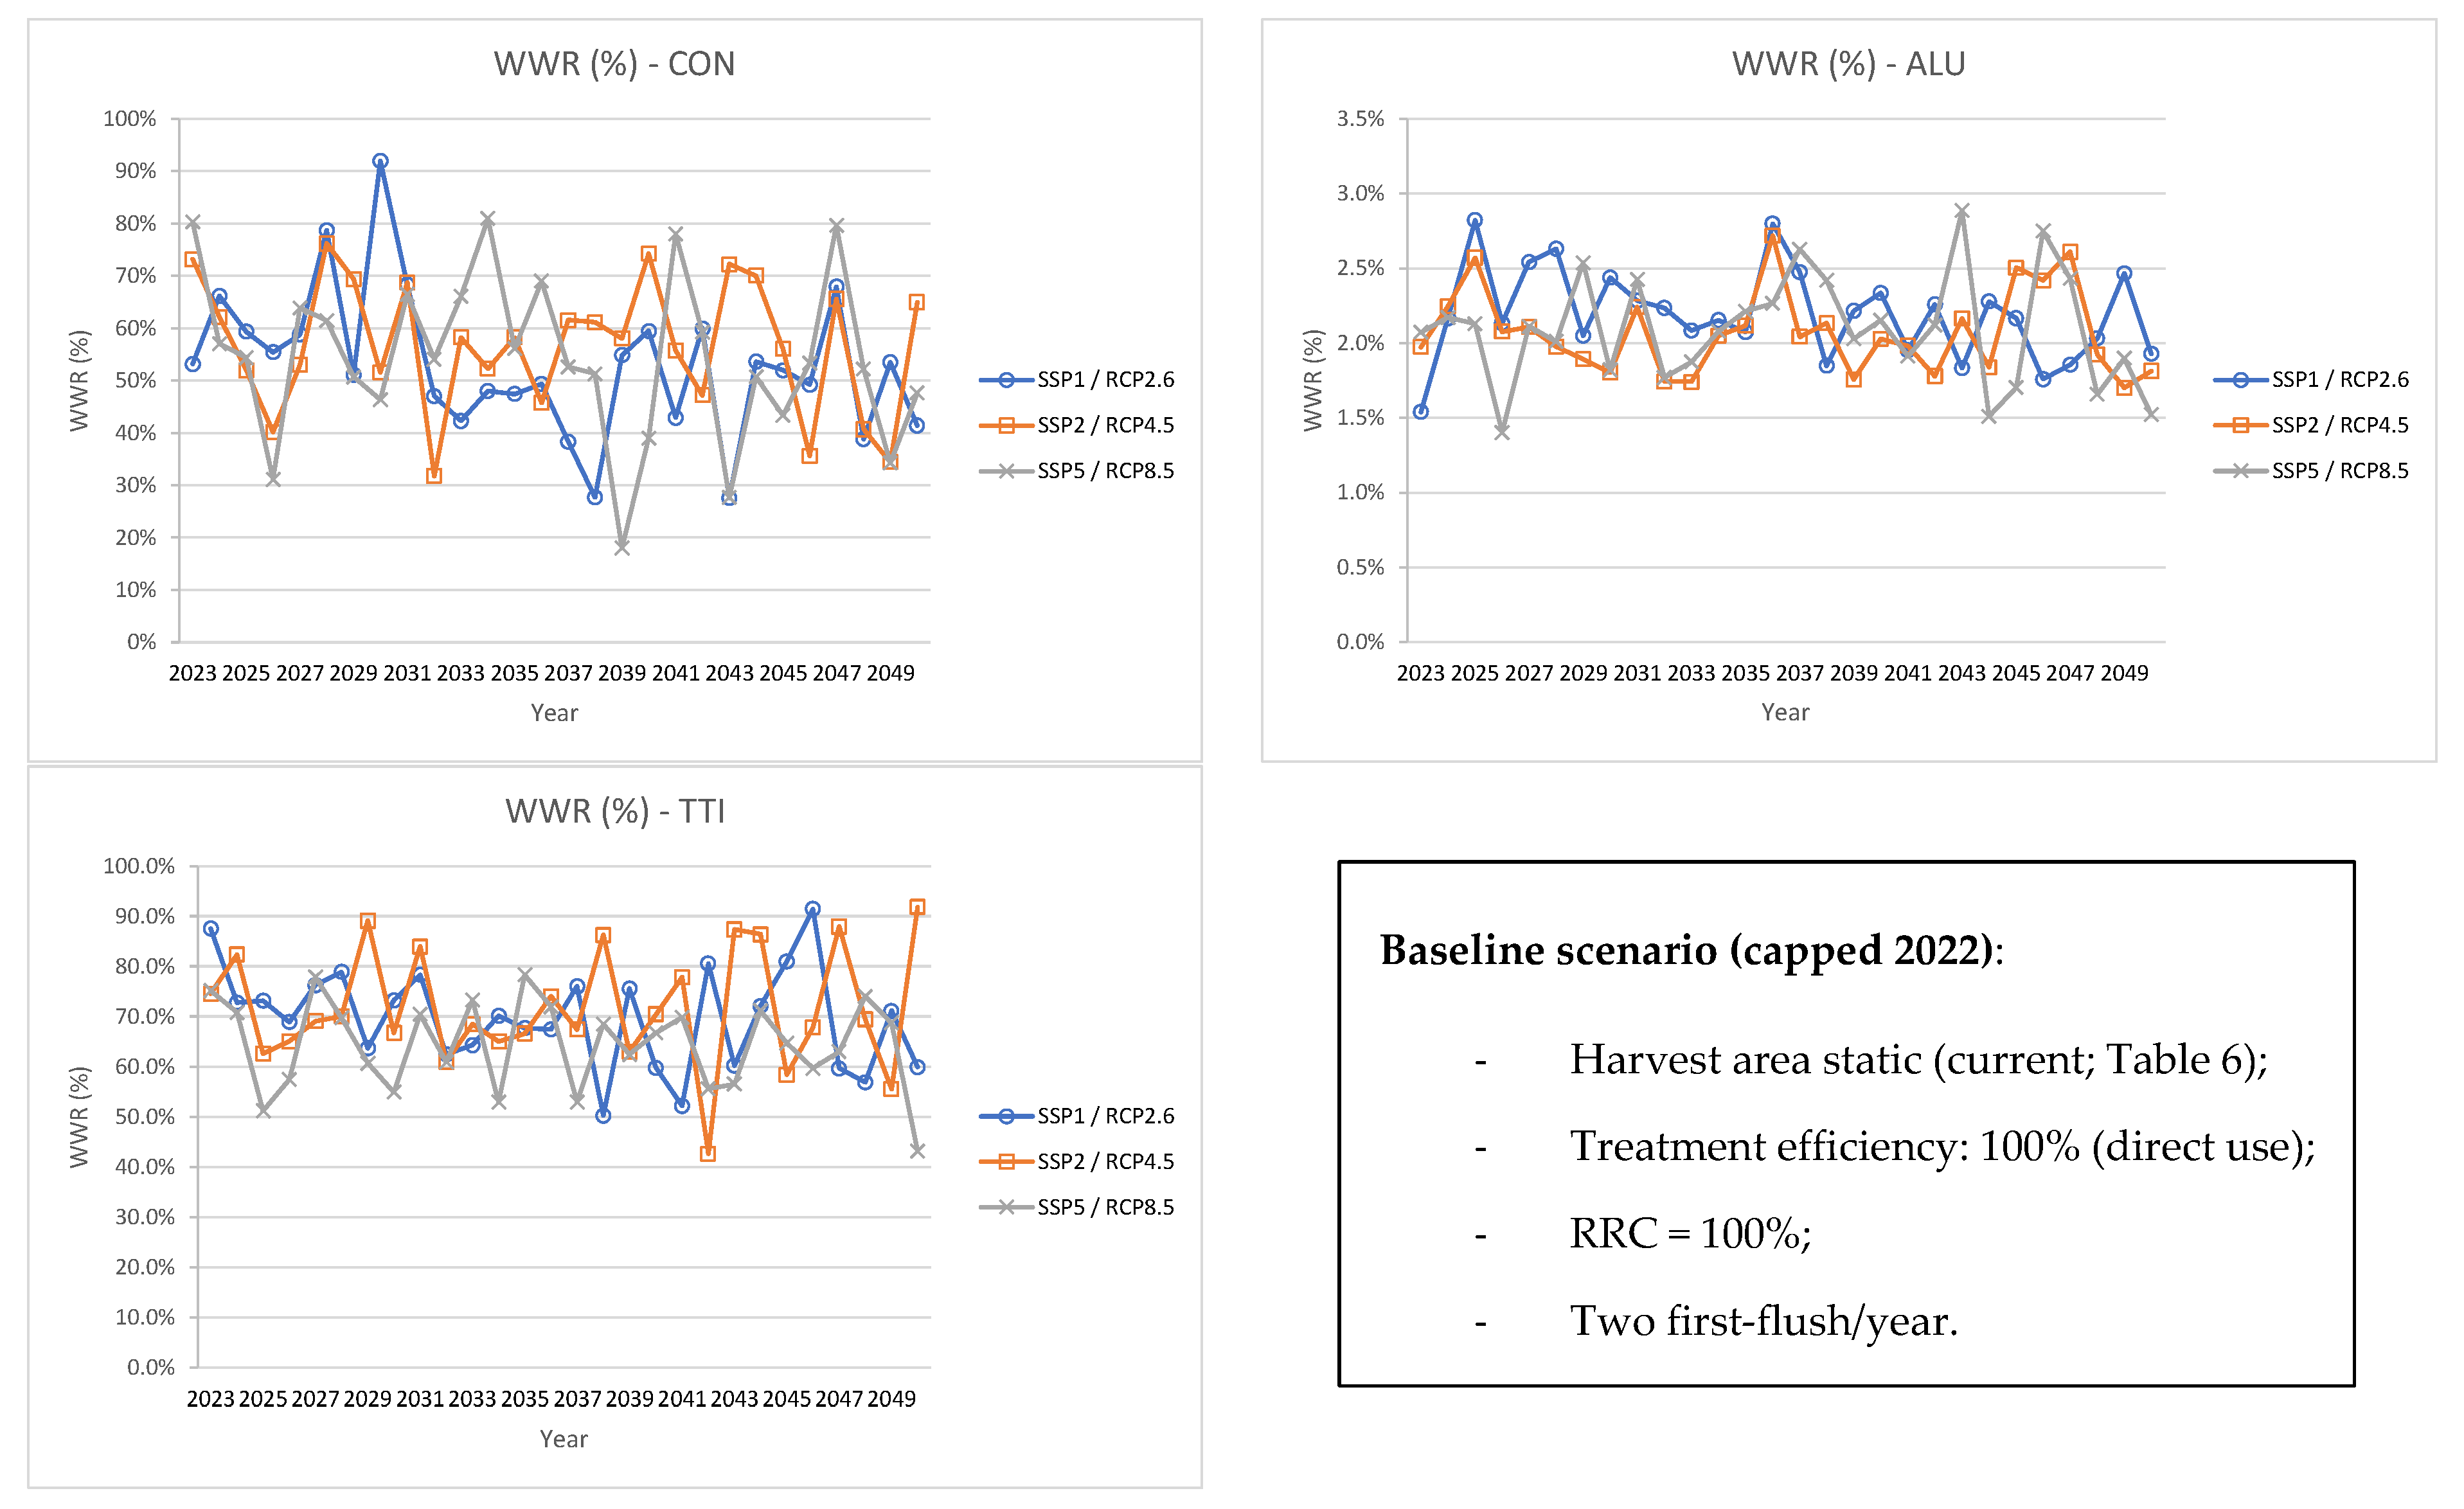
The rainfall simulations based on SSP/RCP help predict future rainwater availability, informing on RWH feasibility under different climate scenarios. Additionally, the scenarios indicate that rainfall patterns will vary, thus impacting the potential for rainwater harvesting. The average expected annual rainfall for each SSP/RCP scenario (as shown in the Supplementary Material S7) is used to calculate the volumes of harvestable rainwater for the current catchment area. The baseline scenario assumes no treatment is required (100% recovery), a Rooftop Runoff Coefficient (RRC) of 100%, a constant catchment area size, and at least two first-flushes performed per year (Figure 5).
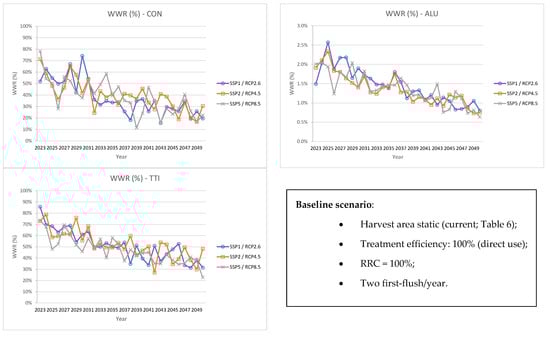
Figure 5.
Baseline scenario for harvesting rainwater: CON, ALU and TTI (2023–2050).
To assess the potential for RWH, the Water Withdrawal Reduction (WWR) indicator (Supplementary Material S7) is used to determine how much rainwater can cover the freshwater requirements of each industrial site. This indicator provides a practical measure of RWH effectiveness, showing the proportion of water needs that can be met with harvested rainwater. The WWR indicator, combined with the calculated annual rainfall, gives insights into the viability of RWH systems in different SSP/RCP scenarios over a temporal scale. The baseline scenario serves as a reference point, allowing decision-makers to understand the potential benefits of implementing RWH systems under various conditions and to identify opportunities for improvement, such as expanding the catchment area or introducing treatment processes.
Figure 6 presents the same baseline scenario, however, capping the water consumption for CON, ALU, and TTI to 2022 values.
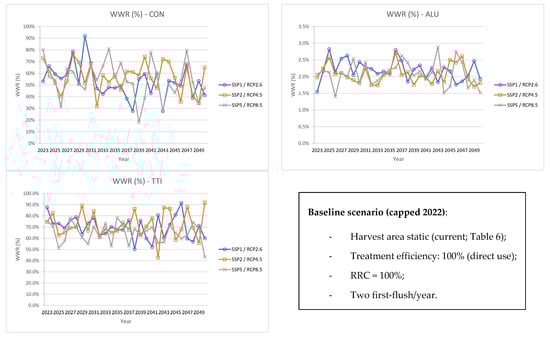
Figure 6.
Baseline scenario for harvesting rainwater: CON, ALU, and TTI (2023–2050)—Capped for 2022 water consumption values.
The potential economic savings (PES) from substituting freshwater with rainwater at each industrial site do not include capital expenditure (CAPEX) or operational expenditure (OPEX), as noted in Table 9. This is because most of the infrastructure needed for rainwater harvesting (RWH) is already in place, and operational costs are minimal since no treatment is required. Although the WWR values differ between the two scenarios analysed, the volume of harvested rainwater remains constant. The distinction lies in the extent to which freshwater is replaced with harvested rainwater, leading to identical PES in both scenarios despite the variation in WWR values.
Table 9.
AAGR and projected annual freshwater consumption increase (2030, 2040, and 2050).
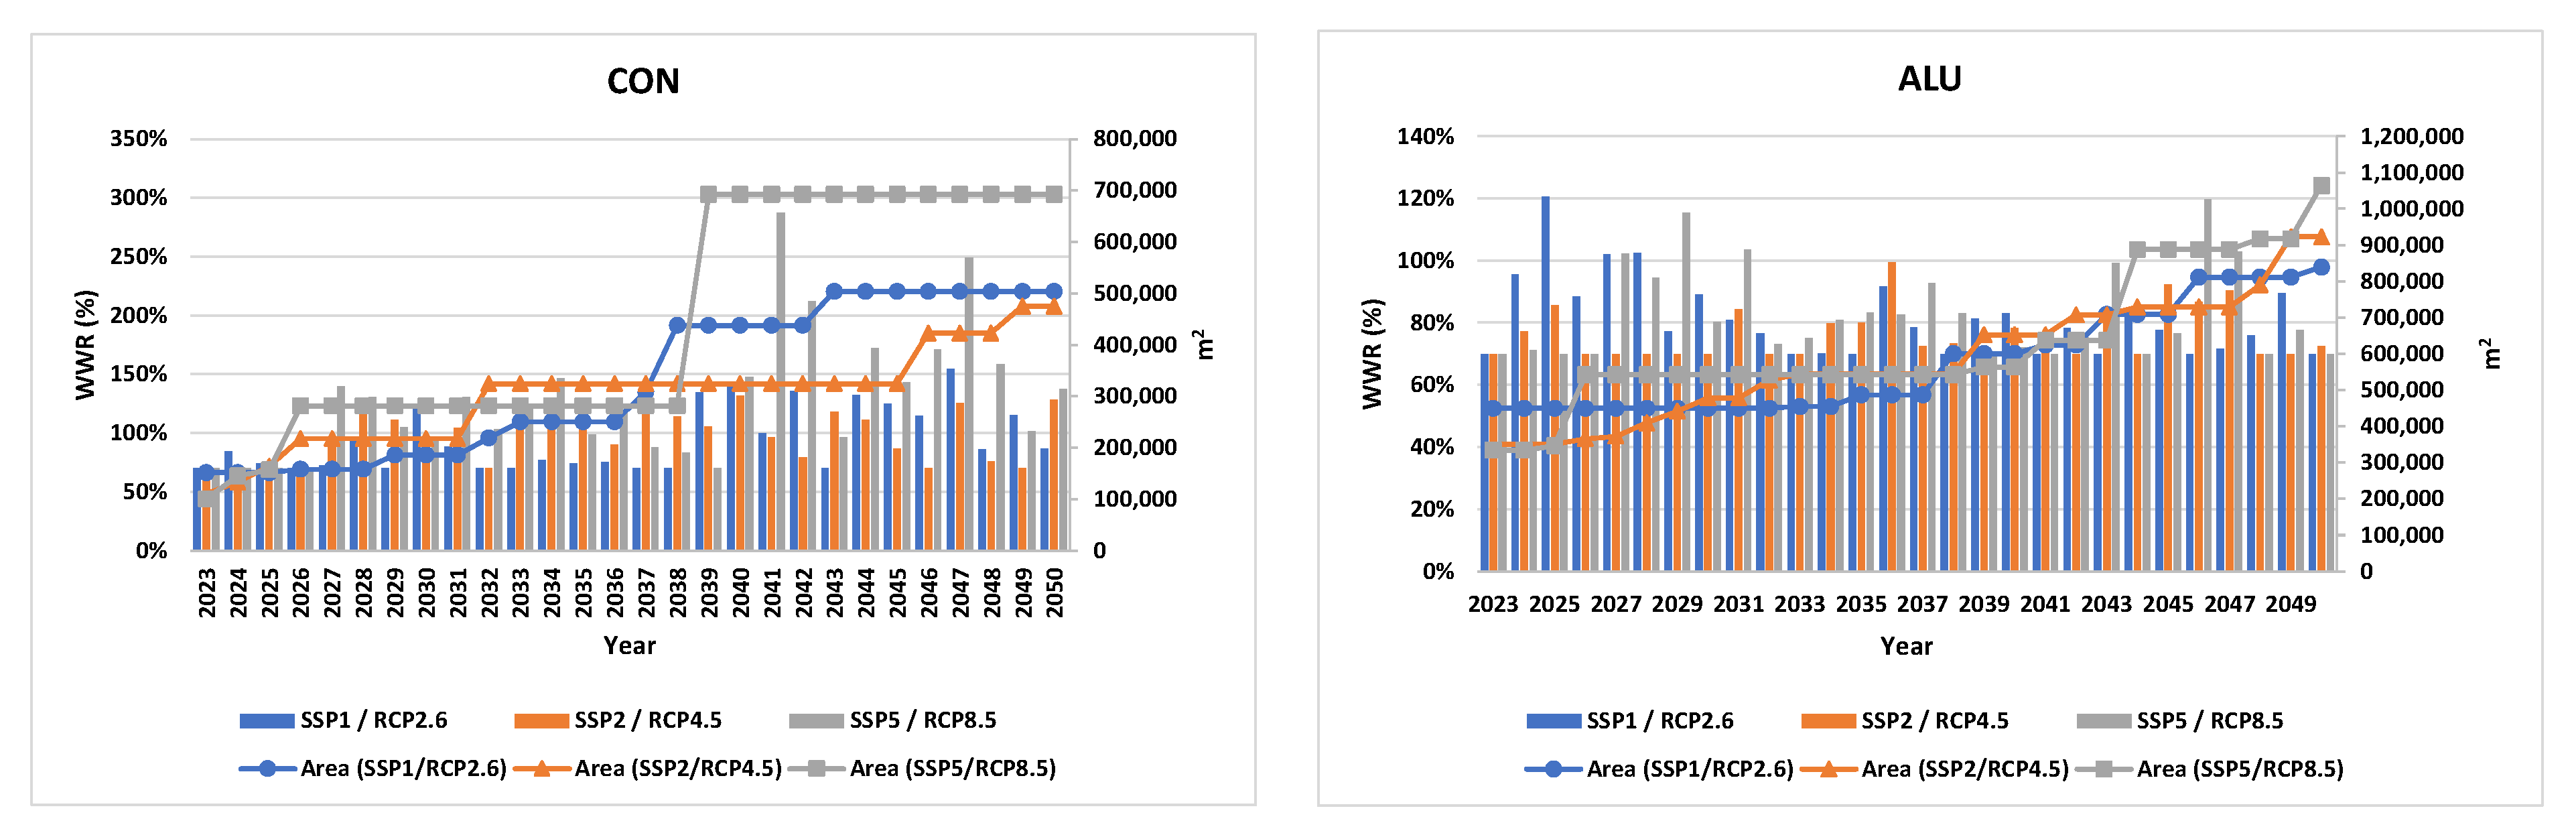
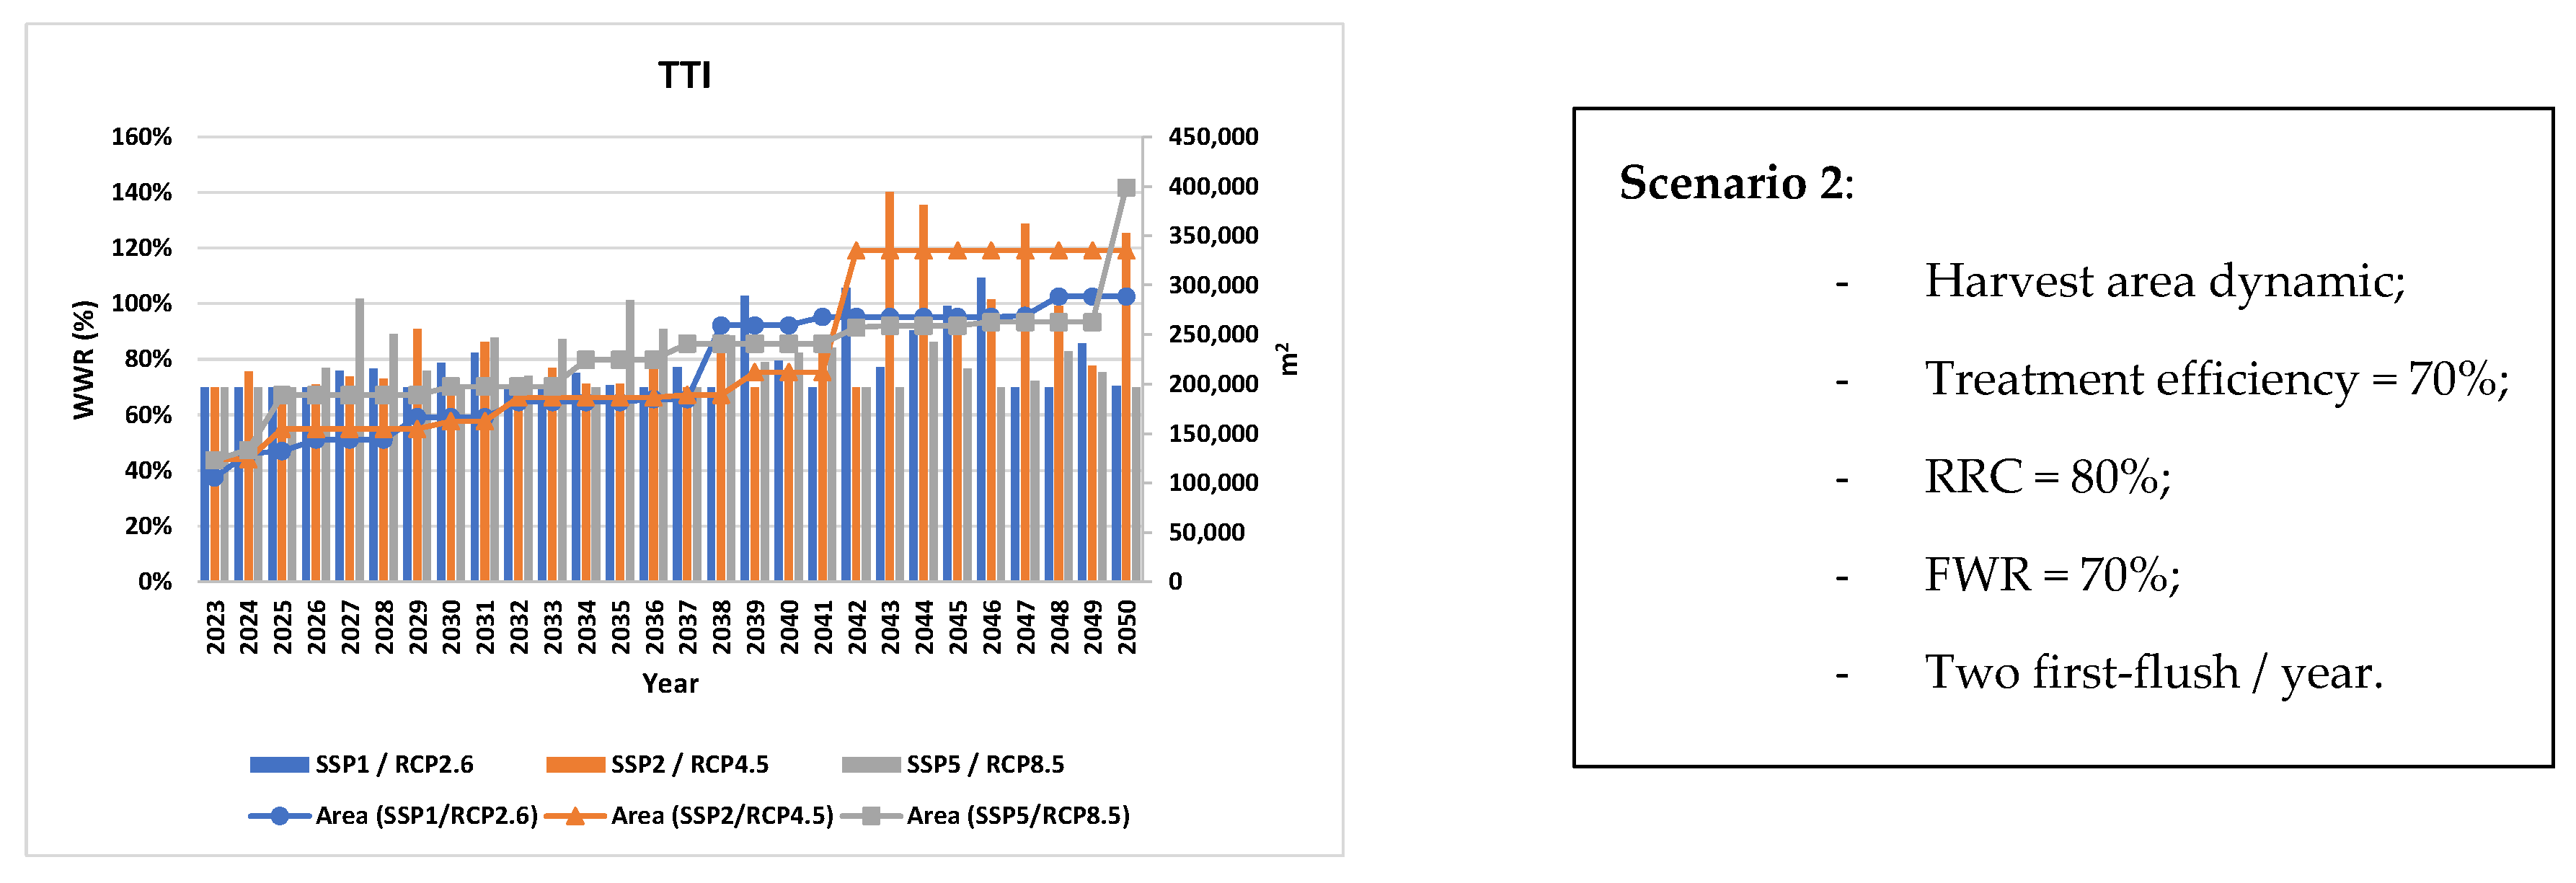
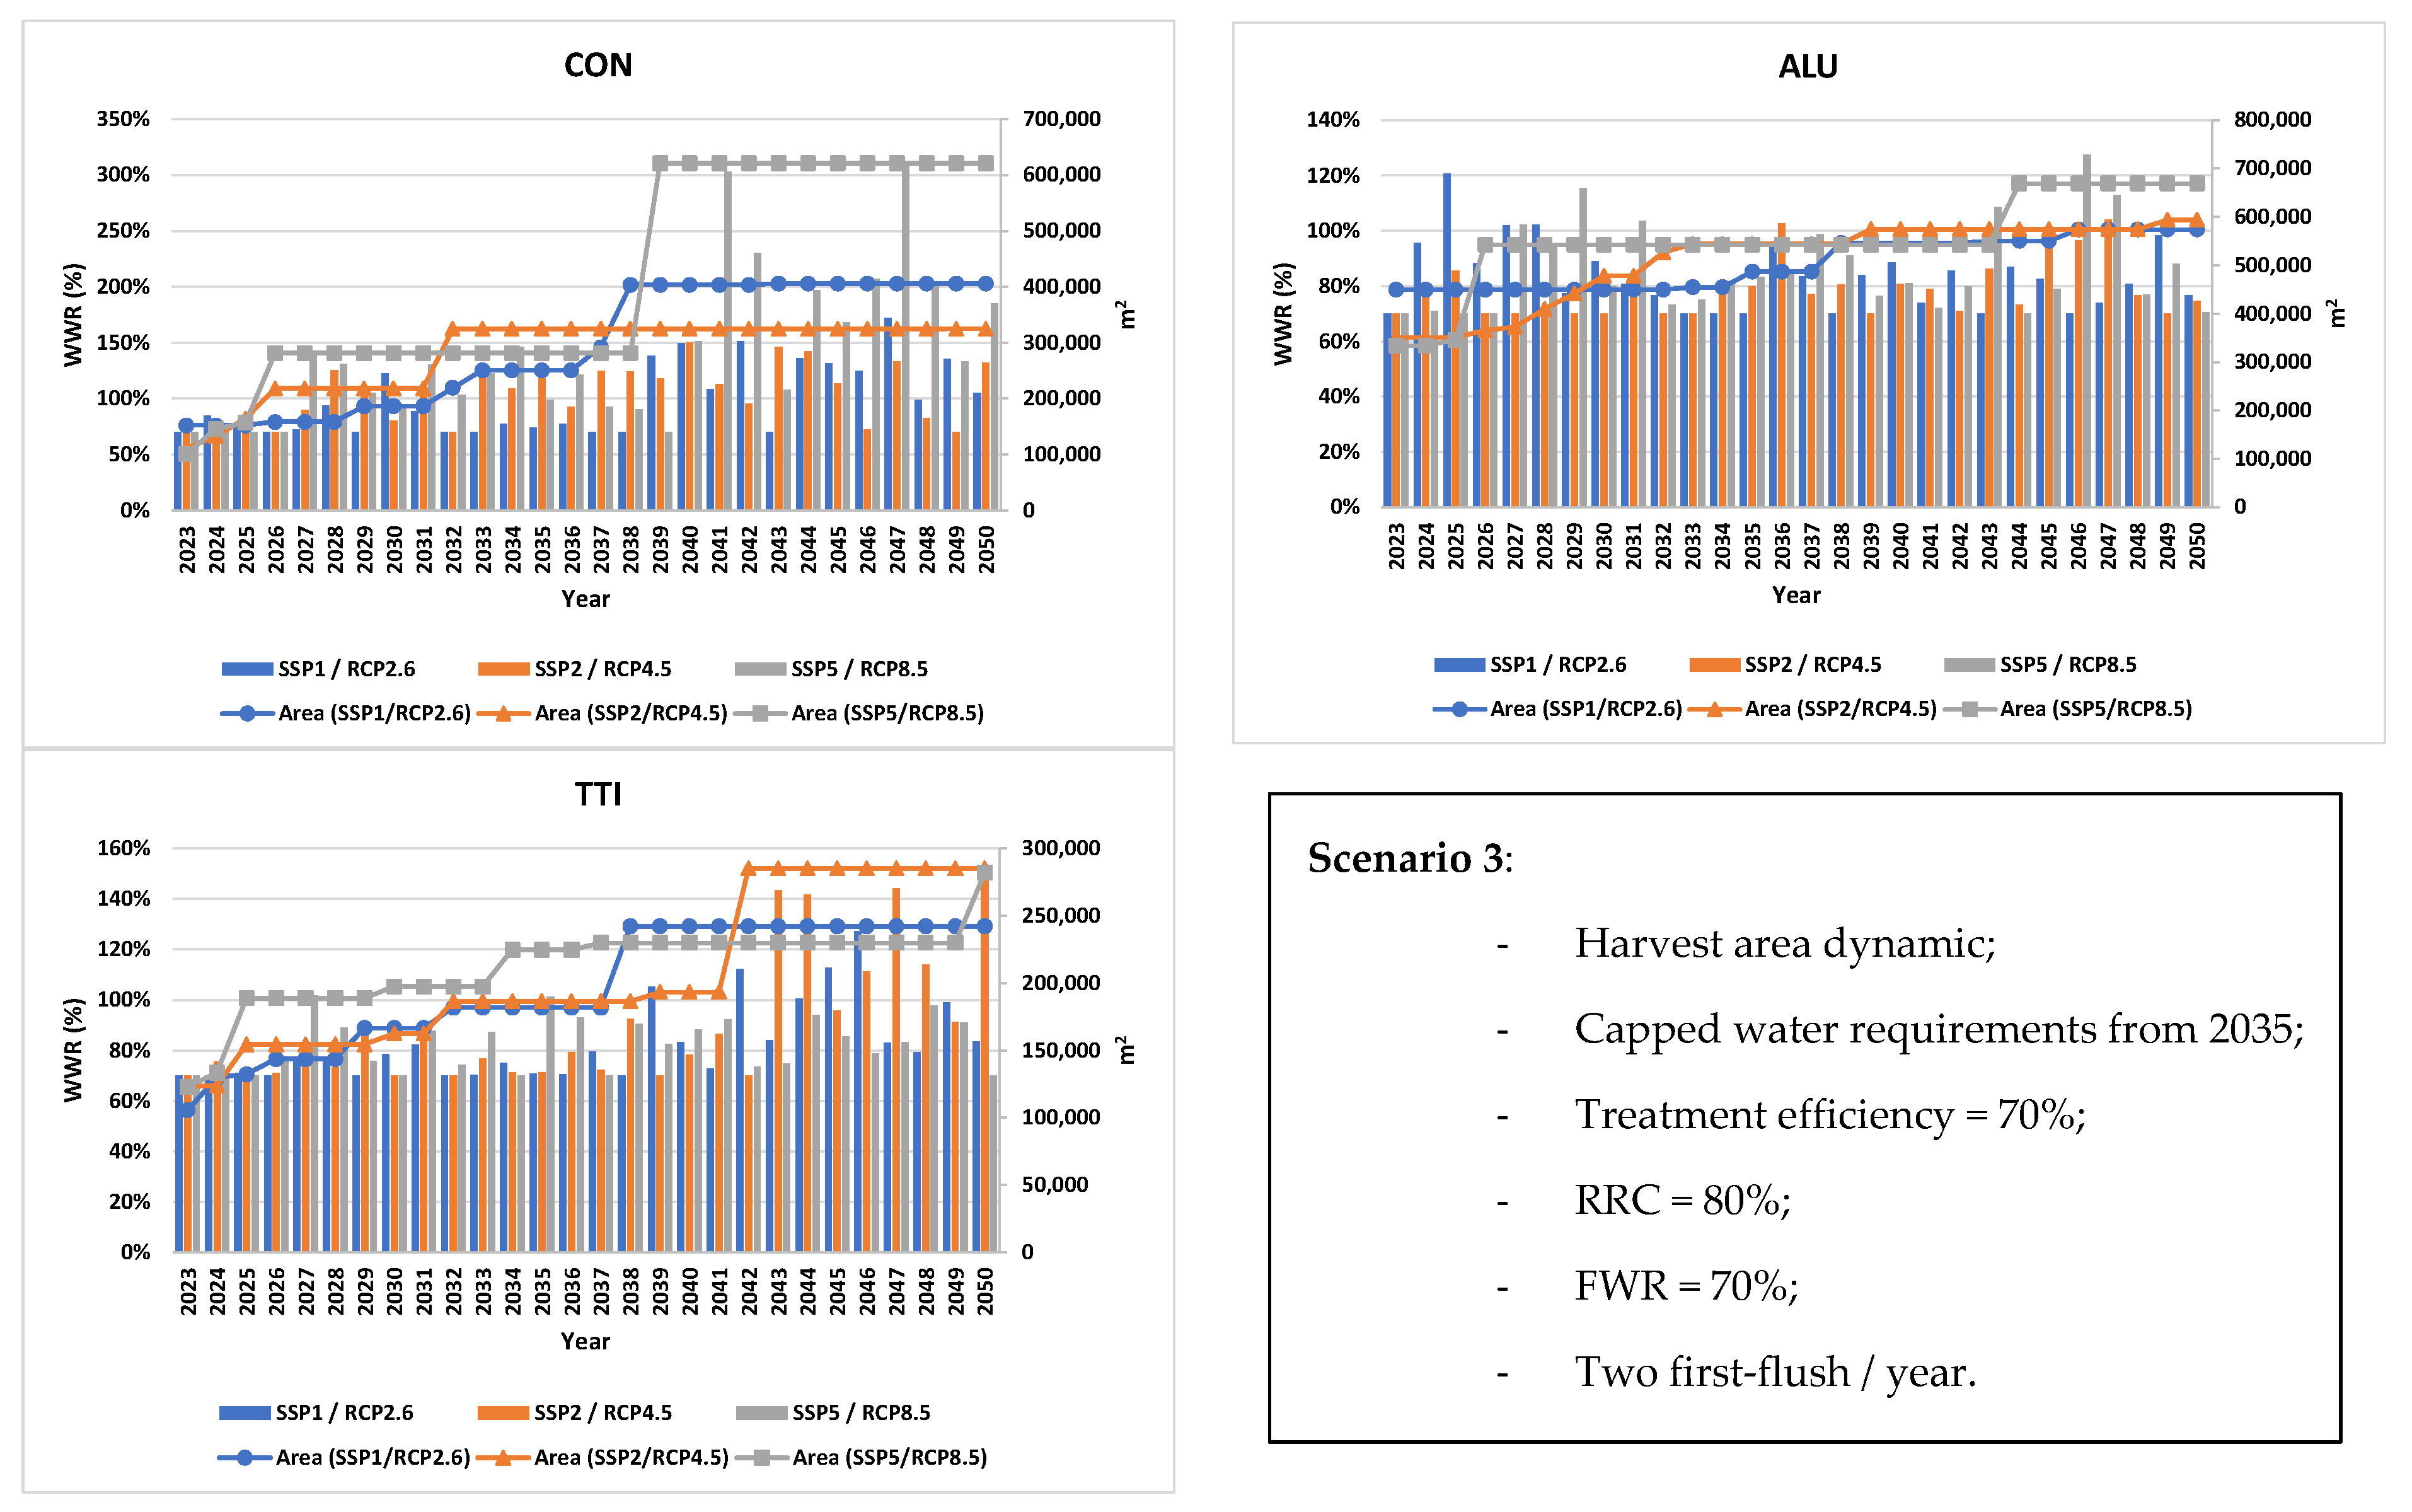
2.11. Dynamic Harvest Area to Accompany Projected Freshwater Requirements and Rainfall: SSP/RCP Scenarios
This section explores the need for a dynamic harvest area to meet projected freshwater requirements and desired coverage based on different SSP/RCP scenarios. It highlights how these scenarios impact rainwater harvesting (RWH) strategies in industrial contexts. SSP/RCP scenarios are used to project future rainfall patterns, which in turn inform the expected freshwater substitution with rainwater for industrial sites. By assessing these scenarios, it is possible to determine the optimal size and configuration of the harvest area. A dynamic harvest area allows for flexibility in RWH system design, enabling industrial sites to adjust to changing rainfall patterns and freshwater demands. This adaptability is crucial for ensuring sustainability and cost-effectiveness.
As a result, five scenarios are proposed and analysed to evaluate the dynamic incrementation of the harvesting area to meet the projected substitution of freshwater with rainwater (Table 10). Each scenario represents a different strategy for integrating rainwater harvesting (RWH) and includes changes in process efficiency, first-flush mechanisms, and water consumption capping by the industry. The scenarios aim to demonstrate the flexibility of the RWH framework in accommodating various conditions as per different SSP/RCP pathways. The goal of the scenarios is to achieve a certain percentage of freshwater substitution with harvested rainwater. They incorporate factors like treatment efficiency, first-flush (FF), and industry water consumption. While similar to previous scenarios, these include an additional parameter: freshwater requirements (FWR) covered by harvested rainwater. This parameter allows for a more dynamic approach, enabling decision-makers to adjust the harvesting area in response to changing conditions.
Table 10.
Scenarios for the dynamic incrementation of potential rainwater harvesting areas.
Dynamic simulation (dx/dt—area over time) of freshwater substitution with rainwater provides decision-makers with an incremental approach to increasing the harvest area with projected SSP/RCP scenarios. This stepwise approach is designed to align with broader EU strategies for water conservation, circular economy, and decentralised water harvesting [40]. Figure 7 illustrates the results of Scenario 1, indicating the following:
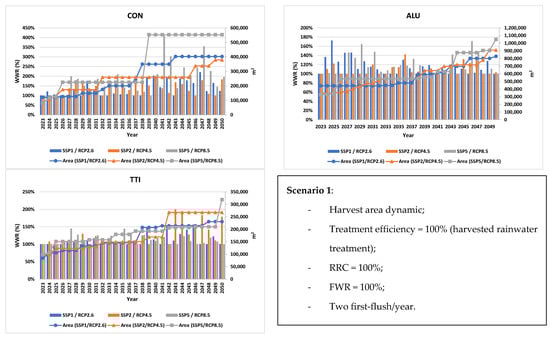
Figure 7.
Dynamic harvest area projection to accompany projected freshwater requirements for CON, ALU, and TTI regarding SSP/RCP scenarios. Scenario 1: idealised.
- The three different SSP/RCP pathways, considering both rainfall and harvested rainwater relative to the corresponding harvest area;
- The Water Withdrawal Reduction (WWR) indicator presents the percentage of freshwater requirements that can be met with harvested rainwater. A WWR value over 100% indicates that more rainwater is collected than required, resulting in a surplus;
- The potential harvest area (m2) required to achieve each WWR value can increase over time or plateau during specific periods, indicating that the current area is sufficient to meet industrial water needs.
Figure 8, Figure 9, Figure 10 and Figure 11 depict scenarios 2 through 5, each introducing additional considerations such as treatment, evapotranspiration, catchment area materials, and rainfall event duration (with a conservative value of 80%)—Table 10. These scenarios offer flexibility by allowing industries to adapt RWH systems to evolving conditions and varying regional policies. By accounting for different parameters and pathways, this framework provides industries with a robust tool to design and implement efficient RWH systems that support sustainability and cost savings.
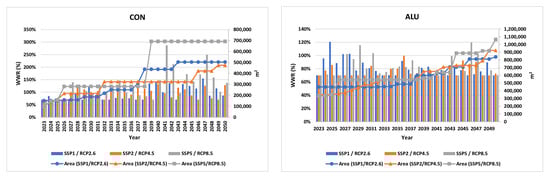
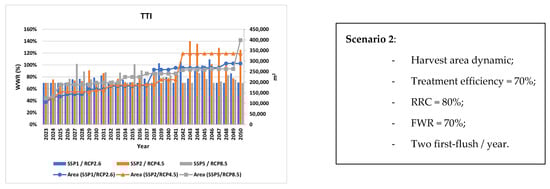
Figure 8.
Dynamic harvest area projection to accompany projected freshwater requirements for CON, ALU, and TTI regarding SSP/RCP scenarios. Scenario 2: increase in water consumption.
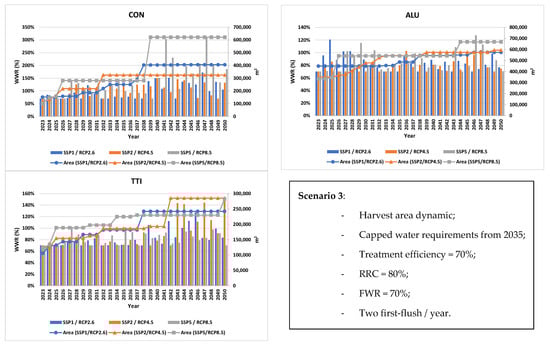
Figure 9.
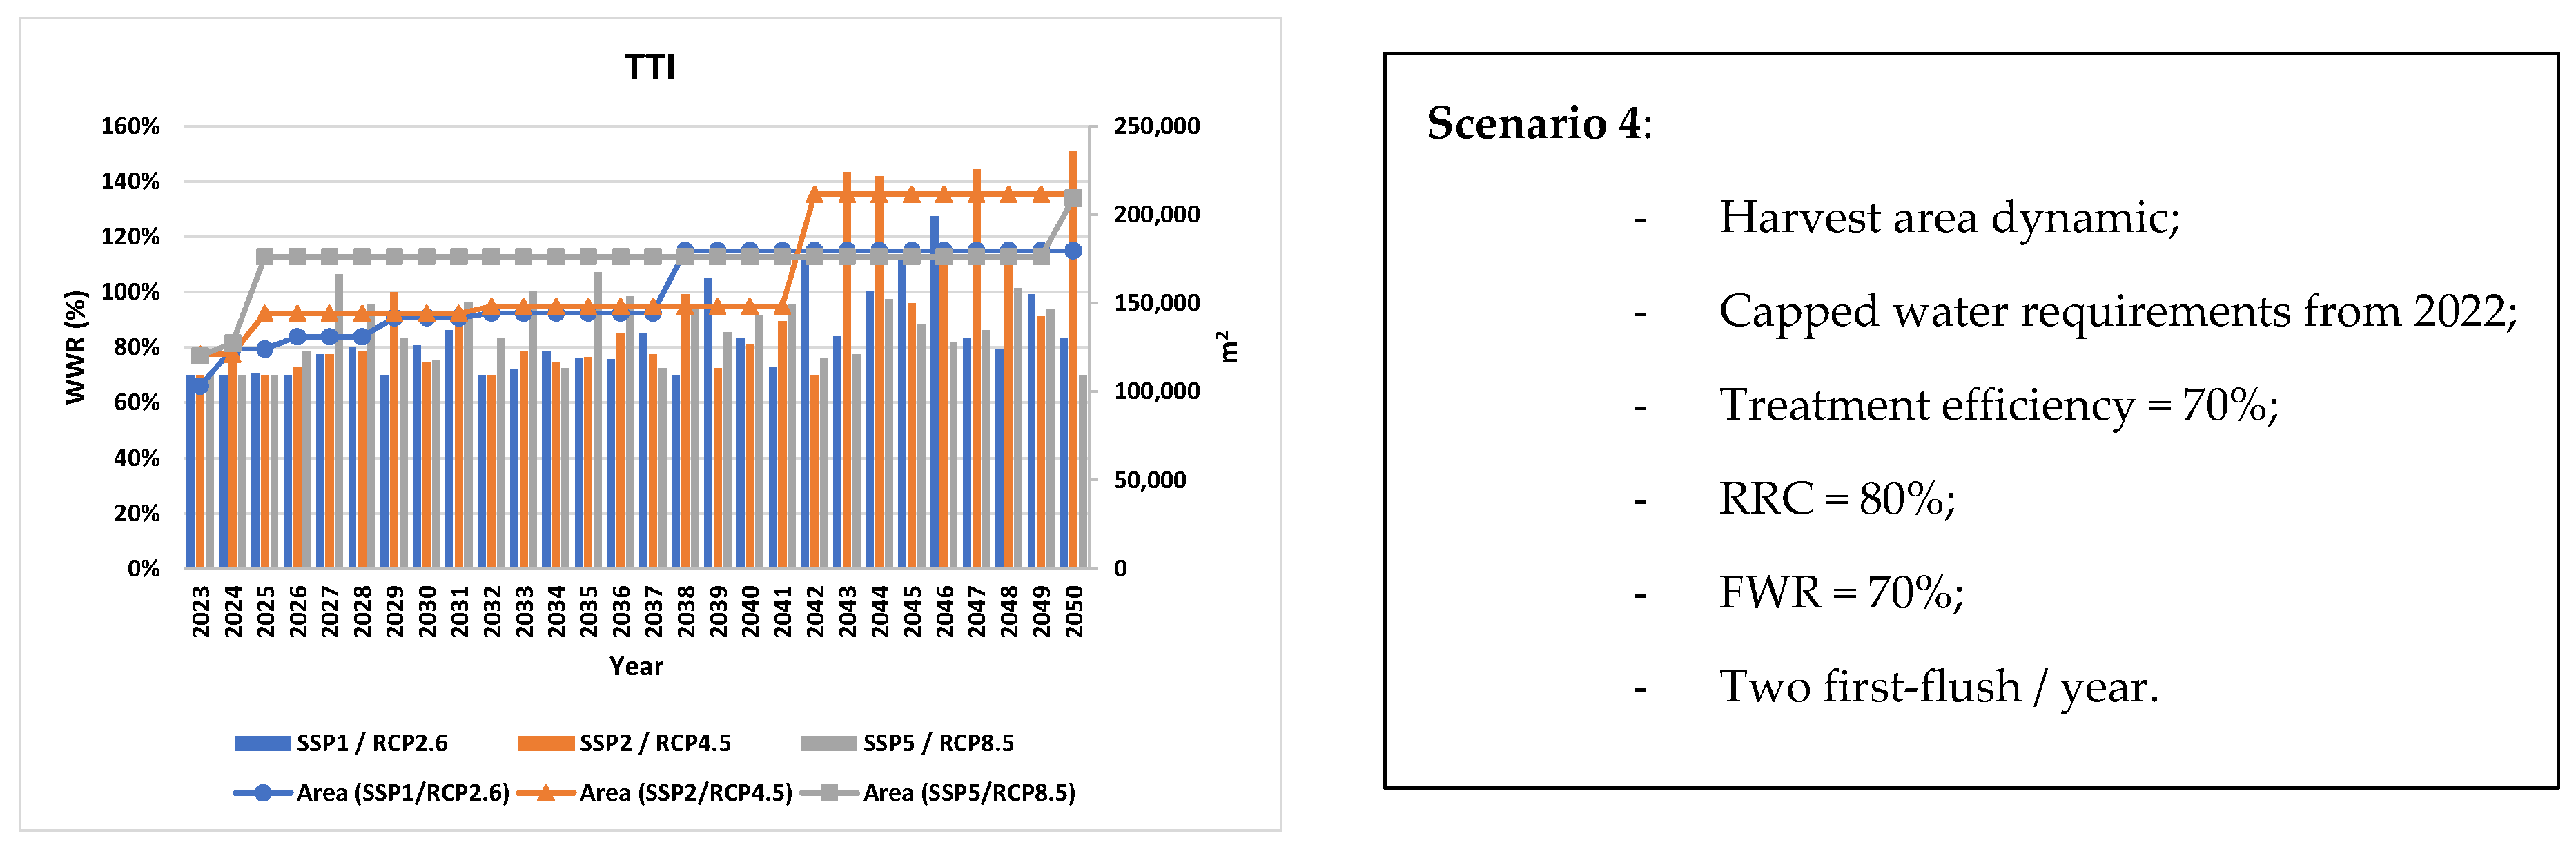
Dynamic harvest area projection to accompany projected freshwater requirements for CON, ALU, and TTI regarding SSP/RCP scenarios. Scenario 3: Freshwater consumption capped by 2035.
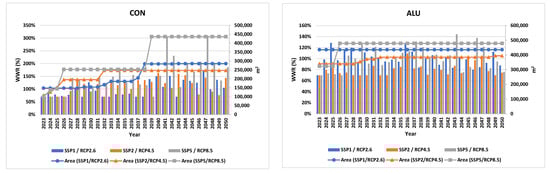
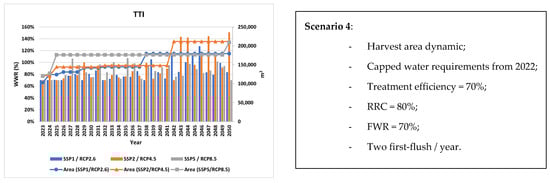
Figure 10.
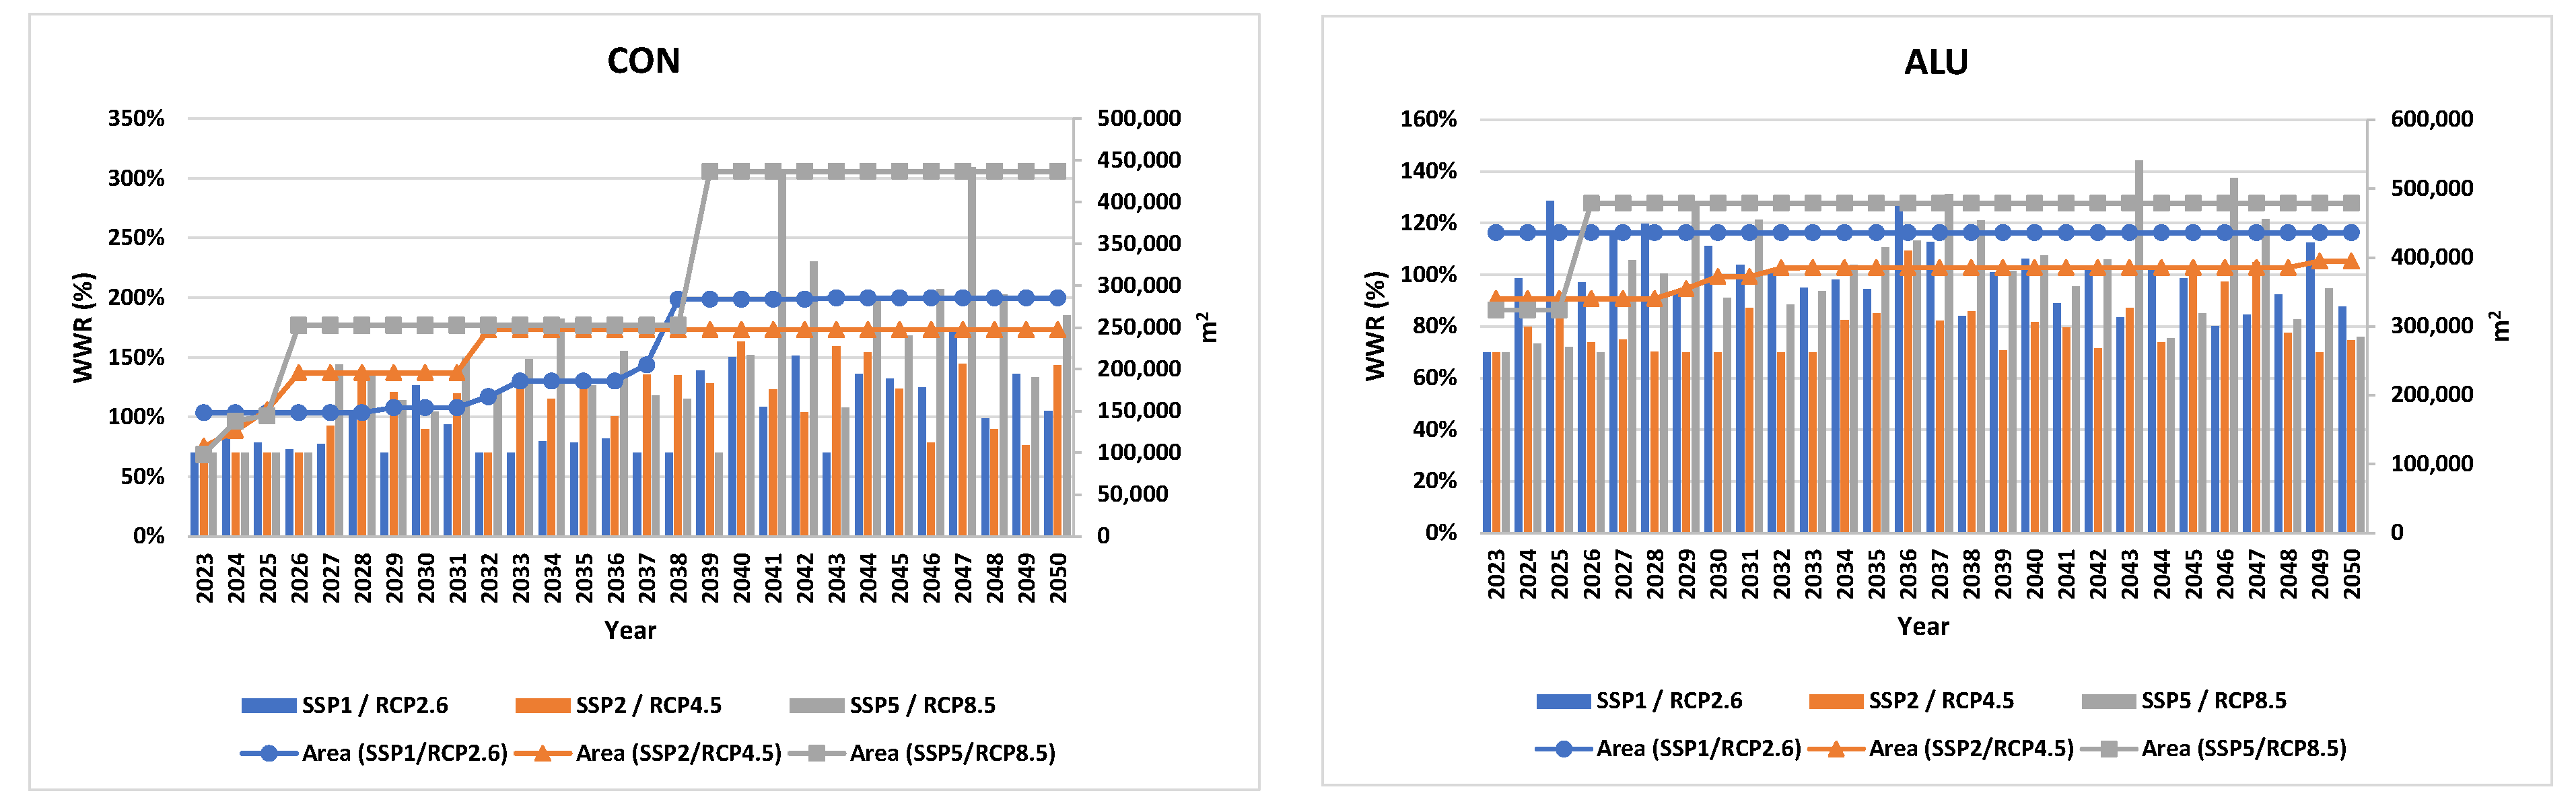
Dynamic harvest area projection to accompany projected freshwater requirements for CON, ALU, and TTI regarding SSP/RCP scenarios. Scenario 4: Freshwater consumption capped by 2022.

Figure 11.
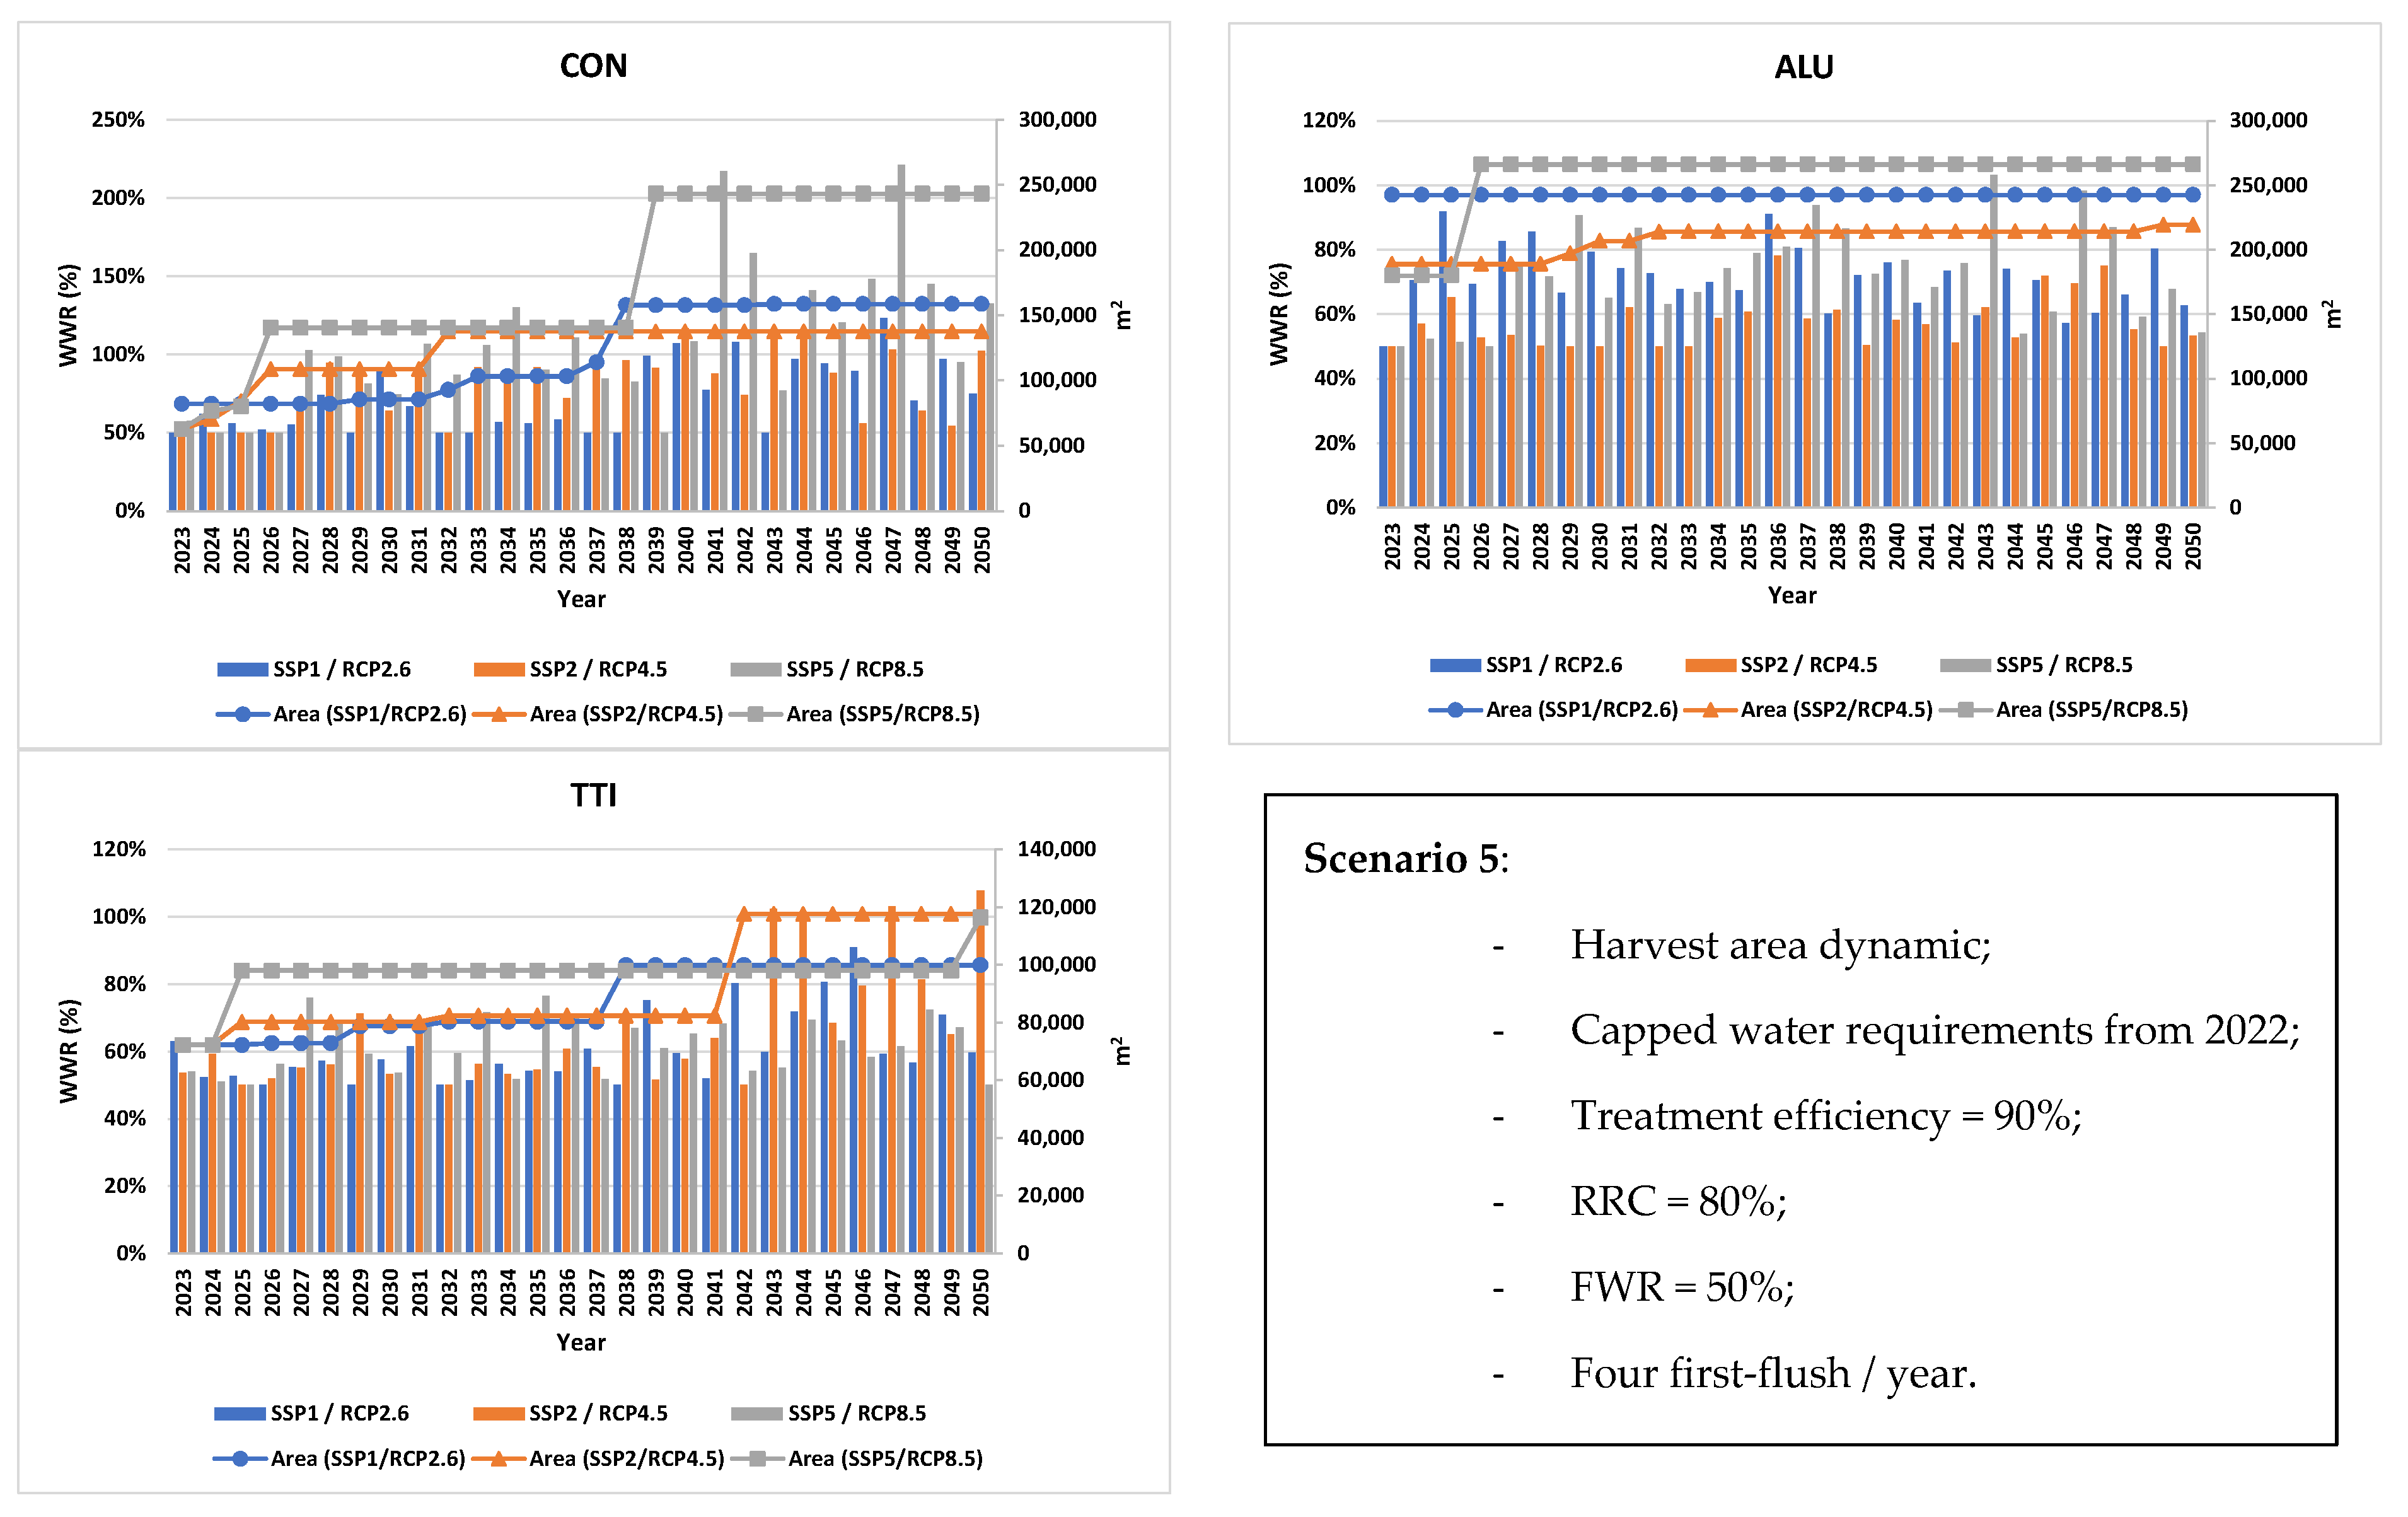
Dynamic harvest area projection to accompany projected freshwater requirements for CON, ALU, and TTI regarding SSP/RCP scenarios. Scenario 5: Freshwater consumption capped by 2022, increased TE.
The Potential Economic Savings (PES) shown in Table 11 are for all scenarios; however, they exclude CAPEX and OPEX related to the RWH solution. In an SSP1/RCP2.6 scenario, which is characterised by sustainable development, the required harvest area might be smaller to meet demand. Conversely, in an SSP5/RCP8.5 scenario, a larger harvest area might be necessary to meet water demand.
Table 11.
Potential economic savings for projected harvest area (2023–2050)—Scenarios 1, 2, 3, 4, and 5.
3. Results
3.1. Industrial Site and Rainwater Analysis
Table 6 provides insights into the targeted industries located in different regions across the EU. According to the Köppen-Geiger climate classification, ALU (Sweden) and TTI (Spain) share a similar climate, but the Spanish site receives over 100 mm/year more rainfall compared to the Swedish site and nearly 200 mm/year more than the Italian site (CON). This suggests that the Spanish site has the greatest potential for rainwater harvesting (RWH). Additionally, all industrial sites have some form of onsite water treatment facility that can be adapted to treat rainwater, thus reducing capital expenditure (CAPEX).
The rainwater quality at these sites is often similar to or even better than the freshwater used in industries, indicating potential for direct use in industrial processes. However, for some processes, additional treatment might be required. Continuous monitoring of rainwater quality can ensure that it meets the industries’ standards, with digitalization enabling automation for more efficient and consistent monitoring.
When examining freshwater consumption, ALU emerges as the largest consumer among the three sites, while CON and TTI have similar consumption ranges. This makes RWH a viable option for ALU to reduce water-related costs and enhance sustainability. However, the available area for RWH at ALU is relatively small compared to the other two sites, possibly requiring a higher initial investment to expand the catchment area. Moreover, lower precipitation levels in Sweden add to this challenge. Freshwater prices for CON and ALU are within the same range, indicating that ALU’s higher water demand could lead to greater savings with an RWH system. TTI, however, pays 31–35% more per cubic meter of water compared to Italy and Sweden, suggesting even greater savings if RWH is implemented there. This underscores the economic advantages of adopting RWH, especially in areas with higher water costs.
3.2. Historical Precipitation: Potential Harvesting and Economic Savings
Historical precipitation indicates the potential behind employing an RWH system at industrial sites. The historical data were collected, treated, and analysed from ECA&D [28] and indicate that the TTI site has the highest potential for rainwater harvesting, leading to significant economic savings—less volume of freshwater sourced from the public system. This highlights the importance of assessing local climate patterns when implementing RWH systems. Savings for the ALU industrial site are not attractive (around 11 €/d) and might not justify the investment considering the current harvest area. Table 7 shows that the TTI site can save up to 246 €/day through RWH, demonstrating the economic benefits of implementing these systems. The CON site also presents an interesting potential for installing an RWH system, with savings of up to 118 €/d.
3.3. Expected and Projected Industrial Freshwater Consumption
The projected freshwater consumption suggests that the industrial sector’s water demand will increase significantly by 2050, necessitating alternative water sources like RWH. The different SSP/RCP scenarios offer insights into how these trends might evolve. Two contexts were considered, as shown in Figure 4:
- Steady Increase in Freshwater Consumption: This context assumes that each industry’s freshwater consumption will increase at a consistent rate until 2050, based on historical water consumption data. This linear trend considers unusual variations, such as those caused by the COVID-19 pandemic. This disruption is reflected in the water consumption data, providing a reference point for the expected growth trajectory.
- Capped Water Consumption: In this context, each industry’s water consumption is capped at 2022 levels. This approach is based on ALU’s projections, which suggest no expected increase in water consumption due to technical constraints and limited available space. To simplify the assessment and facilitate comparisons across industries, water consumption was capped at 2022 levels for all industries.
These two contexts provide different scenarios for assessing water consumption trends, where the steady increase scenario represents a more traditional growth model and the capped scenario addresses constraints that may limit future water consumption. By considering both contexts, the framework allows for flexibility in assessing and comparing water consumption patterns, ultimately guiding more informed decisions in rainwater harvesting (RWH) implementation.
3.4. Projected Precipitation Simulation Considering the Representative Concentration Pathway (RCP) and Shared Socioeconomic Pathways (SSP)
Applying different RCP/SSP pathways to simulate rainfall in each industrial site’s region demonstrates the potential impact on rainwater harvesting (RWH). The precipitation amplitude for the CON industrial site varies widely, ranging from 350 mm to 1500 mm (S7), indicating significant variability and uncertainty in yearly precipitation (as is common with meteorological simulation models). Despite this variability, the average precipitation values (Table 12) are relatively high.
Table 12.
Expected average precipitation for CON, ALU, and TTI.
The ALU industrial site exhibits the most stable precipitation amplitude through 2050 across all SSP/RCP pathways, although it has lower average precipitation compared to CON and TTI. On the other hand, the TTI industrial site has the highest average precipitation values, suggesting a more consistent source of rainwater. Comparing the precipitation values with historical data (Table 6), the CON and TTI industrial sites show slightly higher precipitation, while ALU’s values are relatively consistent with its historical trends. This comparison indicates that earlier conclusions based on historical data could underestimate the volume of harvestable rainwater for CON and TTI, while for ALU it proves more accurate.
When assessing the potential for implementing an RWH solution with the current catchment area, assuming 100% treatment efficiency (T.E.), 100% Rooftop Runoff Coefficient (RRC), and considering the SSP/RCP scenarios, CON and TTI could cover between 24% and 33% of their freshwater needs with harvested rainwater, depending on the chosen pathway and increase in water consumption (Table 13). In contrast, ALU could only cover about 1% of its water needs, possibly due to lower average precipitation, higher freshwater consumption, and a smaller catchment area (as indicated in Table 6 and Table 13). This limited coverage also reflects the lower economic savings for ALU compared to CON and TTI. However, if water consumption is capped at 2022 levels (Table 13), the potential to meet water requirements with harvested rainwater increases to over 50% on average for CON and TTI. The SSP/RCP 4.5 pathway offers the best prospects for precipitation events for these sites, while the SSP/RCP 2.6 pathway seems most favourable for ALU. Yet, despite these results, the latter pathway remains highly recommended for its alignment with climate change mitigation goals.
Table 13.
Expected harvestable rainwater covering freshwater needs considering the current available harvest area: CON, ALU, and TTI.
Economic savings projected by the SSP/RCP scenarios (Table 9) align with those derived from historical data (Table 7), with higher savings observed for TTI. This alignment indicates a degree of reliability in these projections and underscores the importance of selecting the appropriate RCP/SSP pathway for optimal RWH outcomes. Furthermore, the location of each industrial site plays a significant role in the results, highlighting the need for a tailored approach to RWH implementation depending on the chosen pathway and the unique characteristics of each site.
One limitation of this study is the reliance on projected rainfall data, which may not fully capture the variability and uncertainty of future climate patterns. This could affect the accuracy of the RWH system design. Additionally, the absence of model response and internal variability, as discussed by Deser et al. (2012) [22], are another limitation; however, this would increase the complexity of the model and defeat the objective of this framework.
3.5. Dynamic Harvest Area to Accompany Projected Freshwater Requirements
The results from the dynamic simulation of substituting freshwater with harvested rainwater by progressively increasing the harvest area are illustrated in Figure 7, Figure 8, Figure 9, Figure 10 and Figure 11 and in the Supplementary Material S8. These results provide insights into five scenarios and their implications for rainwater harvesting (RWH) at the three industrial sites. As a general observation, an integrated approach to RWH would be to combine photovoltaic panels and rainwater harvesting to reduce CAPEX and increase return on investment.
3.5.1. Scenario 1
Scenario 1 represents an ideal scenario with no loss of rainwater through evapotranspiration or treatment. If the column bars exceed 100% (WWR), it indicates that the amount of harvested rainwater is greater than the industry’s needs, allowing for storage or sale to surrounding industries (Figure 7). Depending on the pathway chosen by the decision-maker (DM), the required harvest area for CON, ALU, and TTI may increase by 257%, 7991%, and 119%, respectively, to cover water needs with harvested rainwater. In the following decades (2030–2040, 2040–2050), the trend continues, but with fewer changes for the ALU site, which experiences the most significant increase in harvest area due to high freshwater consumption, low projected precipitation, and limited existing harvest area. This makes RWH implementation less attractive for ALU stakeholders.
Depending on the decade, the harvest area needed for each site varies. For example, in the first decade, the CON site requires a larger harvest area for the SSP2 pathway compared to SSP1, but this trend reverses in the following decades. TTI requires a smaller increase in harvest area compared to the other two sites, while the CON site’s harvest area could vary significantly depending on the SSP pathway and future precipitation events. This sometimes yields more rainwater than needed, requiring additional storage or sale to other industries.
3.5.2. Scenarios 2 and 3
Scenarios 2 and 3 have the same input parameters, except for water consumption: Scenario 2 assumes a linear increase, while Scenario 3 caps consumption in 2035. Both scenarios show similar RWH volumes for the first decade, with slight variations in the second and third decades due to capped water consumption. In Scenario 3, the CON site requires a smaller harvest area for 2040 and beyond, reducing investment costs. For TTI, a smaller harvest area across all pathways makes it the best option for RWH implementation, with SSP1 presenting the lowest initial investment.
3.5.3. Scenarios 4 and 5
Scenarios 4 and 5 differ in water treatment efficiency and recovery, but both cap water consumption in 2022. Scenario 5 has lower water coverage due to less rainwater recovery but implies smaller harvest areas and lower CAPEX. In Scenario 5, the CON site’s RWH system can cover 61% to 146% of water requirements, depending on the SSP pathway. ALU’s RWH coverage ranges from 54% to 78%, indicating a less feasible option due to the larger harvest areas required. TTI, on the other hand, can cover 55% to 82% of water needs, with the best results observed under the SSP1.
3.5.4. Potential Economic Savings (PES)
Table 11 indicates that SSP5 has the greatest potential economic savings, but it requires more significant capital investment. TTI, considering SSP2, indicates the best PES, while ALU requires the highest investment due to its need for extensive harvest areas.
4. Discussion
This manuscript presents an open-source solution for self-assessing the potential of implementing RWH systems at industrial sites in line with EU Regulation 2020/741 [15] and builds on the European Standard EN 16941-1 [19] for a more oriented form of data use, as suggested by Santos et al. (2020) [21]. The proposed framework and methodologies provide a simple tool that can be employed in a broad range of scenarios in order to assess the feasibility, practicability, benefits, required structures, and potential economic savings that could be accomplished within the defined boundaries. The resulting assessment can aid stakeholder engagement in informed decision-making and involve them from the design phase to the stepwise implementation phase, thus encouraging cross-industry collaboration. This is an important aspect, as water security plays a pivotal role in industrial sites; therefore, collaboration aligned with policy frameworks is important for sustainable development.
Recent studies have demonstrated concern with RWH in climate change contexts [21,41,42,43]. The water demand level is a driving factor for RWH performance [41] and thus should always be considered. The previous studies reported on the reliability of an RWH system as the number of times the water demand was achieved with rainwater. In this approach, this is improved as the stepwise harvesting procedure ensures that the demand of the industry will always be covered if the guidelines are followed (also depending on the pathways), thus optimising the RWH implementation process and enabling a structured approach. Additionally, the current approach can guide policy making, by enforcing potential policies related to minimal volumes of sourced water from alternative sources with regard to overall water consumption by industries—this can enable further collaboration between industrial parks.
The study demonstrates that rainwater harvesting (RWH) can significantly reduce freshwater consumption in industrial settings by promoting circular actions, with the potential for economic savings and environmental benefits. To implement RWH effectively, industrial sites should assess their catchment areas and water consumption patterns to determine the optimal system design. Collaboration with local stakeholders is key to enhancing the success of RWH projects. The three industrial sites evaluated in this study exhibit varying levels of water consumption, precipitation levels, harvesting areas, and overall rainwater harvesting potential. The TTI site has the largest catchment area and highest rainfall, indicating the best potential for implementing an RWH system. The variability among the industrial sites suggests that RWH strategies must be tailored to each site’s unique characteristics. This requires flexibility in design and adaptation to the industry’s specific needs—quite often, medium-sized industries are grouped in industrial zones and often resort to a syndicate for the collective industrial zone. Grouped investments could help mitigate investment costs, balance temporal consumption variations (process-specific), increase catchment areas, and optimise design.
Limitations in the current study should consider a broader range of scenarios and include real-time data to improve the accuracy of RWH projections. Additionally, more research is needed to explore the integration of RWH with other sustainable practices. Another limitation of this study is the reliance on projected rainfall data, which may not fully capture the variability and uncertainty of future climate patterns. This could affect the accuracy of the RWH system design. The framework enables a sustainable approach to implementing an RWH solution by guiding the industries in a stepwise manner. This ensures that the RWH solution is tailored to the industries’ needs and thus contributes to reducing freshwater consumption and promoting circular economy practices on a per-demand basis. Although the resolution is lost due to the temporal scale (annual basis), it is recommended to align the seasonality of rainwater harvesting on a monthly basis, as well as the industrial cycle. This would enable the determination of the storage tank volumes. In the current application, the framework’s objective is to demonstrate the varying strategies that the tool enables. However, the temporal scale is a choice that can be implemented by the decision-maker depending on the information that they wish to extract from the assessment. The framework can employ any temporal scale, depending on data availability. By integrating RWH with other sustainable strategies, industrial sites can achieve significant environmental and economic benefits.
5. Conclusions and Perspectives
This study demonstrates that rainwater harvesting (RWH) in industrial settings can significantly reduce freshwater consumption, with the potential for substantial economic savings. The results support the feasibility of implementing RWH systems in the EU industrial sector by 2050. The successful implementation of RWH systems aligns with sustainability goals and contributes to the circular economy. This approach reduces industrial water consumption, lowers the carbon footprint, and promotes environmental stewardship. While the results are promising, there are limitations due to the variability of the projected rainfall data. This uncertainty could affect the accuracy of RWH system design and implementation. Industrial sites should assess their catchment areas, water consumption patterns, and existing infrastructure to determine the optimal RWH system design. Collaboration with stakeholders and compliance with EU regulations are crucial for successful implementation. Future research should explore the integration of RWH with other sustainable practices, such as energy-efficient systems and green infrastructure such as green filtration roofs. Additional studies could also focus on developing more accurate models for predicting rainfall patterns and freshwater consumption.
The choice of which pathway solution to adopt depends on the direction states are taking regarding climate change adaptation and mitigation strategies. While decarbonisation is often politically favoured in the EU, resembling the SSP1 narrative, its implementation can be delayed or ineffective, rendering low mitigation and adaptation paths seemingly utopian. The SSP2/RCP4.5 pathway considered an optimistic approach, might lead to increased rainwater harvesting volumes, with surpluses potentially stored or sold within industrial sites’ vicinity. However, this scenario requires a higher initial investment, necessitating political support or incentives to be economically feasible. Incentives play a crucial role in facilitating the adoption of RWH solutions and promoting data-driven strategies. Innovative approaches, such as using photovoltaic (PV) panels to support both energy decarbonisation and RWH, offer a dual benefit of reducing carbon emissions while also alleviating water stress. This integrated approach to sustainability can drive long-term solutions, justifying initial investments.
Future recommendations for this framework include expanding it to cover CAPEX, OPEX, multiple objective optimisation problem formulations, and integrated solutions like PV panels. Water prices are another aspect to consider, while here the water price was considered fixed. Future recommendations should consider inflation on an annual basis to reflect potentially real savings. The framework aims to guide stakeholders in making informed decisions that support climate change policies, reduce greenhouse gas (GHG) emissions, and increase efficiency through circular and sustainable solutions.
One limitation of this framework, similar to other simulation models, is its reliance on data accuracy, transparency, and availability. This uncertainty underscores the need for a structured and incremental approach to implementing rainwater harvesting (RWH) solutions. The framework provides guidance to decision-makers (DMs) by promoting a step-by-step strategy that addresses this uncertainty. The framework is not limited to industrial sites but can be applied to other contexts where RWH serves as an alternative water source, contributing to sector sustainability. An integrated approach to RWH implementation can maximise multifunctional efficiency, offer a return on investment, and support broader sustainability goals. The application of the framework was limited to self-contained industrial boundaries; however, the framework could be used at a larger scale to perform a holistic assessment by considering other sustainable strategies as limitations on the inclusion of the RWH solution within an Integrated Water Resources Management (IWRM) approach. This would promote further efficient, equitable, and sustainable development and management of the available water sources within the defined boundaries of the assessment. Additionally, expanding the boundaries of the assessment to include the water balance and water allocation on a local scale would be the next step; however, this is prone to data availability and transparency.
This framework could be exploited for policy making by enforcing minimal volumes of sourced onsite rainwater used in industries, considering their current consumption levels. This can be tailored based on overall consumption ranges. It could be used to make medium- to long-term plans regarding the implementation of RWH systems in unison with other sustainable practices (e.g., PV panels). Additionally, it allows us to foresee best and worst-case scenarios.
Supplementary Materials
The following supporting information can be downloaded at: https://www.mdpi.com/article/10.3390/w16121758/s1, S1 and S2: Average Annual Growth Rate; S3. Potential industry freshwater requirements; S4 and S5. Potential rainwater harvested; S6. Potential harvest area; S7. Projected rainfall simulation considering the Representative Concentration Pathway (RCP); S8. Rainfall: SSP/RCP scenarios.
Author Contributions
Conceptualisation, D.F.C.D. and M.A.; methodology, D.F.C.D. and J.M.R.; validation, D.F.C.D., M.A. and J.M.R.; formal analysis, D.F.C.D.; investigation, D.F.C.D. and M.A.; data curation, D.F.C.D. and M.A.; writing—original draft preparation, D.F.C.D. and M.A.; writing—review and editing, D.F.C.D., M.A., J.M.R., H.J. and E.K. All authors have read and agreed to the published version of the manuscript.
Funding
This research has received funding received funding from the European Union’s Horizon 2020 research and innovation programme under grant agreement No 958274—iWAYS—Innovative WAter recoverY Solutions through recycling of heat, materials and water across multiple sectors.
Data Availability Statement
Data are contained within the article.
Acknowledgments
We would also like to extend the acknowledgement to Krister Eskilsson from Alufluor AB, Marco Manfrendini from Atlas-Concorde and Eduardo Quevedo from Tubacex for their support and input.
Conflicts of Interest
The authors declare no conflicts of interest. The funders had no role in the design of the study, in the collection, analyses, or interpretation of data, in the writing of the manuscript, or in the decision to publish the results.
Abbreviations
| AAGR | average annual growth rate |
| Al | Aluminium |
| ALU | Alufluor AB, Sweden |
| BAU | Business as usual |
| Ca | Calcium |
| CAPEX | Capital Expenditure |
| Cr | Chromium |
| CMIP6 | Coupled Model Intercomparison Project Phase 6 |
| COD | Chemical Oxygen Demand |
| CON | Atlas Concorde |
| DM | Decision-Maker |
| DSS | Decision Support System |
| ECA&D | European Climate Assessment and Dataset |
| EU | European Union |
| F | Fluor |
| FF | First-Flush |
| FWR | Freshwater Reduction |
| GHG | Green house gases |
| IPCC | Intergovernmental Panel on Climate Change |
| OPEX | Operational Expenditure |
| PES | Potential Economic Savings |
| PV | Photovoltaic |
| RCP | Representative Concentration Pathways |
| RRC | Rooftop Runoff Coefficient |
| RWH | Rainwater Harvesting |
| SSP | Shared Socioeconomic Pathways |
| TE | Treatment Efficiency |
| TN | Total Nitrogen |
| TOC | Total Organic Carbon |
| TSS | Total Suspended Solids |
| TTI | Tubacex Tubos Inoxidables, Spain |
| WWR | Water Withdrawal Reduction |
References
- Willet, J.; Wetser, K.; Vreeburg, J.; Rijnaarts, H.H.M. Review of methods to assess sustainability of industrial water use. Water Resour. Ind. 2019, 21, 100110. [Google Scholar] [CrossRef]
- Rahman, A. Recent Advances in Modelling and Implementation of Rainwater Harvesting Systems towards Sustainable Development. Water 2017, 9, 959. [Google Scholar] [CrossRef]
- Pandey, D.N.; Gupta, A.K.; Anderson, D.M. Rainwater harvesting as an adaptation to climate change. Curr. Sci. 2023, 85, 46–59. Available online: http://www.jstor.org/stable/24107712 (accessed on 19 January 2024).
- Chubaka, C.E.; Whiley, H.; Edwards, J.W.; Ross, K.E. A Review of Roof Harvested Rainwater in Australia. J. Environ. Public Health 2018, 2018, 6471324. [Google Scholar] [CrossRef] [PubMed]
- Campisano, A.; Modica, C. Rainwater harvesting as source control option to reduce roof runoff peaks to downstream drainage systems. J. Hydrol. 2016, 18, 23–32. [Google Scholar] [CrossRef]
- Coutts, A.M.; Tapper, N.J.; Beringer, J.; Loughnan, M.; Demuzere, M. Watering our Cities: The capacity for Water Sensitive Urban Design to support urban cooling and improve human thermal comfort in the Australian context. Prog. Phys. Geogr. 2012, 37, 2–28. [Google Scholar] [CrossRef]
- Hamel, P.; Fletcher, T.D.; Daly, E.; Beringer, J. Water retention by raingardens: Implications for local-scale soil moisture and water fluxes. In WSUD 2012: Water Sensitive Urban Design; Building the Water Sensitive Community, Proceedings of the 7th International Conference on Water Sensitive Urban Design, Barton, Australia, 21–23 February 2012; Centre for Water Sensitive Cities: Melbourne, Australia, 2012; pp. 1–8. [Google Scholar]
- Hermann, T.; Schimda, U. Rainwater utilization in Germany: Efficiency, dimensioning, hydraulic and environmental aspects. Urban Water. 2000, 1, 307–316. [Google Scholar] [CrossRef]
- Fewkes, A. The use of rainwater for WC flushing: The field testing of a collection system. Build. Environ. 1999, 34, 765–772. [Google Scholar] [CrossRef]
- Melville-Shreeve, P.; Ward, S.; Butler, D. Rainwater Harvesting Typologies for UK Houses: A Multi Criteria Analysis of System Configurations. Water 2016, 8, 129. [Google Scholar] [CrossRef]
- Jothiprakash, V.; Sathe, M.V. Evaluation of Rainwater Harvesting Methods and Structures Using Analytical Hierarchy Process for a Large-Scale Industrial Area. J. Water Resour. Prot. 2009, 1, 427–438. [Google Scholar] [CrossRef]
- Zhang, X.; Hu, M. Effectiveness of Rainwater Harvesting in Runoff Volume Reduction in a Planned Industrial Park, China. Water Resour. Manag. 2014, 28, 671–682. [Google Scholar] [CrossRef]
- Morales-Pinzon, T.; Rieradevall, J.; Gasol, C.M.; Gabarrell, X. Modelling for economic cost and environmental analysis of rainwater harvesting systems. J. Clean. Prod. 2015, 87, 613–626. [Google Scholar] [CrossRef]
- Campisano, A.; Butler, D.; Ward, S.; Burns, M.J.; Friedler, E.; DeBusk, K.; Fisher-Jeffes, L.N.; Ghisi, E.; Rahman, A.; Furumai, H.; et al. Urban rainwater harvesting systems: Research, implementation, and future perspectives. Water Res. 2017, 115, 195–209. [Google Scholar] [CrossRef] [PubMed]
- Regulation 2020/741. Regulation (EU) 2020/741 of the European Parliament and of the Council of 25 May 2020 on Minimum Requirements for Water Reuse. Available online: https://eur-lex.europa.eu/legal-content/EN/TXT/?uri=CELEX%3A32020R0741 (accessed on 1 June 2024).
- Ghisi, E.; Schondermark, P. Investment feasibility analysis of rainwater use in residences. Water Resour. Manag. 2013, 27, 2555–2576. [Google Scholar] [CrossRef]
- Imteaz, M.; Karki, R.; Hossain, I.; Karim, M. Climatic and spatial variabilities of potential rainwater savings and economic benefits for Kathmandu valley. Int. J. Hydrol. Sci. Technol. 2017, 7, 213–227. [Google Scholar] [CrossRef]
- Geraldi, M.; Ghisi, E. Assessment of the length of rainfall time series for rainwater harvesting in buildings. Resour. Cons. Rec. 2018, 133, 231–241. [Google Scholar] [CrossRef]
- EN 16941-1:2024; On-Site Non-Potable Water Systems—Part 1: Systems for the Use of Rainwater. European Committe for Standardization: Brussels, Belgium, 2024.
- EEA. Annual Report from the European Environment Agency: Signals 2018—Water Is Life. Water Use in Europe—Quantity and Quality Face Big Challenges; EEA: Copenhagen, Denmark, 2019. [Google Scholar]
- Santos, C.; Imteaz, M.A.; Ghisi, E.; Matos, C. The effect of climate change on domestic Rainwater Harvesting. Sci. Total Environ. 2020, 729, 138967. [Google Scholar] [CrossRef] [PubMed]
- Deser, C.; Phillips, A.; Bourdette, V.; Teng, H. Uncertainty in climate change projections: The role of internal variability. Clim. Dyn. 2012, 38, 527–546. [Google Scholar] [CrossRef]
- Chen, S.; Sun, H.; Chen, Q.; Liu, S.; Chen, X. An Innovative Approach to Predicting the Financial Prospects of a Rainwater Harvesting System. Water Resour. Manag. 2023, 37, 3169–3185. [Google Scholar] [CrossRef]
- Berg, P.; Photiadou, C.; Simonsson, L.; Sjokvist, E.; Thuresson, J.; Mook, R. Temperature and Precipitation Climate Impact Indicators from 1970 to 2100 Derived from European Climate Projections. Copernicus Climate Change Service (C3S) Climate Data Store (CDS). 2021. Available online: https://doi.org/10.24381/cds.9eed87d5 (accessed on 1 June 2024).
- Tebaldi, C.; Debeire, K.; Eyring, V.; Fischer, E.; Fyfe, J.; Friedlingstein, P.; Knutti, R.; Lowe, J.; O’Neill, B.; Sanderson, B.; et al. Climate model projections from the scenario model intercomparison project (ScenarioMIP) of CMIP6. Earth Syst. Dyn. Discuss. 2020, 12, 253–293. [Google Scholar] [CrossRef]
- O’Neill, B.C.; Tebaldi, C.; Van Vuuren, D.P.; Eyring, V.; Friedlingstein, P.; Hurtt, G.; Knutti, R.; Kriegler, E.; Lamarque, J.F.; Lowe, J.; et al. The scenario model intercomparison project (ScenarioMIP) for CMIP6. Geosci. Model Dev. 2016, 9, 3461–3482. [Google Scholar] [CrossRef]
- Peel, M.C.; Finlayson, B.L.; McMahon, T.A. Updated world map of the Koppen-Geiger climate classification. Hydrol. Earth Syst. Sci. 2007, 11, 1633–1644. [Google Scholar] [CrossRef]
- Klein Tank, A.M.G.; Wijngaard, J.B.; Können, G.P.; Böhm, R.; Demarée, G.; Gocheva, A.; Mileta, M.; Pashiardis, S.; Hejkrlik, L.; Kern-Hansen, C.; et al. Daily Dataset of 20th-Century Surface Air Temperature and Precipitation Series for the European Climate Assessment. Int. J. Climatol. 2002, 22, 1441–1453. [Google Scholar] [CrossRef]
- IPCC. Towards New Scenarios for Analysis of Emissions, Climate Change, Impacts, and Response Strategies. In Technical Summary; IPCC: Noordwijkerhout, The Netherlands, 2007. [Google Scholar]
- IPCC. Climate Change 2014: Synthesis Report. Contribution of Working Groups I, II and III to the Fifth Assessment Report of the Intergovernmental Panel on Climate Change; Core Writing Team, Pachauri, R.K., Meyer, L.A., Eds.; IPCC: Geneva, Switzerland, 2014; p. 151. [Google Scholar]
- O’Neill, B.C.; Kriegler, E.; Riahi, K. A new scenario framework for climate change research: The concept of shared socioeconomic pathways. Clim. Change 2014, 122, 387–400. [Google Scholar] [CrossRef]
- Riahi, K.; Van Vuuren, D.P.; Kriegler, E.; Edmonds, J.; O’neill, B.C.; Fujimori, S.; Bauer, N.; Calvin, K.; Dellink, R.; Fricko, O.; et al. The Shared Socioeconomic Pathways and their energy, land use, and greenhouse gas emissions implications: An overview. Global Environ. Change 2017, 42, 153–168. [Google Scholar] [CrossRef]
- Kriegler, E.; Edmonds, J.; Hallegatte, S.; Ebi, K.L.; Kram, T.; Riahi, K.; Winkler, H.; Van Vuuren, D.P. A new scenario framework for climate change research: The concept of shared climate policy assumptions. Clim. Change 2014, 122, 401–414. [Google Scholar] [CrossRef]
- O’Neill, B.C. The roads ahead: Narratives for shared socioeconomic pathways describing world futures in the 21st century. Global Environ. Change 2017, 42, 169–180. [Google Scholar]
- Copernicus Climate Change Service, Climate Data Store. CMIP6 Climate Projections. Copernicus Climate Change Service (C3S) Climate Data Store (CDS). 2021. Available online: https://cds.climate.copernicus.eu/cdsapp#!/dataset/10.24381/cds.c866074c?tab=overview (accessed on 1 June 2024).
- Sellar, A.A.; Walton, J.; Jones, C.G.; Wood, R.; Abraham, N.L.; Andrejczuk, M.; Andrews, M.B.; Andrews, T.; Archibald, A.T.; de Mora, L.; et al. Implementation of UK Earth system models for CMIP6. J. Adv. Model. Earth Syst. 2020, 12, e2019MS001946. [Google Scholar] [CrossRef]
- Haileamlak, A. Pandemics Will be More Frequent. Ethiop. J. Health Sci. 2022, 32, 228. [Google Scholar]
- Jamison, D.T.; Gelband, H.; Horton, S.; Jha, P.; Laxminarayan, R.; Mock, C.N.; Nugent, R. Disease Control Priorities: Improving Health and Reducing Poverty. Disease Control Priorities, 3rd ed.; World Bank: Washington, DC, USA, 2017; Volume 9. [Google Scholar] [CrossRef]
- de Vet, J.M.; Nigohosyan, D.; Ferrer, J.N.; Gross, A.K.; Kuehl, S.; Flickenschild, M. Impacts of the COVID19 Pandemic on EU Industries; Publication for the Committee on Industry, Research and Energy; Policy Department for Economic, Scientific and Quality of Life Policies, European Parliament: Luxembourg, 2021. [Google Scholar]
- Qtaishat, Y.; Hofman, J.; Adeyeye, K. Circular Water Economy in the EU: Findings from Demonstrator Projects. Clean Technol. 2022, 4, 865–892. [Google Scholar] [CrossRef]
- Toosi, A.S.; Danesh, S.; Tousi, E.G.; Doulabian, S. Annual and seasonal reliability of urban rainwater harvesting system under climate change. Sustain. Cities Soc. 2020, 63, 102427. [Google Scholar] [CrossRef]
- Monjardin, C.E.F.; Ente, A.L.B.; Lorenzo, G.M.G. Analysis of Rainwater Harvesting Methods Considering the Impacts of Climate Change. In Proceedings of the IEEE Conference on Technologies for Sustainability (SusTech), Corona, CA, USA, 21–23 April 2022. [Google Scholar] [CrossRef]
- Feloni, E.; Nastos, P.T. Evaluating Rainwater Harvesting Systems for Water Scarcity Mitigation in Small Greek Islands under Climate Change. Sustainability 2024, 16, 2592. [Google Scholar] [CrossRef]

Disclaimer/Publisher’s Note: The statements, opinions and data contained in all publications are solely those of the individual author(s) and contributor(s) and not of MDPI and/or the editor(s). MDPI and/or the editor(s) disclaim responsibility for any injury to people or property resulting from any ideas, methods, instructions or products referred to in the content. |
© 2024 by the authors. Licensee MDPI, Basel, Switzerland. This article is an open access article distributed under the terms and conditions of the Creative Commons Attribution (CC BY) license (https://creativecommons.org/licenses/by/4.0/).