Article

Novel Implications of the PARAFAC Model for Characterizing and Distributing DOM in Groundwater Networks by Using Spectroscopic Techniques

by
Yousef Alhaj Hamoud
1,2,
Abdullah Maqsood
3,
Muhammad Zia-ur-Rehman
3,*,
Hiba Shaghaleh
4,*,
Amna Sahar
5,
Muhammad Usman
3,
Muhammad Rizwan
6,
Hesham F. Alharby
7,8,
Refaat A. Abohassan
9 and
Awatif M. Abdulmajeed
10
1
The National Key Laboratory of Water Disaster Prevention, Hohai University, Nanjing 210098, China
2
College of Hydrology and Water Recourses, Hohai University, Nanjing 210098, China
3
Institute of Soil and Environmental Sciences, University of Agriculture, Faisalabad 38000, Pakistan
4
College of Environment, Hohai University, Nanjing 210098, China
5
Faculty of Food, Nutrition & Home Sciences, National Institute of Food Science and Technology, University of Agriculture, Faisalabad 38000, Pakistan
6
Department of Environmental Sciences, Government College University Faisalabad, Faisalabad 38000, Pakistan
7
Department of Biological Sciences, Faculty of Science, King Abdulaziz University, Jeddah 21589, Saudi Arabia
8
Plant Biology Research Group, Department of Biological Sciences, Faculty of Science, King Abdulaziz University, Jeddah 21589, Saudi Arabia
9
Department of Agriculture, Faculty of Environmental Sciences, King Abdulaziz University, Jeddah 21589, Saudi Arabia
10
Biology Department, Faculty of Science, University of Tabuk, Umluj 46429, Saudi Arabia
*
Authors to whom correspondence should be addressed.
Water 2024, 16(13), 1768; https://doi.org/10.3390/w16131768
Submission received: 28 May 2024 / Revised: 16 June 2024 / Accepted: 18 June 2024 / Published: 21 June 2024
(This article belongs to the Section Urban Water Management)

Abstract

:
Groundwater, a primary source of freshwater on Earth, is rapidly declining due to natural and anthropogenic activities. This study aimed to investigate the spatial distribution of dissolved organic matter (DOM) and heavy metals (HMs) in two municipal groundwater networks (A and B) from tube wells to taps in an industrial city, Faisalabad. The results showed that parameters such as color, turbidity, pH, EC, TDS, Ca2+, Mg2+, CO32−, HCO3, Cl, CaCO3, Na+, and NO3 were within the permissible limits set by the World Health Organization (WHO) and Pakistan Environmental Quality Standards (PEQSs). However, parameters like DO and COD exceeded standard values along the routes. Odor, taste, temperature, BOD, NH4+, T. coli, and F. coli surpassed acceptable levels at the tap end of both networks. Fluorescence EEM-PARAFAC spectra were analyzed at an excitation wavelength of 220–500 nm and emission wavelength of 240–550 nm, revealing UVA-humic-like (C1–C2) and UVC-humic-like (C3) components in the DOM. Based on fluorescence intensity, DOM was dominated by C2 > C1 > C3 compounds in both networks. The mean concentrations of HMs, including Cu, Zn, and Fe, fell below the prescribed limits in both networks. However, concentrations of Pb (A: 0.015–0.028 mg/L), (B: 0.013–0.027 mg/L), and Cd (A: 0.004–0.006 mg/L), (B: 0.005–0.008 mg/L) exceeded permissible limits from tube wells to taps. Moreover, C1 demonstrated a significant positive correlation with Cd and Cu in networks A and B, respectively. Furthermore, C2 displayed a significant positive correlation with Cd in network A. This study concludes that the groundwater in both networks (A and B) is contaminated by agricultural runoff, industrial and sewage water, plumbing materials, and eroded pipelines. As a result, the water is unsafe for cooking and drinking, posing risks of kidney, lung, and bladder cancers. Therefore, this study urgently recommends pipeline reconstruction and the implementation of proper groundwater remediation approaches before these sources are used for drinking.

1. Introduction

Freshwater is essential for human life, agriculture, and industrial operations. It is a critical resource for the health of ecosystems and human survival on Earth [1,2]. In developing Asian countries, like Pakistan, freshwater comes from surface water sources, such as rivers, canals, lakes, streams, ponds, and groundwater reservoirs [3]. Unfortunately, surface water resources are gradually deteriorating due to the presence of organic, inorganic, and nutrient materials from both natural and human-induced activities. This deterioration results in water pollution and poses risks of waterborne disease [4,5]. Under these circumstances, groundwater becomes a crucial freshwater resource, especially in semi-arid zones [6]. Environmental factors, such as global warming, snowmelt, heavy rainfall, changes in soil acidity, and spring infiltration, significantly impact groundwater quality [7,8]. In addition, increasing urbanization, industrial growth, and agricultural expansion have substantial implications for the accessibility and quality of groundwater resources [9]. Researchers suggest that groundwater quality is also at risk from pollutants like dissolved organic matter (DOM), heavy metals (HMs), and nitrate ions from anthropogenic activities [9,10]. Therefore, there is an urgent need to monitor and implement valuable approaches to maintain the quality of groundwater used for domestic purposes.
DOM refers to a heterogeneous combination of natural organic matter in the aquatic environment that can filter through a 0.45 µm membrane [11]. It originates from the degradation of living and dead plants, animals, microorganisms, wetlands, soils, refuse dumps, algae, and human excreta [12]. DOM, as a source of carbon, nitrogen, and energy for heterotrophic metabolism, also affects water quality, enhances microbial metabolism, and potentially reduces the efficiency of water treatment processes [13,14]. DOM can absorb and form complexes with trace metals, influencing their metallic form, bioavailability, and bioremediation [15]. In water, the combination of metallic ions and DOM can have a negative effect on fluorescence intensity measurement. Iron (Fe), for example, disturbs the optical properties of DOM by absorbing light at specific wavelengths and influencing the absorbance measurement [16]. Zinc (Zn) ions can attach to humic acid through carboxyl functional groups, while mercury (Hg) can be connected via carboxylic, alcoholic, and phenolic moieties [17]. Huang et al. [15] observed that cadmium (Cd) may bind to DOM in the fulvic-like fraction, whereas copper (Cu) binding to humic and protein-like substances was stronger. Although DOM is not toxic, spontaneous reactions occur between DOM, bromide, iodide, and disinfectants, producing disinfection by-products (DBPs) and biofilm in water supply pipes [18]. It enhances the Cu/Pb rust level in pipes [19].
Various techniques have been used to characterize the DOM in aquatic environments. In recent years, three-dimensional excitation–emission matrix (EEM) fluorescence spectroscopy has been widely used to characterize the DOM composition in water due to several benefits, such as fast speed, sensitivity, and robustness [20,21]. Based on the data of the EEM, Stedmon and Bro [22] was the first to utilize parallel factor analysis (PARAFAC) statistical tools to deconvolve the EEM and provide information about individual fluorescence peaks. Numerous fluorescence peaks have been identified in water bodies. Tryptophan (peak T), tyrosine-like (peak B), and soluble microbial product (SMP)-like (peak T2) peaks, usually denoted as protein-like fluorescence peaks T and B, are located at an emission (Em) wavelength of 380 nm [23,24]. Peaks A, C, and M positioned above the Em of 380 nm are usually linked with humic bodies. Peaks A and M represent fulvic-like substances, while peak C represents humic-like substances [23,25]. Peak (T) and peak (C) are expected to be linearly proportional to microbial growth and microbial metabolism, respectively [26].
Researchers have identified HM (Fe, Cd, Pb, Cu, Zn, Ni, and As) contamination in the groundwater of various cities in Pakistan, such as Lahore [27], Faisalabad [28], Vehari [29], and Swabi [30]. However, the literature on the composition and distribution variations in DOM and HMs in groundwater is scarce. To our knowledge, this survey represents an innovative study conducted for the first time in Faisalabad city, Pakistan. Faisalabad relies heavily on groundwater as its primary source of freshwater. It is the third-largest economic and populated state and the second-largest industrial center. The primary goal of this study was to identify hotspot areas and determine the suitability of groundwater for commercial and domestic use. The specific goals of this research were as follows: (i) to measure the distribution and concentration of pollutants in the groundwater of an industrial city; and (ii) to characterize and correlate the DOM and HMs using spectroscopy techniques.

2. Materials and Methods

2.1. Study Area

A survey study was conducted to determine groundwater quality in Faisalabad (31.4504° N, 73.1350° E), located on the flat plains of northeast Punjab, Pakistan. The total population of the city is 3.6 million. In Faisalabad, the sun’s rays are relatively direct during the summer, resulting in high temperatures (26.9–40.5 °C), while the winters (4.1–19.4 °C) are cool and dry. The average annual rainfall measures 14.76 inches, and the wind speed is 94 mph [28,31]. The management of the city’s groundwater supply is carried out by the Water and Sanitation Agency (WASA), Faisalabad. Jamal [32] explained how the city is appropriately networked.

2.2. Sample Collection and Analytical Characterization

Between 21 to 24 March 2022, we collected 150 samples from 50 sampling points, conducting two series of collections with three replications each. The samples were gathered in 1L plastic bottles that were thoroughly washed in a three-step process: first with tap water, then with double-distilled water (DDW), and finally with water from the sampling point before collecting the samples. Samples were collected from municipal water distribution networks, covering the entire system from tube wells to taps, following standard methods. Specifically, the sampling involved two networks: Network A: Samples were collected from tube wells at Chak 49 JB Munda Pend (MP), terminal reservoir (TR) A at Chak 7 JB, and taps in Mustafa Abad (MA); and Network B: Samples were taken from tube wells in Gatwala (GW), TR B in Madinah Town X Block, and taps in Madinah Town (MT) (Table S1). The coordinates of the sampling locations were recorded using a GARMIN GPS (Global Positioning System) and depicted on a GIS map (Tables S3 and S4; Figure 1).
Each sample was sealed with plastic film and immediately transported for preservation in the refrigerator at 4 °C. A series of samples was used for physicochemical and microbial analyses. The second series was passed through a 0.45 μm cellulose acetate membrane filter to distinguish DOM from particulate organic substances [33]. Before filtration, the 0.45 μm membrane filters underwent a prewashing process with DDW, which reduced their potential to emit dissolved organic carbon (DOC). All the reagents and solutions were prepared using analytical-grade chemicals and DDW. Glassware used for the analysis was cleaned with Thomas Baker Thormaklin liquid soap, rinsed with distilled water, and heat treated at 300 °C overnight to remove organic matter [34]. Physicochemical [34], biological [35], and HM (Fe, Pb, Cd, Zn, and Cu) analyses were examined as per the decorum designated in [36,37] (Table S2).

2.3. DOM Characterization

The filtered samples were placed in a 1 cm (girth) four-sided glass cuvette to collect fluorescence and ultraviolet spectra. This was performed using a FluoroMax 4 spectrometer (Horiba) for fluorescence spectroscopy and a UH5300 spectrophotometer (Hitachi, Japan) for UV-visible (UV-vis) spectroscopy. Higher dissolved organic matter (DOM) concentrations in water samples can affect the accuracy of fluorescence measurements due to inner filter effects. To address this, we used the UV-vis spectra to verify each sample’s absorption rate at a wavelength of 254 nm. If the absorption rate at 254 nm exceeded 0.05 cm−1, the samples were diluted with double-distilled water (DDW) [38]. Fluorescence spectra were captured in 3D-EEM (excitation–emission matrix) scan mode. The excitation (Ex) wavelength range was set from 220 to 500 nm, and the emission (Em) wavelength range was selected from 240 to 550 nm, with steps of 5 nm and 1 nm, respectively. The slit sizes for both Ex and Em were set at 10 nm, and the scan speed was 12,000 nm/min. EEMs of DDW were used as a blank and subtracted from the water sample readings.

2.4. PARAFAC Modeling

PARAFAC modeling was performed on the EEM datasets derived from each water sample using MATLAB (R2018a) (MathWorks Inc., USA) and the DOMFluor toolbox, following the instructions provided by Stedmon and Bro [22]. We undertook several steps to ensure accurate fluorescence analysis: removing scattering, applying non-negativity constraints, estimating the loading leverage, identifying and removing outliers (if any), and conducting split-half analysis. These steps helped ensure the reliability and accuracy of the fluorescence data analysis.

2.5. Statistical Analysis

Origin Pro (2022) statistical software (version 9.90.225) was used to create graphs and perform multivariate analysis, including principal component analysis (PCA) and Pearson correlation, using data on DOM, heavy metals content, physicochemical properties, and microbial characteristics of groundwater samples. Additionally, Microsoft Office Excel 2016 version number 16.0 was used to calculate the dataset’s maximum, minimum, mean, and standard deviation.

3. Results

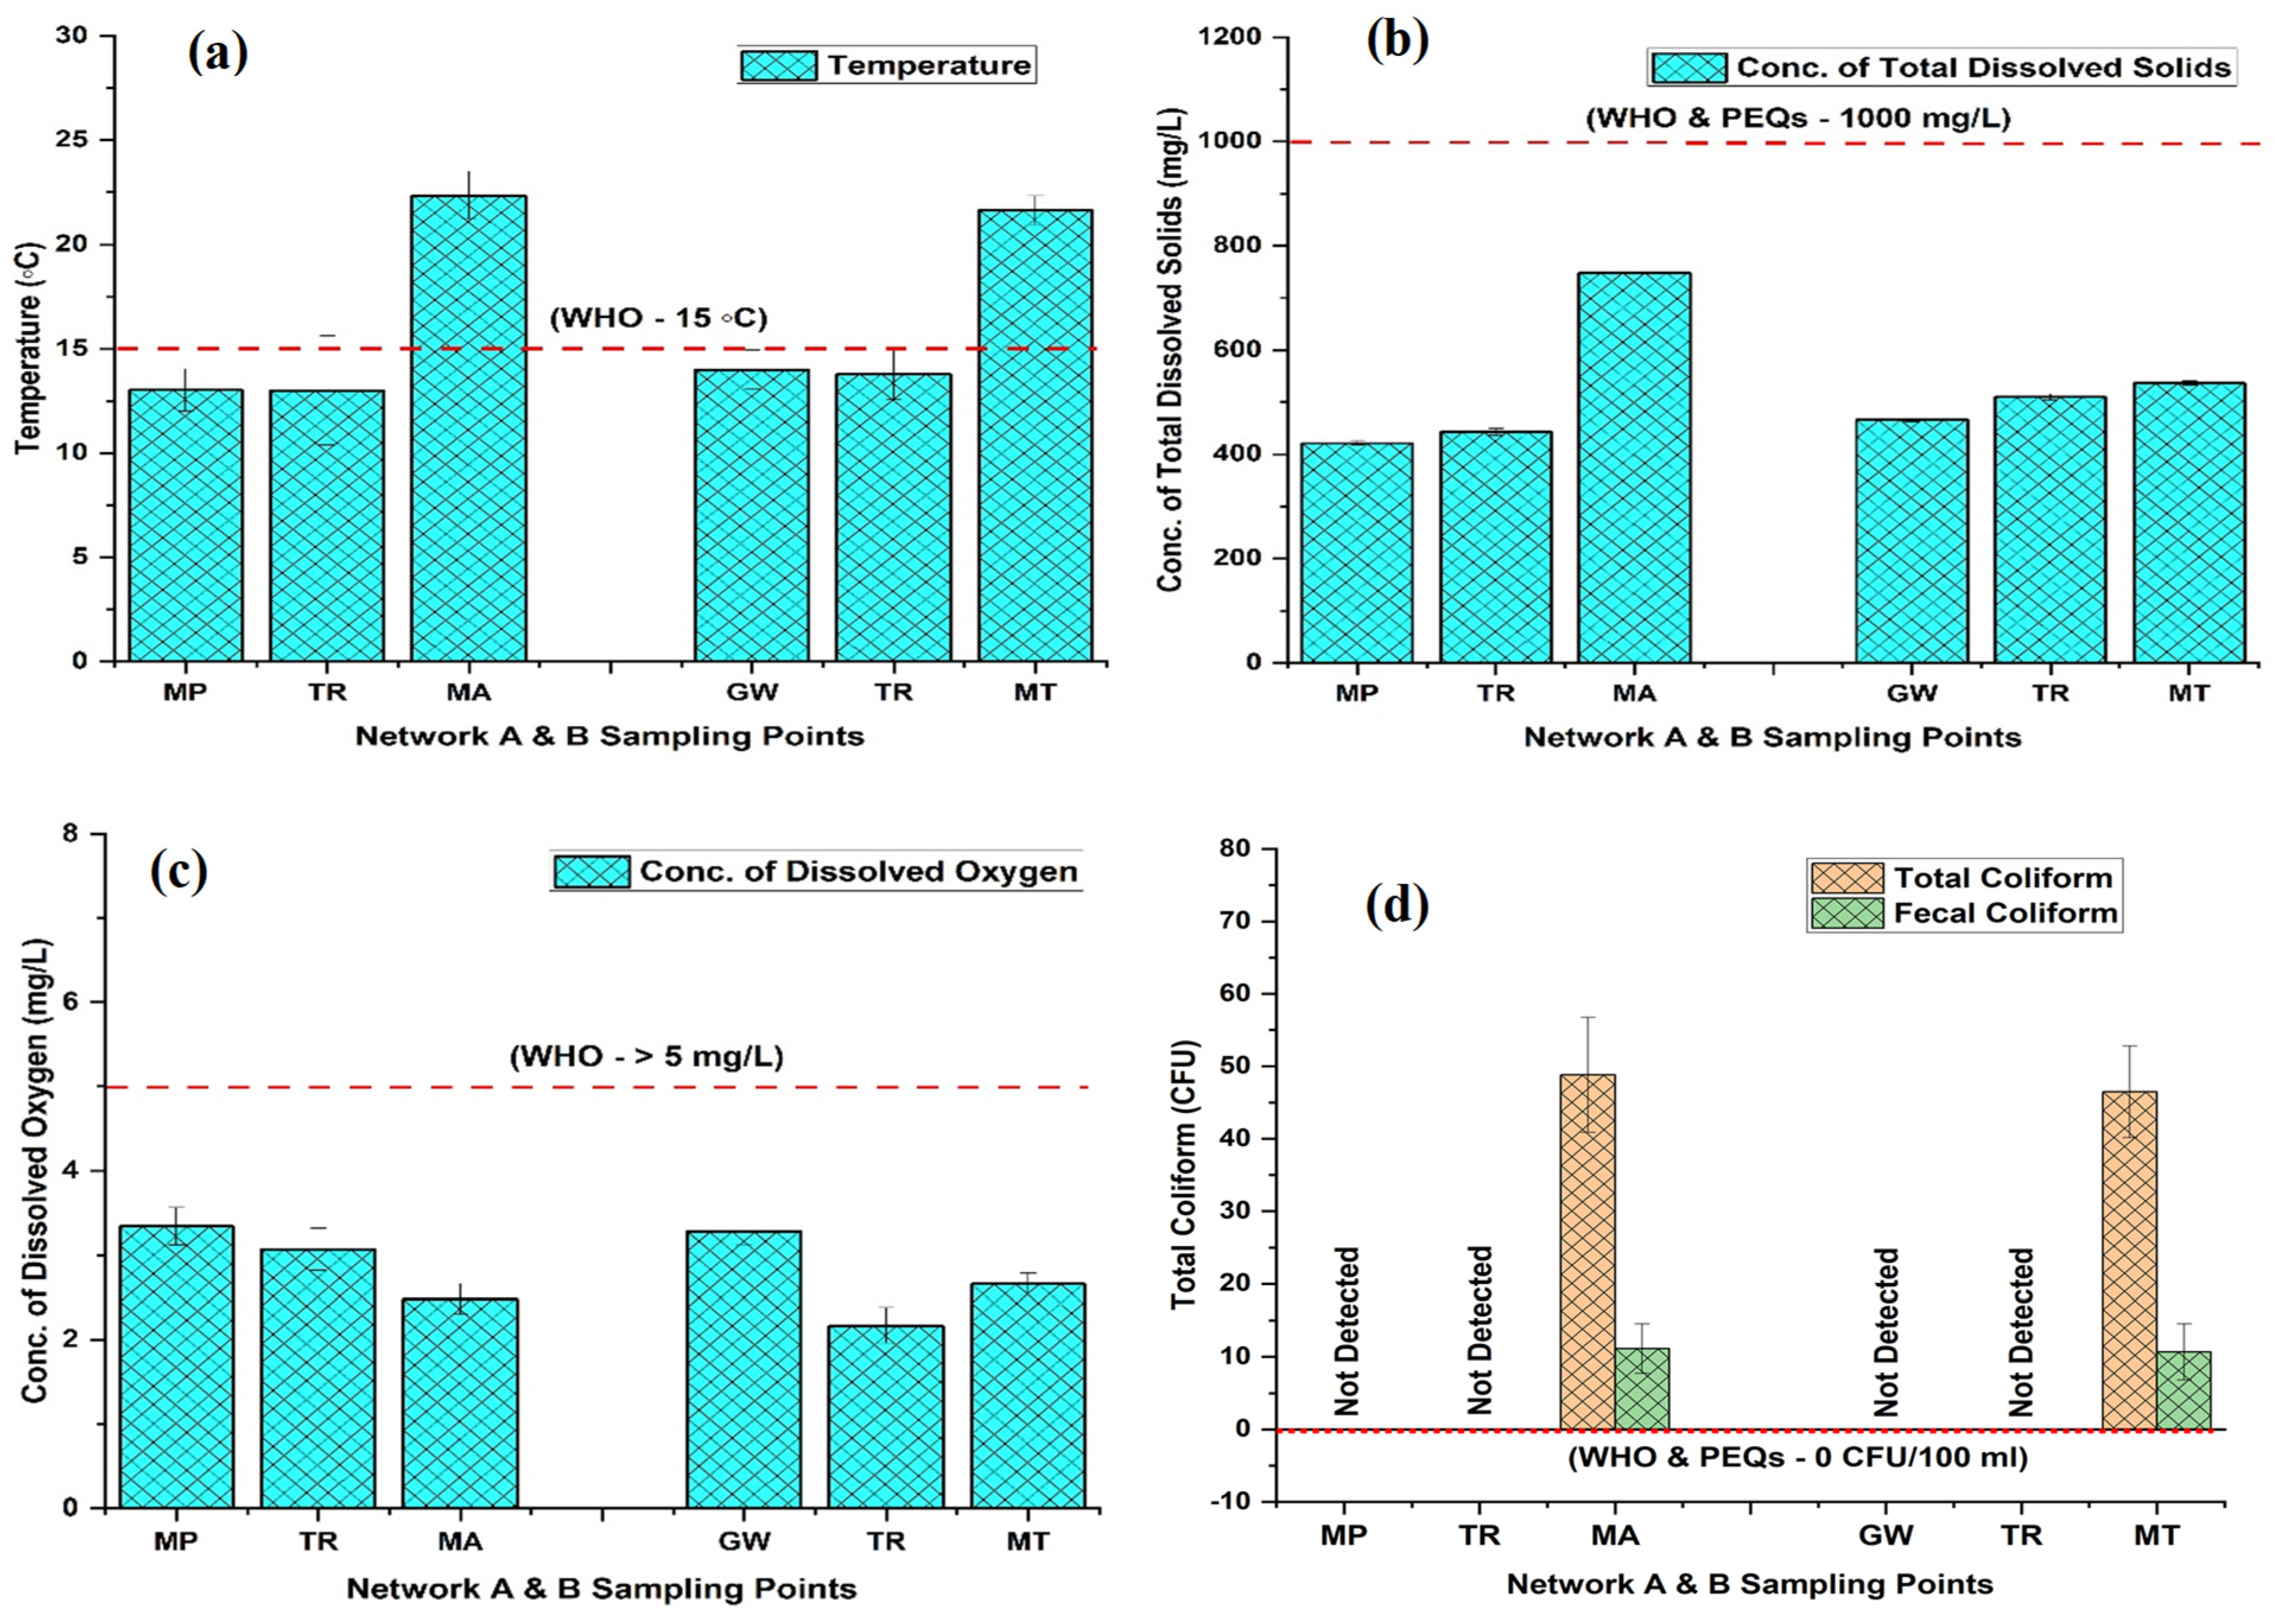
3.1. General Water Quality Parameters

The summarized results of the physicochemical and biological parameters used to evaluate the groundwater’s suitability for commercial and domestic purposes are provided in Table 1. The results are presented in the following format: Mean (range: minimum to maximum). The interpretation of our findings is based on the drinking water quality standards established by the World Health Organization (WHO) [39] and the Punjab Environment Quality Standards (PEQS) [40]. In both networks (A and B), the color and turbidity (TU) of the groundwater remained undetectable as it flowed from the tube well end to the tap end, but the odor and taste at the tap water end (MA and MT) were objectionable. The groundwater temperature (T) was in the range of 11.93–24.67 °C and 11.70–23.17 °C in the networks (A and B), with a mean value showing an increasing trend from the tube well end to tap end of 13.0222.36 °C and 13.99–21.64 °C, respectively. The T at both TRs (A and B) was recorded as 13 °C and 13.8 °C before distribution into the channel (Figure 2a). The min and max values were observed in network A at tube well MP-8 and tap MA-7, while in network B, they were noted at tube well GW-1 and tap MT-8, respectively. The ranged potential of hydrogen (pH) 6.20–8.43 in A and 6.17–8.10 in B of the groundwater displayed a downward trend in both networks. The pH values averaged 7.78–6.72 and 7.72–6.71 in both networks (A and B) from tube well end to tap end, respectively, showing a neutral to slightly acidic pH (Figure S2a). The electrical conductivity (EC) (Figure S2b) and total dissolved solids (TDSs) (Figure 2b) contents showed an upward trend from the tube well end to tap end, with values in the range of 174–532 µS/cm for EC and 266.67–787.67 mg/L for TDS in network A. Similarly, in network B, the values ranged from 228 to 501.67 µS/cm and 373.3 to 592.67 mg/L respectively. The groundwater dissolved oxygen (DO) varied from 2.17 to 4.56 mg/L in network A and 2.04 to 4.60 mg/L in network B, with a mean value of 3.34 to 2.48 mg/L and 3.28 to 2.66 mg/L, as water traveled from the tube well end to tap end and displayed a declining trend in both networks, respectively (Figure 2c).
The concentration of cations, including calcium (Ca2+), magnesium (Mg2+), sodium (Na+), and total hardness (CaCO3), exhibited an elevated trend in the groundwater networks of Faisalabad: in network A, they varied in the ranges of 25.67–72 mg/L, 8.17–28.03 mg/L, 26.57–118.67 mg/L, and 99.33–262.83 mg/L, respectively; in network B, it was in the ranges of 42.67–83.67 mg/L, 9.74–23.60 mg/L, 39.50–131 mg/L, and 153–233.33 mg/L, respectively. Notably, we found an upward trend in Ca2+, Mg2+, Na+, and CaCO3 (Figure S1a–d). Similarly, the anions concentration varied within the ranges of not-detected (n.d)-21.67 mg/L, 90.50–183.67 mg/L and 30.13–111.30 mg/L in network A, and n.d-27.33 mg/L, 108.67–220.67 mg/L, and 44–84.17 mg/L in network B, respectively, for carbonate (CO32−), bicarbonate (HCO3), and chloride (Cl). Notably, we found an upward trend for Cl concentration and downward trends for CO32− and HCO3 in both networks (A and B) (Figure S2c–e). The groundwater chemical oxygen demand (COD) was in the ranges of 7.60–22.97 mg/L and 7.80₋25.10 mg/L in networks A and B, respectively, with a mean value showing an elevated trend from the tube well end to tap end of 13.41₋19.45 mg/L and 11.74₋17.85 mg/L, respectively. The COD at TR A and B was recorded as 12.77 mg/L and 13.07 mg/L, respectively (Figure 3a). The min and max values were observed in network A at tube well MP-2 and tap MA-12, while in B, they were noted at tube well GW-7 and tap MT-2, respectively. The biochemical oxygen demand (BOD) ranges of 1.90₋11.30 mg/L in A and 1.57₋7.67 mg/L in B for the groundwater displayed an upward trend in both networks. The min and max values were observed in network A at tube well MP-2 and tap MA-9, while in B, they were noted at tube well GW-2 and tap MT-2, respectively. The BOD values were averaged as 3.49₋6.90 mg/L and 3.25₋6.11 mg/L in both networks (A and B) from the tube well end to tap end, respectively (Figure 3b).
The nitrate (NO3) and ammonium (NH4+) contents showed an increasing trend from the tube well end to tap end, with values in the range of 7.87₋19.57 mg/L for NO3 and 1.09₋5.23 mg/L for NH4+, in network A, respectively. Similarly, in network B, the values were in the ranges of 3.71₋16.25 mg/L and n.d-2.36 mg/L (Figure 3c,d). The NH4+ min and max values were observed in network A at tube well MP-9 and tap MA-7, while in B, they were discovered at tube well GW-7 and tap MT-10, respectively. The total coliforms (T. coli) and fecal coliforms (F. coli) in the groundwater remained undetectable at the tube well end and TR, but we discovered high contamination as it flowed toward the tap end in both networks (A and B). The values for T. coli and F. coli ranged from n.d-107.33 CFU and n.d-34.33 CFU at the MA tap end in network A, respectively, and from n.d-91.33 CFU and n.d-23.00 CFU at the MT tap end in network B, respectively (Figure 2d). In summary, our investigation revealed that parameters such as color, TU, pH, EC, TDS, Ca2+, Mg2+, Na+, CaCO3, CO32, HCO3, Cl, and NO3 were consistently within the permissible limits set by the WHO and PEQSs in both groundwater networks (A and B) from the tube well end to the tap end. However, issues were identified at the tap ends in both networks, where water properties, such as odor, taste, T, NH4+, BOD, T. coli, and F. coli, did not meet the established standards. Additionally, DO and COD levels were found to be exceed the threshold level outlined by the WHO in both groundwater networks from the tube well end to the tap end.

3.2. Spatial Evaluation of Heavy Metals

The trace metal contents in groundwater are displayed in Table 2. Lead (Pb) was in the ranges of 0.003₋0.032 mg/L and 0.004–0.033 mg/L in networks A and B, with mean values of 0.015₋0.028 mg/L and 0.013–0.027 mg/L showing an upward trend from the tube well end to tap end, respectively. The Pb values at both TRs A and B were recorded as 0.015 mg/L and 0.017 mg/L, respectively, before distribution into the channel. The min and max values were observed in network A at tube well MP-1 and tap MA-10, while in B, they were noted at tube well GW-2 and tap MT-8, respectively (Figure 4a). Fe, Cu, and Zn concentrations displayed an elevated trend in both networks: in network A, they were in the ranges of n.d-0.19 mg/L, 0.06₋0.88 mg/L, and 0.99–1.50 mg/L, respectively; in network B, they were in the ranges of 0.02₋0.22 mg/L, 0.04₋0.96 mg/L, and 1.27–1.68 mg/L, respectively (Figure 4b–d). The average level of Cd 0.004₋0.006 mg/L in A and 0.005₋0.008 mg/L in B of the groundwater displayed an increasing trend in both networks. The min and max values of Cd were observed in network A at tube well MP-6 (0.002 mg/L) and tap MA-5 (0.009 mg/L), respectively. In comparison, in B, they were noted at tube well GW-6 (0.002 mg/L) and tap MT-9 (0.012 mg/L) (Figure 4e). Our results indicate that metal concentrations, specifically Cu, Zn, and Fe, are below the established threshold limit. However, both Pb and Cd exceeded the permissible limits of the WHO, although they remained within the standards defined by the PEQSS in both networks (A and B) spanning from the tube well end to the tap end.

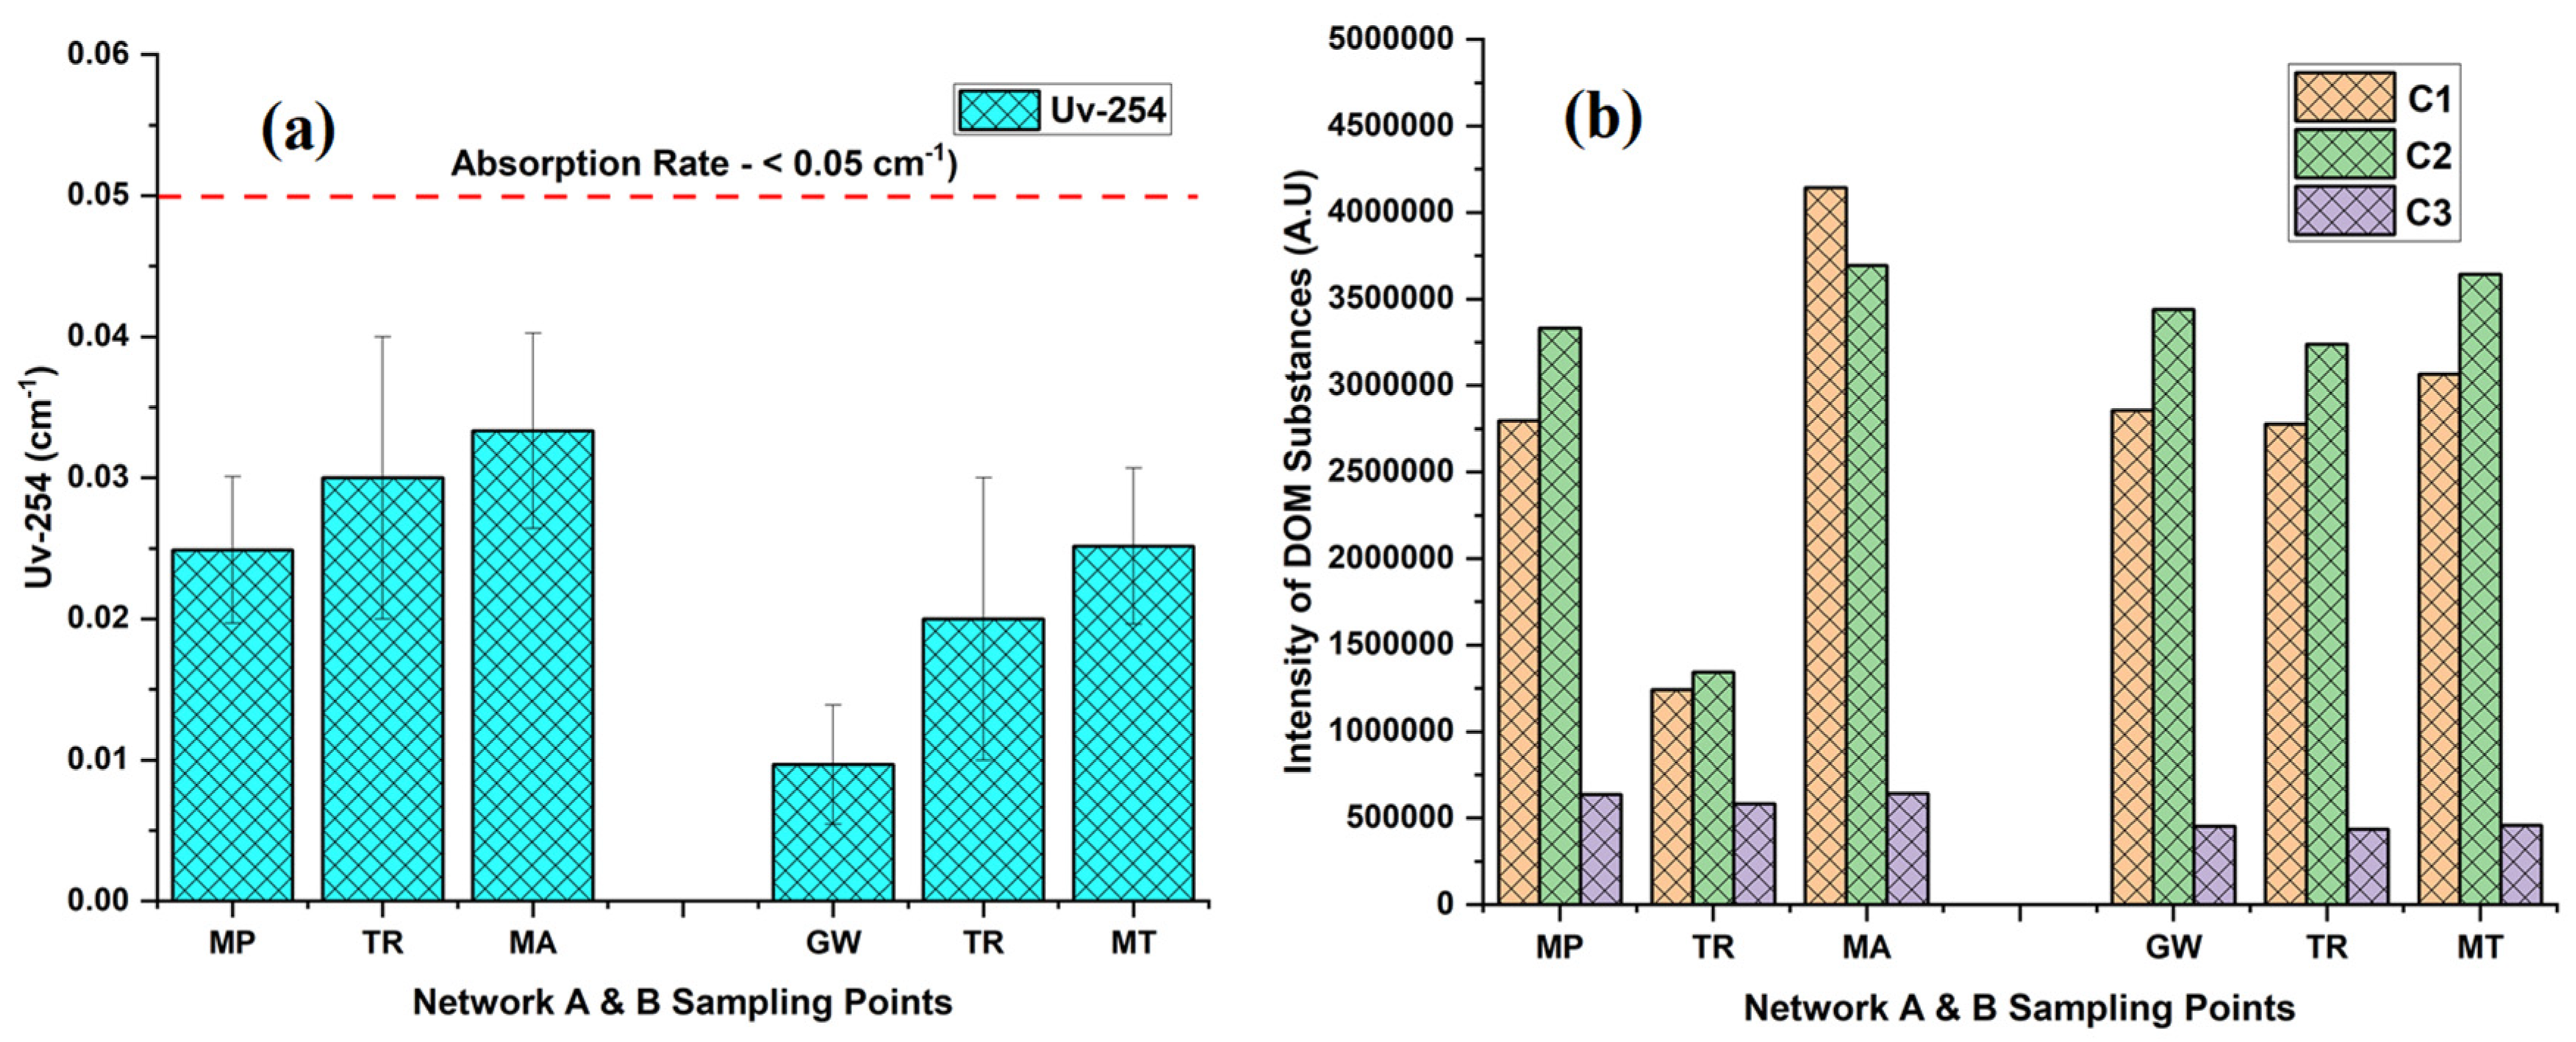
3.3. Fluorescence EEM-PARAFAC Analysis and Uv-254

The Uv-254 absorption rate was in the ranges of 0.00₋0.04 cm−1 in both networks A and B from tube well end to tap end (Figure 5a). EEM fluorescence was utilized to visually and qualitatively estimate DOM components in the groundwater. To yield more quantitative insights into the variation in fluorescence spectra and the distribution of DOM components, we conducted a PARAFAC analysis (Table 2; Figure 5b). This analysis identified DOM’s three humic-like components (C1, C2, and C3). A comprehensive summary of the spectral features of EEM-PARAFAC components can be found in Table 3. The peak of component 1 (C1) was found at Ex/Em: 255(362)/452 nm, which corresponds to a microbial humic-like-substance component and is classified as UVA [10,41]. C1 was in the ranges of 916,829.53–7,831,019.11 A.U and 1,171,664.00–4,550,157.92 A.U in network A and B, respectively, with a mean value showing an increasing trend from the tube well end to tap end in both networks. The min and max values were observed in network A at tube well MP-4 and tap MA-4, while in B, they were noted at tube well GW-9 and tap MT-9, respectively. Component 2 (C2) displayed a peak at an Ex/Em ratio of 315/370 nm, resembling a microbial humic-like-substance component and classified as UVA [10,42]. C2 min and max values were in the ranges of 1293146.40 (MP-4)-9730781.13 (MP-3) A.U in A and 1590794.19 (MT-10)-5020190.51 (GW-8) A.U in B, respectively, with a mean value showing an upward trend from the tube well end to tap end in both networks. Component 3 (C3) was exhibited at a maximum wavelength pair of Ex/Em: 290 (452)/510 nm, which was identified as terrestrial humic substances and classified as UVC [43,44]. The mean values of C3 show an elevated trend from the tube well end to tap end in networks A and B. The values varied in the ranges of 216,156.34–1,442,714.44 A.U (network A) and 242,890.87–863,057.10 A.U (network B). The min and max values were observed in network A at tube wells MP-4 and MP-14, while in B, they were noted at taps MT-2 and MT-5, respectively. These results indicate that the contents of C2 substances are highest in the groundwaters of both networks A and B in Faisalabad, and C3 has the lowest contents.

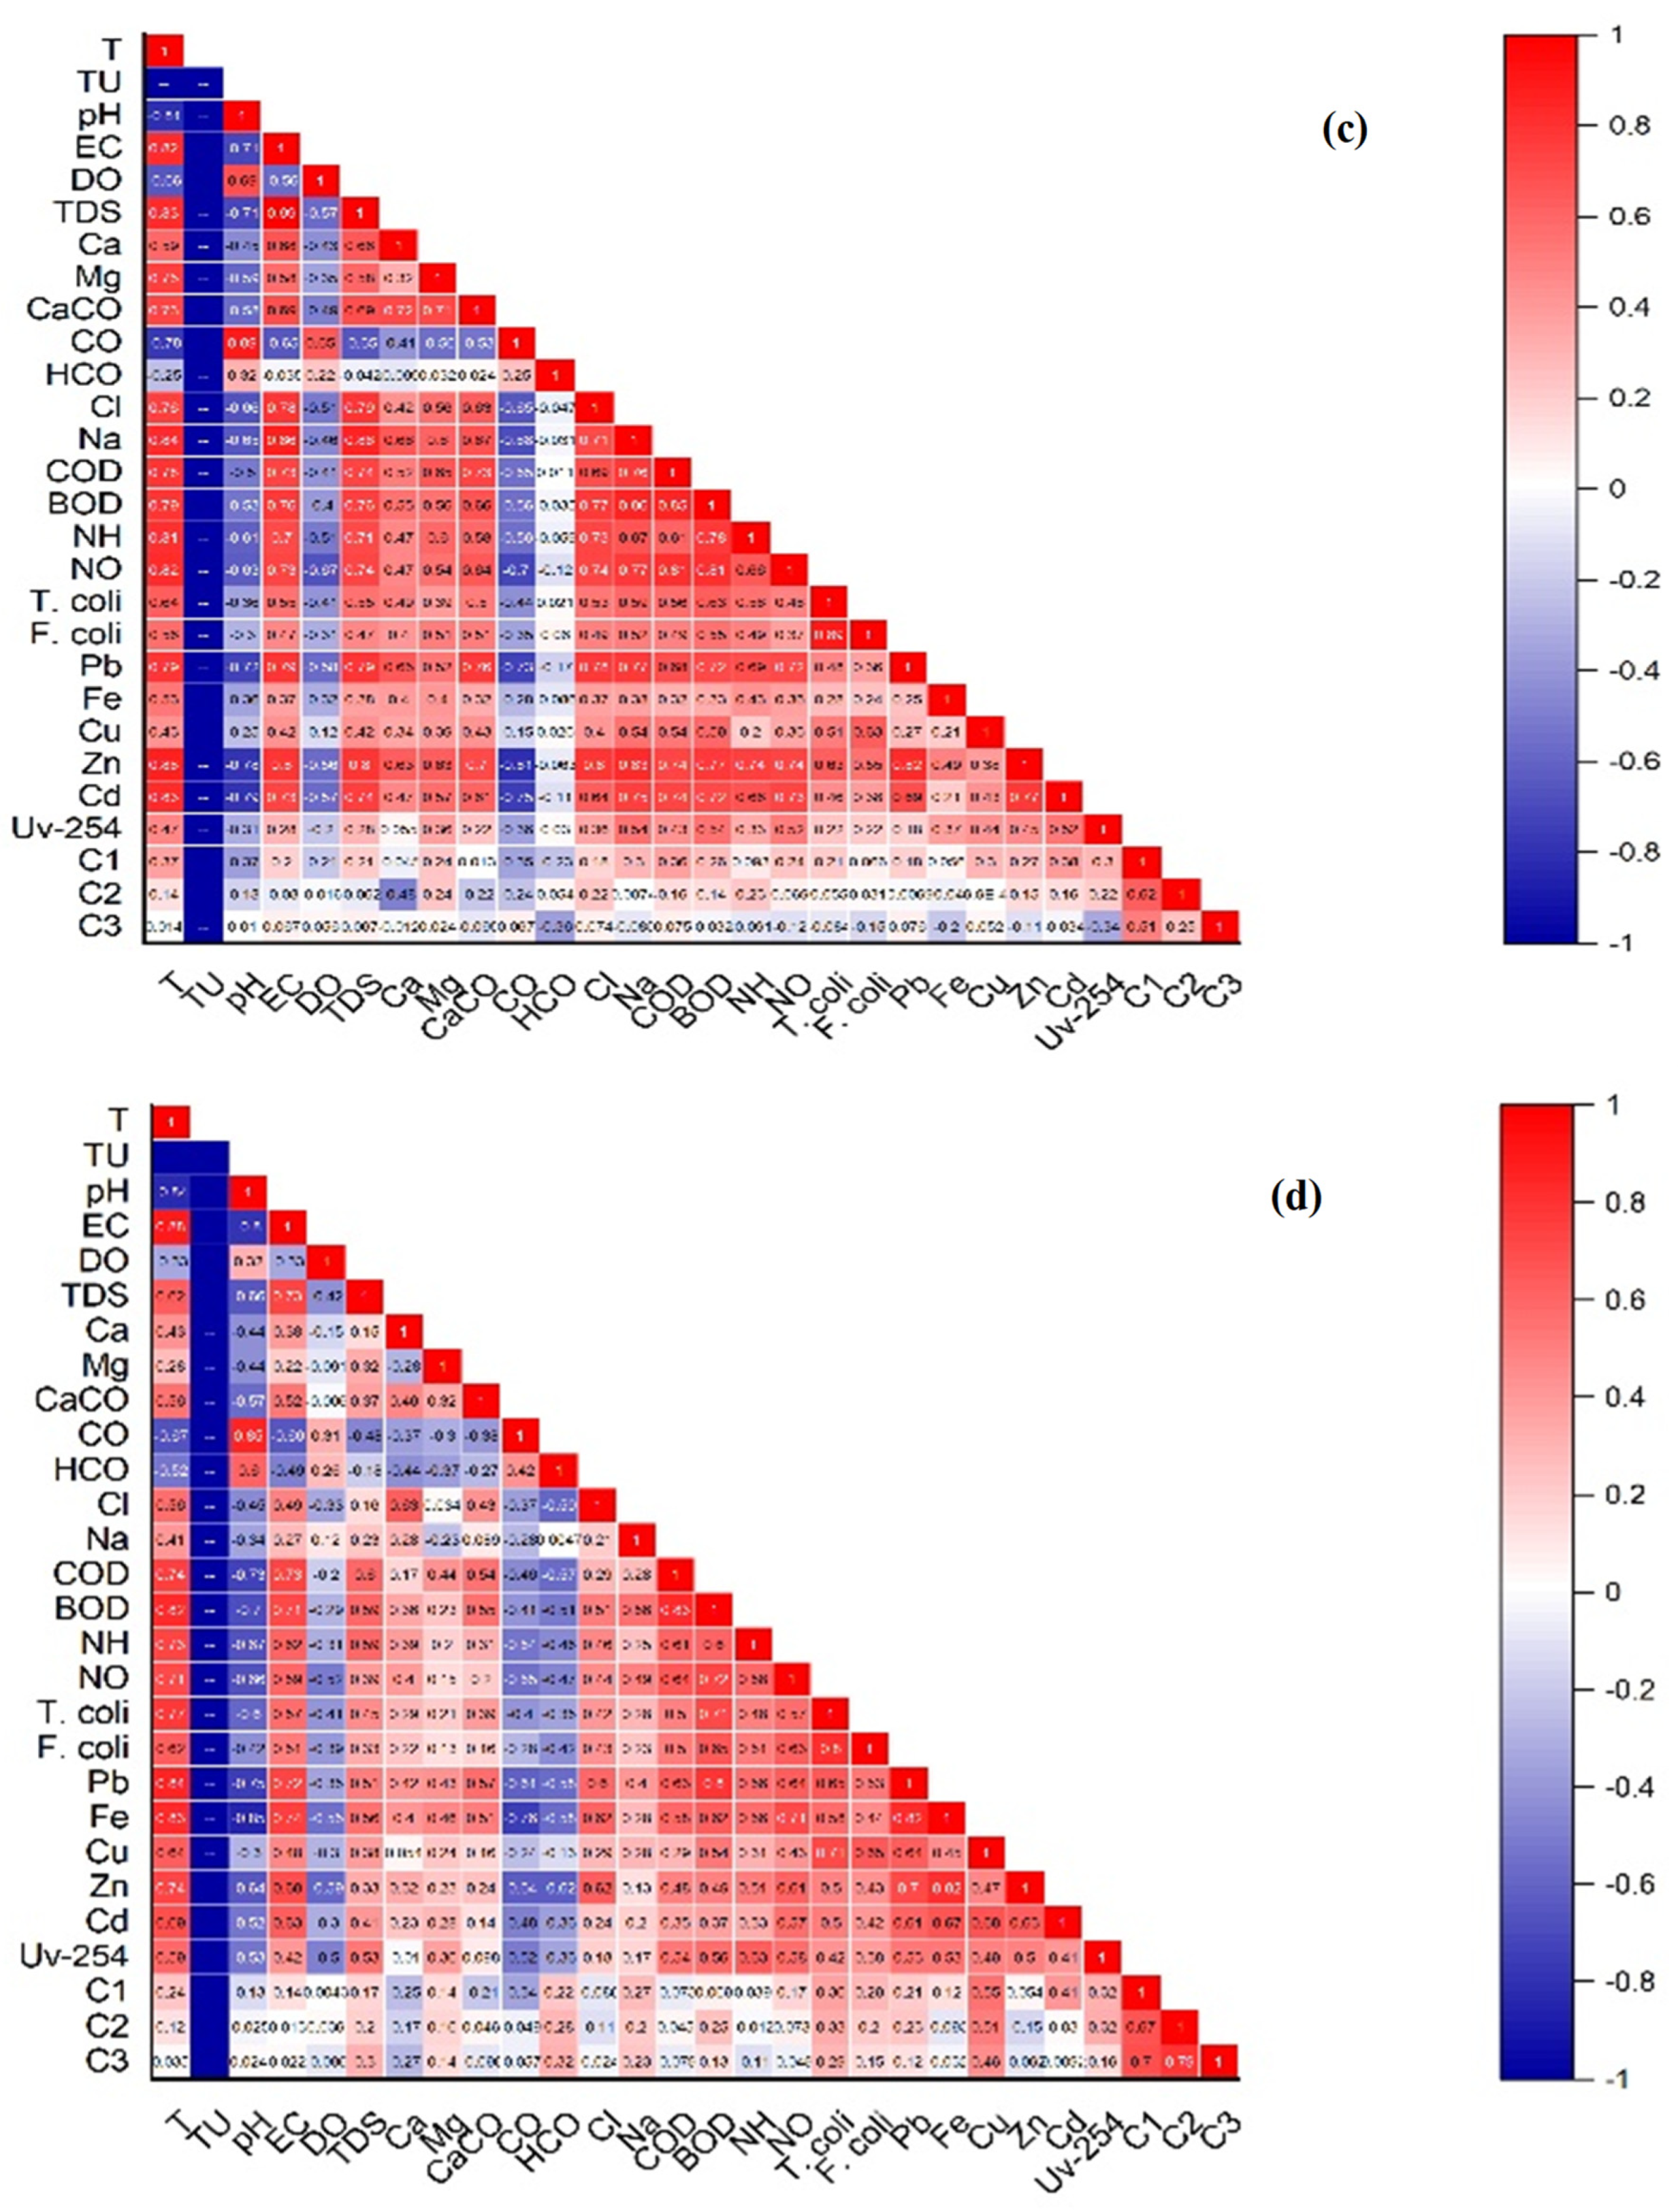
3.4. Correlation Analysis

We conducted a multivariate analysis to track trends and intercorrelations in the data, including PCA and the Pearson correlation matrix. PCA partitioned the data into the two components PC1 and PC2, which accounted for 52.26% and 8.56% of the variance, respectively. This collectively amounts to 60.82% of the total variance observed within network A (Figure 6a). In the case of network B, PC1 (44.89%) and PC2 (13.48%) constituted 58.37% of the total variance in the data, as depicted in (Figure 6b). The Pearson correlation statistical method, with a significance level of (p < 0.05), revealed that, in network A, metal Pb exhibited a strongly positive correlation with T, EC, TDS, Ca2+, Mg2+, CaCO3, Cl, Na+, COD, BOD, NH4+, NO3, Zn, and Cd, and moderately positive correlation with T. coli, F. coli, Fe, Cu, UV-254, C1, and C3. Meanwhile, a strongly negative correlation was observed with TU, pH, DO, and CO32−, and a moderately negative correlation with HCO3 and C2. Similarly, in network B, Pb demonstrated a positively strong correlation with T, EC, TDS, CaCO3, Cl, COD, BOD, NH4+, NO3, T. coli, F. coli, Fe, Cu, Zn, Cd, and UV-254, and positively moderate correlation with Ca2+, Mg2+, Na+, C1, C2, and C3, while there was a negatively strong correlation with TU, pH, CO32−, and HCO3, and a negatively moderate correlation with DO (Figure 6c,d). Metal Fe in network A exhibited a strongly positive correlation with T and moderately positive correlation with EC, TDS, Ca2+, Mg2+, CaCO3, Cl, Na+, COD, BOD, NH4+, NO3, T. coli, F. coli, Pb, Cu, Zn, Cd, UV-254, and C1. Meanwhile, there is a strongly negative correlation with TU and a moderately negative correlation with pH, DO, CO32−, HCO3, C2, and C3. Similarly, in network B, Fe demonstrated a positively strong correlation with T, EC, TDS, CaCO3, Cl, COD, BOD, NH4+, NO3, T. coli, Pb, Zn, Cd, and UV-254, and positively moderate correlation with Ca2+, Mg2+, Na+, F. coli, Cu, and C1, while there was a negatively strong correlation with TU, pH, DO, CO32−, and HCO3, and a negatively moderate correlation with C2 and C3 (Figure 6c,d).
Metal Cu in network A showed a strongly positive correlation with Na+, COD, BOD, T. coli, and F. coli, and a moderately positive correlation with T, EC, TDS, Ca2+, Mg2+, CaCO3, HCO3, Cl, NH4+, NO3, Pb, Fe, Zn, Cd, UV-254, C1, and C3. Meanwhile, there is a strongly negative correlation with TU and a moderately negative correlation with pH, DO, CO32−, and C2. Similarly, in network B, Cu displayed a positively strong correlation with T, BOD, T. coli, F. coli, Pb, Cd, C1, and C2, and a positively moderate correlation with EC, TDS, Ca2+, Mg2+, CaCO3, Cl, Na+, COD, NH4+, NO3, Fe, Zn, UV-254, and C3, while there was a negative strong correlation with TU and a negatively moderate correlation with pH, DO, CO32−, and HCO3 (Figure 6c,d). Metal Zn in network A exhibited a strongly positive correlation with T, EC, TDS, Ca2+, Mg2+, CaCO3, Cl, Na+, COD, BOD, NH4+, NO3, T. coli, F. coli, Pb, and Cd, and moderately positive correlation with Fe, Cu, UV-254, C1, and C2. Meanwhile, there is a strongly negative correlation with TU, pH, DO, and CO32−, and a moderately negative correlation with HCO3 and C3. Similarly, in network B, Zn demonstrated a positively strong correlation with T, EC, Cl, NH4+, NO3, T. coli, Pb, Fe, Cd, and UV-254, and a positively moderate correlation with TDS, Ca2+, Mg2+, CaCO3, Na+, COD, BOD, F. coli, and Cu, while there was a negatively strong correlation with TU, pH, DO, CO32−, and HCO3, and negatively moderate correlation with C1, C2, and C3 (Figure 6c,d). Metal Cd in network A showed strongly positive correlations with T, EC, TDS, Mg2+, CaCO3, Cl, Na+, COD, BOD, NH4+, NO3, Pb, Zn, and UV-254, and moderately positive correlations with Ca2+, T. coli, F. coli, Fe, Cu, C1, and C2. Meanwhile, there is a strongly negative correlation with TU, pH, DO, and CO32−, and a moderately negative correlation with HCO3 and C3. Similarly, in network B, Cd displayed a positively strong correlation with T, EC, NO3, T. coli, Pb, Fe, Cu, and Zn, and a positively moderate correlation with TDS, Ca2+, Mg2+, CaCO3, Cl, Na+, COD, BOD, NH4+, F. coli, UV-254, C1, C2, and C3, while there was a negative strong correlation with TU and pH, and a negatively moderate correlation with DO, CO32−, and HCO3 (Table 4; Figure 6c,d).

4. Discussion

Access to safe and pure groundwater is essential for sustaining human life. Yet, global groundwater contamination by industries due to the discharge of organic and inorganic pollutants poses a significant challenge [46]. Pakistan, the world’s sixth most populous nation, suffers from severe water scarcity and poor quality. Poor water quality in Pakistan, contaminated by sewage (fecal matter), industrial discharge, and agricultural runoff, is responsible for nearly 50% of illnesses and 40% of associated mortality. In Pakistan, approximately 20% of the population has access to improved sanitation and water sources, while the remaining 80% do not have access [47]. According to estimates, around 47 million Pakistanis might have been poisoned by metals [48,49]. To better understand the extent of the issue, we evaluated the groundwater quality in two networks in the metropolitan city of Faisalabad. Unfortunately, our findings reveal a worrying situation regarding groundwater quality for human consumption. Our physicochemical and biological results were in accordance with different national and international studies, such as in Faisalabad [28,32,50], Chiniot [51], Khurrianwala [52], Vehari [29], Hangu [53], Sindh [48], India [54,55], Ethiopia [56], Nigeria [57], Vietnam [58]. Consequently, these findings suggest a potential common origin for these components. The groundwater was polluted due to agricultural runoff, household PVC pipes, and industrial and sewage wastewater leaching through eroded pipelines during water transportation.
The warmer temperature of the tap water in Faisalabad may be due to its semi-arid climate conditions, featuring extremely hot and humid summers. The temperature in this region typically ranges between 26.9 °C (80.4 °F) and 45.5 °C (113.9 °F). An earlier study in Ethiopia reported a water temperature variation from the source end (16.1 °C) to taps (22.1 °C), which might be due to high temperatures and rainfall in the tropical climate [56]. The taste of minerals is more evident at room temperature than in chilled or cold water [59]. Furthermore, according to Henry’s Law, higher temperatures enhance odor intensity [60]. The primary origins of taste and odor in water can be attributed to various factors, including decaying organic matter, living organisms, iron, fungi, mixing industrial and swage effluents, and excessive chlorination [5,48,61]. Chen et al. [62] indicated that elevated summer temperature led to a reduction in the solubility of oxygen, which contributed to diminished concentrations of DO. A lack of DO in groundwater suggests the presence of organic contaminants [63] and may be contributing to the increased corrosion of pipes [64], algae growth [65], foul odor [57], and microbial degradation of NO3 to NO2 [39]. A high COD and BOD concentration results from sewage and industrial effluent discharge into water [57]. They indicate the presence of organic matter and microbes pollution, thereby promoting microbial activity [66]. High levels of NH4+ can contribute to increased BOD, potentially leading to reduced DO levels in the water. NH4+ is a natural by-product of the rapid decomposition of terrestrial humic-like organic matter [67]. This element originates from soil microbial activity and industrial and agricultural waste [68]. The presence of T. coli and F. coli in water samples indicates bacterial activity, and the presence of pathogens, such as Escherichia coli (E. coli), may be due to sewage and animal waste in groundwater supply pipelines [50,69]. Infectious and water-borne diseases can develop as a result of microbial contamination [50].
Certain metals, including Fe, Cu, and Zn, are recognized as micronutrients essential for the growth and health development of the human body [70]. Conversely, metals like Cd and Pb are classified as non-essential due to their toxicity. Nevertheless, the toxicity of these HMs depends on their concentrations in the water [71]. Pb, characterized by its low environmental concentration, limited solubility, and consequent immobility in soil, poses significant toxicity to humans and organisms [72]. Pb can be found in pipelines, plumbing systems, automobile fuels, paint, batteries, alloys, fossil fuel combustion products, sewage, and industrial and agricultural waste [39,72]. Pb is a very hazardous metal that causes toxic carcinogenic effects, brain damage, high blood pressure, threat to pregnancy, decline in fertility in men through sperm damage, anemia, kidney problems, and stomach and lung cancers [39,73]. Cd may be present in groundwater due to its widespread use in different industries (plastics, batteries, chemicals, and steel), galvanized pipes, solders, and metal fittings [39,74]. Cd poisoning primarily affects the liver and kidneys [74], and causes premature birth and cancer in humans [75]. Numerous previous national and international studies have consistently documented levels of HMs in groundwater exceeding or falling below permissible limits. Mahfooz et al. [28] reported low concentrations of Cd (0.002), Pb (0.001), Cu (0.22), Fe (0.09), and Zn (0.90) (mg/L) in tap water and hand-pump water in the industrial city Faisalabad, Pakistan. In Swabi city, Pakistan, Hussain et al. [30] revealed low levels of Cd (0.001), Pb (0.005), Cu (0.002), and Zn (0.003), and high levels of Fe (12.62) (mg/L) in groundwater samples from the industrial area.
Furthermore, Khalid et al. [29] reported low concentrations of Cu (0.31) and Zn (0.61) and high values of Cd (0.01), Pb (0.14), and Fe (1.67) (mg/L) in groundwater extracted by electric pumps in Vehari city, Pakistan, possibly due to the mixing of sewage and industrial water. Aleem et al. [52] found higher concentrations of Fe (0.48) and lower concentrations of Zn (0.05) (mg/L) in groundwater from hand pumps and electric pumps in the industrial city of Khurrianwala, Pakistan. In the dry season in northern Tanzania, Lwimbo et al. [76] reported concentrations of Cd (0.007), Pb (0.10), Cu (0.06), Fe (0.14), and Zn (0.31) (mg/L) in groundwater from shallow wells and deep boreholes, possibly due to the excessive use of phosphate fertilizers leading to the infiltration of contaminants through rainfall. Ren et al. [77] reported that Pb (0.039 mg/L) in groundwater extracted from tube wells in Peshawar city, Pakistan, was potentially due to intensive irrigation with fertilizers and plumbing materials. Thus, the likely sources of Cd and Pb may be attributed to agriculture runoff, industrial and sewage water mixing, plumbing materials, and substandard pipelines.
Water exhibiting elevated UV-254 nm absorbance is recognized for its substantial content of humic materials, specifically humic and fulvic acids, which are identified as primary precursors for the formation of trihalomethanes (THMs) and haloacetic acids (HAAs) after chlorination [78,79,80]. In chlorination, 50₋80% of chlorine oxidizes humic substances, transforming them into carbon dioxide (CO2). Meanwhile, around 5₋10% of the chlorine takes part in a different reaction to create DBPs [81,82]. These UVA (C1-C2) compounds were characterized as microbial humic-like substances with a low molecular weight, potentially identified in wastewater and agricultural environments [45,83]. UVC (C3) was a prevalent aromatic terrestrial humic-like compound with more condensed structures and a larger molecular size [84]. UVC might have been detected in aquatic and terrestrial environments [85]. This study agrees with Dong et al. [10], who determined microbial humic-like (UVA) fluorescence (C2) Ex/Em: 315/394 nm and (C3) Ex/Em: 255 (350)/422 nm, which could be affected by the mutual recharge of groundwater and surface water in shallow groundwater in Guan Zhong basin in China. McIntyre and Guéguen [41] and Fan et al. [41] determined microbial humic-like (UVA) fluorescence C1 (Ex/Em: 255(340)/455 nm) and C1 (Ex/Em: 320/400 nm) in aquatic environments in Canada and China, respectively. Tang et al. [43] and Liang et al. [44] reported terrestrial humic-like (UVC) fluorescence (C3) Ex/Em: 288 (466)/517 nm and (C3) Ex/Em: 300 (420)/520 nm,. The abundance of humic-like substances in source water could be due to terrestrial/soil organic matter, microbial humification, vegetation/forest cover, agricultural activities, deep water percolation, and soil erosion [86,87,88]. DOM in water adversely impacts groundwater quality and diminishes the efficiency of water treatment processes [14]. The consumption of disinfectant mixed water with an elevated concentration of DOM causes negative health impacts, such as bladder cancer, miscarriage, and children being born small for their gestational age due to different DBPs [89,90].

5. Conclusions

This study concludes that HMs, such as Cu, Zn, and Fe, were below the threshold limits, while Pb and Cd exceeded the permissible limits set by the WHO but remained within the standards of the PEQSs in both networks (A and B). Fluorescence EEM-PARAFAC spectra highlighted the presence of UVA-microbial humic-like components (C1 and C2) and a UVC-terrestrial humic-like component (C3) in DOM. Based on the fluorescence intensity, C2 dominated C1 and C3 in both networks. All humic components were strongly positively correlated, and C1 was positively associated with HMs in both networks. The concentration of humic substances in terminal reservoirs (TRs) decreased due to higher Cl concentrations, which oxidized the humic substances. However, their levels rebounded upon reaching taps as they traveled through pipelines. Groundwater pollution was attributed to agricultural runoff, household PVC pipes, and industrial and sewage wastewater leaching through eroded pipelines during water transportation. In both networks (A and B), the groundwater quality in Faisalabad presents a concerning situation for human health. Nevertheless, it can still be utilized for various industrial, agricultural, and household purposes, as the water meets the standards for these sectors. The study recommends a further evaluation of organic pollutants in this industrial city, especially pesticides and microplastics, as they could pose significant health risks.

Supplementary Materials

The following supporting information can be downloaded at: https://www.mdpi.com/article/10.3390/w16131768/s1, Figure S1: The concentration of Calcium (A), Magnesium (B), Sodium (C) and Total Hardness (D), in two groundwater networks: network A, spanning from Munda pend (MP) to Terminal Reservoir (TR) and then to taps in Mustafabad (MA) and network B, extending from (Gut Wala (GW) to Terminal Reservoir (TR) and then to taps in Madinah town (MT) in Faisalabad; Figure S2: The level of pH (A), Electrical Conductivity (B), Carbonate (C), Bicarbonate (D) and Chloride (E) in two groundwater networks: network A, spanning from Munda pend (MP) to Terminal Reservoir (TR) and then to taps in Mustafabad (MA) and network B, extending from (Gut Wala (GW) to Terminal Reservoir (TR) and then to taps in Madinah town (MT) in Faisalabad; Table S1: Detail of groundwater samples collection from different networks in industrial city Faisalabad, Punjab, Pakistan; Table S2: Parameters and analytical techniques used for groundwater samples analysis; Table S3: Sampling Coordinates of groundwater network A in industrial city Faisalabad, Punjab, Pakistan; Table S4: Sampling Coordinates of groundwater network B in industrial city Faisalabad, Punjab, Pakistan. Ref. [91] is cited in the Supplementary Materials.

Author Contributions

Conceptualization, Y.A.H.; Data curation, Y.A.H. and H.S.; Formal analysis, M.Z.-u.-R.; Investigation, H.F.A. and R.A.A.; Methodology, H.S. and A.S.; Project administration, H.F.A.; Resources, A.S., A.M., M.R. and A.M.A.; Software, M.Z.-u.-R., A.M., M.U. and A.M.A.; Validation, A.S., M.R. and R.A.A.; Writing—original draft, Y.A.H.; Writing—review and editing, M.Z.-u.-R., M.U. and H.S. All authors have read and agreed to the published version of the manuscript.

Funding

This work was funded by the Institutional Fund Projects under “grant no. IFPIP: 482-155-1443”, the Ministry of Education in Saudi Arabia.

Data Availability Statement

Data will be available on request.

Acknowledgments

The authors gratefully acknowledge the technical and financial support from the Ministry of Education and King Abdulaziz University, DSR, Jeddah, Saudi Arabia.

Conflicts of Interest

The authors declare no conflicts of interest.

References

  1. Ingrao, C.; Strippoli, R.; Lagioia, G.; Huisingh, D. Water Scarcity in Agriculture: An Overview of Causes, Impacts and Approaches for Reducing the Risks. Heliyon 2023, 9, e18507. [Google Scholar] [CrossRef]
  2. Layani, G.; Bakhshoodeh, M.; Zibaei, M.; Viaggi, D. Sustainable Water Resources Management under Population Growth and Agricultural Development in the Kheirabad River Basin, Iran. Bio-Based Appl. Econ. 2022, 10, 305–323. [Google Scholar] [CrossRef]
  3. Ishaque, W.; Mukhtar, M.; Tanvir, R. Pakistan’s Water Resource Management: Ensuring Water Security for Sustainable Development. Front. Environ. Sci. 2023, 11, 1096747. [Google Scholar] [CrossRef]
  4. Xiao, Y.; Hao, Q.; Zhang, Y.; Zhu, Y.; Yin, S.; Qin, L.; Li, X. Investigating Sources, Driving Forces and Potential Health Risks of Nitrate and Fluoride in Groundwater of a Typical Alluvial Fan Plain. Sci. Total Environ. 2022, 802, 149909. [Google Scholar] [CrossRef] [PubMed]
  5. Mumtaz, A.; Mirjat, M.S.; Mangio, H.; Soomro, A. Assessment of Drinking Water Quality Status and Its Impact on Health in Tandojam City. J. Basic Appl. Sci. 2017, 13, 363–369. [Google Scholar] [CrossRef]
  6. Li, P.; Karunanidhi, D.; Subramani, T.; Srinivasamoorthy, K. Sources and Consequences of Groundwater Contamination. Arch. Environ. Contam. Toxicol. 2021, 80, 1–10. [Google Scholar] [CrossRef] [PubMed]
  7. Meyer, T.; Wania, F. Organic Contaminant Amplification during Snowmelt. Water Res. 2008, 42, 1847–1865. [Google Scholar] [CrossRef]
  8. Fabris, R.; Chow, C.W.K.; Drikas, M.; Eikebrokk, B. Comparison of NOM Character in Selected Australian and Norwegian Drinking Waters. Water Res. 2008, 42, 4188–4196. [Google Scholar] [CrossRef] [PubMed]
  9. Jia, L.; Liu, H.; Kong, Q.; Li, M.; Wu, S.; Wu, H. Interactions of High-Rate Nitrate Reduction and Heavy Metal Mitigation in Iron-Carbon-Based Constructed Wetlands for Purifying Contaminated Groundwater. Water Res. 2020, 169, 115285. [Google Scholar] [CrossRef]
  10. Dong, L.; Zhang, J.; Guo, Z.; Li, M.; Wu, H. Distributions and Interactions of Dissolved Organic Matter and Heavy Metals in Shallow Groundwater in Guanzhong Basin of China. Environ. Res. 2022, 207, 112099. [Google Scholar] [CrossRef]
  11. Rajapaksha, A.U.; Ok, Y.S.; El-Naggar, A.; Kim, H.; Song, F.; Kang, S.; Tsang, Y.F. Dissolved Organic Matter Characterization of Biochars Produced from Different Feedstock Materials. J. Environ. Manag. 2019, 233, 393–399. [Google Scholar] [CrossRef] [PubMed]
  12. Shen, Y.; Chapelle, F.H.; Strom, E.W.; Benner, R. Origins and Bioavailability of Dissolved Organic Matter in Groundwater. Biogeochemistry 2014, 122, 61–78. [Google Scholar] [CrossRef]
  13. Schwalm, M.; Zeitz, J. Concentrations of Dissolved Organic Carbon in Peat Soils as Influenced by Land Use and Site Characteristics—A Lysimeter Study. Catena 2015, 127, 72–79. [Google Scholar] [CrossRef]
  14. Chiu, T.P.; Huang, W.S.; Chen, T.C.; Yeh, Y.L. Fluorescence Characteristics of Dissolved Organic Matter (Dom) in Percolation Water and Lateral Seepage Affected by Soil Solution (s-s) in a Lysimeter Test. Sensors 2019, 19, 4016. [Google Scholar] [CrossRef] [PubMed]
  15. Huang, M.; Li, Z.; Huang, B.; Luo, N.; Zhang, Q.; Zhai, X.; Zeng, G. Investigating Binding Characteristics of Cadmium and Copper to DOM Derived from Compost and Rice Straw Using EEM-PARAFAC Combined with Two-Dimensional FTIR Correlation Analyses. J. Hazard. Mater. 2018, 344, 539–548. [Google Scholar] [CrossRef] [PubMed]
  16. Doane, T.A.; Horwáth, W.R. Eliminating Interference from Iron(III) for Ultraviolet Absorbance Measurements of Dissolved Organic Matter. Chemosphere 2010, 78, 1409–1415. [Google Scholar] [CrossRef] [PubMed]
  17. Jaouadi, M.; Jebri, S.; M’nif, A. Dissolved Organic Matter Extracted from Groundwater and Heavy Metals Behavior in Ain Senan-Kef, Tunisia. Groundw. Sustain. Dev. 2019, 9, 100254. [Google Scholar] [CrossRef]
  18. Williams, C.J.; Conrad, D.; Kothawala, D.N.; Baulch, H.M. Selective Removal of Dissolved Organic Matter Affects the Production and Speciation of Disinfection Byproducts. Sci. Total Environ. 2019, 652, 75–84. [Google Scholar] [CrossRef] [PubMed]
  19. Adusei-Gyamfi, J.; Ouddane, B.; Rietveld, L.; Cornard, J.-P.; Criquet, J. Natural Organic Matter-Cations Complexation and Its Impact on Water Treatment: A Critical Review. Water Res. 2019, 160, 130–147. [Google Scholar] [CrossRef]
  20. Carstea, E.M.; Bridgeman, J.; Baker, A.; Reynolds, D.M. Fluorescence Spectroscopy for Wastewater Monitoring: A Review. Water Res. 2016, 95, 205–219. [Google Scholar] [CrossRef]
  21. Maqbool, T.; Li, C.; Qin, Y.; Zhang, J.; Asif, M.B.; Zhang, Z. A Year-Long Cyclic Pattern of Dissolved Organic Matter in the Tap Water of a Metropolitan City Revealed by Fluorescence Spectroscopy. Sci. Total Environ. 2021, 771, 144850. [Google Scholar] [CrossRef] [PubMed]
  22. Stedmon, C.A.; Bro, R. Characterizing Dissolved Organic Matter Fluorescence with Parallel Factor Analysis: A Tutorial. Limnol. Oceanogr. Methods 2008, 6, 572–579. [Google Scholar] [CrossRef]
  23. Bieroza, M.; Baker, A.; Bridgeman, J. Relating Freshwater Organic Matter Fluorescence to Organic Carbon Removal Efficiency in Drinking Water Treatment. Sci. Total Environ. 2009, 407, 1765–1774. [Google Scholar] [CrossRef] [PubMed]
  24. Shi, W.; Zhuang, W.-E.; Hur, J.; Yang, L. Monitoring Dissolved Organic Matter in Wastewater and Drinking Water Treatments Using Spectroscopic Analysis and Ultra-High Resolution Mass Spectrometry. Water Res. 2021, 188, 116406. [Google Scholar] [CrossRef] [PubMed]
  25. Maqbool, T.; Qin, Y.; Ly, Q.V.; Zhang, J.; Li, C.; Asif, M.B.; Zhang, Z. Exploring the Relative Changes in Dissolved Organic Matter for Assessing the Water Quality of Full-Scale Drinking Water Treatment Plants Using a Fluorescence Ratio Approach. Water Res. 2020, 183, 116125. [Google Scholar] [CrossRef] [PubMed]
  26. Fox, B.; Thorn, R.; Anesio, A.; Cox, T.; Attridge, J.; Reynolds, D. Microbial Processing and Production of Aquatic Fluorescent Organic Matter in a Model Freshwater System. Water 2018, 11, 10. [Google Scholar] [CrossRef]
  27. Malik, A.; Parvaiz, A.; Mushtaq, N.; Hussain, I.; Javed, T.; Rehman, H.U.; Farooqi, A. Characterization and Role of Derived Dissolved Organic Matter on Arsenic Mobilization in Alluvial Aquifers of Punjab, Pakistan. Chemosphere 2020, 251, 126374. [Google Scholar] [CrossRef] [PubMed]
  28. Mahfooz, Y.; Yasar, A.; Sohail, M.T.; Tabinda, A.B.; Rasheed, R.; Irshad, S.; Yousaf, B. Investigating the Drinking and Surface Water Quality and Associated Health Risks in a Semi-Arid Multi-Industrial Metropolis (Faisalabad), Pakistan. Environ. Sci. Pollut. Res. 2019, 26, 20853–20865. [Google Scholar] [CrossRef] [PubMed]
  29. Khalid, S.; Shahid, M.; Natasha; Shah, A.H.; Saeed, F.; Ali, M.; Qaisrani, S.A.; Dumat, C. Heavy Metal Contamination and Exposure Risk Assessment via Drinking Groundwater in Vehari, Pakistan. Environ. Sci. Pollut. Res. 2020, 27, 39852–39864. [Google Scholar] [CrossRef]
  30. Hussain, R.; Khattak, S.A.; Ali, L.; Sattar, S.; Zeb, M.; Hussain, M.L. Correction to: Impacts of the Linear Flowing Industrial Wastewater on the Groundwater Quality and Human Health in Swabi, Pakistan (Environmental Science and Pollution Research, (2021), 28, 40, (56741-56757), 10.1007/S11356-021-13842-5). Environ. Sci. Pollut. Res. 2021, 28, 56758. [Google Scholar] [CrossRef]
  31. Saleem, A.; Mahmood, S. Spatio-Temporal Assessment of Urban Growth Using Multi-Stage Satellite Imageries in Faisalabad, Pakistan. Adv. Remote Sens. 2023, 3, 10–18. [Google Scholar]
  32. Jamal, S. Situational Analysis of Water Resources in Faisalabad City (Establishing a Case for Water Stewardship). WWF Pakistan Report. WWF Situational Analysis of Water Resources of Karachi. Wwf. 2019. Available online: https://wwfasia.awsassets.panda.org/downloads/situational_analysis_of_water_resources_of_faisalabad_city__1_.pdf (accessed on 14 June 2024).
  33. Zsolnay, Á. Dissolved Organic Matter: Artefacts, Definitions, and Functions. Geoderma 2003, 113, 187–209. [Google Scholar] [CrossRef]
  34. American Public Health Association; Eaton, A.D.; American Water Works Association; Water Environment Federation. Standard Methods for the Examination of Water and Wastewater; APHA-AWWA-WEF: Washington, DC, USA, 2005. [Google Scholar]
  35. Pepper, I.L.; Gerba, C.P.; Brendecke, J.W. Environmental Microbiology: A Laboratory Manual; Academic Press: Cambridge, MA, USA, 1995; ISBN 0125506554. [Google Scholar]
  36. Simmons, G.M. Standard Methods for the Examination of Water and Waste Water. A. E. Greenberg, L.S. Clesceri, A.D. Eaton. J. N. Am. Benthol. Soc. 1993, 12, 308–309. [Google Scholar] [CrossRef]
  37. Estefan, G.; Sommer, R.; Ryan, J. Methods of Soil, Plant, and Water Analysis: A Manual for the West Asia and North; International Center for Agricultural Research in the Dry Areas (ICARDA): Beirut, Lebanon, 2013; pp. 1–243. [Google Scholar]
  38. Aftab, B.; Hur, J. Fast Tracking the Molecular Weight Changes of Humic Substances in Coagulation/Flocculation Processes via Fluorescence EEM-PARAFAC. Chemosphere 2017, 178, 317–324. [Google Scholar] [CrossRef] [PubMed]
  39. World Health Organization. Guidelines for Drinking-Water Quality: Fourth Edition Incorporating the First and Second Addenda; World Health Organization: Geneva, Switzerland, 2022; pp. 1–614. [Google Scholar]
  40. Tsegaye, H.; Thillaigovindan, N.; Alemayehu, G. An Efficient Method for Solving Intuitionistic Fuzzy Multi-objective Optimization Problems. Punjab Univ. J. Math. 2021, 53, 631–664. [Google Scholar] [CrossRef]
  41. McIntyre, A.M.; Guéguen, C. Binding Interactions of Algal-Derived Dissolved Organic Matter with Metal Ions. Chemosphere 2013, 90, 620–626. [Google Scholar] [CrossRef] [PubMed]
  42. Fan, T.; Yao, X.; Sun, Z.; Sang, D.; Liu, L.; Deng, H.; Zhang, Y. Properties and Metal Binding Behaviors of Sediment Dissolved Organic Matter (SDOM) in Lakes with Different Trophic States along the Yangtze River Basin: A Comparison and Summary. Water Res. 2023, 231, 119605. [Google Scholar] [CrossRef] [PubMed]
  43. Tang, G.; Zheng, X.; Li, B.; Chen, S.; Zhang, B.; Hu, S.; Qiao, H.; Liu, T.; Wang, Q. Trace Metal Complexation with Dissolved Organic Matter Stresses Microbial Metabolisms and Triggers Community Shifts: The Intercorrelations. Environ. Pollut. 2022, 314, 120221. [Google Scholar] [CrossRef] [PubMed]
  44. Liang, E.; Li, J.; Li, B.; Liu, S.; Ma, R.; Yang, S.; Cai, H.; Xue, Z.; Wang, T. Roles of Dissolved Organic Matter (DOM) in Shaping the Distribution Pattern of Heavy Metal in the Yangtze River. J. Hazard. Mater. 2023, 460, 132410. [Google Scholar] [CrossRef]
  45. Stedmon, C.A.; Markager, S.; Bro, R. Tracing Dissolved Organic Matter in Aquatic Environments Using a New Approach to Fluorescence Spectroscopy. Mar. Chem. 2003, 82, 239–254. [Google Scholar] [CrossRef]
  46. Makki, Z.F.; Zuhaira, A.A.; Al-Jubouri, S.M.; Al-Hamd, R.K.S.; Cunningham, L.S. GIS-Based Assessment of Groundwater Quality for Drinking and Irrigation Purposes in Central Iraq. Environ. Monit. Assess. 2021, 107, 193. [Google Scholar] [CrossRef] [PubMed]
  47. Daud, M.K.; Nafees, M.; Ali, S.; Rizwan, M.; Bajwa, R.A.; Shakoor, M.B.; Arshad, M.U.; Chatha, S.A.S.; Deeba, F.; Murad, W.; et al. Drinking Water Quality Status and Contamination in Pakistan. Biomed Res. Int. 2017, 2017, 7908183. [Google Scholar] [CrossRef] [PubMed]
  48. Khan, S.; Aziz, T.; Noor-Ul-Ain, A.K.; Ahmed, I.; Nida, A. Drinking Water Quality in 13 Different Districts of Sindh, Pakistan. Health Care Curr. Rev. 2018, 6, 4. [Google Scholar] [CrossRef]
  49. Shahid, M.; Niazi, N.K.; Dumat, C.; Naidu, R.; Khalid, S.; Rahman, M.M.; Bibi, I. A Meta-Analysis of the Distribution, Sources and Health Risks of Arsenic-Contaminated Groundwater in Pakistan. Environ. Pollut. 2018, 242, 307–319. [Google Scholar] [CrossRef] [PubMed]
  50. Rasheed, H.; Altaf, F.; Anwaar, K.; Ashraf, M. Drinking Water Quality in Pakistan: Current Status and Challenges; Pakistan Council of Research in Water Resources (PCRWR): Islamabad, Pakistan, 2021; p. 141. [Google Scholar]
  51. Ahmad, M.N.; Sultana, R.; Yoshida, M.; Salahuddin, M. Groundwater Contamination Issues in Chiniot Area, Punjab, Pakistan. Int. J. Environ. Sci. Dev. 2020, 11, 123–127. [Google Scholar] [CrossRef]
  52. Aleem, M.; Shun, C.; Li, C.; Aslam, A.; Yang, W.; Nawaz, M.; Ahmed, W.; Buttar, N. Evaluation of Groundwater Quality in the Vicinity of Khurrianwala Industrial Zone, Pakistan. Water 2018, 10, 1321. [Google Scholar] [CrossRef]
  53. Din, I.U.; Muhammad, S.; Rehman, I.U. Groundwater Quality Assessment for Drinking and Irrigation Purposes in the Hangu District, Pakistan. J. Food Compos. Anal. 2023, 115, 104919. [Google Scholar] [CrossRef]
  54. Adimalla, N.; Qian, H.; Tiwari, D.M. Groundwater Chemistry, Distribution and Potential Health Risk Appraisal of Nitrate Enriched Groundwater: A Case Study from the Semi-Urban Region of South India. Ecotoxicol. Environ. Saf. 2021, 207, 111277. [Google Scholar] [CrossRef]
  55. Kothari, V.; Vij, S.; Sharma, S.; Gupta, N. Correlation of Various Water Quality Parameters and Water Quality Index of Districts of Uttarakhand. Environ. Sustain. Indic. 2021, 9, 100093. [Google Scholar] [CrossRef]
  56. Duressa, G.; Assefa, F.; Jida, M. Assessment of Bacteriological and Physicochemical Quality of Drinking Water from Source to Household Tap Connection in Nekemte, Oromia, Ethiopia. J. Environ. Public Health 2019, 2019, 2129792. [Google Scholar] [CrossRef]
  57. Jacob, A.A.; Ndukwe, G.I.; Gimba, C.E.; Yilleng, M.T.; Stephen, D.; Fasanya, O.; Samuel, N.Y.; Madaki, L.A. Physicochemical Assessment of Ground Water Quality from Borehole and Hand Dug Wells around Obajana Community, Lokoja, Kogi State, Nigeria. J. Appl. Sci. Environ. Manag. 1970, 26, 505–511. [Google Scholar] [CrossRef]
  58. An, H.T.; Bich, T.T.N.; Yi-Ching, C.; Hien, T.T.T. Assessment of Groundwater Quality for Drinking and Domestic Purposes through Local Survey and Water Quality Index in Vietnam. J. Southwest Jiaotong Univ. 2021, 56, 83–93. [Google Scholar] [CrossRef]
  59. Gallagher, C.D.; Dietrich, A.M. TDS and Temperature Affect Consumer Taste Preferences. Opflow 2010, 36, 20–22. [Google Scholar] [CrossRef]
  60. Burlingame, G.A.; Doty, R.L. Important Considerations for Estimating Odor Threshold Concentrations of Contaminants Found in Water Supplies. J. AWWA 2018, 110, 1–12. [Google Scholar] [CrossRef]
  61. Bai, X.; Zhang, T.; Qu, Z.; Li, H.; Yang, Z. Contribution of Filamentous Fungi to the Musty Odorant 2,4,6-Trichloroanisole in Water Supply Reservoirs and Associated Drinking Water Treatment Plants. Chemosphere 2017, 182, 223–230. [Google Scholar] [CrossRef] [PubMed]
  62. Chen, Z.J.; Liu, Y.Q.; Li, Y.Y.; Lin, L.A.; Zheng, B.H.; Ji, M.F.; Li, B.L.; Han, X.M. The Seasonal Patterns, Ecological Function and Assembly Processes of Bacterioplankton Communities in the Danjiangkou Reservoir, China. Front. Microbiol. 2022, 13, 884765. [Google Scholar] [CrossRef] [PubMed]
  63. Rajendiran, T.; Sabarathinam, C.; Panda, B.; Elumalai, V. Influence of Dissolved Oxygen, Water Level and Temperature on Dissolved Organic Carbon in Coastal Groundwater. Hydrology 2023, 10, 85. [Google Scholar] [CrossRef]
  64. Kalyani, D.S.; Rajesh, V.; Reddi, E.U.B.; Kumar, K.C.; Rao, S.S. Correlation between Corrosion Indices and Corrosiveness of Groundwater: A Study with Reference to Selected Areas of Krishna District, Andhra Pradesh, India. Environ. Earth Sci. 2017, 76, 568. [Google Scholar] [CrossRef]
  65. Fakioğlu, M.; Karpuzcu, M.E.; Öztürk, İ. İçme Sularında Alg Kaynaklı Tat Ve Koku Sorununun Değerlendirilmesi. Pamukkale Univ. Muh. Bilim. Derg. 2018, 24, 1141–1156. [Google Scholar]
  66. Zhang, Y.L.; Yang, L.Y.; Qin, B.Q.; Gao, G.; Luo, L.C.; Zhu, G.W.; Liu, M.L. Spatial Distribution of COD and the Correlations with Other Parameters in the Northern Region of Lake Taihu. Huanjing Kexue/Environ. Sci. 2008, 29, 1457–1462. [Google Scholar]
  67. Du, Y.; Deng, Y.; Ma, T.; Xu, Y.; Tao, Y.; Huang, Y.; Liu, R.; Wang, Y. Enrichment of Geogenic Ammonium in Quaternary Alluvial–Lacustrine Aquifer Systems: Evidence from Carbon Isotopes and DOM Characteristics. Environ. Sci. Technol. 2020, 54, 6104–6114. [Google Scholar] [CrossRef] [PubMed]
  68. Rusydi, A.F.; Onodera, S.I.; Saito, M.; Hyodo, F.; Maeda, M.; Sugianti, K.; Wibawa, S. Potential Sources of Ammonium-Nitrogen in the Coastal Groundwater Determined from a Combined Analysis of Nitrogen Isotope, Biological and Geological Parameters, and Land Use. Water 2021, 13, 25. [Google Scholar] [CrossRef]
  69. Ghssein, G.; Awada, R.; Salami, A.; Bahmad, H.F.; Awad, A.; Joumaa, W.H.; El Roz, A. Prevalence, Laboratory Findings and Clinical Characteristics of Campylobacteriosis Agents among Hospitalized Children with Acute Gastroenteritis in Lebanon. Pediatr. Gastroenterol. Hepatol. Nutr. 2021, 24, 346–356. [Google Scholar] [CrossRef]
  70. Wang, C.; Yang, Y.; Wu, N.; Gao, M.; Tan, Y. Combined Toxicity of Pyrethroid Insecticides and Heavy Metals: A Review. Environ. Chem. Lett. 2019, 17, 1693–1706. [Google Scholar] [CrossRef]
  71. Lazhar, B.; Ammar, T.; Lotfi, M. Assessment of Heavy Metals Contamination in Groundwater: A Case Study of the South of Setif Area, East Algeria. In Achievements and Challenges of Integrated River Basin Management; Komatina, D., Ed.; IntechOpen: Rijeka, Croatia, 2018. [Google Scholar]
  72. Oyeleke, P.; Okparaocha, F. Assessment of Some Heavy Metals in Groundwater in the Vicinity of an Oil Depot in Nigeria. Am. Chem. Sci. J. 2016, 12, 1–7. [Google Scholar] [CrossRef]
  73. Nsdwq, U. Nigerian Standard for Drinking Water Quality. Niger. Ind. Stand. NIS 2007, 554, 13–14. [Google Scholar]
  74. Hussain, R.; Khattak, S.A.; Sattar, S.; Ali, L.; Ullah, Z.; Muhammad, N. Evaluation of the Contaminated Soil and Its Impacts on Tobacco (Nicotiana tabacum L.) Crops in Swabi, Pakistan. J. Himal. Earth Sci. 2020, 53, 34–48. [Google Scholar]
  75. Gimba, C.E.; Ndukwe, G.I.; Paul, E.D.; Habila, J.D.; Madaki, L.A. Heavy Metals (Cd, Cu, Fe, Mn and Zn,) Assessment of Groundwater, in Kaltungo LGA, Gombe State, Nigeria. Int. J. Sci. Technol. 2015, 4, 49–56. [Google Scholar]
  76. Lwimbo, Z.D.; Komakech, H.C.; Muzuka, A.N.N. Impacts of Emerging Agricultural Practices on Groundwater Quality in Kahe Catchment, Tanzania. Water 2019, 11, 2263. [Google Scholar] [CrossRef]
  77. Ren, Y.S.; Ilyas, M.; Xu, R.Z.; Ahmad, W.; Wang, R. Concentrations of Lead in Groundwater and Human Blood in the Population of Palosai, a Rural Area in Pakistan: Human Exposure and Risk Assessment. Adsorpt. Sci. Technol. 2022, 2022, 1–12. [Google Scholar] [CrossRef]
  78. Reckhow, D.A.; Singer, P.C.; Malcolm, R.L. Chlorination of Humic Materials: Byproduct Formation and Chemical Interpretations. Environ. Sci. Technol. 1990, 24, 1655–1664. [Google Scholar] [CrossRef]
  79. White, M.C.; Thompson, J.D.; Harrington, G.W.; Singer, P.C. Evaluating Criteria for Enhanced Coagulation Compliance. J. AWWA 1997, 89, 64–77. [Google Scholar] [CrossRef]
  80. Weishaar, J.L.; Aiken, G.R.; Bergamaschi, B.A.; Fram, M.S.; Fujii, R.; Mopper, K. Evaluation of Specific Ultraviolet Absorbance as an Indicator of the Chemical Composition and Reactivity of Dissolved Organic Carbon. Environ. Sci. Technol. 2003, 37, 4702–4708. [Google Scholar] [CrossRef] [PubMed]
  81. Johnson, J.D.; Jensen, J.N. THM and TOX Formation: Routes, Rates, and Precursors. J. AWWA 1986, 78, 156–162. [Google Scholar] [CrossRef]
  82. Vo-Minh Nguyen, H.; Hur, J.; Shin, H.-S. Humic Acids and Fulvic Acids: Characteristics, Sorption of Hydrophobic Organic Contaminants, and Formation of Disinfection by-Products during Chlorination. In Humus and Humic Substances–Recent Advances; IntechOpen: Rijeka, Croatia, 2022. [Google Scholar]
  83. Murphy, K.R.; Ruiz, G.M.; Dunsmuir, W.T.M.; Waite, T.D. Optimized Parameters for Fluorescence-Based Verification of Ballast Water Exchange by Ships. Environ. Sci. Technol. 2006, 40, 2357–2362. [Google Scholar] [CrossRef]
  84. Huang, S.B.; Wang, Y.X.; Ma, T.; Tong, L.; Wang, Y.Y.; Liu, C.R.; Zhao, L. Linking Groundwater Dissolved Organic Matter to Sedimentary Organic Matter from a Fluvio-Lacustrine Aquifer at Jianghan Plain, China by EEM-PARAFAC and Hydrochemical Analyses. Sci. Total Environ. 2015, 529, 131–139. [Google Scholar] [CrossRef] [PubMed]
  85. Ishii, S.K.L.; Boyer, T.H. Behavior of Reoccurring PARAFAC Components in Fluorescent Dissolved Organic Matter in Natural and Engineered Systems: A Critical Review. Environ. Sci. Technol. 2012, 46, 2006–2017. [Google Scholar] [CrossRef]
  86. Pisani, O.; Bosch, D.D.; Coffin, A.W.; Endale, D.M.; Liebert, D.; Strickland, T.C. Riparian Land Cover and Hydrology Influence Stream Dissolved Organic Matter Composition in an Agricultural Watershed. Sci. Total Environ. 2020, 717, 137165. [Google Scholar] [CrossRef]
  87. Baghoth, S.A.; Sharma, S.K.; Amy, G.L. Tracking Natural Organic Matter (NOM) in a Drinking Water Treatment Plant Using Fluorescence Excitation–Emission Matrices and PARAFAC. Water Res. 2011, 45, 797–809. [Google Scholar] [CrossRef]
  88. Jiang, T.; Bravo, A.G.; Skyllberg, U.; Björn, E.; Wang, D.; Yan, H.; Green, N.W. Influence of Dissolved Organic Matter (DOM) Characteristics on Dissolved Mercury (Hg) Species Composition in Sediment Porewater of Lakes from Southwest China. Water Res. 2018, 146, 146–158. [Google Scholar] [CrossRef]
  89. Kaufman, J.A.; Wright, J.M.; Evans, A.; Rivera-Núñez, Z.; Meyer, A.; Narotsky, M.G. Disinfection By-Product Exposures and the Risk of Musculoskeletal Birth Defects. Environ. Epidemiol. 2020, 4, e081. [Google Scholar] [CrossRef] [PubMed]
  90. Costet, N.; Villanueva, C.M.; Jaakkola, J.J.K.; Kogevinas, M.; Cantor, K.P.; King, W.D.; Lynch, C.F.; Nieuwenhuijsen, M.J.; Cordier, S. Water Disinfection By-Products and Bladder Cancer: Is There a European Specificity? A Pooled and Meta-Analysis of European Case-Control Studies. Occup. Environ. Med. 2011, 68, 379–385. [Google Scholar] [CrossRef] [PubMed]
  91. Nicholson, G. Methods of Soil, Plant and Water Analysis. FRI Bull. N. Z. For. Serv. For. Res. Inst. 1984, 70, 65–119. [Google Scholar]
Figure 1. Location map showing study area’s geographical location and groundwater sampling sites of different groundwater networks in the industrial city of Faisalabad, Punjab, Pakistan.
Water 16 01768 g001
Figure 2. The concentrations of temperature (a), total dissolved solids (b), dissolved oxygen (c), and total coliform and fecal coliform (d) in two groundwater networks: network A, spanning from Munda Pend (MP) to the terminal reservoir (TR) and then to taps in Mustafa Abad (MA), and network B, extending from Gut Wala (GW) to the terminal reservoir (TR), and then to taps in Madinah Town (MT) in Faisalabad. The mean value with standard deviation is presented in the graphs. Horizontal lines show standard values for each parameter, with the red line representing the World Health Organization (WHO) standards and the blue line representing the Pakistan Environmental Quality Standards (PEQSs) guidelines.
Water 16 01768 g002
Figure 3. The concentrations of chemical oxygen demand (a), biological oxygen demand (b), nitrate (c), and ammonium (d) in the two groundwater networks: network A, spanning from Munda Pend (MP) to the terminal reservoir (TR) and then to taps in Mustafa Abad (MA), and network B, extending from Gut Wala (GW) to the terminal reservoir (TR), and then to taps in Madinah Town (MT) in Faisalabad. The mean value with standard deviation is presented in the graphs. Horizontal lines show standard values for each parameter, with the red line representing the World Health Organization (WHO) standards and the blue line representing the Pakistan Environmental Quality Standards (PEQSs) guidelines.
Water 16 01768 g003
Figure 4. The concentrations (Conc.) of lead (a), iron (b), copper (c), zinc (d), and cadmium (e) in two groundwater networks: network A, spanning from Munda Pend (MP) to the terminal reservoir (TR) and then to taps in Mustafa Abad (MA), and network B, extending from Gut Wala (GW) to the terminal reservoir (TR), and then to taps in Madinah Town (MT) in Faisalabad. The mean value with standard deviation is presented in the graphs. Horizontal lines show standard values for each parameter, with the red line representing the World Health Organization (WHO) standards and the blue line representing the Pakistan Environmental Quality Standards (PEQSs) guidelines.
Water 16 01768 g004
Figure 5. The levels of ultraviolet (Uv-254) (a) and dissolved organic matter (DOM) (b) in two groundwater networks: network A, spanning from Munda Pend (MP) to the terminal reservoir (TR) and then to taps in Mustafa Abad (MA), and network B, extending from Gut Wala (GW) to the terminal reservoir (TR), and then to taps in Madinah Town (MT) in the industrial city of Faisalabad. The microbial humic-like component is represented by C1–C2, and terrestrial humic-like substances are represented by C3. The mean value with standard deviation is presented in the graphs. Horizontal lines show the threshold level for the parameter.
Water 16 01768 g005
Figure 6. Principal component analysis (PCA) of network A (a) and PCA of network B (b); Pearson correlation matrix (heatmaps) at significance level (p < 0.05) of network A (c) and network B (d), showing the correlations between physicochemical, microbiological, heavy metals, and DOM properties in two groundwater networks. Network A, spanning from Munda Pend (MP) to the terminal reservoir (TR) and then to taps in Mustafa Abad (MA), and network B, extending from Gut Wala (GW) to the terminal reservoir (TR), and then to taps in Madinah Town (MT) in Faisalabad, Pakistan.
Water 16 01768 g006aWater 16 01768 g006b
Table 1. Mean values of physicochemical and microbial parameters in samples from two groundwater networks: Network A, spanning from Munda Pend (MP) to the terminal reservoir (TR) and then to taps in Mustafa Abad (MA), and network B, extending from Gut Wala (GW) to the terminal reservoir (TR) and then to taps in Madinah Town (MT) in the industrial city Faisalabad compared with the World Health Organization (WHO) standards and Punjab Environmental Quality Standards (PEQSs) guidelines.
Sr. No.ParametersNetwork ANetwork BPEQSWHO
Tube WellsTRTapsTube WellsTRTaps
1Color (TCU)U.OU.OU.OU.OU.OU.O<15<15
2TasteU.OU.OOU.OU.OOU.OU.O
3OdorU.OU.OOU.OU.OOU.OU.O
4Temperature(°C)13.02 ± 1.0213.00 ± 2.6122.36 ± 1.1513.99 ± 0.9413.80 ± 1.2321.64 ± 0.70-15
5Turbidity (NTU)n.dn.dn.dn.dn.dn.d<5<5
6pH7.45 ± 0.077.30 ± 0.366.72 ± 0.257.72 ± 0.117.50 ± 0.596.81 ± 0.166.5–8.56.5–8.5
7EC (µS/cm)285.51 ± 6.09365.67 ± 4.93504.31 ± 3.71334.50 ± 5.08347.33 ± 4.51459.91 ± 6.7515001000
8DO (mg/L)3.34 ± 0.223.07 ± 0.252.48 ± 0.183.28 ± 0.152.17 ± 0.212.66 ± 0.13->5
9TDS (mg/L)421.24 ± 3.57443.00 ± 6.24748.96 ± 3.61466.60 ± 4.36510.00 ± 6536.64 ± 3.9910001000
10Ca2+ (mg/L)51.24 ± 3.3462.00 ± 2.6565.00 ± 3.6752.77 ± 2.0651.33 ± 4.1661.88 ± 2.73-200
11Mg2+ (mg/L)11.86 ± 1.0612.27 ± 1.5519.62 ± 1.4814.88 ± 1.1215.07 ± 1.0416.77 ± 1.06-150
12CO32− (mg/L)15.74 ± 1.1814.33 ± 2.313.66 ± 1.6520.40 ± 0.9918.00 ± 2.006.65 ± 1.546060
13HCO3 (mg/L)144.21 ± 4.07141.33 ± 6.66129.04 ± 4.84180.83 ± 4.52172.33 ± 5.13141.21 ± 7.15-250
14Cl (mg/L)50.02 ± 2.8858.97 ± 3.5081.85 ± 2.4058.10 ± 3.0565.57 ± 7.8472.80 ± 2.55250250
15Na+ (mg/L)46.18 ± 4.5957.17 ± 3.3497.70 ± 3.4182.33 ± 5.1779.97 ± 4.3799.62 ± 3.67200200
16CaCO3 (mg/L)178.96 ± 5.53191.00 ± 6.76228.29 ± 3.88190.65 ± 3.94192.33 ± 6.81209.35 ± 4.25500300
17COD (mg/L)13.41 ± 1.6612.77 ± 2.4119.45 ± 2.4711.74 ± 1.2413.07 ± 3.0017.85 ± 2.09-10
18BOD (mg/L)3.49 ± 0.664.10 ± 1.106.90 ± 1.063.25 ± 0.324.47 ± 0.406.11 ± 0.35-<5
19NO3 (mg/L)9.08 ± 1.219.25 ± 0.8513.73 ± 0.616.76 ± 0.159.83 ± 1.1012.77 ± 0.515050
20NH4+ (mg/L)1.34 ± 0.071.11 ± 0.093.47 ± 0.411.06 ± 0.090.94 ± 0.061.80 ± 0.09-1.5
21T. coli (CFU)n.dn.d48.81 ± 7.95n.dn.d46.45 ± 6.320/100 mL0/100 mL
22F. coli (CFU)n.dn.d11.14 ± 3.40n.dn.d10.70 ± 3.880/100 mL0/100 mL
Note: Not detected (n.d), objectionable (O), unobjectionable (U.O), nephelometric turbidity unit (NTU), electrical conductivity (EC), dissolved oxygen (DO), total dissolved solids (TDSs), calcium (Ca2+), magnesium (Mg2+), carbonate (CO32−), bicarbonate (HCO3), chloride (Cl), sodium (Na+), total hardness (TH), chemical oxygen demand (COD), biological oxygen demand (BOD), nitrate (NO3), ammonium (NH4+), colony forming unit (CFU), milligram per liter (mg/L), microsiemens per centimeter (µS/cm), true color unit (TCU), and degrees Celsius (°C). “- “showing there is no specific permissible limit.
Table 2. Mean values of heavy metals and dissolved organic matter in samples from two groundwater networks: Network A, starting from Munda Pend (MP) to the terminal reservoir (TR) and then to taps in Mustafa Abad (MA), and network B, extending from Gut Wala (GW) to the terminal reservoir (TR) and then to taps in Madinah Town (MT) in the industrial city of Faisalabad compared with the World Health Organization (WHO) standards and Punjab Environmental Quality Standards (PEQs) guidelines.
Sr. No.ParametersNetwork ANetwork BPEQSWHO
Tube WellsTRTapsTube WellsTRTaps
1Fe (mg/L)0.08 ± 0.020.10 ± 0.020.13 ± 0.010.07 ± 0.010.11 ± 0.020.16 ± 0.01 -0.3
2Pb (mg/L)0.015 ± 0.0010.015 ± 0.0040.028 ± 0.0010.013 ± 0.0010.017 ± 0.0020.027 ± 0.002 0.050.01
3Cd (mg/L)0.004 ± 0.0010.003 ± 0.0020.006 ± 0.0010.005 ± 0.0010.005 ± 0.0020.008 ± 0.0010.010.003
4Cu (mg/L)0.12 ± 0.020.14 ± 0.020.30 ± 0.020.08 ± 0.010.08 ± 0.020.41 ± 0.0222
5Zn (mg/L)1.10 ± 0.031.14 ± 0.101.35 ± 0.051.43 ± 0.051.46 ± 0.051.56 ± 0.0353
6Uv-254 (cm−1)0.02 ± 0.010.03 ± 0.010.03 ± 0.010.01 ± 0.000.02 ± 0.010.03 ± 0.01--
7C1 (A.U)2,796,848.25 ± 46.711,241,836.38 ± 91.954,145,083.89 ± 52.082,856,364.44 ± 54.872,777,733.81 ± 44.823,067,002.09 ± 59.31 --
8C2 (A.U)3,333,520.09 ± 45.051,343,680.92 ± 57.213,693,985.98 ± 51.183,440,604.59 ± 42.893,237,889.35 ± 60.473,643,204.79 ± 44.98 --
9C3 (A.U)638,012.18 ± 36.63582,705.01 ± 122.14643,968.05 ± 59.32453,994.01 ± 36.80437,370.46 ± 59.57459,525.57 ± 41.58 --
Note: milligram per liter (mg/L), iron (Fe), lead (Pb), cadmium (Cd), copper (Cu), zinc (Zn), arbitrary units (A.Us), and UVA-humic-like (C1), UVA-humic-like (C2), UVC-humic-like (C3) components. “-“showing there is no permissible limit.
Table 3. The spectral features of EEM-PARAFAC components identified through EEM-PARAFAC analysis are presented for two groundwater networks (A and B) in the industrial city of Faisalabad, Pakistan.
CompoundsEEM ContourEEM LocationFluorescence CompoundsReferences
C1Water 16 01768 i001Ex: 255 (362) nm
Em: 452 nm
UVA-humic-like component[10,41,45]
C2Water 16 01768 i002Ex: 315 nm
Em: 370 nm
UVA-humic-like component[10,42,45]
C3Water 16 01768 i003Ex: 290 (452) nm
Em: 510 nm
UVC-humic-like component[43,44,45]
Table 4. Pearson correlation coefficients between dissolved organic matter and heavy metals are presented for two groundwater networks (A and B) in the industrial city of Faisalabad, Pakistan. Significance level (p < 0.05), * significant (p < 0.05), and NS not significant (p > 0.05).
Network ANetwork B
PbCdFeZnCuPbCdFeZnCu
C1+0.18 NS+0.38 *+0.05 NS+0.27 NS+0.3 NS+0.2 NS+0.4 NS+0.12 NS+0.05 NS+0.55 *
C2−0.006 NS+0.16 *−0.04 NS+0.15 NS−0.09 NS+0.23 NS+0.03 NS−0.09 NS−0.15 NS+0.51 NS
C3+0.07 NS−0.03 NS−0.2 NS−0.11 NS+0.05 NS+0.12 NS+0.009 NS−0.03 NS−0.09 NS+0.46 NS
Disclaimer/Publisher’s Note: The statements, opinions and data contained in all publications are solely those of the individual author(s) and contributor(s) and not of MDPI and/or the editor(s). MDPI and/or the editor(s) disclaim responsibility for any injury to people or property resulting from any ideas, methods, instructions or products referred to in the content.

